Embed Size (px)
Citation preview

Parent Involvement and Academic Achievement
Susan Campbell & Sharon Glasgow
EDU 703.22Spring 2010
May 20, 2010

Table of Contents• Introduction
– Statement of the Problem– Review of Literature– Statement of the Hypothesis
• Methods– Participants– Instruments– Experimental Design– Threats to Internal and External Validity – Procedure
• Results– Pre and Post test Data – Correlation Graphs– Distribution /Standard Deviation
• Discussion
• Implications
• References

Introduction• Research indicates that there are
positive academic outcomes stemming from parental involvement with benefits beginning in early childhood throughout adolescence and beyond. (Henderson & Mapp, 2002; Patrikakou, Weisberg, Redding, & Walberg, 2005).

Statement of the Problem
• As children move up in grades, parent involvement wanes. This research project will attempt to prove that increasing parent involvement will improve children’s academic achievement.

Review of Literature• It is a well-established fact that parental
involvement is linked to children’s success at school.
• When parents are involved in their children’s education at home, they do better in school. (Henderson & Berla, 1994)
• When school and home work together collaboratively using a competent approach to education, it can make a huge difference in student achievement (Padgett, 2006).
• Educators, parents and community partners work collaboratively on action teams and they become engaged in productive ways at school, at home, and the community (Epstein, 2002).
• Parent involvement is a valuable component of any student’s education.
• The level of parent–school involvement is a better predictor of grades than are standardized test scores. (Desimone, 1999).
• There is no question that parent involvement represents an exceptionally powerful way of making schools more effective, and of dramatically enriching children’s experiences (Walberg, 1984).
Hypothesis
HR-1 Parents/caregivers reading for a maximum of 30
minutes five times a week over a six week period will increase the reading scores of 40 students at P.S. X
in Brooklyn.

Method
Participants:
– 40 sixth grade students at P.S. X in Brooklyn, New York.
– 75% African American; 25% Hispanic
– Two classes of 20 students will be involved.
- Parents of participating students
– Teachers and Administration

METHODINSTRUMENTS
Parent Release/Consent form
Parent Questionnaire used to assess the level of parent involvement in student academic life
Student Questionnaire used to assess student study habits and parent involvement
Reading Passages
ELA Pre-Test
ELA Post-Test

Research Design• Quasi Experimental: Non equivalent
Control Group Design
- Two groups: Designated treatment group (X1) and control group (X2) are pretested, exposed to a treatment (X) and post-tested (O)
– Groups are not randomly assigned
• Symbolic Design
O X1 OO X2 O
• This design is Quasi Experimental– It is performed with two groups
with similar demographics.– The participants are not
randomly assigned. • The two groups are pre-tested,
exposed to a treatment, and post-tested.

Threats to Internal Validity History
Participants may not be focused and may not give honest responses on the questionnaires and surveys.
MortalityParticipants parent or child may drop out of study for a number of reasons.
TestingPreparation outside of school could affect test scores.
TutoringParents can pay for private tutoring for subjects.
Maturation Children’s attitude can change toward studying and test taking as they grow and
mature.Home Environment
Children may not have a structured home environment. Fatigue can negatively impact reading comprehension scores.
InstrumentationParents may refuse to fill out the questionnaires and surveys
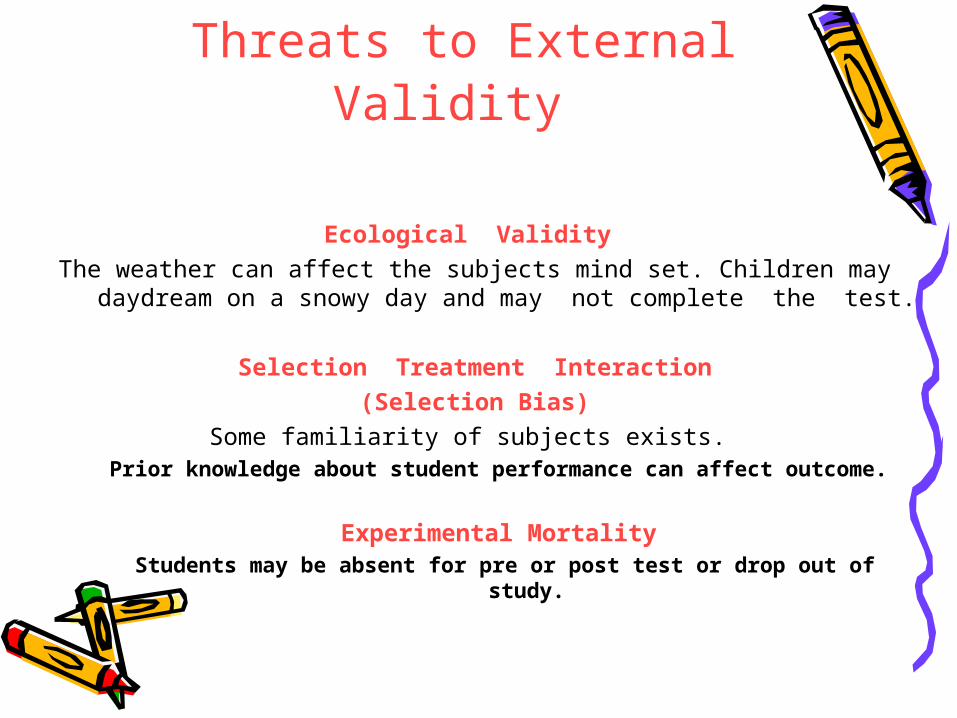
Threats to External Validity
Ecological Validity The weather can affect the subjects mind set. Children may daydream
on a snowy day and may not complete the test.
Selection Treatment Interaction(Selection Bias)
Some familiarity of subjects exists. Prior knowledge about student performance can affect outcome.
Experimental Mortality Students may be absent for pre or post test or drop out of study.

Procedure
• This Action Research was conducted from November 2009 to May 2010
• Parent consent forms were distributed in November 2009
• The ELA pre-test was given in January 2010
• Student and Parent Questionnaires were distributed in January 2010
• Reading passages
• The ELA post-test was given in April 2010

Quantitative Data
Class # Never (1)
Once per week (2)
2-3 times per week (3)
5 or more (4)
601 2 2 8 10
603 1 5 13 4
Parent survey question #1:
How often do you read to your child?
(4) – 5 or more times
(3) – 2-3 times per week
(2) – once per week
(1) - Never
Student survey question #12:
Do you read books for fun that is not required for homework?
Class # Never (1)
Once per week (2)
2-3 times per week (3)
5 or more(4)
601 0 3 10 9
603 1 0 8 11

Pre & Post-test DataClass 601
Pre and Post Test 601
55
60
65
70
75
80
1 3 5 7 9 11 13 15 17 19
Students
Gra
de
in P
erce
nt
Pre test
Post test
Most students showed improvement in grades from pre to post test results
Improvement in grade was not significant enough to change ELA Level for most students
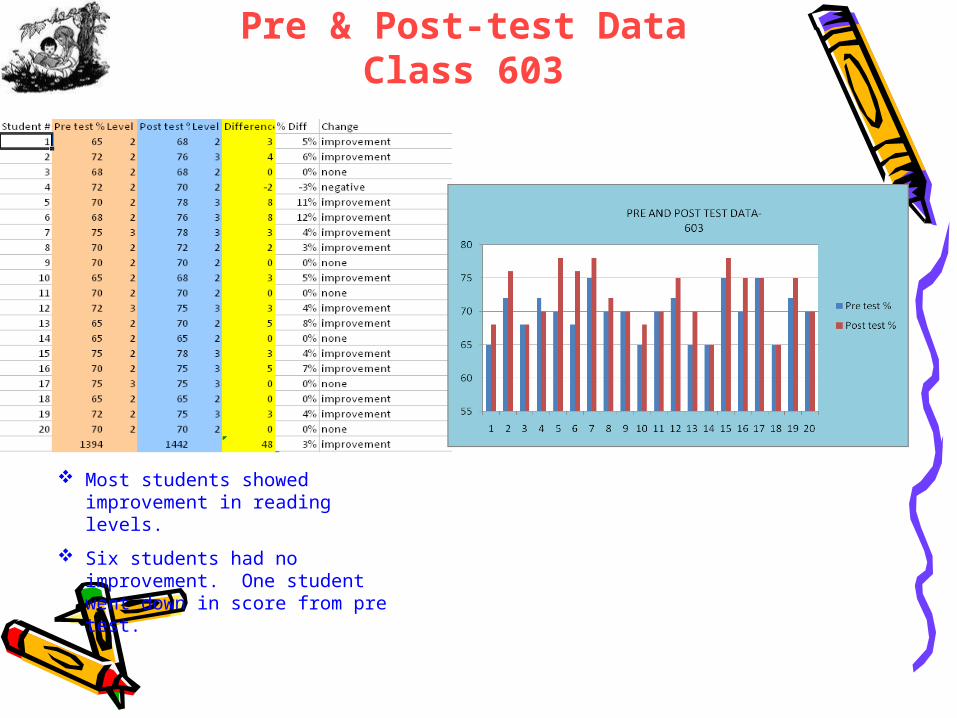
Pre & Post-test DataClass 603
Most students showed improvement in reading levels.
Six students had no improvement. One student went down in score from pre test.

0
5
10
15
20
25
30
35
40
45
Attitude to Reading
Student Participants
Chart #3: Influence of Attitude on Reading Level - Class 601
Attitude 33 42 34 37 41 33 37 34 35 27 42 30 24 28 40 20 32 37 27 25
Pre-Test Level 3 3 4 3 3 3 3 4 3 3 3 3 2 3 3 3 3 3 4 3
Post-Test Level 3 3 4 4 3 3 3 4 3 3 3 3 2 3 3 3 3 3 4 4
1 2 3 4 5 6 7 8 910
11
12
13
14
15
16
17
18
19
20
Results - 601
Based on the data, there is no clear indication that a high attitudinal score will yield a high post test level.
An assumption can be made that attitudinal scores of 28 and above yielded higher testing levels.

Results-603
051015202530354045
Attitude to Reading
Chart #3: Influence of Attitude on Reading Level - Class 603
Attitude 28 42 43 39 41 36 38 34 35 42 33 29 41 28 39 36 37 35 35 30
Pre-Test Level 2 2 2 2 2 2 3 2 2 2 2 3 2 2 2 2 3 2 2 2
Post-Test Level 2 3 2 2 3 3 3 2 2 2 2 3 2 2 3 3 3 2 3 2
1 2 3 4 5 6 7 8 9 10 11 12 13 14 15 16 17 18 19 20
The data for class 603 also indicate that there is no clear correlation between attitude score and the level a student achieved on the ELA test.
Student Participants

Correlation Graphs
Rxy=0.2420 Rxy=0.2035
The data for class 601 indicate that there is no correlation between the student attitude to reading and the change in test scores.
The data for class 603 indicate that there is no correlation between student attitude to reading and the change in test scores.
Correlation of Attitude to difference in Pre/Post-Test Score Class 601
0
2
4
6
8
10
12
0 5 10 15 20 25 30 35 40 45
Attitude to Reading
Chan
ge in
Tes
t Sco
re Series1
Linear (Series1)
Correlation of Attitude to difference in Pre/Post-Test Score Class 603
-4
-2
0
2
4
6
8
10
0 5 10 15 20 25 30 35 40 45 50
Attitude to Reading
Chan
ge in
Tes
t Sco
re
Series1
Linear(Series1)
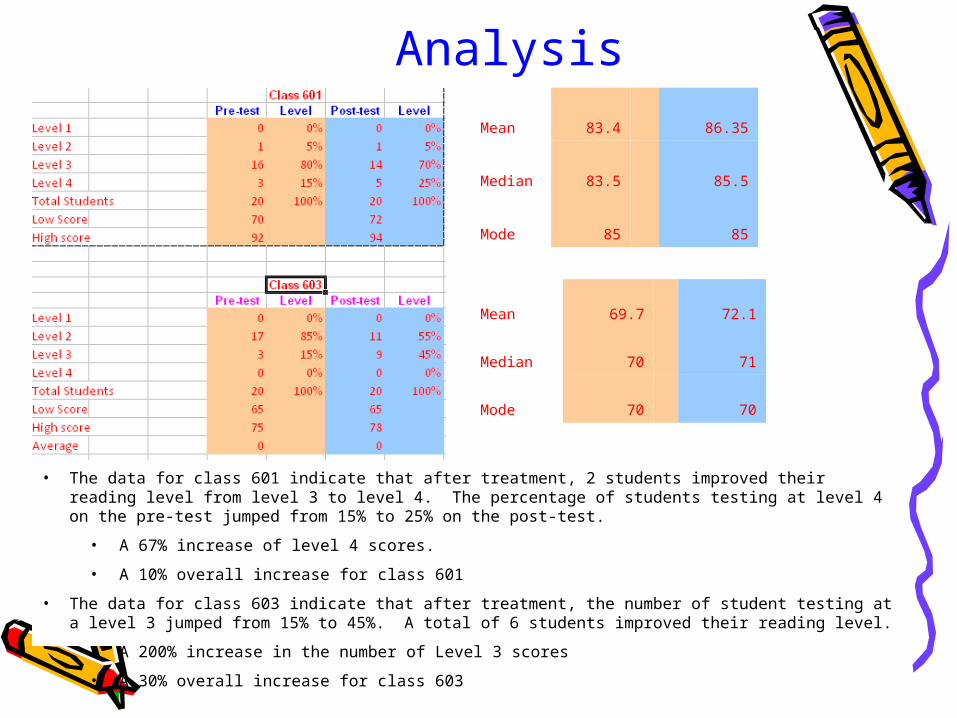
Analysis
• The data for class 601 indicate that after treatment, 2 students improved their reading level from level 3 to level 4. The percentage of students testing at level 4 on the pre-test jumped from 15% to 25% on the post-test.
• A 67% increase of level 4 scores.
• A 10% overall increase for class 601
• The data for class 603 indicate that after treatment, the number of student testing at a level 3 jumped from 15% to 45%. A total of 6 students improved their reading level.
• A 200% increase in the number of Level 3 scores
• A 30% overall increase for class 603
Mean 69.7 72.1
Median 70 71
Mode 70 70
Mean 83.4 86.35
Median 83.5 85.5
Mode 85 85

Distribution Curve Class 601
85
85.5
86.35
mode
median
mean
Positive skew
Frequency
Low Score=72 High Score=94
When compared to the normal distribution, the mean, median and mode of the post test scores have a positive skew.

Distribution Curve Class 603
71
72.1
mode
median
mean
Positive skew
Frequency
Low Score=65 High Score=7870
When compared to the normal distribution, the mean, median and mode of the post test scores have a positive skew.

Discussion There is a correlation between parent involvement and student
achievement as demonstrated in the survey results and in the test scores of those students whose parents are involved in their students’ academic life.
There is a correlation between overall academic performance and parent involvement as demonstrated by the grades of those students who have active parent involvement in school and at home.
The socio economic status of students is indicative of the low level of parent involvement as demonstrated by the low percentage of parent questionnaire returned – 12/125 (inferred
based on personal knowledge of student population – refer to threats)
Implications• Larger Sample Size
• Parent Involvement
• Examine other factors that impact parent involvement
• Recognize common values of parents and schools

References• Carey, N., Lewis, L., Farris, E., & Westat, I. (1998). Parent Involvement in Children's Education:
Efforts by Public Elementary Schools. National Center for Education Statistics Statistical Analysis Report. http://search.ebscohost.com
• Cheung, C., (2009). Evaluating the benefit from the Help of the Parent-Teacher Association to Child Performance. Retrieved October 1, 2009
• Desimone, L., (1999). Linking Parent Involvement with Student Achievement: Do Race and Income Matter? The Journal of Educational Research, Vol. 93, No. 1 (Sep.-Oct., 1999), pp. 11-30 Published by: Heldref Publications http://www.jstor.org/stable/27542243
• Epstein, J., (2005). A Case Study of the Partnership Schools Comprehensive School Reform (CSR) Model. Retrieved October 20, 2009, from Elementary School Journal, Vol. 106 Issue 2, p 151-170
• Henderson, A. T., & Mapp, K. L. (2002). A new wave of evidence. Austin, TX: National Center for Family and Community Connections with Schools.
• Henderson, A. T., & Berla, N. (1994). A new generation of evidence: The family is critical to student achievement. St Louis, MO: Danforth Foundation and Flint.
• Hill, N., and Tyson, D., (2009) Parental Involvement in Middle School: A Meta-Analytic Assessment of the Strategies That Promote Achievement. Developmental Psychology 2009, Vol. 45 NO. 3,
740-763• Patrikakou, E. N., Weissberg, R. P., Redding, S., & Walberg, H. J. (Eds.). (2005). School-family
partnerships: Fostering children’s school success. New York: Teachers College Press.• Yap, K., and Enoki, D., (1995). In Search of the Elusive Magic Bullet: Parental Involvement
and Student Outcomes (2007), Perceptions of Parent Involvement in Academic * Achievement.
• O’Connor-Petruso, Sharon A., (2009, February 5) Descriptive & Inferential Statistics, Analyses, Threats and Designs. Powerpoint. Brooklyn College, Graduate Department of Education.

Reading Changes Lives