Embed Size (px)
Citation preview
1
DEPARTMENT OF ECONOMICS
ISSN 1441-5429
DISCUSSION PAPER 02/14
Parents’ attitudes towards science and their children’s science achievement
Liyanage Devangi H. Perera, Eduard J. Bomhoff & Grace H.Y. Lee
Abstract Although countries and school systems worldwide are emphasizing the importance of science
education for technological development and global economic competition, comparative findings
from standardized international student assessments point towards a huge gap in science scores
between developed and developing countries. Certain developed economies too have made little
progress in raising science achievement over the past decade. Despite school improvement being
placed high on the policy agenda, the results of such actions have been poor. Therefore, there is a
need to explore additional ways in which science achievement can be enhanced. This study focuses
on the family and examines to what extent parents’ attitudes towards science (how much they value
science and the importance they place on it) can influence their children’s science achievement.
Individual- and school-level data are obtained from the Program for International Student
Assessment (PISA) 2006 survey for 15 OECD and non-OECD countries. Hierarchical Linear
Modelling (HLM) is employed to estimate the equations. The findings indicate that parents’
attitudes towards science have a positive and statistically significant effect on science achievement,
after controlling for other important student- and school-level variables. Moreover, students from
poor backgrounds appear to benefit from more positive parental science attitudes as much as
students from high socioeconomic status, such that equality of student achievement is not affected.
This study recommends that schools and teachers encourage parents to play a more pro-active role
in their children’s science education, as well as educate parents about the importance of science and
strategies that can be adopted to support their children’s science learning.
Keywords: science achievement, parents’ attitudes, PISA, multi-level modelling
JEL codes: I2, Z13
© 2014 Liyanage Devangi H. Perera, Eduard J. Bomhoff & Grace H.Y. Lee
All rights reserved. No part of this paper may be reproduced in any form, or stored in a retrieval system, without the prior written
permission of the author.
2
1.0 Introduction
1.1 Background
Technology and globalization have brought about rapid economic growth and a transformation
of everyday life in the past few decades (Sun, Bradley & Akers, 2012). As a result, countries and
school systems across the globe have started to emphasize the fundamental role that science
education plays in technological development and global economic competition and have called
for reforms in science education (Sun et al., 2012). Furthermore, the widely-discussed and
pressing issues of environmental pollution and climate change are examples of socio-scientific
concerns that require an engagement with and understanding of science in order to find solutions
(Boon, 2012). As stressed more generally by top United Nations officials at a 2013 UN forum,
innovations in science and technology would be imperative for overcoming today’s global
challenges such as poverty alleviation and sustainable development (United Nations, 2013).
The Program for International Student Assessment (PISA) is a standardized international
assessment that examines science competencies of 15-year olds. Such competencies provide an
early indication of how these children would respond to issues, problems and situations relating
to science and technology that may arise later in life (OECD, 2006a). PISA also measures the
educational attainment of these students on reading and mathematical literacy, but the focus of
the current study is on scientific literacy only. PISA examines both the cognitive and affective
aspects of scientific literacy. In terms of cognitive aspects, it measures students’ science
knowledge and their “capacity to use this knowledge, to identify questions and to make
evidence-based conclusions in order to understand and help make decisions about the natural
world and the changes made to it through human activity” (OECD, 2004, p. 286). Affective or
non-cognitive aspects examine students’ “interest in science, support for scientific enquiry, and
motivation to act responsibly towards, for example, natural resources and environment” (OECD,
2006a, p. 22). The PISA 2006 science assessment covered issues such as maintenance of health,
personal consumption of materials and energy, and climate change (OECD, 2006a).
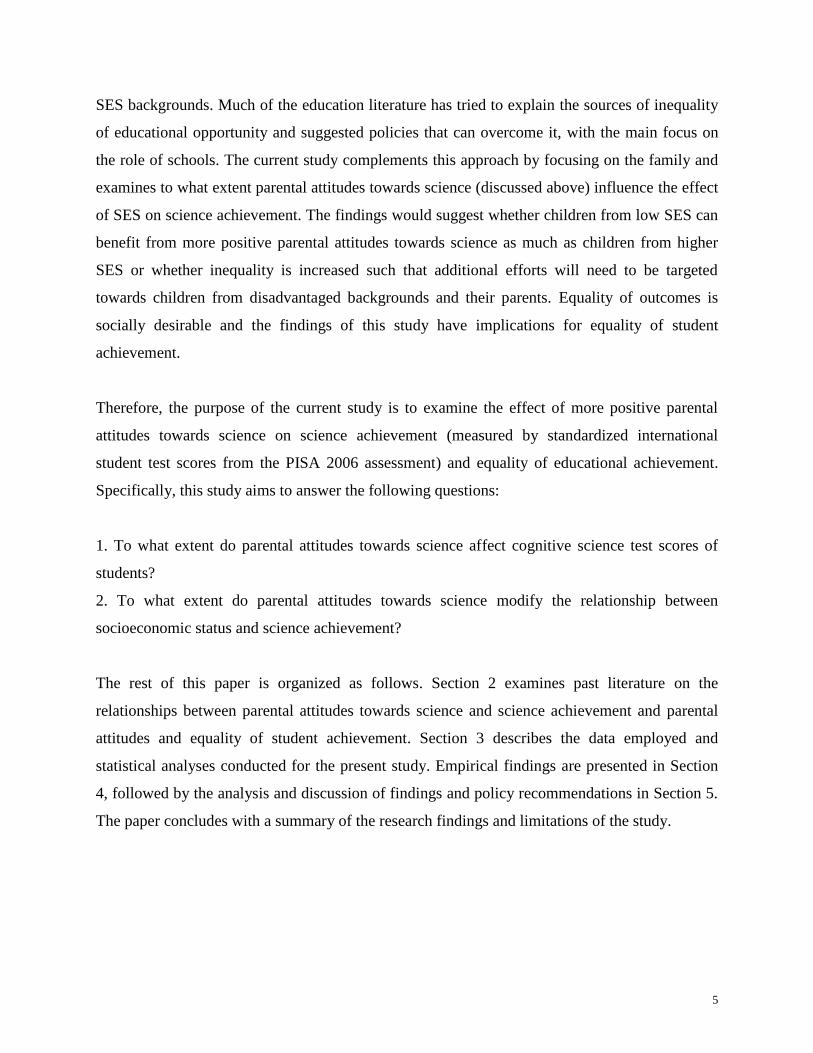
Comparative findings from PISA help policymakers to compare the relative position of countries
in scientific literacy as well as assess the effectiveness of science educational policies instituted
to improve the quality of science education and student achievement. Table 1 below shows PISA
science test scores from 2000 to 2012 for selected developed and developing countries. The gap
3
in science test scores between developed and developing economies is significant and – outside
East Asia – not yet shrinking. For example, in 2000, the gap between South Korea and Indonesia
was 159 score points (more than 1.5 standard deviations), which had reduced to only 156 score
points by 2012. Even among the developed countries, science performance has not seen much
improvement since 2000 especially in Australia, United States and France. Hence, it can be
concluded that science performance is worrying in both developed and developing countries.
Table 1: PISA Science test scores, 2000-2012, for selected developing and developed countries
Note: Countries are ranked in terms of the PISA 2012 science test scores.
Source: OECD (2004, 2007, 2010, 2013)
It is important and useful to identify factors that can improve science test scores. Although
researchers and policymakers worldwide have identified the need to improve achievement in
science, much emphasis has been placed on improving teachers and schools, given that it is
easier for governments to influence these two factors. But policies that involve substantial flows
of resources such as direct spending, increases in teacher salaries and reductions in class size,
provide little assurance that educational outcomes can be significantly improved (Hanushek &
Woessmann, 2011). Student achievement clearly depends on many factors that operate
independently of schooling institutions. Based on the ‘education production function’
2000 2003 2006 2009 2012
Japan 550 548 531 539 547
South Korea 552 538 522 538 538
Poland 483 498 498 508 526
Germany 487 502 516 520 524
Australia 528 525 527 527 521
Latvia 460 489 490 494 502
OECD average 500 496 498 501 501
France 500 511 495 498 499
Denmark 481 475 496 499 498
US 499 491 489 502 497
Russian Federation 460 489 479 478 486
Thailand 436 429 421 425 444
Mexico 422 405 410 416 415
Brazil 375 390 390 405 405
Indonesia 393 395 393 383 382
4
(Hanushek, 1994), student achievement can be expressed as a function of student characteristics,
family background, school resources and country characteristics. In addition to quality of
teachers and schools, focusing on improving parents’ efforts towards their children’s education
can also have a significant impact. That could complement the efforts of teachers and schools in
improving science achievement. Attention needs to be paid also to the role of the family in
improving science performance.
Among the home factors that can affect student science achievement, many studies have focused
on the role played by socioeconomic status, parenting styles and involvement (Smith &
Hausafus, 1998; Szechter & Carey, 2009; Tare, French, Frazier, Diamond & Evans, 2011) and
parental attitudes towards education (Chen, 2001). PISA also offers some responses about
parents’ attitudes towards science (the importance they place on science and how much they
value science). These parental attitudes have not been examined previously in relation to science
achievement, with the exception of the study for Hong Kong by Sun et al. (2012). Their paper
examined this relationship only in one particular country and hence, it would be interesting to
extend the analysis for several more countries using data from standardized international
assessments that could provide comparable information across countries.
The socioeconomic status (SES) of the family also plays a major role in determining science
achievement both within and between countries, with students from high SES backgrounds
performing significantly better than those from low SES backgrounds. As seen in Table 1, there
are large differences in science achievement between countries based on the level of economic
development. When PISA’s indicator for SES – the index of economic, social and cultural status
(ESCS) – increases by 1 standard deviation within the OECD countries, science performance can
be increased by 40 score points (equivalent to 0.4 standard deviations) (OECD, 2007), which is a
significant improvement. Socioeconomic inequalities are a major issue for both researchers and
policymakers within countries. Given the higher labour-market returns to better quality education
and the strong relationship between cognitive achievement and employment, equity of student
achievement is crucial for subsequent earnings equality and intergenerational mobility of
societies, in general (Schütz, West & Woessmann, 2007). Parents, schools and society can help
compensate for these differences in science achievement by supporting those students from low
5
SES backgrounds. Much of the education literature has tried to explain the sources of inequality
of educational opportunity and suggested policies that can overcome it, with the main focus on
the role of schools. The current study complements this approach by focusing on the family and
examines to what extent parental attitudes towards science (discussed above) influence the effect
of SES on science achievement. The findings would suggest whether children from low SES can
benefit from more positive parental attitudes towards science as much as children from higher
SES or whether inequality is increased such that additional efforts will need to be targeted
towards children from disadvantaged backgrounds and their parents. Equality of outcomes is
socially desirable and the findings of this study have implications for equality of student
achievement.
Therefore, the purpose of the current study is to examine the effect of more positive parental
attitudes towards science on science achievement (measured by standardized international
student test scores from the PISA 2006 assessment) and equality of educational achievement.
Specifically, this study aims to answer the following questions:
1. To what extent do parental attitudes towards science affect cognitive science test scores of
students?
2. To what extent do parental attitudes towards science modify the relationship between
socioeconomic status and science achievement?
The rest of this paper is organized as follows. Section 2 examines past literature on the
relationships between parental attitudes towards science and science achievement and parental
attitudes and equality of student achievement. Section 3 describes the data employed and
statistical analyses conducted for the present study. Empirical findings are presented in Section
4, followed by the analysis and discussion of findings and policy recommendations in Section 5.
The paper concludes with a summary of the research findings and limitations of the study.
6
2.0 Literature Review
Parental attitudes towards science and science achievement
Empirical research has confirmed that children’s attitudes towards science can have a significant
impact on their science test scores (Beaton et al., 1996; George & Kaplan, 1998; Schibeci &
Riley, 1986; Singh, Granville & Dika, 2002). In recent years, there has also been an increasing
amount of literature examining the effect of parental involvement on children’s science
achievement (Fan & Chen, 2001; Ho, 2010; Ratelle, Larose, Guay & Senécal, 2005; Tare et al.,
2011). Parental involvement can take the form of direct participation in science activities such as
library and science museum visits or indirect support provided at home by helping with
homework and buying more science books (Sun et al., 2012). More parental involvement in
children’s science studies can have a positive influence on science test scores (Breakwell &
Beardsell, 1992; Ho, 2010; Ratelle et al. 2005; Tare et al. 2011). However, very few studies have
studied the effect that parents’ own attitudes towards science can have on their children’s science
achievement.
The study by Simpson and Oliver (1990) appears to be one of these very few and preliminary
studies investigating parental attitudes towards science and science achievement. Simpson and
Oliver (1990) observed that the father’s attitude towards science is strongly correlated with the
child’s achievement in science. However, their findings were based on simple correlation
coefficients and were limited to families in North Carolina only. Using a multi-level analytical
approach and PISA data, Sun et al. (2012) sought to identify factors that can influence science
achievement in Hong Kong. They found parental attitudes towards science to be a statistically
significant factor controlling for other student and school variables (Sun et al., 2012). Boon
(2012) conducted focus group interviews and a survey of indigenous and non-indigenous parents
in Regional Queensland to understand parental attitudes about science education. Using
structural equation modelling, Boon (2012) examined the effect of these parents’ attitudes on
parental support of science study for their children. However, her study did not address whether
parental attitudes could affect their children’s science achievement.
According to Sun et al. (2012), there are two ways in which parental attitudes towards science
could affect their children’s science achievement. One such way is by influencing their
7
children’s attitudes. Bourdieu (1998) asserted that within social groups, children tend to develop
certain tastes, academic motivations and preferences based on the experiences provided by
parents. Simpson and Oliver (1990) found that even though school factors have a dominant
effect on student attitudes towards science, parental attitudes towards science can also have a
positive influence. Tenenbaum and Leaper (2003) also concluded that parental beliefs about
science can significantly influence children’s interest and self-efficacy in science. More positive
attitudes towards science among children, in turn, result in increased enrolment in science
courses, and also influence science achievement and interest in science careers (George &
Kaplan, 1998). Smith and Hausafus (1998) showed that in the US, believing science to be an
important subject for children and encouraging children to take advanced science courses affects
science test scores more than whether parents attend parent-teacher conferences or have more
books and magazines at home. They concluded that teachers should help parents see the
importance of science and mathematics in their children’s daily lives (Smith & Hausafus, 1998).
More recent studies have also affirmed that parental attitudes can influence their children’s
attitudes. Gunderson, Ramirez, Levine and Beilock (2012) studied the role played by parents’
math anxieties and self-concepts and argued that little research has addressed this relationship,
partially due to the implicit belief that schools play the primary role in promoting math learning.
Gunderson et al. (2012) concluded that just as a female school teacher could serve as a role
model for her female students, parents’ attitudes towards math could influence their children’s
math attitudes. Employing data from a longitudinal project, DeWitt et al. (2013) found that
students who reported to have parents with more positive attitudes towards science tended to
have higher educational and occupational science aspirations. Therefore, parental attitudes
towards science can positively influence their children’s attitudes, which in turn are associated
with higher science test scores (George & Kaplan, 1998; Schibeci & Riley, 1986; Simpson &
Oliver, 1990).
Parental attitudes towards science can also affect science achievement by influencing parental
involvement in their children’s science studies (Sun et al., 2012). As mentioned before, parental
involvement can be either direct participation in science activities such as science museum visits
or indirect support by helping with homework. George and Kaplan (1998) found parental
8
attitudes towards science to be positively correlated with the number of science books at home
and access to a home computer. Szechter and Carey (2009) also revealed that parents’ views of
science and scientists were positively associated with the number of museum exhibits they
visited with their children. Likewise, Tare et al. (2011) noted that parents’ views on the
importance of understanding evolution were positively correlated with the educational quality of
the museum visit (in terms of duration and reasoning provided by parents). In terms of indirect
support, parents who have a negative attitude towards school science learning tend to remain
uninvolved in their children’s science homework (Kaya & Lundeen, 2010). Greater parental
involvement in children’s science learning, directly or indirectly, in turn, has been found to lead
to better science achievement (Ho, 2010; Szechter & Carey, 2009; Tare et al., 2011). Szechter
and Carey (2009) highlighted the importance of out-of-school, informal learning experiences for
children’s interest and understanding of science and sought to understand the nature of parent-
child conversations at an informal science education centre in the US. Activities such as
watching television programmes about science and reading books on scientific discovery have
been found to be influential for achievement in science in Hong Kong (Ho, 2010).
While parental attitudes towards science do appear to be important for students’ science
achievement, there is little empirical evidence to support this claim. The study by Sun et al.
(2012) focuses only on Hong Kong and it would be interesting to extend the analysis to include
more countries from different regions to observe whether the relationship still holds1. Therefore,
the present study aims to contribute to the literature by examining the relationship between
parental attitudes towards science and their children’s science achievement for several countries
from different regions2. Given that more positive parental attitudes towards science can affect
their children’s science achievement by influencing the children’s attitudes towards science and
parental involvement in science-related activities, it is hypothesized that:
Hypothesis 1: More positive parental attitudes towards science will lead to higher science
achievement of students.
1 Sun et al. (2012) deleted all student observations with missing values which may have created bias if observations
were not missing at random (Schütz et al., 2007). 2 This study conducts multiple imputation to replace missing values instead of deleting valuable observations.
9
Parental attitudes towards science and Equality of student achievement
The SES of the family has a considerable impact on the student’s academic achievement, with
students from more favourable family backgrounds scoring significantly higher in science than
those from low SES backgrounds (OECD, 2007). For example, wealthy parents can “buy”
educational success for their children by sending them to prestigious, expensive schools, paying
for extra tuition classes, and buying houses in districts that have good schools (Marks, Cresswell
& Ainley, 2006). Social justice is served when the school system is there for all children, rich
and poor, and gives poor children as much of an equal position at the starting line as possible.
Researchers including Marks et al. (2006), Schütz et al. (2007) and Waltenberg and
Vandenberghe (2007) have emphasized the importance of schools in achieving such equality of
educational opportunity. Schütz et al. (2007) investigated the impact of school reforms in terms
of accountability, autonomy and choice on equality of opportunity across countries. In other
words, they examined whether student achievement depends more or less on SES in school
systems that employ these institutional features. The authors concluded that education systems
that favour accountability, autonomy and choice appear to benefit all students rather than
harming disadvantaged students. While it is obvious that schools can play a major role in helping
to achieve equality of outcomes, parents too can contribute to better outcomes regardless of their
socioeconomic background (OECD, 2012). Hence, this study complements the approach taken
by Schütz et al. (2007) by focusing on the family and examines whether or not the effect of SES
on science achievement becomes magnified with more positive parental attitudes towards
science. The question of whether parental attitudes towards science can influence the relationship
between SES and science achievement has not been examined before, and hence, the present
study contributes to the literature by focusing on this issue.
It is possible that as parental attitudes towards science becomes more positive, they will have a
more favourable impact on achievement of students from higher SES compared to those from
less favourable backgrounds. This is because with more positive parental attitudes towards
science, the more educated parents who have higher science competence would be more willing
and able to help their children in their science homework or be more willing to take them to the
museum or science centres. Bandura’s (1986) Social Learning Theory proposed that people tend
to avoid tasks in which they lack confidence (Kaya & Lundeen, 2010). Green, Walker, Hoover-
10
Dempsey and Sandler (2007) found evidence to support this theory, noting that self-efficacy
beliefs of parents (i.e. beliefs of their capability to act in ways that will produce desirable
outcomes) are a strong, positive predictor of home-based involvement such as keeping track of
the child’s progress in school. Therefore, parents from low SES with low levels of scientific
knowledge may lack confidence to support their children’s science learning even though they
may have a positive attitude towards science. However, this may not necessarily be true since the
literature provides mixed evidence as to whether or not parental involvement differs based on
SES.
Lareau (1987) put forward three conceptual approaches that can be used to explain differences in
parental involvement based on SES: the culture of poverty, the institutional approach, and the
cultural capital approach. According to the cultural capital approach, for instance, schools are
largely middle-class institutions with values, organizational patterns, and forms of
communication that are more conducive to the middle-class. Therefore, children from middle-
class families are better able to adapt and benefit from school life and parents too feel
comfortable getting involved in the school (Sui-Chu & Willms, 1996). McNeal Jr. (2001) noted
that poor parents and minorities tend to refrain from getting involved in school activities as a
result of their sense of intimidation and previous negative educational experiences. Previous
studies have also shown differences in museum and science exhibit experiences between families
with high and low levels of parental education. For example, Szechter and Carey (2009) asserted
that learning conversations in museum visits by parents and children may differ between groups
with high and low levels of parental schooling. Parents’ overall level of schooling was found to
be positively correlated with the amount of time parents and children spend in the exhibit hall
and with the proportion of exhibits in which the parents make connections with previous
experiences (Szechter & Carey, 2009). Children who hear more explanations from parents are in
turn more likely to develop better conceptual understanding of the exhibited phenomena (Fender
& Crowler, 2007, as cited in Tare et al., 2011).
On the other hand, some studies have failed to find a significant relationship between parental
involvement and SES, asserting that poor parents are as involved in their children’s education as
much as richer parents. Sui-Chu and Willms (1996) reported that there was virtually no
11
relationship between the SES of the family and the level of home supervision. Using data from a
longitudinal study in Britain, Hango (2007) reported that parents facing economic hardship are
able to reduce the impact of financial disadvantage on their children’s education by showing a
greater interest in their children’s education. Ream and Palardy (2008) asserted that even though
parents from low SES have low education levels and income compared to wealthier parents, their
children can still greatly benefit from informal parental involvement in the form of simply
talking about activities done in school or subject material studied in class.
Given the insignificant relationship observed between parental involvement and SES, it is likely
that more positive parental attitudes towards science can help poor children as much as richer
children. Therefore, it is hypothesized that:
Hypothesis 2: More positive parental attitudes towards science will not modify the
relationship between socioeconomic status and student science achievement.
3.0 Methodology
3.1 Data
All individual- and school-level data are obtained from the Program for International Student
Assessment (PISA) 2006 survey. The present study concentrates on scientific literacy since PISA
examined parental attitudes (the main area of interest) in terms of this domain only. The 2006
survey is utilized in this study since its main focus was on science achievement. The assessment
employed a two-stage stratified sample design. Schools were sampled at the first stage with
probabilities proportional to size and then students were randomly sampled from these schools at
the second stage (OECD, 2006b, 2009). The OECD also collected cross-nationally comparable
information on various aspects of students’ home, family and school backgrounds through their
student, school, and parent questionnaires. The parent questionnaire was administered to the
parents of the students participating in PISA, but only in 15 countries. Since the main variable of
this study – parental attitudes – is obtained from the parent questionnaire, only the following 15
countries can be included in the analysis: Colombia (Latin America), Bulgaria, Croatia,
Denmark, Germany, Iceland, Italy, Luxembourg, Portugal and Turkey (Europe and Central
12
Asia), Qatar (Middle East), Hong Kong, Macao and South Korea (Asia), and New Zealand
(Oceania).
Survey weights were also calculated by the OECD. Weighting acknowledges that certain units in
a sample may be more important than others and hence, should contribute more for population
estimates. Survey weights are not the same for all students in a country due to reasons such as
over- or under-sampling of certain sectors of the school population for analysis at the national
level or school (OECD, 2009). If population parameters are estimated without taking these
varying probabilities into account, results will be biased (OECD, 2009). Therefore, the data is
weighted at both the student and school level when conducting the analysis.
3.1.2 Dependent variable
The dependent variable is student science achievement measured by the PISA science literacy
test scores. PISA defines scientific literacy as “the capacity to use scientific knowledge, to
identify questions and to draw evidence-based conclusions in order to understand and make
decisions about the natural world and the changes made to it through human activities” (OECD,
2000, p. 76). To overcome conflicting demands of limited testing time and broad coverage of the
science domain, the data made available by the OECD have gone through the following
procedure. The OECD used a balanced incomplete block (BIB) test where students answered
only a subset of questions from the overall test (Chiu, 2007). Different subtests were created and
in order to compare student performance between tests, the test scores were analysed by fitting a
graded response Rasch model to the BIB data (Chiu, 2007; OECD, 2009). The Rasch model
creates a continuum on which student ability (measured by the achievement score) and item
difficulty is located, which are then linked by a logistic function that can compute the probability
that a student succeeds on any test item (OECD, 2009). The OECD then estimated a distribution
of plausible scores that students might have obtained had they completed the full test, and given
the measurement error associated with the test (Willms & Smith, 2005). Five plausible values
were then selected from this posterior distribution for each student. To obtain parameter
estimates, the analysis is conducted for each of the five plausible values and then averaged.
13
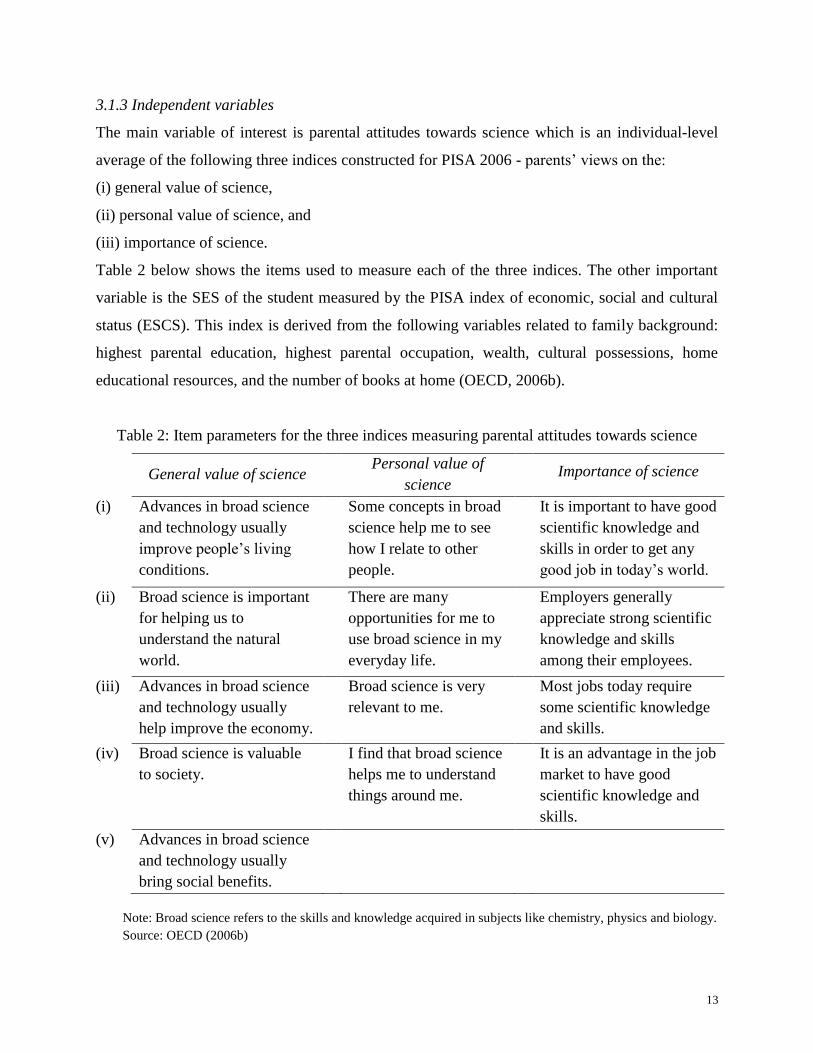
3.1.3 Independent variables
The main variable of interest is parental attitudes towards science which is an individual-level
average of the following three indices constructed for PISA 2006 - parents’ views on the:
(i) general value of science,
(ii) personal value of science, and
(iii) importance of science.
Table 2 below shows the items used to measure each of the three indices. The other important
variable is the SES of the student measured by the PISA index of economic, social and cultural
status (ESCS). This index is derived from the following variables related to family background:
highest parental education, highest parental occupation, wealth, cultural possessions, home
educational resources, and the number of books at home (OECD, 2006b).
Table 2: Item parameters for the three indices measuring parental attitudes towards science
General value of science
Personal value of
science Importance of science
(i) Advances in broad science
and technology usually
improve people’s living
conditions.
Some concepts in broad
science help me to see
how I relate to other
people.
It is important to have good
scientific knowledge and
skills in order to get any
good job in today’s world.
(ii) Broad science is important
for helping us to
understand the natural
world.
There are many
opportunities for me to
use broad science in my
everyday life.
Employers generally
appreciate strong scientific
knowledge and skills
among their employees.
(iii) Advances in broad science
and technology usually
help improve the economy.
Broad science is very
relevant to me.
Most jobs today require
some scientific knowledge
and skills.
(iv) Broad science is valuable
to society.
I find that broad science
helps me to understand
things around me.
It is an advantage in the job
market to have good
scientific knowledge and
skills.
(v) Advances in broad science
and technology usually
bring social benefits.
Note: Broad science refers to the skills and knowledge acquired in subjects like chemistry, physics and biology.
Source: OECD (2006b)
14
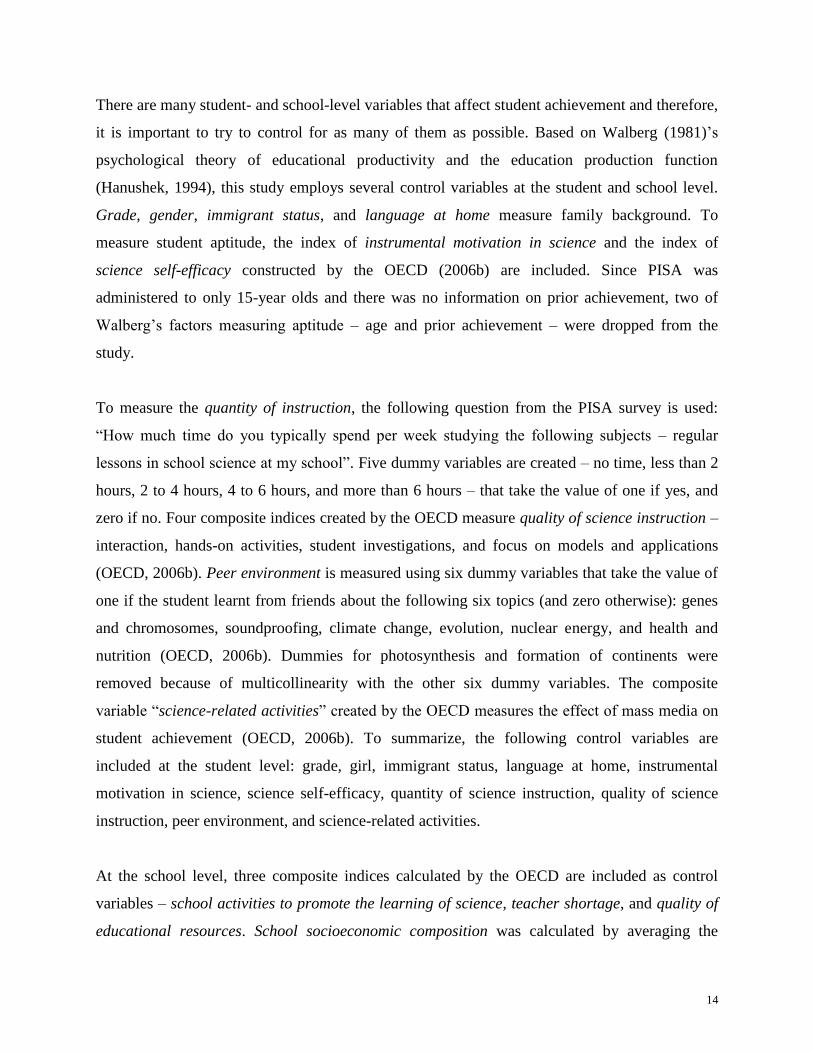
There are many student- and school-level variables that affect student achievement and therefore,
it is important to try to control for as many of them as possible. Based on Walberg (1981)’s
psychological theory of educational productivity and the education production function
(Hanushek, 1994), this study employs several control variables at the student and school level.
Grade, gender, immigrant status, and language at home measure family background. To
measure student aptitude, the index of instrumental motivation in science and the index of
science self-efficacy constructed by the OECD (2006b) are included. Since PISA was
administered to only 15-year olds and there was no information on prior achievement, two of
Walberg’s factors measuring aptitude – age and prior achievement – were dropped from the
study.
To measure the quantity of instruction, the following question from the PISA survey is used:
“How much time do you typically spend per week studying the following subjects – regular
lessons in school science at my school”. Five dummy variables are created – no time, less than 2
hours, 2 to 4 hours, 4 to 6 hours, and more than 6 hours – that take the value of one if yes, and
zero if no. Four composite indices created by the OECD measure quality of science instruction –
interaction, hands-on activities, student investigations, and focus on models and applications
(OECD, 2006b). Peer environment is measured using six dummy variables that take the value of
one if the student learnt from friends about the following six topics (and zero otherwise): genes
and chromosomes, soundproofing, climate change, evolution, nuclear energy, and health and
nutrition (OECD, 2006b). Dummies for photosynthesis and formation of continents were
removed because of multicollinearity with the other six dummy variables. The composite
variable “science-related activities” created by the OECD measures the effect of mass media on
student achievement (OECD, 2006b). To summarize, the following control variables are
included at the student level: grade, girl, immigrant status, language at home, instrumental
motivation in science, science self-efficacy, quantity of science instruction, quality of science
instruction, peer environment, and science-related activities.
At the school level, three composite indices calculated by the OECD are included as control
variables – school activities to promote the learning of science, teacher shortage, and quality of
educational resources. School socioeconomic composition was calculated by averaging the
15
ESCS index within each school. To measure school autonomy, a dummy variable was created
that took the value of one if the school had considerable responsibility in formulating the school
budget, and zero if the answer was no (OECD, 2006b). Dummy variables measuring other
aspects of autonomy were removed because of multicollinearity between the dummy variables.
School location, proportion of certified teachers, school enrolment size, and teacher-student ratio
were not included due to the large number of missing values for certain countries or because they
were not available for some countries. The OECD reverse-scored all scale variables (student- and
school-level) except for teacher shortage for scaling so that higher values indicate more positive,
favourable or higher levels for that attribute. GDP is measured as the log of real GDP per capita
for the year 2006 at Purchasing Power Parity (PPP) in constant 2005 international dollars
(Laspeyres) obtained from the Penn World Tables 7.1.
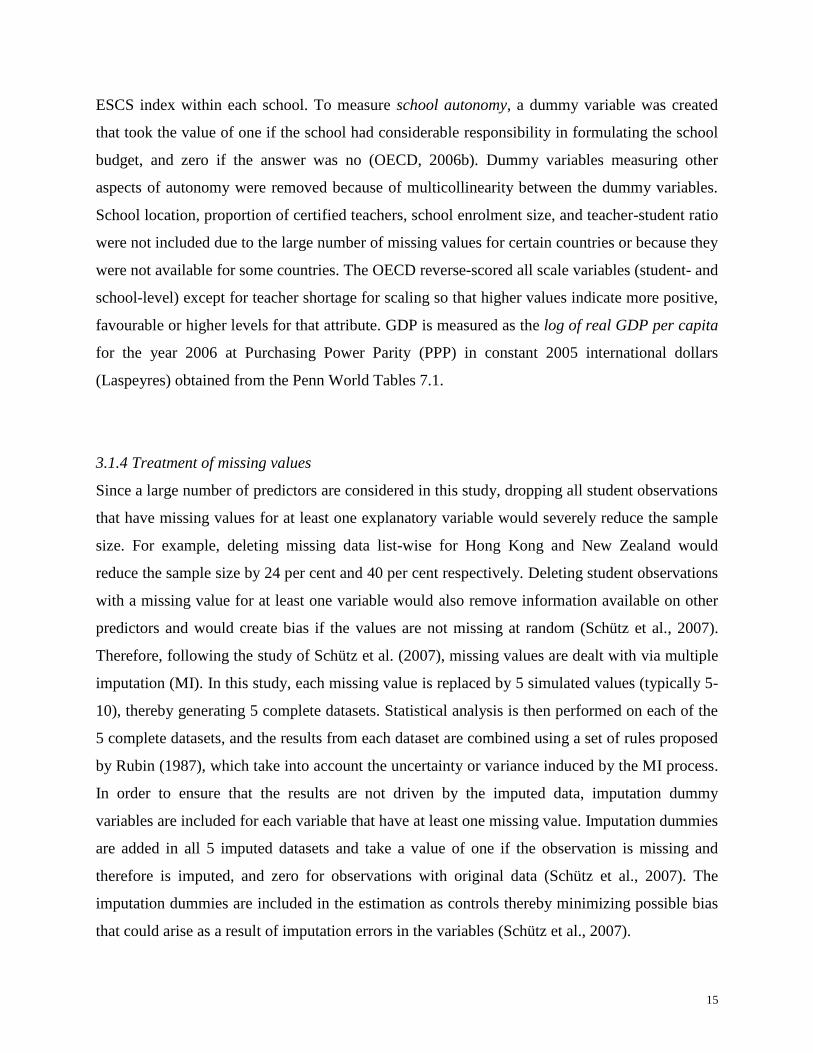
3.1.4 Treatment of missing values
Since a large number of predictors are considered in this study, dropping all student observations
that have missing values for at least one explanatory variable would severely reduce the sample
size. For example, deleting missing data list-wise for Hong Kong and New Zealand would
reduce the sample size by 24 per cent and 40 per cent respectively. Deleting student observations
with a missing value for at least one variable would also remove information available on other
predictors and would create bias if the values are not missing at random (Schütz et al., 2007).
Therefore, following the study of Schütz et al. (2007), missing values are dealt with via multiple
imputation (MI). In this study, each missing value is replaced by 5 simulated values (typically 5-
10), thereby generating 5 complete datasets. Statistical analysis is then performed on each of the
5 complete datasets, and the results from each dataset are combined using a set of rules proposed
by Rubin (1987), which take into account the uncertainty or variance induced by the MI process.
In order to ensure that the results are not driven by the imputed data, imputation dummy
variables are included for each variable that have at least one missing value. Imputation dummies
are added in all 5 imputed datasets and take a value of one if the observation is missing and
therefore is imputed, and zero for observations with original data (Schütz et al., 2007). The
imputation dummies are included in the estimation as controls thereby minimizing possible bias
that could arise as a result of imputation errors in the variables (Schütz et al., 2007).
16
3.2 Multi-level modelling
In PISA data, students are nested within schools, with variables describing students at the
individual level, and school-level variables describing the nature of their schools. This study
employs multilevel modelling (MLM), which is the most appropriate statistical technique for
PISA data due to its ability to remove correlation among error terms as a result of students being
nested within schools and countries (Chiu, 2007). MLM (also known as hierarchical linear
modelling) specifies a variance components model, separating unexplained error into student
(Level 1), school (Level 2), and country (Level 3) components. Hence, standard errors of
regression coefficients estimated by MLM are therefore, more precisely estimated in comparison
with OLS regression (Chiu, 2007).
MLM is conducted using the software Hierarchical Linear and Nonlinear Modelling (HLM) 7.1
(Raudenbush & Bryk, 2002) which takes into account the hierarchical structure of the data. This
software is able to combine the five imputed datasets and provide the final parameter estimates
and standard errors. Additionally, HLM 7.1 also allows researchers to incorporate the weights
provided at the student and school level in the PISA 2006 dataset into the analysis. In order for
the intercept representing the grand mean of students’ science achievement to be a meaningful
average measure of achievement, as well as to limit the possibility of multicollinearity between
levels, student- and school-level variables were centred on their group means while the country-
level variables were centred on their grand means. The HLM software also provides deviance
values (also known as -2 log likelihood or model chi-square) which allow for tests of model
improvement. The greater the drop in deviance of the new model, the more likely that the model
fit is to be significantly better (Garson, 2012, p. 70). The p-value of the likelihood ratio test
provides a measure of the extent to which this difference in deviance is statistically significant.
Hence, to assess model improvement, deviance values are reported which indicate whether the
drop in deviance is significant at the 1 per cent, 5 per cent or 10 per cent level.
3.3 Statistical Models
This study estimates 3 three-level models that build incrementally using the pooled data of 15
countries. Model 1 includes the student- and school-level control variables described in Section
17
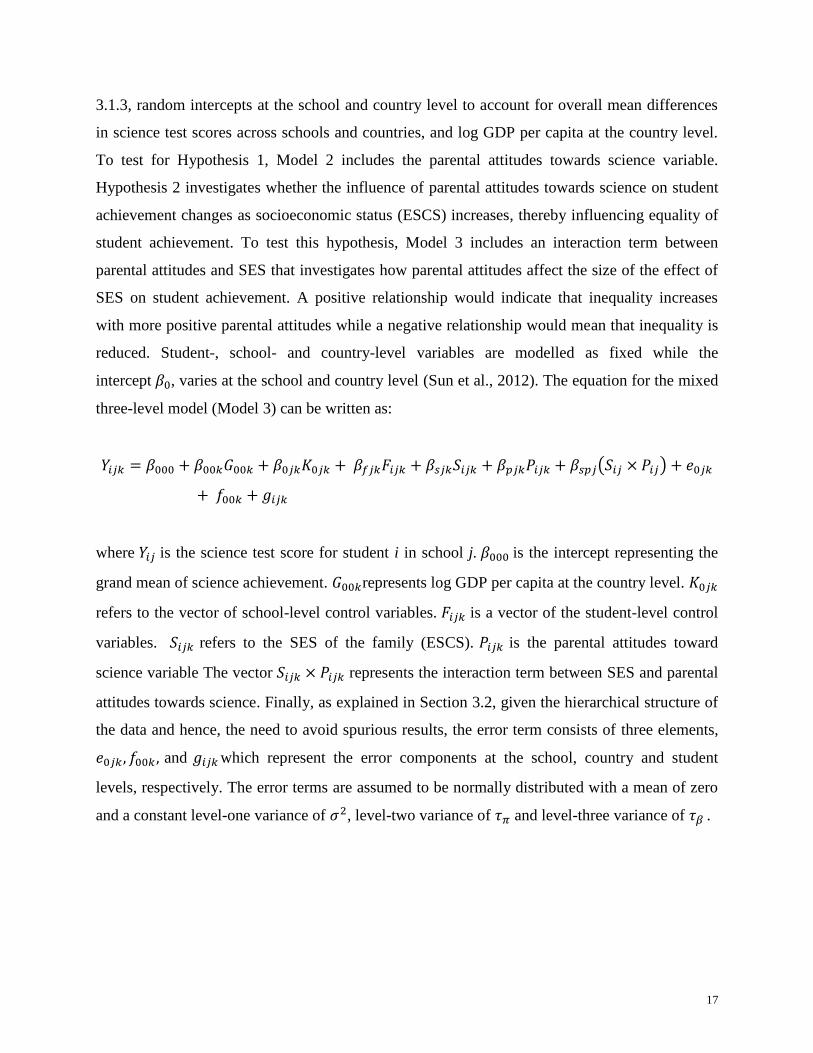
3.1.3, random intercepts at the school and country level to account for overall mean differences
in science test scores across schools and countries, and log GDP per capita at the country level.
To test for Hypothesis 1, Model 2 includes the parental attitudes towards science variable.
Hypothesis 2 investigates whether the influence of parental attitudes towards science on student
achievement changes as socioeconomic status (ESCS) increases, thereby influencing equality of
student achievement. To test this hypothesis, Model 3 includes an interaction term between
parental attitudes and SES that investigates how parental attitudes affect the size of the effect of
SES on student achievement. A positive relationship would indicate that inequality increases
with more positive parental attitudes while a negative relationship would mean that inequality is
reduced. Student-, school- and country-level variables are modelled as fixed while the
intercept , varies at the school and country level (Sun et al., 2012). The equation for the mixed
three-level model (Model 3) can be written as:
( )
where is the science test score for student i in school j. is the intercept representing the
grand mean of science achievement. represents log GDP per capita at the country level.
refers to the vector of school-level control variables. is a vector of the student-level control
variables. refers to the SES of the family (ESCS). is the parental attitudes toward
science variable The vector represents the interaction term between SES and parental
attitudes towards science. Finally, as explained in Section 3.2, given the hierarchical structure of
the data and hence, the need to avoid spurious results, the error term consists of three elements,
and which represent the error components at the school, country and student
levels, respectively. The error terms are assumed to be normally distributed with a mean of zero
and a constant level-one variance of , level-two variance of and level-three variance of .
18
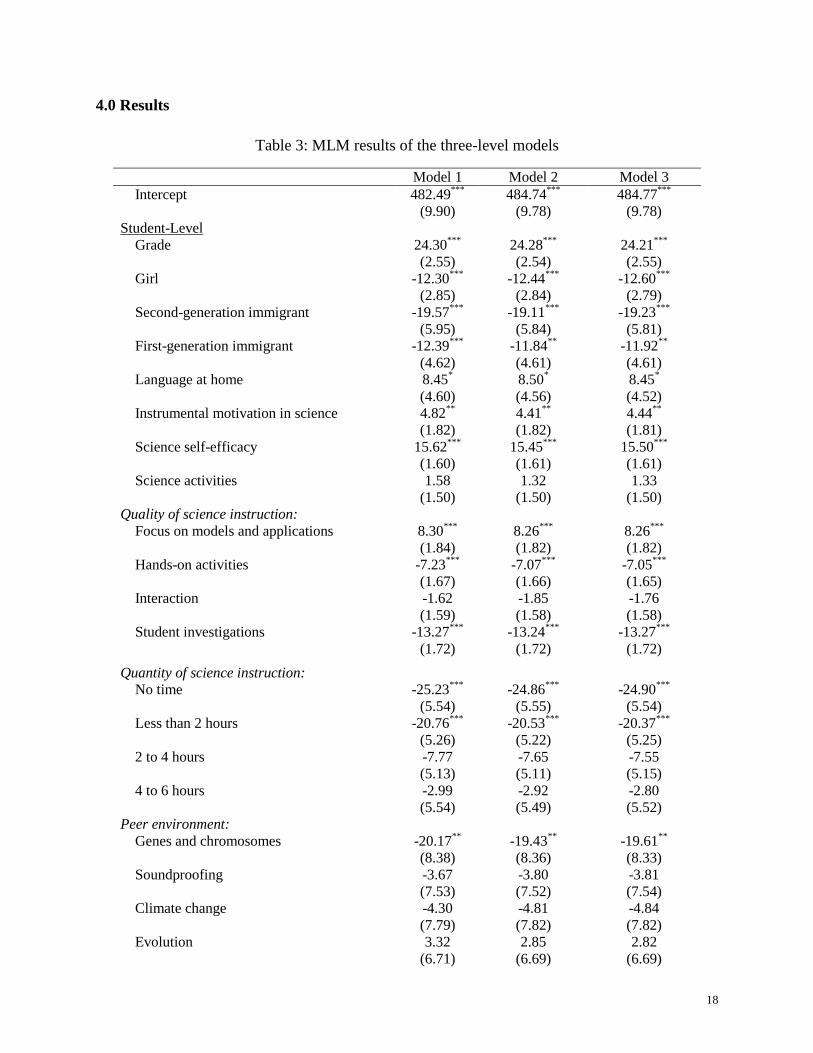
4.0 Results
Table 3: MLM results of the three-level models
Model 1 Model 2 Model 3
Intercept 482.49***
(9.90)
484.74***
(9.78)
484.77***
(9.78)
Student-Level
Grade 24.30***
(2.55)
24.28***
(2.54)
24.21***
(2.55)
Girl -12.30***
(2.85)
-12.44***
(2.84)
-12.60***
(2.79)
Second-generation immigrant -19.57***
(5.95)
-19.11***
(5.84)
-19.23***
(5.81)
First-generation immigrant -12.39***
(4.62)
-11.84**
(4.61)
-11.92**
(4.61)
Language at home 8.45*
(4.60)
8.50*
(4.56)
8.45*
(4.52)
Instrumental motivation in science 4.82**
(1.82)
4.41**
(1.82)
4.44**
(1.81)
Science self-efficacy 15.62***
(1.60)
15.45***
(1.61)
15.50***
(1.61)
Science activities 1.58
(1.50)
1.32
(1.50)
1.33
(1.50)
Quality of science instruction:
Focus on models and applications
8.30***
(1.84)
8.26***
(1.82)
8.26***
(1.82)
Hands-on activities -7.23***
(1.67)
-7.07***
(1.66)
-7.05***
(1.65)
Interaction -1.62
(1.59)
-1.85
(1.58)
-1.76
(1.58)
Student investigations -13.27***
(1.72)
-13.24***
(1.72)
-13.27***
(1.72)
Quantity of science instruction:
No time
-25.23***
(5.54)
-24.86***
(5.55)
-24.90***
(5.54)
Less than 2 hours -20.76***
(5.26)
-20.53***
(5.22)
-20.37***
(5.25)
2 to 4 hours -7.77
(5.13)
-7.65
(5.11)
-7.55
(5.15)
4 to 6 hours -2.99
(5.54)
-2.92
(5.49)
-2.80
(5.52)
Peer environment:
Genes and chromosomes
-20.17**
(8.38)
-19.43**
(8.36)
-19.61**
(8.33)
Soundproofing -3.67
(7.53)
-3.80
(7.52)
-3.81
(7.54)
Climate change -4.30
(7.79)
-4.81
(7.82)
-4.84
(7.82)
Evolution 3.32
(6.71)
2.85
(6.69)
2.82
(6.69)
19
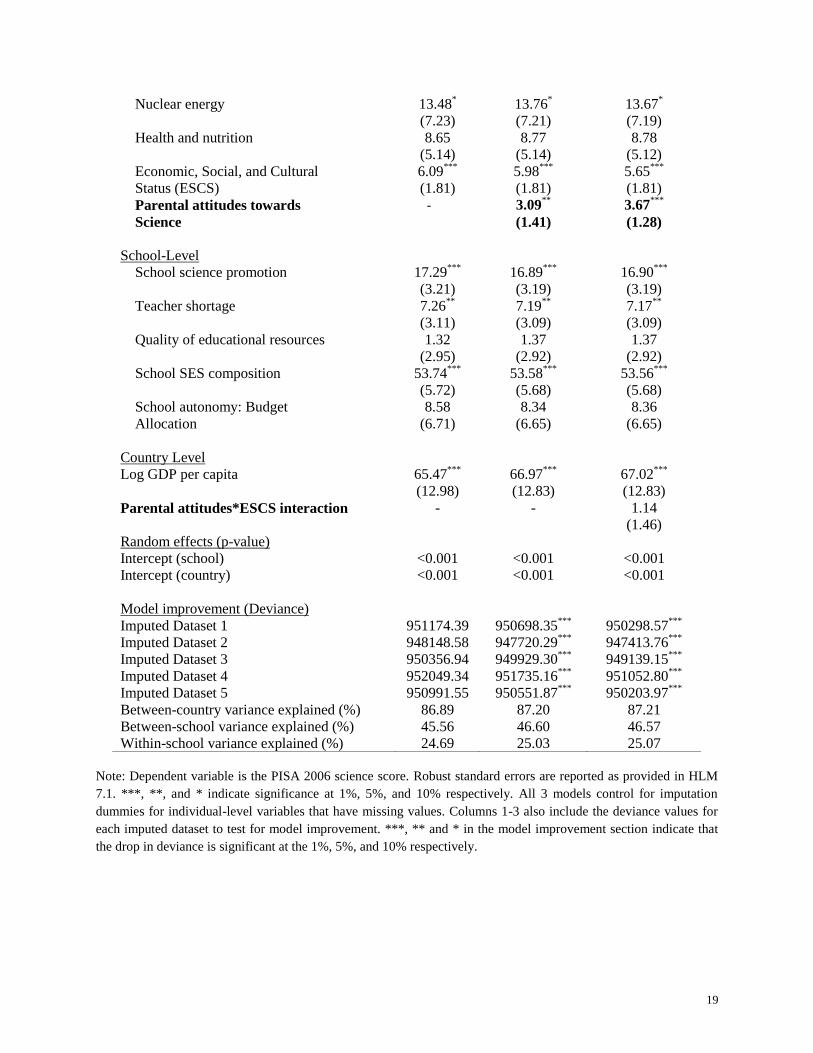
Note: Dependent variable is the PISA 2006 science score. Robust standard errors are reported as provided in HLM
7.1. ***, **, and * indicate significance at 1%, 5%, and 10% respectively. All 3 models control for imputation
dummies for individual-level variables that have missing values. Columns 1-3 also include the deviance values for
each imputed dataset to test for model improvement. ***, ** and * in the model improvement section indicate that
the drop in deviance is significant at the 1%, 5%, and 10% respectively.
Nuclear energy 13.48*
(7.23)
13.76*
(7.21)
13.67*
(7.19)
Health and nutrition 8.65
(5.14)
8.77
(5.14)
8.78
(5.12)
Economic, Social, and Cultural
Status (ESCS)
6.09***
(1.81)
5.98***
(1.81)
5.65***
(1.81)
Parental attitudes towards
Science
- 3.09**
(1.41)
3.67***
(1.28)
School-Level
School science promotion 17.29***
(3.21)
16.89***
(3.19)
16.90***
(3.19)
Teacher shortage 7.26**
(3.11)
7.19**
(3.09)
7.17**
(3.09)
Quality of educational resources 1.32
(2.95)
1.37
(2.92)
1.37
(2.92)
School SES composition 53.74***
(5.72)
53.58***
(5.68)
53.56***
(5.68)
School autonomy: Budget
Allocation
8.58
(6.71)
8.34
(6.65)
8.36
(6.65)
Country Level
Log GDP per capita 65.47***
(12.98)
66.97***
(12.83)
67.02***
(12.83)
Parental attitudes*ESCS interaction
- - 1.14
(1.46)
Random effects (p-value)
Intercept (school) <0.001 <0.001 <0.001
Intercept (country) <0.001 <0.001 <0.001
Model improvement (Deviance)
Imputed Dataset 1 951174.39 950698.35***
950298.57***
Imputed Dataset 2 948148.58 947720.29***
947413.76***
Imputed Dataset 3 950356.94 949929.30***
949139.15***
Imputed Dataset 4 952049.34 951735.16***
951052.80***
Imputed Dataset 5 950991.55 950551.87***
950203.97***
Between-country variance explained (%) 86.89 87.20 87.21
Between-school variance explained (%) 45.56 46.60 46.57
Within-school variance explained (%) 24.69 25.03 25.07
20
Table 3 displays the coefficients and standard errors for the three-level MLM models. The HLM
estimates of reliability are strong (lambda = 0.904 for level 1 and lambda = 0.928 for level 2),
which justifies using the coefficient to distinguish science achievement among schools and
countries (Sun et al., 2012). The first column provides information for Model 1 that examines the
effect of the control variables on science achievement. SES measured by the ESCS index, has a
significant impact on student achievement across countries. Consistent with previous research,
students are more likely to score higher on science if they are in a higher grade, are boys, are
native students, speak the test language at home, have higher instrumental motivation in science,
have higher self-efficacy, tend to focus more on models and applications when learning science,
spend more time in science classes, have a more positive peer environment, and attend schools
that are more likely to promote science and higher school SES. Students from more developed
countries also appear to be doing better since log GDP per capita appears to have a strong,
significant impact on test scores. The variables for quality of instruction – hands-on activities
and student investigations take on negative but statistically significant coefficients suggesting
that more positive values on these indices would have a detrimental effect on performance,
holding all else constant. Simple correlations between these two indices and achievement still
reveal this relationship to be negative. Since these measures are based on the opinions of
students, which may vary greatly, they may not provide a very accurate picture of the quality of
science instruction in the classroom. One peer environment variable – whether the students learnt
about genes and chromosomes from their friends – also has a negative but statistically
coefficient, suggesting that even this variable may not necessarily reflect the peer environment of
the student. The variance components model shows that the control variables explain 24.69 per
cent of the variance within schools, 45.56 per cent of the variance between schools, and 86.89
per cent of the variance between countries.
Model 2 improves on Model 1 by including parental attitudes towards science at the student-
level. The coefficients of the control variables change only slightly with the inclusion of the
parental attitudes variable and the signs of the coefficients remain unchanged. As expected from
Hypothesis 1, parental attitudes towards science have a positive and statistically significant effect
on science achievement. Holding all else constant, when parental attitudes increases by 1 unit
above the school mean, test scores can be increased by 3.09 points. The deviance values from all
21
five imputed datasets have reduced after including ‘parental attitudes towards science’ into the
model and this reduction is statistically significant, indicating that the ‘parental attitudes towards
science’ variable significantly improves the fit of the model. Hypothesis 2 stated that more
positive parental attitudes towards science will not modify the relationship between SES and
science achievement. To test for Hypothesis 2, Model 3 introduces an interaction term between
parental attitudes and ESCS. The results in column 3 lend support to this hypothesis since the
coefficient on this interaction term is not significant. This finding means that low-SES students
can benefit from more positive parental attitudes towards science as much as high-SES students.
Equity of student achievement is not affected by more positive attitudes towards science among
parents. Therefore, even parents with low education or income can still contribute to their
children’s science achievement through more positive attitudes towards science. The drop in
deviance in Model 3 is statistically significant indicating that model fit is improved further by
including the interaction with ESCS.
5.0 Discussion
The results of this study indicate that parents’ attitudes towards science have a positive effect on
science test scores across the fifteen countries. Therefore, the findings lend support to those of
Sun et al. (2012) who found parents’ attitudes towards science to be a statistically significant
factor for science achievement in Hong Kong. However, while Sun et al. (2012) found science
test scores to increase by 1.65 points, our results suggest that parents’ attitudes have a larger
impact on science test scores of 3.09 points. This difference in results may be due to the fact that
in this study, the variables were centered on their school means whereas it is not clear how
centering has been performed by Sun et al. (2012). Furthermore, the results of this study are
based on an average for fifteen countries as opposed to a single country, which may also explain
the difference observed the parental attitudes variable. The findings suggest that more positive
parental attitudes towards science would create more favourable attitudes towards science among
children, which would in turn lead to higher science achievement, as described in Section 2.
More positive parental attitudes can also influence parental involvement in children’s science
studies, either through direct participation in science activities like museum and science exhibit
visits or indirect support provided at home such as supervising science homework or buying
22
science books. In turn, past studies such as those by Szechter & Carey (2009) and Tare et al.
(2011) have revealed that more parental involvement in science can lead to higher science
achievement.
The present study also sought to determine the effect of more positive parental attitudes towards
science on equality of student achievement. Given the strong relationship between cognitive
achievement and employment, differences in cognitive achievement across social groups have a
strong and growing impact on the distribution of income within a country (Schütz et al., 2007).
Hence, examining how more positive parental attitudes towards science would affect the
relationship between SES and science achievement is insightful and has implications for
equality. Since this relationship has not been examined previously, the current study contributes
to the literature on this issue. Hypothesis 2 stated that more positive parental attitudes towards
science will not modify the relationship between SES and student science achievement. Based on
the results from this study, more positive parental attitudes towards science do not appear to
affect equality of student achievement since the interaction term between SES and parental
attitudes is insignificant. The findings of the present study do not provide sufficient evidence to
reject Hypothesis 2. In other words, they do not support fears that more positive parental
attitudes towards science would benefit children from affluent backgrounds more than children
from poorer families. Instead, the findings suggest that children from disadvantaged backgrounds
may be able to improve their science performance as much as students from more wealthy
families if their parents have more positive attitudes towards science. Therefore, these results do
not support the theories proposed by Lareau (1987) that sought to explain why parents from high
social status may be more involved in their children’s education compared to poorer parents.
A possible explanation for these findings could be the insignificant relationship between SES
and parental involvement observed by other studies, as mentioned in Section 2. For example,
Sui-Chu and Willms (1996) concluded that their findings provided little support for the argument
that parents from low SES are less involved in their children’s education compared to parents
from more affluent backgrounds citing the insignificant relationship between SES and home
supervision. Hango (2007) reported that poor parents in Britain are able to reduce the impact of
financial disadvantage on their children’s education by showing a greater interest in their
23
children’s education or strengthening the bond between parent and child by increasing the
frequency of outings with their children. The author concluded that parents could partially make
up for the lack of financial resources during their child’s life by being more involved in their
children’s education. In the US, psychological constructs such as ‘self-perceived time and energy
for involvement’ and ‘perceptions of specific child invitations’ have been found to predict
parents’ home-based involvement after controlling for family status variables such as income and
education levels of the parents (Green et al., 2007). This finding suggests that parental
involvement is predominantly influenced by parents’ interpersonal relationships with children
and teachers and other features of the social context, rather than by the parents’ SES (Green et
al., 2007). Simply talking about activities conducted in school with their children or discussing
about subject material studied in class can greatly benefit children from low SES households
even though the parents may have low educational levels (Ream and Palardy, 2008). Based on
the PISA 2009 results, the OECD (2011) concluded that genuine interest and active engagement
in their children’s studies can help them to succeed rather than unlimited time with children or
high parental education levels.
The above findings have important implications for parents, teachers and schools across
countries. Some parents may believe that once their child begins formal schooling, only teachers
are responsible for educating them. But education is a shared responsibility, and parents can
greatly complement the efforts of teachers and schools. The findings suggest that schools and
teachers can play a major role in educating parents about the importance of science and
encourage parents to play a more pro-active role in their children’s science education. Teachers
need to build strong and trusting collaborative relationships with all parents. Doing so would
encourage more parents to participate in seminars, workshops and courses on the importance of
science and strategies and practices that can be adopted to support their children’s science
learning. Family Science Night is an example of a program in the US that has been designed to
provide students with a meaningful environment to learn science by introducing parents,
students, and other family members to science concepts and allowing for adult-child co-learning
through “minds-on/hands-on experiences” (Kaya & Lundeen, 2010). Kaya and Lundeen (2010)
observed that such programs allow for more engaging, accessible and meaningful opportunities
to engage with and learn science, fostering more positive parental attitudes about science.
24
Interventions can also be implemented at the large scale with campaigns being held to raise
parental awareness of the importance of science, both in rural and urban areas (Ratelle et al.,
2005).
Sometimes, rural and/or low-income parents may not have much influence over schools. Hence,
schools and teachers need to work towards overcoming emotional and physical barriers and
cultural differences in order to ensure the participation of parents from all families, especially
those from poorer backgrounds (LaRocque, Kleiman & Darling, 2011,). In the US, teachers have
reported that they are not sufficiently trained in terms of providing strategies for working with
parents and are unable to involve parents in their children’s learning (LaRocque et al., 2011).
Therefore, education systems can support teachers by identifying milestones and expected
outcomes that teachers should aim for, allocating adequate resources to meet objectives on
family engagement, and provide the necessary training on how to build strong partnerships with
families. Finally, policymakers and educators worldwide have highlighted that there is a
declining trend in the number of students choosing to pursue education in science and science-
related fields and scientific careers (George, 2006; Osborne, Simon & Collins, 2003; Ratelle et
al., 2005). Given that parents have a great deal of influence over their children’s choices
especially in terms of career choices, creating more positive attitudes towards science among
parents would mean that they could present science careers as good options for their children.
6.0 Conclusion
The purpose of the current study was to examine the effect of more positive parental attitudes
towards science on science achievement as well as equity of student achievement. This study has
confirmed that more positive parental attitudes towards science are beneficial for children’s
science achievement. Parents’ attitudes can positively impact student science achievement by
influencing their children’s attitudes towards science and by getting more involved in their
children’s science studies such as by visiting the library and museum and supervising homework.
The second major finding is that more positive parental attitudes can benefit students from low
SES backgrounds as much as those from more favourable backgrounds instead of creating an
advantage for high SES students only. In other words, this study does not find sufficient
25
evidence to reject the notion that more positive parental attitudes benefit all students regardless
of their SES. So even if students are from a poor background, if their parents see the value of
science and have a positive attitude towards science, these children can still be encouraged and
pushed by their parents to perform well. Based on the findings, this study recommends that
teachers and schools institute parental awareness programs that help raise attitudes towards
science and educate parents about practices that can be adopted to support their children’s
learning. Measures must be taken to ensure that parents from all backgrounds are involved in
these programs. A limitation of this study is that due to the large number of missing cases for
certain countries, it was not possible to include certain school-level variables such as school
location or the proportion of certified teachers. Additionally, this study was not able to include
all 58 nations examined in PISA 2006 which would have allowed a comparison of parental
attitudes and science achievement between developed and developing economies. With a larger
number of countries, it would have also been possible to include more country-level variables
that measure, for instance, differences in culture and attitudes across countries.
26
References
Bandura, A. (1986). Social foundations of thought and action: A social cognition theory.
Englewood Cliffs, NJ: Prentice Hall.
Beaton, A. E., Martin, M. O., Mullis, I. V. S., Gonzalez, E. J., Smith, T. A. & Kelly, D. L.
(1996). Science achievement in the middle school years: IEA’s third international
mathematics and science study (TIMSS). Chestnut Hill, USA: Center for the Study of
Testing, Evaluation and Educational Policy, Boston College.
Boon, H. J. (2012). Regional Queensland parents’ views of science education: Some
unexpected perceptions. Australian Educational Researcher, 39(1), 17-43.
Bourdieu, P. (1998). Practical reason: On the theory of action. Cambridge, UK: Polity Press.
Breakwell, G. M., & Beardsell, S. (1992). Gender, parental and peer influences upon science
attitudes and activities. Public Understanding of Science, 1(2), 183-197.
Chen, H. (2001). Parents' attitudes and expectations regarding science education:
Comparisons among American, Chinese-American, and Chinese families.
ADOLESCENCE-SAN DIEGO-, 36, 305-314.
Chiu, M. M. (2007). Families, economies, cultures, and science achievement in 41 countries:
Country-, school-, and student-level analyses. Journal of Family Psychology, 21(3),
510.
DeWitt, J., Osborne, J., Archer, L., Dillon, J., Willis, B., & Wong, B. (2013). Young
children's aspirations in science: The unequivocal, the uncertain and the
unthinkable. International Journal of Science Education, 35(6), 1037-1063.
Fan, X., & Chen, M. (2001). Parental involvement and students' academic achievement: A
meta-analysis. Educational Psychology Review, 13(1), 1-22.
Garson, G. D. (2012). Hierarchical linear modeling: Guide and applications. London, United
Kingdom: SAGE Publications.
George, R., & Kaplan, D. (1998). A structural model of parent and teacher influences on science
attitudes of eighth graders: Evidence from NELS: 88. Science Education, 82(1), 93-109.
George, R. (2006). A cross‐domain analysis of change in students’ attitudes toward science
and attitudes about the utility of science. International Journal of Science
Education, 28(6), 571-589.
Green, C. L., Walker, J. M., Hoover-Dempsey, K. V., & Sandler, H. M. (2007). Parents'
motivations for involvement in children's education: An empirical test of a theoretical
model of parental involvement. Journal of Educational Psychology, 99(3), 532.
Gunderson, E. A., Ramirez, G., Levine, S. C., & Beilock, S. L. (2012). The role of parents
and teachers in the development of gender-related math attitudes. Sex Roles, 66(3-4),
153-166.
Hango, D. (2007). Parental investment in childhood and educational qualifications: Can greater
parental involvement mediate the effects of socioeconomic disadvantage? Social Science
Research, 36(4), 1371-1390.
27
Hanushek, E. A. (1994). Education production functions. In T. Husén & T. N. Postlethwaite
(Eds.), International Encyclopedia of Education (Volume 3, pp. 1756-1762). Oxford:
Pergamon.
Hanushek, E. A., & Woessmann, L. (2011). How much do educational outcomes matter in
OECD countries? Economic Policy, 26(67), 427–491.
Ho, E. S. C. (2010). Family influences on science learning among Hong Kong adolescents:
What we learned from PISA. International Journal of Science and Mathematics
Education, 8(3), 409-428.
Kaya, S., & Lundeen, C. (2010). Capturing parents’ individual and institutional interest toward
involvement in science education. Journal of Science Teacher Education, 21(7), 825-841.
LaRocque, M., Kleiman, I., & Darling, S. M. (2011). Parental involvement: The missing link
in school achievement. Preventing School Failure, 55(3), 115-122.
Lareau, A. (1987). Social class differences in family-school relationships: The importance of
cultural capital. Sociology of Education, 60, 73-85.
Marks, G. N., Cresswell, J., & Ainley, J. (2006). Explaining socioeconomic inequalities in
student achievement: The role of home and school factors. Educational Research and
Evaluation, 12(2), 105-128.
McNeal, R. B. (2001). Differential effects of parental involvement on cognitive and
behavioral outcomes by socioeconomic status. Journal of Socio-Economics, 30(2),
171-179.
Organisation for Economic Co-operation and Development [OECD]. (2000). Measuring student
knowledge and skills: The PISA 2000 assessment of reading, mathematical and scientific
literacy. Paris: Author.
OECD. (2004). Learning for tomorrow’s world – First results from PISA 2003. Paris:
Author.
OECD. (2006a). Assessing scientific, reading and mathematical literacy: A Framework for
PISA 2006. Paris: Author.
OECD. (2006b). PISA 2006 technical report. Paris: Author.
OECD. (2007). PISA 2006 Science competencies for tomorrow’s world (Volume 1). Paris:
Author.
OECD. (2009). PISA data analysis manual: SPSS, second edition. Paris: Author.
OECD. (2010). PISA 2009 Results: What students know and can do – student performance in
reading, mathematics and science (Volume 1). Paris: Author.
OECD. (2011). PISA in focus: What can parents do to help their children succeed in school?
Paris: Author.
OECD. (2012). Let’s read them a story! The parent factor in education. Paris: Author.
OECD. (2013). PISA 2012 Results in focus: What 15-year olds know and what they can do
with what they know. Paris: Author.
Osborne, J., Simon, S., & Collins, S. (2003). Attitudes towards science: a review of the literature
and its implications. International Journal of Science Education, 25(9), 1049-1079.
28
Ratelle, C. F., Larose, S., Guay, F., & Senécal, C. (2005). Perceptions of parental involvement
and support as predictors of college students' persistence in a science curriculum. Journal
of Family Psychology, 19(2), 286.
Raudenbush, S.W., & Bryk, A.S. (2002). Hierarchical linear models: Applications and data
analysis methods (Volume 1). London, United Kingdom: SAGE Publications.
Ream, R. K., & Palardy, G. J. (2008). Reexamining social class differences in the availability
and the educational utility of parental social capital. American Educational Research
Journal, 45(2), 238-273.
Rubin, D.B. (1987). Multiple imputation for nonresponse in surveys (Vol. 307). New York:
Wiley.
Schibeci, R. A., & Riley, J. P. (1986). Influence of students' background and perceptions on
science attitudes and achievement. Journal of Research in Science teaching, 23(3),
177-187.
Schütz, G., West, M., & Woessmann, L. (2007). School accountability, autonomy, choice,
and the equity of student achievement: International evidence from PISA
2003 (Education Working Paper No. 14). Paris: OECD.
Simpson, R. D., & Oliver, J. S. (1990). A summary of major influences on attitude toward
and achievement in science among adolescent students. Science Education, 74(1), 1-
18.
Singh, K., Granville, M., & Dika, S. (2002). Mathematics and science achievement: Effects
of motivation, interest, and academic engagement. The Journal of Educational
Research, 95(6), 323-332.
Smith, F. M., & Hausafus, C. O. (1998). Relationship of family support and ethnic minority
students' achievement in science and mathematics. Science Education, 82(1), 111- 125.
Sui-Chu, E. H., & Willms, J. D. (1996). Effects of parental involvement on eighth-grade
achievement. Sociology of Education, 69(2), 126-141.
Sun, L., Bradley, K. D., & Akers, K. (2012). A multilevel modelling approach to investigating
factors impacting science achievement for secondary school students: PISA Hong Kong
sample. International Journal of Science Education, 34(14), 2107- 2125.
Szechter, L. E., & Carey, E. J. (2009). Gravitating toward science: Parent–child interactions
at a gravitational‐wave observatory. Science Education, 93(5), 846-858.
Tare, M., French, J., Frazier, B. N., Diamond, J., & Evans, E. M. (2011). Explanatory parent–
child conversation predominates at an evolution exhibit. Science Education, 95(4),
720-744.
Tenenbaum, H. R., & Leaper, C. (2003). Parent-child conversations about science.
Development Psychology, 39(1), 34-47.
United Nations. (2013, July 1). Annual UN forum spotlights role of science, technology and
innovation for development. Retrieved October 24, 2013, from
http://www.un.org/apps/news/story.asp/html/www.unicef.org/story.asp?NewsID=453
09&Cr=development&Cr1=#.UsVOcdIW2pA
29
Walberg, H.J. (1981). A psychological theory of educational productivity. In F.H. Farley &
N. Gordon (Eds.), Psychology and Education (pp. 81-110). Berkeley, CA: McCutchan.
Waltenberg, F. D., & Vandenberghe, V. (2007). What does it take to achieve equality of
opportunity in education?: An empirical investigation based on Brazilian
data. Economics of Education Review, 26(6), 709-723.
Willms, J. D., & Smith, T. (2005). A manual for conducting analyses with data from TIMSS
and PISA. Report prepared for UNESCO Institute for Statistics.