Embed Size (px)
Citation preview
Sustainability Presentation Oddo Securities 10th Environmental Forum
Paris – June 11, 2015
http://www.continental-ir.com Rolf Woller – Head of IR
Ticker: CON ADR-Ticker: CTTAY
Sustainability Presentation – June 11, 2015 Oddo Securities 10th Environmental Forum EDMR – Equity and Debt Markets Relations
Back up
2
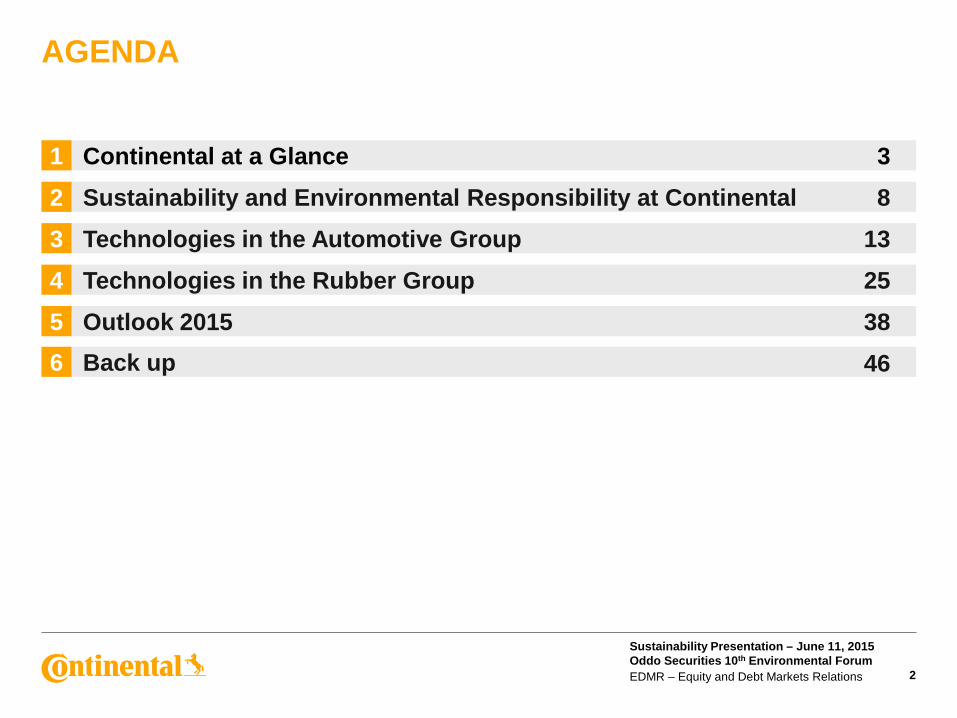
AGENDA
Continental at a Glance 1 3 Sustainability and Environmental Responsibility at Continental 2 8 Technologies in the Automotive Group 3 13 Technologies in the Rubber Group 4 25 Outlook 2015 5 38
46 6
Sustainability Presentation – June 11, 2015 Oddo Securities 10th Environmental Forum EDMR – Equity and Debt Markets Relations
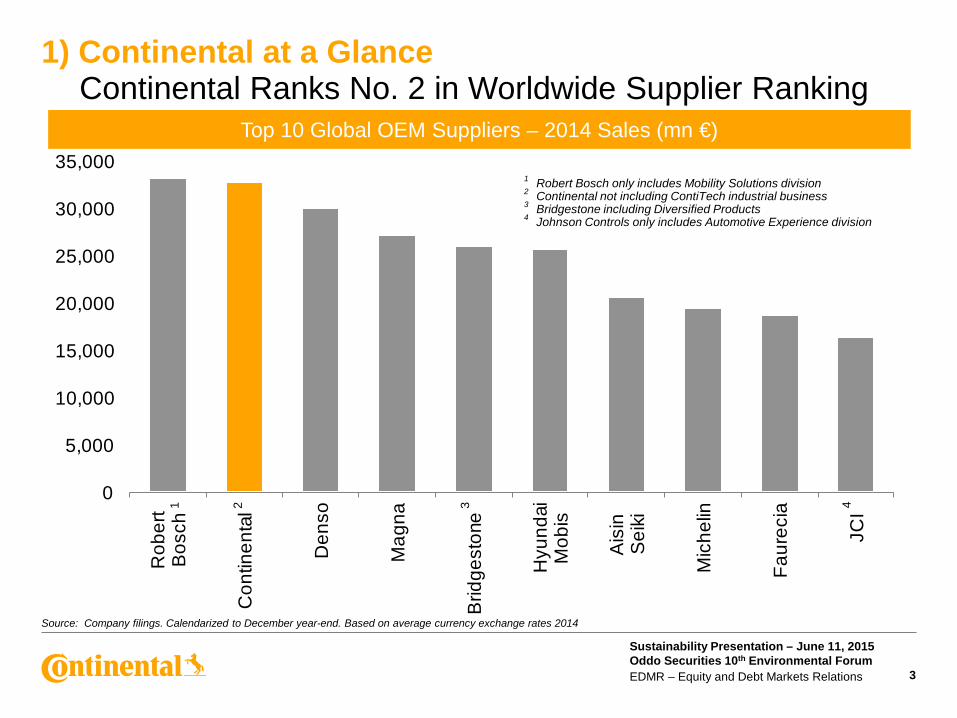
1) Continental at a Glance Continental Ranks No. 2 in Worldwide Supplier Ranking
3
0
5,000
10,000
15,000
20,000
25,000
30,000
35,000R
ober
tB
osch
Con
tinen
tal
Den
so
Mag
na
Brid
gest
one
Hyu
ndai
Mob
is
Ais
inS
eiki
Mic
helin
Faur
ecia
JCI
Top 10 Global OEM Suppliers – 2014 Sales (mn €)
Source: Company filings. Calendarized to December year-end. Based on average currency exchange rates 2014
1 Robert Bosch only includes Mobility Solutions division 2 Continental not including ContiTech industrial business 3 Bridgestone including Diversified Products 4 Johnson Controls only includes Automotive Experience division
1 2 3 4
Sustainability Presentation – June 11, 2015 Oddo Securities 10th Environmental Forum EDMR – Equity and Debt Markets Relations
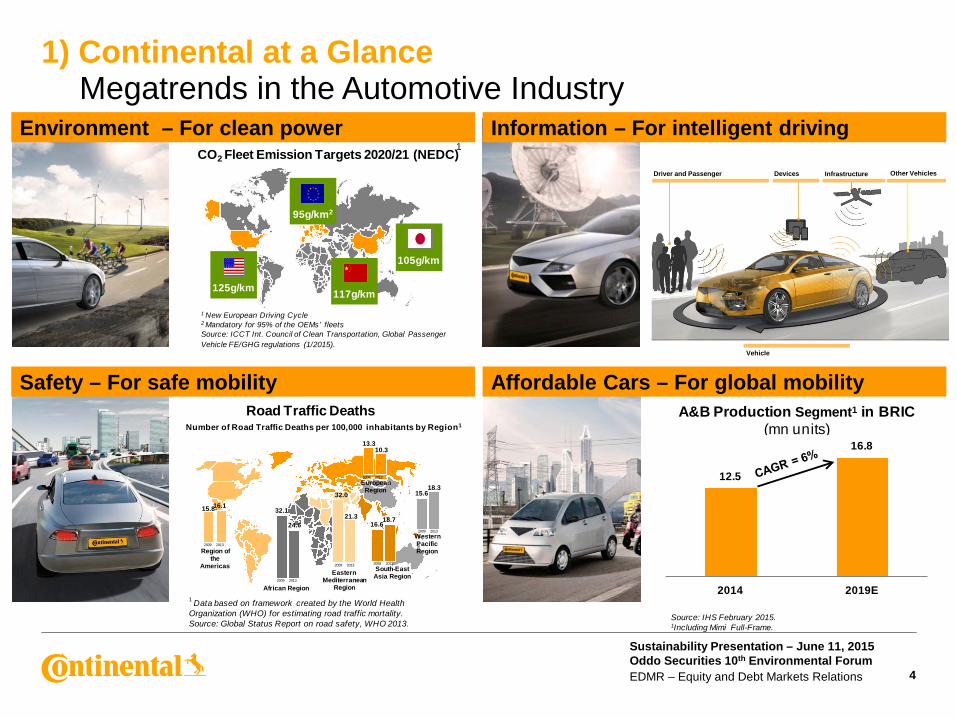
1) Continental at a Glance Megatrends in the Automotive Industry
4
Safety – For safe mobility
Environment – For clean power Information – For intelligent driving
Affordable Cars – For global mobility
Driver and Passenger Devices Infrastructure Other Vehicles
Vehicle
CO2 Fleet Emission Targets 2020/21 (NEDC)
1 New European Driving Cycle2 Mandatory for 95% of the OEMs’ fleetsSource: ICCT Int. Council of Clean Transportation, Global PassengerVehicle FE/GHG regulations (1/2015).
125g/km
95g/km2
117g/km
105g/km
1
A&B Production Segment1 in BRIC (mn units)
12.5
16.8
2014 2019E
Source: IHS February 2015.1Including Mimi Full-Frame.
Road Traffic Deaths
1 Data based on framework created by the World Health Organization (WHO) for estimating road traffic mortality.Source: Global Status Report on road safety, WHO 2013.
Number of Road Traffic Deaths per 100,000 inhabitants by Region1
Region ofthe
Americas
African Region
Eastern Mediterranean
Region
South-East Asia Region
Western Pacific Region
European Region
15.8-
2009 2013
16.132.1
24.6
2009 2013
2009 2013
32.0
21.3
2009 2013
16.618.7
15.618.3
2009 2013
2009 2013
13.310.3
Sustainability Presentation – June 11, 2015 Oddo Securities 10th Environmental Forum EDMR – Equity and Debt Markets Relations
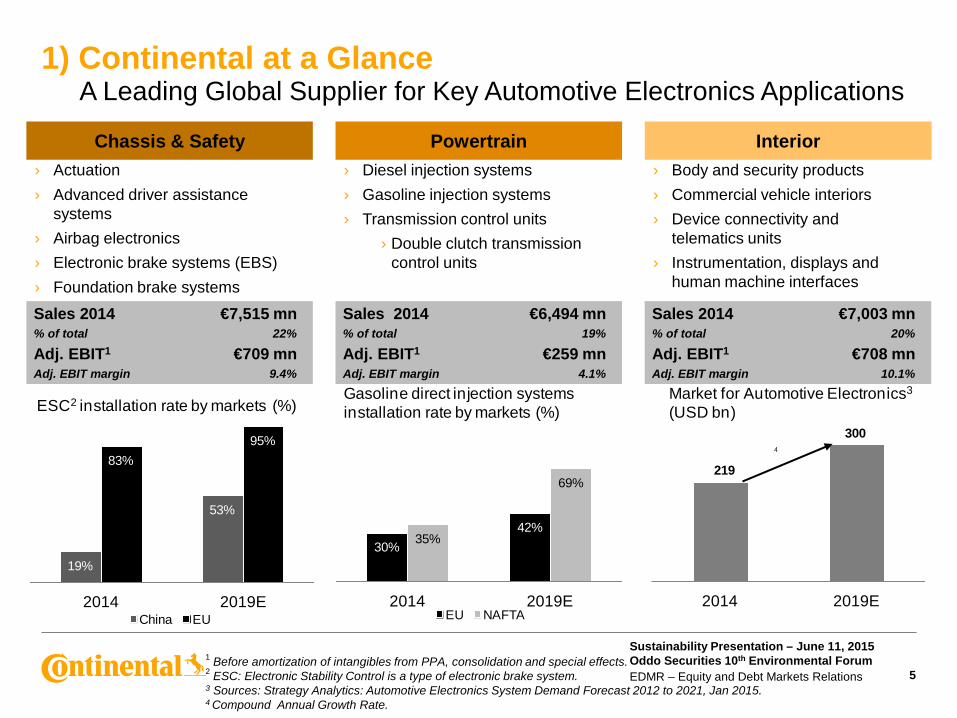
1) Continental at a Glance A Leading Global Supplier for Key Automotive Electronics Applications
5
› Actuation › Advanced driver assistance
systems › Airbag electronics › Electronic brake systems (EBS) › Foundation brake systems
› Diesel injection systems › Gasoline injection systems › Transmission control units
› Double clutch transmission control units
› Body and security products › Commercial vehicle interiors › Device connectivity and
telematics units › Instrumentation, displays and
human machine interfaces
Sales 2014 €7,515 mn % of total 22%
Adj. EBIT1 €709 mn Adj. EBIT margin 9.4%
Sales 2014 €6,494 mn % of total 19%
Adj. EBIT1 €259 mn Adj. EBIT margin 4.1%
Sales 2014 €7,003 mn % of total 20%
Adj. EBIT1 €708 mn Adj. EBIT margin 10.1%
Chassis & Safety Powertrain Interior
ESC2 installation rate by markets (%)
19%
53%
83%95%
2014 2019EChina EU
Gasoline direct injection systems installation rate by markets (%)
30%42%
35%
69%
2014 2019EEU NAFTA
Market for Automotive Electronics3
(USD bn)
219
300
2014 2019E
1 Before amortization of intangibles from PPA, consolidation and special effects. 2 ESC: Electronic Stability Control is a type of electronic brake system. 3 Sources: Strategy Analytics: Automotive Electronics System Demand Forecast 2012 to 2021, Jan 2015. 4 Compound Annual Growth Rate.
4
Sustainability Presentation – June 11, 2015 Oddo Securities 10th Environmental Forum EDMR – Equity and Debt Markets Relations
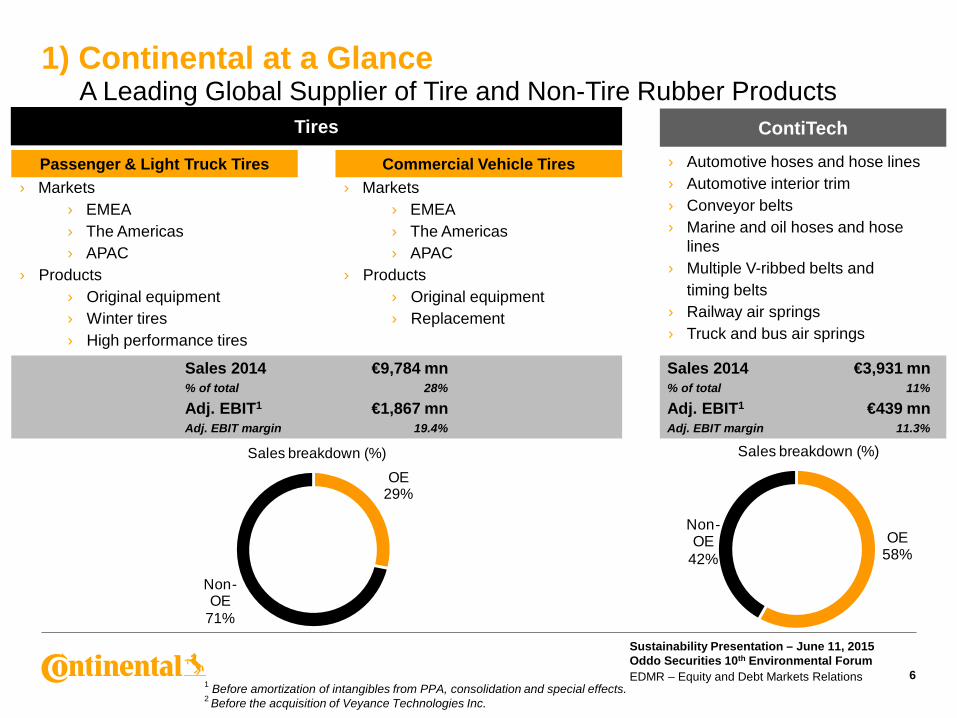
1) Continental at a Glance A Leading Global Supplier of Tire and Non-Tire Rubber Products
6
Sales 2014 €3,931 mn % of total 11%
Adj. EBIT1 €439 mn Adj. EBIT margin 11.3%
› Markets › EMEA › The Americas › APAC
› Products › Original equipment › Winter tires › High performance tires
› Markets › EMEA › The Americas › APAC
› Products › Original equipment › Replacement
› Automotive hoses and hose lines › Automotive interior trim › Conveyor belts › Marine and oil hoses and hose
lines › Multiple V-ribbed belts and timing belts › Railway air springs › Truck and bus air springs
Sales 2014 €9,784 mn % of total 28%
Adj. EBIT1 €1,867 mn Adj. EBIT margin 19.4%
Passenger & Light Truck Tires Commercial Vehicle Tires
ContiTech Tires
Sales breakdown (%)OE
29%
Non-OE
71%
Sales breakdown (%)
OE58%
Non-OE
42%
1 Before amortization of intangibles from PPA, consolidation and special effects. 2 Before the acquisition of Veyance Technologies Inc.
Sustainability Presentation – June 11, 2015 Oddo Securities 10th Environmental Forum EDMR – Equity and Debt Markets Relations
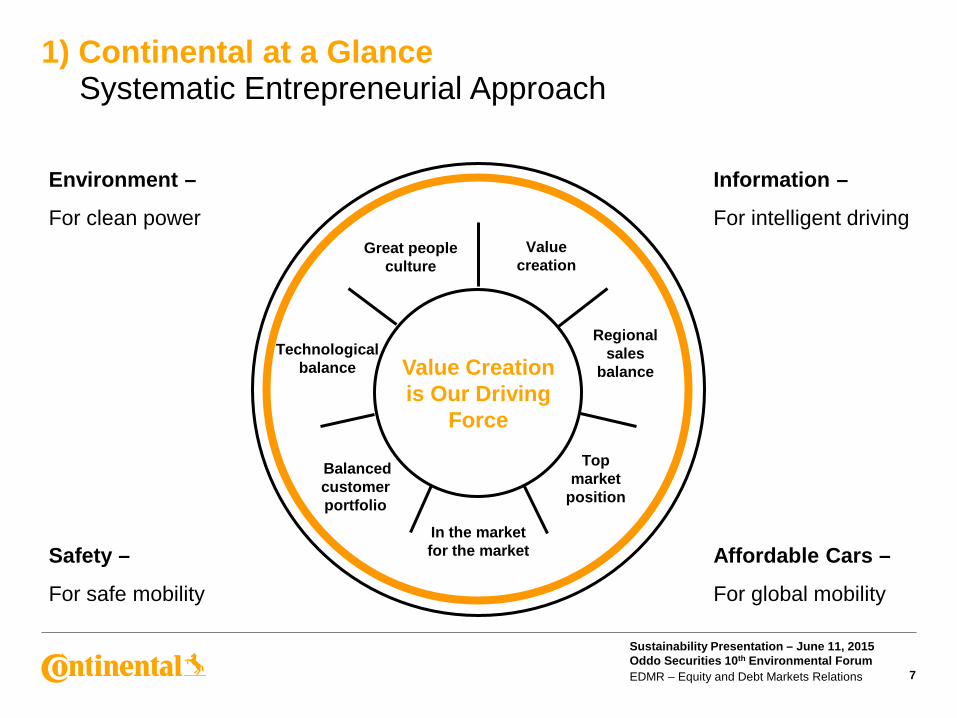
1) Continental at a Glance Systematic Entrepreneurial Approach
7
Value Creation is Our Driving
Force
Great people culture
Value creation
Regional sales
balance Technological
balance
In the market for the market
Balanced customer portfolio
Top market
position
Affordable Cars –
For global mobility
Safety –
For safe mobility
Information –
For intelligent driving
Environment –
For clean power
Sustainability Presentation – June 11, 2015 Oddo Securities 10th Environmental Forum EDMR – Equity and Debt Markets Relations
2) Sustainability at Continental Our Definition
8
Sustainability at Continental
Sustainable management and social responsibility are inscribed within the bedrock of Continental’s corporate values. Both reinforce the culture of solidarity while simultaneously contributing to forward-looking and value based corporate management. We respect the freedom of future generations and live up to our responsibility. With our products and services, we help expand – and do not restrict – their opportunities for development. We consider sustainable management to be a strategic corporate development task.
Source: Annual Report Continental AG 2013, GRI 2013
Sustainability Presentation – June 11, 2015 Oddo Securities 10th Environmental Forum EDMR – Equity and Debt Markets Relations
2) Sustainability at Continental Our Policies and Guidelines
9
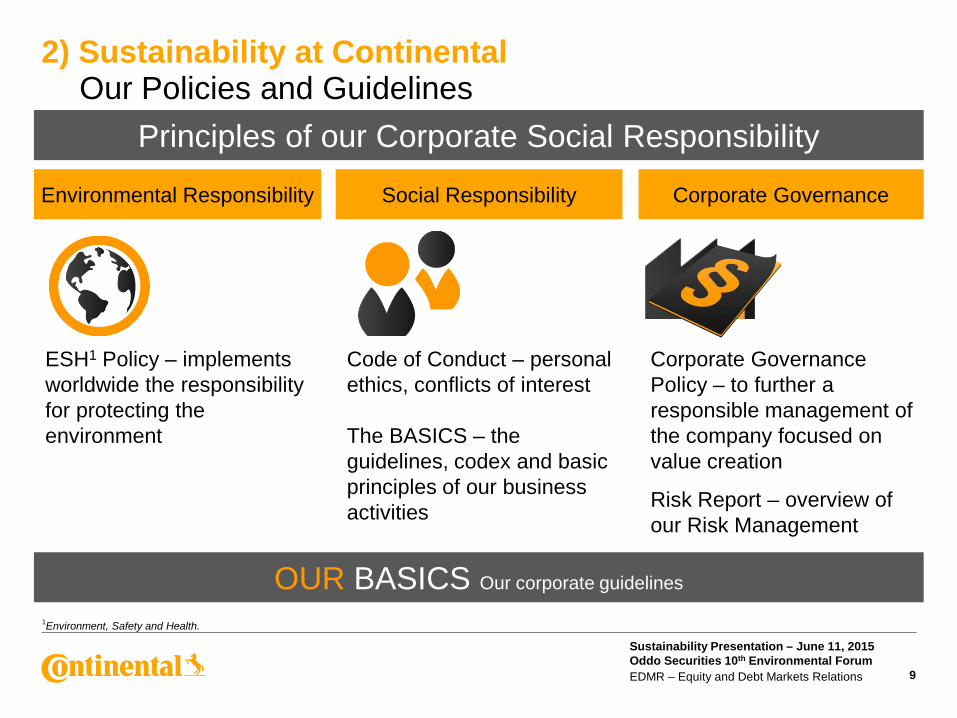
ESH1 Policy – implements worldwide the responsibility for protecting the environment
Code of Conduct – personal ethics, conflicts of interest The BASICS – the guidelines, codex and basic principles of our business activities
OUR BASICS Our corporate guidelines
Corporate Governance Policy – to further a responsible management of the company focused on value creation
Risk Report – overview of our Risk Management
Principles of our Corporate Social Responsibility
Environmental Responsibility Social Responsibility Corporate Governance
1Environment, Safety and Health.
Sustainability Presentation – June 11, 2015 Oddo Securities 10th Environmental Forum EDMR – Equity and Debt Markets Relations
2) Environmental Responsibility Status of Environmental Certification at Continental
10
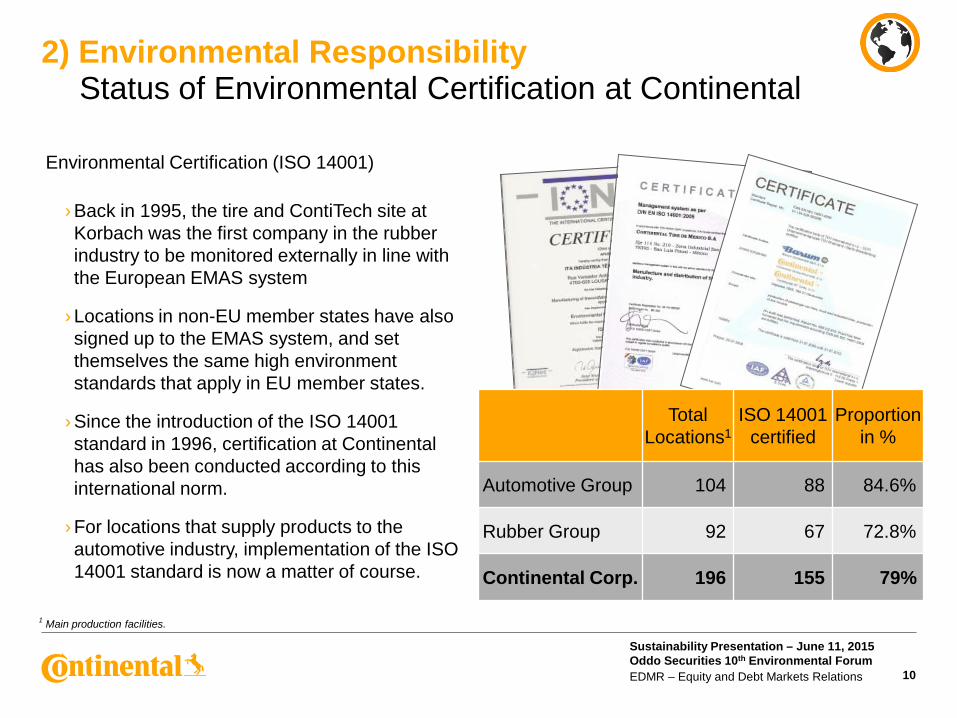
Environmental Certification (ISO 14001)
› Back in 1995, the tire and ContiTech site at Korbach was the first company in the rubber industry to be monitored externally in line with the European EMAS system
› Locations in non-EU member states have also signed up to the EMAS system, and set themselves the same high environment standards that apply in EU member states.
› Since the introduction of the ISO 14001 standard in 1996, certification at Continental has also been conducted according to this international norm.
› For locations that supply products to the automotive industry, implementation of the ISO 14001 standard is now a matter of course.
Total Locations1
ISO 14001 certified
Proportion in %
Automotive Group 104 88 84.6%
Rubber Group 92 67 72.8%
Continental Corp. 196 155 79%
1 Main production facilities.
Sustainability Presentation – June 11, 2015 Oddo Securities 10th Environmental Forum EDMR – Equity and Debt Markets Relations
2) Environmental Responsibility Status of Environmental Certification at Continental
11
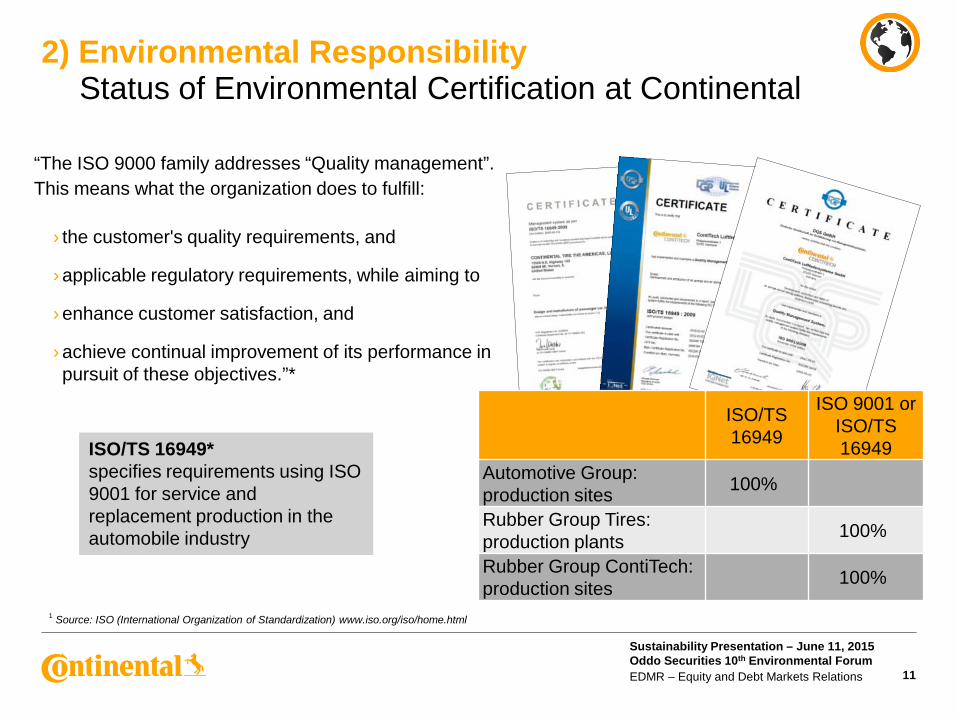
“The ISO 9000 family addresses “Quality management”. This means what the organization does to fulfill:
› the customer's quality requirements, and
› applicable regulatory requirements, while aiming to
› enhance customer satisfaction, and
› achieve continual improvement of its performance in pursuit of these objectives.”*
ISO/TS 16949* specifies requirements using ISO 9001 for service and replacement production in the automobile industry
ISO/TS 16949
ISO 9001 or ISO/TS 16949
Automotive Group: production sites 100%
Rubber Group Tires: production plants 100%
Rubber Group ContiTech: production sites 100%
1 Source: ISO (International Organization of Standardization) www.iso.org/iso/home.html
Sustainability Presentation – June 11, 2015 Oddo Securities 10th Environmental Forum EDMR – Equity and Debt Markets Relations
1 Changes to previous figures are due to changed in the data collection. 2 Continental targets. 3 Independently verified by KPMG.
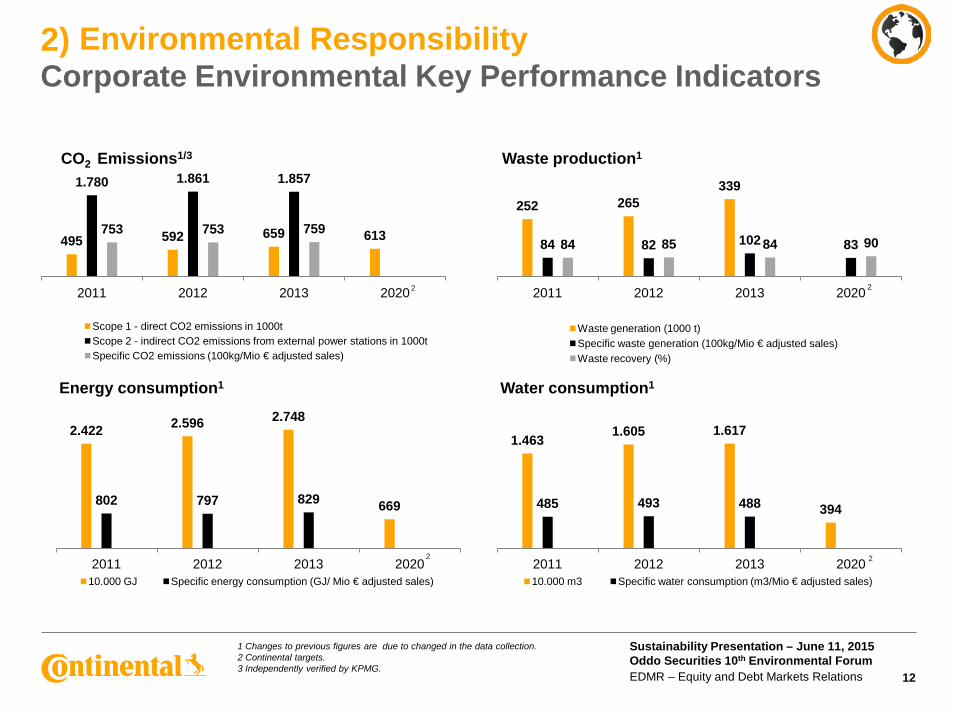
252 265 339
84 82 102 83 84 85 84 90
2011 2012 2013 2020
Waste production1
Waste generation (1000 t) Specific waste generation (100kg/Mio € adjusted sales) Waste recovery (%)
495 592 659 613
1.780 1.861 1.857
753 753 759
2011 2012 2013 2020
CO2 Emissions1/3
Scope 1 - direct CO2 emissions in 1000t Scope 2 - indirect CO2 emissions from external power stations in 1000t Specific CO2 emissions (100kg/Mio € adjusted sales)
2.422 2.596 2.748
669 802 797 829
2011 2012 2013 2020
Energy consumption1
10.000 GJ Specific energy consumption (GJ/ Mio € adjusted sales)
1.463 1.605 1.617
394 485 493 488
2011 2012 2013 2020
Water consumption1
10.000 m3 Specific water consumption (m3/Mio € adjusted sales)
12
2 2
2 2
2) Environmental Responsibility Corporate Environmental Key Performance Indicators
Sustainability Presentation – June 11, 2015 Oddo Securities 10th Environmental Forum EDMR – Equity and Debt Markets Relations
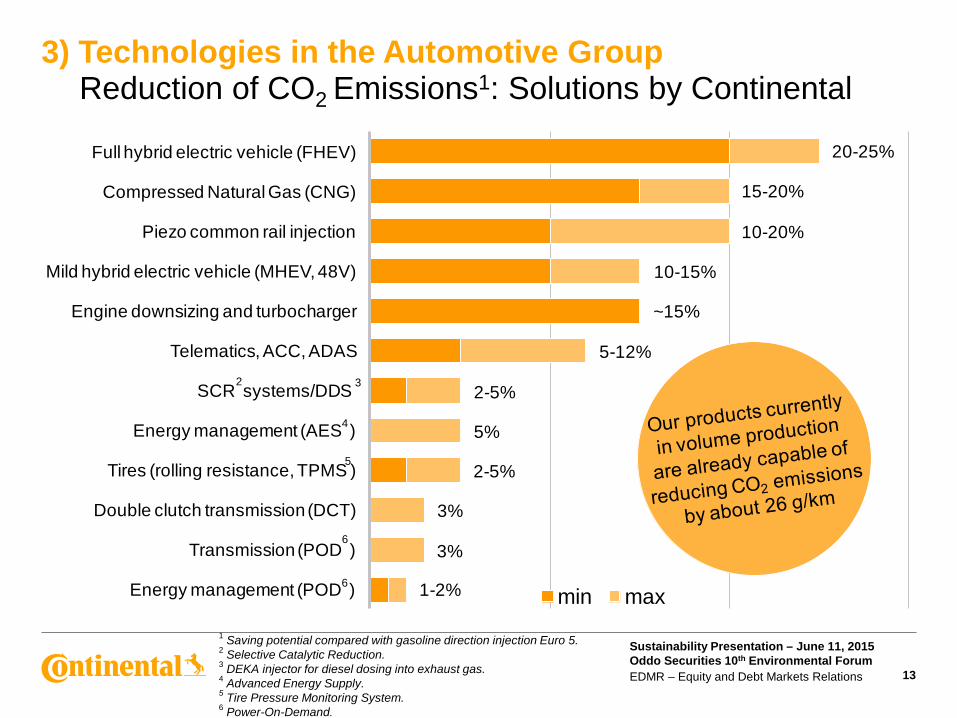
3) Technologies in the Automotive Group Reduction of CO2 Emissions1: Solutions by Continental
13
2 3
4
6
6
5
Full hybrid electric vehicle (FHEV)
Compressed Natural Gas (CNG)
Piezo common rail injection
Mild hybrid electric vehicle (MHEV, 48V)
Engine downsizing and turbocharger
Telematics, ACC, ADAS
SCR systems/DDS
Energy management (AES )
Tires (rolling resistance, TPMS )
Double clutch transmission (DCT)
Transmission (POD )
Energy management (POD ) min max
20-25%
15-20%
10-20%
5-12%
2-5%
2-5%
3%
3%
1-2%
5%
~15%
10-15%
1 Saving potential compared with gasoline direction injection Euro 5. 2 Selective Catalytic Reduction. 3 DEKA injector for diesel dosing into exhaust gas. 4 Advanced Energy Supply. 5 Tire Pressure Monitoring System. 6 Power-On-Demand.
Sustainability Presentation – June 11, 2015 Oddo Securities 10th Environmental Forum EDMR – Equity and Debt Markets Relations
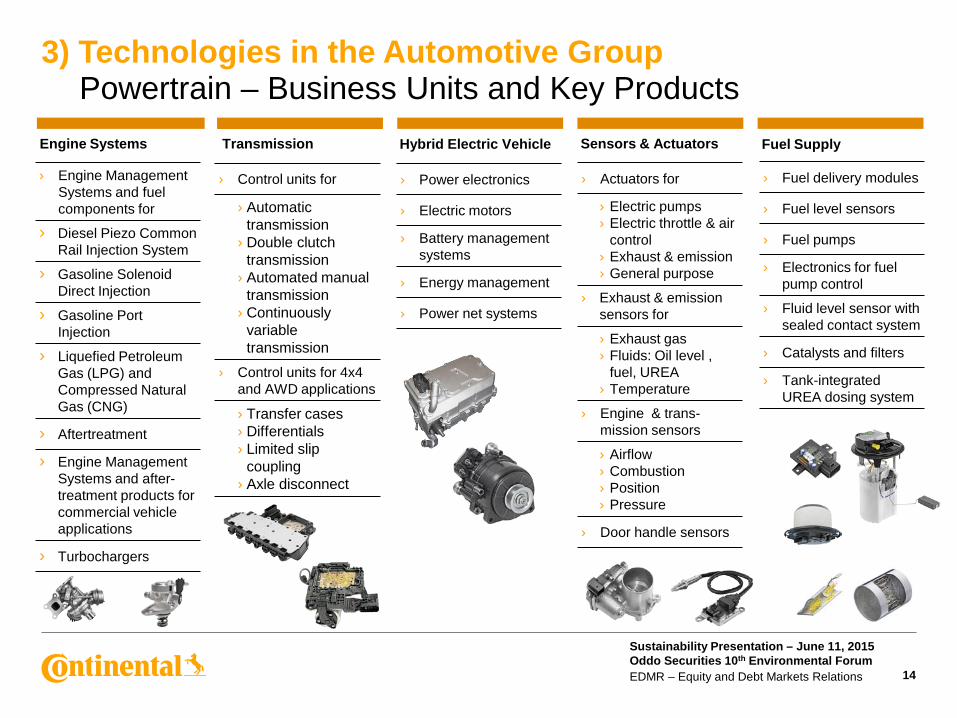
3) Technologies in the Automotive Group Powertrain – Business Units and Key Products
14
› Control units for
› Automatic transmission
› Double clutch transmission
› Automated manual transmission
› Continuously variable transmission
› Control units for 4x4 and AWD applications
› Transfer cases › Differentials › Limited slip
coupling › Axle disconnect
Transmission Engine Systems Fuel Supply Sensors & Actuators Hybrid Electric Vehicle
› Engine Management Systems and fuel components for
› Diesel Piezo Common Rail Injection System
› Gasoline Solenoid Direct Injection
› Gasoline Port Injection
› Liquefied Petroleum Gas (LPG) and Compressed Natural Gas (CNG)
› Aftertreatment
› Engine Management Systems and after-treatment products for commercial vehicle applications
› Turbochargers
› Power electronics
› Electric motors
› Battery management systems
› Energy management
› Power net systems
› Actuators for
› Electric pumps › Electric throttle & air
control › Exhaust & emission › General purpose
› Exhaust & emission sensors for
› Exhaust gas › Fluids: Oil level ,
fuel, UREA › Temperature
› Engine & trans-mission sensors
› Airflow › Combustion › Position › Pressure
› Door handle sensors
› Fuel delivery modules
› Fuel level sensors
› Fuel pumps
› Electronics for fuel pump control
› Fluid level sensor with sealed contact system
› Catalysts and filters
› Tank-integrated UREA dosing system
Sustainability Presentation – June 11, 2015 Oddo Securities 10th Environmental Forum EDMR – Equity and Debt Markets Relations
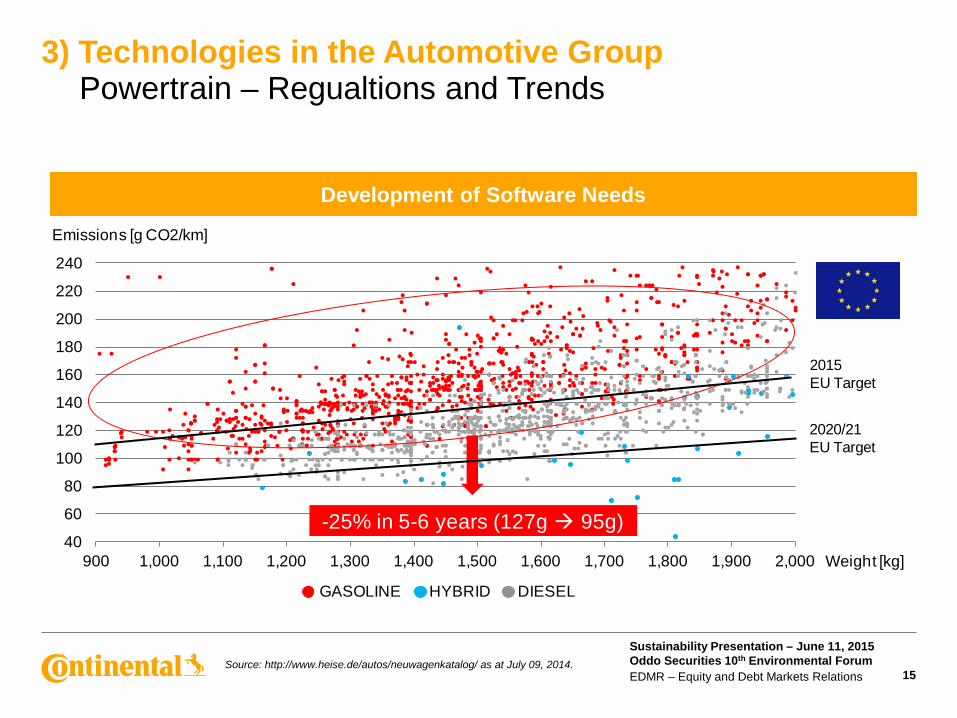
3) Technologies in the Automotive Group Powertrain – Regualtions and Trends
15 Source: http://www.heise.de/autos/neuwagenkatalog/ as at July 09, 2014.
Development of Software Needs
40
60
80
100
120
140
160
180
200
220
240
900 1,000 1,100 1,200 1,300 1,400 1,500 1,600 1,700 1,800 1,900 2,000
GASOLINE HYBRID DIESEL
Emissions [g CO2/km]
Weight [kg]
2015 EU Target
2020/21 EU Target
-25% in 5-6 years (127g 95g)
Sustainability Presentation – June 11, 2015 Oddo Securities 10th Environmental Forum EDMR – Equity and Debt Markets Relations
3) Technologies in the Automotive Group Powertrain – Regualtions and Trends
16
60
90
120
150
180
210
240
270
300
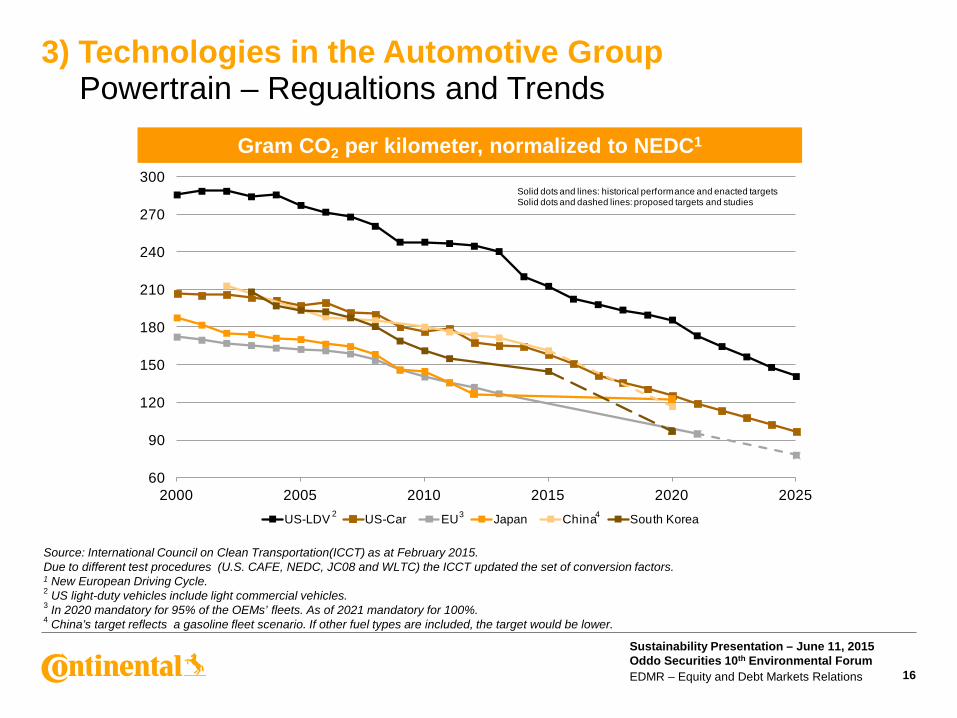
2000 2005 2010 2015 2020 2025US-LDV US-Car EU Japan China South Korea
Solid dots and lines: historical performance and enacted targets Solid dots and dashed lines: proposed targets and studies
2 3 4
Gram CO2 per kilometer, normalized to NEDC1
Source: International Council on Clean Transportation(ICCT) as at February 2015. Due to different test procedures (U.S. CAFE, NEDC, JC08 and WLTC) the ICCT updated the set of conversion factors. 1 New European Driving Cycle. 2 US light-duty vehicles include light commercial vehicles. 3 In 2020 mandatory for 95% of the OEMs’ fleets. As of 2021 mandatory for 100%. 4 China’s target reflects a gasoline fleet scenario. If other fuel types are included, the target would be lower.
Sustainability Presentation – June 11, 2015 Oddo Securities 10th Environmental Forum EDMR – Equity and Debt Markets Relations
3) Technologies in the Automotive Group Powertrain – Regualtions and Trends
17
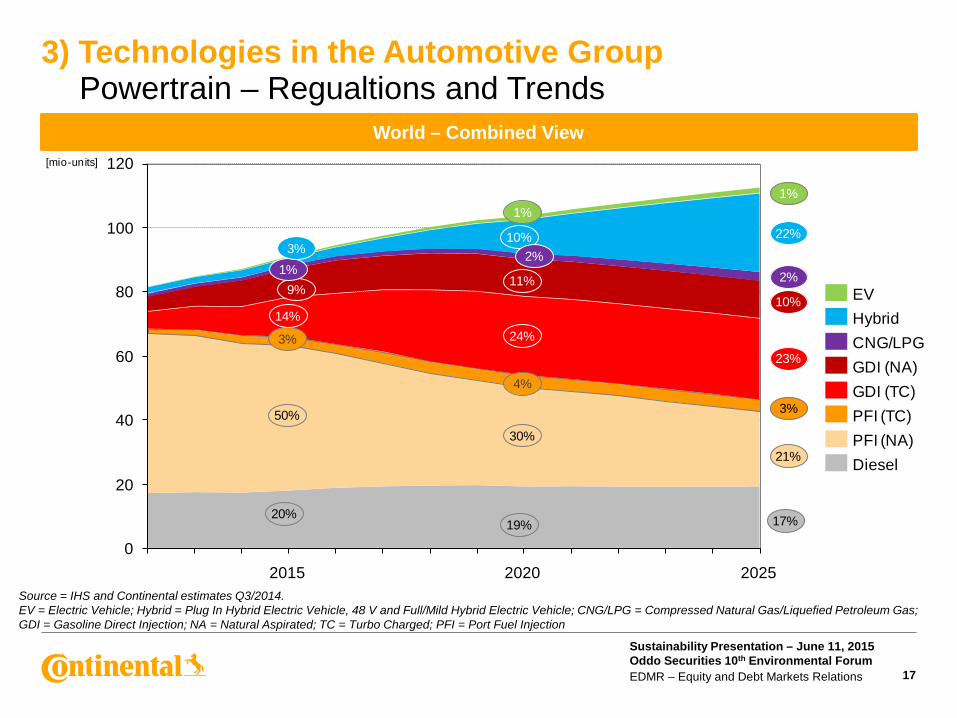
World – Combined View
Source = IHS and Continental estimates Q3/2014. EV = Electric Vehicle; Hybrid = Plug In Hybrid Electric Vehicle, 48 V and Full/Mild Hybrid Electric Vehicle; CNG/LPG = Compressed Natural Gas/Liquefied Petroleum Gas; GDI = Gasoline Direct Injection; NA = Natural Aspirated; TC = Turbo Charged; PFI = Port Fuel Injection
120
100
80
60
40
20
0202520202015
PFI (NA)
GDI (TC)PFI (TC)
GDI (NA)CNG/LPGHybridEV
Diesel
[mio-units]
21%
1%
22%
2%
17%
10%
23%
3%
1%
10%2%
19%
11%
24%
4%
30%50%
3%
14%
9%
20%
1%3%
Sustainability Presentation – June 11, 2015 Oddo Securities 10th Environmental Forum EDMR – Equity and Debt Markets Relations
3) Technologies in the Automotive Group Powertrain – Technologies to face Future Demands for Emission Reduction
18
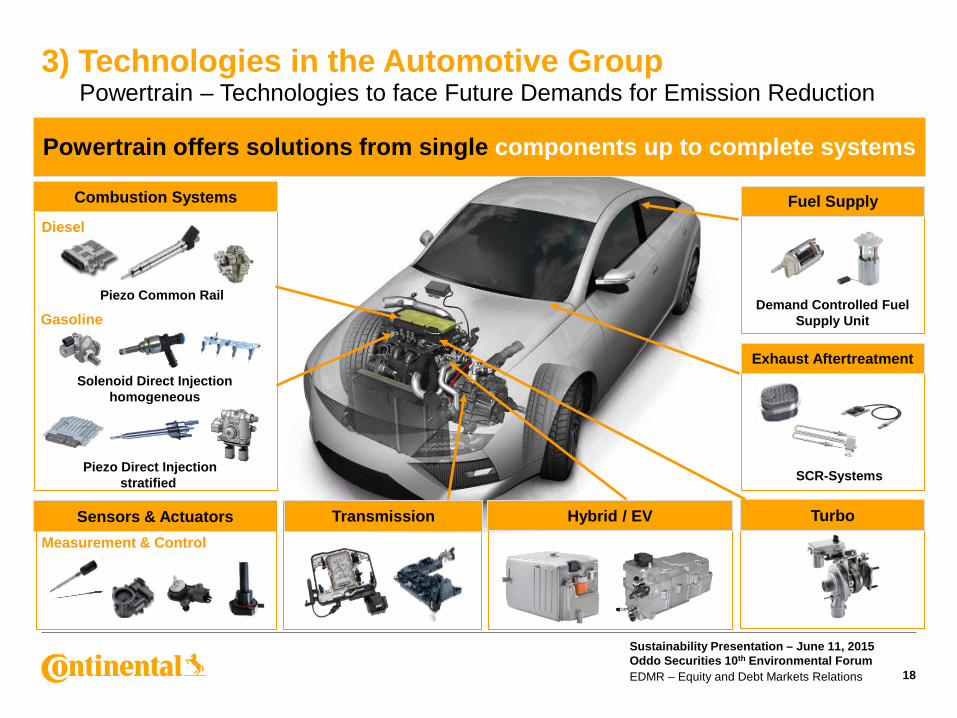
Powertrain offers solutions from single components up to complete systems
Turbo Hybrid / EV
Piezo Direct Injection stratified
Piezo Common Rail
Solenoid Direct Injection homogeneous
Diesel
Gasoline
Combustion Systems
Measurement & Control
Demand Controlled Fuel Supply Unit
SCR-Systems
Exhaust Aftertreatment
Transmission Sensors & Actuators
Fuel Supply
Sustainability Presentation – June 11, 2015 Oddo Securities 10th Environmental Forum EDMR – Equity and Debt Markets Relations
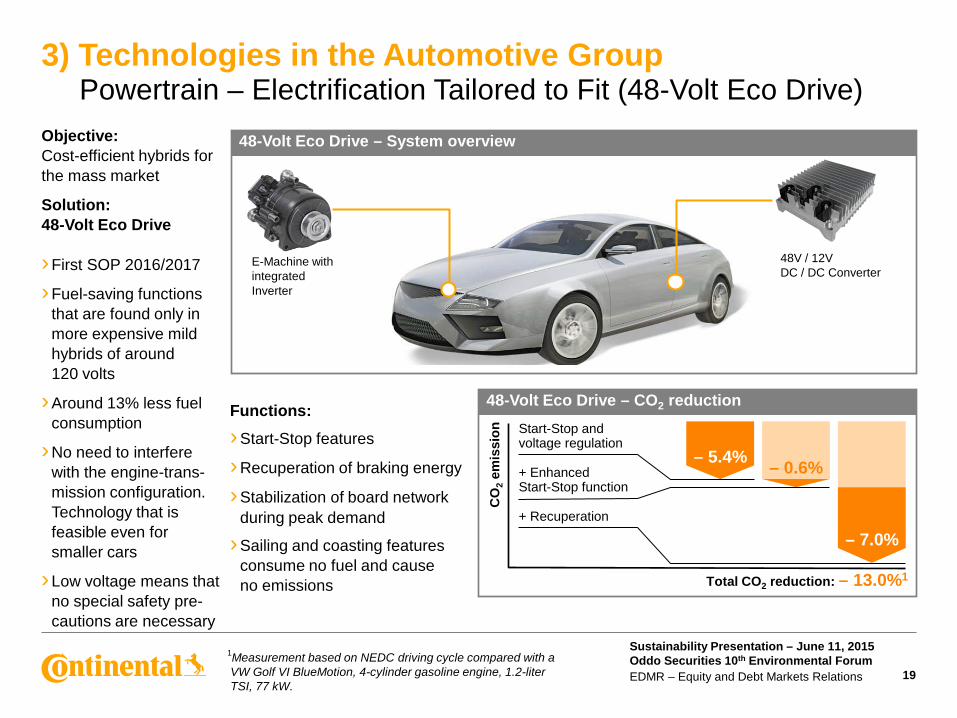
3) Technologies in the Automotive Group Powertrain – Electrification Tailored to Fit (48-Volt Eco Drive)
19
48-Volt Eco Drive – System overview
Functions: › Start-Stop features › Recuperation of braking energy › Stabilization of board network during peak demand › Sailing and coasting features consume no fuel and cause no emissions
Start-Stop and voltage regulation + Enhanced Start-Stop function + Recuperation
48-Volt Eco Drive – CO2 reduction
48V / 12V DC / DC Converter
Total CO2 reduction: – 13.0%1
CO
2 em
issi
on
– 7.0%
– 0.6% – 5.4%
E-Machine with integrated Inverter
Objective: Cost-efficient hybrids for the mass market Solution: 48-Volt Eco Drive › First SOP 2016/2017 › Fuel-saving functions that are found only in more expensive mild hybrids of around 120 volts › Around 13% less fuel consumption › No need to interfere with the engine-trans- mission configuration. Technology that is feasible even for smaller cars › Low voltage means that no special safety pre- cautions are necessary
1Measurement based on NEDC driving cycle compared with a VW Golf VI BlueMotion, 4-cylinder gasoline engine, 1.2-liter TSI, 77 kW.
Sustainability Presentation – June 11, 2015 Oddo Securities 10th Environmental Forum EDMR – Equity and Debt Markets Relations
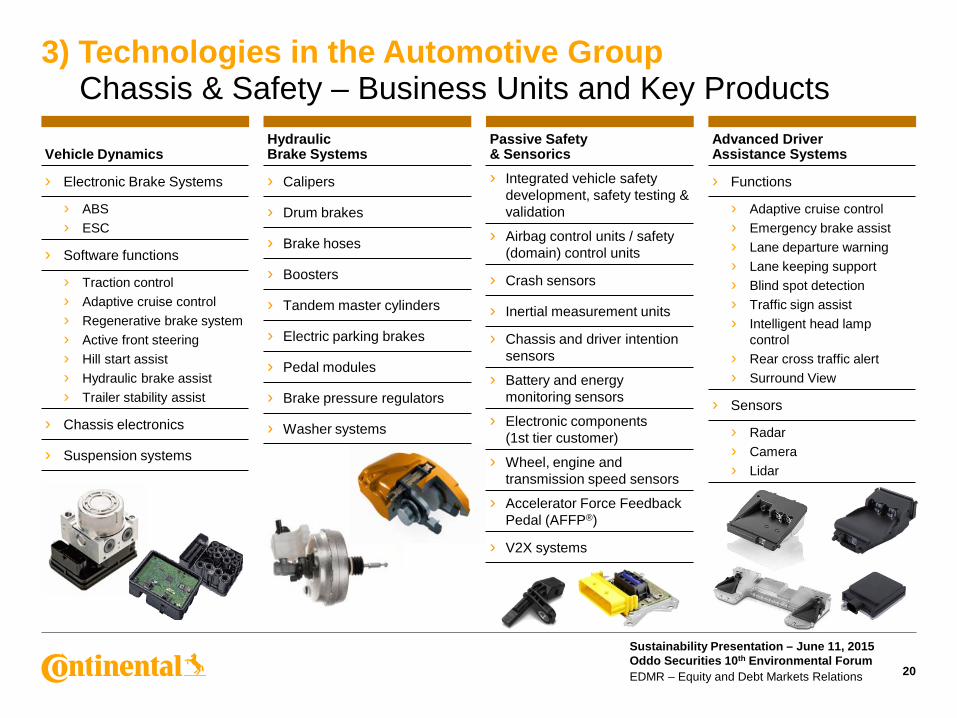
3) Technologies in the Automotive Group Chassis & Safety – Business Units and Key Products
20
Vehicle Dynamics Hydraulic Brake Systems
Passive Safety & Sensorics
Advanced Driver Assistance Systems
› Integrated vehicle safety development, safety testing & validation
› Airbag control units / safety (domain) control units
› Crash sensors
› Inertial measurement units
› Chassis and driver intention sensors
› Battery and energy monitoring sensors
› Electronic components (1st tier customer)
› Wheel, engine and transmission speed sensors
› Accelerator Force Feedback Pedal (AFFP®)
› V2X systems
› Functions
› Adaptive cruise control › Emergency brake assist › Lane departure warning › Lane keeping support › Blind spot detection › Traffic sign assist › Intelligent head lamp
control › Rear cross traffic alert › Surround View
› Sensors
› Radar › Camera › Lidar
› Electronic Brake Systems
› ABS › ESC
› Software functions
› Traction control › Adaptive cruise control › Regenerative brake system › Active front steering › Hill start assist › Hydraulic brake assist › Trailer stability assist
› Chassis electronics
› Suspension systems
› Calipers
› Drum brakes
› Brake hoses
› Boosters
› Tandem master cylinders
› Electric parking brakes
› Pedal modules
› Brake pressure regulators
› Washer systems
Sustainability Presentation – June 11, 2015 Oddo Securities 10th Environmental Forum EDMR – Equity and Debt Markets Relations
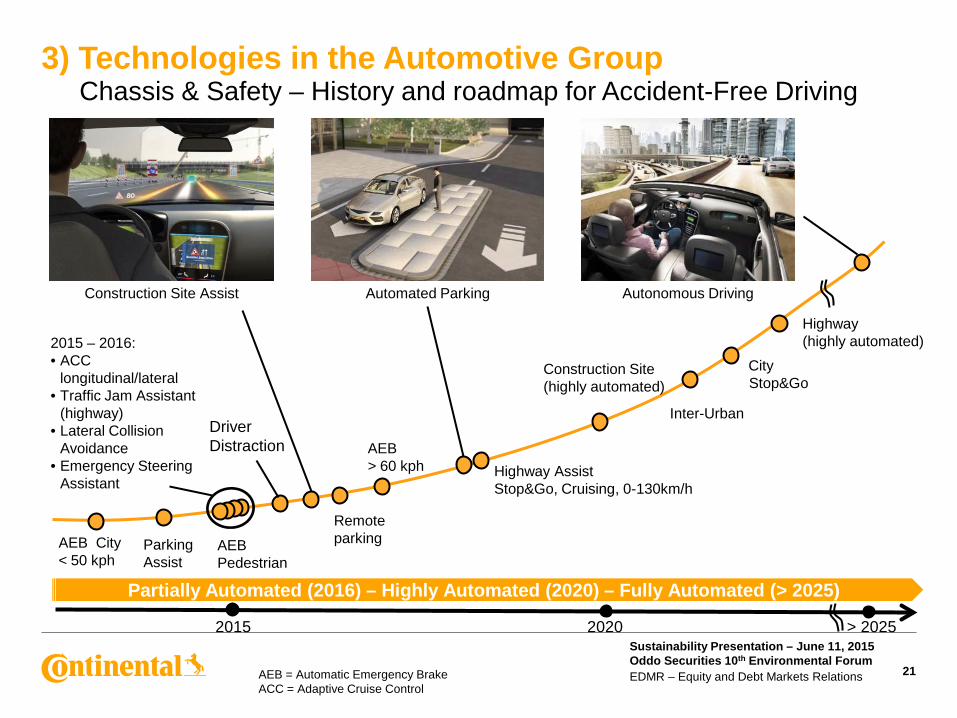
3) Technologies in the Automotive Group Chassis & Safety – History and roadmap for Accident-Free Driving
21
AEB City < 50 kph
Parking Assist
Automated Parking
AEB > 60 kph
Driver Distraction
Highway Assist Stop&Go, Cruising, 0-130km/h
Construction Site (highly automated)
City Stop&Go
Highway (highly automated)
Remote parking
Construction Site Assist
2015 – 2016: • ACC
longitudinal/lateral • Traffic Jam Assistant
(highway) • Lateral Collision
Avoidance • Emergency Steering
Assistant
AEB Pedestrian
Inter-Urban
Autonomous Driving
Partially Automated (2016) – Highly Automated (2020) – Fully Automated (> 2025)
2015 2020 > 2025
AEB = Automatic Emergency Brake ACC = Adaptive Cruise Control
Sustainability Presentation – June 11, 2015 Oddo Securities 10th Environmental Forum EDMR – Equity and Debt Markets Relations
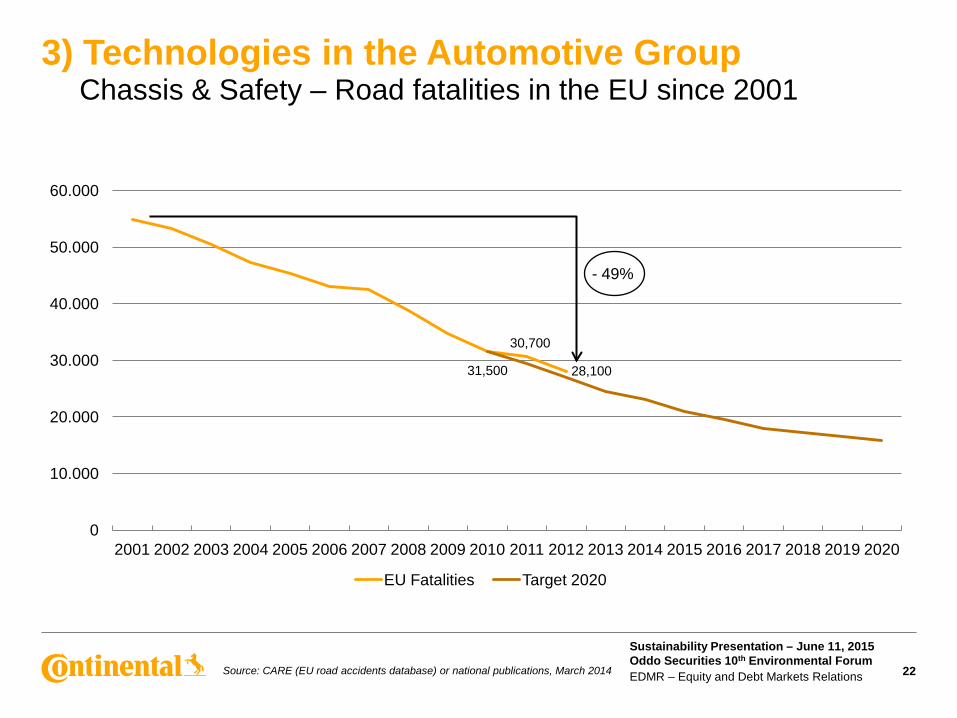
3) Technologies in the Automotive Group Chassis & Safety – Road fatalities in the EU since 2001
22
0
10.000
20.000
30.000
40.000
50.000
60.000
2001 2002 2003 2004 2005 2006 2007 2008 2009 2010 2011 2012 2013 2014 2015 2016 2017 2018 2019 2020
EU Fatalities Target 2020
- 49%
Source: CARE (EU road accidents database) or national publications, March 2014
28,100
30,700
31,500
Sustainability Presentation – June 11, 2015 Oddo Securities 10th Environmental Forum EDMR – Equity and Debt Markets Relations
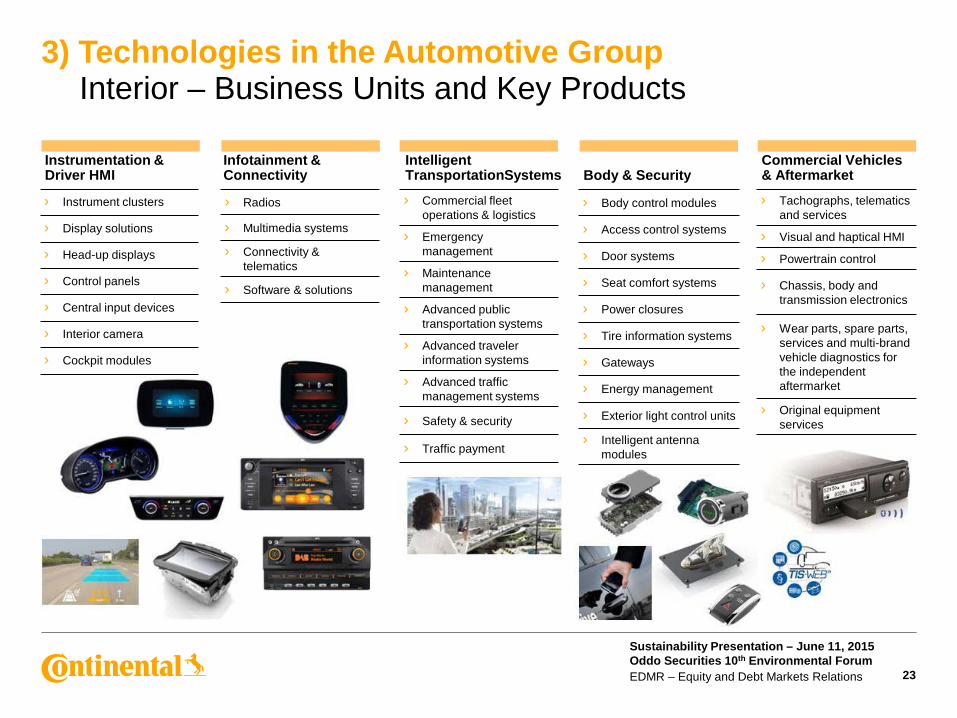
3) Technologies in the Automotive Group Interior – Business Units and Key Products
23
› Body control modules
› Access control systems
› Door systems
› Seat comfort systems
› Power closures
› Tire information systems
› Gateways
› Energy management
› Exterior light control units
› Intelligent antenna modules
Body & Security
› Tachographs, telematics and services
› Visual and haptical HMI
› Powertrain control
› Chassis, body and transmission electronics
› Wear parts, spare parts, services and multi-brand vehicle diagnostics for the independent aftermarket
› Original equipment services
› Instrument clusters
› Display solutions
› Head-up displays
› Control panels
› Central input devices
› Interior camera
› Cockpit modules
› Radios
› Multimedia systems
› Connectivity & telematics
› Software & solutions
Commercial Vehicles & Aftermarket
Infotainment & Connectivity
Instrumentation & Driver HMI
Intelligent TransportationSystems
› Commercial fleet operations & logistics
› Emergency management
› Maintenance management
› Advanced public transportation systems
› Advanced traveler information systems
› Advanced traffic management systems
› Safety & security
› Traffic payment
Sustainability Presentation – June 11, 2015 Oddo Securities 10th Environmental Forum EDMR – Equity and Debt Markets Relations
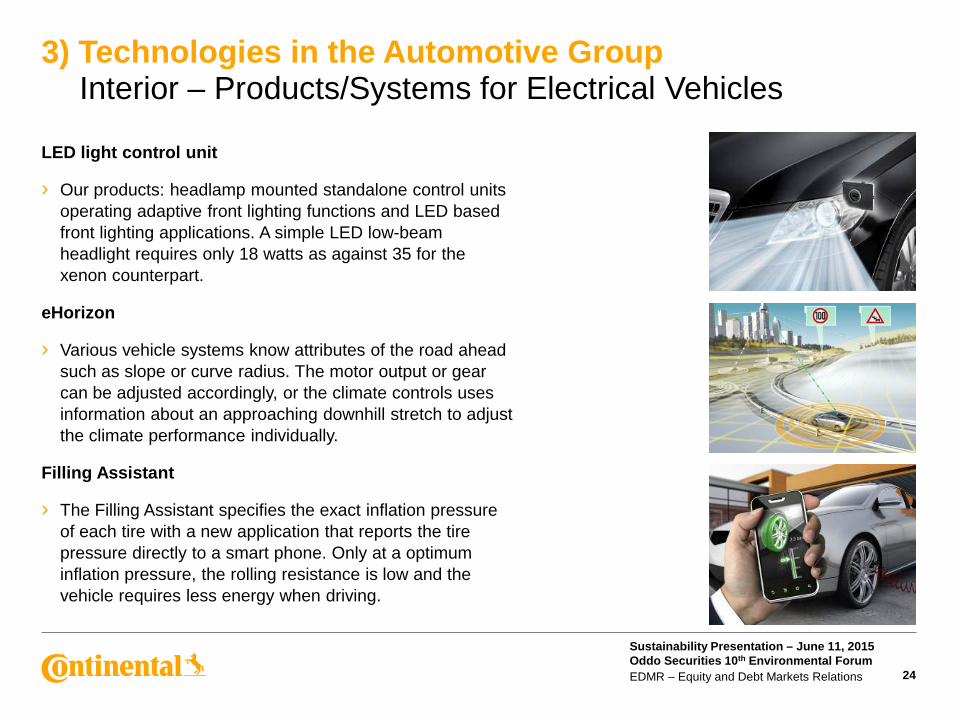
3) Technologies in the Automotive Group Interior – Products/Systems for Electrical Vehicles
24
LED light control unit
› Our products: headlamp mounted standalone control units operating adaptive front lighting functions and LED based front lighting applications. A simple LED low-beam headlight requires only 18 watts as against 35 for the xenon counterpart.
eHorizon
› Various vehicle systems know attributes of the road ahead such as slope or curve radius. The motor output or gear can be adjusted accordingly, or the climate controls uses information about an approaching downhill stretch to adjust the climate performance individually.
Filling Assistant
› The Filling Assistant specifies the exact inflation pressure of each tire with a new application that reports the tire pressure directly to a smart phone. Only at a optimum inflation pressure, the rolling resistance is low and the vehicle requires less energy when driving.
Sustainability Presentation – June 11, 2015 Oddo Securities 10th Environmental Forum EDMR – Equity and Debt Markets Relations
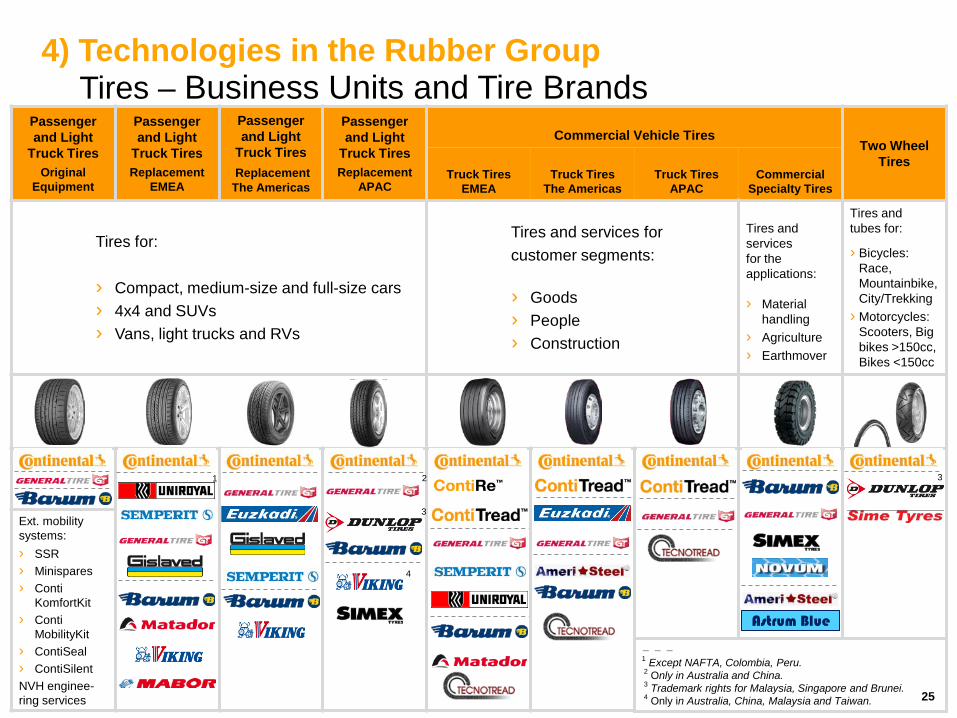
4) Technologies in the Rubber Group Tires – Business Units and Tire Brands
Passenger and Light
Truck Tires Original
Equipment
Passenger and Light
Truck Tires Replacement
EMEA
Passenger and Light
Truck Tires Replacement The Americas
Passenger and Light
Truck Tires Replacement
APAC
Commercial Vehicle Tires
Two Wheel Tires
Truck Tires EMEA
Truck Tires
The Americas
Truck Tires
APAC
Commercial
Specialty Tires
Tires for: › Compact, medium-size and full-size cars › 4x4 and SUVs › Vans, light trucks and RVs
Tires and services for customer segments:
› Goods › People › Construction
Tires and services for the applications: › Material
handling › Agriculture › Earthmover
Tires and tubes for:
› Bicycles: Race, Mountainbike, City/Trekking
› Motorcycles: Scooters, Big bikes >150cc, Bikes <150cc
Ext. mobility systems: › SSR › Minispares › Conti
KomfortKit › Conti
MobilityKit › ContiSeal › ContiSilent NVH enginee-ring services
– – – Segmentation into Premium, Quality and Budget. 1 Except NAFTA, Colombia, Peru. 2 Only in Australia and China. 3 Trademark rights for Malaysia, Singapore and Brunei. 4 Only in Australia, China, Malaysia and Taiwan.
Astrum Blue
4
2 3
3
1
25
Sustainability Presentation – June 11, 2015 Oddo Securities 10th Environmental Forum EDMR – Equity and Debt Markets Relations
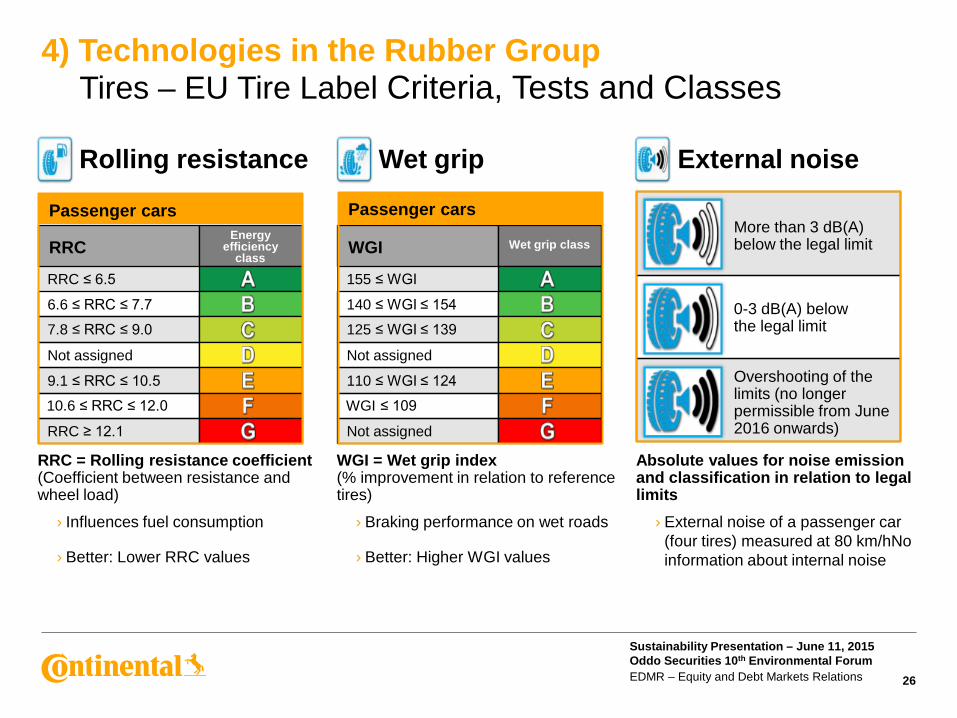
4) Technologies in the Rubber Group Tires – EU Tire Label Criteria, Tests and Classes
26
Rolling resistance
RRC = Rolling resistance coefficient (Coefficient between resistance and wheel load)
› Influences fuel consumption
› Better: Lower RRC values
Wet grip External noise
WGI = Wet grip index (% improvement in relation to reference tires)
› Braking performance on wet roads
› Better: Higher WGI values
Passenger cars Energy
efficiency class
RRC ≤ 6.5
6.6 ≤ RRC ≤ 7.7
7.8 ≤ RRC ≤ 9.0
Not assigned
9.1 ≤ RRC ≤ 10.5
10.6 ≤ RRC ≤ 12.0
RRC ≥ 12.1
RRC
Passenger cars
Wet grip class
155 ≤ WGI
140 ≤ WGI ≤ 154
125 ≤ WGI ≤ 139
Not assigned
110 ≤ WGI ≤ 124
WGI ≤ 109
Not assigned
WGI More than 3 dB(A) below the legal limit
0-3 dB(A) below the legal limit
Overshooting of the limits (no longer permissible from June 2016 onwards)
Absolute values for noise emission and classification in relation to legal limits
› External noise of a passenger car (four tires) measured at 80 km/hNo information about internal noise
Sustainability Presentation – June 11, 2015 Oddo Securities 10th Environmental Forum EDMR – Equity and Debt Markets Relations
4) Technologies in the Rubber Group Tires – Business Units and Tire Brands
27
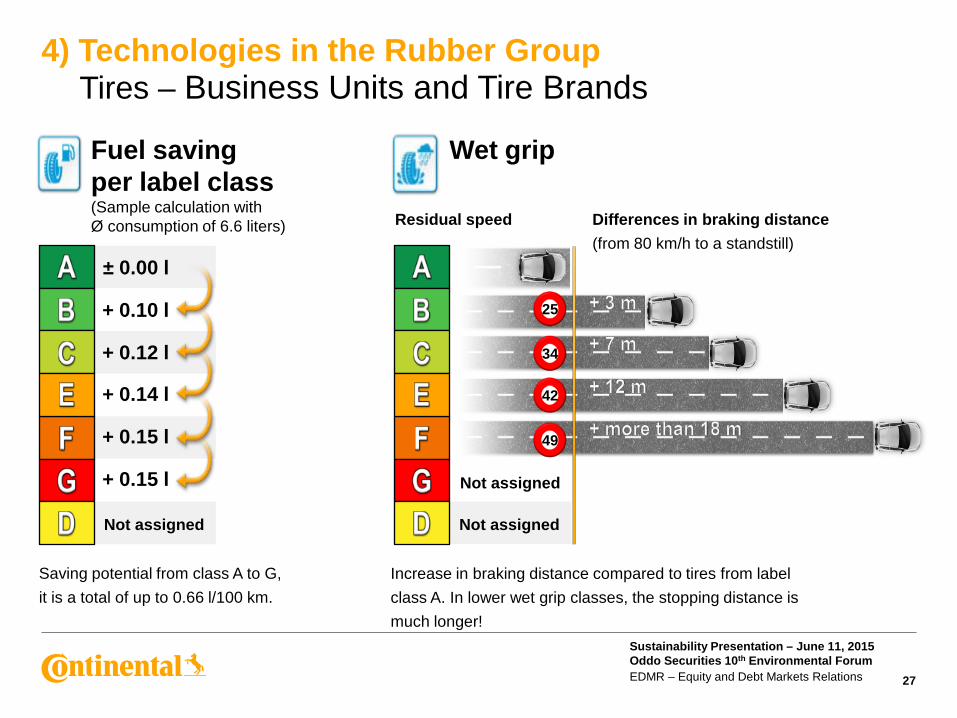
Fuel saving per label class (Sample calculation with Ø consumption of 6.6 liters)
+ 0.15 l
± 0.00 l
+ 0.10 l
+ 0.12 l
+ 0.14 l
+ 0.15 l
Saving potential from class A to G, it is a total of up to 0.66 l/100 km.
Not assigned
Wet grip
Increase in braking distance compared to tires from label class A. In lower wet grip classes, the stopping distance is much longer!
Residual speed Differences in braking distance (from 80 km/h to a standstill)
Not assigned
Not assigned
25
34
42
49
Sustainability Presentation – June 11, 2015 Oddo Securities 10th Environmental Forum EDMR – Equity and Debt Markets Relations
4) Technologies in the Rubber Group Tires – Research in Alternative Raw Materials for Tire Production
28
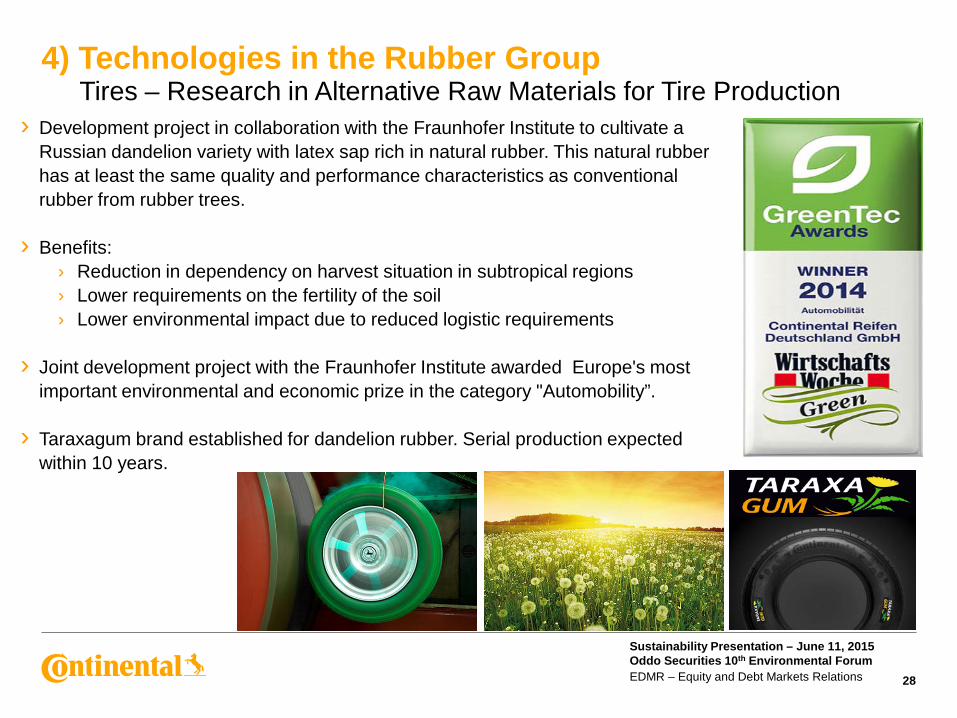
› Development project in collaboration with the Fraunhofer Institute to cultivate a
Russian dandelion variety with latex sap rich in natural rubber. This natural rubber has at least the same quality and performance characteristics as conventional rubber from rubber trees.
› Benefits: › Reduction in dependency on harvest situation in subtropical regions › Lower requirements on the fertility of the soil › Lower environmental impact due to reduced logistic requirements
› Joint development project with the Fraunhofer Institute awarded Europe's most important environmental and economic prize in the category "Automobility”.
› Taraxagum brand established for dandelion rubber. Serial production expected
within 10 years.
Sustainability Presentation – June 11, 2015 Oddo Securities 10th Environmental Forum EDMR – Equity and Debt Markets Relations
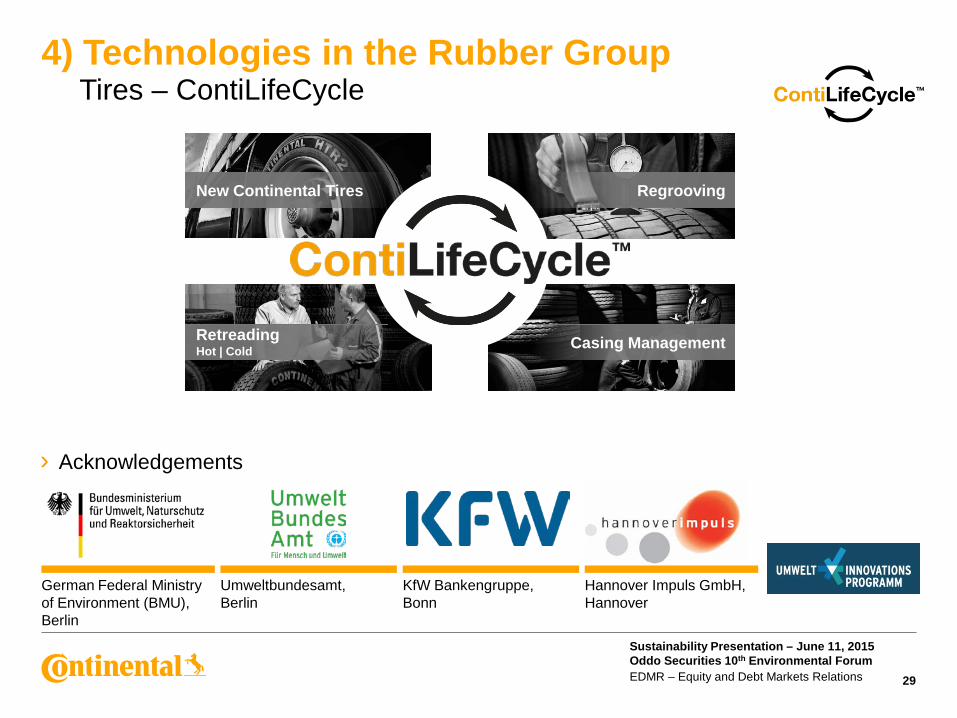
4) Technologies in the Rubber Group Tires – ContiLifeCycle
29
Retreading Hot | Cold Casing Management
Regrooving New Continental Tires
› Acknowledgements
German Federal Ministry of Environment (BMU), Berlin
Umweltbundesamt, Berlin
KfW Bankengruppe, Bonn
Hannover Impuls GmbH, Hannover
Sustainability Presentation – June 11, 2015 Oddo Securities 10th Environmental Forum EDMR – Equity and Debt Markets Relations
4) Technologies in the Rubber Group Tires – ContiLifeCycle
30
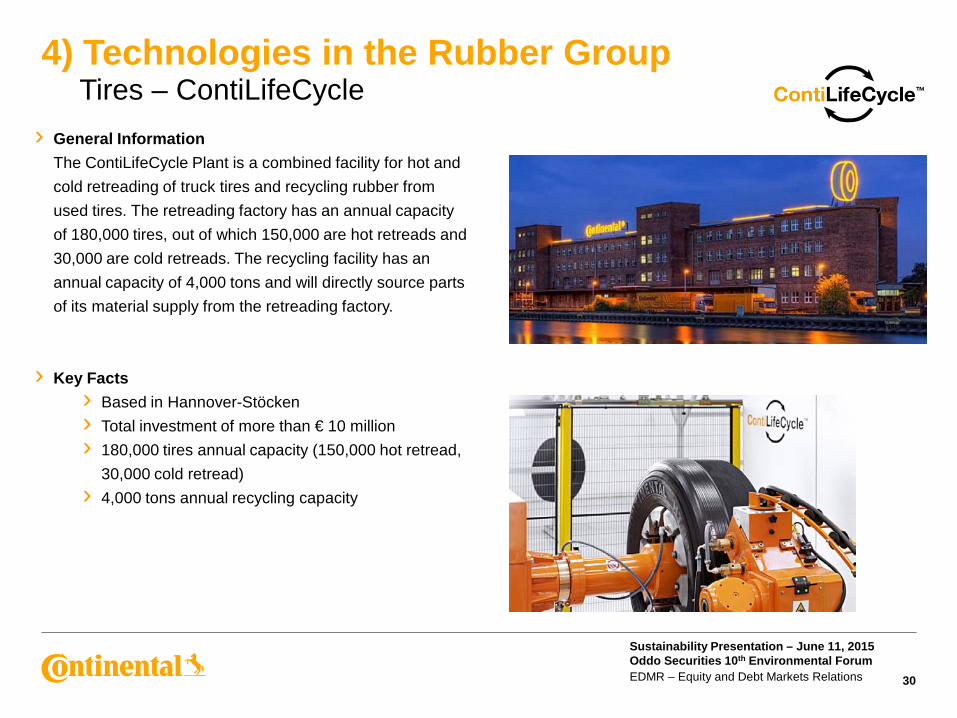
› General Information The ContiLifeCycle Plant is a combined facility for hot and
cold retreading of truck tires and recycling rubber from used tires. The retreading factory has an annual capacity of 180,000 tires, out of which 150,000 are hot retreads and 30,000 are cold retreads. The recycling facility has an annual capacity of 4,000 tons and will directly source parts of its material supply from the retreading factory.
› Key Facts
› Based in Hannover-Stöcken › Total investment of more than € 10 million › 180,000 tires annual capacity (150,000 hot retread,
30,000 cold retread) › 4,000 tons annual recycling capacity
Sustainability Presentation – June 11, 2015 Oddo Securities 10th Environmental Forum EDMR – Equity and Debt Markets Relations
4) Technologies in the Rubber Group Tires – ContiLifeCycle
31
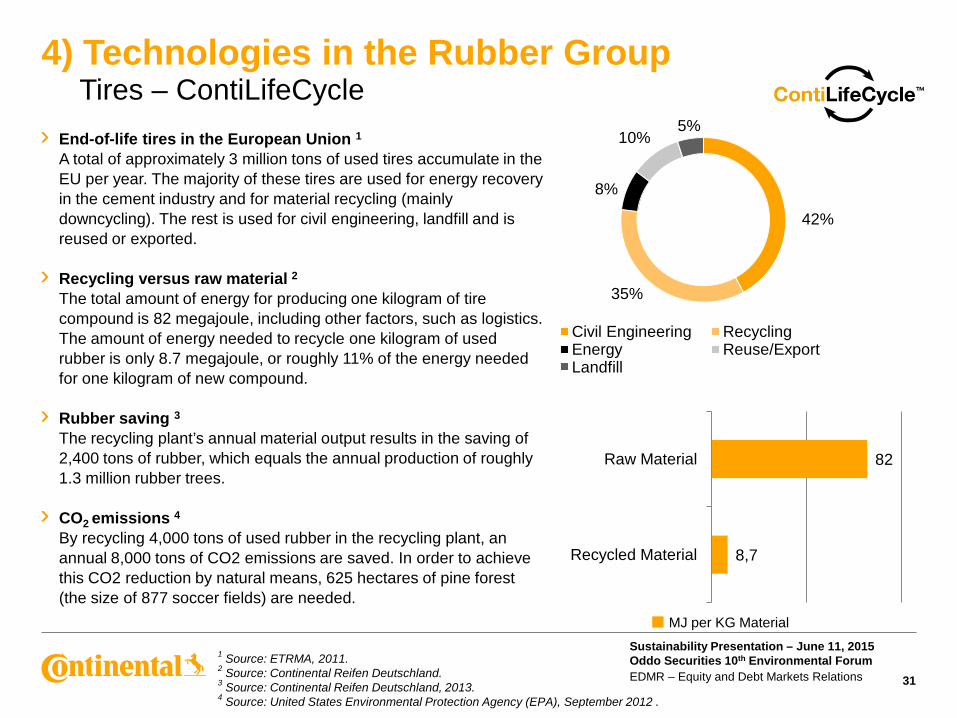
› End-of-life tires in the European Union 1
A total of approximately 3 million tons of used tires accumulate in the EU per year. The majority of these tires are used for energy recovery in the cement industry and for material recycling (mainly downcycling). The rest is used for civil engineering, landfill and is reused or exported.
› Recycling versus raw material 2
The total amount of energy for producing one kilogram of tire compound is 82 megajoule, including other factors, such as logistics. The amount of energy needed to recycle one kilogram of used rubber is only 8.7 megajoule, or roughly 11% of the energy needed for one kilogram of new compound.
› Rubber saving 3
The recycling plant’s annual material output results in the saving of 2,400 tons of rubber, which equals the annual production of roughly 1.3 million rubber trees.
› CO2 emissions 4
By recycling 4,000 tons of used rubber in the recycling plant, an annual 8,000 tons of CO2 emissions are saved. In order to achieve this CO2 reduction by natural means, 625 hectares of pine forest (the size of 877 soccer fields) are needed.
42%
35%
8%
10% 5%
Civil Engineering Recycling Energy Reuse/Export Landfill
8,7
82
Recycled Material
Raw Material
MJ per KG Material
1 Source: ETRMA, 2011. 2 Source: Continental Reifen Deutschland. 3 Source: Continental Reifen Deutschland, 2013. 4 Source: United States Environmental Protection Agency (EPA), September 2012 .
Sustainability Presentation – June 11, 2015 Oddo Securities 10th Environmental Forum EDMR – Equity and Debt Markets Relations
4) Technologies in the Rubber Group Tires – ContiLifeCycle
32
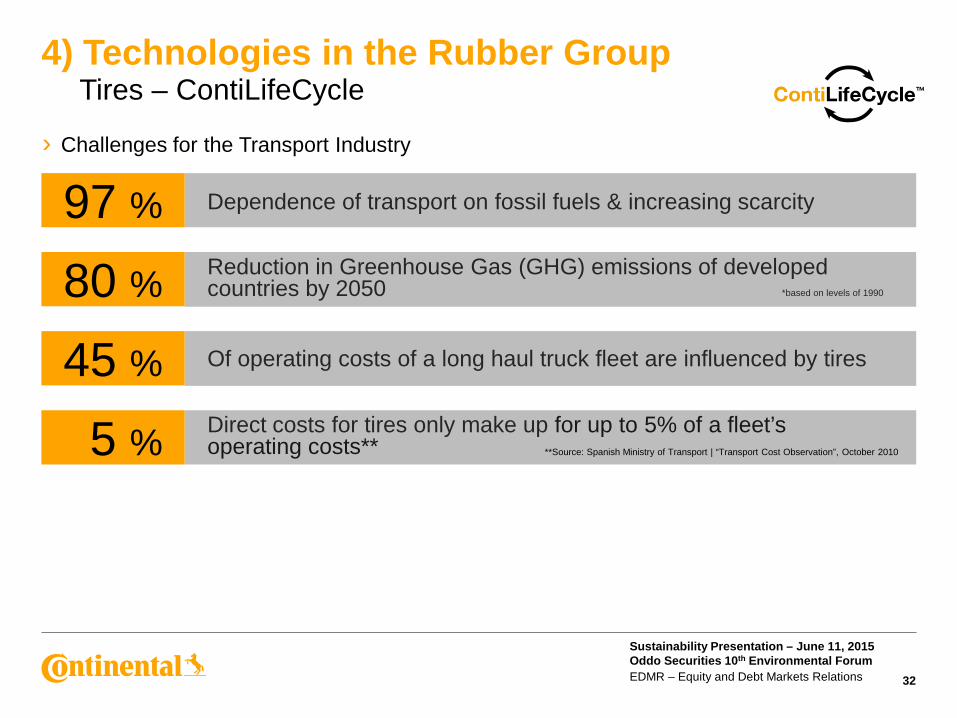
› Challenges for the Transport Industry
Dependence of transport on fossil fuels & increasing scarcity 97 % Reduction in Greenhouse Gas (GHG) emissions of developed countries by 2050 *based on levels of 1990 80 %
Of operating costs of a long haul truck fleet are influenced by tires 45 % Direct costs for tires only make up for up to 5% of a fleet’s operating costs** 5 % **Source: Spanish Ministry of Transport | “Transport Cost Observation”, October 2010
Sustainability Presentation – June 11, 2015 Oddo Securities 10th Environmental Forum EDMR – Equity and Debt Markets Relations
4) Technologies in the Rubber Group Tires – ContiLifeCycle
33
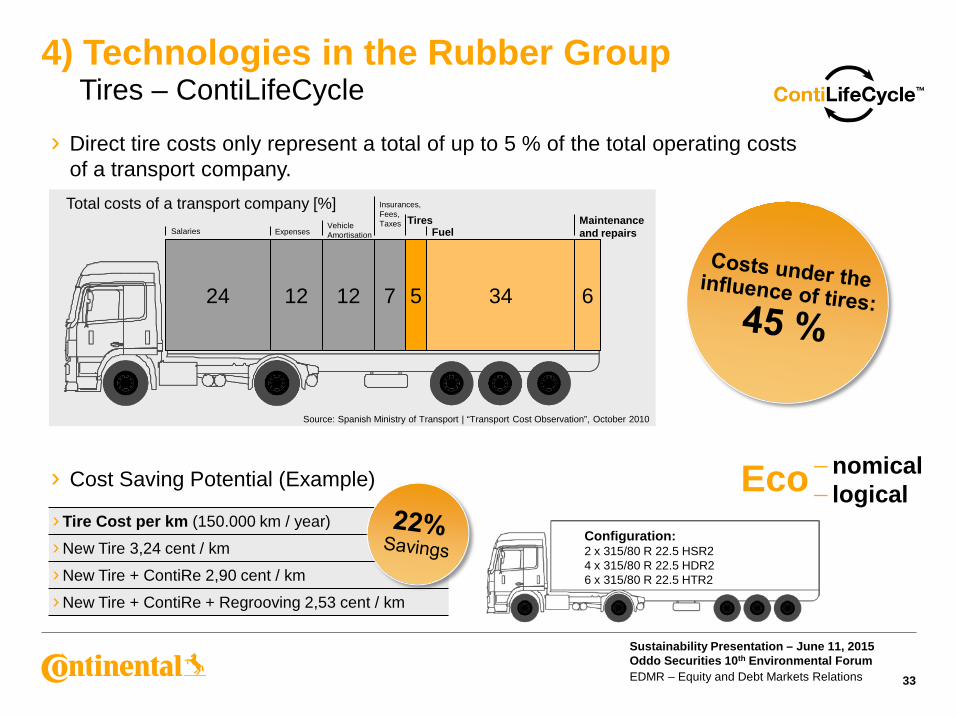
Source: Spanish Ministry of Transport | “Transport Cost Observation”, October 2010
Total costs of a transport company [%] Maintenance and repairs Fuel
6 34 5
Tires Insurances, Fees, Taxes
7
Vehicle Amortisation
12
Expenses
12
Salaries
24
› Direct tire costs only represent a total of up to 5 % of the total operating costs of a transport company.
6 34 5
Configuration: 2 x 315/80 R 22.5 HSR2 4 x 315/80 R 22.5 HDR2 6 x 315/80 R 22.5 HTR2
› Tire Cost per km (150.000 km / year)
› New Tire 3,24 cent / km
› New Tire + ContiRe 2,90 cent / km
› New Tire + ContiRe + Regrooving 2,53 cent / km
−nomical − logical Eco › Cost Saving Potential (Example)
Sustainability Presentation – June 11, 2015 Oddo Securities 10th Environmental Forum EDMR – Equity and Debt Markets Relations
4) Technologies in the Rubber Group Tires – ContiLifeCycle
34
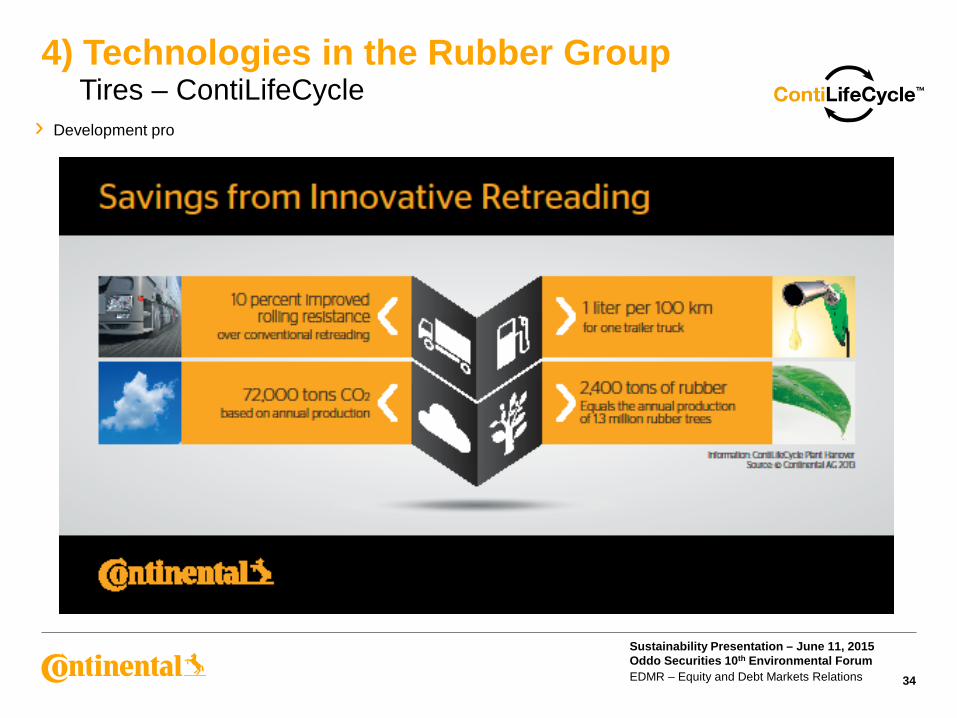
› Development pro
Sustainability Presentation – June 11, 2015 Oddo Securities 10th Environmental Forum EDMR – Equity and Debt Markets Relations
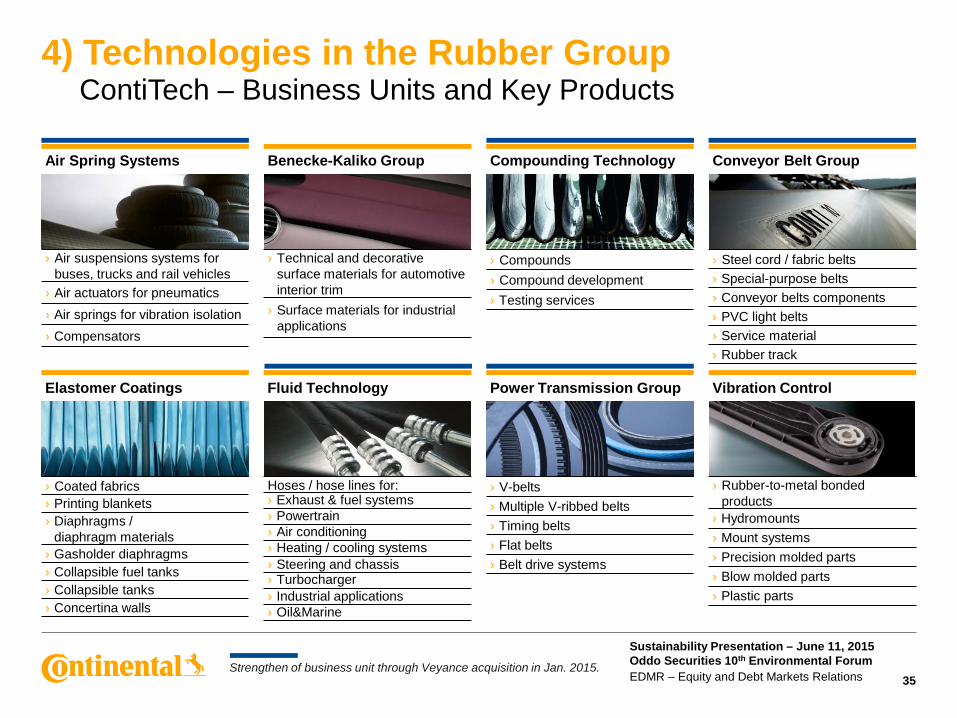
4) Technologies in the Rubber Group ContiTech – Business Units and Key Products
35
Air Spring Systems Benecke-Kaliko Group Conveyor Belt Group Compounding Technology
Power Transmission Group Vibration Control Fluid Technology Elastomer Coatings
› Air suspensions systems for buses, trucks and rail vehicles
› Air actuators for pneumatics › Air springs for vibration isolation › Compensators
› Compounds › Compound development › Testing services
› Steel cord / fabric belts › Special-purpose belts › Conveyor belts components › PVC light belts › Service material › Rubber track
› Coated fabrics › Printing blankets › Diaphragms /
diaphragm materials › Gasholder diaphragms › Collapsible fuel tanks › Collapsible tanks › Concertina walls
Hoses / hose lines for: › Exhaust & fuel systems › Powertrain › Air conditioning › Heating / cooling systems › Steering and chassis › Turbocharger › Industrial applications › Oil&Marine
› V-belts › Multiple V-ribbed belts › Timing belts › Flat belts › Belt drive systems
› Rubber-to-metal bonded products
› Hydromounts › Mount systems › Precision molded parts › Blow molded parts › Plastic parts
› Technical and decorative surface materials for automotive interior trim
› Surface materials for industrial applications
Strengthen of business unit through Veyance acquisition in Jan. 2015.
Sustainability Presentation – June 11, 2015 Oddo Securities 10th Environmental Forum EDMR – Equity and Debt Markets Relations
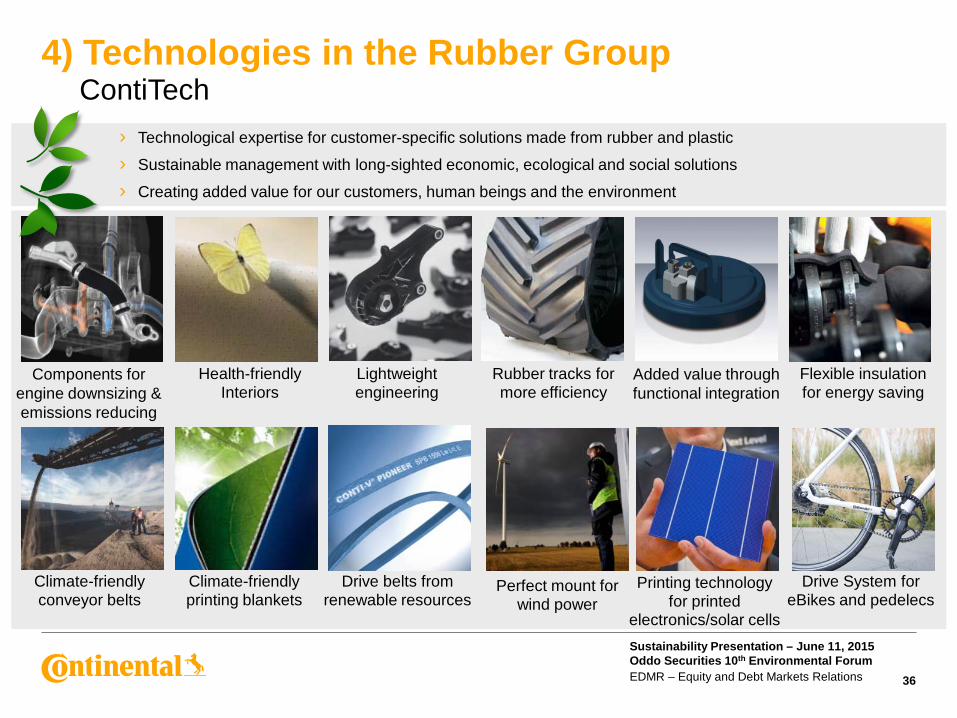
4) Technologies in the Rubber Group ContiTech
36
Health-friendly Interiors
Lightweight engineering
Perfect mount for wind power
Drive belts from renewable resources
Climate-friendly conveyor belts
Rubber tracks for more efficiency
› Technological expertise for customer-specific solutions made from rubber and plastic
› Sustainable management with long-sighted economic, ecological and social solutions
› Creating added value for our customers, human beings and the environment
Flexible insulation for energy saving
Components for engine downsizing & emissions reducing
Drive System for eBikes and pedelecs
Climate-friendly printing blankets
Printing technology for printed
electronics/solar cells
Added value through functional integration
Sustainability Presentation – June 11, 2015 Oddo Securities 10th Environmental Forum EDMR – Equity and Debt Markets Relations
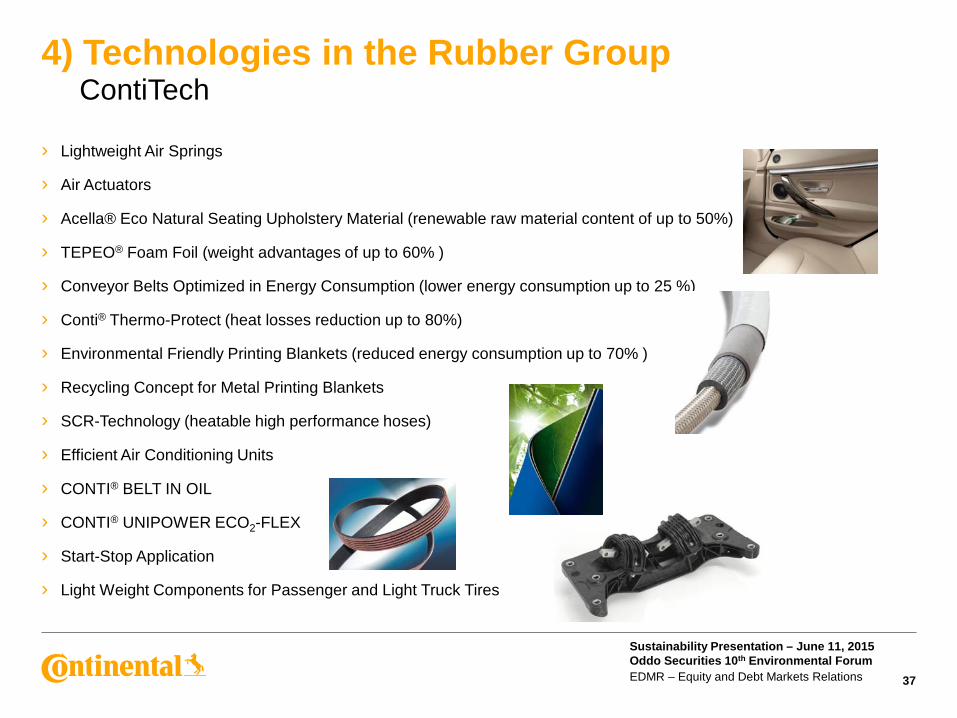
4) Technologies in the Rubber Group ContiTech
37
› Lightweight Air Springs
› Air Actuators
› Acella® Eco Natural Seating Upholstery Material (renewable raw material content of up to 50%)
› TEPEO® Foam Foil (weight advantages of up to 60% )
› Conveyor Belts Optimized in Energy Consumption (lower energy consumption up to 25 %)
› Conti® Thermo-Protect (heat losses reduction up to 80%)
› Environmental Friendly Printing Blankets (reduced energy consumption up to 70% )
› Recycling Concept for Metal Printing Blankets
› SCR-Technology (heatable high performance hoses)
› Efficient Air Conditioning Units
› CONTI® BELT IN OIL
› CONTI® UNIPOWER ECO2-FLEX
› Start-Stop Application
› Light Weight Components for Passenger and Light Truck Tires
Sustainability Presentation – June 11, 2015 Oddo Securities 10th Environmental Forum EDMR – Equity and Debt Markets Relations 38
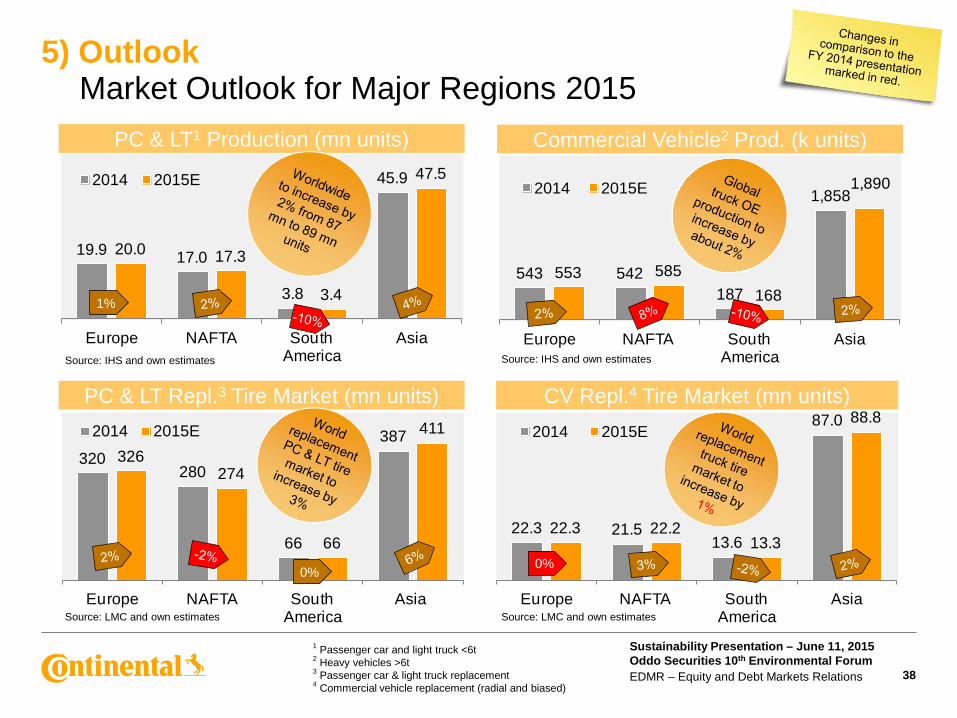
5) Outlook Market Outlook for Major Regions 2015
22.3 21.513.6
87.0
22.3 22.213.3
88.8
Europe NAFTA South America
Asia
2014 2015E
543 542187
1,858
553 585168
1,890
Europe NAFTA South America
Asia
2014 2015E
320280
66
387326
274
66
411
Europe NAFTA South America
Asia
2014 2015E
19.9 17.0
3.8
45.9
20.0 17.3
3.4
47.5
Europe NAFTA South America
Asia
2014 2015E
Commercial Vehicle2 Prod. (k units)
CV Repl.4 Tire Market (mn units)
Source: IHS and own estimates
Source: LMC and own estimates
1%
Source: IHS and own estimates
PC & LT1 Production (mn units)
Source: LMC and own estimates
PC & LT Repl.3 Tire Market (mn units)
0% 0%
1 Passenger car and light truck <6t 2 Heavy vehicles >6t 3 Passenger car & light truck replacement 4 Commercial vehicle replacement (radial and biased)
Sustainability Presentation – June 11, 2015 Oddo Securities 10th Environmental Forum EDMR – Equity and Debt Markets Relations
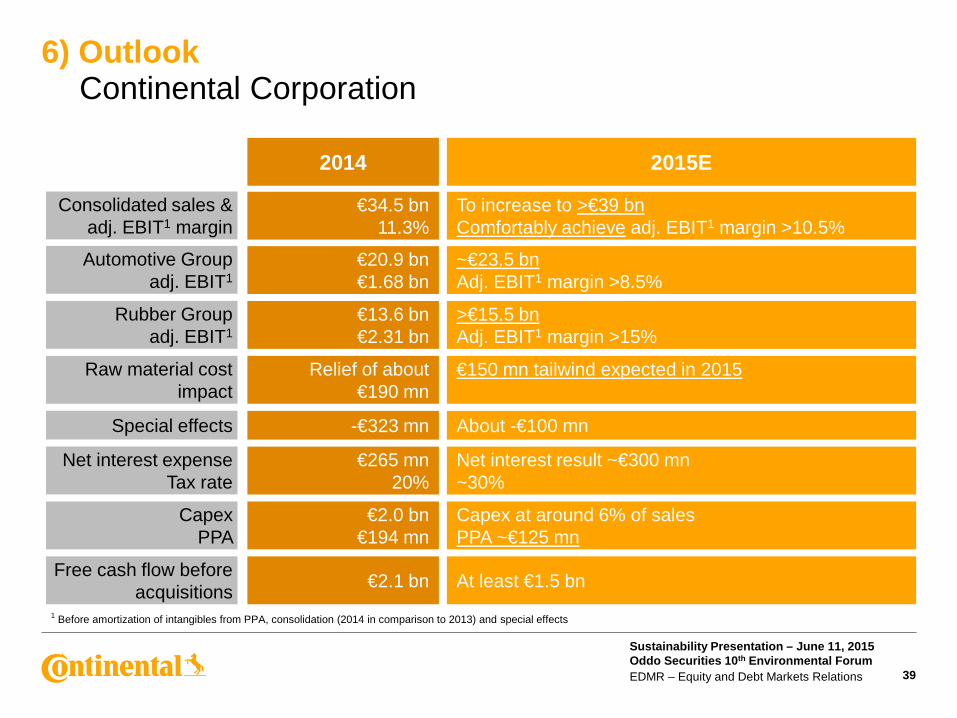
6) Outlook Continental Corporation
39
1 Before amortization of intangibles from PPA, consolidation (2014 in comparison to 2013) and special effects
Consolidated sales & adj. EBIT1 margin
€34.5 bn 11.3%
Automotive Group adj. EBIT1
€20.9 bn €1.68 bn
Rubber Group adj. EBIT1
€13.6 bn €2.31 bn
Raw material cost impact
Relief of about €190 mn
2014
Special effects -€323 mn
Net interest expense Tax rate
€265 mn 20%
Capex PPA
€2.0 bn €194 mn
Free cash flow before acquisitions €2.1 bn
To increase to >€39 bn Comfortably achieve adj. EBIT1 margin >10.5%
~€23.5 bn Adj. EBIT1 margin >8.5%
>€15.5 bn Adj. EBIT1 margin >15%
€150 mn tailwind expected in 2015
2015E
About -€100 mn
Net interest result ~€300 mn ~30%
Capex at around 6% of sales PPA ~€125 mn
At least €1.5 bn
Sustainability Presentation – June 11, 2015 Oddo Securities 10th Environmental Forum EDMR – Equity and Debt Markets Relations 40
Thank you!
Official Sponsor of the UEFA European Football Championship™
Sustainability Presentation – June 11, 2015 Oddo Securities 10th Environmental Forum EDMR – Equity and Debt Markets Relations 41
Disclaimer
› This presentation has been prepared by Continental Aktiengesellschaft solely in connection with the Oddo Securities 10th Environmental Forum on June 11, 2015, in Paris. It has not been independently verified. It does not constitute an offer, invitation or recommendation to purchase or subscribe for any shares or other securities issued by Continental AG or any subsidiary and neither shall any part of it form the basis of, or be relied upon in connection with, any contract or commitment concerning the purchase or sale of such shares or other securities whatsoever.
› Neither Continental Aktiengesellschaft nor any of its affiliates, advisors or representatives shall have any liability whatsoever (in negligence or otherwise) for any loss that may arise from any use of this presentation or its contents or otherwise arising in connection with this presentation.
› This presentation includes assumptions, estimates, forecasts and other forward-looking statements, including statements about our beliefs and expectations regarding future developments as well as their effect on the results of Continental. These statements are based on plans, estimates and projections as they are currently available to the management of Continental. Therefore, these statements speak only as of the date they are made, and we undertake no obligation to update publicly any of them in light of new information or future events. Furthermore, although the management is of the opinion that these statements, and their underlying beliefs and expectations, are realistic or of the date they are made, no guarantee can be given that the expected developments and effects will actually occur. Many factors may cause the actual development to be materially different from the expectations expressed here. Such factors include, for example and without limitation, changes in general economic and business conditions, fluctuations in currency exchange rates or interest rates, the introduction of competing products, the lack of acceptance for new products or services and changes in business strategy.
› All statements with regard to markets or market position(s) of Continental or any of its competitors are estimates of Continental based on data available to Continental. Such data are neither comprehensive nor independently verified. Consequently, the data used are not adequate for and the statements based on such data are not meant to be, an accurate or proper definition of regional and/or product markets or market shares of Continental and any of the participants in any market.
› Unless otherwise stated, all amounts are shown in millions of euro. Please note that differences may arise as a result of the use of rounded amounts and percentages.
Sustainability Presentation – June 11, 2015 Oddo Securities 10th Environmental Forum EDMR – Equity and Debt Markets Relations 42
Contact Equity and Debt Markets Relations
Vahrenwalder Str. 9 Klaus Paesler 30165 Hanover Phone: +49 511 938 1316 Germany e-mail: [email protected] Rolf Woller Sabine Reese Phone: +49 511 938 1068 Phone: +49 511 938 1027 e-mail: [email protected] e-mail: [email protected] Ingrid Kampf Michael Saemann Phone: +49 511 938 1163 Phone: +49 511 938 1307 Fax: +49 511 938 1080 e-mail: [email protected] e-mail: [email protected] www.continental-ir.com Henry Schniewind Phone: +49 511 938 1062 e-mail: [email protected]
Sustainability Presentation – June 11, 2015 Oddo Securities 10th Environmental Forum EDMR – Equity and Debt Markets Relations 43
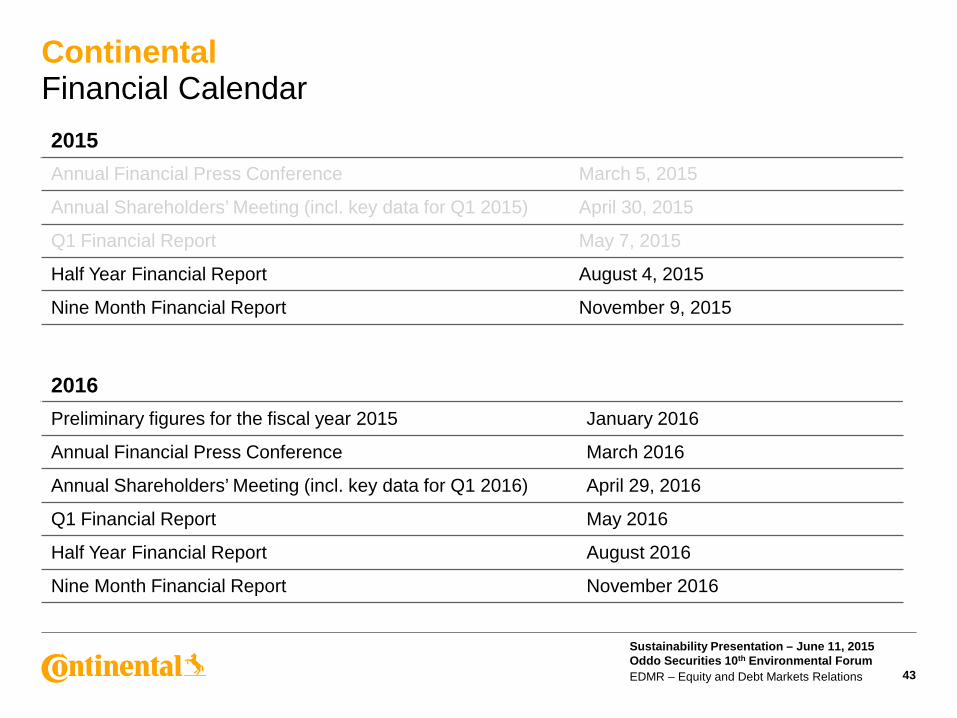
Continental Financial Calendar 2015 Annual Financial Press Conference March 5, 2015
Annual Shareholders’ Meeting (incl. key data for Q1 2015) April 30, 2015
Q1 Financial Report May 7, 2015
Half Year Financial Report August 4, 2015
Nine Month Financial Report November 9, 2015
2016 Preliminary figures for the fiscal year 2015 January 2016
Annual Financial Press Conference March 2016
Annual Shareholders’ Meeting (incl. key data for Q1 2016) April 29, 2016
Q1 Financial Report May 2016
Half Year Financial Report August 2016
Nine Month Financial Report November 2016
Sustainability Presentation – June 11, 2015 Oddo Securities 10th Environmental Forum EDMR – Equity and Debt Markets Relations 44
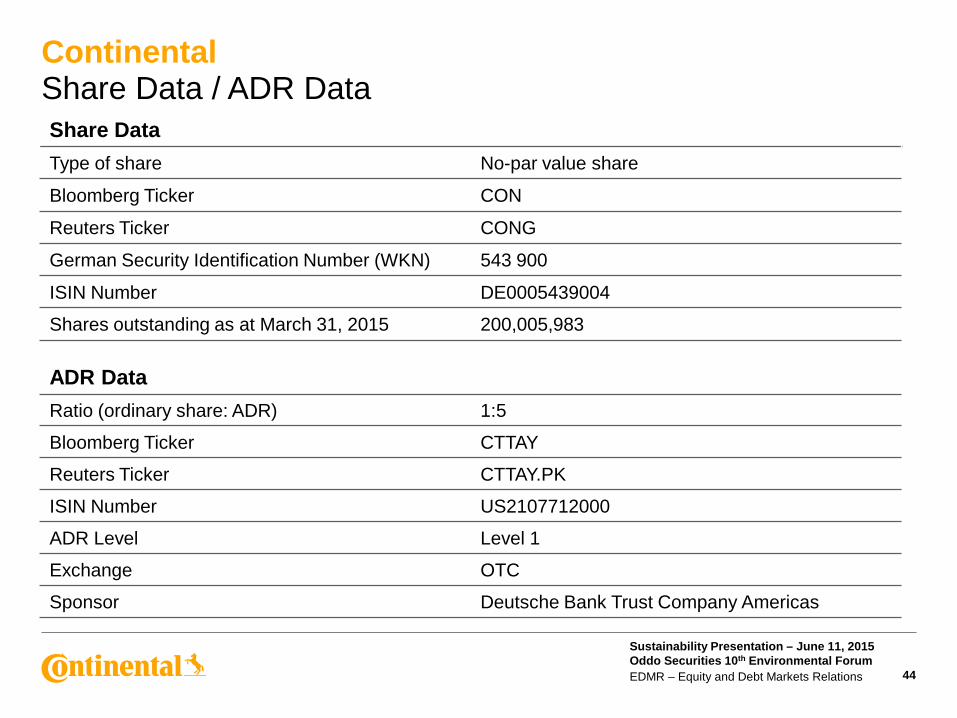
Continental Share Data / ADR Data Share Data Type of share No-par value share
Bloomberg Ticker CON
Reuters Ticker CONG
German Security Identification Number (WKN) 543 900
ISIN Number DE0005439004
Shares outstanding as at March 31, 2015 200,005,983
ADR Data Ratio (ordinary share: ADR) 1:5
Bloomberg Ticker CTTAY
Reuters Ticker CTTAY.PK
ISIN Number US2107712000
ADR Level Level 1
Exchange OTC
Sponsor Deutsche Bank Trust Company Americas
Sustainability Presentation – June 11, 2015 Oddo Securities 10th Environmental Forum EDMR – Equity and Debt Markets Relations 45
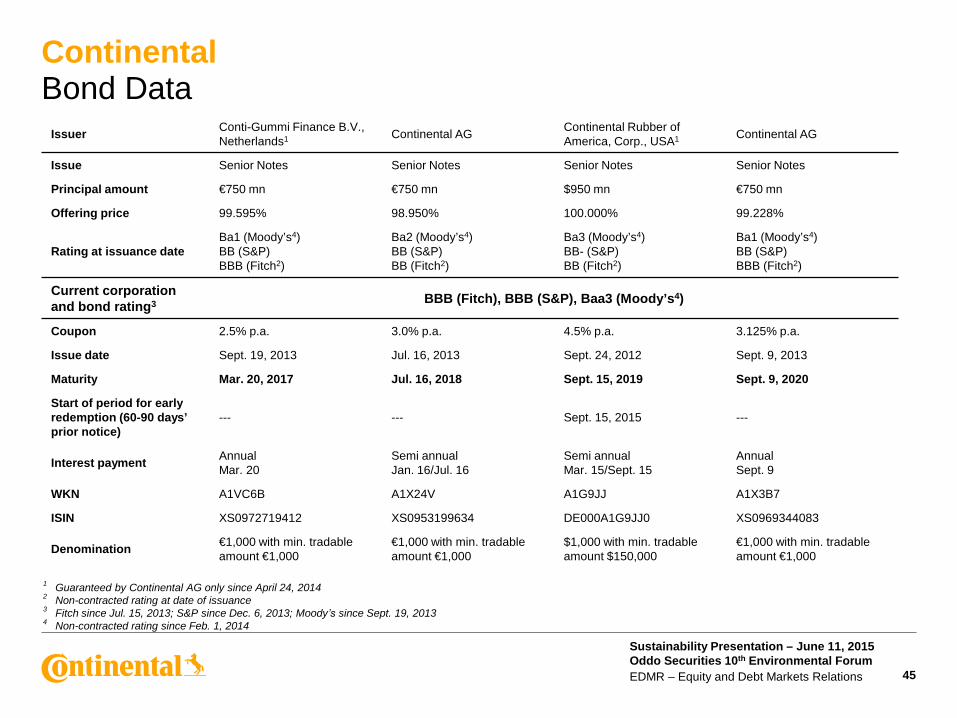
Continental Bond Data
Issuer Conti-Gummi Finance B.V., Netherlands1 Continental AG Continental Rubber of
America, Corp., USA1 Continental AG
Issue Senior Notes Senior Notes Senior Notes Senior Notes
Principal amount €750 mn €750 mn $950 mn €750 mn
Offering price 99.595% 98.950% 100.000% 99.228%
Rating at issuance date Ba1 (Moody’s4) BB (S&P) BBB (Fitch2)
Ba2 (Moody’s4) BB (S&P) BB (Fitch2)
Ba3 (Moody’s4) BB- (S&P) BB (Fitch2)
Ba1 (Moody’s4) BB (S&P) BBB (Fitch2)
Current corporation and bond rating3 BBB (Fitch), BBB (S&P), Baa3 (Moody’s4)
Coupon 2.5% p.a. 3.0% p.a. 4.5% p.a. 3.125% p.a.
Issue date Sept. 19, 2013 Jul. 16, 2013 Sept. 24, 2012 Sept. 9, 2013
Maturity Mar. 20, 2017 Jul. 16, 2018 Sept. 15, 2019 Sept. 9, 2020
Start of period for early redemption (60-90 days’ prior notice)
--- --- Sept. 15, 2015 ---
Interest payment Annual Mar. 20
Semi annual Jan. 16/Jul. 16
Semi annual Mar. 15/Sept. 15
Annual Sept. 9
WKN A1VC6B A1X24V A1G9JJ A1X3B7
ISIN XS0972719412 XS0953199634 DE000A1G9JJ0 XS0969344083
Denomination €1,000 with min. tradable amount €1,000
€1,000 with min. tradable amount €1,000
$1,000 with min. tradable amount $150,000
€1,000 with min. tradable amount €1,000
1 Guaranteed by Continental AG only since April 24, 2014 2 Non-contracted rating at date of issuance 3 Fitch since Jul. 15, 2013; S&P since Dec. 6, 2013; Moodyʼs since Sept. 19, 2013 4 Non-contracted rating since Feb. 1, 2014
Sustainability Presentation – June 11, 2015 Oddo Securities 10th Environmental Forum EDMR – Equity and Debt Markets Relations
Back-up
46
Sustainability Presentation – June 11, 2015 Oddo Securities 10th Environmental Forum EDMR – Equity and Debt Markets Relations 47
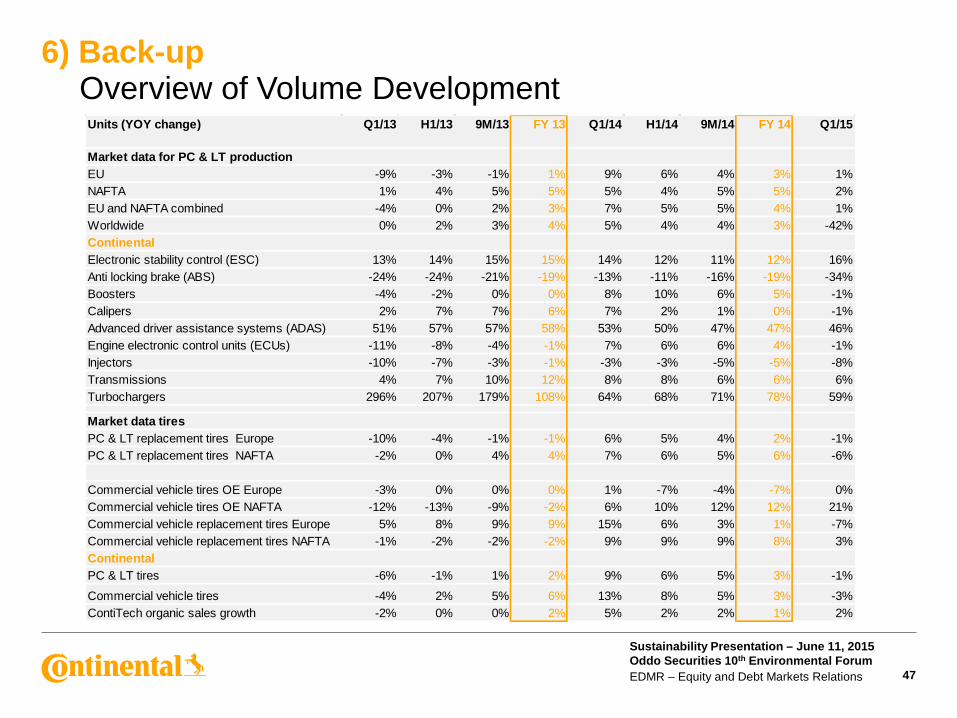
6) Back-up Overview of Volume Development
Units (YOY change) Q1/13 H1/13 9M/13 FY 13 Q1/14 H1/14 9M/14 FY 14 Q1/15
Market data for PC & LT productionEU -9% -3% -1% 1% 9% 6% 4% 3% 1%NAFTA 1% 4% 5% 5% 5% 4% 5% 5% 2%EU and NAFTA combined -4% 0% 2% 3% 7% 5% 5% 4% 1%Worldwide 0% 2% 3% 4% 5% 4% 4% 3% -42%Continental Electronic stability control (ESC) 13% 14% 15% 15% 14% 12% 11% 12% 16%Anti locking brake (ABS) -24% -24% -21% -19% -13% -11% -16% -19% -34%Boosters -4% -2% 0% 0% 8% 10% 6% 5% -1%Calipers 2% 7% 7% 6% 7% 2% 1% 0% -1%Advanced driver assistance systems (ADAS) 51% 57% 57% 58% 53% 50% 47% 47% 46%Engine electronic control units (ECUs) -11% -8% -4% -1% 7% 6% 6% 4% -1%Injectors -10% -7% -3% -1% -3% -3% -5% -5% -8%Transmissions 4% 7% 10% 12% 8% 8% 6% 6% 6%Turbochargers 296% 207% 179% 108% 64% 68% 71% 78% 59%
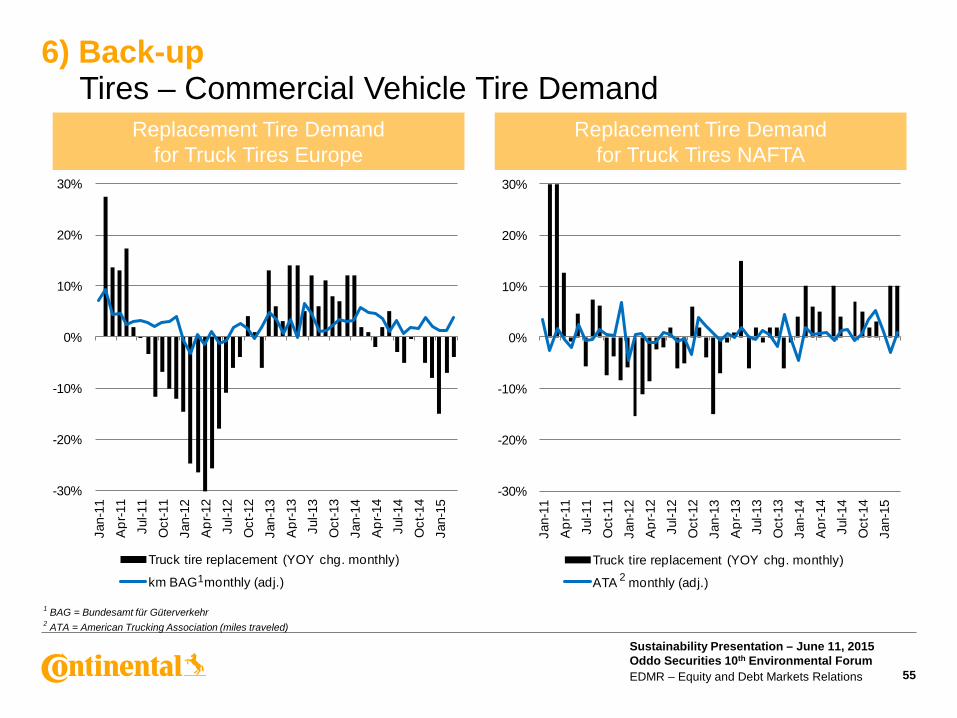
Market data tiresPC & LT replacement tires Europe -10% -4% -1% -1% 6% 5% 4% 2% -1%PC & LT replacement tires NAFTA -2% 0% 4% 4% 7% 6% 5% 6% -6%
Commercial vehicle tires OE Europe -3% 0% 0% 0% 1% -7% -4% -7% 0%Commercial vehicle tires OE NAFTA -12% -13% -9% -2% 6% 10% 12% 12% 21%Commercial vehicle replacement tires Europe 5% 8% 9% 9% 15% 6% 3% 1% -7%Commercial vehicle replacement tires NAFTA -1% -2% -2% -2% 9% 9% 9% 8% 3%ContinentalPC & LT tires -6% -1% 1% 2% 9% 6% 5% 3% -1%
Commercial vehicle tires -4% 2% 5% 6% 13% 8% 5% 3% -3%ContiTech organic sales growth -2% 0% 0% 2% 5% 2% 2% 1% 2%
Sustainability Presentation – June 11, 2015 Oddo Securities 10th Environmental Forum EDMR – Equity and Debt Markets Relations 48
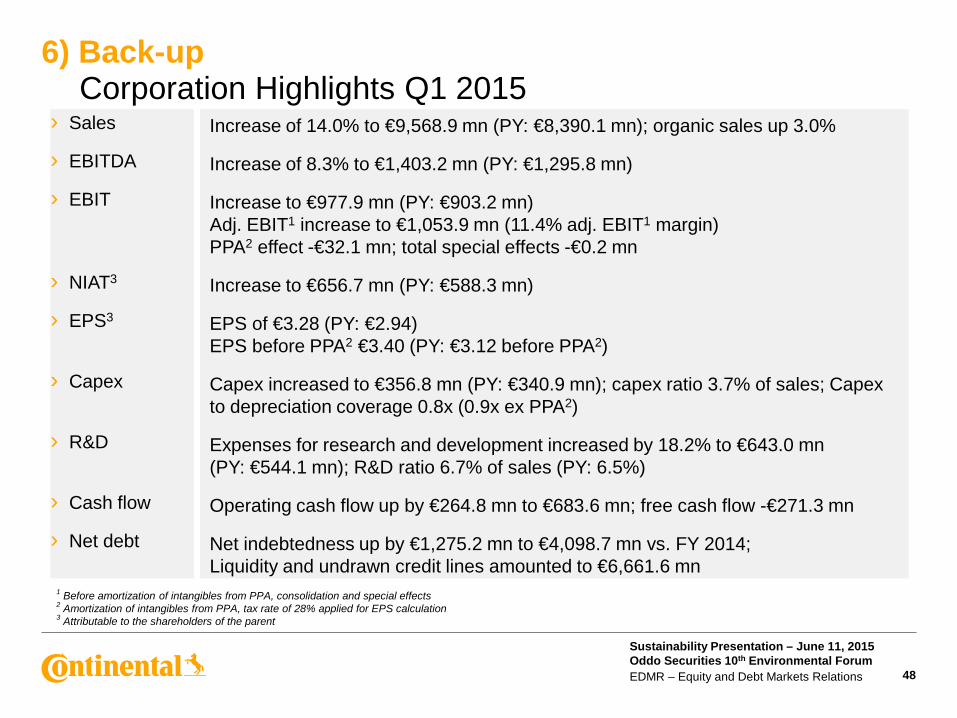
6) Back-up Corporation Highlights Q1 2015
› Sales
› EBITDA
› EBIT
› NIAT3
› EPS3
› Capex
› R&D
› Cash flow
› Net debt
Increase of 14.0% to €9,568.9 mn (PY: €8,390.1 mn); organic sales up 3.0%
Increase of 8.3% to €1,403.2 mn (PY: €1,295.8 mn)
Increase to €977.9 mn (PY: €903.2 mn) Adj. EBIT1 increase to €1,053.9 mn (11.4% adj. EBIT1 margin) PPA2 effect -€32.1 mn; total special effects -€0.2 mn
Increase to €656.7 mn (PY: €588.3 mn)
EPS of €3.28 (PY: €2.94) EPS before PPA2 €3.40 (PY: €3.12 before PPA2)
Capex increased to €356.8 mn (PY: €340.9 mn); capex ratio 3.7% of sales; Capex to depreciation coverage 0.8x (0.9x ex PPA2)
Expenses for research and development increased by 18.2% to €643.0 mn (PY: €544.1 mn); R&D ratio 6.7% of sales (PY: 6.5%)
Operating cash flow up by €264.8 mn to €683.6 mn; free cash flow -€271.3 mn
Net indebtedness up by €1,275.2 mn to €4,098.7 mn vs. FY 2014; Liquidity and undrawn credit lines amounted to €6,661.6 mn
1 Before amortization of intangibles from PPA, consolidation and special effects 2 Amortization of intangibles from PPA, tax rate of 28% applied for EPS calculation 3 Attributable to the shareholders of the parent
Sustainability Presentation – June 11, 2015 Oddo Securities 10th Environmental Forum EDMR – Equity and Debt Markets Relations 49
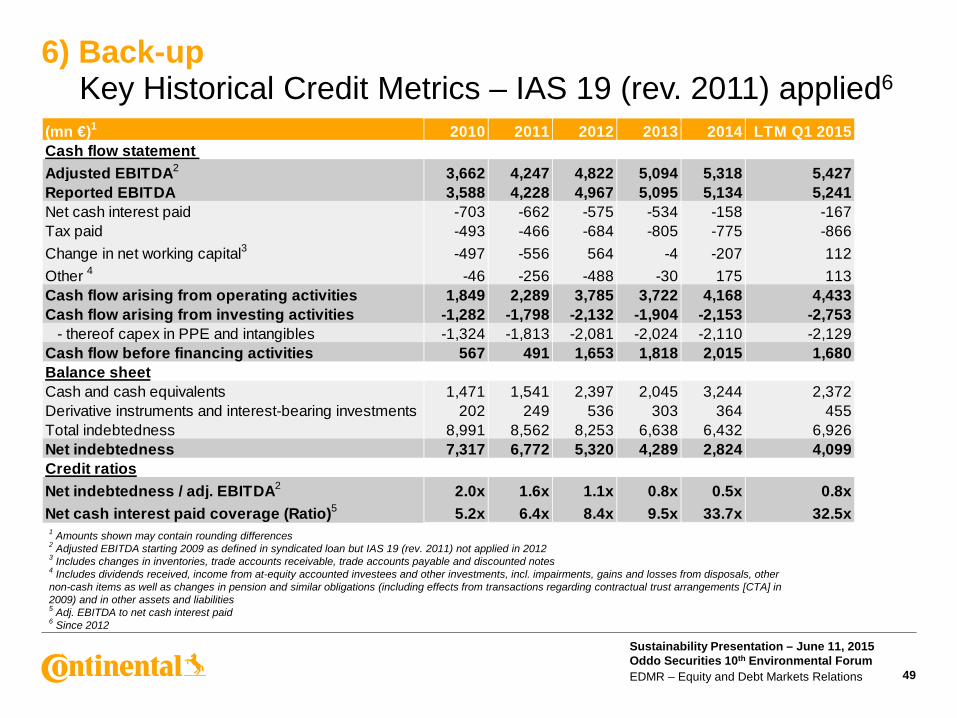
6) Back-up Key Historical Credit Metrics – IAS 19 (rev. 2011) applied6
1 Amounts shown may contain rounding differences 2 Adjusted EBITDA starting 2009 as defined in syndicated loan but IAS 19 (rev. 2011) not applied in 2012 3 Includes changes in inventories, trade accounts receivable, trade accounts payable and discounted notes 4 Includes dividends received, income from at-equity accounted investees and other investments, incl. impairments, gains and losses from disposals, other non-cash items as well as changes in pension and similar obligations (including effects from transactions regarding contractual trust arrangements [CTA] in 2009) and in other assets and liabilities 5 Adj. EBITDA to net cash interest paid 6 Since 2012
(mn €)1 2010 2011 2012 2013 2014 LTM Q1 2015Cash flow statement Adjusted EBITDA2 3,662 4,247 4,822 5,094 5,318 5,427Reported EBITDA 3,588 4,228 4,967 5,095 5,134 5,241Net cash interest paid -703 -662 -575 -534 -158 -167Tax paid -493 -466 -684 -805 -775 -866Change in net working capital3 -497 -556 564 -4 -207 112Other 4 -46 -256 -488 -30 175 113Cash flow arising from operating activities 1,849 2,289 3,785 3,722 4,168 4,433Cash flow arising from investing activities -1,282 -1,798 -2,132 -1,904 -2,153 -2,753 - thereof capex in PPE and intangibles -1,324 -1,813 -2,081 -2,024 -2,110 -2,129Cash flow before financing activities 567 491 1,653 1,818 2,015 1,680Balance sheetCash and cash equivalents 1,471 1,541 2,397 2,045 3,244 2,372Derivative instruments and interest-bearing investments 202 249 536 303 364 455Total indebtedness 8,991 8,562 8,253 6,638 6,432 6,926Net indebtedness 7,317 6,772 5,320 4,289 2,824 4,099Credit ratiosNet indebtedness / adj. EBITDA2 2.0x 1.6x 1.1x 0.8x 0.5x 0.8xNet cash interest paid coverage (Ratio)5 5.2x 6.4x 8.4x 9.5x 33.7x 32.5x
Sustainability Presentation – June 11, 2015 Oddo Securities 10th Environmental Forum EDMR – Equity and Debt Markets Relations
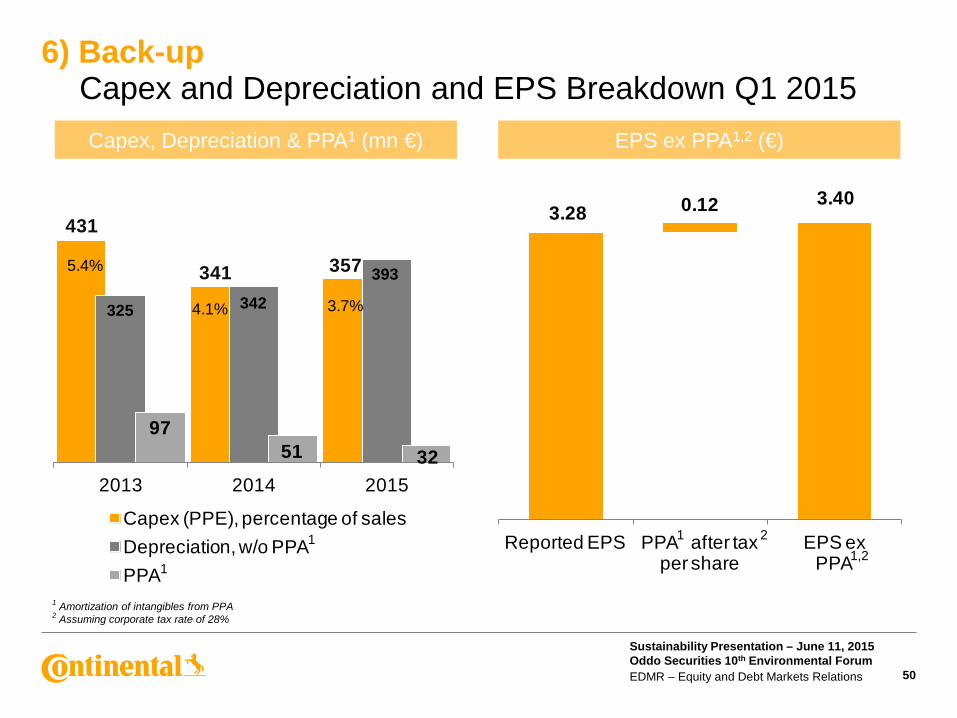
431
341 357
325 342
393
9751 32
2013 2014 2015
Capex (PPE), percentage of salesDepreciation, w/o PPAPPA
5.4%
4.1% 3.7%
3.28 0.12 3.40
Reported EPS PPA after tax per share
EPS ex PPA
50
6) Back-up Capex and Depreciation and EPS Breakdown Q1 2015 Capex, Depreciation & PPA1 (mn €) EPS ex PPA1,2 (€)
1 Amortization of intangibles from PPA 2 Assuming corporate tax rate of 28%
1
1 1 1,2
2
Sustainability Presentation – June 11, 2015 Oddo Securities 10th Environmental Forum EDMR – Equity and Debt Markets Relations
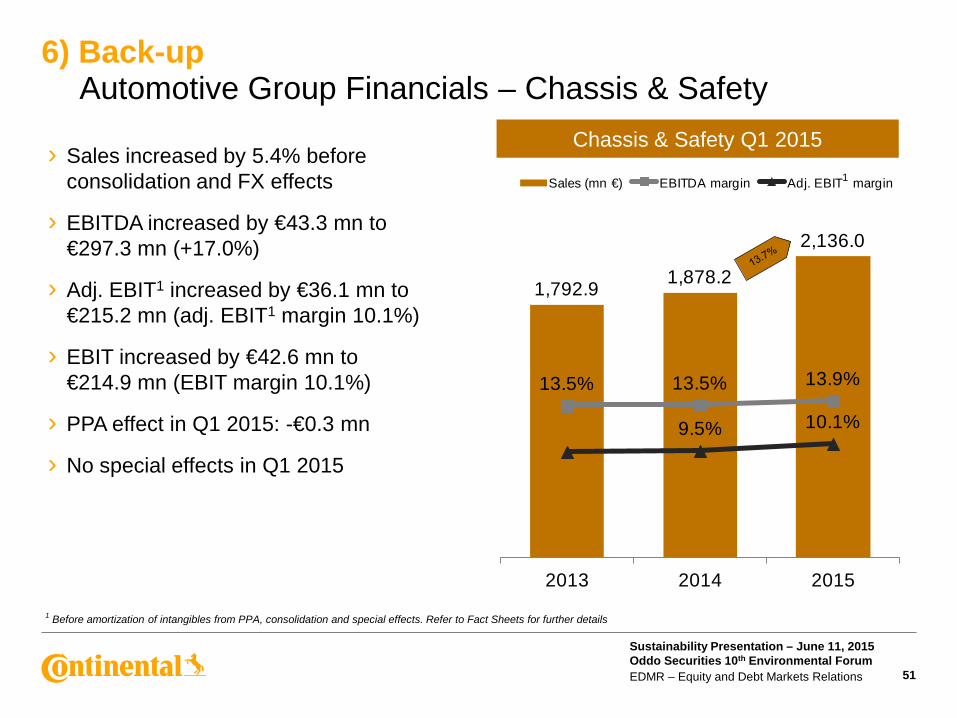
1,792.9 1,878.2
2,136.0
13.5% 13.5% 13.9%
9.5% 10.1%
2013 2014 2015
Sales (mn €) EBITDA margin Adj. EBIT margin
› Sales increased by 5.4% before consolidation and FX effects
› EBITDA increased by €43.3 mn to €297.3 mn (+17.0%)
› Adj. EBIT1 increased by €36.1 mn to €215.2 mn (adj. EBIT1 margin 10.1%)
› EBIT increased by €42.6 mn to €214.9 mn (EBIT margin 10.1%)
› PPA effect in Q1 2015: -€0.3 mn
› No special effects in Q1 2015
51
6) Back-up Automotive Group Financials – Chassis & Safety
1 Before amortization of intangibles from PPA, consolidation and special effects. Refer to Fact Sheets for further details
Chassis & Safety Q1 2015 1
Sustainability Presentation – June 11, 2015 Oddo Securities 10th Environmental Forum EDMR – Equity and Debt Markets Relations
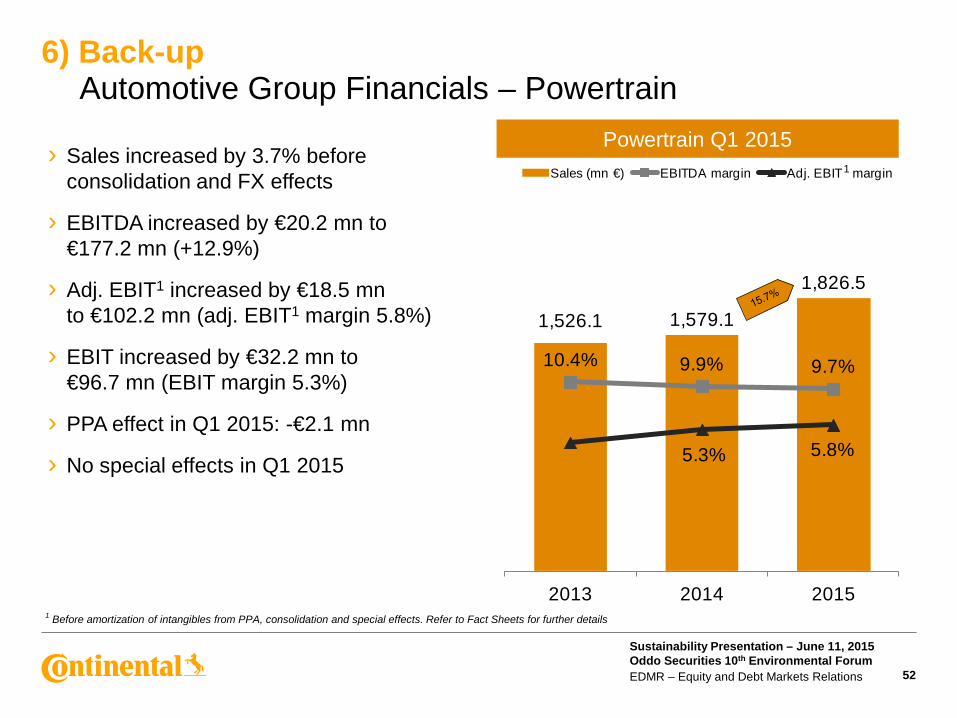
1,526.1 1,579.1
1,826.5
10.4% 9.9% 9.7%
5.3% 5.8%
2013 2014 2015
Sales (mn €) EBITDA margin Adj. EBIT margin› Sales increased by 3.7% before
consolidation and FX effects
› EBITDA increased by €20.2 mn to €177.2 mn (+12.9%)
› Adj. EBIT1 increased by €18.5 mn to €102.2 mn (adj. EBIT1 margin 5.8%)
› EBIT increased by €32.2 mn to €96.7 mn (EBIT margin 5.3%)
› PPA effect in Q1 2015: -€2.1 mn
› No special effects in Q1 2015
52
6) Back-up Automotive Group Financials – Powertrain
Powertrain Q1 2015 1
1 Before amortization of intangibles from PPA, consolidation and special effects. Refer to Fact Sheets for further details
Sustainability Presentation – June 11, 2015 Oddo Securities 10th Environmental Forum EDMR – Equity and Debt Markets Relations
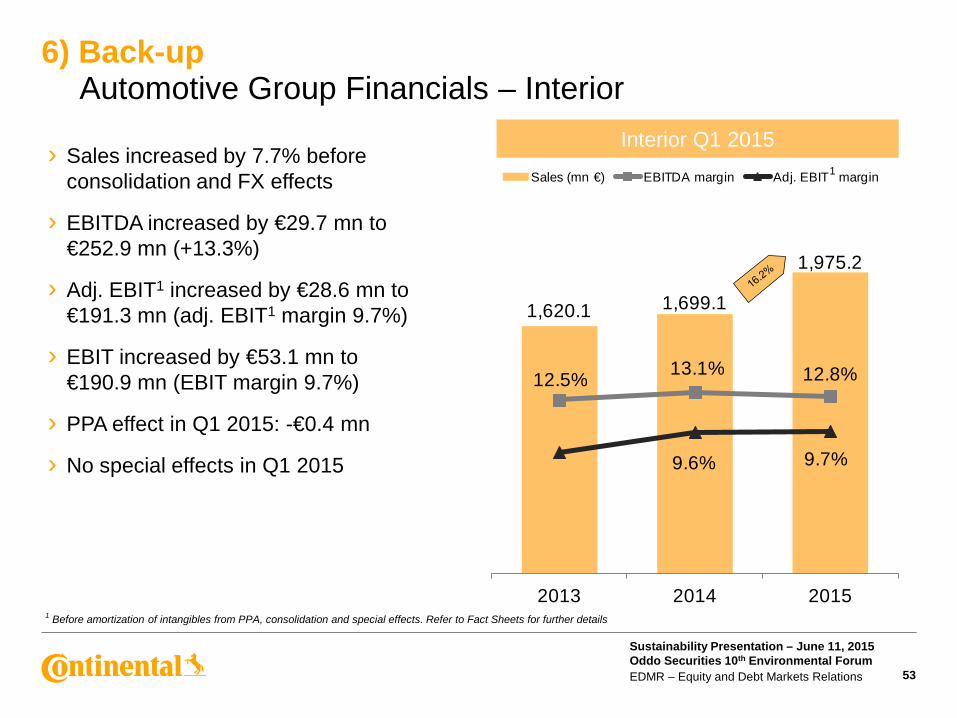
1,620.1 1,699.1
1,975.2
12.5% 13.1% 12.8%
9.6% 9.7%
2013 2014 2015
Sales (mn €) EBITDA margin Adj. EBIT margin› Sales increased by 7.7% before
consolidation and FX effects
› EBITDA increased by €29.7 mn to €252.9 mn (+13.3%)
› Adj. EBIT1 increased by €28.6 mn to €191.3 mn (adj. EBIT1 margin 9.7%)
› EBIT increased by €53.1 mn to €190.9 mn (EBIT margin 9.7%)
› PPA effect in Q1 2015: -€0.4 mn
› No special effects in Q1 2015
53
6) Back-up Automotive Group Financials – Interior
Interior Q1 2015 1
1 Before amortization of intangibles from PPA, consolidation and special effects. Refer to Fact Sheets for further details
Sustainability Presentation – June 11, 2015 Oddo Securities 10th Environmental Forum EDMR – Equity and Debt Markets Relations
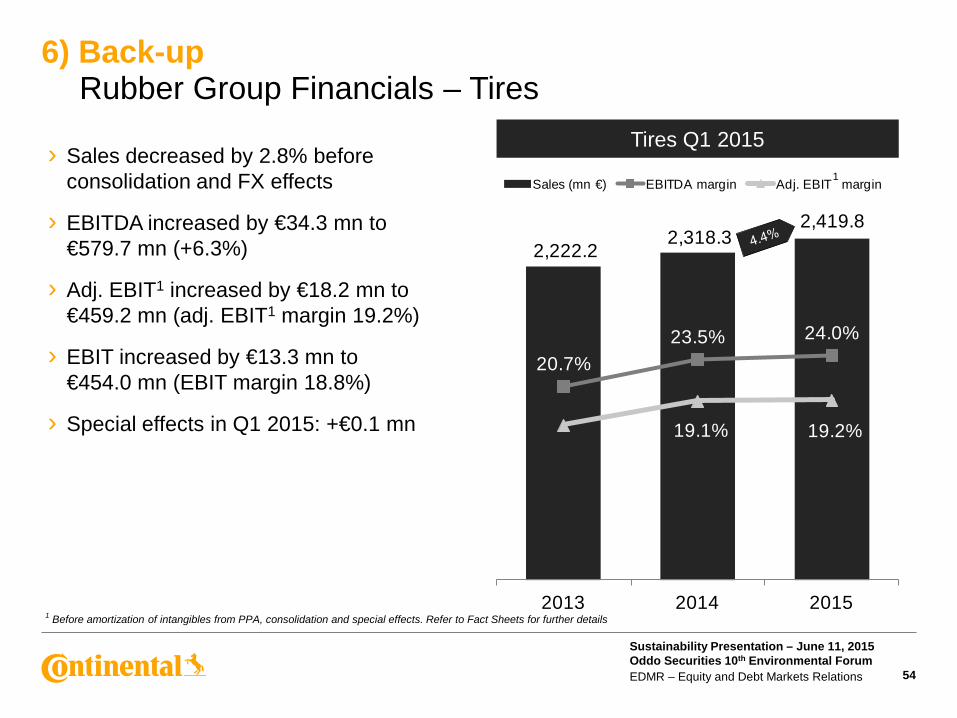
2,222.2 2,318.3
2,419.8
20.7%23.5% 24.0%
19.1% 19.2%
2013 2014 2015
Sales (mn €) EBITDA margin Adj. EBIT margin
› Sales decreased by 2.8% before consolidation and FX effects
› EBITDA increased by €34.3 mn to €579.7 mn (+6.3%)
› Adj. EBIT1 increased by €18.2 mn to €459.2 mn (adj. EBIT1 margin 19.2%)
› EBIT increased by €13.3 mn to €454.0 mn (EBIT margin 18.8%)
› Special effects in Q1 2015: +€0.1 mn
54
6) Back-up Rubber Group Financials – Tires
Tires Q1 2015 1
1 Before amortization of intangibles from PPA, consolidation and special effects. Refer to Fact Sheets for further details
Sustainability Presentation – June 11, 2015 Oddo Securities 10th Environmental Forum EDMR – Equity and Debt Markets Relations
-30%
-20%
-10%
0%
10%
20%
30%
Jan-
11A
pr-1
1Ju
l-11
Oct
-11
Jan-
12A
pr-1
2Ju
l-12
Oct
-12
Jan-
13A
pr-1
3Ju
l-13
Oct
-13
Jan-
14A
pr-1
4Ju
l-14
Oct
-14
Jan-
15
Truck tire replacement (YOY chg. monthly)
km BAG monthly (adj.)
-30%
-20%
-10%
0%
10%
20%
30%
Jan-
11A
pr-1
1Ju
l-11
Oct
-11
Jan-
12A
pr-1
2Ju
l-12
Oct
-12
Jan-
13A
pr-1
3Ju
l-13
Oct
-13
Jan-
14A
pr-1
4Ju
l-14
Oct
-14
Jan-
15
Truck tire replacement (YOY chg. monthly)
ATA monthly (adj.)
55
6) Back-up Tires – Commercial Vehicle Tire Demand
1 BAG = Bundesamt für Güterverkehr 2 ATA = American Trucking Association (miles traveled)
Replacement Tire Demand for Truck Tires Europe
Replacement Tire Demand for Truck Tires NAFTA
2 1
Sustainability Presentation – June 11, 2015 Oddo Securities 10th Environmental Forum EDMR – Equity and Debt Markets Relations
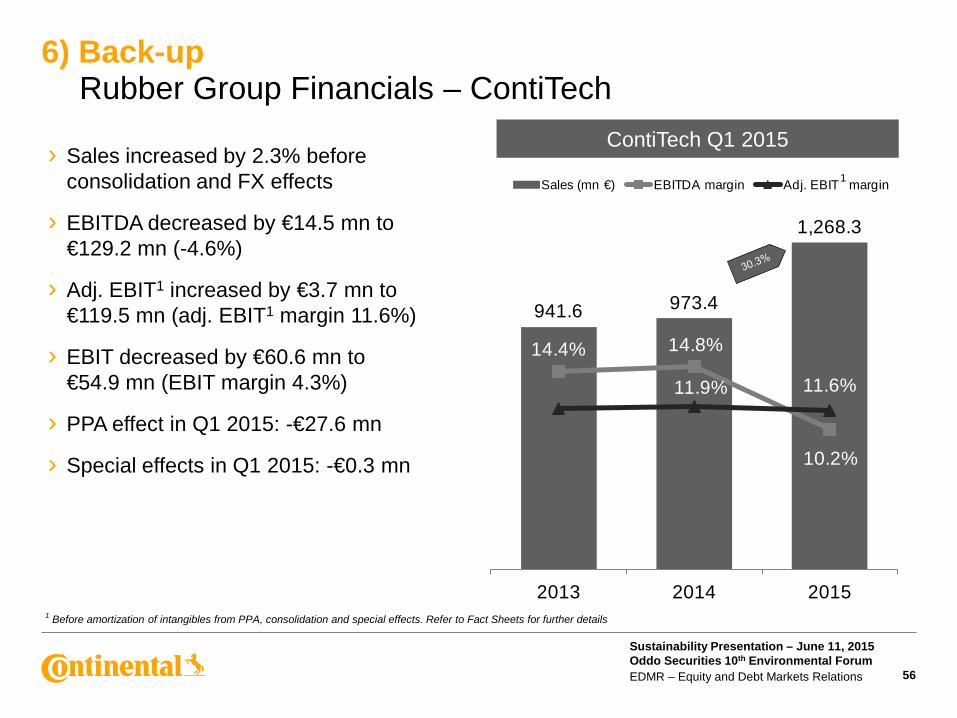
941.6 973.4
1,268.3
14.4% 14.8%
10.2%
11.9% 11.6%
2013 2014 2015
Sales (mn €) EBITDA margin Adj. EBIT margin
› Sales increased by 2.3% before consolidation and FX effects
› EBITDA decreased by €14.5 mn to €129.2 mn (-4.6%)
› Adj. EBIT1 increased by €3.7 mn to €119.5 mn (adj. EBIT1 margin 11.6%)
› EBIT decreased by €60.6 mn to €54.9 mn (EBIT margin 4.3%)
› PPA effect in Q1 2015: -€27.6 mn
› Special effects in Q1 2015: -€0.3 mn
56
6) Back-up Rubber Group Financials – ContiTech
ContiTech Q1 2015 1
1 Before amortization of intangibles from PPA, consolidation and special effects. Refer to Fact Sheets for further details
Sustainability Presentation – June 11, 2015 Oddo Securities 10th Environmental Forum EDMR – Equity and Debt Markets Relations 57
Fact Sheets 2013 – 2015
Sustainability Presentation – June 11, 2015 Oddo Securities 10th Environmental Forum EDMR – Equity and Debt Markets Relations 58
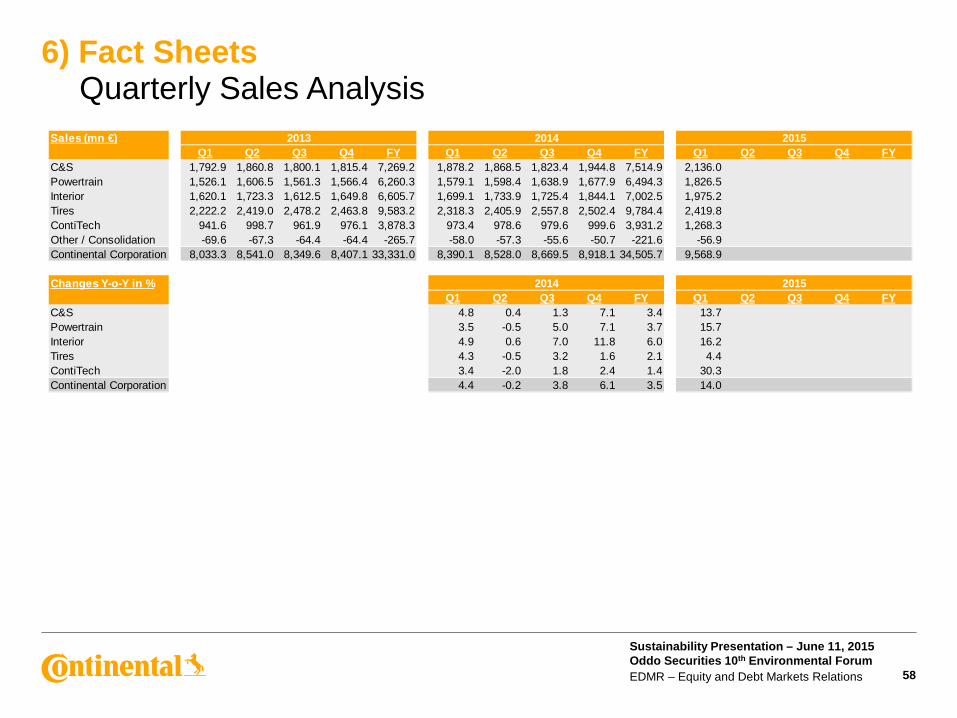
6) Fact Sheets Quarterly Sales Analysis
Sales (mn €)Q1 Q2 Q3 Q4 FY Q1 Q2 Q3 Q4 FY Q1 Q2 Q3 Q4 FY
C&S 1,792.9 1,860.8 1,800.1 1,815.4 7,269.2 1,878.2 1,868.5 1,823.4 1,944.8 7,514.9 2,136.0Powertrain 1,526.1 1,606.5 1,561.3 1,566.4 6,260.3 1,579.1 1,598.4 1,638.9 1,677.9 6,494.3 1,826.5Interior 1,620.1 1,723.3 1,612.5 1,649.8 6,605.7 1,699.1 1,733.9 1,725.4 1,844.1 7,002.5 1,975.2Tires 2,222.2 2,419.0 2,478.2 2,463.8 9,583.2 2,318.3 2,405.9 2,557.8 2,502.4 9,784.4 2,419.8ContiTech 941.6 998.7 961.9 976.1 3,878.3 973.4 978.6 979.6 999.6 3,931.2 1,268.3Other / Consolidation -69.6 -67.3 -64.4 -64.4 -265.7 -58.0 -57.3 -55.6 -50.7 -221.6 -56.9Continental Corporation 8,033.3 8,541.0 8,349.6 8,407.1 33,331.0 8,390.1 8,528.0 8,669.5 8,918.1 34,505.7 9,568.9
Changes Y-o-Y in %Q1 Q2 Q3 Q4 FY Q1 Q2 Q3 Q4 FY
C&S 4.8 0.4 1.3 7.1 3.4 13.7Powertrain 3.5 -0.5 5.0 7.1 3.7 15.7Interior 4.9 0.6 7.0 11.8 6.0 16.2Tires 4.3 -0.5 3.2 1.6 2.1 4.4ContiTech 3.4 -2.0 1.8 2.4 1.4 30.3Continental Corporation 4.4 -0.2 3.8 6.1 3.5 14.0
2015
2015
2013 2014
2014
Sustainability Presentation – June 11, 2015 Oddo Securities 10th Environmental Forum EDMR – Equity and Debt Markets Relations 59
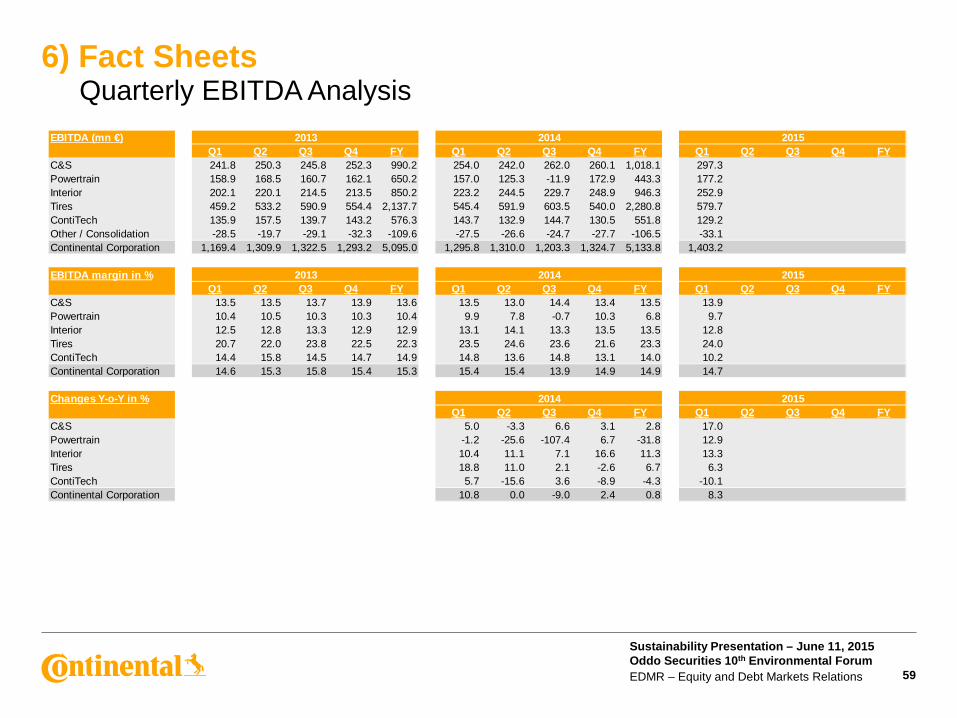
6) Fact Sheets Quarterly EBITDA Analysis
EBITDA (mn €)Q1 Q2 Q3 Q4 FY Q1 Q2 Q3 Q4 FY Q1 Q2 Q3 Q4 FY
C&S 241.8 250.3 245.8 252.3 990.2 254.0 242.0 262.0 260.1 1,018.1 297.3Powertrain 158.9 168.5 160.7 162.1 650.2 157.0 125.3 -11.9 172.9 443.3 177.2Interior 202.1 220.1 214.5 213.5 850.2 223.2 244.5 229.7 248.9 946.3 252.9Tires 459.2 533.2 590.9 554.4 2,137.7 545.4 591.9 603.5 540.0 2,280.8 579.7ContiTech 135.9 157.5 139.7 143.2 576.3 143.7 132.9 144.7 130.5 551.8 129.2Other / Consolidation -28.5 -19.7 -29.1 -32.3 -109.6 -27.5 -26.6 -24.7 -27.7 -106.5 -33.1Continental Corporation 1,169.4 1,309.9 1,322.5 1,293.2 5,095.0 1,295.8 1,310.0 1,203.3 1,324.7 5,133.8 1,403.2
EBITDA margin in %Q1 Q2 Q3 Q4 FY Q1 Q2 Q3 Q4 FY Q1 Q2 Q3 Q4 FY
C&S 13.5 13.5 13.7 13.9 13.6 13.5 13.0 14.4 13.4 13.5 13.9Powertrain 10.4 10.5 10.3 10.3 10.4 9.9 7.8 -0.7 10.3 6.8 9.7Interior 12.5 12.8 13.3 12.9 12.9 13.1 14.1 13.3 13.5 13.5 12.8Tires 20.7 22.0 23.8 22.5 22.3 23.5 24.6 23.6 21.6 23.3 24.0ContiTech 14.4 15.8 14.5 14.7 14.9 14.8 13.6 14.8 13.1 14.0 10.2Continental Corporation 14.6 15.3 15.8 15.4 15.3 15.4 15.4 13.9 14.9 14.9 14.7
Changes Y-o-Y in %Q1 Q2 Q3 Q4 FY Q1 Q2 Q3 Q4 FY
C&S 5.0 -3.3 6.6 3.1 2.8 17.0Powertrain -1.2 -25.6 -107.4 6.7 -31.8 12.9Interior 10.4 11.1 7.1 16.6 11.3 13.3Tires 18.8 11.0 2.1 -2.6 6.7 6.3ContiTech 5.7 -15.6 3.6 -8.9 -4.3 -10.1Continental Corporation 10.8 0.0 -9.0 2.4 0.8 8.3
2015
2015
20152014
2013 2014
2013 2014
Sustainability Presentation – June 11, 2015 Oddo Securities 10th Environmental Forum EDMR – Equity and Debt Markets Relations
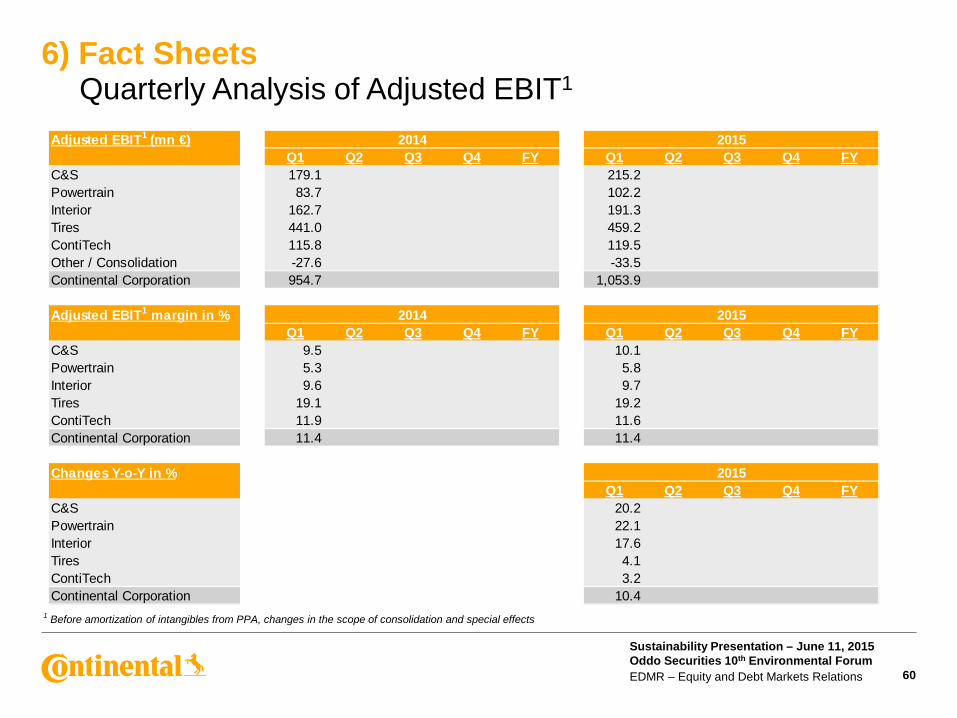
Adjusted EBIT1 (mn €)Q1 Q2 Q3 Q4 FY Q1 Q2 Q3 Q4 FY
C&S 179.1 215.2Powertrain 83.7 102.2Interior 162.7 191.3Tires 441.0 459.2ContiTech 115.8 119.5Other / Consolidation -27.6 -33.5Continental Corporation 954.7 1,053.9
Adjusted EBIT1 margin in %Q1 Q2 Q3 Q4 FY Q1 Q2 Q3 Q4 FY
C&S 9.5 10.1Powertrain 5.3 5.8Interior 9.6 9.7Tires 19.1 19.2ContiTech 11.9 11.6Continental Corporation 11.4 11.4
Changes Y-o-Y in %Q1 Q2 Q3 Q4 FY
C&S 20.2Powertrain 22.1Interior 17.6Tires 4.1ContiTech 3.2Continental Corporation 10.4
2014
2014
2015
2015
2015
60
6) Fact Sheets Quarterly Analysis of Adjusted EBIT1
1 Before amortization of intangibles from PPA, changes in the scope of consolidation and special effects
Sustainability Presentation – June 11, 2015 Oddo Securities 10th Environmental Forum EDMR – Equity and Debt Markets Relations 61
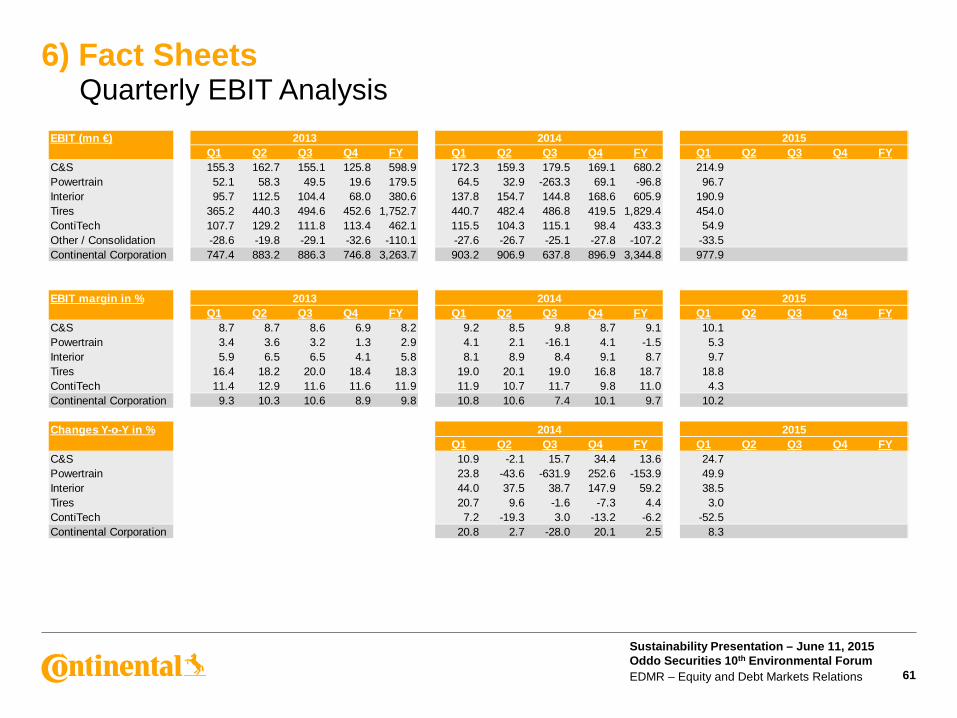
6) Fact Sheets Quarterly EBIT Analysis
EBIT (mn €)Q1 Q2 Q3 Q4 FY Q1 Q2 Q3 Q4 FY Q1 Q2 Q3 Q4 FY
C&S 155.3 162.7 155.1 125.8 598.9 172.3 159.3 179.5 169.1 680.2 214.9Powertrain 52.1 58.3 49.5 19.6 179.5 64.5 32.9 -263.3 69.1 -96.8 96.7Interior 95.7 112.5 104.4 68.0 380.6 137.8 154.7 144.8 168.6 605.9 190.9Tires 365.2 440.3 494.6 452.6 1,752.7 440.7 482.4 486.8 419.5 1,829.4 454.0ContiTech 107.7 129.2 111.8 113.4 462.1 115.5 104.3 115.1 98.4 433.3 54.9Other / Consolidation -28.6 -19.8 -29.1 -32.6 -110.1 -27.6 -26.7 -25.1 -27.8 -107.2 -33.5Continental Corporation 747.4 883.2 886.3 746.8 3,263.7 903.2 906.9 637.8 896.9 3,344.8 977.9
EBIT margin in %Q1 Q2 Q3 Q4 FY Q1 Q2 Q3 Q4 FY Q1 Q2 Q3 Q4 FY
C&S 8.7 8.7 8.6 6.9 8.2 9.2 8.5 9.8 8.7 9.1 10.1Powertrain 3.4 3.6 3.2 1.3 2.9 4.1 2.1 -16.1 4.1 -1.5 5.3Interior 5.9 6.5 6.5 4.1 5.8 8.1 8.9 8.4 9.1 8.7 9.7Tires 16.4 18.2 20.0 18.4 18.3 19.0 20.1 19.0 16.8 18.7 18.8ContiTech 11.4 12.9 11.6 11.6 11.9 11.9 10.7 11.7 9.8 11.0 4.3Continental Corporation 9.3 10.3 10.6 8.9 9.8 10.8 10.6 7.4 10.1 9.7 10.2
Changes Y-o-Y in %Q1 Q2 Q3 Q4 FY Q1 Q2 Q3 Q4 FY
C&S 10.9 -2.1 15.7 34.4 13.6 24.7Powertrain 23.8 -43.6 -631.9 252.6 -153.9 49.9Interior 44.0 37.5 38.7 147.9 59.2 38.5Tires 20.7 9.6 -1.6 -7.3 4.4 3.0ContiTech 7.2 -19.3 3.0 -13.2 -6.2 -52.5Continental Corporation 20.8 2.7 -28.0 20.1 2.5 8.3
2015
2015
20152014
2013 2014
2013 2014
Sustainability Presentation – June 11, 2015 Oddo Securities 10th Environmental Forum EDMR – Equity and Debt Markets Relations 62
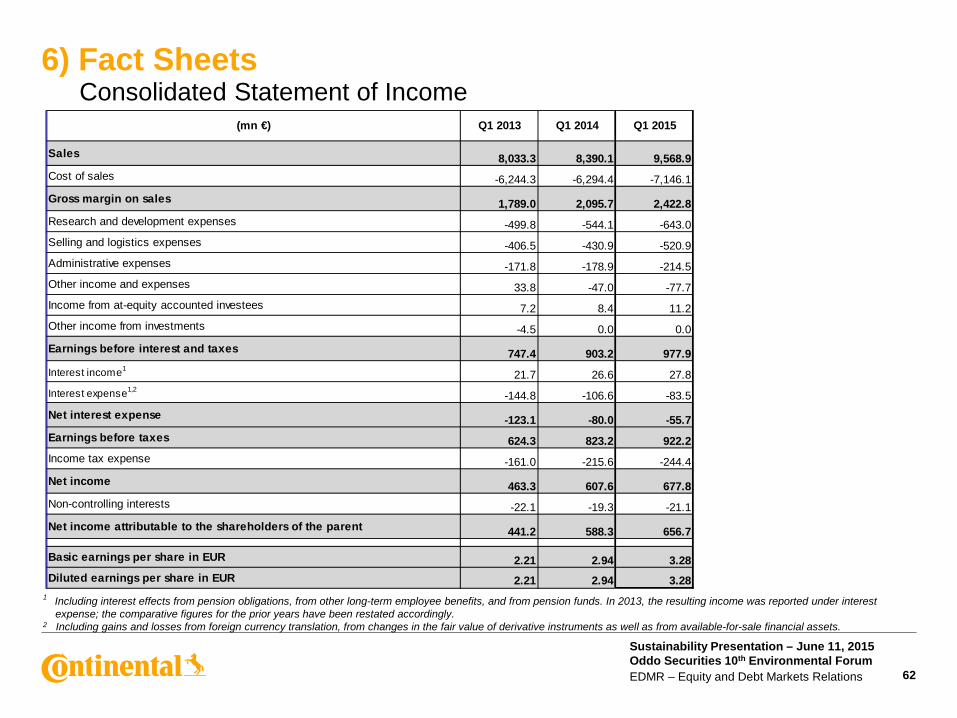
6) Fact Sheets Consolidated Statement of Income
1 Including interest effects from pension obligations, from other long-term employee benefits, and from pension funds. In 2013, the resulting income was reported under interest expense; the comparative figures for the prior years have been restated accordingly.
2 Including gains and losses from foreign currency translation, from changes in the fair value of derivative instruments as well as from available-for-sale financial assets.
Sales 8,033.3 8,390.1 9,568.9Cost of sales -6,244.3 -6,294.4 -7,146.1
Gross margin on sales 1,789.0 2,095.7 2,422.8Research and development expenses -499.8 -544.1 -643.0Selling and logistics expenses -406.5 -430.9 -520.9Administrative expenses -171.8 -178.9 -214.5Other income and expenses 33.8 -47.0 -77.7Income from at-equity accounted investees 7.2 8.4 11.2Other income from investments -4.5 0.0 0.0
Earnings before interest and taxes 747.4 903.2 977.9Interest income1
21.7 26.6 27.8Interest expense1,2
-144.8 -106.6 -83.5
Net interest expense -123.1 -80.0 -55.7Earnings before taxes 624.3 823.2 922.2Income tax expense -161.0 -215.6 -244.4
Net income 463.3 607.6 677.8Non-controlling interests -22.1 -19.3 -21.1
Net income attributable to the shareholders of the parent 441.2 588.3 656.7
Basic earnings per share in EUR 2.21 2.94 3.28Diluted earnings per share in EUR 2.21 2.94 3.28
(mn €) Q1 2015Q1 2014Q1 2013
Sustainability Presentation – June 11, 2015 Oddo Securities 10th Environmental Forum EDMR – Equity and Debt Markets Relations 63
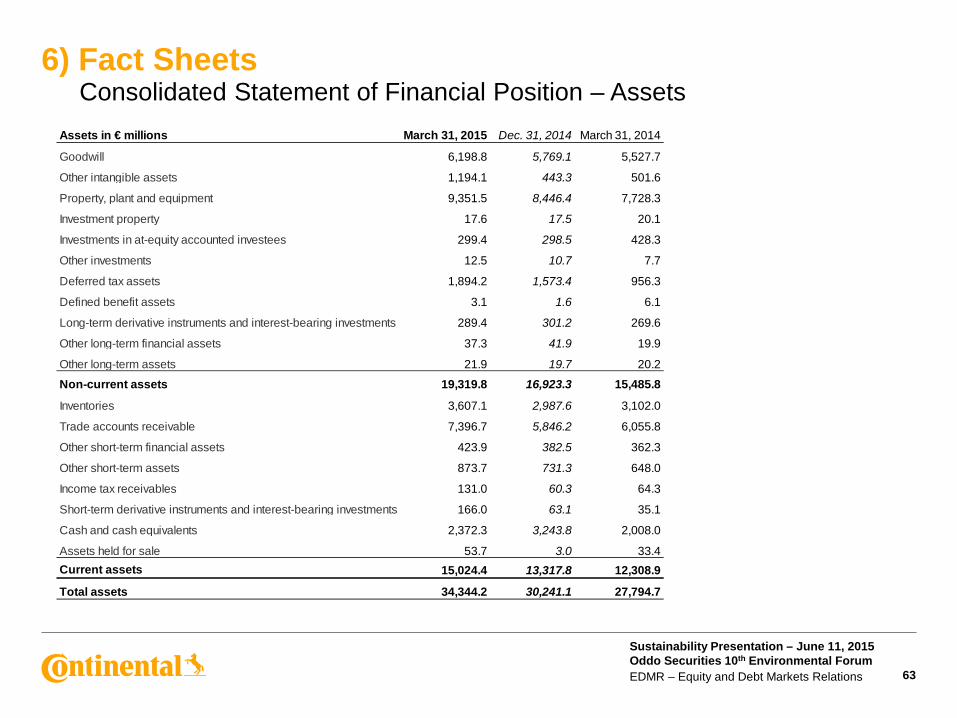
6) Fact Sheets Consolidated Statement of Financial Position – Assets
Assets in € millions March 31, 2015 Dec. 31, 2014 March 31, 2014
Goodwill 6,198.8 5,769.1 5,527.7
Other intangible assets 1,194.1 443.3 501.6
Property, plant and equipment 9,351.5 8,446.4 7,728.3
Investment property 17.6 17.5 20.1
Investments in at-equity accounted investees 299.4 298.5 428.3
Other investments 12.5 10.7 7.7
Deferred tax assets 1,894.2 1,573.4 956.3
Defined benefit assets 3.1 1.6 6.1
Long-term derivative instruments and interest-bearing investments 289.4 301.2 269.6
Other long-term financial assets 37.3 41.9 19.9
Other long-term assets 21.9 19.7 20.2
Non-current assets 19,319.8 16,923.3 15,485.8
Inventories 3,607.1 2,987.6 3,102.0
Trade accounts receivable 7,396.7 5,846.2 6,055.8
Other short-term financial assets 423.9 382.5 362.3
Other short-term assets 873.7 731.3 648.0
Income tax receivables 131.0 60.3 64.3
Short-term derivative instruments and interest-bearing investments 166.0 63.1 35.1
Cash and cash equivalents 2,372.3 3,243.8 2,008.0
Assets held for sale 53.7 3.0 33.4Current assets 15,024.4 13,317.8 12,308.9
Total assets 34,344.2 30,241.1 27,794.7
Sustainability Presentation – June 11, 2015 Oddo Securities 10th Environmental Forum EDMR – Equity and Debt Markets Relations 64
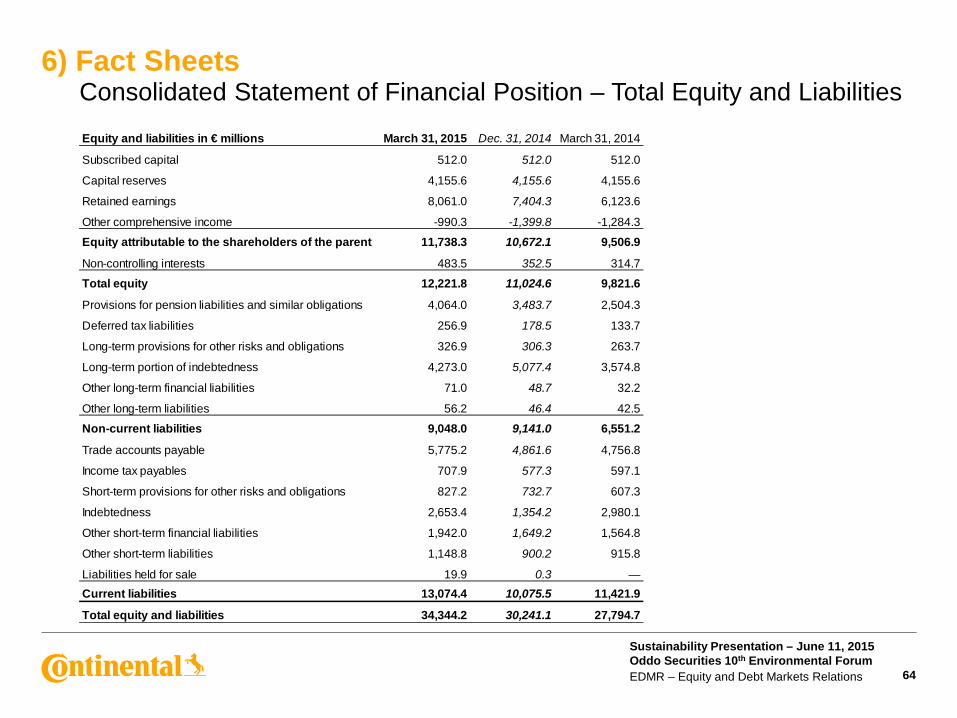
6) Fact Sheets Consolidated Statement of Financial Position – Total Equity and Liabilities Equity and liabilities in € millions March 31, 2015 Dec. 31, 2014 March 31, 2014
Subscribed capital 512.0 512.0 512.0
Capital reserves 4,155.6 4,155.6 4,155.6
Retained earnings 8,061.0 7,404.3 6,123.6
Other comprehensive income -990.3 -1,399.8 -1,284.3
Equity attributable to the shareholders of the parent 11,738.3 10,672.1 9,506.9
Non-controlling interests 483.5 352.5 314.7
Total equity 12,221.8 11,024.6 9,821.6
Provisions for pension liabilities and similar obligations 4,064.0 3,483.7 2,504.3
Deferred tax liabilities 256.9 178.5 133.7
Long-term provisions for other risks and obligations 326.9 306.3 263.7
Long-term portion of indebtedness 4,273.0 5,077.4 3,574.8
Other long-term financial liabilities 71.0 48.7 32.2
Other long-term liabilities 56.2 46.4 42.5
Non-current liabilities 9,048.0 9,141.0 6,551.2
Trade accounts payable 5,775.2 4,861.6 4,756.8
Income tax payables 707.9 577.3 597.1
Short-term provisions for other risks and obligations 827.2 732.7 607.3
Indebtedness 2,653.4 1,354.2 2,980.1
Other short-term financial liabilities 1,942.0 1,649.2 1,564.8
Other short-term liabilities 1,148.8 900.2 915.8
Liabilities held for sale 19.9 0.3 —Current liabilities 13,074.4 10,075.5 11,421.9
Total equity and liabilities 34,344.2 30,241.1 27,794.7
Sustainability Presentation – June 11, 2015 Oddo Securities 10th Environmental Forum EDMR – Equity and Debt Markets Relations 65
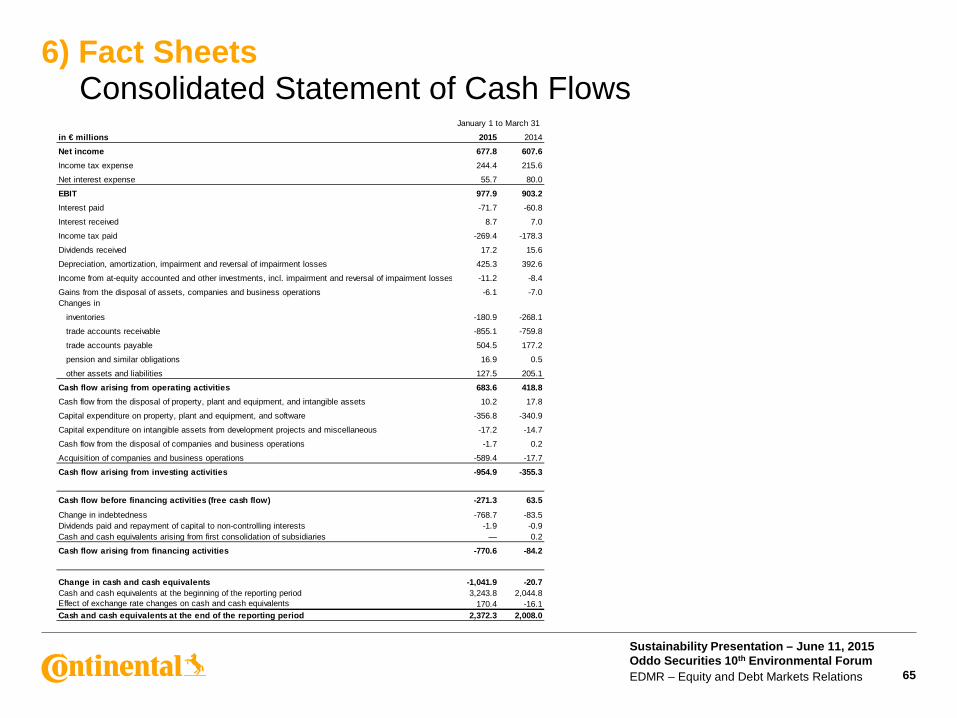
6) Fact Sheets Consolidated Statement of Cash Flows
in € millions 2015 2014
Net income 677.8 607.6Income tax expense 244.4 215.6
Net interest expense 55.7 80.0
EBIT 977.9 903.2Interest paid -71.7 -60.8
Interest received 8.7 7.0
Income tax paid -269.4 -178.3
Dividends received 17.2 15.6
Depreciation, amortization, impairment and reversal of impairment losses 425.3 392.6
Income from at-equity accounted and other investments, incl. impairment and reversal of impairment losses -11.2 -8.4
Gains from the disposal of assets, companies and business operations -6.1 -7.0Changes in
inventories -180.9 -268.1
trade accounts receivable -855.1 -759.8
trade accounts payable 504.5 177.2
pension and similar obligations 16.9 0.5
other assets and liabilities 127.5 205.1
Cash flow arising from operating activities 683.6 418.8Cash flow from the disposal of property, plant and equipment, and intangible assets 10.2 17.8
Capital expenditure on property, plant and equipment, and software -356.8 -340.9
Capital expenditure on intangible assets from development projects and miscellaneous -17.2 -14.7
Cash flow from the disposal of companies and business operations -1.7 0.2
Acquisition of companies and business operations -589.4 -17.7
Cash flow arising from investing activities -954.9 -355.3
Cash flow before financing activities (free cash flow) -271.3 63.5
Change in indebtedness -768.7 -83.5Dividends paid and repayment of capital to non-controlling interests -1.9 -0.9Cash and cash equivalents arising from first consolidation of subsidiaries — 0.2
Cash flow arising from financing activities -770.6 -84.2
Change in cash and cash equivalents -1,041.9 -20.7Cash and cash equivalents at the beginning of the reporting period 3,243.8 2,044.8Effect of exchange rate changes on cash and cash equivalents 170.4 -16.1Cash and cash equivalents at the end of the reporting period 2,372.3 2,008.0
January 1 to March 31
Sustainability Presentation – June 11, 2015 Oddo Securities 10th Environmental Forum EDMR – Equity and Debt Markets Relations 66
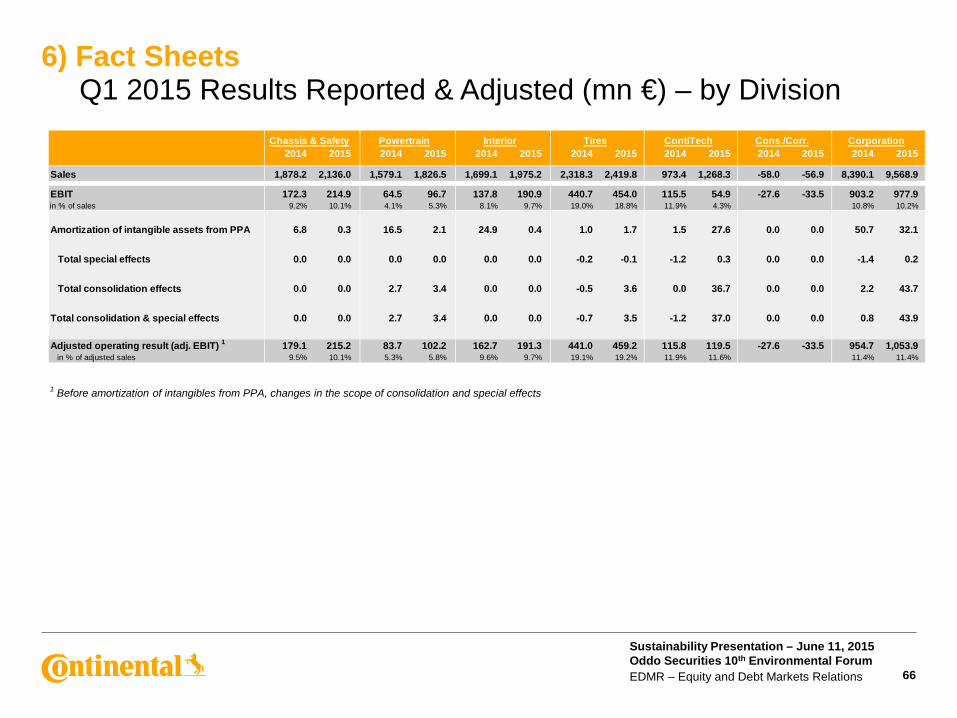
6) Fact Sheets Q1 2015 Results Reported & Adjusted (mn €) – by Division
1 Before amortization of intangibles from PPA, changes in the scope of consolidation and special effects
2014 2015 2014 2015 2014 2015 2014 2015 2014 2015 2014 2015 2014 2015
Sales 1,878.2 2,136.0 1,579.1 1,826.5 1,699.1 1,975.2 2,318.3 2,419.8 973.4 1,268.3 -58.0 -56.9 8,390.1 9,568.9
EBIT 172.3 214.9 64.5 96.7 137.8 190.9 440.7 454.0 115.5 54.9 -27.6 -33.5 903.2 977.9in % of sales 9.2% 10.1% 4.1% 5.3% 8.1% 9.7% 19.0% 18.8% 11.9% 4.3% 10.8% 10.2%
Amortization of intangible assets from PPA 6.8 0.3 16.5 2.1 24.9 0.4 1.0 1.7 1.5 27.6 0.0 0.0 50.7 32.1
Total special effects 0.0 0.0 0.0 0.0 0.0 0.0 -0.2 -0.1 -1.2 0.3 0.0 0.0 -1.4 0.2
Total consolidation effects 0.0 0.0 2.7 3.4 0.0 0.0 -0.5 3.6 0.0 36.7 0.0 0.0 2.2 43.7
Total consolidation & special effects 0.0 0.0 2.7 3.4 0.0 0.0 -0.7 3.5 -1.2 37.0 0.0 0.0 0.8 43.9
Adjusted operating result (adj. EBIT) 1 179.1 215.2 83.7 102.2 162.7 191.3 441.0 459.2 115.8 119.5 -27.6 -33.5 954.7 1,053.9in % of adjusted sales 9.5% 10.1% 5.3% 5.8% 9.6% 9.7% 19.1% 19.2% 11.9% 11.6% 11.4% 11.4%
CorporationInteriorChassis & Safety Powertrain Tires ContiTech Cons./Corr.
Sustainability Presentation – June 11, 2015 Oddo Securities 10th Environmental Forum EDMR – Equity and Debt Markets Relations 67
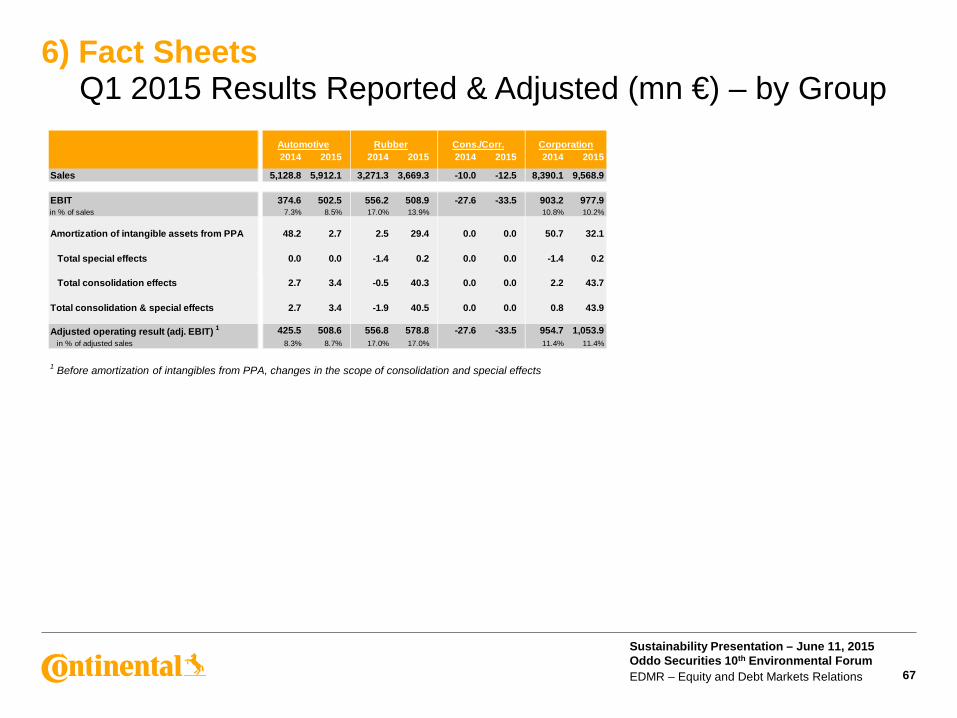
6) Fact Sheets Q1 2015 Results Reported & Adjusted (mn €) – by Group
1 Before amortization of intangibles from PPA, changes in the scope of consolidation and special effects
2014 2015 2014 2015 2014 2015 2014 2015
Sales 5,128.8 5,912.1 3,271.3 3,669.3 -10.0 -12.5 8,390.1 9,568.9
EBIT 374.6 502.5 556.2 508.9 -27.6 -33.5 903.2 977.9in % of sales 7.3% 8.5% 17.0% 13.9% 10.8% 10.2%
Amortization of intangible assets from PPA 48.2 2.7 2.5 29.4 0.0 0.0 50.7 32.1
Total special effects 0.0 0.0 -1.4 0.2 0.0 0.0 -1.4 0.2
Total consolidation effects 2.7 3.4 -0.5 40.3 0.0 0.0 2.2 43.7
Total consolidation & special effects 2.7 3.4 -1.9 40.5 0.0 0.0 0.8 43.9
Adjusted operating result (adj. EBIT) 1 425.5 508.6 556.8 578.8 -27.6 -33.5 954.7 1,053.9in % of adjusted sales 8.3% 8.7% 17.0% 17.0% 11.4% 11.4%
Automotive Rubber Cons./Corr. Corporation
Sustainability Presentation – June 11, 2015 Oddo Securities 10th Environmental Forum EDMR – Equity and Debt Markets Relations 68
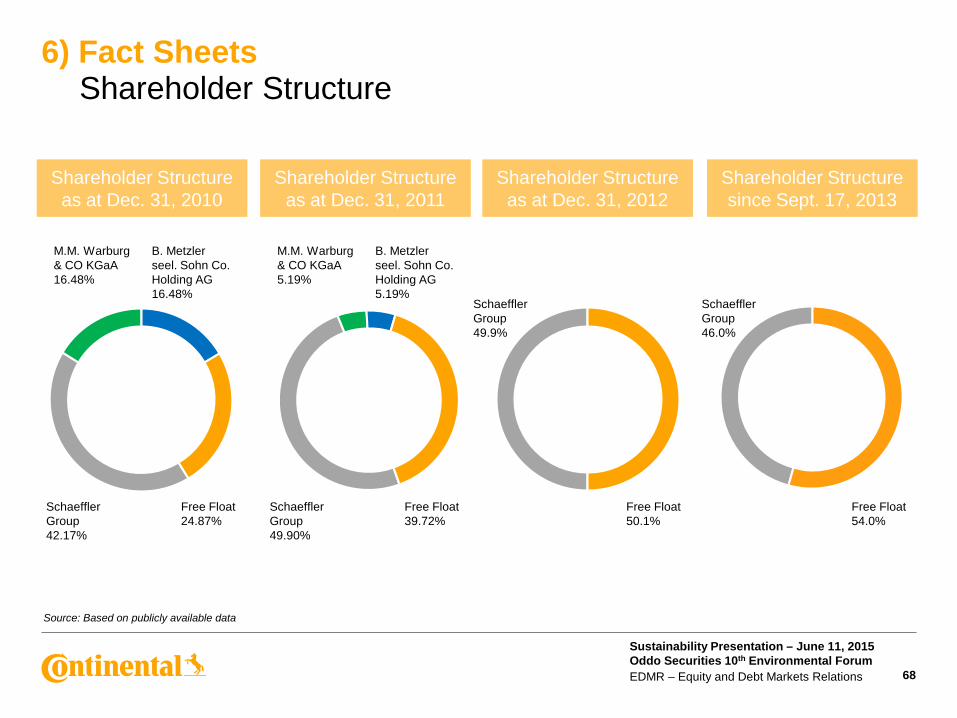
6) Fact Sheets Shareholder Structure
Source: Based on publicly available data
Shareholder Structure as at Dec. 31, 2010
Shareholder Structure as at Dec. 31, 2011
Shareholder Structure as at Dec. 31, 2012
Shareholder Structure since Sept. 17, 2013
M.M. Warburg & CO KGaA 16.48%
M.M. Warburg & CO KGaA 5.19%
B. Metzler seel. Sohn Co. Holding AG 16.48%
B. Metzler seel. Sohn Co. Holding AG 5.19%
Schaeffler Group 42.17%
Schaeffler Group 49.90%
Schaeffler Group 49.9%
Schaeffler Group 46.0%
Free Float 39.72%
Free Float 50.1%
Free Float 54.0%
Free Float 24.87%
Sustainability Presentation – June 11, 2015 Oddo Securities 10th Environmental Forum EDMR – Equity and Debt Markets Relations 69
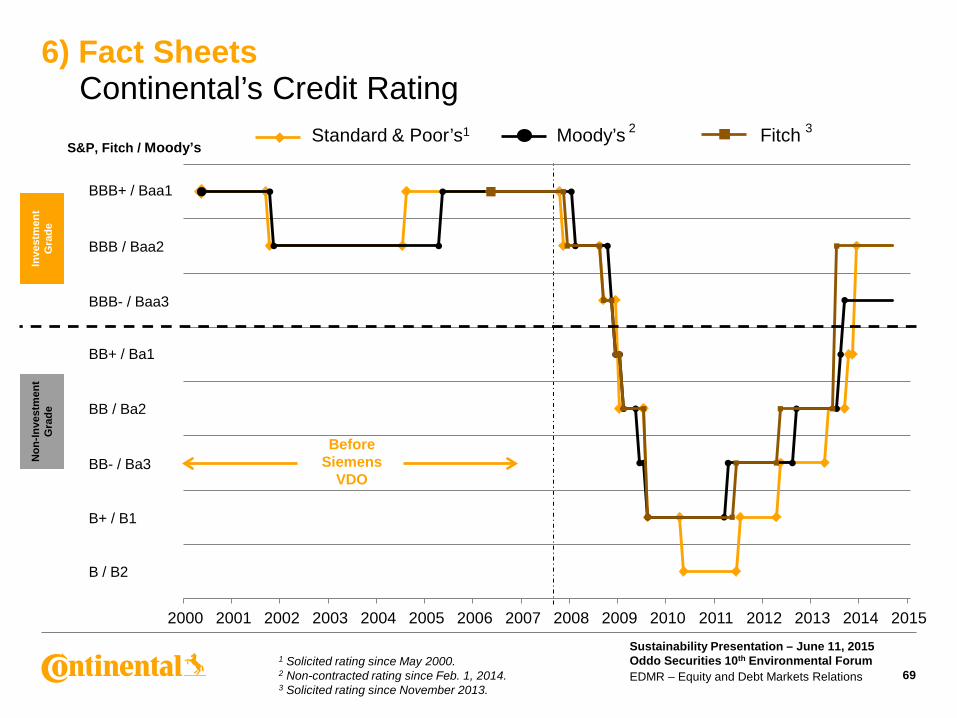
6) Fact Sheets Continental’s Credit Rating
2000 2001 2002 2003 2004 2005 2006 2007 2008 2009 2010 2011 2012 2013 2014 2015
BBB+ / Baa1
BBB / Baa2
BBB- / Baa3
BB+ / Ba1
BB / Ba2
BB- / Ba3
B+ / B1
B / B2
S&P, Fitch / Moody’s Standard & Poor’s1 Moody’s 2 Fitch 3
Before Siemens
VDO
Non
-Inve
stm
ent
Gra
de
Inve
stm
ent
Gra
de
1 Solicited rating since May 2000. 2 Non-contracted rating since Feb. 1, 2014. 3 Solicited rating since November 2013.
Sustainability Presentation – June 11, 2015 Oddo Securities 10th Environmental Forum EDMR – Equity and Debt Markets Relations
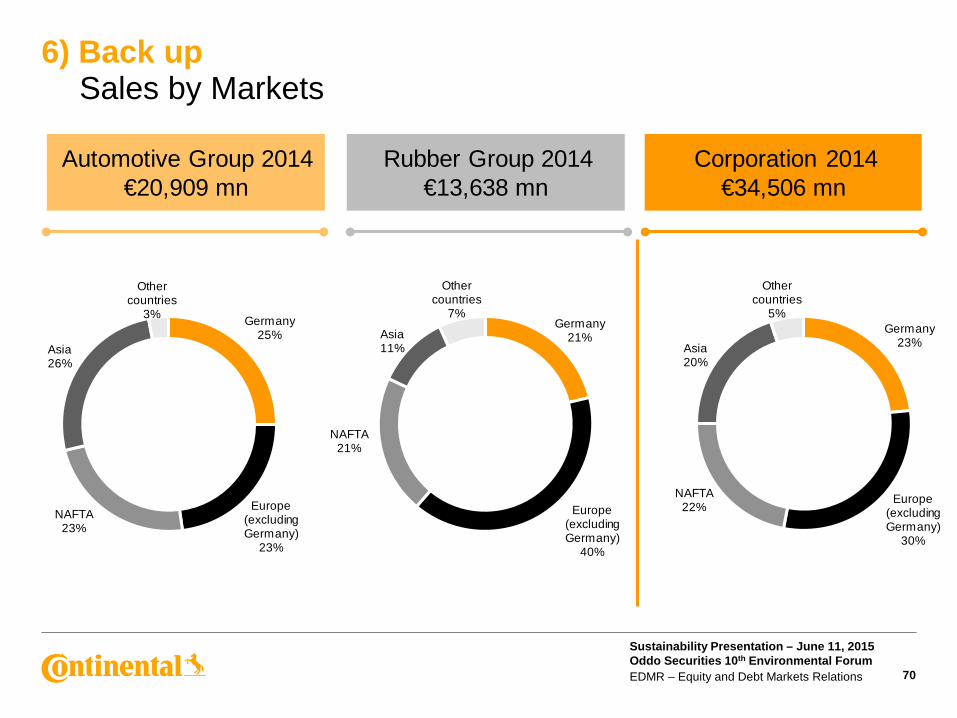
Automotive Group 2014€20,909 mn
Rubber Group 2014€13,638 mn
Corporation 2014€34,506 mn
Germany25%
Europe(excluding Germany)
23%
NAFTA23%
Asia26%
Other countries
3%Germany
21%
Europe(excluding Germany)
40%
NAFTA21%
Asia11%
Other countries
7%Germany
23%
Europe(excluding Germany)
30%
NAFTA22%
Asia20%
Other countries
5%
6) Back up Sales by Markets
70
Sustainability Presentation – June 11, 2015 Oddo Securities 10th Environmental Forum EDMR – Equity and Debt Markets Relations
6) Back up Continental
71
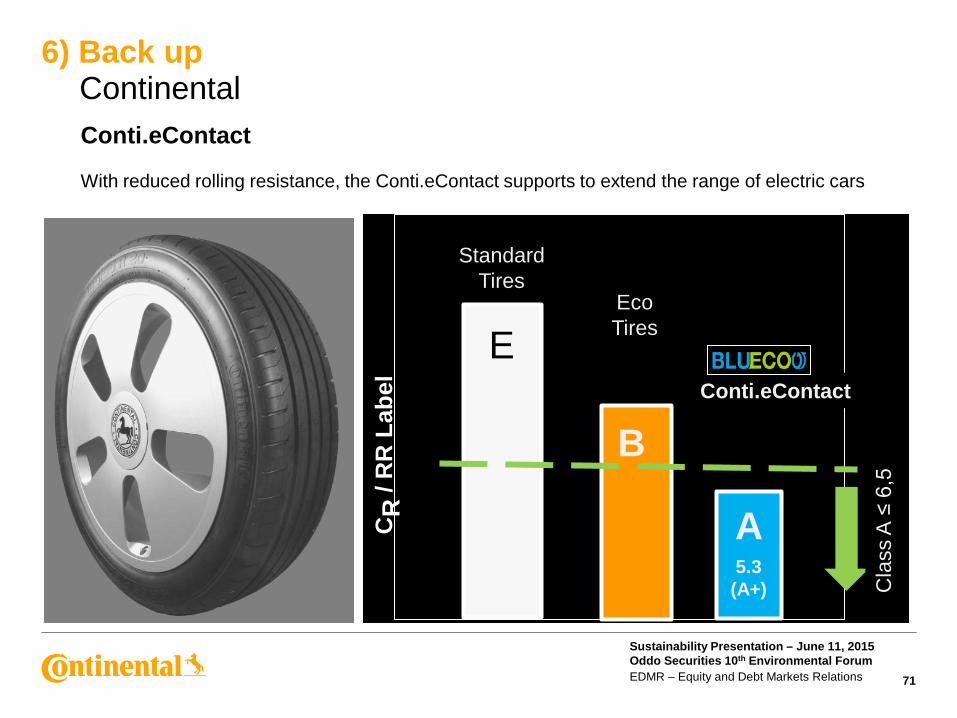
CR
/ R
R L
abel
Standard Tires
Eco Tires
Conti.eContact
Cla
ss A
≤ 6
,5
5.3 (A+)
B
E
Conti.eContact With reduced rolling resistance, the Conti.eContact supports to extend the range of electric cars
A
Sustainability Presentation – June 11, 2015 Oddo Securities 10th Environmental Forum EDMR – Equity and Debt Markets Relations 72
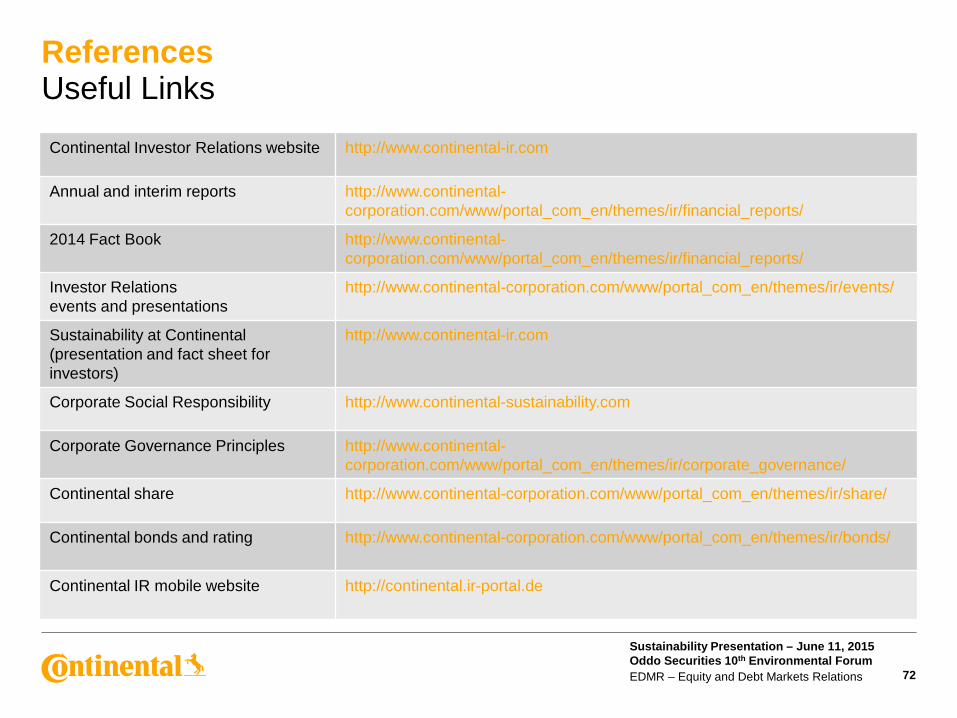
References Useful Links
Continental Investor Relations website http://www.continental-ir.com
Annual and interim reports http://www.continental-corporation.com/www/portal_com_en/themes/ir/financial_reports/
2014 Fact Book http://www.continental-corporation.com/www/portal_com_en/themes/ir/financial_reports/
Investor Relations events and presentations
http://www.continental-corporation.com/www/portal_com_en/themes/ir/events/
Sustainability at Continental (presentation and fact sheet for investors)
http://www.continental-ir.com
Corporate Social Responsibility http://www.continental-sustainability.com
Corporate Governance Principles http://www.continental-corporation.com/www/portal_com_en/themes/ir/corporate_governance/
Continental share http://www.continental-corporation.com/www/portal_com_en/themes/ir/share/
Continental bonds and rating http://www.continental-corporation.com/www/portal_com_en/themes/ir/bonds/
Continental IR mobile website http://continental.ir-portal.de