Embed Size (px)
Citation preview
Cover page
Title: MONITORING OF TEMPORARY CABLES IN “INFANTE D. HENRIQUE” BRIDGE Authors: António Adão da Fonseca
Renato Bastos Álvaro Cunha
Elsa Caetano
ABSTRACT
A new arch bridge under construction in Portugal is presented. The extreme shallowness and flexibility of the arch implies great complexity of construction and requires a very complete control of geometry, deformations and forces. The paper describes the main features of the implemented monitoring systems, discussing the control of the cable forces.
INFANTE D. HENRIQUE BRIDGE
This bridge is fast approaching the day it will be open to traffic linking the cities of Porto and Gaia, and it will be named after the Portuguese Infante D. Henrique, no doubt one of the most remarkable sons of Portugal, for he has lead the European adventure of meeting other civilisations around the Globe.
The “design and built” international competition for the construction of the bridge was won by the consortium of contractors EDIFER – Construções, SA and NECSO – Entrecanales y Cubiertas, SA. The bridge was conceived and designed under the leadership of António Adão da Fonseca, of AFA - Consultores de Engenharia, SA and of José Antonio Fernández Ordóñez and Francisco Millanes Mato, of IDEAM, SA. A bridge inspired in Maillart's works-of-art, with an extremely shallow and thin arch “flying” 280 m over the Douro river with a rise of 25 m, at the height of almost 75 m and in the vicinity of the well-known bridges of Eiffel, Seyrig and Cardoso.
The structure is made up of plans only, with no curved elements. No ornament is added to the bridge. Every element fulfils a functional and structural role. The arch is 1.5 m thick and it is stabilised by a prestressed concrete box beam deck 4.5 m high. _____________ António Adão da Fonseca, Civil Engineer at “AFA – Consultores de Engenharia, SA”, and
Full Professor at “Faculdade de Engenharia do Porto”, Portugal [email protected]
Renato Bastos, Civil Engineer at “AFA – Consultores de Engenharia, SA” [email protected]
Álvaro Cunha, Civil Engineer and Associate Professor at “Faculdade de Engenharia do Porto”, Portugal – [email protected]
Elsa Caetano, Civil Engineer and Assistant Professor at “Faculdade de Engenharia do Porto”, Portugal – [email protected]
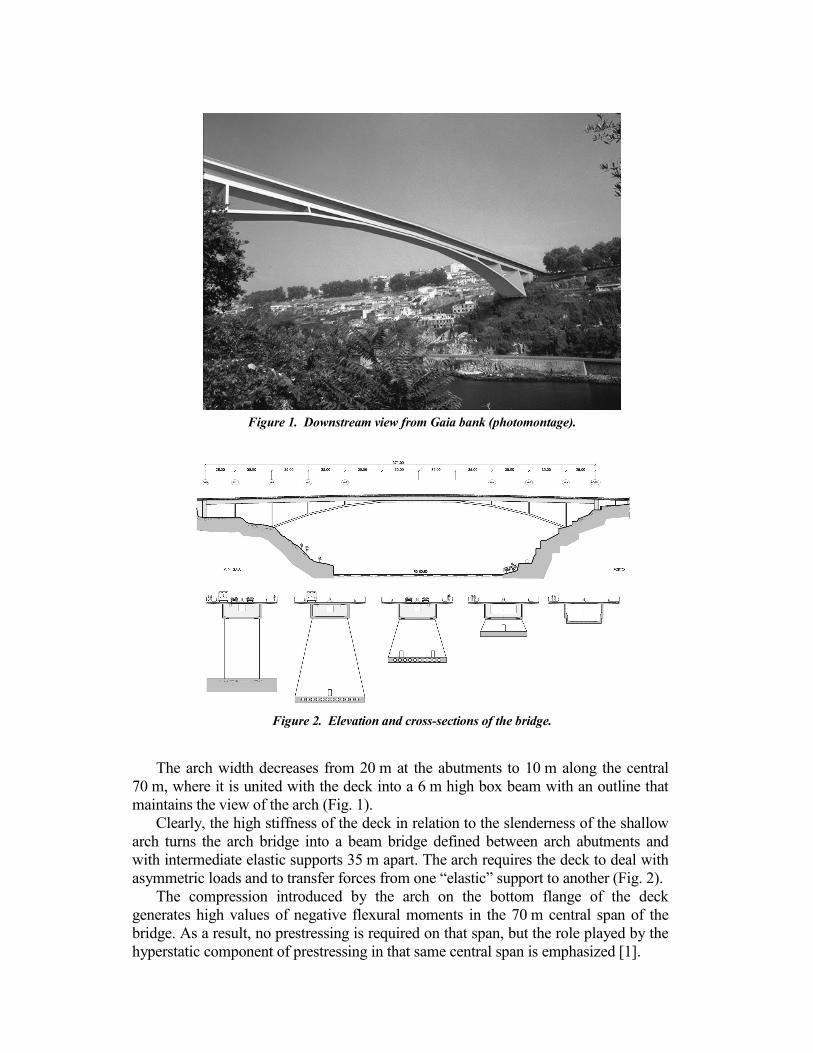
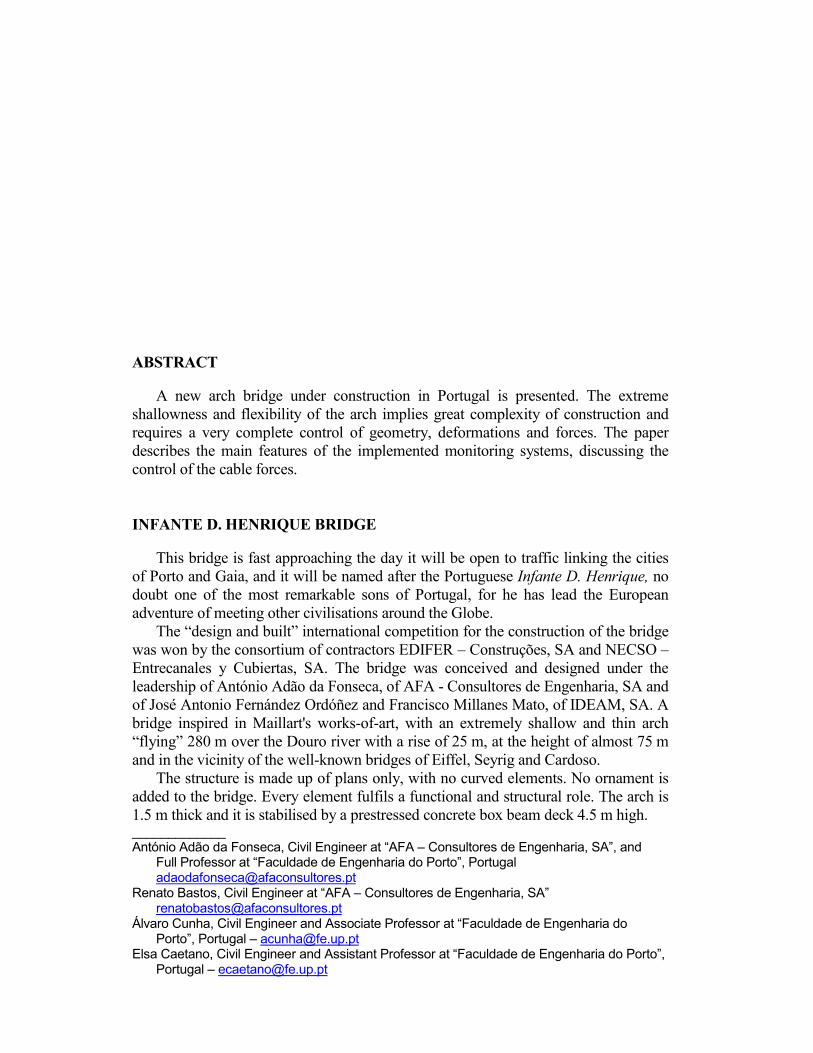
Figure 1. Downstream view from Gaia bank (photomontage).
Figure 2. Elevation and cross-sections of the bridge.
The arch width decreases from 20 m at the abutments to 10 m along the central 70 m, where it is united with the deck into a 6 m high box beam with an outline that maintains the view of the arch (Fig. 1).
Clearly, the high stiffness of the deck in relation to the slenderness of the shallow arch turns the arch bridge into a beam bridge defined between arch abutments and with intermediate elastic supports 35 m apart. The arch requires the deck to deal with asymmetric loads and to transfer forces from one “elastic” support to another (Fig. 2).
The compression introduced by the arch on the bottom flange of the deck generates high values of negative flexural moments in the 70 m central span of the bridge. As a result, no prestressing is required on that span, but the role played by the hyperstatic component of prestressing in that same central span is emphasized [1].
CONSTRUCTION METHOD
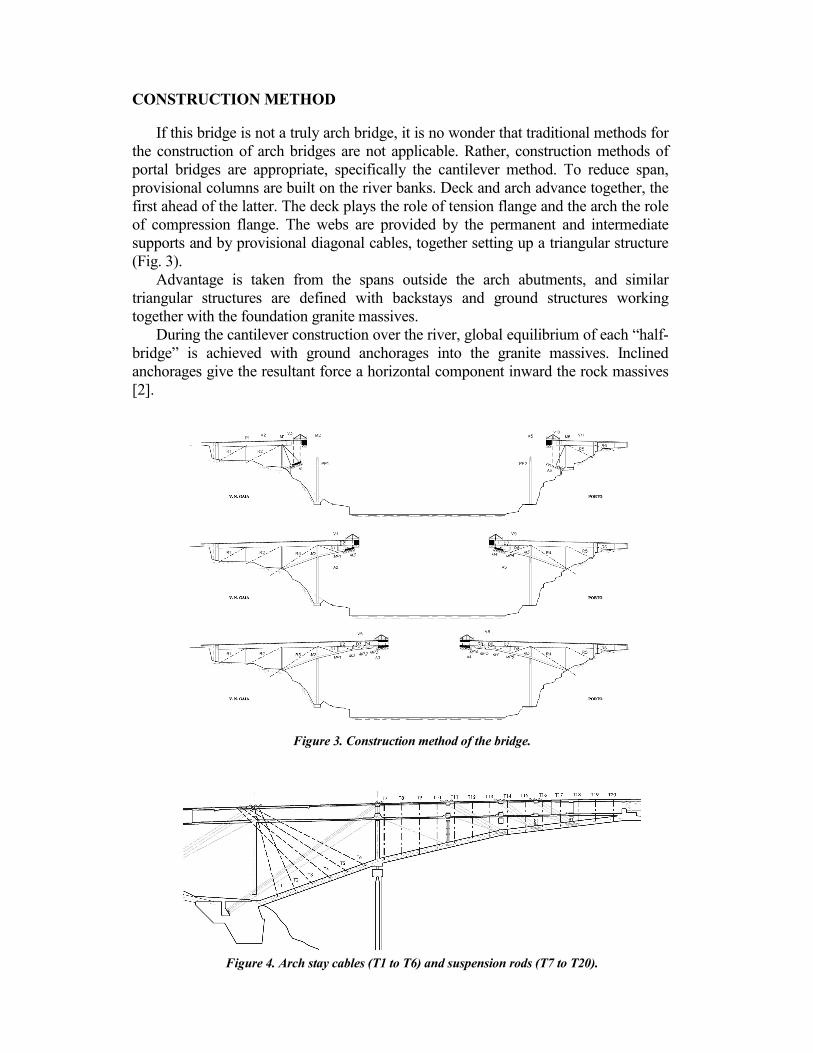
If this bridge is not a truly arch bridge, it is no wonder that traditional methods for the construction of arch bridges are not applicable. Rather, construction methods of portal bridges are appropriate, specifically the cantilever method. To reduce span, provisional columns are built on the river banks. Deck and arch advance together, the first ahead of the latter. The deck plays the role of tension flange and the arch the role of compression flange. The webs are provided by the permanent and intermediate supports and by provisional diagonal cables, together setting up a triangular structure (Fig. 3).
Advantage is taken from the spans outside the arch abutments, and similar triangular structures are defined with backstays and ground structures working together with the foundation granite massives.
During the cantilever construction over the river, global equilibrium of each “half-bridge” is achieved with ground anchorages into the granite massives. Inclined anchorages give the resultant force a horizontal component inward the rock massives [2].
Figure 3. Construction method of the bridge.
Figure 4. Arch stay cables (T1 to T6) and suspension rods (T7 to T20).
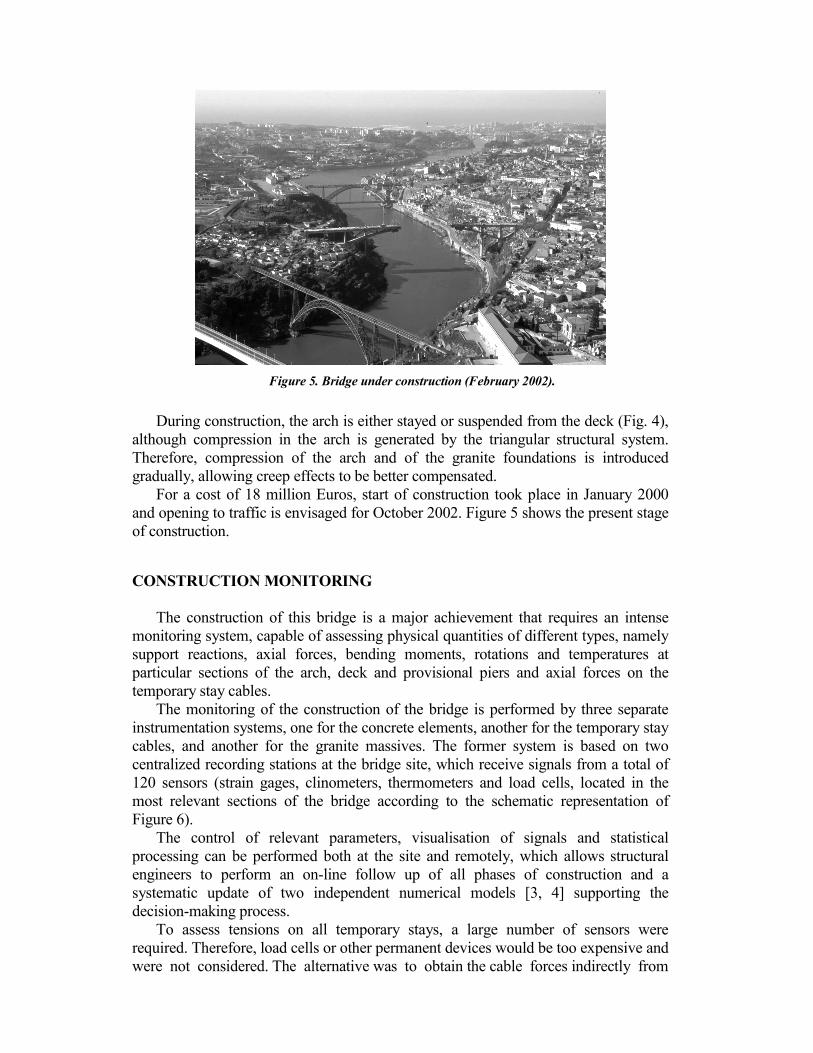
Figure 5. Bridge under construction (February 2002).
During construction, the arch is either stayed or suspended from the deck (Fig. 4), although compression in the arch is generated by the triangular structural system. Therefore, compression of the arch and of the granite foundations is introduced gradually, allowing creep effects to be better compensated.
For a cost of 18 million Euros, start of construction took place in January 2000 and opening to traffic is envisaged for October 2002. Figure 5 shows the present stage of construction.
CONSTRUCTION MONITORING
The construction of this bridge is a major achievement that requires an intense monitoring system, capable of assessing physical quantities of different types, namely support reactions, axial forces, bending moments, rotations and temperatures at particular sections of the arch, deck and provisional piers and axial forces on the temporary stay cables.
The monitoring of the construction of the bridge is performed by three separate instrumentation systems, one for the concrete elements, another for the temporary stay cables, and another for the granite massives. The former system is based on two centralized recording stations at the bridge site, which receive signals from a total of 120 sensors (strain gages, clinometers, thermometers and load cells, located in the most relevant sections of the bridge according to the schematic representation of Figure 6).
The control of relevant parameters, visualisation of signals and statistical processing can be performed both at the site and remotely, which allows structural engineers to perform an on-line follow up of all phases of construction and a systematic update of two independent numerical models [3, 4] supporting the decision-making process.
To assess tensions on all temporary stays, a large number of sensors were required. Therefore, load cells or other permanent devices would be too expensive and were not considered. The alternative was to obtain the cable forces indirectly from
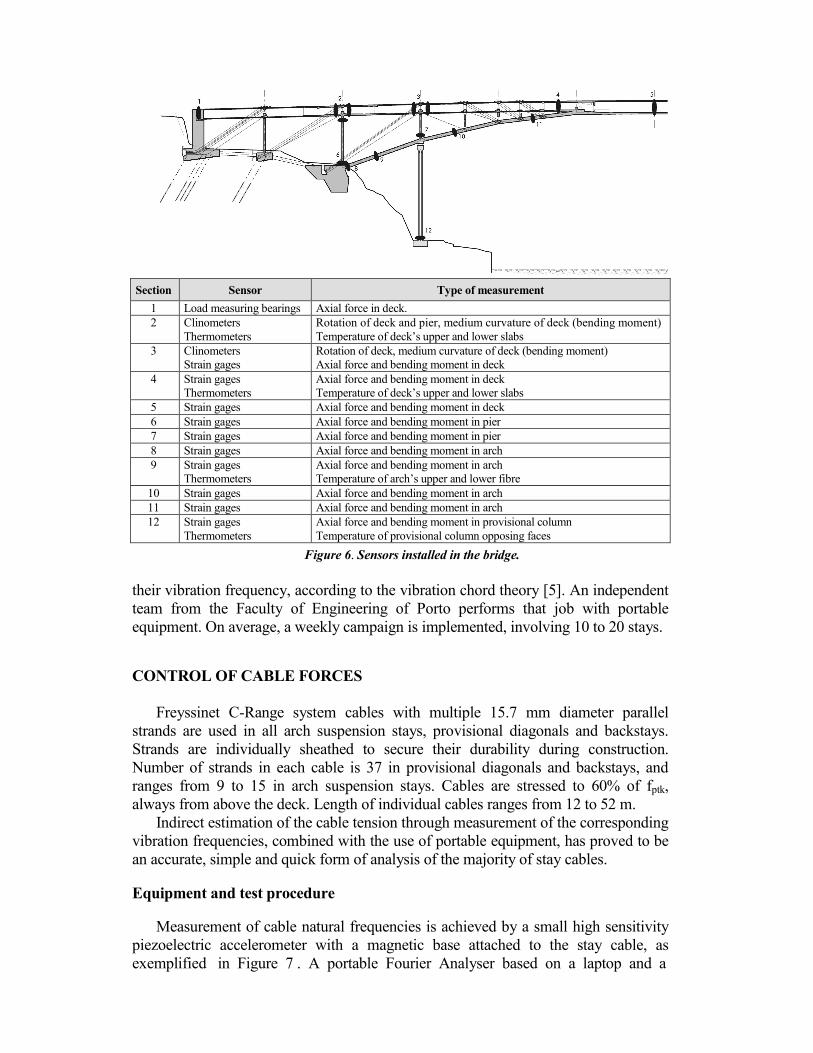
Section Sensor Type of measurement
1 Load measuring bearings Axial force in deck. 2 Clinometers
Thermometers Rotation of deck and pier, medium curvature of deck (bending moment) Temperature of deck’s upper and lower slabs
3 Clinometers Strain gages
Rotation of deck, medium curvature of deck (bending moment) Axial force and bending moment in deck
4 Strain gages Thermometers
Axial force and bending moment in deck Temperature of deck’s upper and lower slabs
5 Strain gages Axial force and bending moment in deck 6 Strain gages Axial force and bending moment in pier 7 Strain gages Axial force and bending moment in pier 8 Strain gages Axial force and bending moment in arch 9 Strain gages
Thermometers Axial force and bending moment in arch Temperature of arch’s upper and lower fibre
10 Strain gages Axial force and bending moment in arch 11 Strain gages Axial force and bending moment in arch 12 Strain gages
Thermometers Axial force and bending moment in provisional column Temperature of provisional column opposing faces
Figure 6. Sensors installed in the bridge.
their vibration frequency, according to the vibration chord theory [5]. An independent team from the Faculty of Engineering of Porto performs that job with portable equipment. On average, a weekly campaign is implemented, involving 10 to 20 stays.
CONTROL OF CABLE FORCES
Freyssinet C-Range system cables with multiple 15.7 mm diameter parallel
strands are used in all arch suspension stays, provisional diagonals and backstays. Strands are individually sheathed to secure their durability during construction. Number of strands in each cable is 37 in provisional diagonals and backstays, and ranges from 9 to 15 in arch suspension stays. Cables are stressed to 60% of fptk, always from above the deck. Length of individual cables ranges from 12 to 52 m.
Indirect estimation of the cable tension through measurement of the corresponding vibration frequencies, combined with the use of portable equipment, has proved to be an accurate, simple and quick form of analysis of the majority of stay cables. Equipment and test procedure
Measurement of cable natural frequencies is achieved by a small high sensitivity piezoelectric accelerometer with a magnetic base attached to the stay cable, as exemplified in Figure 7 . A portable Fourier Analyser based on a laptop and a
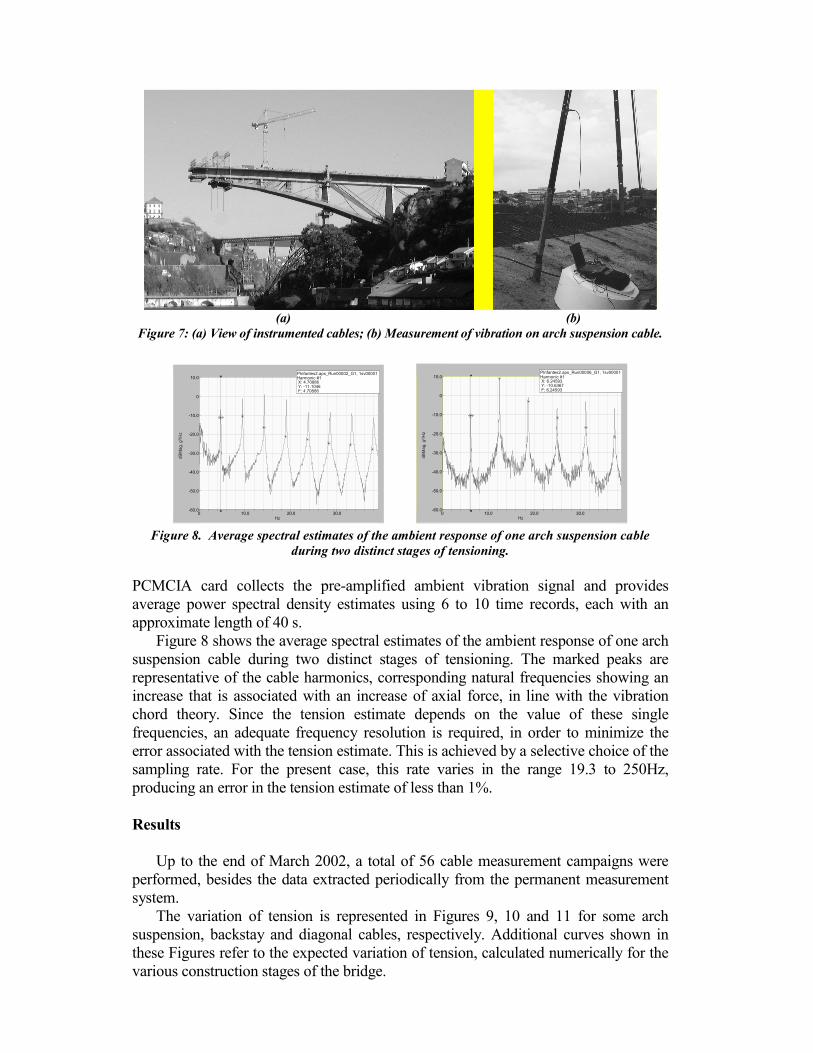
(a) (b)
Figure 7: (a) View of instrumented cables; (b) Measurement of vibration on arch suspension cable.
0 10.0 20.0 30.0-60.0
-50.0
-40.0
-30.0
-20.0
-10.0
0
10.0
Hz
dBM
ag, g
²/H
z
PInfantes2.aps_Run00002_G1, 1sv00001Harmonic #1 X: 4.70886 Y: -11.1046 F: 4.70886
0 10.0 20.0 30.0-60.0
-50.0
-40.0
-30.0
-20.0
-10.0
0
10.0
Hz
dBM
ag, g
²/H
z
PInfantes2.aps_Run00006_G1, 1sv00001Harmonic #1 X: 6.24593 Y: -10.6367 F: 6.24593
Figure 8. Average spectral estimates of the ambient response of one arch suspension cable
during two distinct stages of tensioning.
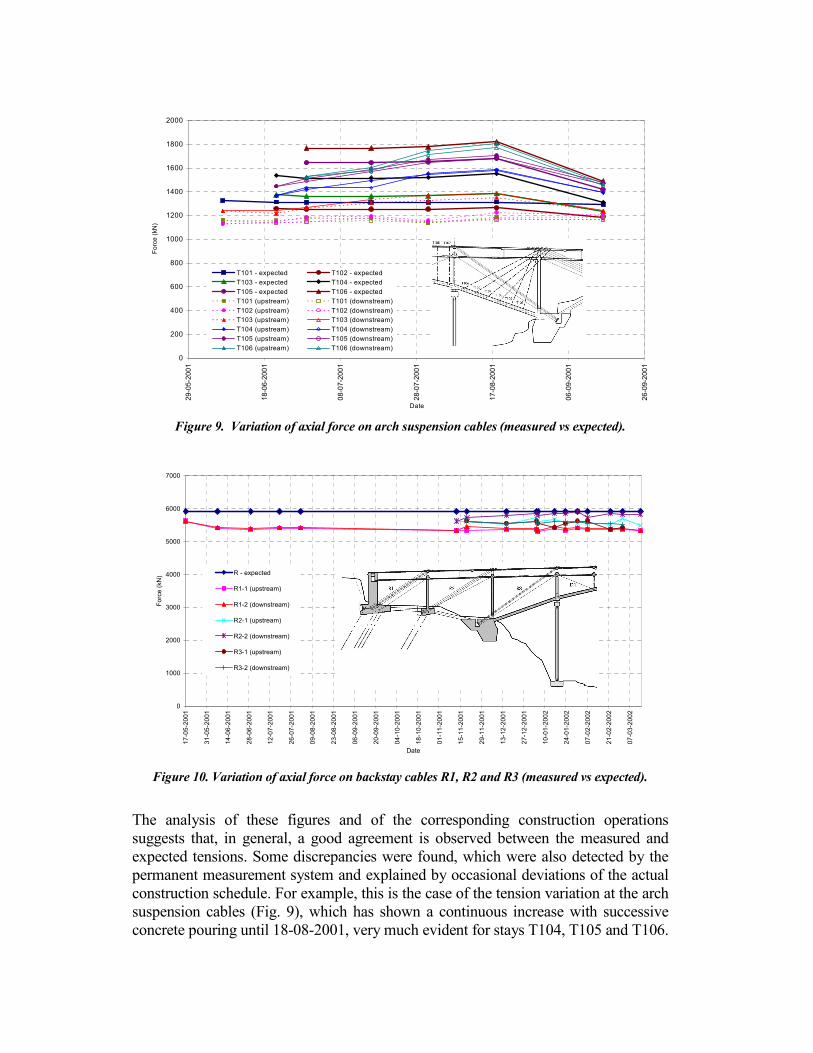
PCMCIA card collects the pre-amplified ambient vibration signal and provides average power spectral density estimates using 6 to 10 time records, each with an approximate length of 40 s.
Figure 8 shows the average spectral estimates of the ambient response of one arch suspension cable during two distinct stages of tensioning. The marked peaks are representative of the cable harmonics, corresponding natural frequencies showing an increase that is associated with an increase of axial force, in line with the vibration chord theory. Since the tension estimate depends on the value of these single frequencies, an adequate frequency resolution is required, in order to minimize the error associated with the tension estimate. This is achieved by a selective choice of the sampling rate. For the present case, this rate varies in the range 19.3 to 250Hz, producing an error in the tension estimate of less than 1%.
Results
Up to the end of March 2002, a total of 56 cable measurement campaigns were
performed, besides the data extracted periodically from the permanent measurement system.
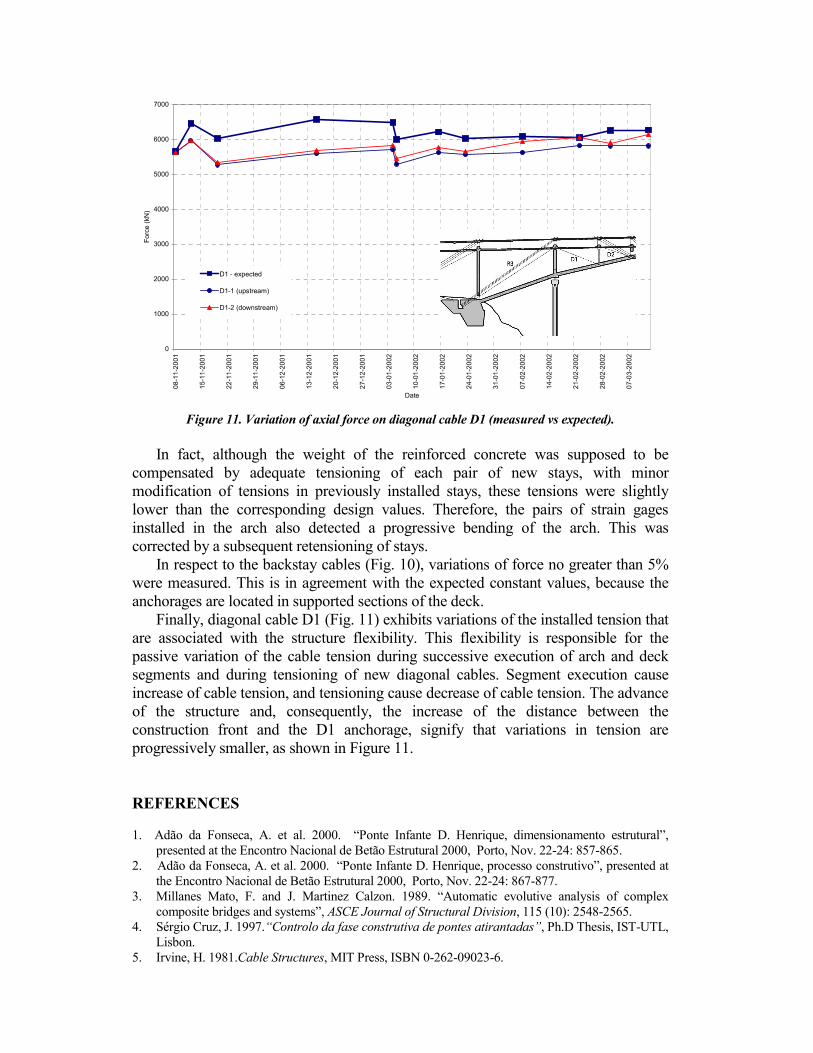
The variation of tension is represented in Figures 9, 10 and 11 for some arch suspension, backstay and diagonal cables, respectively. Additional curves shown in these Figures refer to the expected variation of tension, calculated numerically for the various construction stages of the bridge.
0
200
400
600
800
1000
1200
1400
1600
1800
2000
29
-05
-20
01
18
-06
-20
01
08
-07
-20
01
28
-07
-20
01
17
-08
-20
01
06
-09
-20
01
26
-09
-20
01
Date
Fo
rce
(kN
)
T101 - expected T102 - expected
T103 - expected T104 - expected
T105 - expected T106 - expected
T101 (upstream) T101 (downstream)
T102 (upstream) T102 (downstream)
T103 (upstream) T103 (downstream)
T104 (upstream) T104 (downstream)
T105 (upstream) T105 (downstream)
T106 (upstream) T106 (downstream)
Figure 9. Variation of axial force on arch suspension cables (measured vs expected).
0
1000
2000
3000
4000
5000
6000
7000
17
-05
-20
01
31
-05
-20
01
14
-06
-20
01
28
-06
-20
01
12
-07
-20
01
26
-07
-20
01
09
-08
-20
01
23
-08
-20
01
06
-09
-20
01
20
-09
-20
01
04
-10
-20
01
18
-10
-20
01
01
-11
-20
01
15
-11
-20
01
29
-11
-20
01
13
-12
-20
01
27
-12
-20
01
10
-01
-20
02
24
-01
-20
02
07
-02
-20
02
21
-02
-20
02
07
-03
-20
02
Date
Fo
rce
(kN
) R - expected
R1-1 (upstream)
R1-2 (downstream)
R2-1 (upstream)
R2-2 (downstream)
R3-1 (upstream)
R3-2 (downstream)
Figure 10. Variation of axial force on backstay cables R1, R2 and R3 (measured vs expected).
The analysis of these figures and of the corresponding construction operations suggests that, in general, a good agreement is observed between the measured and expected tensions. Some discrepancies were found, which were also detected by the permanent measurement system and explained by occasional deviations of the actual construction schedule. For example, this is the case of the tension variation at the arch suspension cables (Fig. 9), which has shown a continuous increase with successive concrete pouring until 18-08-2001, very much evident for stays T104, T105 and T106.
0
1000
2000
3000
4000
5000
6000
7000
08
-11
-20
01
15
-11
-20
01
22
-11
-20
01
29
-11
-20
01
06
-12
-20
01
13
-12
-20
01
20
-12
-20
01
27
-12
-20
01
03
-01
-20
02
10
-01
-20
02
17
-01
-20
02
24
-01
-20
02
31
-01
-20
02
07
-02
-20
02
14
-02
-20
02
21
-02
-20
02
28
-02
-20
02
07
-03
-20
02
Date
Fo
rce
(kN
)
D1 - expected
D1-1 (upstream)
D1-2 (downstream)
Figure 11. Variation of axial force on diagonal cable D1 (measured vs expected).
In fact, although the weight of the reinforced concrete was supposed to be compensated by adequate tensioning of each pair of new stays, with minor modification of tensions in previously installed stays, these tensions were slightly lower than the corresponding design values. Therefore, the pairs of strain gages installed in the arch also detected a progressive bending of the arch. This was corrected by a subsequent retensioning of stays.
In respect to the backstay cables (Fig. 10), variations of force no greater than 5% were measured. This is in agreement with the expected constant values, because the anchorages are located in supported sections of the deck.
Finally, diagonal cable D1 (Fig. 11) exhibits variations of the installed tension that are associated with the structure flexibility. This flexibility is responsible for the passive variation of the cable tension during successive execution of arch and deck segments and during tensioning of new diagonal cables. Segment execution cause increase of cable tension, and tensioning cause decrease of cable tension. The advance of the structure and, consequently, the increase of the distance between the construction front and the D1 anchorage, signify that variations in tension are progressively smaller, as shown in Figure 11. REFERENCES
1. Adão da Fonseca, A. et al. 2000. “Ponte Infante D. Henrique, dimensionamento estrutural”,
presented at the Encontro Nacional de Betão Estrutural 2000, Porto, Nov. 22-24: 857-865. 2. Adão da Fonseca, A. et al. 2000. “Ponte Infante D. Henrique, processo construtivo”, presented at
the Encontro Nacional de Betão Estrutural 2000, Porto, Nov. 22-24: 867-877. 3. Millanes Mato, F. and J. Martinez Calzon. 1989. “Automatic evolutive analysis of complex
composite bridges and systems”, ASCE Journal of Structural Division, 115 (10): 2548-2565. 4. Sérgio Cruz, J. 1997.“Controlo da fase construtiva de pontes atirantadas”, Ph.D Thesis, IST-UTL,
Lisbon. 5. Irvine, H. 1981.Cable Structures, MIT Press, ISBN 0-262-09023-6.