Embed Size (px)
Citation preview
0
PARK IMPACT FEE TECHNICAL DOCUMENT April 2016 Update
(rev. 04/16/16)
Clark County, WA
1 PIF Technical Document (2016)
I. ELEMENTS OF THE PARK IMPACT FEE TECHNICAL DOCUMENT
Introduction / Purpose Park Impact Fee Overview & Rate Update
o Background o Overview o PIF Formula o Factors affecting PIF Rates o Park Impact Fee Rate Schedule o Park District Map o Park Impact Fee Rates from Comparable Agencies
Park Impact Fee Indexing o Overview
Recommendations for Park Impact Fee Rate Revisions
II. INTRODUCTION & PURPOSE The original Park Impact Fee (PIF) Technical Document was prepared in 2009 to provide a framework to facilitate and streamline future rate updates or revisions at the direction of the elected officials of the City of Vancouver and Clark County. The purpose of the initial version of the Technical Document was to provide a vehicle to re-adopt the fee schedule and numeric formula factors in effect. In addition, the Technical Document described the methodology for the future implementation of park impact fee indexing in order to keep pace with fluctuations in the economic market, and allow rates to more accurately reflect current acquisition and development costs. The purpose of this updated PIF Technical Document is to establish revised Clark County PIF rates for the various park impact fee districts serving the unincorporated urban area of Vancouver, based on updated and revised inputs to the adopted PIF rate methodology (CCC 40.620.020), for publicly owned parks, open space and recreation facilities, as defined by RCW 82.02.090(7). In the future, at the direction of the County Council, rate change proposals may be brought forward for consideration, utilizing the adoption of a future, revised PIF Technical Document. The revised Technical Document would provide the updated analysis for inflation or deflation adjustments, identify any revised data sources or values for formula factors, and include a proposed fee rate schedule.
III. PARK IMPACT FEE OVERVIEW & RATE UPDATE
A. Background In 1997, the City and the County entered into an interlocal agreement for the operation of a consolidated parks department and joint administration of a parks impact fee program. As part of the 2002 Vancouver Urban Parks, Recreation & Open Space Plan, PIF rates were revised to account for changes in the land and development costs integral to the calculation of the impact fees (Clark County Ordinance 2002-05-03). In 2002, the Clark County made minor adjustments to the PIF rates to account for an adopted, 30-year
2 PIF Technical Document (2016)
extension of the Real Estate Excise Tax (REET) in the unincorporated urban area (Clark County Ordinance 2002-10-16). The County adopted an update to the joint Comprehensive Parks, Recreation & Open Space Plan in 2007, but the PIF rates remained unchanged.
In 2009, references to PIF rate schedules and numeric calculation factors were removed from the Vancouver- Clark Comprehensive Parks and Recreation Comprehensive Parks, Recreation and Open Space Plan (Parks Plan), the Clark County Code, and the Vancouver Municipal Code. The purpose of this action was to:
Establish a streamlined process for rate changes using a PIF Technical Document as a vehicle to adopt both current and future rate schedules,
Adopt numeric calculation factors, Define the park impact fee indexing methodology, and Improve consistency between city and county administrative codes as they relate to the application
and management of the park impact fee program.
Following the completion of the 2009 PIF Technical Document, revisions to the PIF rates were not adopted by either the City of Vancouver or Board of County Commissioners; however, the Clark County Code was amended to reference the PIF Technical Document and include the provision for rate indexing for the acquisition and development components of the rate structure. Annual adjustments to the PIF rates tied to the indexing methodology have not been instituted or submitted for consideration by the County Commission.
The joint administration of the PIF program was terminated by the County effective December 31, 2013, and a Windup Agreement between the city and county became effective January 1, 2014. From that date forward, the City and County are each responsible for administering separate PIF programs.
The PIF rates that are currently charged by the County have remained unchanged since January 2003.
B. Impact Fee Overview Impact fees are one-time payments used to construct system improvements needed to accommodate new development. An impact fee represents new growth’s fair share of capital facility needs. By law, impact fees can only be used for capital improvements that expand system capacity, not for operating or maintenance costs. Impact fees are subject to legal standards, which require fulfillment of three key elements: need, benefit and proportionality.
The Growth Management Act grants counties and cities the authority to assess parks impact fees on new development. Washington law (RCW 82.02.090) defines an impact fee as “a payment of money imposed upon development as a condition of development approval to pay for public facilities needed to serve new growth and development, and that is reasonably related to the new development that creates additional demand and need for public facilities, that is a proportionate share of the cost of the public facilities, and that is used for facilities that reasonably benefit the new development.”
State code defines the limitations of impacts fees, such that they can only be imposed for system improvements that are reasonably related to the new development, cannot exceed a proportionate share of the costs of system improvements that are reasonably related to the new development, and must be used for system improvements that will reasonably benefit the new development.
Additionally, state statute requires that park facilities on which impact fees may be spent must be part of a capital facilities plan that is a component of an adopted comprehensive land use plan. County code (CCC 40.630.010) anticipate that impact fee rates will be revised periodically when financial analysis establishes that there is a need for a major program update, or adjusted annually to account for inflation/deflation using an
3 PIF Technical Document (2016)
indexing methodology. All fee adjustments are to be described in a Technical Document to be reviewed and adopted by the elected officials of Clark County.
Impact fees rates also must be adjusted to account for other revenues that the development pays that are earmarked for or proratable to particular system improvements; these other revenues may be in the form of user fees, debt service payments or taxes, among others. Impact fees may be credited for the value of dedicated land, improvements or construction provided by the developer to facilities that are identified in the capital facilities plan and that are required by the county as a condition of approving the development activity.
RCW 82.02.070 further stipulates that impact fee receipts must be earmarked specifically and retained in special interest-bearing accounts and must be expended or encumbered for a permissible use within ten years of receipt.
C. Park Impact Fee Formula The formula used to compute park impact fee rates is based on four primary factors: 1) acquisition costs; 2) development costs; 3) adopted park standards, and 4) an adjustment factor required by state law.
1. Acquisition cost is the unique cost of land in each of the ten established park districts. 2. Development cost is the average cost of park development over all 10 park districts within the
Vancouver urban growth area. 3. Adopted park standards are those adopted by the Parks Plan for neighborhood and community
parks and urban open space. These standards are population based and represent the acres of land needed to serve one thousand residents for each of the respective park types.
4. The adjustment factor is based on state statute that requires an “adjustment to the cost of public facilities for past or future payments made or reasonably anticipated to be made by new development...” Commonly known as the “proportionate public share” or “shift”, this adjustment is intended to reasonably relate the cost of public facility improvements with the service demands of new development.
The impact fee unit cost is calculated as the net cost basis per capita then converted to the impact fee per residential dwelling unit using the assumed average occupancy rate per dwelling unit. Clark County's impact fee component for parks, open space and recreational facilities currently is calculated using the following formula (CCC 40.620.020, amended on Ord. 2014-01-14):
“PIF” means the park, open space and recreational facility component of the total development impact fee.
“Ca” means the average cost per acre for land appraisal, acquisition, associated due diligence fees and expenses, closing and Level 1 Development for each service area or overlay area as described in the Clark County Parks, Recreation and Open Space Plan for neighborhood parks, community parks and urban open space, and adopted by the Board in the impact fee revision process pursuant to Section 40.630.010.
“Cd” means the average cost per acre for site development. Development costs shall be calculated assuming development standards described in the Clark County Parks, Recreation and Open Space Plan for neighborhood and community parks, and adopted by the Board in the impact fee revision process pursuant to Section 40.630.010.
4 PIF Technical Document (2016)
“Ia” means the percentage annual inflation/deflation adjustment index applicable to the acquisition component, as outlined in the Park Impact Fee Program Technical Document and annually determined by the Board in the impact fee revision process pursuant to Section 40.630.010.
“Id” means the percentage annual inflation/deflation adjustment index applicable to the development component as outlined in the Park Impact Fee Program Technical Document and annually determined by the Board in the impact fee revision process pursuant to Section 40.630.010.
“Sa” means the parks acquisition standard in acres per thousand residents for neighborhood parks, community parks and urban open space as established in the Clark County Parks, Recreation and Open Space Plan.
“Sd” means the parks development standard in acres per thousand residents for neighborhood and community parks as established in the Clark County Parks, Recreation and Open Space Plan.
“P” means one thousand (1,000).
“U” means the average number of occupants per single-family/duplex dwelling unit or per other multifamily dwelling unit based on the most current applicable statistical census data (U.S. Census Bureau or Washington State Office of Financial Management census data for persons per dwelling unit) and as adopted by the Board in the impact fee revision process pursuant to Section 40.630.010.
“A” means an adjustment to the cost of park facilities for past or future payments made or reasonably anticipated to be made by new development to pay for park system improvements in the form of user fees, debt service payments, or other payments earmarked for or pro-ratable to park system improvements.
D. Factors Affecting the Impact Fee Calculation The impact fee calculation includes several variables, described below, that can alter the resulting impact fee rate.
Facility Standards The recently compiled Clark County Parks, Recreation and Open Space Plan was adopted by the County Council in September 2015. No revisions to the service standards were made as part of this plan update, and the standards that are applied to the current park impact fee rates remain constant.
Occupancy Rates per Dwelling Unit Occupancy rates for single-family and multi-family dwellings have increased in Clark County over the past two decades. The park impact fee study conducted in 2002 assumed an average of 2.6 people per household for single-family and 1.9 people per household for multi-family dwellings. Based on 2016 US Census Bureau Public Use Microdata Sample (PUMS) data provided by Clark County Assessment & GIS, the current average is 2.76 people per household for single-family and 2.13 people per household for multi-family dwellings.
Land Valuation Estimates Acquisition costs are developed using a compilation of average property sale values of residentially-zoned lands within each of the ten park districts, using the County’s Assessment & GIS database. Sale values were based on available sale data for residential property transactions occurring between January 2011 and March 2016. The analysis excluded parcels that are not well suited as candidate properties for park acquisition. These excluded parcels included those smaller than ½-acre, multi-family properties, tax-exempt properties, non-residential land uses (e.g., industrial, commercial, business park, office) and those with high building values
5 PIF Technical Document (2016)
relative to the property value. Standard outliers, including properties with assessed values less than $10,000 or greater than $1 million were also excluded from the analysis.
Development Cost Estimates The development component is constant for each of the ten park districts. The average development cost per acre for neighborhood and community parks is determined by averaging the cost of recent development projects. The average per acre cost is weighted to reflect the varying guidelines for the proportion of neighborhood to community parks (2 acres/1,000 persons versus 2.25 acres/1,000 persons respectively). The average cost is then multiplied by the 4.25 acre/1,000 person development standard and the number of persons per dwelling unit to determine the single family and multi-family development component.
Adjustment Factor The Cost Adjustment Factor (CAF) reflects the contribution of other sources of public funds to park development, as the financing system cannot rely solely on impact fees. The adjustment factor utilized in the 2002 park impact fee study was calculated based on the 50% REET allocation that was directed toward park development by the Board of County Commissioners. The CAF estimated a per unit adjustment based on the average sale price of single and multi-family homes, the REET rate and a weighting between single family and multi-family units from recent permit activity. The CAF was recalculated with revised figures for this proposed PIF rate update. While the Board of County Commissioners have re-allocated REET revenue toward debt service for various public facilities, it is assumed that future REET collections for REET-2 will be restored to the 50% allocation for park development, as adopted by a previous Board.
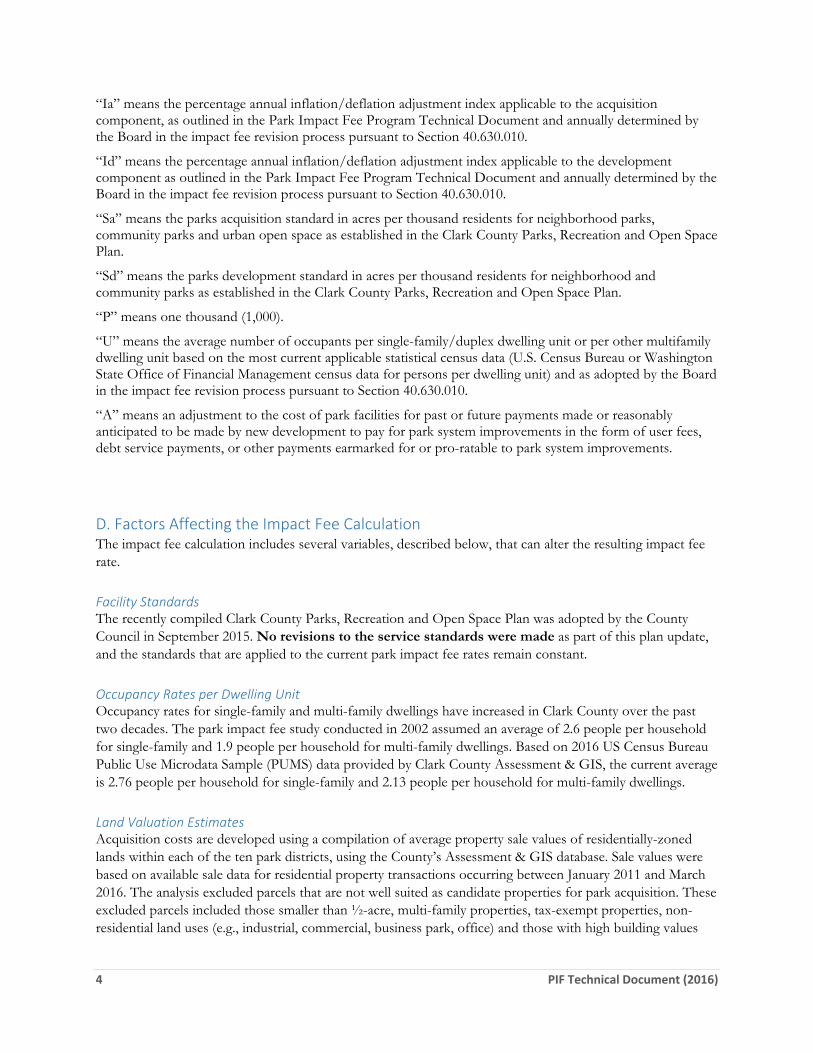
The updated adjustments for Clark County are noted below, based on a per capita adjustment of $108.38:
III. PARK IMPACT FEE INDEX
A. Overview The intent of indexing is simply to keep impact fees as current as possible by accounting for inflation or deflation adjustments over time using a known or common factor, such as the consumer price index or the construction cost index. Annually adjusted impact fees also minimize potential public share obligations to the system, which are caused by the difference between current rates and the annually eroding value of those rates as they are impacted by inflation. Indexing has been implemented by County and codified in CCC 40.620.020.C. No changes to the indexing methodology are proposed at this time. The 2009 PIF Technical Document should be referenced for the discussions pertaining to the methodologies for calculating and implementing the indices for the acquisition and development components.
Unit Type Adjustment Adjustment Value “A”
Single‐Fami ly $299.13
Multi ‐Fami ly $230.85
6 PIF Technical Document (2016)
IV. Park Impact Fee Rate Schedule (Current & Proposed)
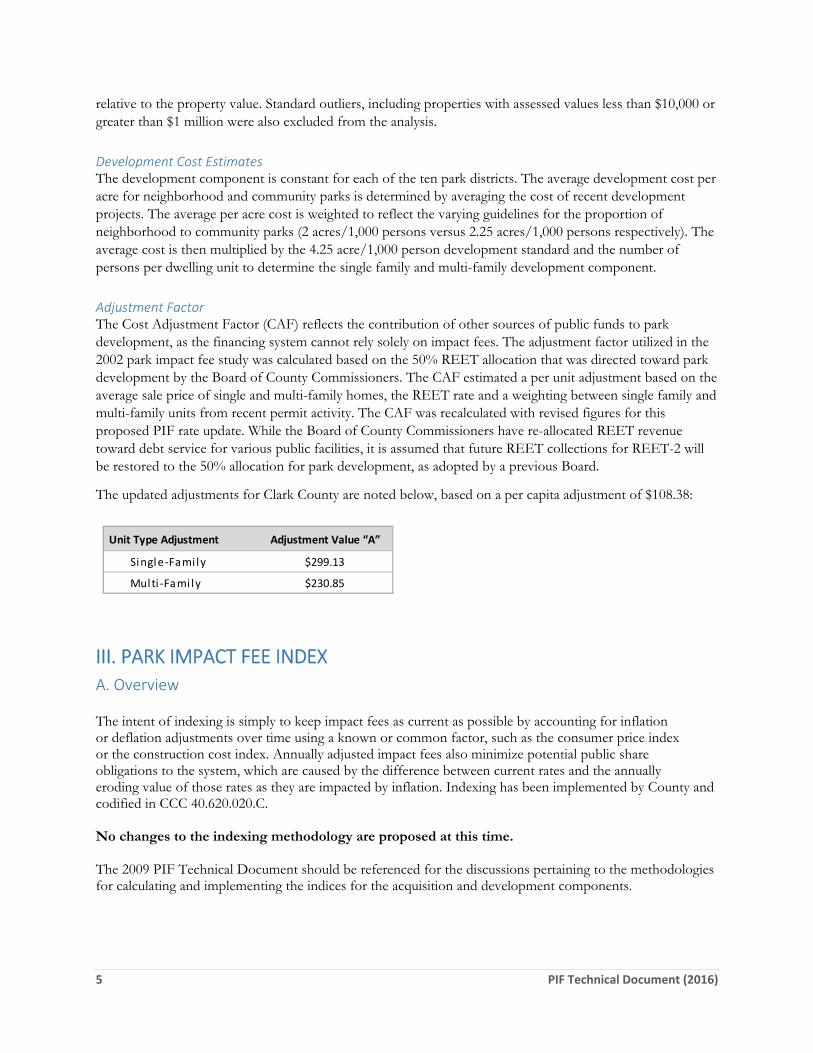
Current Clark County Park Impact Fees (As adopted by Ordinance 2002-10-16, effective January 1, 2003)
Proposed Clark County Park Impact Fees (2016)
Clark County, Urban Unincorporated Area
Current Park Impact Fee Rates (2003)
PIF
Acquis i tion
Rate
Development
Component ‐ CAF =
Development
Rate
Single‐
Family PIF
(2.6 persons)
Multi‐
Family PIF
(1.9 persons)
1 $651 $257 $87.88 $169 $2,133 $1,558
2 $857 $257 $87.88 $169 $2,668 $1,949
3 $708 $257 $87.88 $169 $2,282 $1,667
4 $599 $257 $87.88 $169 $1,998 $1,460
5 $523 $257 $87.88 $169 $1,799 $1,314
6 $424 $257 $87.88 $169 $1,543 $1,127
7 $556 $257 $87.88 $169 $1,885 $1,377
8 $523 $257 $87.88 $169 $1,800 $1,315
9 $606 $257 $87.88 $169 $2,016 $1,472
10 $421 $257 $87.88 $169 $1,534 $1,120
Average $587 $257 $88 $169 $1,966 $1,436
Per Capita Rates Unit Rates (Current)
Clark County, Urban Unincorporated Area
Proposed Park Impact Fee Rates (2016)
PIF
Acquis i tion
Rate
Development
Component ‐ CAF =
Development
Rate
Single‐
Family PIF
(2.76 persons)
Multi‐
Family PIF
(2.13 persons)
1 $2,321 $594 $108.38 $486 N/A N/A
2 $2,164 $594 $108.38 $486 N/A N/A
3 $2,090 $594 $108.38 $486 N/A N/A
4 $2,802 $594 $108.38 $486 N/A N/A
5 $1,091 $594 $108.38 $486 $4,353 $3,359
6 $1,533 $594 $108.38 $486 $5,572 $4,300
7 $1,055 $594 $108.38 $486 $4,252 $3,282
8 $948 $594 $108.38 $486 $3,959 $3,055
9 $1,507 $594 $108.38 $486 $5,500 $4,244
10 $910 $594 $108.38 $486 $3,852 $2,973
Average $1,642 $594 $108 $486 $4,581 $3,536
Per Capita Rates Unit Rates (Proposed)
7 PIF Technical Document (2016)
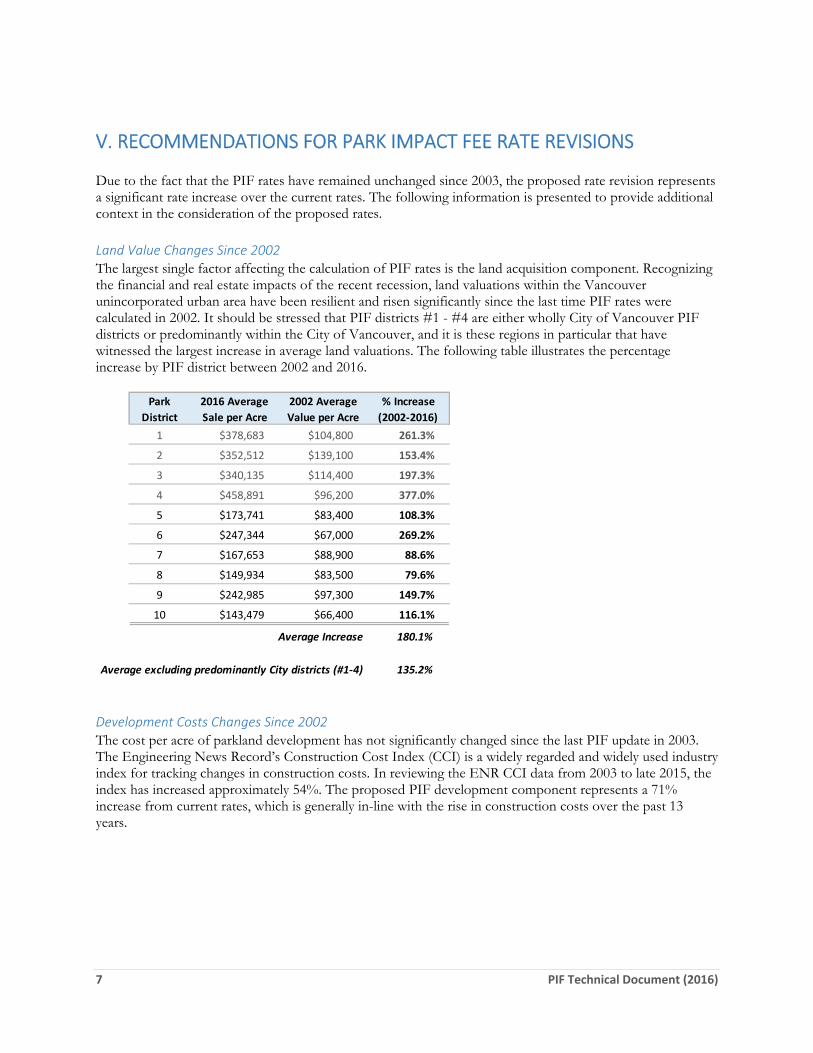
V. RECOMMENDATIONS FOR PARK IMPACT FEE RATE REVISIONS Due to the fact that the PIF rates have remained unchanged since 2003, the proposed rate revision represents a significant rate increase over the current rates. The following information is presented to provide additional context in the consideration of the proposed rates. Land Value Changes Since 2002 The largest single factor affecting the calculation of PIF rates is the land acquisition component. Recognizing the financial and real estate impacts of the recent recession, land valuations within the Vancouver unincorporated urban area have been resilient and risen significantly since the last time PIF rates were calculated in 2002. It should be stressed that PIF districts #1 - #4 are either wholly City of Vancouver PIF districts or predominantly within the City of Vancouver, and it is these regions in particular that have witnessed the largest increase in average land valuations. The following table illustrates the percentage increase by PIF district between 2002 and 2016.
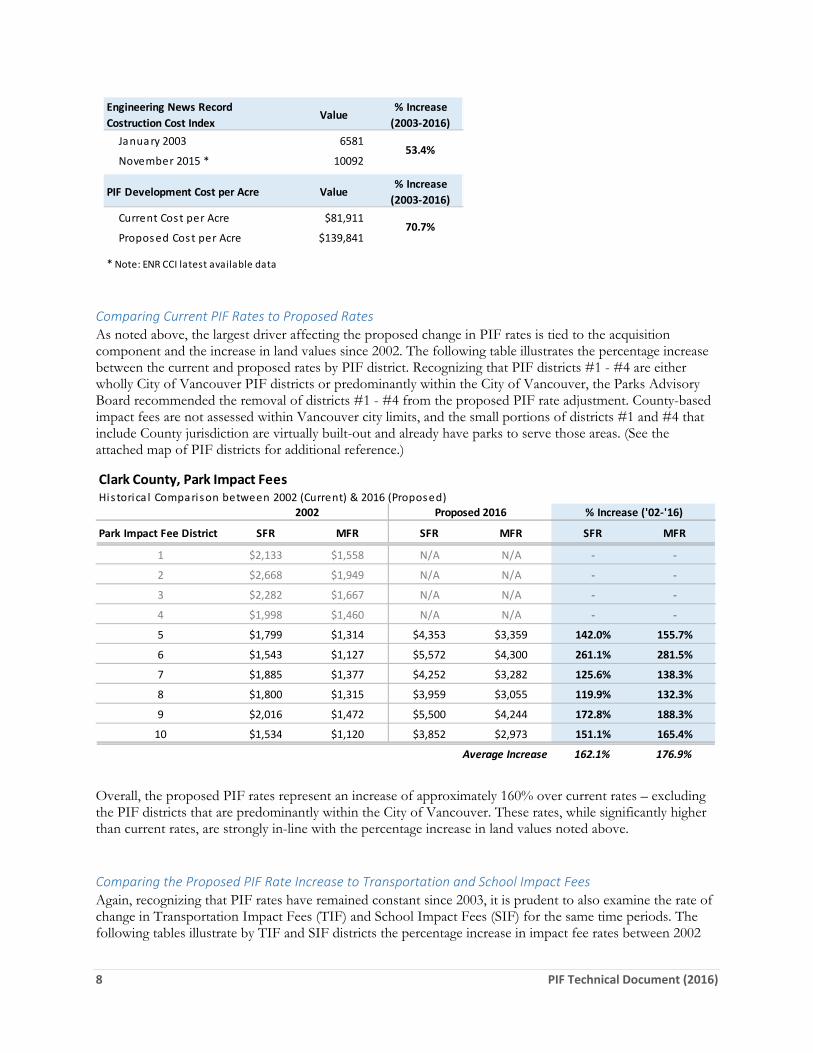
Development Costs Changes Since 2002 The cost per acre of parkland development has not significantly changed since the last PIF update in 2003. The Engineering News Record’s Construction Cost Index (CCI) is a widely regarded and widely used industry index for tracking changes in construction costs. In reviewing the ENR CCI data from 2003 to late 2015, the index has increased approximately 54%. The proposed PIF development component represents a 71% increase from current rates, which is generally in-line with the rise in construction costs over the past 13 years.
Park
District
2016 Average
Sale per Acre
2002 Average
Value per Acre
% Increase
(2002‐2016)
1 $378,683 $104,800 261.3%
2 $352,512 $139,100 153.4%
3 $340,135 $114,400 197.3%
4 $458,891 $96,200 377.0%
5 $173,741 $83,400 108.3%
6 $247,344 $67,000 269.2%
7 $167,653 $88,900 88.6%
8 $149,934 $83,500 79.6%
9 $242,985 $97,300 149.7%
10 $143,479 $66,400 116.1%
Average Increase 180.1%
Average excluding predominantly City districts (#1‐4) 135.2%
8 PIF Technical Document (2016)
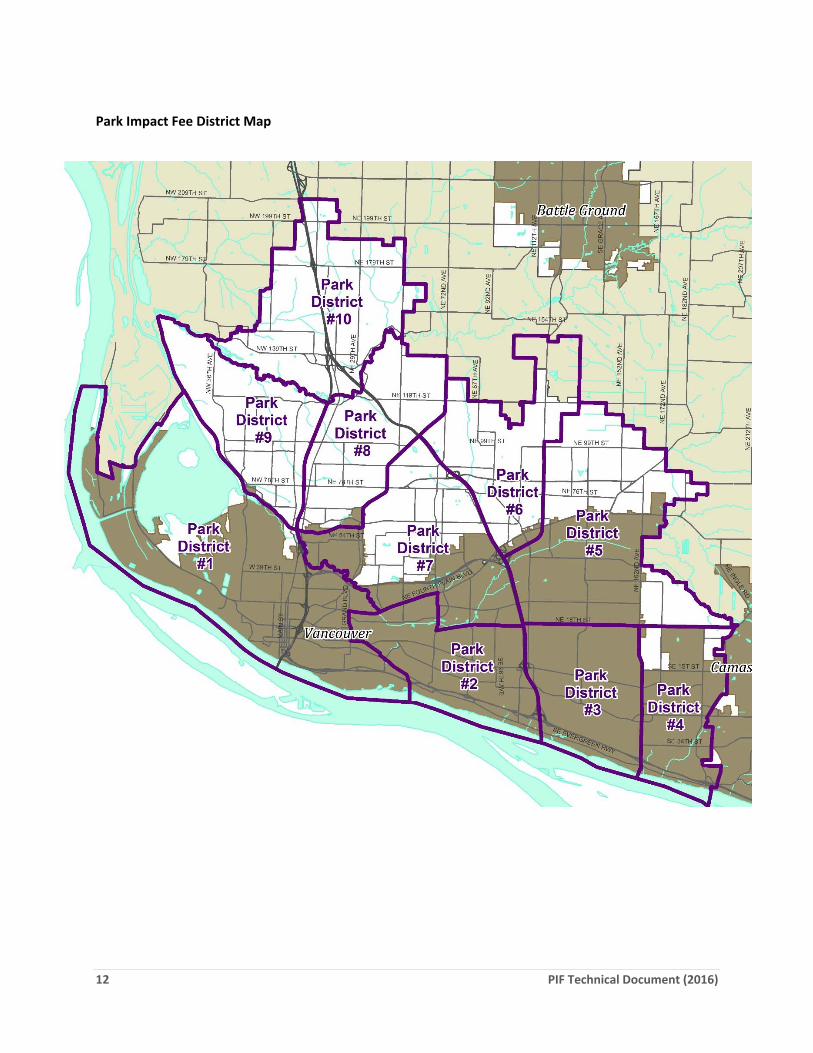
Comparing Current PIF Rates to Proposed Rates As noted above, the largest driver affecting the proposed change in PIF rates is tied to the acquisition component and the increase in land values since 2002. The following table illustrates the percentage increase between the current and proposed rates by PIF district. Recognizing that PIF districts #1 - #4 are either wholly City of Vancouver PIF districts or predominantly within the City of Vancouver, the Parks Advisory Board recommended the removal of districts #1 - #4 from the proposed PIF rate adjustment. County-based impact fees are not assessed within Vancouver city limits, and the small portions of districts #1 and #4 that include County jurisdiction are virtually built-out and already have parks to serve those areas. (See the attached map of PIF districts for additional reference.)
Overall, the proposed PIF rates represent an increase of approximately 160% over current rates – excluding the PIF districts that are predominantly within the City of Vancouver. These rates, while significantly higher than current rates, are strongly in-line with the percentage increase in land values noted above. Comparing the Proposed PIF Rate Increase to Transportation and School Impact Fees Again, recognizing that PIF rates have remained constant since 2003, it is prudent to also examine the rate of change in Transportation Impact Fees (TIF) and School Impact Fees (SIF) for the same time periods. The following tables illustrate by TIF and SIF districts the percentage increase in impact fee rates between 2002
Engineering News Record
Costruction Cost IndexValue
% Increase
(2003‐2016)
January 2003 6581
November 2015 * 10092
PIF Development Cost per Acre Value% Increase
(2003‐2016)
Current Cost per Acre $81,911
Proposed Cost per Acre $139,841
* Note: ENR CCI latest available data
70.7%
53.4%
Clark County, Park Impact FeesHistorica l Comparison between 2002 (Current) & 2016 (Proposed)
Park Impact Fee District SFR MFR SFR MFR SFR MFR
1 $2,133 $1,558 N/A N/A ‐ ‐
2 $2,668 $1,949 N/A N/A ‐ ‐
3 $2,282 $1,667 N/A N/A ‐ ‐
4 $1,998 $1,460 N/A N/A ‐ ‐
5 $1,799 $1,314 $4,353 $3,359 142.0% 155.7%
6 $1,543 $1,127 $5,572 $4,300 261.1% 281.5%
7 $1,885 $1,377 $4,252 $3,282 125.6% 138.3%
8 $1,800 $1,315 $3,959 $3,055 119.9% 132.3%
9 $2,016 $1,472 $5,500 $4,244 172.8% 188.3%
10 $1,534 $1,120 $3,852 $2,973 151.1% 165.4%
Average Increase 162.1% 176.9%
2002 Proposed 2016 % Increase ('02‐'16)
9 PIF Technical Document (2016)
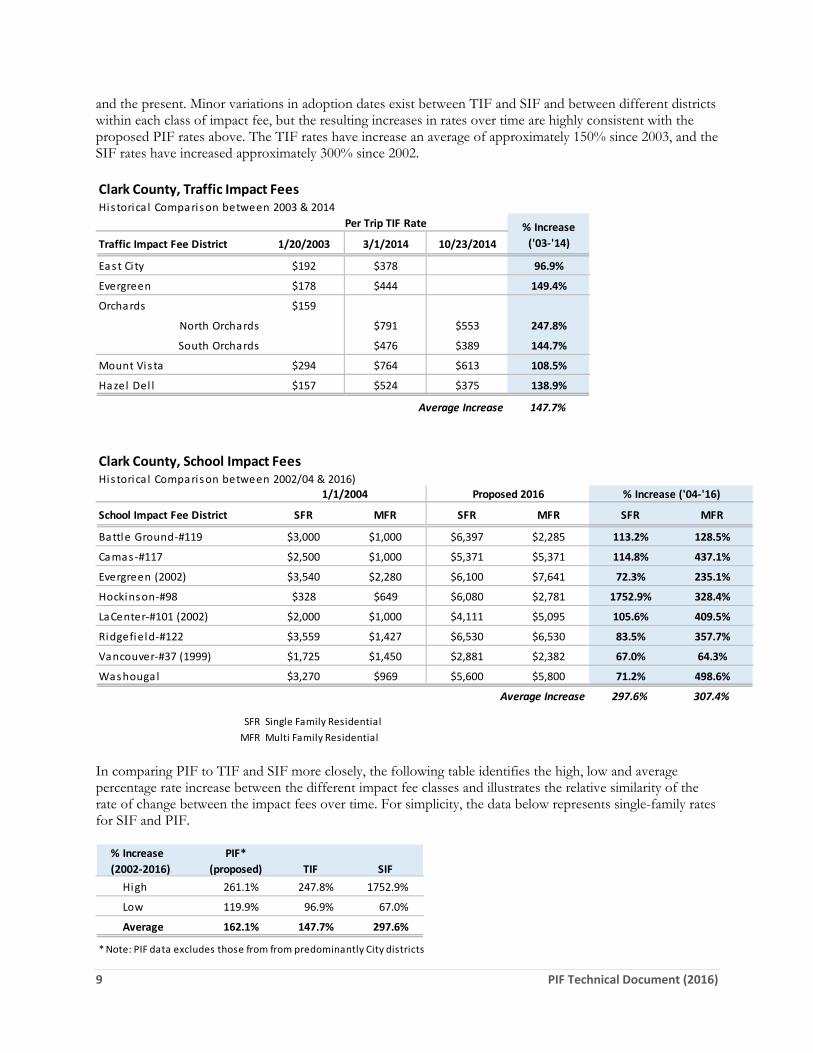
and the present. Minor variations in adoption dates exist between TIF and SIF and between different districts within each class of impact fee, but the resulting increases in rates over time are highly consistent with the proposed PIF rates above. The TIF rates have increase an average of approximately 150% since 2003, and the SIF rates have increased approximately 300% since 2002.
In comparing PIF to TIF and SIF more closely, the following table identifies the high, low and average percentage rate increase between the different impact fee classes and illustrates the relative similarity of the rate of change between the impact fees over time. For simplicity, the data below represents single-family rates for SIF and PIF.
Clark County, Traffic Impact FeesHistorica l Comparison between 2003 & 2014
Traffic Impact Fee District 1/20/2003 3/1/2014 10/23/2014
East City $192 $378 96.9%
Evergreen $178 $444 149.4%
Orchards $159
North Orchards $791 $553 247.8%
South Orchards $476 $389 144.7%
Mount Vista $294 $764 $613 108.5%
Hazel Del l $157 $524 $375 138.9%
Average Increase 147.7%
Clark County, School Impact FeesHistorica l Comparison between 2002/04 & 2016)
School Impact Fee District SFR MFR SFR MFR SFR MFR
Battle Ground‐#119 $3,000 $1,000 $6,397 $2,285 113.2% 128.5%
Camas ‐#117 $2,500 $1,000 $5,371 $5,371 114.8% 437.1%
Evergreen (2002) $3,540 $2,280 $6,100 $7,641 72.3% 235.1%
Hockinson‐#98 $328 $649 $6,080 $2,781 1752.9% 328.4%
LaCenter‐#101 (2002) $2,000 $1,000 $4,111 $5,095 105.6% 409.5%
Ridgefield‐#122 $3,559 $1,427 $6,530 $6,530 83.5% 357.7%
Vancouver‐#37 (1999) $1,725 $1,450 $2,881 $2,382 67.0% 64.3%
Washouga l $3,270 $969 $5,600 $5,800 71.2% 498.6%
Average Increase 297.6% 307.4%
SFR Single Family Residential
MFR Multi Family Residential
Per Trip TIF Rate
1/1/2004 Proposed 2016 % Increase ('04‐'16)
% Increase
('03‐'14)
% Increase
(2002‐2016)
PIF*
(proposed) TIF SIF
High 261.1% 247.8% 1752.9%
Low 119.9% 96.9% 67.0%
Average 162.1% 147.7% 297.6%
* Note: PIF data excludes those from from predominantly City districts
10 PIF Technical Document (2016)
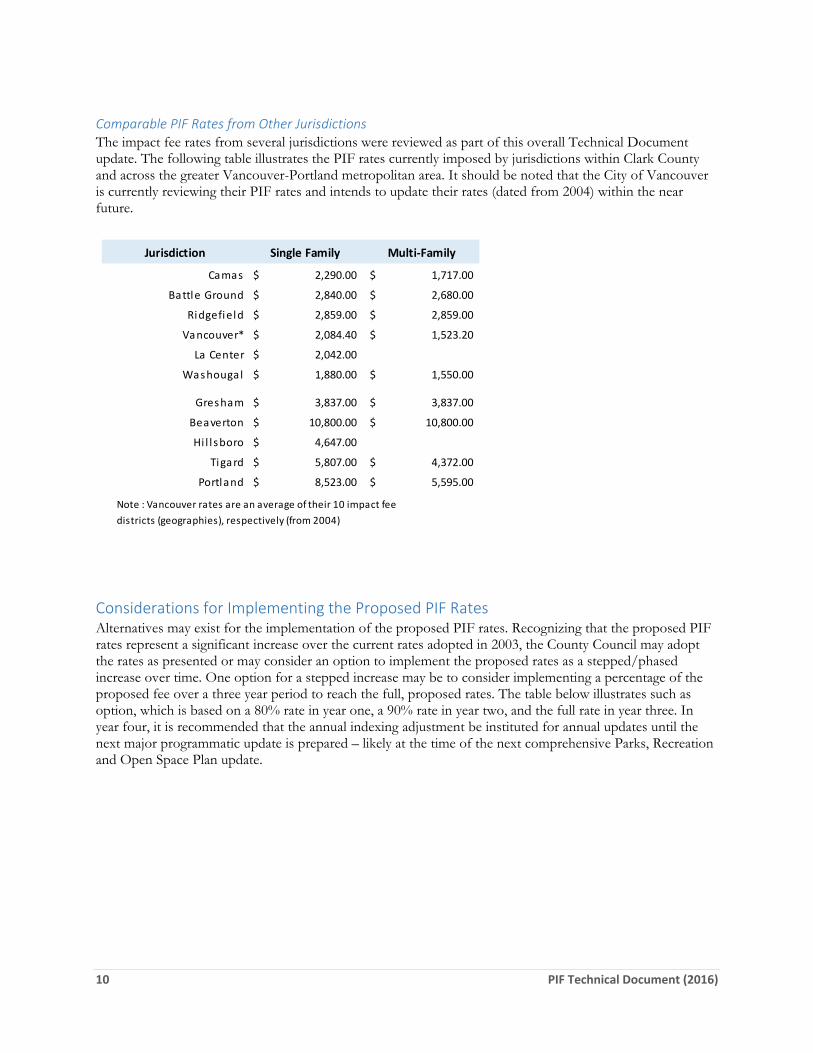
Comparable PIF Rates from Other Jurisdictions The impact fee rates from several jurisdictions were reviewed as part of this overall Technical Document update. The following table illustrates the PIF rates currently imposed by jurisdictions within Clark County and across the greater Vancouver-Portland metropolitan area. It should be noted that the City of Vancouver is currently reviewing their PIF rates and intends to update their rates (dated from 2004) within the near future.
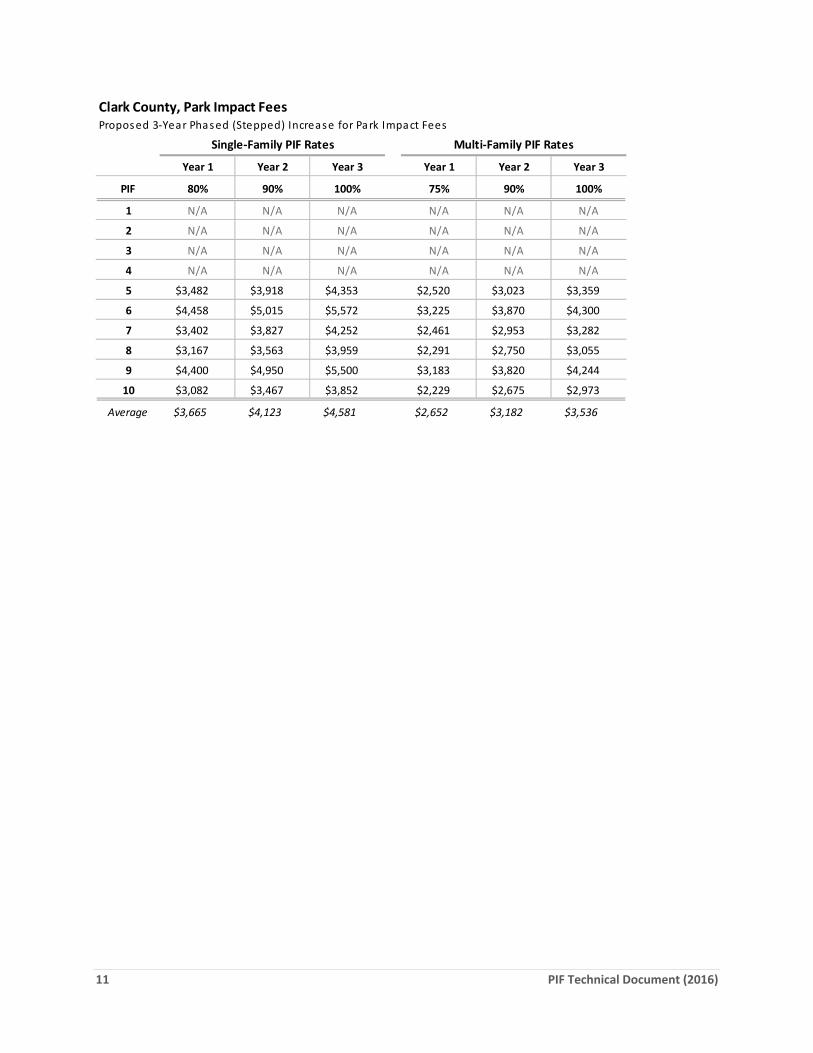
Considerations for Implementing the Proposed PIF Rates Alternatives may exist for the implementation of the proposed PIF rates. Recognizing that the proposed PIF rates represent a significant increase over the current rates adopted in 2003, the County Council may adopt the rates as presented or may consider an option to implement the proposed rates as a stepped/phased increase over time. One option for a stepped increase may be to consider implementing a percentage of the proposed fee over a three year period to reach the full, proposed rates. The table below illustrates such as option, which is based on a 80% rate in year one, a 90% rate in year two, and the full rate in year three. In year four, it is recommended that the annual indexing adjustment be instituted for annual updates until the next major programmatic update is prepared – likely at the time of the next comprehensive Parks, Recreation and Open Space Plan update.
Jurisdiction Single Family Multi‐Family
Camas 2,290.00$ 1,717.00$
Battle Ground 2,840.00$ 2,680.00$
Ridgefield 2,859.00$ 2,859.00$
Vancouver* 2,084.40$ 1,523.20$
La Center 2,042.00$
Washougal 1,880.00$ 1,550.00$
Gresham 3,837.00$ 3,837.00$
Beaverton 10,800.00$ 10,800.00$
Hi l l sboro 4,647.00$
Tigard 5,807.00$ 4,372.00$
Portland 8,523.00$ 5,595.00$
Note : Vancouver rates are an average of their 10 impact fee
districts (geographies), respectively (from 2004)
11 PIF Technical Document (2016)
Clark County, Park Impact FeesProposed 3‐Year Phased (Stepped) Increase for Park Impact Fees
Year 1 Year 2 Year 3 Year 1 Year 2 Year 3
PIF 80% 90% 100% 75% 90% 100%
1 N/A N/A N/A N/A N/A N/A
2 N/A N/A N/A N/A N/A N/A
3 N/A N/A N/A N/A N/A N/A
4 N/A N/A N/A N/A N/A N/A
5 $3,482 $3,918 $4,353 $2,520 $3,023 $3,359
6 $4,458 $5,015 $5,572 $3,225 $3,870 $4,300
7 $3,402 $3,827 $4,252 $2,461 $2,953 $3,282
8 $3,167 $3,563 $3,959 $2,291 $2,750 $3,055
9 $4,400 $4,950 $5,500 $3,183 $3,820 $4,244
10 $3,082 $3,467 $3,852 $2,229 $2,675 $2,973
Average $3,665 $4,123 $4,581 $2,652 $3,182 $3,536
Single‐Family PIF Rates Multi‐Family PIF Rates
12 PIF Technical Document (2016)
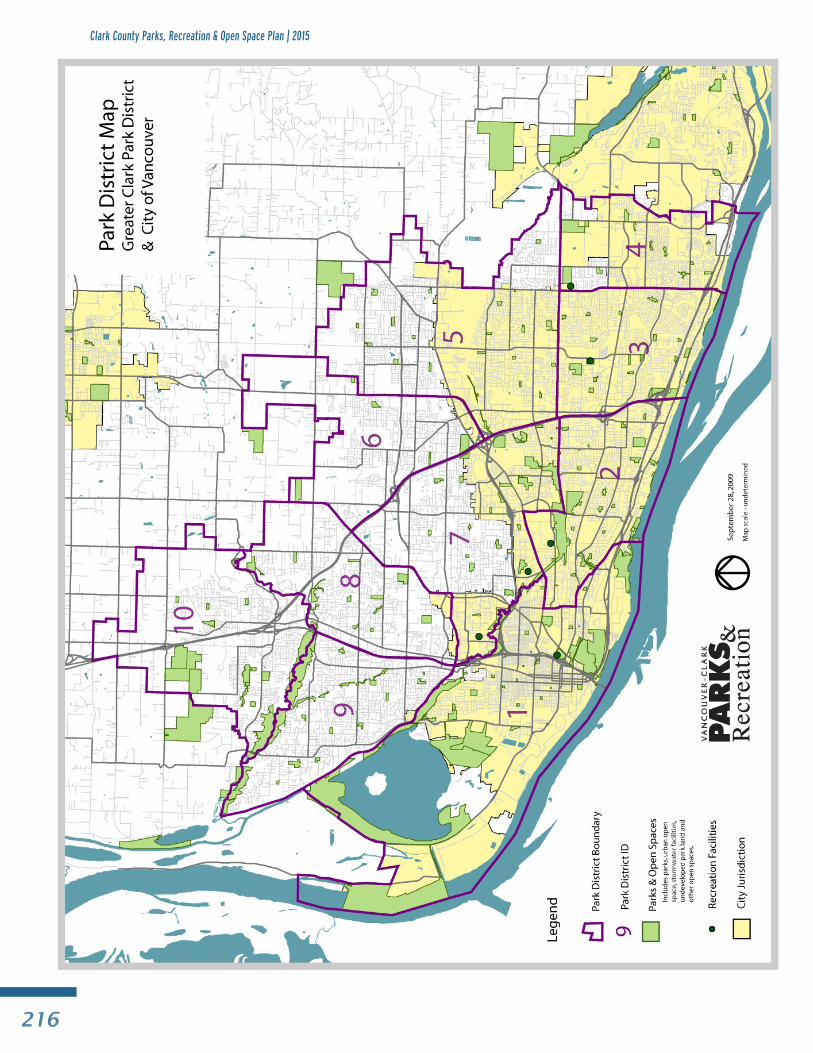
Park Impact Fee District Map
13 PIF Technical Document (2016)
Supporting Documentation
2016 Land Values by PIF District (2011‐2016)
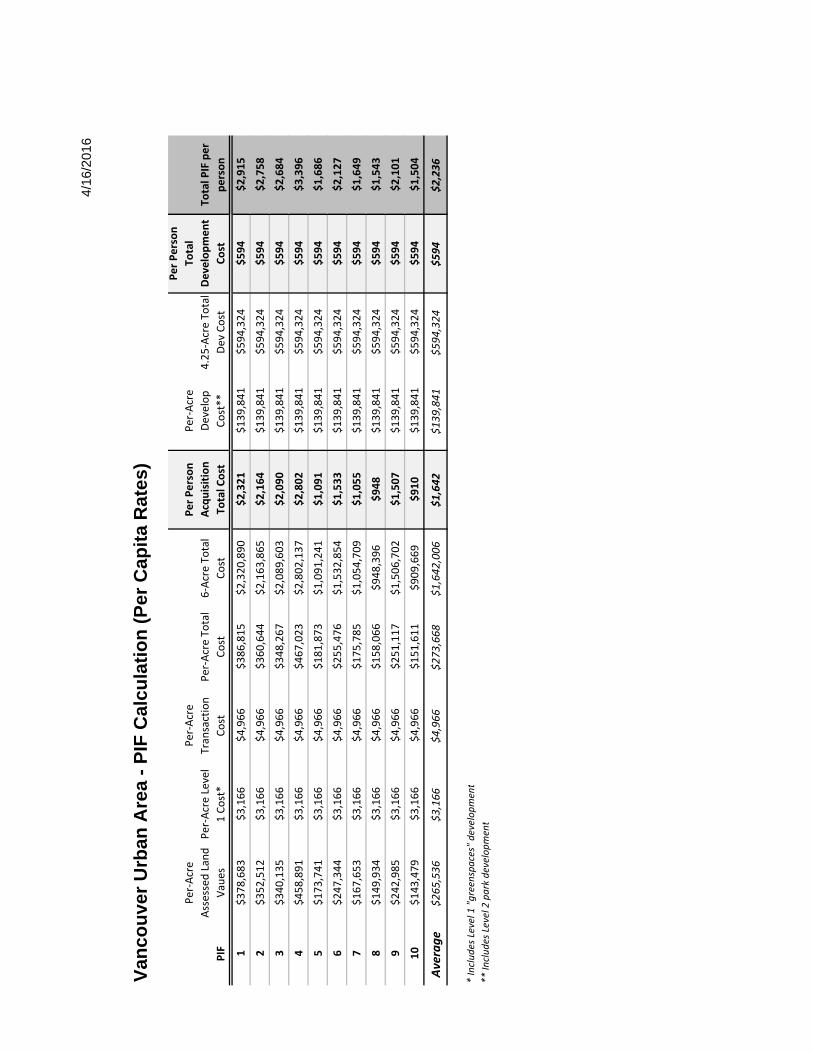
2016 Per Person PIF Rate Data Table
2009 PIF Technical Document
2007 PIF Program & Rate Calculation (from 2007
Vancouver‐Clark Parks, Recreation & Open Space Plan)
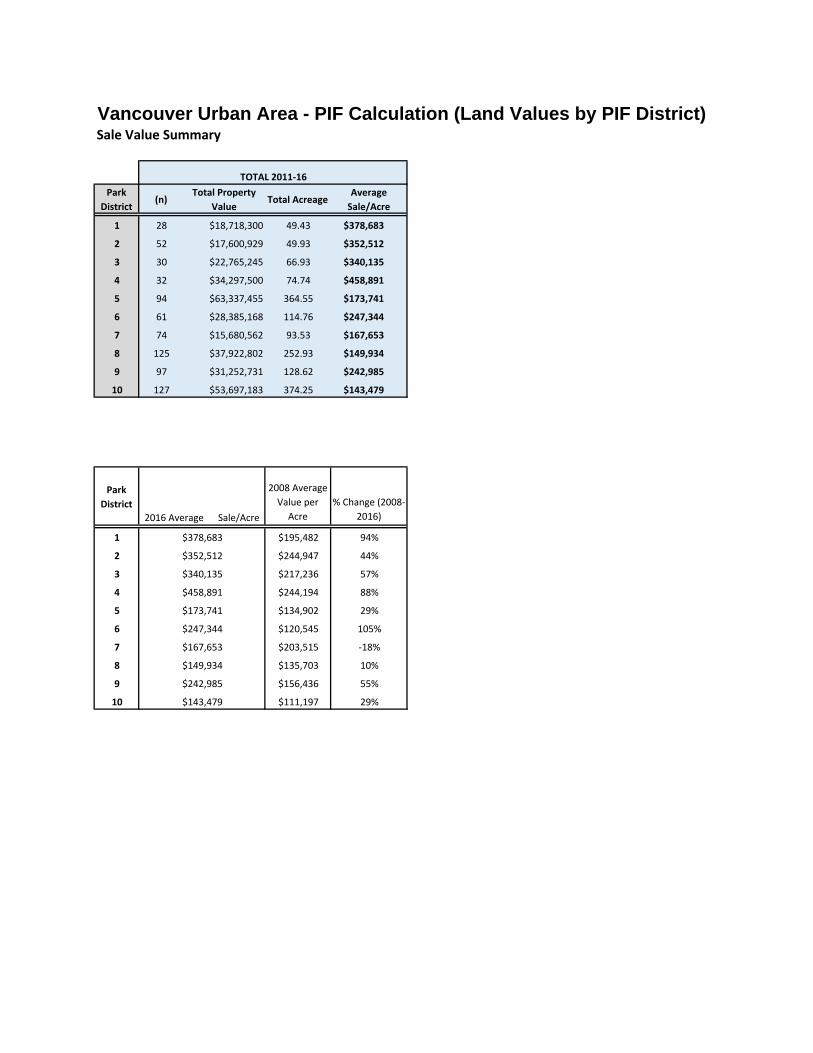
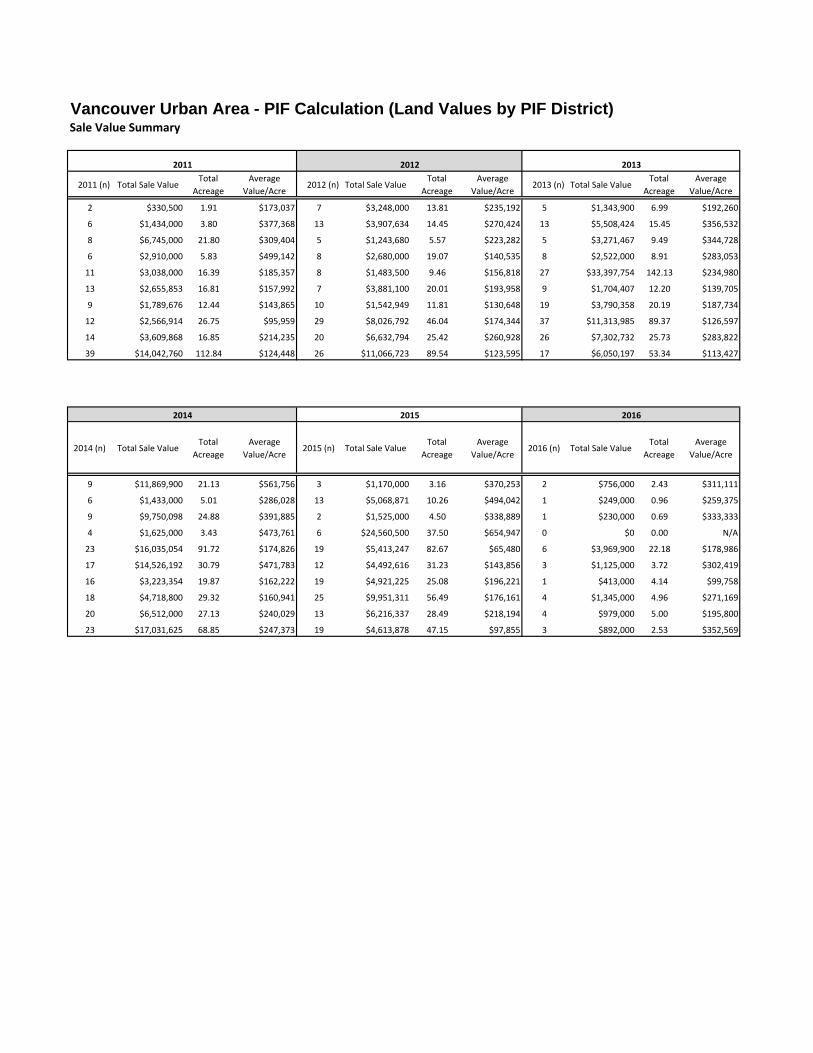
Vancouver Urban Area - PIF Calculation (Land Values by PIF District)Sale Value Summary
Park
District(n)
Total Property
ValueTotal Acreage
Average
Sale/Acre
1 28 $18,718,300 49.43 $378,683
2 52 $17,600,929 49.93 $352,512
3 30 $22,765,245 66.93 $340,135
4 32 $34,297,500 74.74 $458,891
5 94 $63,337,455 364.55 $173,741
6 61 $28,385,168 114.76 $247,344
7 74 $15,680,562 93.53 $167,653
8 125 $37,922,802 252.93 $149,934
9 97 $31,252,731 128.62 $242,985
10 127 $53,697,183 374.25 $143,479
Park
District
2008 Average
Value per
Acre
% Change (2008‐
2016)
1 $195,482 94%
2 $244,947 44%
3 $217,236 57%
4 $244,194 88%
5 $134,902 29%
6 $120,545 105%
7 $203,515 ‐18%
8 $135,703 10%
9 $156,436 55%
10 $111,197 29%
$149,934
$242,985
$143,479
$352,512
$340,135
$458,891
$173,741
$247,344
$167,653
2016 Average Sale/Acre
$378,683
TOTAL 2011‐16
Vancouver Urban Area - PIF Calculation (Land Values by PIF District)Sale Value Summary
2011 (n) Total Sale ValueTotal
Acreage
Average
Value/Acre2012 (n) Total Sale Value
Total
Acreage
Average
Value/Acre2013 (n) Total Sale Value
Total
Acreage
Average
Value/Acre
2 $330,500 1.91 $173,037 7 $3,248,000 13.81 $235,192 5 $1,343,900 6.99 $192,260
6 $1,434,000 3.80 $377,368 13 $3,907,634 14.45 $270,424 13 $5,508,424 15.45 $356,532
8 $6,745,000 21.80 $309,404 5 $1,243,680 5.57 $223,282 5 $3,271,467 9.49 $344,728
6 $2,910,000 5.83 $499,142 8 $2,680,000 19.07 $140,535 8 $2,522,000 8.91 $283,053
11 $3,038,000 16.39 $185,357 8 $1,483,500 9.46 $156,818 27 $33,397,754 142.13 $234,980
13 $2,655,853 16.81 $157,992 7 $3,881,100 20.01 $193,958 9 $1,704,407 12.20 $139,705
9 $1,789,676 12.44 $143,865 10 $1,542,949 11.81 $130,648 19 $3,790,358 20.19 $187,734
12 $2,566,914 26.75 $95,959 29 $8,026,792 46.04 $174,344 37 $11,313,985 89.37 $126,597
14 $3,609,868 16.85 $214,235 20 $6,632,794 25.42 $260,928 26 $7,302,732 25.73 $283,822
39 $14,042,760 112.84 $124,448 26 $11,066,723 89.54 $123,595 17 $6,050,197 53.34 $113,427
2014 (n) Total Sale ValueTotal
Acreage
Average
Value/Acre2015 (n) Total Sale Value
Total
Acreage
Average
Value/Acre2016 (n) Total Sale Value
Total
Acreage
Average
Value/Acre
9 $11,869,900 21.13 $561,756 3 $1,170,000 3.16 $370,253 2 $756,000 2.43 $311,111
6 $1,433,000 5.01 $286,028 13 $5,068,871 10.26 $494,042 1 $249,000 0.96 $259,375
9 $9,750,098 24.88 $391,885 2 $1,525,000 4.50 $338,889 1 $230,000 0.69 $333,333
4 $1,625,000 3.43 $473,761 6 $24,560,500 37.50 $654,947 0 $0 0.00 N/A
23 $16,035,054 91.72 $174,826 19 $5,413,247 82.67 $65,480 6 $3,969,900 22.18 $178,986
17 $14,526,192 30.79 $471,783 12 $4,492,616 31.23 $143,856 3 $1,125,000 3.72 $302,419
16 $3,223,354 19.87 $162,222 19 $4,921,225 25.08 $196,221 1 $413,000 4.14 $99,758
18 $4,718,800 29.32 $160,941 25 $9,951,311 56.49 $176,161 4 $1,345,000 4.96 $271,169
20 $6,512,000 27.13 $240,029 13 $6,216,337 28.49 $218,194 4 $979,000 5.00 $195,800
23 $17,031,625 68.85 $247,373 19 $4,613,878 47.15 $97,855 3 $892,000 2.53 $352,569
2014 2015 2016
2011 2012 2013
4/16
/201
6
Van
cou
ver
Urb
an A
rea
- P
IF C
alcu
lati
on
(P
er C
apit
a R
ates
)
PIF
Per‐Acre
Assessed Land
Vaues
Per‐Acre Level
1 Cost*
Per‐Acre
Transaction
Cost
Per‐Acre To
tal
Cost
6‐Acre To
tal
Cost
Per Person
Acquisition
Total Cost
Per‐Acre
Develop
Cost**
4.25‐Acre To
tal
Dev Cost
Per Person
Total
Development
Cost
Total PIF per
person
1$378,683
$3,166
$4,966
$386,815
$2,320,890
$2,321
$139,841
$594,324
$594
$2,915
2$352,512
$3,166
$4,966
$360,644
$2,163,865
$2,164
$139,841
$594,324
$594
$2,758
3$340,135
$3,166
$4,966
$348,267
$2,089,603
$2,090
$139,841
$594,324
$594
$2,684
4$458,891
$3,166
$4,966
$467,023
$2,802,137
$2,802
$139,841
$594,324
$594
$3,396
5$173,741
$3,166
$4,966
$181,873
$1,091,241
$1,091
$139,841
$594,324
$594
$1,686
6$247,344
$3,166
$4,966
$255,476
$1,532,854
$1,533
$139,841
$594,324
$594
$2,127
7$167,653
$3,166
$4,966
$175,785
$1,054,709
$1,055
$139,841
$594,324
$594
$1,649
8$149,934
$3,166
$4,966
$158,066
$948,396
$948
$139,841
$594,324
$594
$1,543
9$242,985
$3,166
$4,966
$251,117
$1,506,702
$1,507
$139,841
$594,324
$594
$2,101
10
$143,479
$3,166
$4,966
$151,611
$909,669
$910
$139,841
$594,324
$594
$1,504
Average
$265,536
$3,166
$4,966
$273,668
$1,642,006
$1,642
$139,841
$594,324
$594
$2,236
* Includes Level 1 "greenspaces" development
** Includes Level 2 park development
�0�
We create community through people, parks, programs and partnerships.
P.O. Box 1995 - Vancouver, WA 98668-1995 (360) 619-1111 - www.vanclarkparks-rec.org
VANCOUVER-CLARKPARKS AND RECREATION
PARK IMPACT FEE
TECHNICAL DOCUMENT
November 1, 2009
Clark County Parks, Recreation & Open Space Plan | 2015
�0�
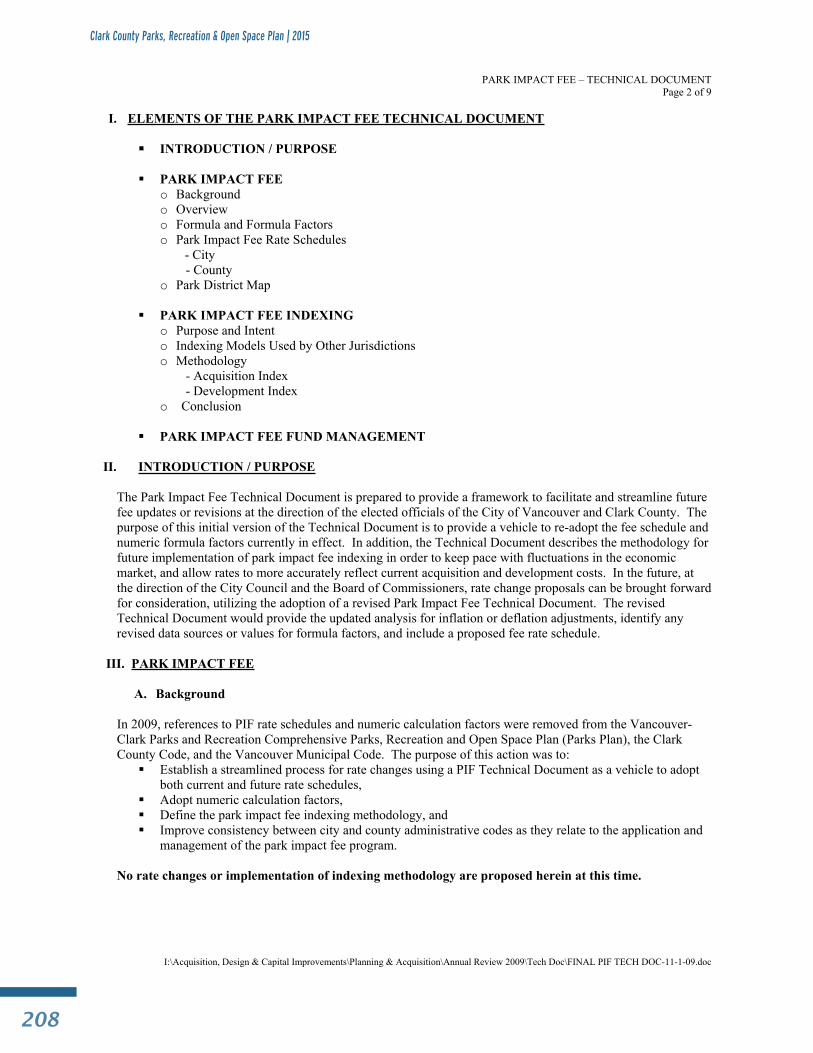
PARK IMPACT FEE – TECHNICAL DOCUMENT Page 2 of 9
I. ELEMENTS OF THE PARK IMPACT FEE TECHNICAL DOCUMENT
INTRODUCTION / PURPOSE
PARK IMPACT FEE o Backgroundo Overviewo Formula and Formula Factors o Park Impact Fee Rate Schedules
- City - County
o Park District Map
PARK IMPACT FEE INDEXING o Purpose and Intent o Indexing Models Used by Other Jurisdictions o Methodology
- Acquisition Index - Development Index
o Conclusion
PARK IMPACT FEE FUND MANAGEMENT
II. INTRODUCTION / PURPOSE
The Park Impact Fee Technical Document is prepared to provide a framework to facilitate and streamline future fee updates or revisions at the direction of the elected officials of the City of Vancouver and Clark County. The purpose of this initial version of the Technical Document is to provide a vehicle to re-adopt the fee schedule and numeric formula factors currently in effect. In addition, the Technical Document describes the methodology for future implementation of park impact fee indexing in order to keep pace with fluctuations in the economic market, and allow rates to more accurately reflect current acquisition and development costs. In the future, at the direction of the City Council and the Board of Commissioners, rate change proposals can be brought forward for consideration, utilizing the adoption of a revised Park Impact Fee Technical Document. The revised Technical Document would provide the updated analysis for inflation or deflation adjustments, identify any revised data sources or values for formula factors, and include a proposed fee rate schedule.
III. PARK IMPACT FEE
A. Background
In 2009, references to PIF rate schedules and numeric calculation factors were removed from the Vancouver-Clark Parks and Recreation Comprehensive Parks, Recreation and Open Space Plan (Parks Plan), the Clark County Code, and the Vancouver Municipal Code. The purpose of this action was to:
Establish a streamlined process for rate changes using a PIF Technical Document as a vehicle to adopt both current and future rate schedules, Adopt numeric calculation factors, Define the park impact fee indexing methodology, and Improve consistency between city and county administrative codes as they relate to the application and management of the park impact fee program.
No rate changes or implementation of indexing methodology are proposed herein at this time.
I:\Acquisition, Design & Capital Improvements\Planning & Acquisition\Annual Review 2009\Tech Doc\FINAL PIF TECH DOC-11-1-09.doc
�0�
PARK IMPACT FEE – TECHNICAL DOCUMENT Page 3 of 9
nts\Planning & Acquisition\Annual Review 2009\Tech Doc\FINAL PIF TECH DOC-11-1-09.doc
B. Overview
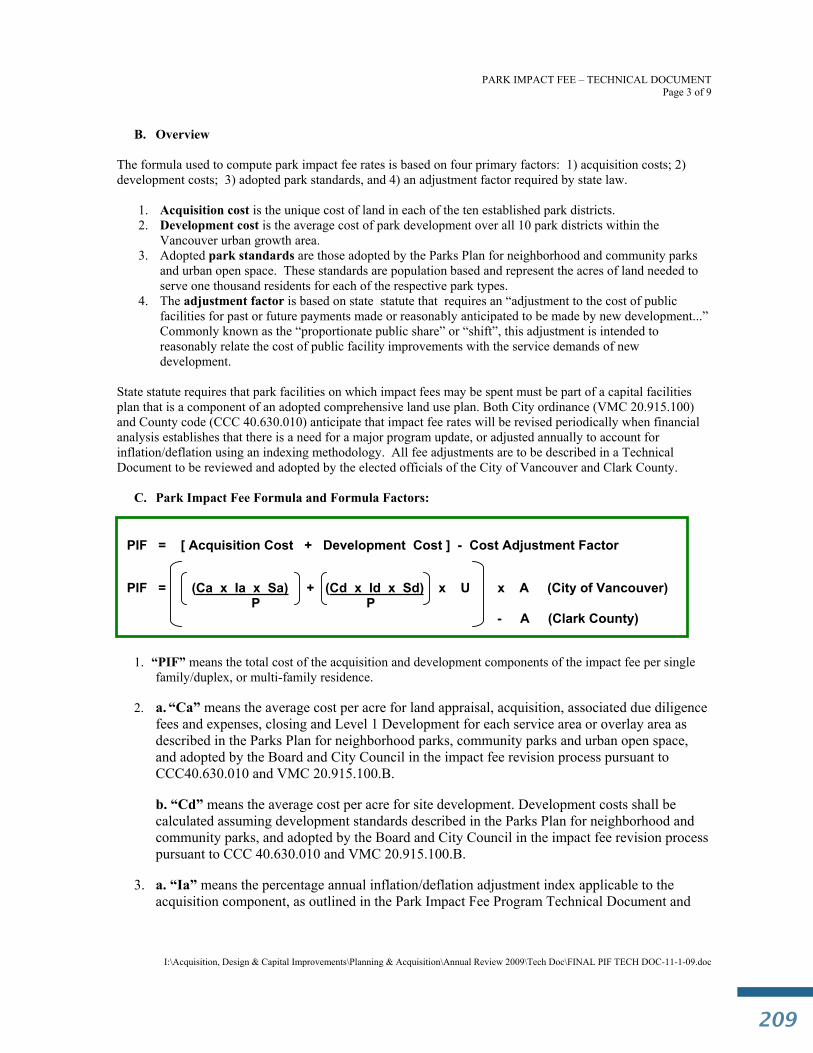
The formula used to compute park impact fee rates is based on four primary factors: 1) acquisition costs; 2) development costs; 3) adopted park standards, and 4) an adjustment factor required by state law.
1. Acquisition cost is the unique cost of land in each of the ten established park districts. 2. Development cost is the average cost of park development over all 10 park districts within the
Vancouver urban growth area. 3. Adopted park standards are those adopted by the Parks Plan for neighborhood and community parks
and urban open space. These standards are population based and represent the acres of land needed to serve one thousand residents for each of the respective park types.
4. The adjustment factor is based on state statute that requires an “adjustment to the cost of public facilities for past or future payments made or reasonably anticipated to be made by new development...” Commonly known as the “proportionate public share” or “shift”, this adjustment is intended to reasonably relate the cost of public facility improvements with the service demands of new development.
State statute requires that park facilities on which impact fees may be spent must be part of a capital facilities plan that is a component of an adopted comprehensive land use plan. Both City ordinance (VMC 20.915.100) and County code (CCC 40.630.010) anticipate that impact fee rates will be revised periodically when financial analysis establishes that there is a need for a major program update, or adjusted annually to account for inflation/deflation using an indexing methodology. All fee adjustments are to be described in a Technical Document to be reviewed and adopted by the elected officials of the City of Vancouver and Clark County.
C. Park Impact Fee Formula and Formula Factors:
PIF = [ Acquisition Cost + Development Cost ] - Cost Adjustment Factor
PIF = (Ca x Ia x Sa) + (Cd x Id x Sd) x U x A (City of Vancouver) P P
- A (Clark County)
1. “PIF” means the total cost of the acquisition and development components of the impact fee per single family/duplex, or multi-family residence.
2. a. “Ca” means the average cost per acre for land appraisal, acquisition, associated due diligence fees and expenses, closing and Level 1 Development for each service area or overlay area as described in the Parks Plan for neighborhood parks, community parks and urban open space, and adopted by the Board and City Council in the impact fee revision process pursuant to CCC40.630.010 and VMC 20.915.100.B.
b. “Cd” means the average cost per acre for site development. Development costs shall be calculated assuming development standards described in the Parks Plan for neighborhood and community parks, and adopted by the Board and City Council in the impact fee revision process pursuant to CCC 40.630.010 and VMC 20.915.100.B.
3. a. “Ia” means the percentage annual inflation/deflation adjustment index applicable to the acquisition component, as outlined in the Park Impact Fee Program Technical Document and
I:\Acquisition, Design & Capital Improveme
Clark County Parks, Recreation & Open Space Plan | 2015
��0
PARK IMPACT FEE – TECHNICAL DOCUMENT Page 4 of 9
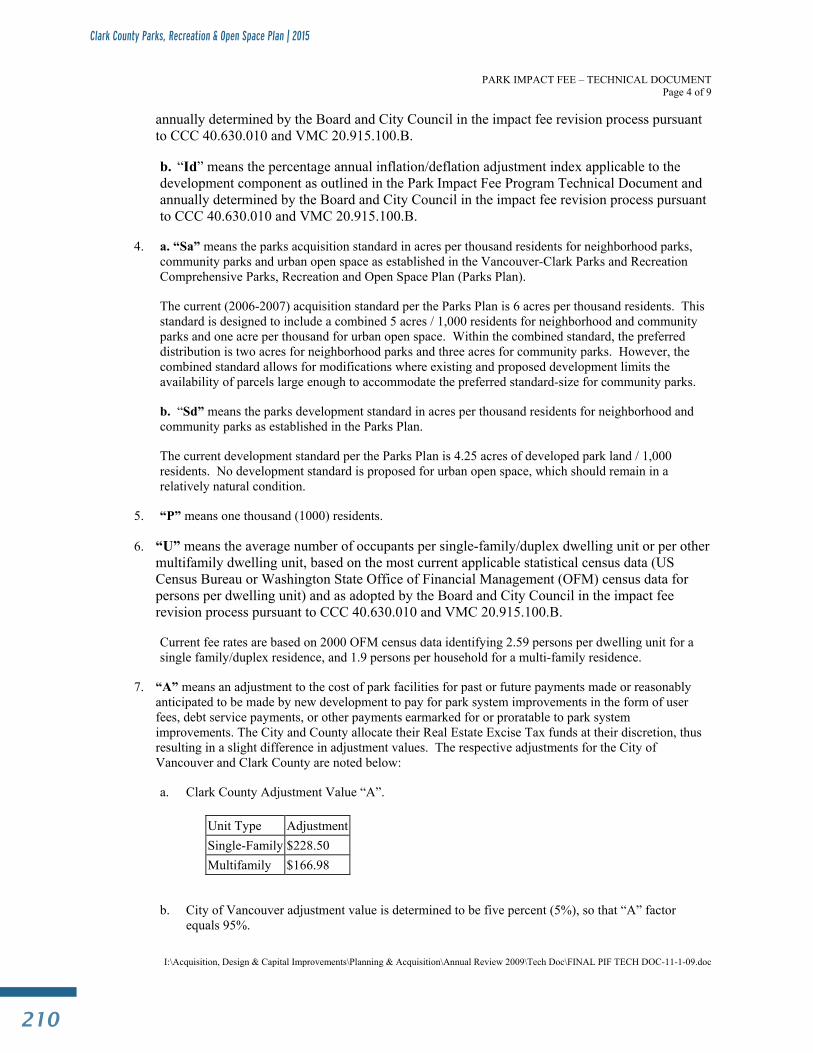
annually determined by the Board and City Council in the impact fee revision process pursuant to CCC 40.630.010 and VMC 20.915.100.B.
b. “Id” means the percentage annual inflation/deflation adjustment index applicable to the development component as outlined in the Park Impact Fee Program Technical Document and annually determined by the Board and City Council in the impact fee revision process pursuant to CCC 40.630.010 and VMC 20.915.100.B.
4. a. “Sa” means the parks acquisition standard in acres per thousand residents for neighborhood parks, community parks and urban open space as established in the Vancouver-Clark Parks and Recreation Comprehensive Parks, Recreation and Open Space Plan (Parks Plan).
The current (2006-2007) acquisition standard per the Parks Plan is 6 acres per thousand residents. This standard is designed to include a combined 5 acres / 1,000 residents for neighborhood and community parks and one acre per thousand for urban open space. Within the combined standard, the preferred distribution is two acres for neighborhood parks and three acres for community parks. However, the combined standard allows for modifications where existing and proposed development limits the availability of parcels large enough to accommodate the preferred standard-size for community parks.
b. “Sd” means the parks development standard in acres per thousand residents for neighborhood and community parks as established in the Parks Plan.
The current development standard per the Parks Plan is 4.25 acres of developed park land / 1,000 residents. No development standard is proposed for urban open space, which should remain in a relatively natural condition.
5. “P” means one thousand (1000) residents.
6. “U” means the average number of occupants per single-family/duplex dwelling unit or per other multifamily dwelling unit, based on the most current applicable statistical census data (US Census Bureau or Washington State Office of Financial Management (OFM) census data for persons per dwelling unit) and as adopted by the Board and City Council in the impact fee revision process pursuant to CCC 40.630.010 and VMC 20.915.100.B.
Current fee rates are based on 2000 OFM census data identifying 2.59 persons per dwelling unit for a single family/duplex residence, and 1.9 persons per household for a multi-family residence.
7. “A” means an adjustment to the cost of park facilities for past or future payments made or reasonably anticipated to be made by new development to pay for park system improvements in the form of user fees, debt service payments, or other payments earmarked for or proratable to park system improvements. The City and County allocate their Real Estate Excise Tax funds at their discretion, thus resulting in a slight difference in adjustment values. The respective adjustments for the City of Vancouver and Clark County are noted below:
a. Clark County Adjustment Value “A”.
Unit Type AdjustmentSingle-Family $228.50 Multifamily $166.98
b. City of Vancouver adjustment value is determined to be five percent (5%), so that “A” factor equals 95%.
I:\Acquisition, Design & Capital Improvements\Planning & Acquisition\Annual Review 2009\Tech Doc\FINAL PIF TECH DOC-11-1-09.doc
���
PARK IMPACT FEE – TECHNICAL DOCUMENT Page 5 of 9
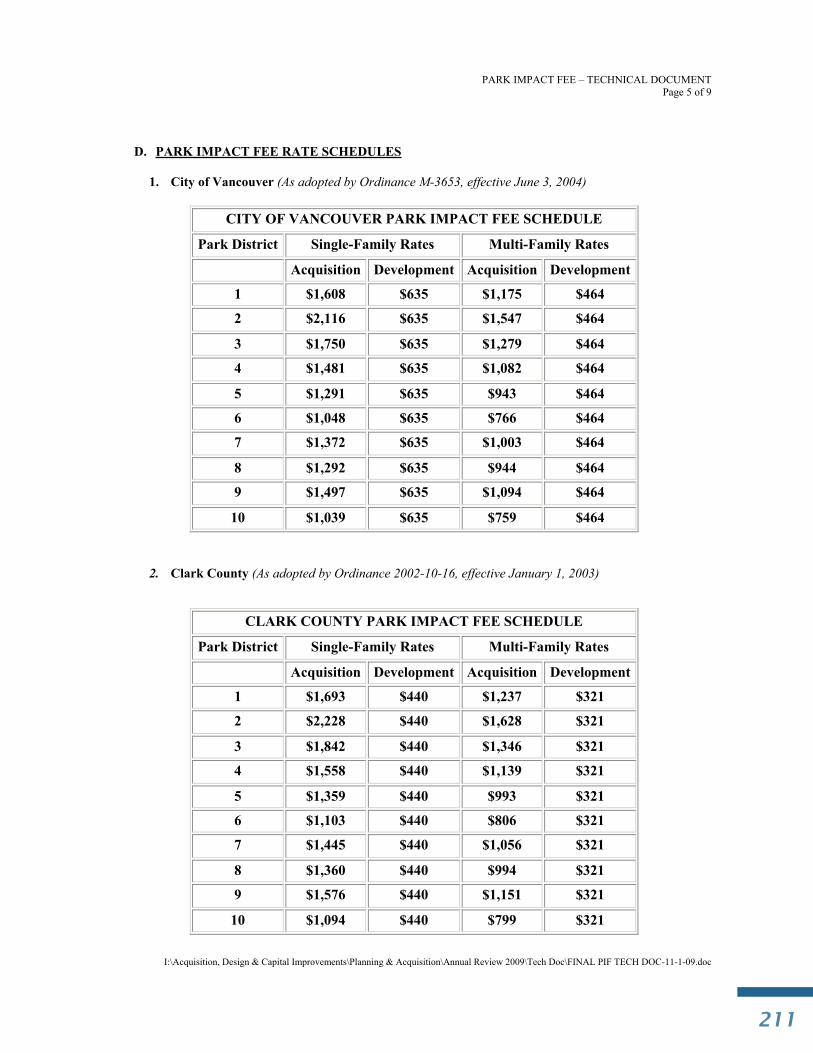
D. PARK IMPACT FEE RATE SCHEDULES
1. City of Vancouver (As adopted by Ordinance M-3653, effective June 3, 2004)
CITY OF VANCOUVER PARK IMPACT FEE SCHEDULE
Park District Single-Family Rates Multi-Family Rates
Acquisition Development Acquisition Development
1 $1,608 $635 $1,175 $464
2 $2,116 $635 $1,547 $464
3 $1,750 $635 $1,279 $464
4 $1,481 $635 $1,082 $464
5 $1,291 $635 $943 $464
6 $1,048 $635 $766 $464
7 $1,372 $635 $1,003 $464
8 $1,292 $635 $944 $464
9 $1,497 $635 $1,094 $464
10 $1,039 $635 $759 $464
2. Clark County (As adopted by Ordinance 2002-10-16, effective January 1, 2003)
CLARK COUNTY PARK IMPACT FEE SCHEDULE
Park District Single-Family Rates Multi-Family Rates
Acquisition Development Acquisition Development
1 $1,693 $440 $1,237 $321
2 $2,228 $440 $1,628 $321
3 $1,842 $440 $1,346 $321
4 $1,558 $440 $1,139 $321
5 $1,359 $440 $993 $321
6 $1,103 $440 $806 $321
7 $1,445 $440 $1,056 $321
8 $1,360 $440 $994 $321
9 $1,576 $440 $1,151 $321
10 $1,094 $440 $799 $321
I:\Acquisition, Design & Capital Improvements\Planning & Acquisition\Annual Review 2009\Tech Doc\FINAL PIF TECH DOC-11-1-09.doc
Clark County Parks, Recreation & Open Space Plan | 2015
���
PARK IMPACT FEE – TECHNICAL DOCUMENT Page 6 of 9
IV. PARK IMPACT FEE INDEX
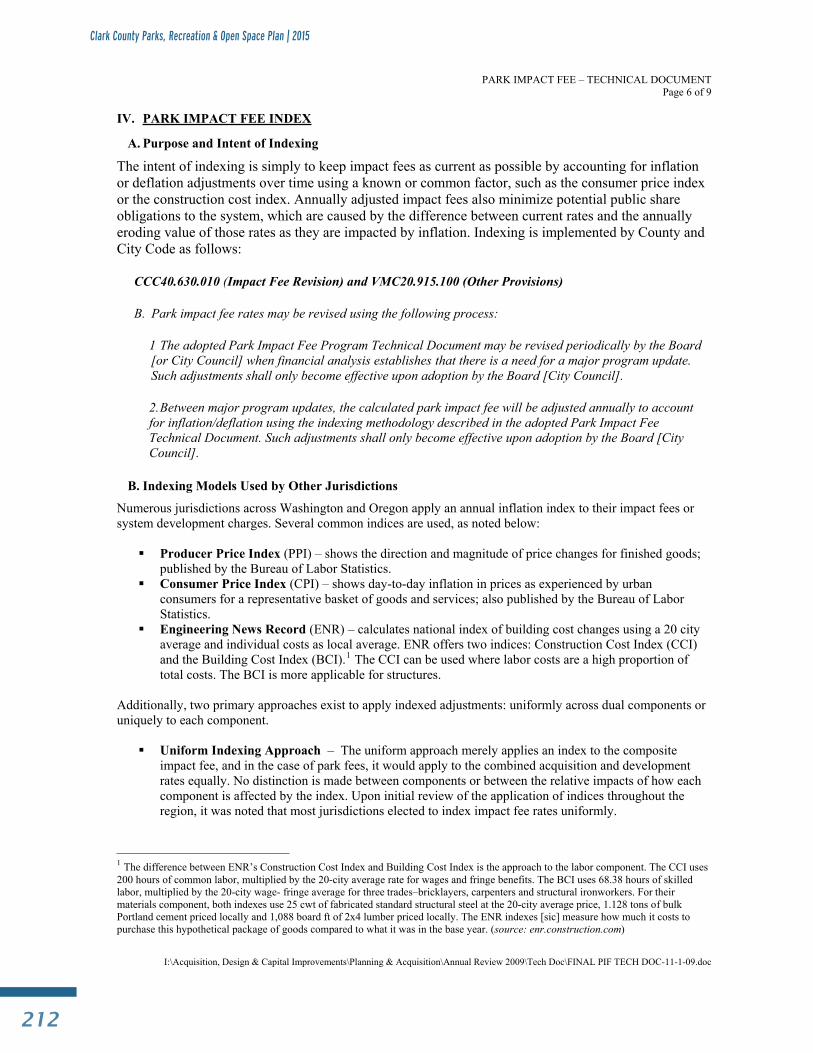
A. Purpose and Intent of Indexing
The intent of indexing is simply to keep impact fees as current as possible by accounting for inflation or deflation adjustments over time using a known or common factor, such as the consumer price index or the construction cost index. Annually adjusted impact fees also minimize potential public share obligations to the system, which are caused by the difference between current rates and the annually eroding value of those rates as they are impacted by inflation. Indexing is implemented by County and City Code as follows:
CCC40.630.010 (Impact Fee Revision) and VMC20.915.100 (Other Provisions)
B. Park impact fee rates may be revised using the following process:
1 The adopted Park Impact Fee Program Technical Document may be revised periodically by the Board [or City Council] when financial analysis establishes that there is a need for a major program update. Such adjustments shall only become effective upon adoption by the Board [City Council].
2. Between major program updates, the calculated park impact fee will be adjusted annually to account for inflation/deflation using the indexing methodology described in the adopted Park Impact Fee Technical Document. Such adjustments shall only become effective upon adoption by the Board [City Council].
B. Indexing Models Used by Other Jurisdictions
Numerous jurisdictions across Washington and Oregon apply an annual inflation index to their impact fees or system development charges. Several common indices are used, as noted below:
Producer Price Index (PPI) – shows the direction and magnitude of price changes for finished goods; published by the Bureau of Labor Statistics. Consumer Price Index (CPI) – shows day-to-day inflation in prices as experienced by urban consumers for a representative basket of goods and services; also published by the Bureau of Labor Statistics.Engineering News Record (ENR) – calculates national index of building cost changes using a 20 city average and individual costs as local average. ENR offers two indices: Construction Cost Index (CCI) and the Building Cost Index (BCI).1 The CCI can be used where labor costs are a high proportion of total costs. The BCI is more applicable for structures.
Additionally, two primary approaches exist to apply indexed adjustments: uniformly across dual components or uniquely to each component.
Uniform Indexing Approach – The uniform approach merely applies an index to the composite impact fee, and in the case of park fees, it would apply to the combined acquisition and development rates equally. No distinction is made between components or between the relative impacts of how each component is affected by the index. Upon initial review of the application of indices throughout the region, it was noted that most jurisdictions elected to index impact fee rates uniformly.
1 The difference between ENR’s Construction Cost Index and Building Cost Index is the approach to the labor component. The CCI uses 200 hours of common labor, multiplied by the 20-city average rate for wages and fringe benefits. The BCI uses 68.38 hours of skilled labor, multiplied by the 20-city wage- fringe average for three trades–bricklayers, carpenters and structural ironworkers. For their materials component, both indexes use 25 cwt of fabricated standard structural steel at the 20-city average price, 1.128 tons of bulk Portland cement priced locally and 1,088 board ft of 2x4 lumber priced locally. The ENR indexes [sic] measure how much it costs to purchase this hypothetical package of goods compared to what it was in the base year. (source: enr.construction.com)
I:\Acquisition, Design & Capital Improvements\Planning & Acquisition\Annual Review 2009\Tech Doc\FINAL PIF TECH DOC-11-1-09.doc
���
PARK IMPACT FEE – TECHNICAL DOCUMENT Page 7 of 9
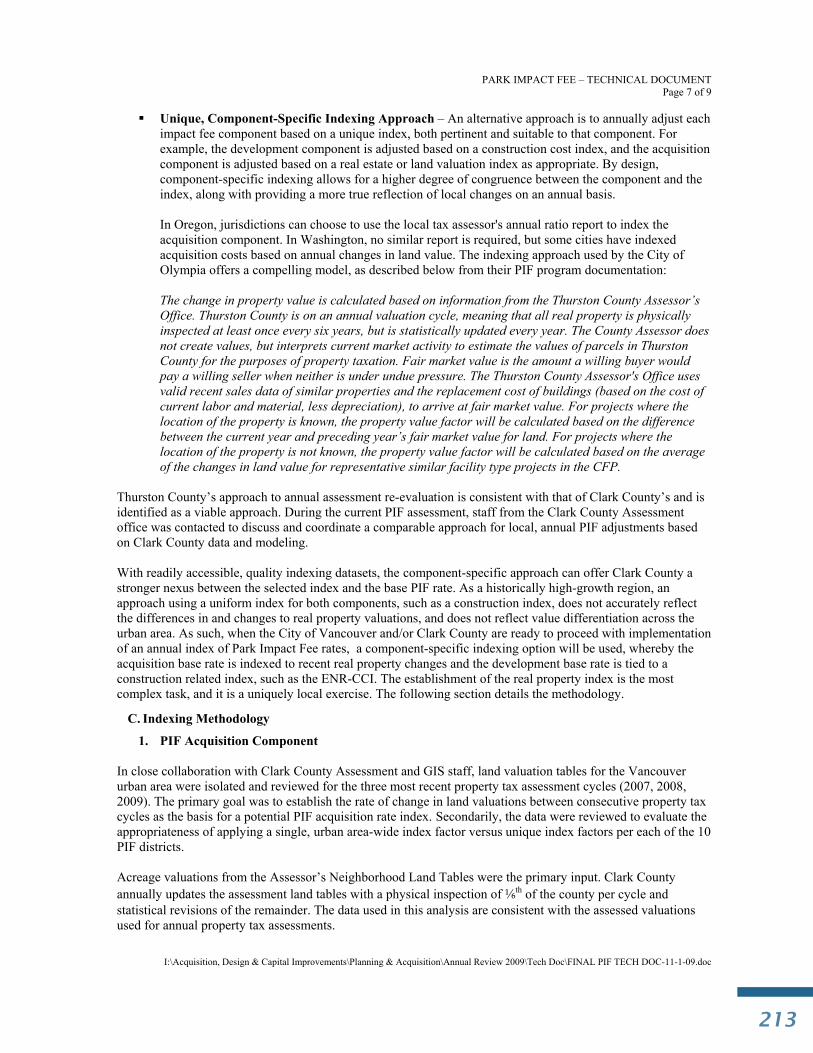
Unique, Component-Specific Indexing Approach – An alternative approach is to annually adjust each impact fee component based on a unique index, both pertinent and suitable to that component. For example, the development component is adjusted based on a construction cost index, and the acquisition component is adjusted based on a real estate or land valuation index as appropriate. By design, component-specific indexing allows for a higher degree of congruence between the component and the index, along with providing a more true reflection of local changes on an annual basis.
In Oregon, jurisdictions can choose to use the local tax assessor's annual ratio report to index the acquisition component. In Washington, no similar report is required, but some cities have indexed acquisition costs based on annual changes in land value. The indexing approach used by the City of Olympia offers a compelling model, as described below from their PIF program documentation:
The change in property value is calculated based on information from the Thurston County Assessor’s Office. Thurston County is on an annual valuation cycle, meaning that all real property is physically inspected at least once every six years, but is statistically updated every year. The County Assessor does not create values, but interprets current market activity to estimate the values of parcels in Thurston County for the purposes of property taxation. Fair market value is the amount a willing buyer would pay a willing seller when neither is under undue pressure. The Thurston County Assessor's Office uses valid recent sales data of similar properties and the replacement cost of buildings (based on the cost of current labor and material, less depreciation), to arrive at fair market value. For projects where the location of the property is known, the property value factor will be calculated based on the difference between the current year and preceding year’s fair market value for land. For projects where the location of the property is not known, the property value factor will be calculated based on the average of the changes in land value for representative similar facility type projects in the CFP.
Thurston County’s approach to annual assessment re-evaluation is consistent with that of Clark County’s and is identified as a viable approach. During the current PIF assessment, staff from the Clark County Assessment office was contacted to discuss and coordinate a comparable approach for local, annual PIF adjustments based on Clark County data and modeling.
With readily accessible, quality indexing datasets, the component-specific approach can offer Clark County a stronger nexus between the selected index and the base PIF rate. As a historically high-growth region, an approach using a uniform index for both components, such as a construction index, does not accurately reflect the differences in and changes to real property valuations, and does not reflect value differentiation across the urban area. As such, when the City of Vancouver and/or Clark County are ready to proceed with implementation of an annual index of Park Impact Fee rates, a component-specific indexing option will be used, whereby the acquisition base rate is indexed to recent real property changes and the development base rate is tied to a construction related index, such as the ENR-CCI. The establishment of the real property index is the most complex task, and it is a uniquely local exercise. The following section details the methodology.
C. Indexing Methodology
1. PIF Acquisition Component
In close collaboration with Clark County Assessment and GIS staff, land valuation tables for the Vancouver urban area were isolated and reviewed for the three most recent property tax assessment cycles (2007, 2008, 2009). The primary goal was to establish the rate of change in land valuations between consecutive property tax cycles as the basis for a potential PIF acquisition rate index. Secondarily, the data were reviewed to evaluate the appropriateness of applying a single, urban area-wide index factor versus unique index factors per each of the 10 PIF districts.
Acreage valuations from the Assessor’s Neighborhood Land Tables were the primary input. Clark County annually updates the assessment land tables with a physical inspection of th of the county per cycle and statistical revisions of the remainder. The data used in this analysis are consistent with the assessed valuations used for annual property tax assessments.
I:\Acquisition, Design & Capital Improvements\Planning & Acquisition\Annual Review 2009\Tech Doc\FINAL PIF TECH DOC-11-1-09.doc
Clark County Parks, Recreation & Open Space Plan | 2015
���
PARK IMPACT FEE – TECHNICAL DOCUMENT Page 8 of 9
nts\Planning & Acquisition\Annual Review 2009\Tech Doc\FINAL PIF TECH DOC-11-1-09.doc
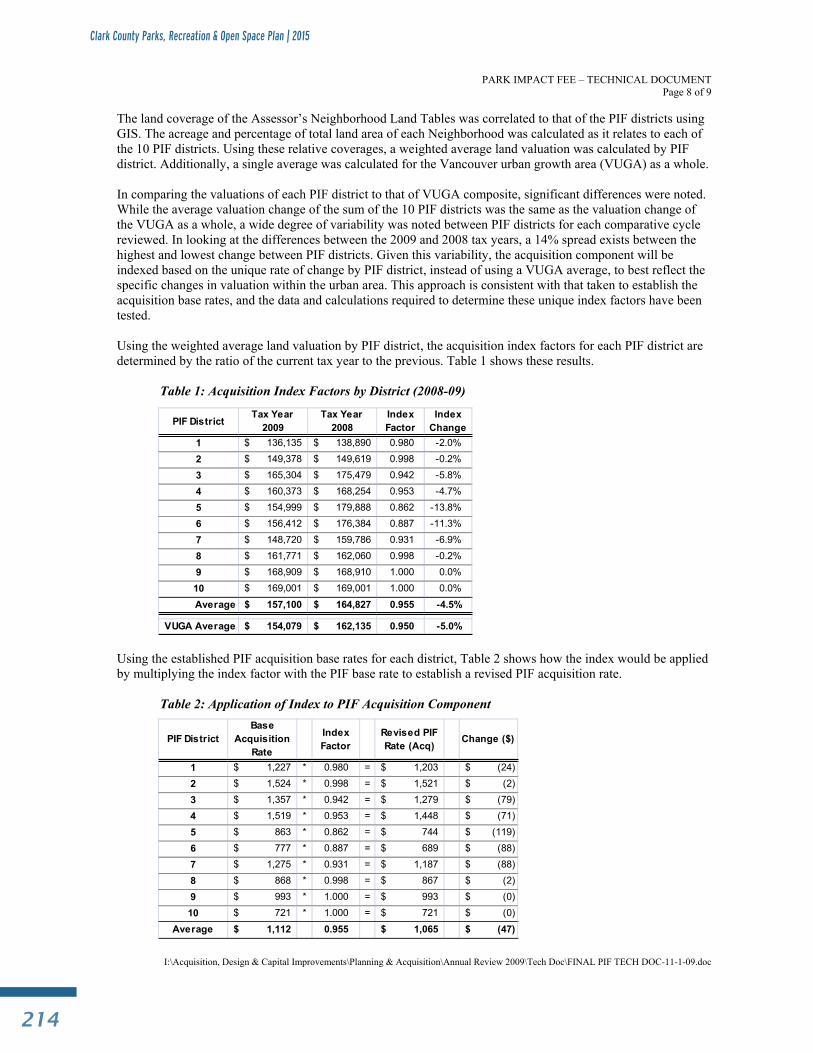
The land coverage of the Assessor’s Neighborhood Land Tables was correlated to that of the PIF districts using GIS. The acreage and percentage of total land area of each Neighborhood was calculated as it relates to each of the 10 PIF districts. Using these relative coverages, a weighted average land valuation was calculated by PIF district. Additionally, a single average was calculated for the Vancouver urban growth area (VUGA) as a whole.
In comparing the valuations of each PIF district to that of VUGA composite, significant differences were noted. While the average valuation change of the sum of the 10 PIF districts was the same as the valuation change of the VUGA as a whole, a wide degree of variability was noted between PIF districts for each comparative cycle reviewed. In looking at the differences between the 2009 and 2008 tax years, a 14% spread exists between the highest and lowest change between PIF districts. Given this variability, the acquisition component will be indexed based on the unique rate of change by PIF district, instead of using a VUGA average, to best reflect the specific changes in valuation within the urban area. This approach is consistent with that taken to establish the acquisition base rates, and the data and calculations required to determine these unique index factors have been tested.
Using the weighted average land valuation by PIF district, the acquisition index factors for each PIF district are determined by the ratio of the current tax year to the previous. Table 1 shows these results.
Table 1: Acquisition Index Factors by District (2008-09)
PIF DistrictTax Year
2009Tax Year
2008Index Factor
Index Change
1 136,135$ 138,890$ 0.980 -2.0%
2 149,378$ 149,619$ 0.998 -0.2%
3 165,304$ 175,479$ 0.942 -5.8%
4 160,373$ 168,254$ 0.953 -4.7%
5 154,999$ 179,888$ 0.862 -13.8%
6 156,412$ 176,384$ 0.887 -11.3%
7 148,720$ 159,786$ 0.931 -6.9%
8 161,771$ 162,060$ 0.998 -0.2%
9 168,909$ 168,910$ 1.000 0.0%
10 169,001$ 169,001$ 1.000 0.0%
Average 157,100$ 164,827$ 0.955 -4.5%
VUGA Average 154,079$ 162,135$ 0.950 -5.0%
Using the established PIF acquisition base rates for each district, Table 2 shows how the index would be applied by multiplying the index factor with the PIF base rate to establish a revised PIF acquisition rate.
Table 2: Application of Index to PIF Acquisition Component
PIF DistrictBase
Acquisition Rate
Index Factor
Revised PIF Rate (Acq)
Change ($)
1 1,227$ * 0.980 = 1,203$ (24)$
2 1,524$ * 0.998 = 1,521$ (2)$
3 1,357$ * 0.942 = 1,279$ (79)$
4 1,519$ * 0.953 = 1,448$ (71)$
5 863$ * 0.862 = 744$ (119)$
6 777$ * 0.887 = 689$ (88)$
7 1,275$ * 0.931 = 1,187$ (88)$
8 868$ * 0.998 = 867$ (2)$
9 993$ * 1.000 = 993$ (0)$
10 721$ * 1.000 = 721$ (0)$
Average 1,112$ 0.955 1,065$ (47)$
I:\Acquisition, Design & Capital Improveme
���
PARK IMPACT FEE – TECHNICAL DOCUMENT Page 9 of 9
I:\Acquisition, Design & Capital Improvements\Planning & Acquisition\Annual Review 2009\Tech Doc\FINAL PIF TECH DOC-11-1-09.doc
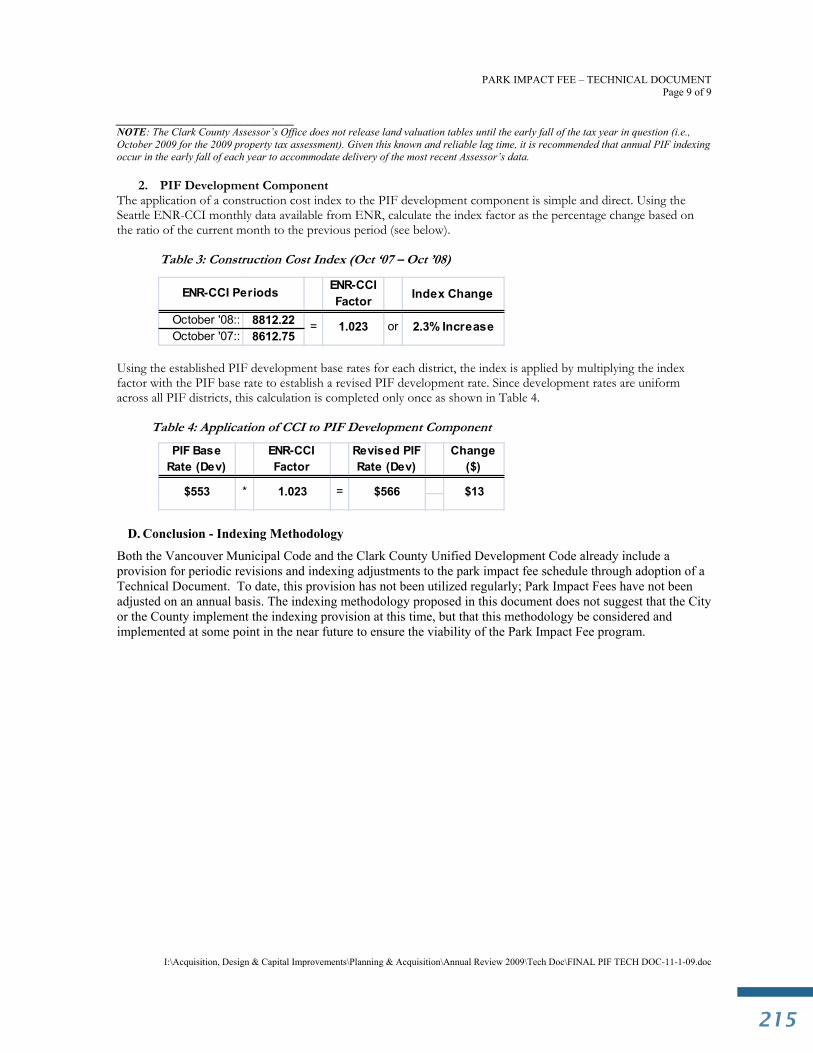
___________________________ NOTE: The Clark County Assessor’s Office does not release land valuation tables until the early fall of the tax year in question (i.e., October 2009 for the 2009 property tax assessment). Given this known and reliable lag time, it is recommended that annual PIF indexing occur in the early fall of each year to accommodate delivery of the most recent Assessor’s data.
2. PIF Development Component The application of a construction cost index to the PIF development component is simple and direct. Using the Seattle ENR-CCI monthly data available from ENR, calculate the index factor as the percentage change based on the ratio of the current month to the previous period (see below).
Table 3: Construction Cost Index (Oct ‘07 – Oct ’08)
ENR-CCI Factor Index Change
October '08:: 8812.22October '07:: 8612.75
ENR-CCI Periods
1.023 or 2.3% Increase=
Using the established PIF development base rates for each district, the index is applied by multiplying the index factor with the PIF base rate to establish a revised PIF development rate. Since development rates are uniform across all PIF districts, this calculation is completed only once as shown in Table 4.
Table 4: Application of CCI to PIF Development Component
PIF Base Rate (Dev)
ENR-CCI Factor
Revised PIF Rate (Dev)
Change ($)
$131.023$553 * = $566
D. Conclusion - Indexing Methodology
Both the Vancouver Municipal Code and the Clark County Unified Development Code already include a provision for periodic revisions and indexing adjustments to the park impact fee schedule through adoption of a Technical Document. To date, this provision has not been utilized regularly; Park Impact Fees have not been adjusted on an annual basis. The indexing methodology proposed in this document does not suggest that the City or the County implement the indexing provision at this time, but that this methodology be considered and implemented at some point in the near future to ensure the viability of the Park Impact Fee program.
Clark County Parks, Recreation & Open Space Plan | 2015
���
APPENDIX J:Park Impact Fee Program
& Rate Calculation
_________________________________________________________________________________________________________ Appendix J
Vancouver-Clark Comprehensive Parks, Recreation, and Open Space Plan| 2007___________________________________J-1
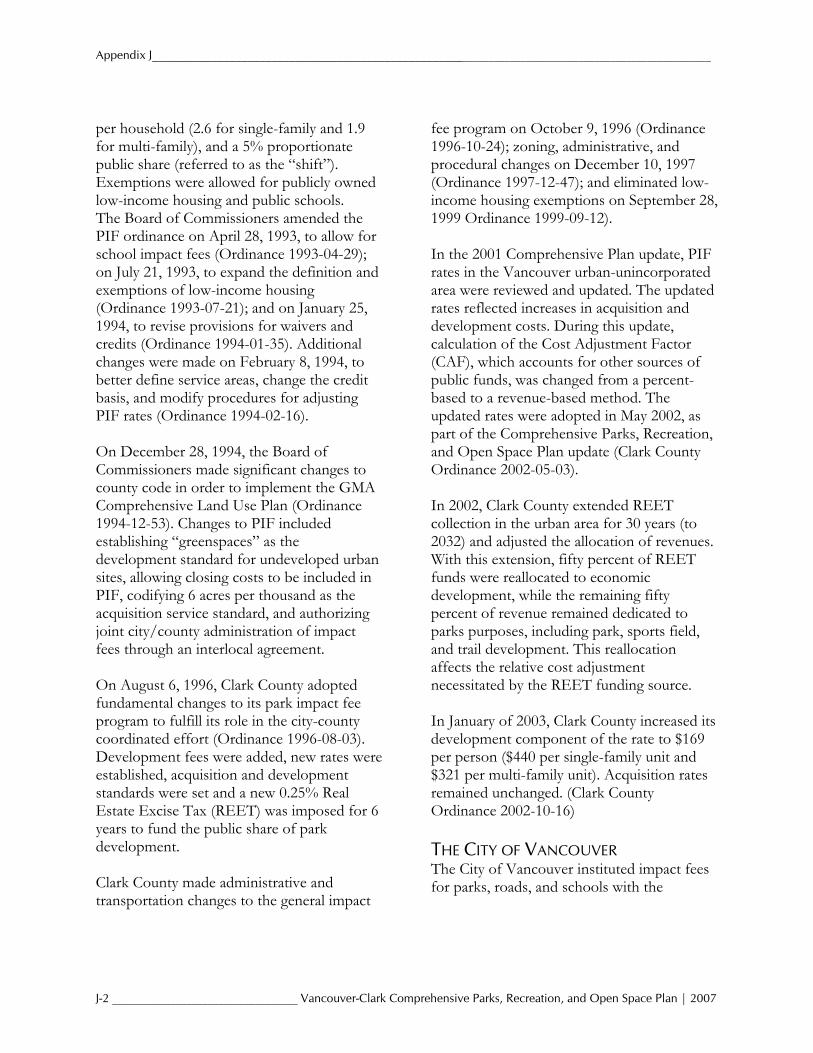
APPENDIX J: PARK IMPACT FEE PROGRAM & RATE CALCULATION The park impact fee program was approved in the mid 1990s by both the City of Vancouver and Clark County to provide a funding source for the acquisition and development of urban parkland in the Vancouver urban area. The program establishes level of service standards for urban parks, including neighborhood and community parks and urban open space, and assesses park impact fees on new residential development to offset the cost of providing these parks. The formula used to compute park impact fee rates is based on the cost of land and the cost of park development in each of the 10 park districts that cover the Vancouver urban growth area. They are fixed until modified by county or city action. The park fees currently charged by Vancouver were last updated in 2004 and Clark County in 2003. Although PIF rate updates have historically occurred concurrently with updates to the Comprehensive Parks, Recreation & Open Space Plan, the 2007 review of PIF rates will occur through a separate process. No methodology or rate changes are proposed in this document. STATUTORY AUTHORITY State statute (RCW 82.02) authorizes qualified Washington counties and cities to collect impact fees to “ensure that adequate facilities are available to serve new growth and development.” The statute requires that impact fees are reasonably related to and reasonably benefit the new development, and
they must not exceed a proportionate share of system improvements. Public facilities on which impact fees may be spent are limited to parks, roads, schools, and fire protection facilities. These facilities must be part of a capital facilities plan that is a component of an adopted comprehensive land use plan. Impact fees must be expended or encumbered within six years of collection, or refunded. The statute also requires an “adjustment to the cost of public facilities for past or future payments made or reasonable anticipated to be made by new development...” Commonly known as the “proportionate public share” or “shift”, this adjustment is intended to reasonably relate the cost of public facility improvements with the service demands of new development. Both City ordinance (VMC 20.97.120) and County code (CCC 12.65.098) anticipate that “Impact fee rates shall be adjusted periodically to reflect changes in costs of land acquisition and construction, facility plan projects, and anticipated growth.”
BACKGROUND OF THE PARK IMPACT FEE PROGRAM CLARK COUNTY On September 26, 1990, the Clark County Board of Commissioners adopted Ordinance 1990-09-47, establishing park impact fees on new residential development within the unincorporated urban area around Vancouver. Fee collection began on January 24, 1991. The park impact fee applied to land acquisition only, and was based on existing land values, a standard of 7.5 acres of urban park land per thousand population, the number of residents
Appendix J___________________________________________________________________________________________________
J-2 ___________________________________ Vancouver-Clark Comprehensive Parks, Recreation, and Open Space Plan | 2007
per household (2.6 for single-family and 1.9 for multi-family), and a 5% proportionate public share (referred to as the “shift”). Exemptions were allowed for publicly owned low-income housing and public schools. The Board of Commissioners amended the PIF ordinance on April 28, 1993, to allow for school impact fees (Ordinance 1993-04-29); on July 21, 1993, to expand the definition and exemptions of low-income housing (Ordinance 1993-07-21); and on January 25, 1994, to revise provisions for waivers and credits (Ordinance 1994-01-35). Additional changes were made on February 8, 1994, to better define service areas, change the credit basis, and modify procedures for adjusting PIF rates (Ordinance 1994-02-16). On December 28, 1994, the Board of Commissioners made significant changes to county code in order to implement the GMA Comprehensive Land Use Plan (Ordinance 1994-12-53). Changes to PIF included establishing “greenspaces” as the development standard for undeveloped urban sites, allowing closing costs to be included in PIF, codifying 6 acres per thousand as the acquisition service standard, and authorizing joint city/county administration of impact fees through an interlocal agreement. On August 6, 1996, Clark County adopted fundamental changes to its park impact fee program to fulfill its role in the city-county coordinated effort (Ordinance 1996-08-03). Development fees were added, new rates were established, acquisition and development standards were set and a new 0.25% Real Estate Excise Tax (REET) was imposed for 6 years to fund the public share of park development. Clark County made administrative and transportation changes to the general impact
fee program on October 9, 1996 (Ordinance 1996-10-24); zoning, administrative, and procedural changes on December 10, 1997 (Ordinance 1997-12-47); and eliminated low-income housing exemptions on September 28, 1999 Ordinance 1999-09-12). In the 2001 Comprehensive Plan update, PIF rates in the Vancouver urban-unincorporated area were reviewed and updated. The updated rates reflected increases in acquisition and development costs. During this update, calculation of the Cost Adjustment Factor (CAF), which accounts for other sources of public funds, was changed from a percent-based to a revenue-based method. The updated rates were adopted in May 2002, as part of the Comprehensive Parks, Recreation, and Open Space Plan update (Clark County Ordinance 2002-05-03). In 2002, Clark County extended REET collection in the urban area for 30 years (to 2032) and adjusted the allocation of revenues. With this extension, fifty percent of REET funds were reallocated to economic development, while the remaining fifty percent of revenue remained dedicated to parks purposes, including park, sports field, and trail development. This reallocation affects the relative cost adjustment necessitated by the REET funding source. In January of 2003, Clark County increased its development component of the rate to $169 per person ($440 per single-family unit and $321 per multi-family unit). Acquisition rates remained unchanged. (Clark County Ordinance 2002-10-16) THE CITY OF VANCOUVER The City of Vancouver instituted impact fees for parks, roads, and schools with the
_________________________________________________________________________________________________________ Appendix J
Vancouver-Clark Comprehensive Parks, Recreation, and Open Space Plan| 2007___________________________________J-3
adoption of Ordinance M-3201 on August 7, 1995. Fees were based on four elements:
• land and development costs in each of the 10 urban park districts;
• acquisition and development standards of 6 acres and 4.25 acres per thousand population respectively;
• dwelling occupancy of 2.59 and 1.9 persons for single-family and multi-family units, respectively; and
• a 5% public share. The City’s park and recreation plan was incorporated into the impact fee program and fees for the 10 park districts were reaffirmed with the adoption of Ordinance M-3206 on September 5, 1995. On January 16, 1996, Vancouver adopted Ordinance M-3224, which amended the city’s zoning ordinance to achieve consistency between the comprehensive plan and its implementing ordinances, as required by the Growth Management Act. Section 20.97.090 codified park impact fees as established by Council. In order to properly fund the City’s public share of park development, the Vancouver City Council adopted on July 1, 1996, Ordinance M-3251 establishing a new 0.25% Real Estate Excise Tax (REET) within the City, effective until 2002. Revenue generated was to be used to address the service level deficit in existing neighborhoods as state statute prohibits park impact fees from being used for this purpose. Funds were dedicated to parks uses as defined in the statute. The City of Vancouver extended REET collections permanently in 2002 and reallocated 30% of revenues to transportation uses, up to a maximum of $500,000 per year plus inflation. City REET revenues available
for parks purposes are now primarily devoted to debt service on recreation center construction and redevelopment. These allocations affect the relative cost adjustment necessitated by the REET funding source. (City of Vancouver Ordinance M-3590 and M-3598). Updated PIF rates for the City were adopted in May 2002, as part of the 2001 Comprehensive Parks, Recreation, and Open Space Plan update (City of Vancouver Ordinance M-3584). This rate update also included an adjustment to the CAF calculation methodology, as occurred in the County. The City of Vancouver also updated its rates in 2004, lowering the acquisition rate an average of $30 per person from 2001, and increasing the development component to $244 per person. (City of Vancouver Ordinance M-3652)
FEE STRUCTURE & RATE CALCULATIONS Park Impact Fee rates are determined for each PIF district by calculating the cost of acquiring and developing parkland necessitated by new development and deducting the impact of taxes and fees currently paid by new home-owners towards park acquisition and development (the cost adjustment factor, or CAF). ACQUISITION COMPONENT Currently, the per person land acquisition component of the park impact fee is calculated, by PIF District, based on the average assessed value of an acre of vacant,
Acquisition Cost + Development Cost – CAF = PIF
Appendix J___________________________________________________________________________________________________
J-4 ___________________________________ Vancouver-Clark Comprehensive Parks, Recreation, and Open Space Plan | 2007
non-critical land, plus average additional transaction costs, multiplied by the urban park acreage standard (6 acres/1,000 people). This per person rate is then multiplied by the number of people per dwelling unit to determine the single family and multi-family acquisition components. Acquisition costs are developed using a compilation of the assessed values of vacant/underutilized, non-critical, residentially zoned lands within each of the ten park districts, using the county’s vacant lands model. This method was chosen for use in the 2001 Comprehensive Plan update due to consistence with other datasets, large sample size, and the reliability of the Assessment & GIS database. The exclusion of critical lands most closely reflects the current need for neighborhood and community parklands. Calculations are also based on the following inputs:
• Household population of 2.6 persons per single family unit or duplex.
• Household population on 1.9 persons per multi-family unit.
• Standard of 5 acres of community and neighborhood parks and 1 acre of urban open space per 1,000 residents. Generally, a mixture of 3 acres of community park and 2 acres of neighborhood park is desired to compose the five acre acquisition standard.
DEVELOPMENT COMPONENT The development component is constant for each PIF district. The average development cost per acre for neighborhood and comm.-unity parks is determined by averaging the cost of recent development projects and the estimated cost of near term projects. The average per acre cost is weighted to reflect the varying guidelines for the proportion of
neighborhood to community parks (2 acres/1,000 persons versus 3 acres/1,000 persons respectively). The average cost is then multiplied by the 4.25 acre/1,000 person development standard and the number of persons per dwelling unit to determine the single family and multi-family development component. For development components of the fee, the inputs include:
• Household population of 2.6 persons per single family unit or duplex.
• Household population on 1.9 persons per multi-family unit.
• Standard of 4.25 acres of developed community and neighborhood per 1,000 residents.
• “Greenspaces” (Level 1) improvements until sites are developed.
• Level 2 development standard for neighborhood and community parks.
THE COST ADJUSTMENT FACTOR The Cost Adjustment Factor (CAF) reflects the contribution of other sources of public funds to park development, as the financing system cannot rely solely on impact fees. (RCW 82.02.050 (2) It is intended to meet two statutory requirements. First RWC 82.02.060 (1) (b) requires that a local impact fee include: (a)n adjustment to the cost of the public facilities for past or future payments made or reasonably anticipated to be made by new development to pay for particular system improvements in the form of user fees, debt service payments, taxes, or other payments earmarked for or proratable to the particular system improvement.
Second, RCW 82.02.050 (2) provides that, “the financing for system improvements to serve new development must provide for a balance between impact fees and other
_________________________________________________________________________________________________________ Appendix J
Vancouver-Clark Comprehensive Parks, Recreation, and Open Space Plan| 2007___________________________________J-5
sources of public funds and cannot rely solely on impact fees.” Because CAF is intended to address two distinct statutory requirements, a two-step approach to calculating the value of CAF is used:
1. Revenue-Based CAF: As a first step, the CAF is calculated based solely on “payments made or reasonably anticipated to be made by new development to pay for particular system improvements.” (a) Identify principles for including a
candidate revenue source in the CAF calculation.
(b) Survey parks revenue sources and identify specific sources to include. For each included revenue source, estimate the per capita contribution of new development. Combine these contributions into an Acquisition CAF, a Development CAF, and a Total CAF.
(a)
2. Minimum CAF: As the second step, compare the Total CAF to the total (per capita) PIF in each district. If the Total CAF equals or exceeds the minimum level (recommended at 5% of total PIF) for a district, no further action is needed – the district meets its “minimum CAF” requirement. However, if the Total CAF is less than 5% of a district’s per capita PIF, increase the Acquisition CAF and/or Development CAF by the amount(s) necessary to bring the total to 5%. The allocation of this increase between the Acquisition and Development CAF should be at the discretion of the City Council and Board of County Commissioners, and should be based on their evaluation of the likely availability of public funds for those purposes.
Revenue-Based CAF Principles Step One of the CAF Methodology is identification of principles to be used in deciding whether a revenue source should be considered a “payment made or reasonably expected to be made by new development to pay for particular system improvements.” The statute contemplates payments “in the form of user fees, debt service payments, taxes, or other payments earmarked for or proratable to the particular system improvement.” The following principles are recommended as guidelines for determining whether particular revenue streams fall within this category.
1. Covered System Improvements: A revenue stream should be included in the CAF calculation only if it supports (i.e. is earmarked for or proratable to) system improvements of a type for which park impact fees are assessed – in particular, the neighborhood parks (acquisition and development), community parks (acquisition and development) and urban open space (acquisition). Rationale: the intent of the statute is to prevent “double-charging” new development for system improvements, once via PIF and once via other payments. If a particular cost or facility type is not covered by PIF (i.e. is not included in the standard costs used to compute PIF), there is no possibility of “double-charging.”
2. System Expansion vs. Repair and Renovation: A revenue stream should be included in the CAF calculation only if it supports projects which expand the capacity of the parks system as measured against the standards defined in the parks facilities plan; revenues supporting bona fide repair, reconstruction and renovation only should not be included. Rationale: PIFs are collected and expended only for the purpose of increasing system capacity, so
Appendix J___________________________________________________________________________________________________
J-6 ___________________________________ Vancouver-Clark Comprehensive Parks, Recreation, and Open Space Plan | 2007
this principle is simply a corollary of the preceding one. Moreover, it seems unlikely that the legislature intended to prohibit localities from asking new development to participate, along with the rest of the community, in supporting the ongoing preservation of existing facilities.
3. Earmarked Revenues: Revenues formally earmarked for expansion of covered facilities- by statutes, ordinance, or formally adopted local policy – should be included in the CAF calculation.
4. Proratable Revenues: Revenues “proratable to particular system improvements” form a potentially much broader category than earmarked revenues, and some judgment is required to determine how broadly the statutory language should be read. As a partial criterion we recommend that a candidate proratable revenue be included in the CAF calculation only if there is a distinct nexus between the occurrence of new development within the community and the subsequent availability of the revenue in question to the community. As a hypothetical example, if the State of Washington were to impose a new tax on development activity, and the proceeds of that tax were redistributed to cities and counties on a per capita basis for parks purposes, then that tax would be included in the CAF calculation – because development in the community (by raising its population) contributes to making the resource available to the community (via the redistribution formula). Conversely, grants awarded on the basis of project-proposal competition, for example, would not be included in the CAF calculation, despite the possibility that new development may indirectly finance some portion of such a program through general federal or state taxes. Rationale: It
seems likely that the legislature’s intent in adoption RCW 82.02.060 (1) (b) was to prevent substantial, direct “double-charging” of new development by local governments, rather than to require an immensely complex tracing of marginal payments through the state and federal budgets. The criterion above is offered as a principled way of distinguishing direct “double-charging” from the more roundabout financial linkages.
5. Reasonably Anticipated: In some cases, the Parks Department may find it useful to list funding sources in its comprehensive facilities plan which may or may not actually materialize – representing, for example, grants applied for or general fund support requested. We recommend that only revenues “reasonably anticipated” be included in the CAF calculation. The Parks Department may have to estimate the probability of receiving various types of funding to carry out this recommendation. Rationale: This is simply in conformity with the terms of the statute.
Revenue Sources to Include in CAF The primary source for identifying candidate revenue sources for the CAF calculation is the financial element of the parks facilities plan. That document shows the planned revenue sources for all parks projects in the 2006-2012 timeframe. The following paragraphs summarize the rationale for including or excluding each source, based on the principles outlined above.
• REET-2: Include, assuming source is renewed and that it remains earmarked by ordinance for parks development.
• Greater Clark Parks District: Exclude, based on Principles 1 and 2. The Greater Clark Parks District is a metropolitan parks
_________________________________________________________________________________________________________ Appendix J
Vancouver-Clark Comprehensive Parks, Recreation, and Open Space Plan| 2007___________________________________J-7
district formed by voters in 2005, which assesses a property tax primarily to provide revenue for the operation of 35 urban-unincorporated parks and 5 trail segments. A limited amount of revenue is available for above-standard development of these parks; however this revenue is not available for the PIF-funded standard Level II development of these parks.
• City General Fund: Exclude, based on Principles 2 and 5. Most of the projects listed as general fund-supported represent repair and renovation efforts, which do not increase the capacity of the parks system.
• County Remediation Payment: Exclude, as this represents a single lump-sum payment made to the County a number of years ago (~$2.9 million) from accumulated fund balance. Thus it represents no tax burden on current or future development.
• CDBG & IAC Grants: Exclude, on the criteria proposed under Principle 4. Although these grant funs may arguably include some trace amount of tax dollars paid by new development, development itself does not cause these funds to be available to the community.
• Private Donations: Exclude, as these are unconnected with any taxes, fees, or other payments imposed on new development.
• Other Sources: There are additional funding sources included in the parks facilities plan to finance projects outside the core parks system to which PIF funding is dedicated. Such sources are excluded under Principle 1, i.e. they do not reflect spending on system improvements “covered” by the PIF program.
CAF Calculations Of the candidate revenue sources reviewed above, only one is recommended for inclusion in the CAF calculation: REET-2. The following paragraphs outline assumptions and methodologies for this funding source. Real Estate Excise Tax Assumptions 1. Continuation of Source: It is assumed that
both the City of Vancouver and Clark County will continue collection of the 0.25% real estate excise tax and that proceeds of the tax will continue to be dedicated, at least in part, to parks purposes. The CAF calculation accounts only for the percentage of REET-2 devoted to parks development.
2. First Sale: For the purpose of this calculation, the revenue attributed to new development is the tax collected on the first sale of newly developed residential property. The full value of the first sale is included in the calculation – that is, no attempt is made to estimate and deduct the value of the bare land underlying the new development.
3. Occupants per dwelling Unit: Single family dwelling units are assumed to have 2.6 occupants on average, while multi-family units are assumed to average 1.9 occupants. This conforms to the assumptions incorporated in the Parks Facilities Plan.
4. Single Family vs. Multi-Family Dwelling Units: According to City and County staff, 78% of residential building permits issued over the past four years have been for single family units, while 22% have been issued for multi-family units. This calculation assumes this mix will continue in the future.
Appendix J___________________________________________________________________________________________________
J-8 ___________________________________ Vancouver-Clark Comprehensive Parks, Recreation, and Open Space Plan | 2007
5. Single Family vs. Multi-Family Population: Combining assumptions 3 and 4 above, the distribution of population between single family units and multi-family units can be calculated: 83% of new population growth is expected to reside in single family units, compared to 17% in multi-family units. (These figures are more heavily weighted towards single family units because each such unit is expected to house a larger number of occupants than each multi-family unit. Example: Given 100 new dwelling units, 78 are expected to be single family and 22 multi-family. We expect the simple family units to house 78 x 2.6 = 202.8 residents, while the multi-family units will house 22 x 1.9 = 41.8 persons. The total population will be 202.8 + 41.8 = 244.6. The single family units will house 202.8/244.6 = 83% of the total population, while multi-family units house 41.8/244.6 = 17%.)
6. Multi-Family Unit Sales: New construction generates REET revenue at the time the newly constructed unit is sold. In the case of single family units, nearly all are expected to be sold prior to occupancy. (This analysis assumes that all single family units are sold prior to occupancy, ignoring builder-owned housing.) However, multi-family complexes (e.g. apartment buildings) may be occupied by new residents – typically renters – without being sold. To take this into account, this calculation assumes that 20% of multi-family units will change hands each year. Over the 2006-2012 period, this implies that 74% of multi-family units will be sold, generating REET revenues at least one time.
7. Unit Sales Price: The average sale price of new single family dwelling unit is used, and the average sale price for multi-family
homes is assumed at 50% of single-family. The 50% ratio reflects the ration or average construction costs for single family and multi-family housing units in the year 2000 (as of the last census) for Vancouver and Unincorporated Clark County, and the assumption that the ratios between construction costs and initial sales price are approximately equal for both types of housing.
Real Estate Excise Tax Calculation 1. REET per capita (Single Family) equals
the median price of a new single family dwelling unit times the tax rate times the percent allocated to parks purposes divided by occupants per dwelling unit.
2. REET per capita (Multi-Family) equals the median price of a new multi-family dwelling unit times applicable tax rate times the percent allocated to parks purposes divided by occupants per dwelling unit, times turnover rate (see assumption 6).
3. Average REET per capita: REET per capita (Single Family) times percentage of new population in single family housing plus REET per capita (Multi-Family) times percentage of new population in multi-family housing.
This calculation yields an average REET-2 revenue amount for each jurisdiction per new resident. This is then multiplied by the average number of people per household to determine average single family and multi-family CAF rates. This calculated CAF must be compared to the 5% of total PIF minimum, and the greater of these deducted from the PIF development rate.
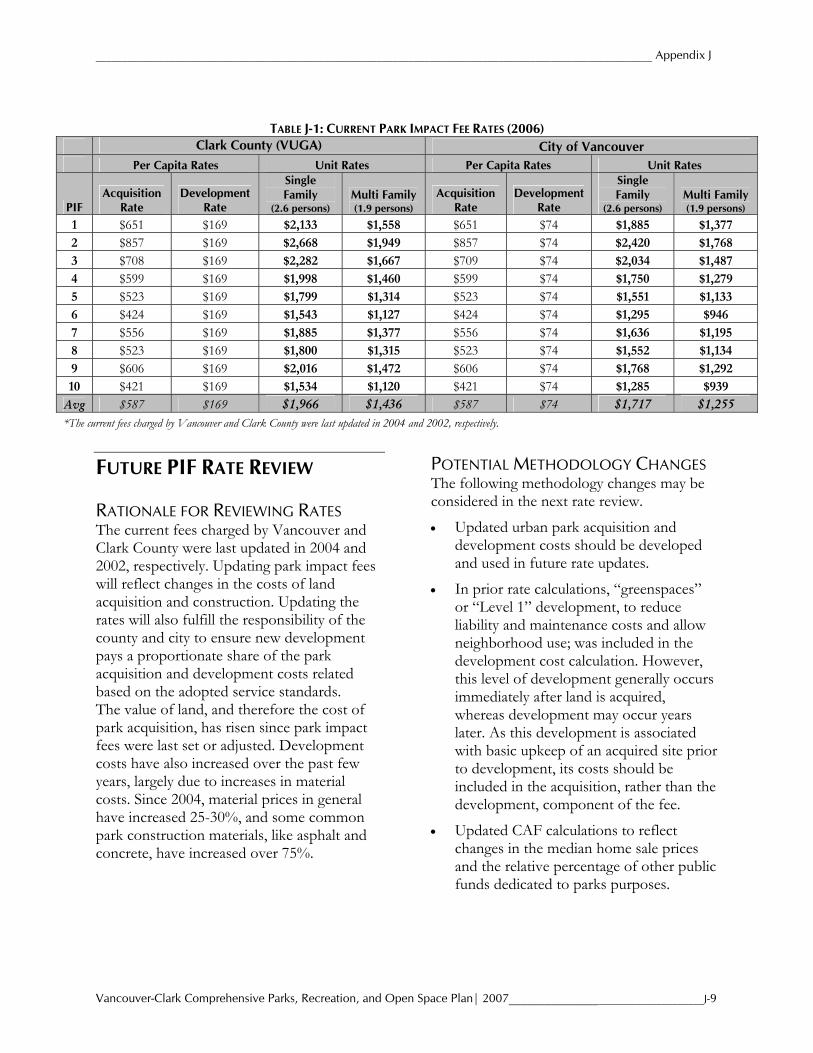
_________________________________________________________________________________________________________ Appendix J
Vancouver-Clark Comprehensive Parks, Recreation, and Open Space Plan| 2007___________________________________J-9
FUTURE PIF RATE REVIEW RATIONALE FOR REVIEWING RATES The current fees charged by Vancouver and Clark County were last updated in 2004 and 2002, respectively. Updating park impact fees will reflect changes in the costs of land acquisition and construction. Updating the rates will also fulfill the responsibility of the county and city to ensure new development pays a proportionate share of the park acquisition and development costs related based on the adopted service standards. The value of land, and therefore the cost of park acquisition, has risen since park impact fees were last set or adjusted. Development costs have also increased over the past few years, largely due to increases in material costs. Since 2004, material prices in general have increased 25-30%, and some common park construction materials, like asphalt and concrete, have increased over 75%.
POTENTIAL METHODOLOGY CHANGES The following methodology changes may be considered in the next rate review.
• Updated urban park acquisition and development costs should be developed and used in future rate updates.
• In prior rate calculations, “greenspaces” or “Level 1” development, to reduce liability and maintenance costs and allow neighborhood use; was included in the development cost calculation. However, this level of development generally occurs immediately after land is acquired, whereas development may occur years later. As this development is associated with basic upkeep of an acquired site prior to development, its costs should be included in the acquisition, rather than the development, component of the fee.
• Updated CAF calculations to reflect changes in the median home sale prices and the relative percentage of other public funds dedicated to parks purposes.
TABLE J-1: CURRENT PARK IMPACT FEE RATES (2006) Clark County (VUGA) City of Vancouver Per Capita Rates Unit Rates Per Capita Rates Unit Rates
PIF Acquisition
Rate Development
Rate
Single Family
(2.6 persons) Multi Family (1.9 persons)
Acquisition Rate
Development Rate
Single Family
(2.6 persons) Multi Family (1.9 persons)
1 $651 $169 $2,133 $1,558 $651 $74 $1,885 $1,377 2 $857 $169 $2,668 $1,949 $857 $74 $2,420 $1,768 3 $708 $169 $2,282 $1,667 $709 $74 $2,034 $1,487 4 $599 $169 $1,998 $1,460 $599 $74 $1,750 $1,279 5 $523 $169 $1,799 $1,314 $523 $74 $1,551 $1,133 6 $424 $169 $1,543 $1,127 $424 $74 $1,295 $946 7 $556 $169 $1,885 $1,377 $556 $74 $1,636 $1,195 8 $523 $169 $1,800 $1,315 $523 $74 $1,552 $1,134 9 $606 $169 $2,016 $1,472 $606 $74 $1,768 $1,292 10 $421 $169 $1,534 $1,120 $421 $74 $1,285 $939
Avg $587 $169 $1,966 $1,436 $587 $74 $1,717 $1,255 *The current fees charged by Vancouver and Clark County were last updated in 2004 and 2002, respectively.
Appendix J___________________________________________________________________________________________________
J-10 __________________________________ Vancouver-Clark Comprehensive Parks, Recreation, and Open Space Plan | 2007
• Indexing the park impact fee may promote gradual changes on a yearly basis, rather than more significant modifications at multi-year intervals. However, choosing cost indexes that accurately reflect cost
fluctuations in land value and construction costs may be difficult. A combined strategy of indexing and more frequent rate evaluations may be a reasonable way to approach future rate updates.