Embed Size (px)
Citation preview

22 Economic Growth
Learning Objectives
Economic growth rate and the implications of sustained
growth
The economic growth trends in Canada and other
countries and regions
Labour productivity growth and potential GDP growth
Sources of labour productivity growth
The theories of economic
Real GDP per person in Canada tripled between
1961 and 2011.
What has brought about this growth in production,
incomes, and living standards?
Incomes in China have tripled in the 13 years
between 1997 and 2010.
Why are incomes in China growing so rapidly?
The Basics of Economic Growth
Economic growth is the sustained expansion of production
possibilities measured as the increase in real GDP over a
given period.
Calculating Growth Rates
The economic growth rate is the annual percentage
change of real GDP.
The economic growth rate tells us how rapidly the total
economy is expanding.
The standard of living depends on real GDP per person.
Real GDP per person/Per capita income
Real GDP per person grows only if real GDP grows faster
than the population grows.
The Basics of Economic Growth
The Basics of Economic Growth
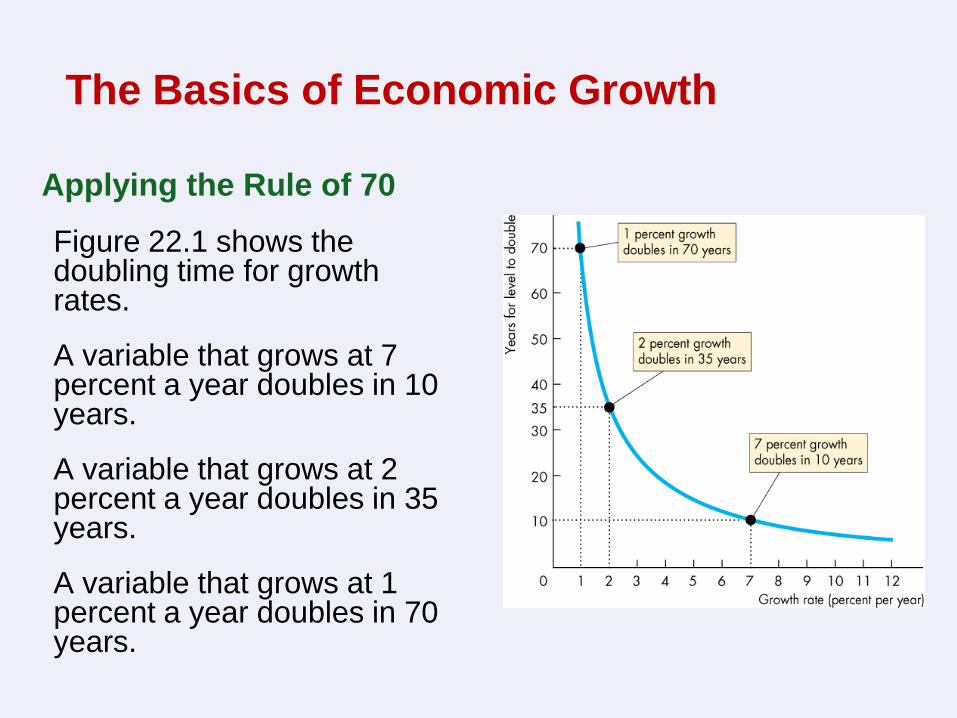
Applying the Rule of 70
Figure 22.1 shows the doubling time for growth rates.
A variable that grows at 7 percent a year doubles in 10 years.
A variable that grows at 2 percent a year doubles in 35 years.
A variable that grows at 1 percent a year doubles in 70 years.
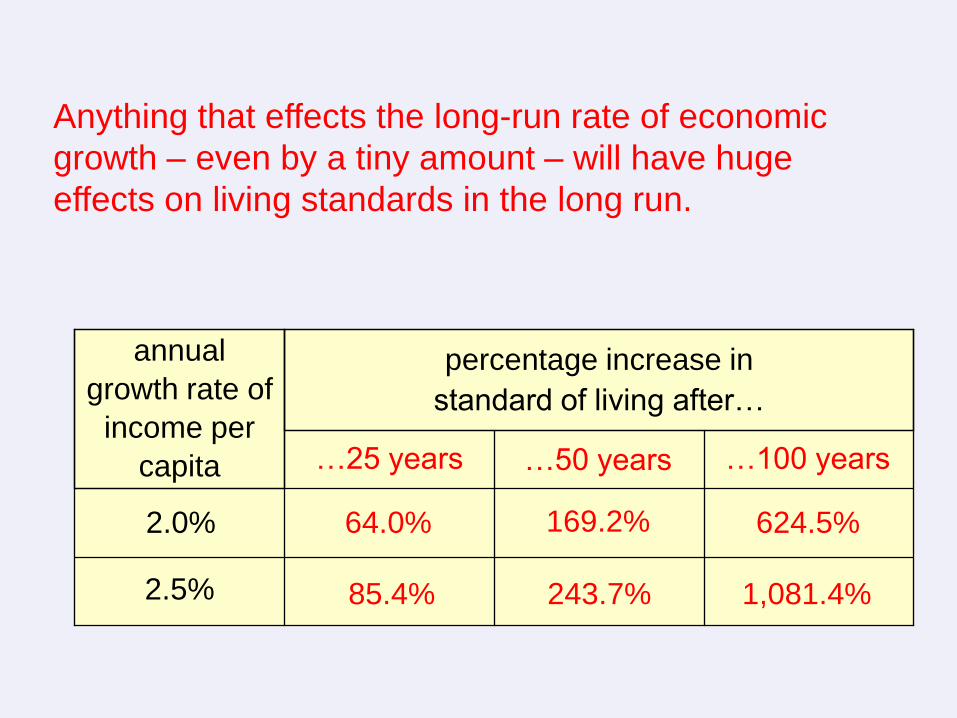
Anything that effects the long-run rate of economic
growth – even by a tiny amount – will have huge
effects on living standards in the long run.
1,081.4% 243.7% 85.4%
624.5% 169.2% 64.0%
2.5%
2.0%
…100 years …50 years …25 years
percentage increase in
standard of living after…
annual
growth rate of
income per
capita
Economic Growth Trends
Growth in the Canadian Economy
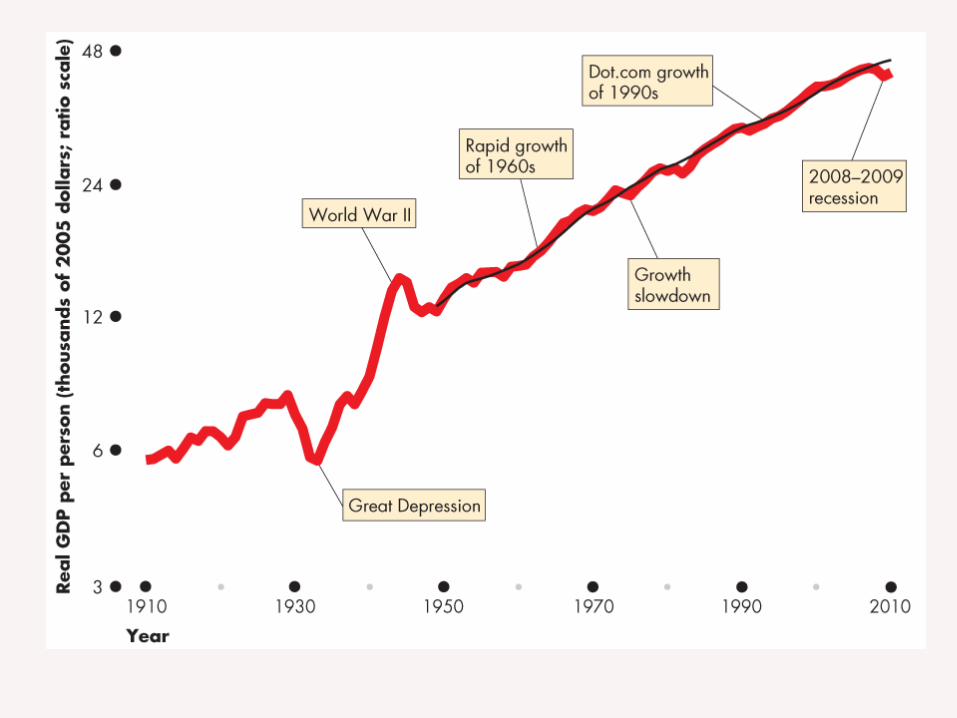
From 1926 to 2010, growth in real GDP per person in Canada averaged 2% a year.
Real GDP per person fell precipitously during the Great Depression and rose rapidly during World War II.
Growth was most rapid during the 1960s.
Growth slowed during the 1970s and sped up again in the 1980s and1990s.
Economic Growth Trends
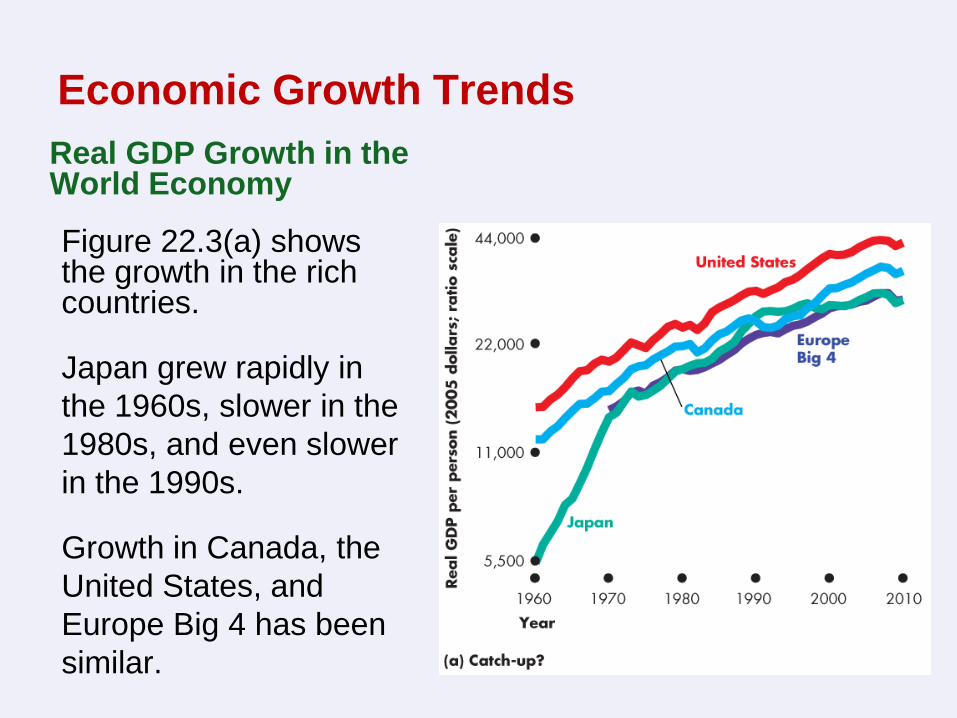
Real GDP Growth in the World Economy
Figure 22.3(a) shows the growth in the rich countries.
Japan grew rapidly in
the 1960s, slower in the
1980s, and even slower
in the 1990s.
Growth in Canada, the
United States, and
Europe Big 4 has been
similar.
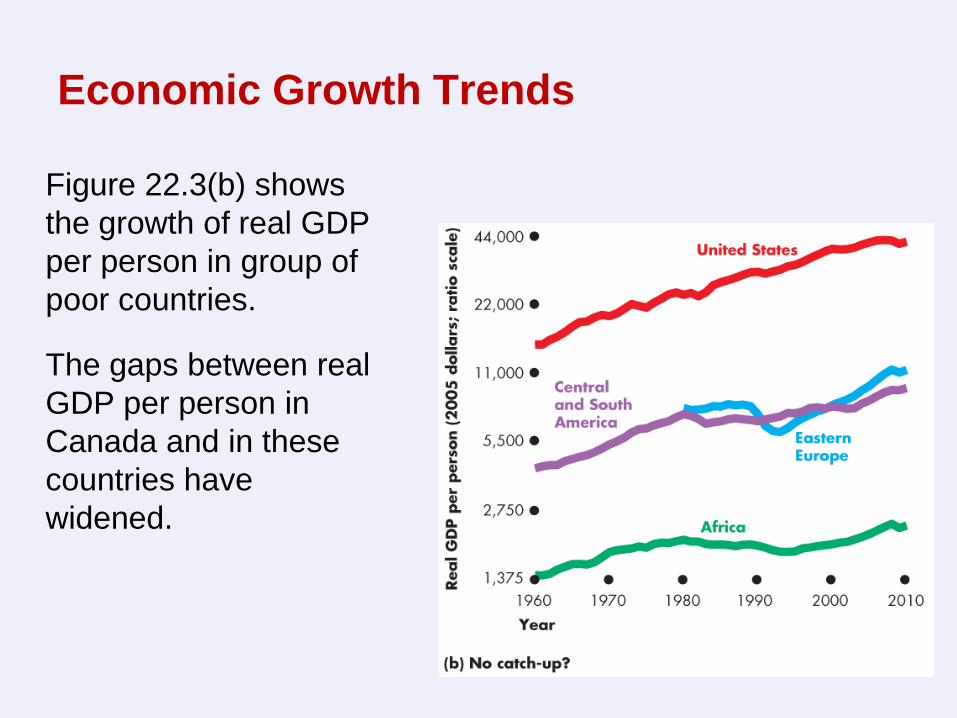
Economic Growth Trends
Figure 22.3(b) shows
the growth of real GDP
per person in group of
poor countries.
The gaps between real
GDP per person in
Canada and in these
countries have
widened.
How Potential GDP Grows
What Determines Potential GDP?
Potential GDP is the quantity of real GDP produced when
the quantity of labour employed is the full-employment
quantity.
To determine potential GDP we use a model with two
components:
An aggregate production function
An aggregate labour market
How Potential GDP Grows
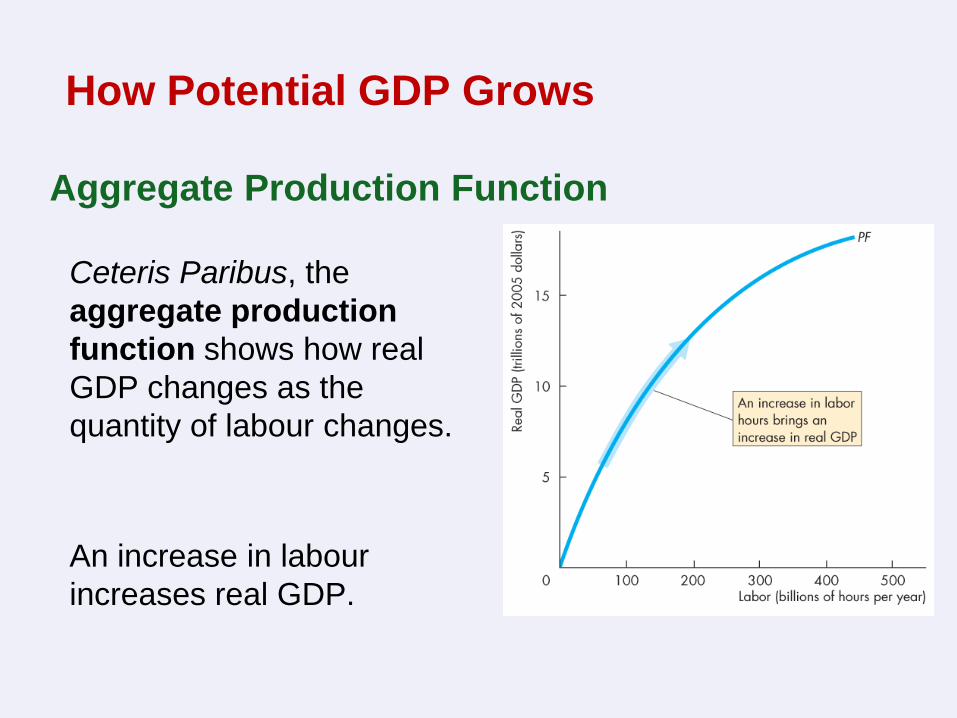
Ceteris Paribus, the
aggregate production
function shows how real
GDP changes as the
quantity of labour changes.
An increase in labour
increases real GDP.
Aggregate Production Function
How Potential GDP Grows
Aggregate Labour Market
The demand for labour shows the quantity of
labour demanded and the real wage rate.
The supply of labour shows the quantity of labour
supplied and the real wage rate.
The labour market is in equilibrium at the real
wage rate at which the quantity of labour
demanded equals the quantity of labour supplied.
How Potential GDP Grows
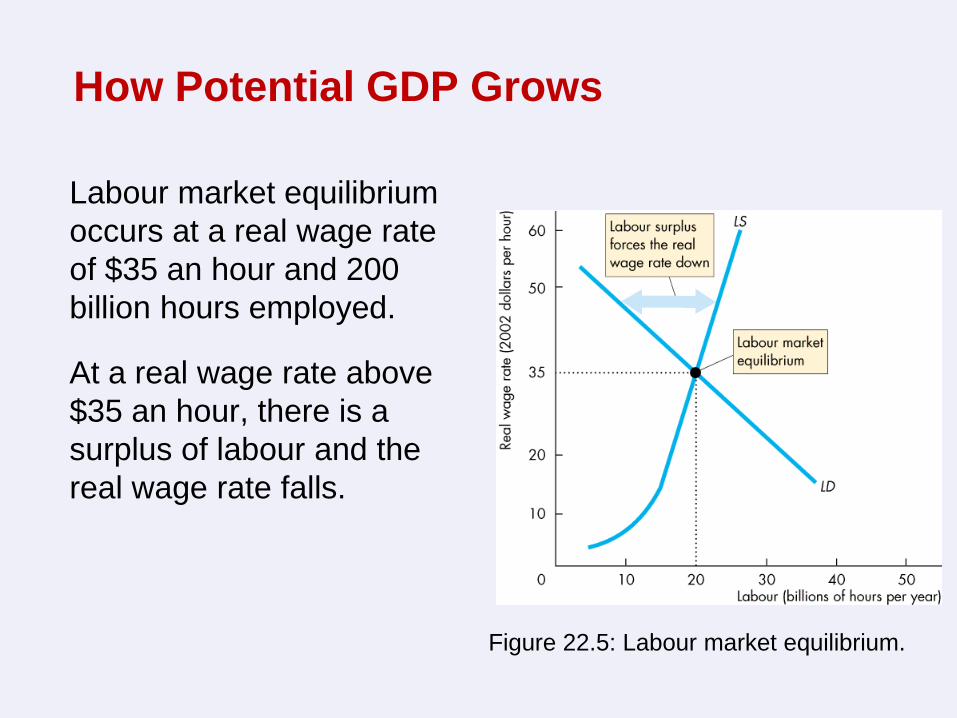
Labour market equilibrium
occurs at a real wage rate
of $35 an hour and 200
billion hours employed.
At a real wage rate above
$35 an hour, there is a
surplus of labour and the
real wage rate falls.
Figure 22.5: Labour market equilibrium.
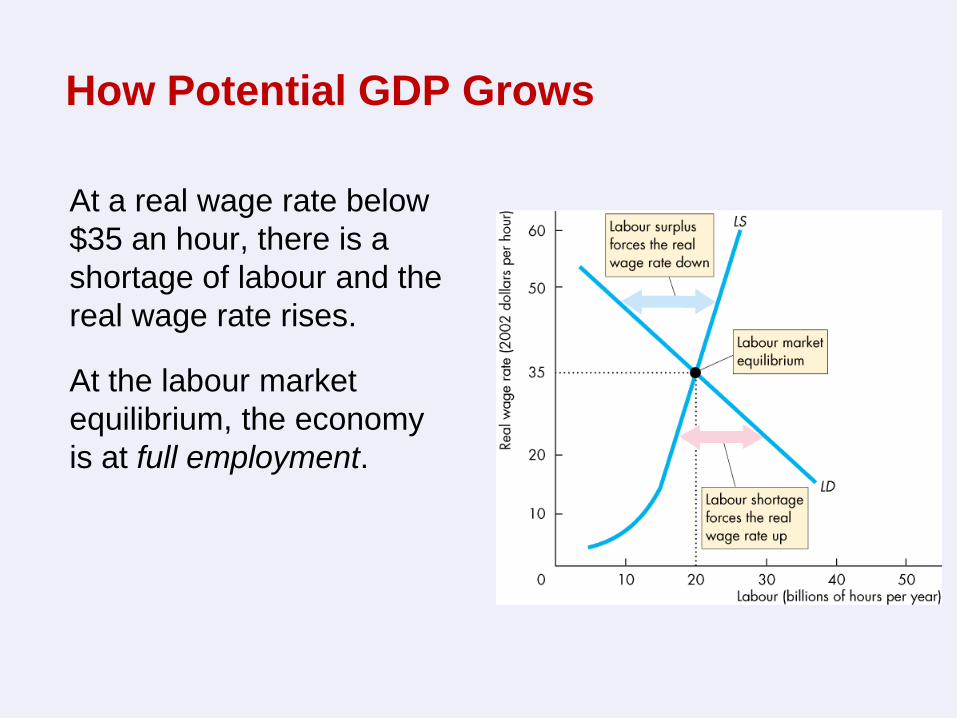
At a real wage rate below
$35 an hour, there is a
shortage of labour and the
real wage rate rises.
At the labour market
equilibrium, the economy
is at full employment.
How Potential GDP Grows
How Potential GDP Grows
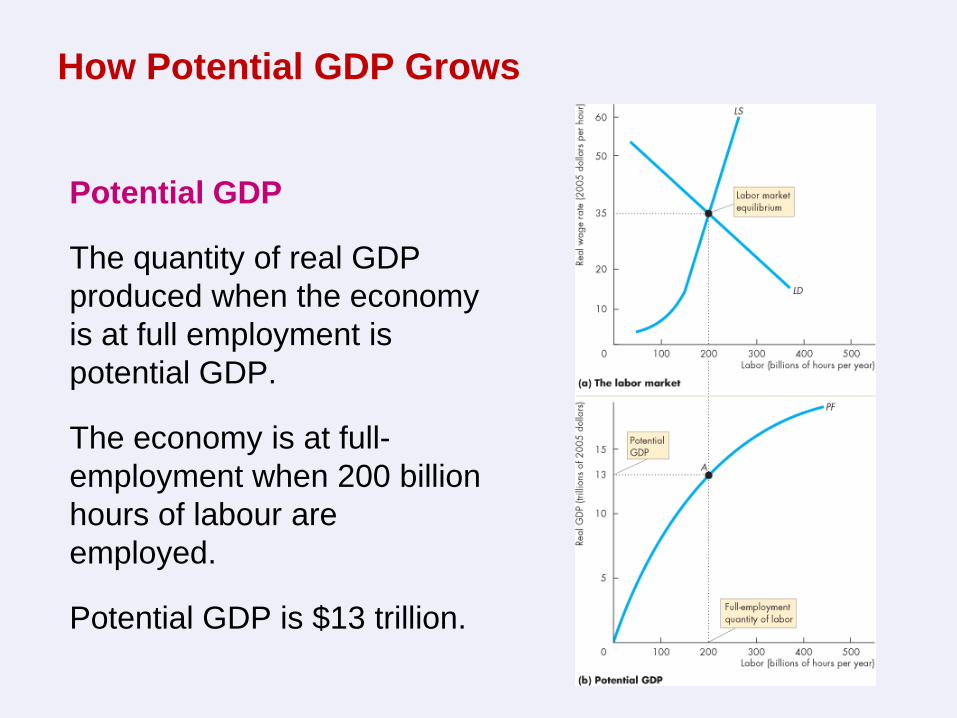
Potential GDP
The quantity of real GDP
produced when the economy
is at full employment is
potential GDP.
The economy is at full-
employment when 200 billion
hours of labour are
employed.
Potential GDP is $13 trillion.
What Makes Potential GDP Grow?
We begin by dividing real GDP growth into the forces that
increase:
Growth in the supply of labour
Growth in labour productivity
How Potential GDP Grows
How Potential GDP Grows
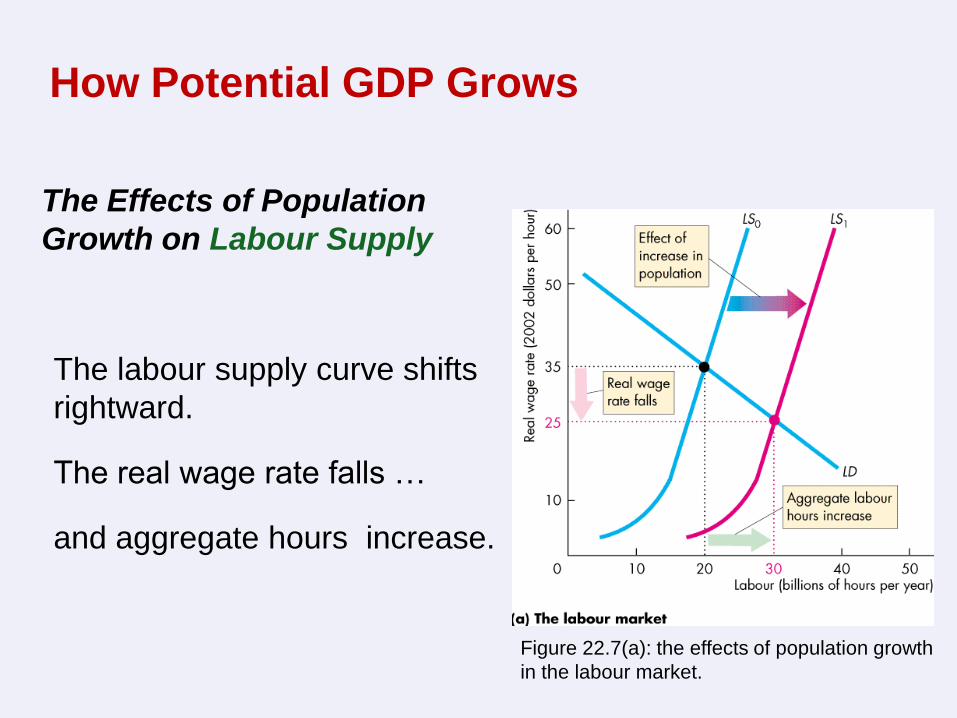
The Effects of Population
Growth on Labour Supply
The labour supply curve shifts
rightward.
The real wage rate falls …
and aggregate hours increase.
Figure 22.7(a): the effects of population growth
in the labour market.
How Potential GDP Grows
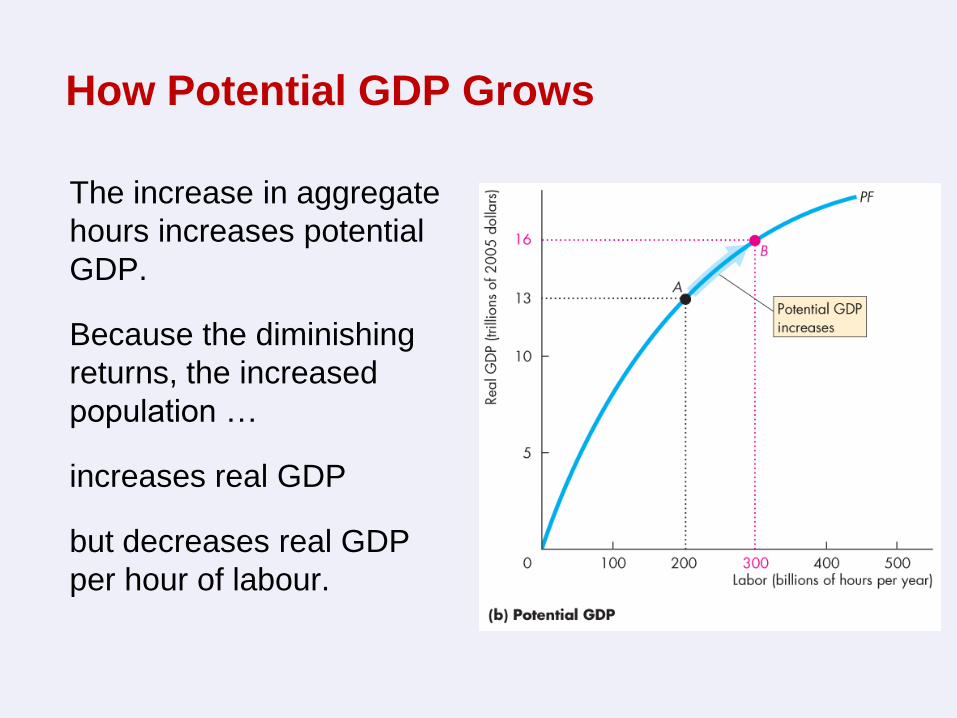
The increase in aggregate
hours increases potential
GDP.
Because the diminishing
returns, the increased
population …
increases real GDP
but decreases real GDP
per hour of labour.

Growth of Labour Productivity
Labour productivity is the quantity of real GDP produced by an hour of labour.
Labour productivity equals real GDP divided by aggregate labour hours.
If labour become more productive, firms are willing to pay more for a given number of hours so the demand for labour increases.
How Potential GDP Grows
How Potential GDP Grows
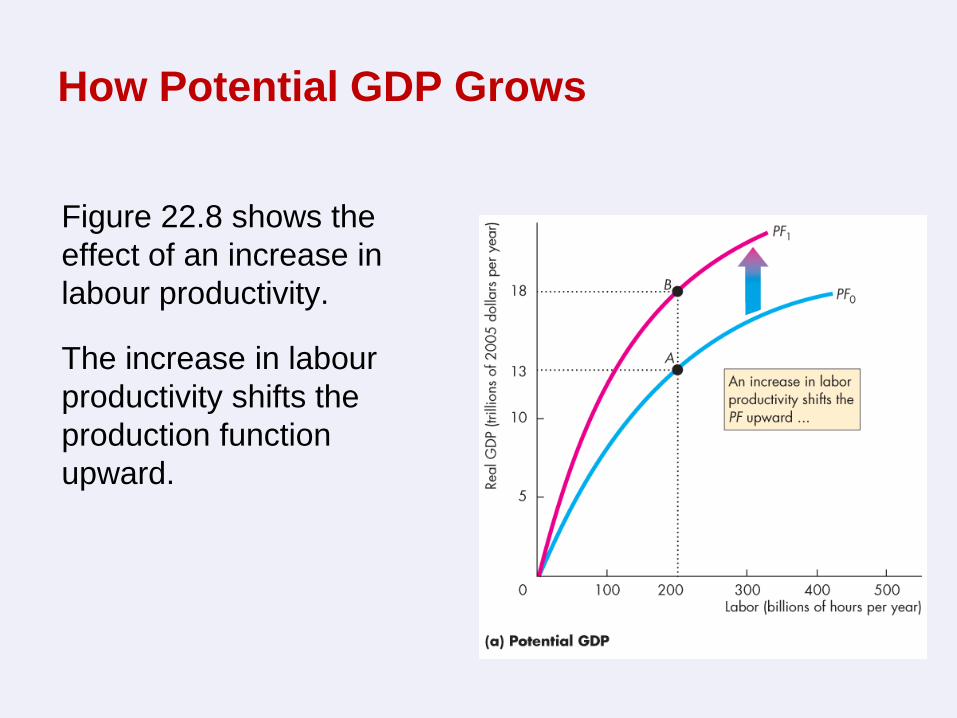
Figure 22.8 shows the
effect of an increase in
labour productivity.
The increase in labour
productivity shifts the
production function
upward.
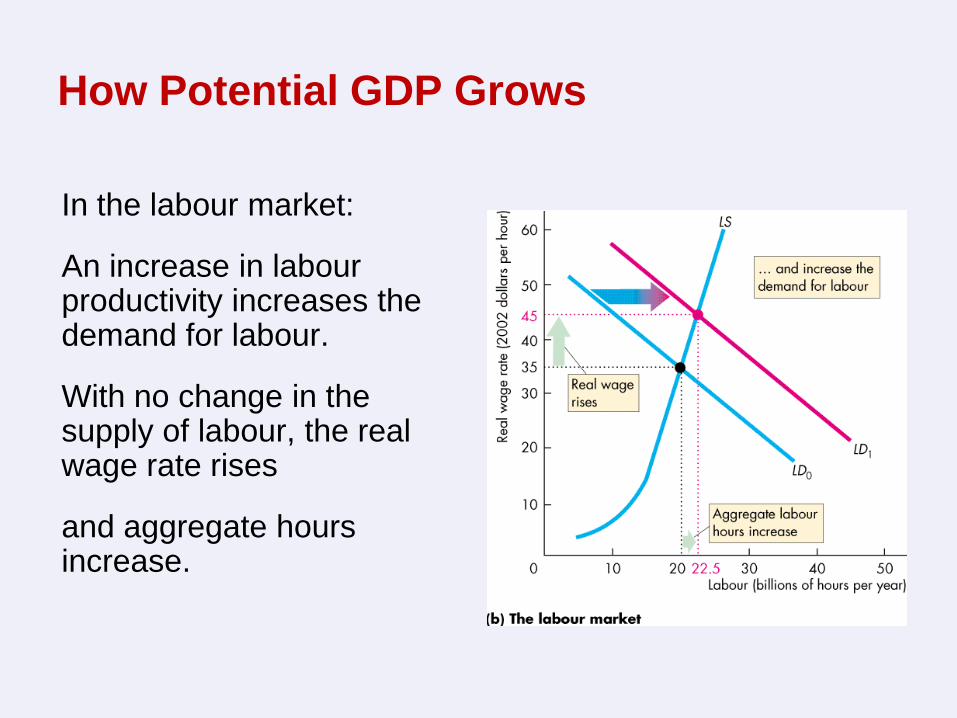
How Potential GDP Grows
In the labour market:
An increase in labour productivity increases the demand for labour.
With no change in the supply of labour, the real wage rate rises
and aggregate hours increase.
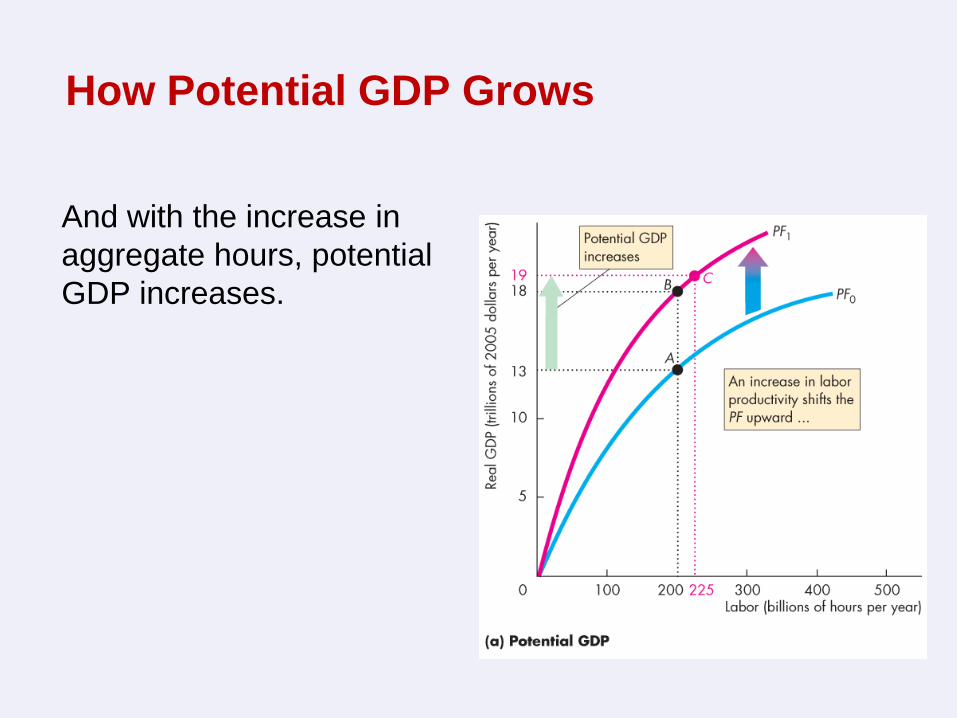
And with the increase in
aggregate hours, potential
GDP increases.
How Potential GDP Grows

Preconditions for Labour Productivity Growth
The fundamental precondition for labour productivity
growth is the incentive system created by firms, markets,
property rights, and money.
The growth of labour productivity depends on
Physical capital growth
Human capital growth
Technological advances
Why Labour Productivity Grows

Why Labour Productivity Grows
We study three growth theories:
Classical growth theory
Neoclassical growth theory
New growth theory
Growth Theories, Evidence, and Policies
Neoclassical Growth Theory
Neoclassical growth theory is the proposition that real
GDP per person grows because technological change
induces a level of saving and investment that makes
capital per hour of labour grow.
Growth ends only if technological change stops because
of diminishing marginal returns to both labour and capital.
Growth Theories, Evidence, and Policies
The Neoclassical Theory of Population Growth
The neoclassical view is that the population growth rate is
independent of real GDP and the real GDP growth rate.
Technological Change and Diminishing Returns
In the neoclassical theory, the rate of technological
change influences the economic growth rate but economic
growth does not influence the pace of technological
change.
It is assumed that technological change results from
chance.
Growth Theories, Evidence, and Policies
The Basic Neoclassical Idea
Technology begins to advance at a more rapid pace.
New profit opportunities arise and investment and saving increase.
As technology advances and the capital stock grows, real GDP per person increases.
Diminishing returns to capital lower the real interest rate and eventually economic growth slows and just keeps up with population growth.
Capital per worker remains constant.
Growth Theories, Evidence, and Policies
New Growth Theory
New growth theory holds that real GDP per person grows
because of choices that people make in the pursuit of
profit and that growth can persist indefinitely.
The theory begins with two facts about market economies:
Discoveries result from choices.
Discoveries bring profit and competition destroys profit.
Growth Theories, Evidence, and Policies
Two further facts play a key role in the new growth theory:
Discoveries are a public capital good.
Knowledge is not subject to diminishing returns.
Increasing the stock of knowledge makes capital and
labour more productive.
Knowledge capital does not experience diminishing
returns is the central proposition of new growth theory.
Growth Theories, Evidence, and Policies
Growth Theories, Evidence, and Policies
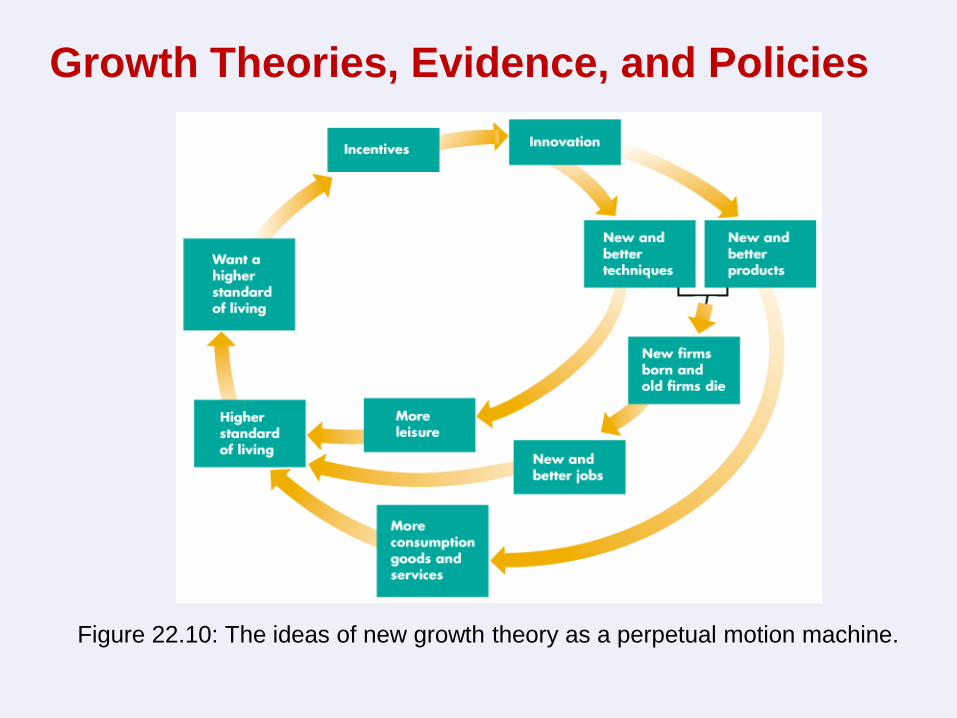
Figure 22.10: The ideas of new growth theory as a perpetual motion machine.
The Empirical Evidence on the Causes of Economic Growth
Economic growth makes progress by the interplay of theory
and empirical evidence.
Theory makes predictions about what we will observe if it is
correct.
Empirical evidence provides the data for testing the theory.
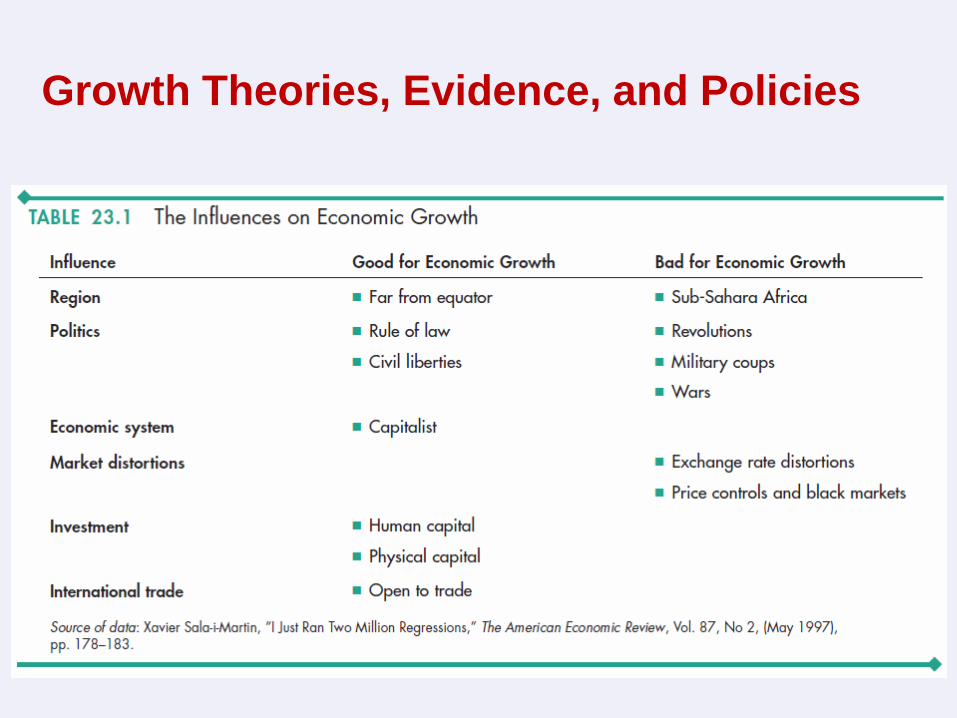
Table 22.1 on the next slide summarizes the more robust
influences on growth that economists have discovered.
Growth Theories, Evidence, and Policies
Growth Theories, Evidence, and Policies
Policies for Achieving Faster Growth
Growth accounting tell us that to achieve faster economic
growth we must either increase the growth rate of capital
per hour of labour or increase the pace of technological
change.
The main suggestions for achieving these objectives are
Stimulate Saving
Saving finances investment. So higher saving rates might
increase physical capital growth.
Tax incentives might be provided to boost saving.
Growth Theories, Evidence, and Policies
Stimulate Research and Development
Because the fruits of basic research and development
efforts can be used by everyone, not all the benefit of a
discovery falls to the initial discoverer.
So the market might allocate too few resources to
research and development.
Government subsidies and direct funding might stimulate
basic research and development.
Growth Theories, Evidence, and Policies
Improve the Quality of Education
The benefits from education spread beyond the person
being educated, so there is a tendency to under invest in
education.
Provide International Aid to Developing Countries
If rich countries give financial aid to developing countries,
investment and growth will increase.
But data on the effect of aid shows that it has had zero or
a negative effect.
Growth Theories, Evidence, and Policies
Encourage International Trade
Free international trade stimulates growth by extracting all
the available gains from specialization and trade.
The fastest growing nations are the ones with the fastest
growing exports and imports.
Growth Theories, Evidence, and Policies