Embed Size (px)
Citation preview
PARKING OVERSUPPLY IN EAST HARLEM: 1 2
AN ANALYSIS OF PARKING OCCUPANCY AND MODE USAGE AT EAST RIVER 3 PLAZA IN NEW YORK CITY 4
5 Kyle Gebhart 6
San Francisco County Transportation Authority 7 1455 Market Street, 22
nd Floor 8
San Francisco, CA 94103 9 Tel: (415) 593-1664 10
Fax: (415) 522-4829 11 [email protected] 12
13 14
Submission Date: August 1, 2012 15 16
5,057 words + 1 table (250 x 1) + 5 figures (250 x 5) = 6,557 words 17
18
TRB 2013 Annual Meeting Paper revised from original submittal.

Gebhart 1
ABSTRACT 19 East River Plaza is a recently constructed mall in the East Harlem section of Manhattan. The 20
development contains big box stores including Target, Costco, and Best Buy along with a 1,248 21 space parking garage. This paper evaluates the assumptions and methodology of the analysis 22
determining the large parking supply, measures current parking usage, and determines modal 23 splits through an intercept survey. The project’s Environmental Impact Statement assumed 67% 24
to 68% of all trips arriving to East River Plaza would be by automobile. Parking accumulation 25 was calculated using parking studies conducted at Home Depots in the Bronx, Queens, and Port 26
Chester, NY and a Costco in Staten Island, all of which are less dense and have higher vehicle 27 trip rates and vehicle ownership rates. These calculations resulted in a peak parking 28
accumulation of 1,190 vehicles for a Saturday afternoon. Actual parking occupancy 29 observations revealed only 371 vehicles (34% occupancy) on a Tuesday afternoon in late 30
November, and 426 vehicles (39% occupancy) on a Saturday afternoon in December. The 31 intercept survey revealed 48% and 37% of respondents arrived by foot and 27% and 33% drove 32
on Tuesday and Saturday, respectively. Thus, the parking supplied has resulted in an 33 underutilized land use and lost opportunity for additional development. Future big box 34
developments in dense urban areas should not use suburban models for auto trip generation and 35 parking accumulation and instead consider the provision of trips being made by walking and 36
public transportation, reducing the need for unnecessary parking. 37 38
TRB 2013 Annual Meeting Paper revised from original submittal.

Gebhart 2
INTRODUCTION 39 The impact of parking on transportation and land use is of growing interest in the field of urban 40
planning (1). Parking supply impacts both car-ownership rates and vehicle-miles traveled 41 (VMT) (1). With new development, the parking supply typically increases due to new parking 42
construction, either from a zoning ordinance with minimum parking requirements or by the 43 assessed parking need at peak demand by the developer (1). These are both often based on rates 44
in the Parking Generation report published by the Institute of Transportation Engineers (ITE) 45 (1). As a result, car-travel is often induced and there is an arguable loss in urban vitality through 46
space reserved for parking instead of another use. This paper aims to understand the challenge 47 of achieving accurate estimates for parking requirements within a dense urban area through a 48
case study of the 1,248 space parking garage at East River Plaza, a recent shopping center 49 development in the East Harlem section of New York City. The shopping center is distinctive 50
due to both its dense, urban location and high amount of parking supplied. The parking garage 51 has anecdotally been underused (2). This case study will show that the parking structure was 52
built with excess capacity due to the methods used for estimating parking demand and an 53 underestimation of shoppers who would arrive by foot. The result is a misuse of land—a 54
suburban-style project forced into an urban context. 55 56
LITERATURE REVIEW 57 Research criticizing the current practice of planning for parking has been largely spearheaded by 58
Donald Shoup and is best documented in his comprehensive book The High Cost of Free 59 Parking (1). From every possible perspective, Shoup demonstrates the lack of science in 60
planning for parking. In regards to off-street parking supply for new developments, parking 61 demand is regularly calculated from ITE’s Parking Generation, which gives a fitted curve 62
equation relating parking demand to building square footage or number of employees (1). These 63 equations are derived from parking surveys, typically at low density suburban sites with little 64
transit and free parking (1). Additionally, many of these rates do not show a statistically 65 significant relationship between the peak parking occupancy and square footage, resulting in 66
“low R2” warnings (1). Therefore, due to planners and developers misapplication on parking 67
generation rates, developments often result in poor estimations of parking demand and the 68
consequence is in an oversupply of parking. 69 Further research on parking supply is scarce but growing. More documentation has 70
emerged as to the oversupply of parking due to misapplication of ITE data. For example, Rowe 71 et al. observed the relationship between residential parking demand and transit service in King 72
County Washington (3). Parking utilization counts were conducted at two urban centers, one in 73 downtown with transit service and a mixed-use suburban location without transit. The urban 74
center resulted in parking demand of 50% less than ITE data and 50% less than the mixed-use 75 suburban center. Additionally, Wilson and Roberts found required parking to exceed free 76
demand at suburban Inland Empire residential developments (4). Researchers and planners often 77 call for lowering or removing existing minimum parking requirements. Engel-Yan therefore 78
explored the likelihood of developers to respond to decreased parking requirements in Toronto, 79 Canada and predicted that general office, medical office, and general retail uses would likely 80
respond with fewer parking spaces, but bank and large grocery store developments would not 81 (5). Finally, through exploring the broader challenges of successful transportation demand 82
management (TDM) integration into the land development process, Sara Hendricks identifies the 83
TRB 2013 Annual Meeting Paper revised from original submittal.
Gebhart 3
reliance of trip and parking generation rates as a significant barrier to successful integration of 84 TDM and land use (6). 85
86 PROJECT OVERVIEW AND BACKGROUND 87 East River Plaza opened in November 2009 and contains approximately 485,000 square feet of 88 retail space and is home to Costco, Target, Best Buy, Old Navy, PetSmart, and Bob’s Discount 89
Furniture, among others. The development is situated west of FDR Drive along the East River 90 between East 116
th Street and East 119
th Street in East Harlem. The site was originally the 91
Washburn water factory which was dormant when the project was first proposed in the early 92 1990s (7). East 118
th Street dead-ends into the project and East 117
th Street turns into a roadway 93
servicing the mall, facilitating pickups and drop-offs and dividing the retail outlets from the 94 parking garage. The mall contains a series of vertically-stacked big-box stores totaling five 95
levels: PetSmart below ground, Costco on the ground floor, Target and Kidstown on level 2, Best 96 Buy and Old Navy on level 3, and Marshalls and Bob’s Discount Furniture on level 4. Nearby 97
bus service includes the M116 bus operating on E 116th Street and Pleasant Avenue and Select 98
Bus Service on 1st and 2
nd Avenues. The 4-5-6 train is the nearest subway, a half-mile away on 99
Lexington Avenue. The parking garage charges parkers using a pricing scheme to encourage 100 only shoppers to park: $5 for up to two hours, $11 for up to three hours, and $18 for up to 24-101
hours. 102 The project was in development by the Blumenfeld Development Group, Ltd. since the 103
early 1990s. Additional investment came from the Canyon Capital Realty Advisers of Beverly 104 Hills, California, who eventually sold to Forest City Ratner in 2004 (7). The environmental 105
impact statement was released and approved by the city planning commission in 1999 via the 106 Empire State Development Corporation (8). The project took an especially long time to build, 107
even to New York City standards. Much of this could be attributed to the unfamiliarity of 108 placing large superstores in dense, urban settings. While this has recently become a growing 109
phenomenon (Atlantic Center in Brooklyn, Home Depot on 34th Street, etc.), it was still 110
pioneering when first proposed in the 1990s. 111
METHODOLOGY 112 A thorough review of project documents was conducted to obtain background information of the 113
project and determine how site design and transportation decisions were made. Specifically, the 114 trip generation rates prepared for the project’s Environmental Impact Statement (EIS) were 115
analyzed to determine if assumptions, methods, and therefore results, were appropriate. 116 Following the EIS analysis, a parking inventory was conducted on two occasions 117
determined to be peak shopping times: a weekday late afternoon and Saturday early afternoon 118 (on November 22, 2011 and December 3, 2011). The number of cars parked was counted 119 throughout the entire garage, by floor, in addition to a parking inventory totaling the actual 120
number of parkable spaces. 121 Concurrently, an intercept survey was conducted as shoppers entered and exited Target to 122
calculate modal splits to and from East River Plaza. (Therefore, data from the intercept survey is 123 only representative of Target shoppers and may not be applicable to Costco or other retail 124
shoppers. Surveying in front of Target was chosen in order to randomly capture shoppers using 125 all modes as those entering from the parking garage or from the street enter at the same location. 126
This is not the case when entering Costco, and thus surveying in front of Target was deemed 127 more appropriate.) Additionally, drivers were asked their parking location and transit riders and 128
pedestrians were asked questions regarding accessibility perception, vehicle ownership, and 129
TRB 2013 Annual Meeting Paper revised from original submittal.

Gebhart 4
motivations for modal choice. Zip codes were recorded for all respondents to get a sense of how 130 far shoppers were from home. 131
A qualitative assessment of pedestrian flows and transit access was analyzed through 132 photo documentation to determine how friendly and intuitive it is to navigate as a pedestrian. 133
Finally, U.S. Census and American Community Survey data were consulted to determine 134 journey to work modal splits and vehicle ownership rates of residential zip codes of the majority 135
of survey respondents. 136 137
RESULTS AND FINDINGS 138 139
EIS Review 140 The East River Plaza EIS contains a full analysis of project impacts to the transportation 141
network, including trip generation and parking accumulation projections. What follows is a 142 description of the methodology used and reported findings as related to trip generation and 143
parking accumulation. 144 The trip generation forecast was calculated by assessing each of the three original project 145
components: Home Depot (assumed to be the projects anchor tenant, later replaced by Target), 146 Costco, and the remaining mixed retail. To calculate generated trips at Home Depot and Costco, 147
surveys were conducted at existing New York City locations. This included Home Depots 148 located at Gun Hill Road in the Bronx, Avery Avenue in Queens, and Hamilton Avenue in 149
Brooklyn. Costcos were surveyed on Richmond Avenue in Staten Island and Third Avenue in 150 Brooklyn (8). Vehicle trip rates were calculated based on trips per 1,000 square feet, and then 151
factored up to a 100% vehicle trip rate (by assuming an 85% vehicle modal split). Trip rates for 152 all Home Depots and all Costcos were then averaged for each peak period. 153
Trip generation for the remaining retail was calculated using the ITE Trip Generation 154 Handbook, 6
th Edition (8). Distinct trip generation characteristics were assumed for each project 155
component. The modal split assumption was “based on surveys conducted at various retail 156 projects in New York City, as well as travel characteristics of the area based on the 1990 census” 157
(8). This attributed 67% to 68% of all trips arriving to Home Depot, Costco, and mixed retail to 158 autos and 35% of all office trips arriving by auto. Only 6% to 8% were forecasted to arrive by 159
subway, 10% to 12% by bus and 10% to 11% by walking (8). As a result of these projected 160 vehicle trips added to the roadway network, the project was expected to have “significant” (as 161
defined by the New York City Environmental Quality Review (CEQR) Manual) level of service 162 (LOS) impacts at three locations in the weekday midday peak hour, six locations in the weekday 163
PM peak hour, and three in the Saturday midday peak hour. Thus, mitigation measures were 164 proposed in signal timing and turn-lane restriping (8). 165
For the analysis of off-street parking need, parking accumulation was calculated again by 166 dividing the project into three components: Home Depot, Costco, and a combined “retail” 167
category. The accumulation patterns for Home Depot were based on “planning assumptions” 168 used in parking studies conducted at Home Depot locations on Gun Hill Road in the Bronx, 169
Woodhaven Boulevard in Queens, and in Port Chester, NY (8). Costco was calculated via 170 surveys conducted at a Staten Island location. The remaining retail category referenced data 171
from the ITE Trip Generation Handbook, 6th Edition. These calculations resulted in a peak 172
parking accumulation of 1,190 between 2:00 PM and 3:00 PM on a Saturday afternoon (8). 173
Thus, the 1,248 parking garage is justified to ensure no spillover onto adjacent on-street parking 174 spaces. 175
TRB 2013 Annual Meeting Paper revised from original submittal.

Gebhart 5
176
Parking Garage Survey 177 Since opening in November 2009, it is now possible to test the transportation parking demand 178 forecasts based on actual utilization rates. The survey results can be seen in Table 1. The overall 179
parking occupancy was 34% on Tuesday afternoon and 39% on Saturday afternoon. Levels 1a 180 and 1b had much higher occupancy rates (51% to 89%) due to their direct connections to Costco. 181
However, the upper levels, notably 3a and 4a, had hardly any vehicles parked on them (1% to 182 6%). It should also be noted that these occupancy rates were calculated based on the observed 183
capacity—a parking inventory taken on site which yielded a total of 1,103 spaces. The official 184 capacity as reported in the site floor plans calculated a higher number of spaces (1,176), and the 185
original parking garage plans as described in the EIS had an even higher number of parking 186 spaces (1,248). Thus, if parking occupancy is calculated against the latter two figures, 187
occupancy rates would be even lower. 188 189
TABLE 1: Parking Occupancy Rates in East River Plaza Garage 190
Level fdr 1a 1b 2a 2b 3a 3b 4a Total
Tuesday, Nov 22, 2011
3:50 p.m. - 4:50 p.m.
57 79 70 54 55 9 46 1 371
50% 89% 51% 34% 35% 6% 37% 1% 34%
Saturday, Dec 3, 2011
12:30 p.m. - 1:15 p.m.
61 62 110 61 53 9 60 10 426
54% 70% 80% 39% 34% 6% 48% 6% 39%
Observed Capacity 114 89 137 157 156 154 125 171 1,103
Official Capacity 107 101 140 157 165 162 166 178 1,176
note: Observed Capacity consists of a count of the number of parkable spaces on each level. Official capacity is the number of spots as detailed 191 on the floor plans found at http://www.eastriverplaza.com/html/floorplans/planGr.html 192
193
Intercept Survey 194 After 90-minutes of surveying on each day, there were 52 respondents on Tuesday and 49 on 195 Saturday with response rates of 30% and 24% respectively. The response rate is based on 196
shoppers who were directly asked to take the survey, which was a limited sample due to heavy 197 pedestrian flows. 198
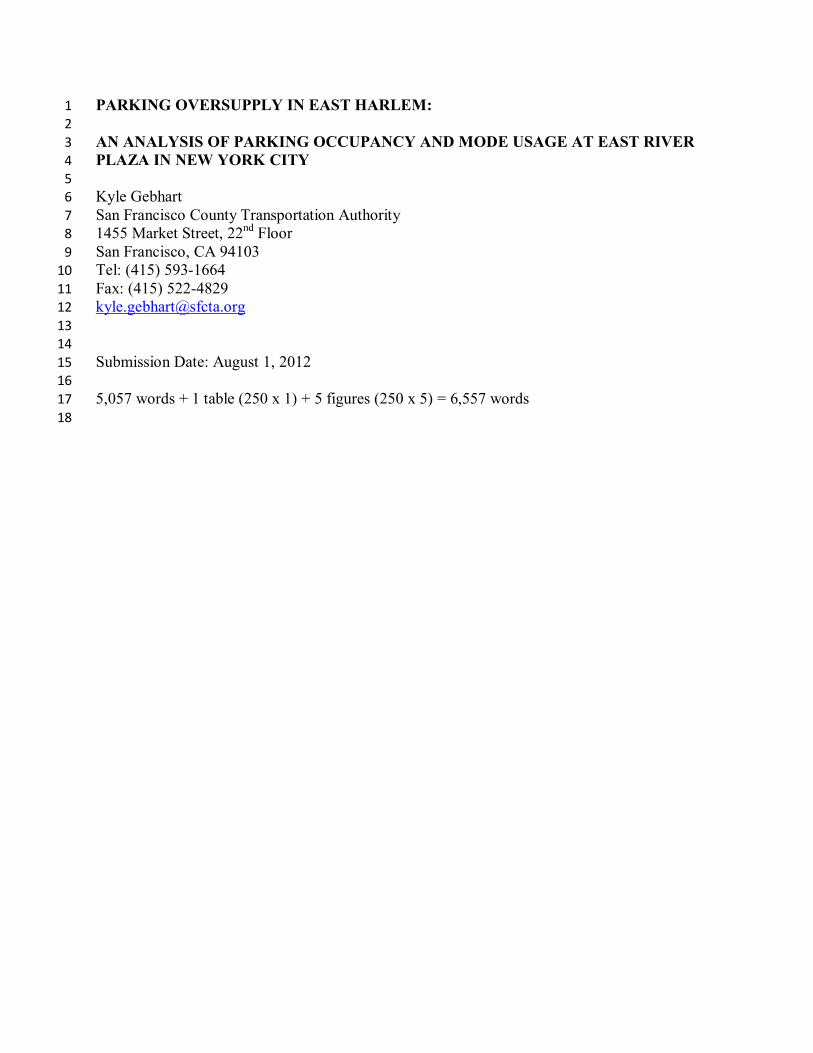
199 Figure 1 reveals the modal splits of arrival mode and planned departure mode on Tuesday and 200
Saturday (note: some multi-modal trips may have not been captured as it is probable that 201 respondents may have only reported the most recently used mode—e.g. a subway rider who 202
walked the last half-mile may have reported to have simply “walked”). On Tuesday, 27% 203 arrived by car, while almost half (48%) arrived by walking, as many shoppers were 204
neighborhood residents. No respondents reported cycling, though a few cyclists were observed 205 at the mall. Some transit riders and pedestrians planned to leave by taxi to more easily take 206
purchases home. Saturday revealed similar results yet with a small increase in driving (33%), a 207 few subway riders (6%) and a decrease in walking (37%). Taxis saw a slight increase as well in 208
the “leaving” modal split. These results are to be expected as larger shopping ventures are more 209 likely on a Saturday as opposed to a weekday. 210 211
212
TRB 2013 Annual Meeting Paper revised from original submittal.

Gebhart 6
FIGURE 1 Mode Slits to/from Target at East River Plaza 213
214 *Tuesday, November 22, 2011, 4:50 p.m. to 6:20 p.m. 215 ^Saturday, December 3, 2011, 12:30 p.m. to 1:15 p.m. 216
217 For those who did drive to East River Plaza, not all of them parked in the attached 218
garage. From both Tuesday and Saturday, only 21 of the 32 (66%) drivers parked in facility. 219 Many who parked on-street cited the $5 charge as the reason for not parking in the garage. For 220
those who walked or took transit, a vast majority (78%) responded that they did not drive due to 221 not owning a car, followed by convenience (10%), parking cost (0.7%), and exercise (0.3%). 222
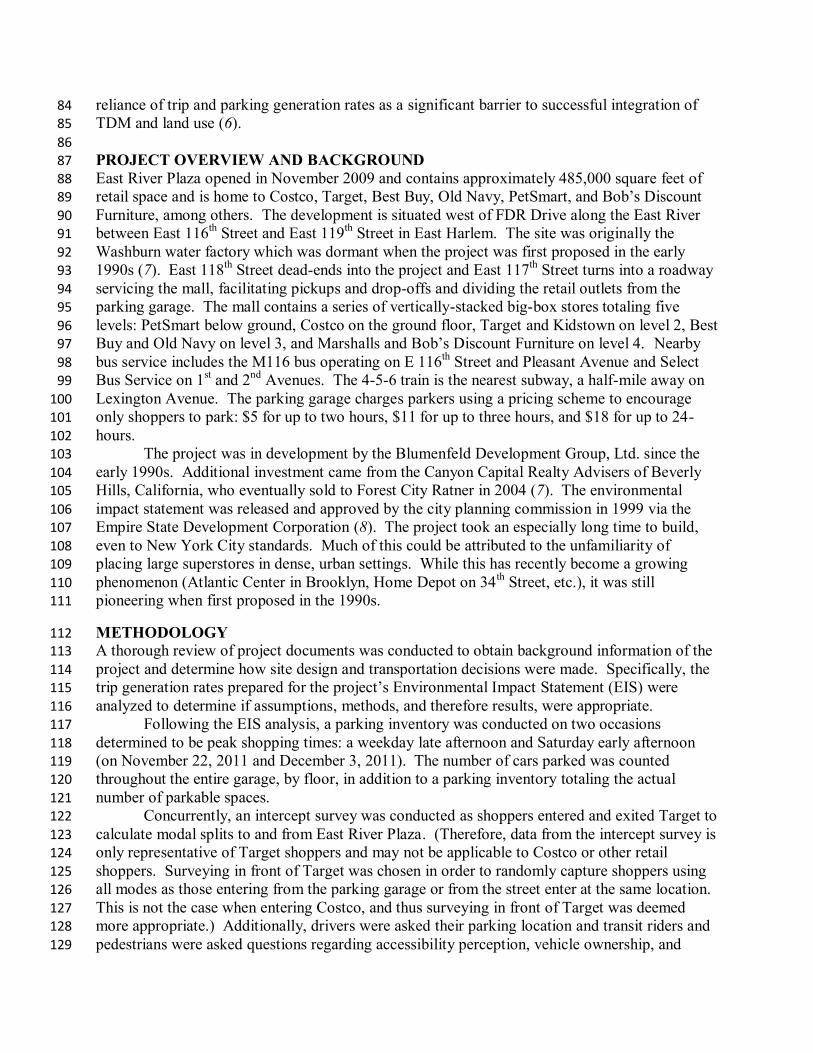
Zip code data revealed that many shoppers were traveling from close-by. A majority of 223 respondents (52%) were from the 10026, 10029, and 10035 zip codes in Harlem and East 224
Harlem. 43% of respondents were from the two closest zip codes to East River Plaza (10029 and 225 10035) in East Harlem. A map representing home zip codes of respondents is shown in Figure 2. 226 227
0%
10%
20%
30%
40%
50%
60%P
erc
en
t o
f Su
rve
yed
Sh
op
pe
rs
Mode
Tues* Arriving (n=52) Tues* Leaving (n=50) Sat^ Arriving (n=49) Sat^ Leaving (n=48)
TRB 2013 Annual Meeting Paper revised from original submittal.

Gebhart 7
FIGURE 2 Home Zip Codes Recorded from 11/22/11 and 12/3/11 Target Shopper Surveys 228
229 230
ANALYSIS OF RESULTS 231 232
Trip Generation 233 The travel demand forecasting compiled in the EIS contained the key justifications for traffic 234
impact mitigations and building the 1,248 space parking garage. However, the methodologies 235 and assumptions to generate the forecasted travel demand numbers were flawed in a variety of 236
ways. First, trip generation was based on vehicle trip rates observed at Costcos and Home 237 Depots which were all located in the outer boroughs. This is inappropriate due to the drastically 238
different levels of density, car ownership, and driving habits surrounding these store locations in 239 Brooklyn, the Bronx, Queens, and most notably, Staten Island. Only 22% of Manhattanites own 240
personal vehicles, lower than all other boroughs—Bronx (40%), Brooklyn (42%), Queens (63%), 241 and Staten Island (85%). The majority of survey respondents reside in zip codes 10026, 10029, 242
and 10035 (see Figure 2). Only 20% of these residents own personal vehicles (based on 243 American Community Survey 2006-2010 5-year estimates using census tracts approximately 244
matching zip codes). American Community Survey Journey to Work trends mirror this pattern 245 of limited car use by those in Manhattan, with only 8.7% commuting to work by vehicle (and 246
9.2% in majority-respondent zip codes), significantly lower than Brooklyn (23.5%), Bronx 247 (28.4%), Queens (40.0%), and Staten Island (64.6%) (9). Additionally, these surveyed locations 248
TRB 2013 Annual Meeting Paper revised from original submittal.

Gebhart 8
are often in portions of the outer boroughs which are more difficult to access via foot or public 249 transportation. East River Plaza is situated with easy pedestrian access from the neighborhood, 250
making driving a less-desired option. 251 Once these rates were determined at different locations, they were then simply averaged 252
together, with no weights or adjustments given. Some locations varied significantly including a 253 Saturday midday vehicle trip rate of 6.99 for the Home Depot and Queens compared to 3.90 in 254
Brooklyn. It is odd to somehow presume that a Manhattan Home Depot would generate an 255 average number of trips from these locations. A clear pattern emerges from the vehicle trip 256
generation surveys which can be correlated to density or vehicle ownership for each location, yet 257 this is lost when it is assumed that the Manhattan Home Depot will simply generate the same 258
number of trips. 259 The surveys were also flawed because they were conducted at Home Depot stores which 260
never became a tenant at East River Plaza. Whether Target would generate fewer or greater auto 261 trips is unclear, but it is reasonable to assume that home furnishing purchases tend to be larger 262
and bulkier than many goods bought at Target, and thus would result in more vehicle trips. 263 Trip generation for the remaining mixed retail simply used ITE trip generation rates. The 264
flawed application of these rates has become fairly apparent as chronicled by Donald Shoup in 265 The High Cost of Free Parking. Notably, trip generation rates for given land uses are typically 266
based on the average vehicle trips observed from a small sample of suburban locations, with 267 plenty of free parking, and no public transit (1). The ITE manual calculates trip ends based on 268
square footage, yet the surveys that these rates are typically based on often show no statistically 269 significant relationship between square footage and trips generated. Nonetheless, the fitted curve 270
equation is given, allowing engineers and developers to calculate the precise number of trips to 271 be generated. In the case of East River Plaza, the result is vehicle trip rates of 4.52, 4.86, and 272
6.69 trips per 1,000 square feet during the weekday midday, weekday PM, and Saturday midday 273 peaks (8). Applying ITE trip generation rates produces inaccurate results, especially in this 274
project context in Manhattan. 275 Perhaps the most surprising assumption in the travel forecast demand is the 67% to 68% 276
auto modal split for all three site components. The only explanation given for this is that they 277 “were based on surveys conducted at various retail projects in New York City, as well as travel 278
characteristics of the area based on the 1990 census” (8). Further explanation as to the nature of 279 these surveys is not given. Also, information regarding what census characteristics were 280
considered or a definition of the area is not given. Judging from the low car ownership rates and 281 low percentage of vehicle commute trips in the area, a more-than two-thirds auto mode share 282
would seem unlikely. The weekday PM peak survey conducted for this case study observed a 283 drive mode share far less than half (27% compared to 67%) of the EIS assumptions. The 284
Saturday midday peak drive mode share was also less than half (33% compared to 67%). 285 Correcting these assumptions would result in less than half of the vehicle trips forecasted to be 286
added to the roadway network. 287 288
Parking Accumulation 289 While trip generation was used to determine the number of additional trips added to the roadway 290
network, and thus, mitigations necessary to handle said trips, the expected parking accumulation 291 patterns justified the need for the 1,248-car parking garage. Like trip generation, parking 292
accumulation is based on observations on outer borough locations. However, instead of 293 surveying these locations, the accumulation figures are instead based on “planning assumptions 294
TRB 2013 Annual Meeting Paper revised from original submittal.
Gebhart 9
used in Home Depot parking studies” (8). However, these assumptions are never explicitly 295 stated. Additionally, one of the studies referenced is from a Home Depot in a New York City 296
suburb, in Port Chester, NY in West Chester County near Connecticut, which is even more auto-297 dependent than the Bronx or Queens locations, as 94% of households own at least one vehicle 298
(9). 299 The accumulation rates calculated for Costco were based on one accumulation survey in 300
Staten Island. This is therefore measuring the amount of parking in the most car-dependent 301 borough and applying it to the most car-free borough. The total parking accumulation is then 302
calculated by summing the accumulations of Home Depot, Costco, and mixed retail (which is 303 calculated using the ITE Trip Generation Handbook, 6
th Edition). 304
An additional problem is that all of the parking accumulation patterns are based on 305 locations in which parking is free. The East River Plaza garage charges a minimum of $5 to 306
park. As would be expected, the demand for priced parking is lower than the demand for free 307 parking. Evidence for this exists from intercept survey results where car owners cited the 308
parking cost as their reason to not drive. 309 310
Planning for Parking 311 Beyond poor assumptions and methodologies in the parking accumulation calculations, there is 312
an even more fundamentally faulty assumption of planning a parking garage to supply more than 313 enough spaces to satisfy peak parking occupancy. Even if the trip generation rates and parking 314
accumulation rates were accurate, the garage was projected to be more than half-empty before 315 10:00 a.m. and after 6:00 p.m. on Saturdays (8). This results in an extremely inefficient land use 316
in a location where land is quite valuable. Because drivers do not pay the full market rate at the 317 garage, it in turn raises the cost of everything else. It is an area where few people drive, yet the 318
costs of parking are spread broadly. 319 The virtue of satisfying peak free parking demand (when the parking ultimately will not 320
be free) should be questioned as it results in underutilized land use most of the time. Instead of 321 designing the garage for sufficient supply for the peak hour, the garage could instead be designed 322
for slightly less than that. The Parsons Transportation Group did just this when conducting a 323 parking study for Home Depot and recommending a “design day” for parking supply—the fifth 324
busiest day of the year. Parsons explained that the negative implications “would mean that some 325 customers may not be able to find a parking space immediately during the peak hour of busiest 326
four or five days of the year; however, they should have no problem finding a parking space in 327 the lot at any other time” (1). Likewise, it may have been appropriate to design the parking 328
garage supply to satisfy free demand at a point less than the Saturday peak hour, especially when 329 pricing was to be instituted. 330
331
Pedestrian Facilitation 332 As shown in Figure 1, a high number of pedestrians enter and leave the site. However, the mall 333 was designed assuming most shoppers would be arriving via automobile. Thus, much of the 334
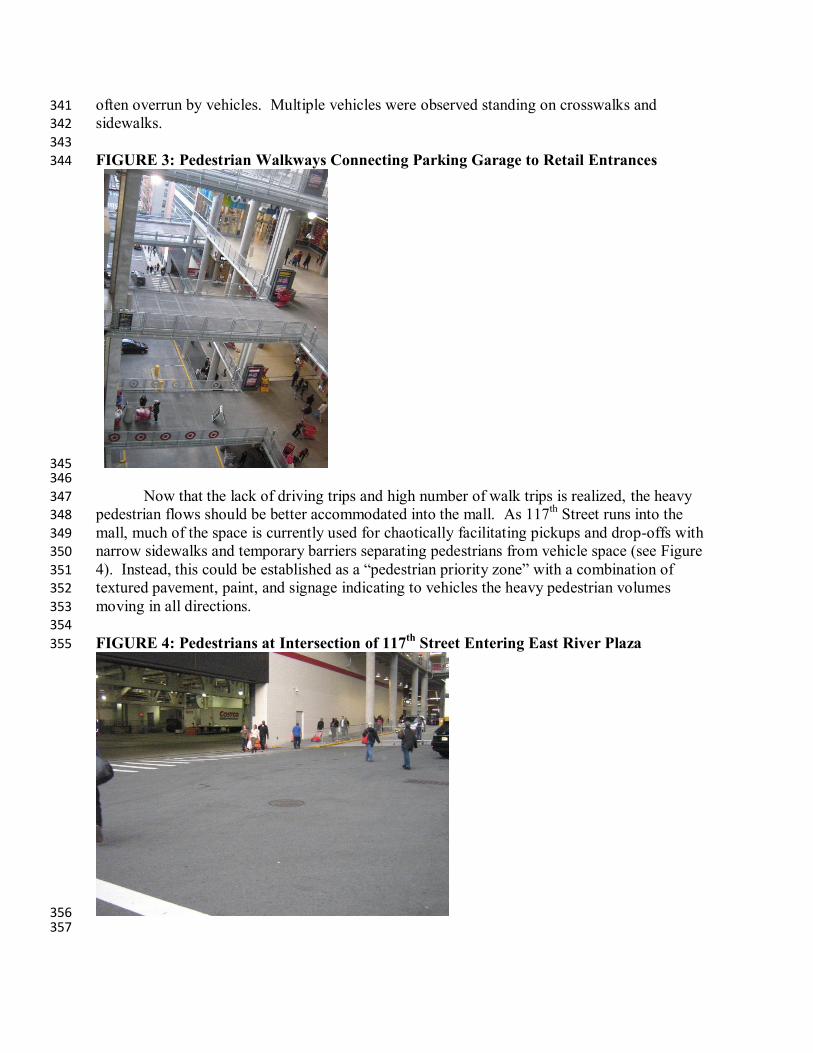
design was based around facilitating pedestrian flows from the parking garage. Figure 3 shows 335 the walkways built to connect each level of the parking garage to the shopping center providing 336
easy access and sufficient capacity for movement to and from the garage. However, the same 337 care was not taken to facilitate pedestrians coming from the street. The project required some of 338
the sidewalk on East 117th Street to be narrowed, while the roadway was widened, reducing 339
pedestrian capacity. Additionally, navigating the space as a pedestrian can be confusing as it is 340
TRB 2013 Annual Meeting Paper revised from original submittal.
Gebhart 10
often overrun by vehicles. Multiple vehicles were observed standing on crosswalks and 341 sidewalks. 342
343
FIGURE 3: Pedestrian Walkways Connecting Parking Garage to Retail Entrances 344
345 346
Now that the lack of driving trips and high number of walk trips is realized, the heavy 347 pedestrian flows should be better accommodated into the mall. As 117
th Street runs into the 348
mall, much of the space is currently used for chaotically facilitating pickups and drop-offs with 349 narrow sidewalks and temporary barriers separating pedestrians from vehicle space (see Figure 350
4). Instead, this could be established as a “pedestrian priority zone” with a combination of 351 textured pavement, paint, and signage indicating to vehicles the heavy pedestrian volumes 352
moving in all directions. 353 354
FIGURE 4: Pedestrians at Intersection of 117th
Street Entering East River Plaza 355
356 357
TRB 2013 Annual Meeting Paper revised from original submittal.

Gebhart 11
CONCLUSIONS 358 In a July 20, 2010 post on Streetsblog, Noah Kazis stated “It's safe to say that East River Plaza 359
will go down as an urban planning disaster for the ages” (2). Why did East River Plaza provide 360 such an oversupply of parking using valuable land and adding significant costs? Lead developer 361
David Blumenfeld suggested large parking supply desires from the big-box tenants: “I don’t 362 think the tenants were ever ready to build it without parking,” Blumenfeld stated (10). He also 363
noted that there was no pushback from the city to limit parking capacity (10). 364 While the garage remains, evidence of exploring other possibilities for the garage exists. 365
Between the two survey dates, a portion of floor 3b was fenced off and filled with storage boxes, 366 as discovered on the December 3, 2011 survey date (see Figure 5). Taking a cue from this 367
creative re-use, other possibilities should be explored as well. The garage could be used for 368 events, such as a farmer’s market or craft fair. Open space for such events can be difficult to 369
come by in Manhattan and such events could then benefit tenants of East River Plaza, by 370 attracting more visitors to the mall. 371
372 FIGURE 5: Re-use of a Portion of Level 3b for Storage 373
374 375
When questioned about the future of the garage, Rachel Weinberger of the University of 376 Pennsylvania posited that the top floor will likely become reserved for monthly parking for 377
residents (10). By increasing the parking supply in East Harlem, increased car-ownership and 378 induced driving are likely to occur. If new residential development occurs in the neighborhood, 379
the parking supply will further increase due to minimum residential parking requirements 380 (parking maximums do exist for Manhattan south of 96
th Street on the East Side and south of 381
110th
Street on the West Side, but do not extend up to East Harlem) (13). As Shoup proposes, 382 eliminating these minimums is an appropriate first step. Then, for developments such as East 383
River Plaza, the city should work more closely with the developer to limit excess parking from 384
TRB 2013 Annual Meeting Paper revised from original submittal.

Gebhart 12
being built. David Blumenfeld, the project’s lead developer stated in a July 8th
Streetsblog 385 article, “None of these things had ever been built in an urban market before. There was no 386
model to go off of; there was only the suburban model” (10). However, now as more big-box 387 stores are locating in urban environments, other models are being developed to follow. The 388
Home Depot on 23rd
Street in Manhattan has no dedicated parking spaces (10). Thus, an 389 oversupply of parking is not inevitable when big box stores locate in urban environments. 390 391
TRB 2013 Annual Meeting Paper revised from original submittal.

Gebhart 13
ACKNOWLEDGMENTS 392 The author would like to acknowledge and thank Robert B. Noland at Rutgers, the State 393
University of New Jersey for serving as an advisor to this research, the Empire State 394 Development Corporation for providing the apparently-only copy in existence of the EIS for the 395
East River Plaza Project, and the East River Plaza security staff for allowing the intercept survey 396 to be conducted. 397 398
TRB 2013 Annual Meeting Paper revised from original submittal.

Gebhart 14
REFERENCES 399 1. Shoup, Donald. The High Cost of Free Parking. Paperback. American Planning 400
Association, Chicago, 2011. 401 2. Kazis, Noah. Quinn Praises Empty Garage at East River Plaza Ribbon Cutting. 402
Streetsblog, July 7, 2010. http://www.streetsblog.org/2010/07/20/quinn-praises-empty-403 garage-at-east-river-plaza-ribbon-cutting/. Accessed Dec. 13, 2011. 404
3. Rowe, Daniel H., Bae, C.-H. Christine and Shen, Qing. Evaluating the Impact of Transit 405 Service. In Transportation Research Record: Journal of the Transportation Research 406
Board No. 2245, Transportation Research Board of the National Academies, Washington, 407 D.C., 2011, pp. 56-62. 408
4. Wilson, Richard William and Roberts, Michael. Parking Demand and Zoning 409 Requirements for Suburban Multifamily Housing. Presented at 83rd Annual Meeting of 410
the Transportation Research Board, Washington, D.C., 2004. 411 5. Engel-Yan, Joshua, Hollingworth, Brian and Anderson, Stuart. Will Reducing Parking 412
Standards Lead to Reductions in Parking Supply?: Results of Extensive Commercial 413 Parking Survey in Toronto, Canada. In Transportation Research Record: Journal of the 414
Transportation Research Board, No. 2010, Transportation Research Board of the 415 National Academies, Washington, D.C., 2007, pp. 102-110. 416
6. Hendricks, Sara J. Four Challenges to Incorporating Transportation Demand 417 Management into the Land Development Process. In Transportation Research Record: 418
Journal of the Transportation Research Board, No. 2046, Transportation Research Board 419 of the National Academies, Washington, D.C., 2008, pp. 30-36. 420
7. Pristin, Terry. A Difficult Birth for East Harlem Mall. The New York Times. October 20, 421 2009. 422
8. Allee King Rosen & Fleming, Inc. East River Plaza FEIS. Empire State Development 423 Corporation, 1999. 424
9. U.S. Census Bureau. American Community Survey. 2010. 425 10. Kazis, Noah. Big Box Mall's Giant Parking Garage a Predictable, Preventable Waste. 426
Streetsblog. July 8, 2010. http://www.streetsblog.org/2010/07/08/big-box-malls-giant-427 parking-garage-a-predictable-preventable-waste/. Accessed Dec. 11, 2011. 428
11. Pristin, Terry. Costco Fails Again in Bid for a Manhattan Foothold. The New York Times. 429 September 17, 2006. 430
12. Blumenfeld Development Group, Ltd. East River Plaza. http://www.eastriverplaza.com/. 431 Accessed Dec. 10, 2011 432
13. Manhattan Core: Public Parking Study. UPWP Project # PTCP08D00.G06. NYC 433 Department of City Planning, Transportation Division, 2011. 434
435
TRB 2013 Annual Meeting Paper revised from original submittal.


![P-63 3 4 O4 3 4 - Sekretarijat za · PDF filetrafostanica 2282 2299 XOD] X JDUDæX kontenjer parking parking parking parking parking parking kontenjer trafostanica kontenjer kontenjer](https://img.pdfslide.net/doc/110x75/5a95e7177f8b9a18628cd8cb/p-63-3-4-o4-3-4-sekretarijat-za-2282-2299-xod-x-jdudx-kontenjer-parking-parking.jpg)