Embed Size (px)
Citation preview
Parkway Life REIT(“PLife REIT”)
1Q 2010 Results Presentation6 May 2010
DisclaimerDisclaimerThis Presentation is focused on comparing actual results for the period from 1 January 2010 to 31 March 2010 (“1Q 2010”) versus the period from 1 January 2009 to 31 March 2009 (“1Q 2009”). This shall be read in conjunction with PLife REIT 2010 First Quarter Unaudited Financial Statement and Distribution Announcement in SGXNet.
This Presentation may contain forward-looking statements that involve assumptions, risks and uncertainties. Actual future performance, outcomes and results may differ materially from those expressed in forward-looking statements as a result of a number of risks, uncertainties and assumptions. Representative examples of these factors include (without limitation) general industry and economic conditions, interest rate trends, cost of capital and capital availability, shifts in expected levels of property rental income, changes in operating expenses, property expenses and governmental and public policy changes and the continued availability of financing in the amounts and the terms necessary to support future business. Investors are cautioned not to place undue reliance on these forward-looking statements, which are based on the Manager’s current view of future events.
2
Agenda Agenda
1Q 2010 Highlights11
Financial Highlights22
Capital and Financial Management
3
Our Growth StrategyII
33
Appendix A
Portfolio HighlightsIIII
44
1Q 2010 Highlights1Q 2010 Highlights
4
1Q 2010 Highlights1Q 2010 Highlights
5
Strong Revenue & Net Property Income Growth― Gross revenue grew by 14.1% (1Q Y-O-Y)
― Net property income grew by 13.4% (1Q Y-O-Y)
Continued DPU Growth since IPO― DPU for 1Q 2010 at 2.07 cents
― Strong growth of 30.2% since IPO
Strengthened Balance Sheet ― Healthy gearing of 28.2%
― Low effective all-in borrowing cost of 3.06%
1Q 2010 Highlights (cont1Q 2010 Highlights (cont’’d)d)
6
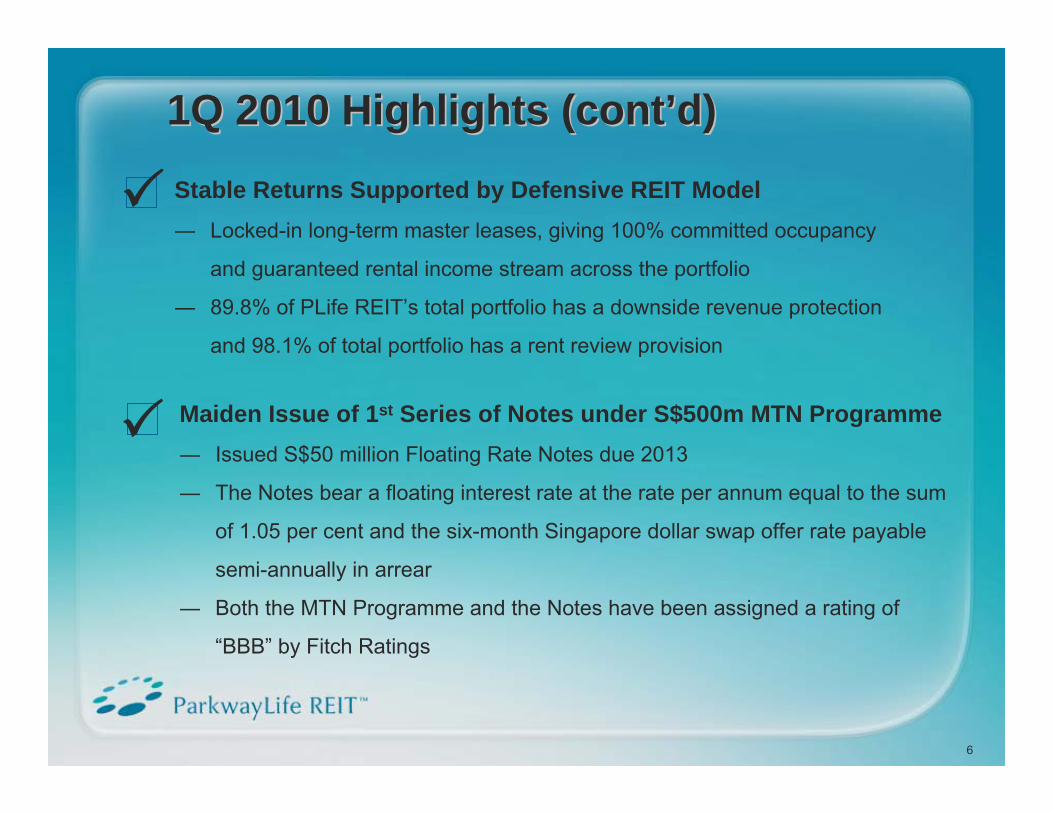
Stable Returns Supported by Defensive REIT Model― Locked-in long-term master leases, giving 100% committed occupancy
and guaranteed rental income stream across the portfolio
― 89.8% of PLife REIT’s total portfolio has a downside revenue protection
and 98.1% of total portfolio has a rent review provision
Maiden Issue of 1st Series of Notes under S$500m MTN Programme― Issued S$50 million Floating Rate Notes due 2013
― The Notes bear a floating interest rate at the rate per annum equal to the sum
of 1.05 per cent and the six-month Singapore dollar swap offer rate payable
semi-annually in arrear
― Both the MTN Programme and the Notes have been assigned a rating of
“BBB” by Fitch Ratings
Financial HighlightsFinancial Highlights
7
8
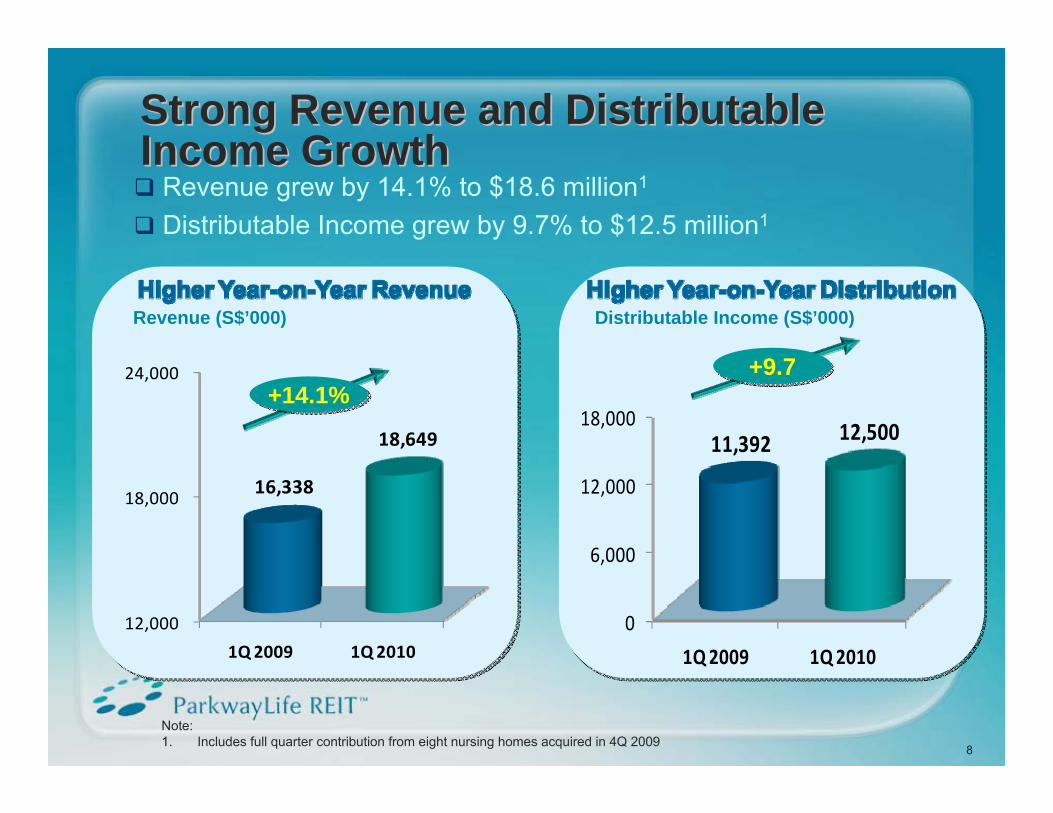
Strong Revenue and Distributable Strong Revenue and Distributable Income GrowthIncome Growth
Revenue grew by 14.1% to $18.6 million1
Distributable Income grew by 9.7% to $12.5 million1
12,000
18,000
24,000
1Q 2009 1Q 2010
16,338
18,649
0
6,000
12,000
18,000
1Q 2009 1Q 2010
11,392 12,500
Revenue (S$’000)
+14.1%+14.1%+9.7+9.7
Distributable Income (S$’000)
Note:1. Includes full quarter contribution from eight nursing homes acquired in 4Q 2009
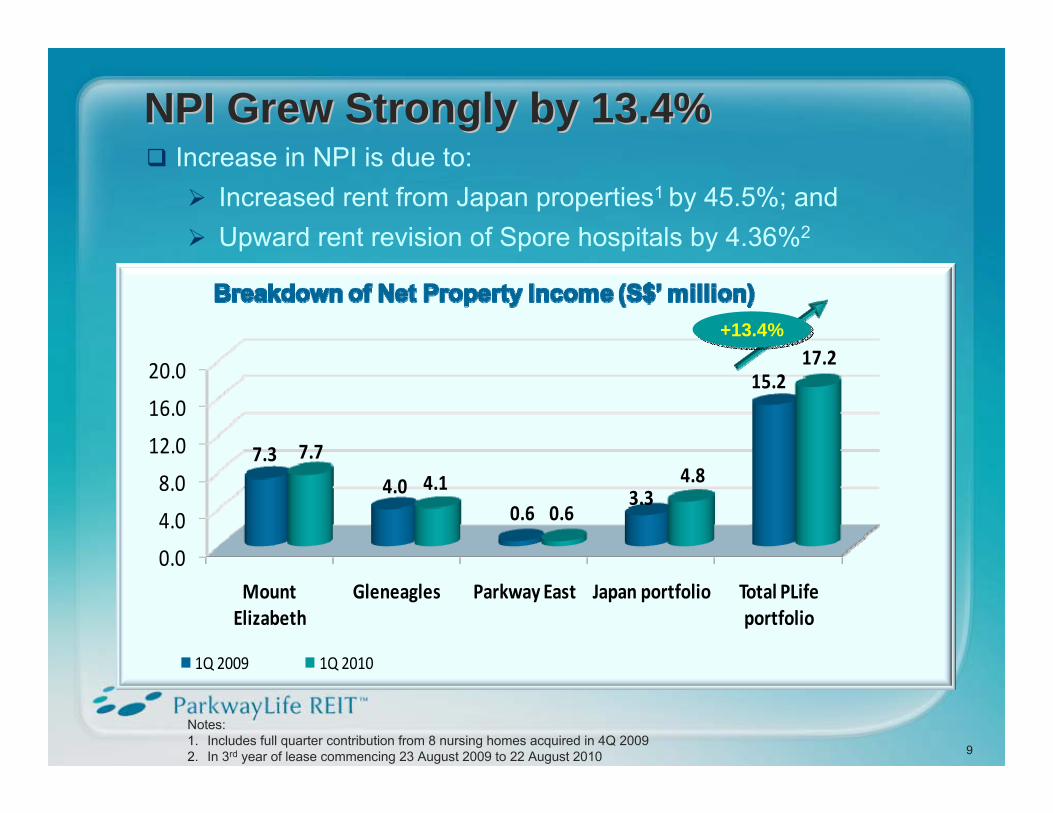
NPI Grew Strongly by 13.4%NPI Grew Strongly by 13.4%Increase in NPI is due to:
Increased rent from Japan properties1 by 45.5%; andUpward rent revision of Spore hospitals by 4.36%2
9
0.0
4.0
8.0
12.0
16.0
20.0
Mount Elizabeth
Gleneagles Parkway East Japan portfolio Total PLife portfolio
7.3
4.00.6
3.3
15.2
7.74.1
0.6
4.8
17.2
1Q 2009 1Q 2010
+13.4%+13.4%
Notes:1. Includes full quarter contribution from 8 nursing homes acquired in 4Q 20092. In 3rd year of lease commencing 23 August 2009 to 22 August 2010
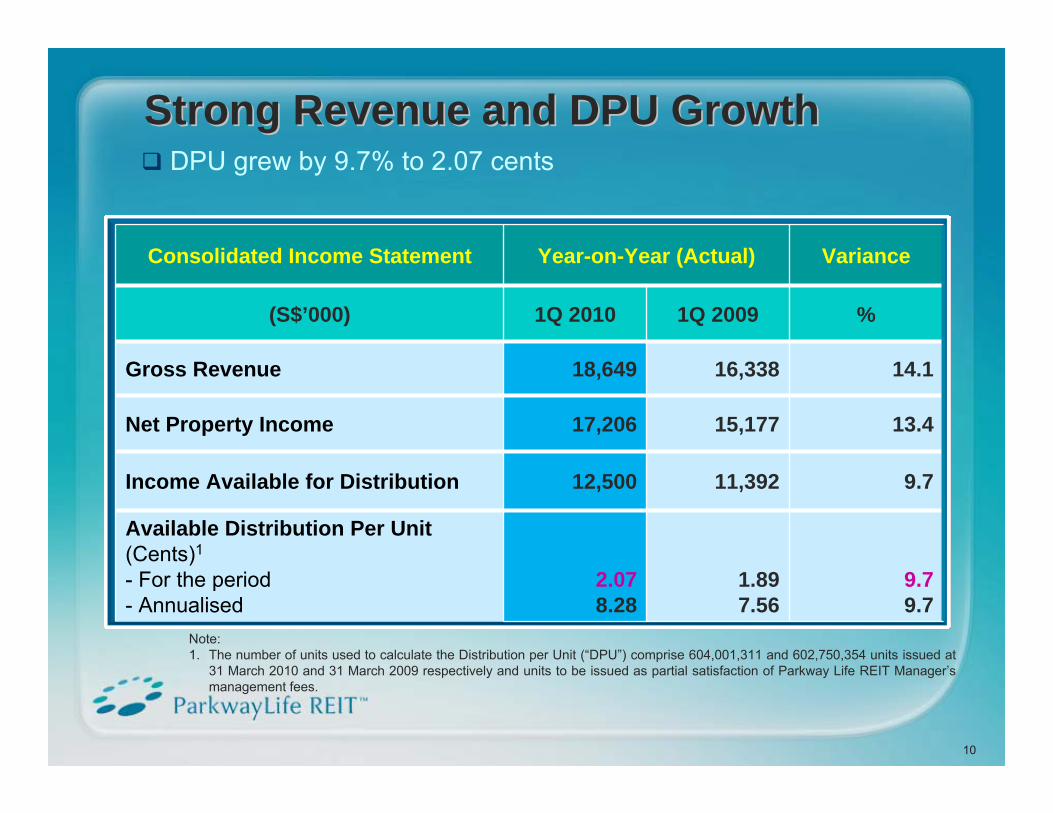
Consolidated Income Statement Year-on-Year (Actual) Variance
(S$’000) 1Q 2010 1Q 2009 %
Gross Revenue 18,649 16,338 14.1
Net Property Income 17,206 15,177 13.4
Income Available for Distribution 12,500 11,392 9.7
Available Distribution Per Unit (Cents)1
- For the period- Annualised
2.078.28
1.897.56
9.79.7
Strong Revenue and DPU GrowthStrong Revenue and DPU GrowthDPU grew by 9.7% to 2.07 cents
10
Note:1. The number of units used to calculate the Distribution per Unit (“DPU”) comprise 604,001,311 and 602,750,354 units issued at
31 March 2010 and 31 March 2009 respectively and units to be issued as partial satisfaction of Parkway Life REIT Manager’s management fees.
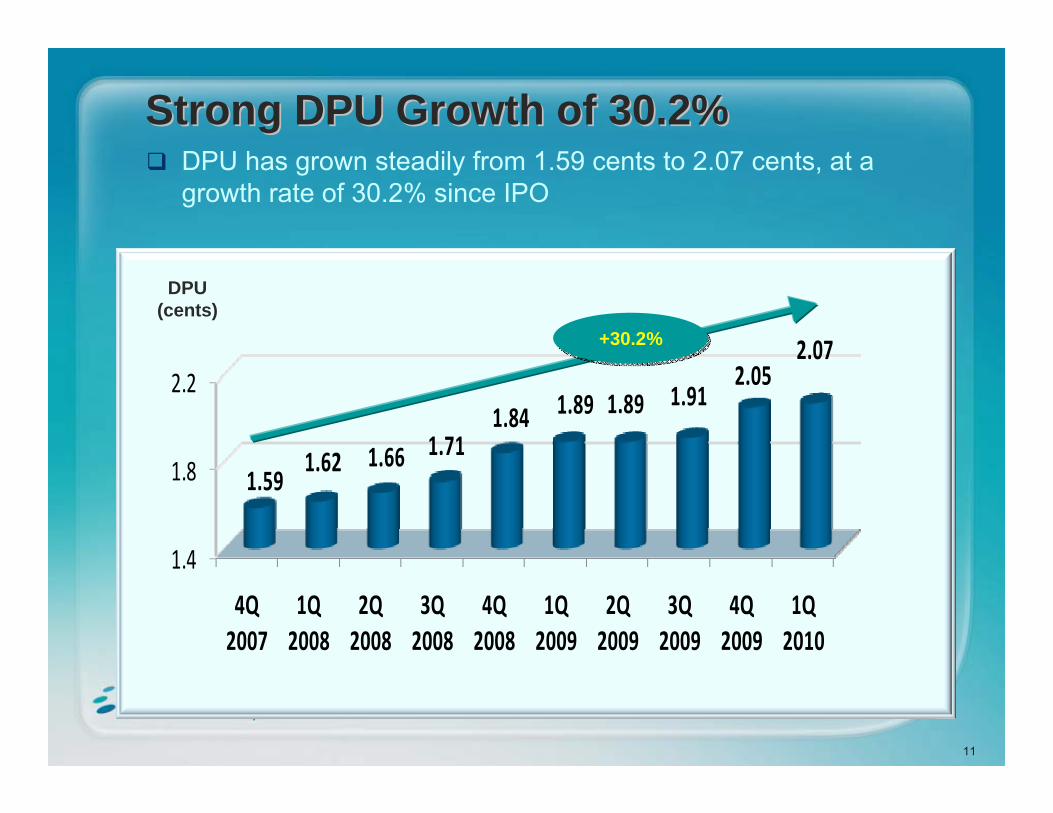
Strong DPU Growth of 30.2%Strong DPU Growth of 30.2%DPU has grown steadily from 1.59 cents to 2.07 cents, at a growth rate of 30.2% since IPO
11
1.4
1.8
2.2
4Q 2007
1Q 2008
2Q 2008
3Q 2008
4Q 2008
1Q 2009
2Q 2009
3Q 2009
4Q 2009
1Q 2010
1.591.62 1.66 1.71
1.84 1.89 1.89 1.912.05
2.07
DPU (cents)
+30.2%+30.2%
12
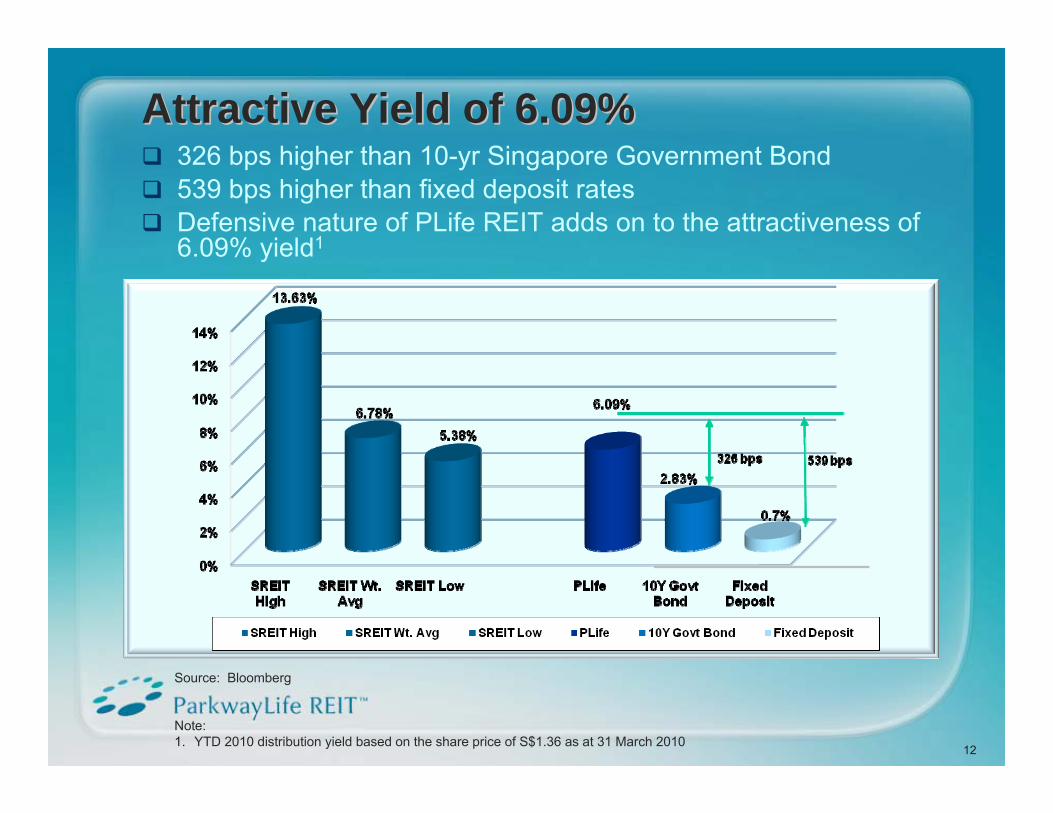
Attractive Yield of 6.09%Attractive Yield of 6.09%
Source: Bloomberg
Note:1. YTD 2010 distribution yield based on the share price of S$1.36 as at 31 March 2010
326 bps higher than 10-yr Singapore Government Bond539 bps higher than fixed deposit ratesDefensive nature of PLife REIT adds on to the attractiveness of 6.09% yield1
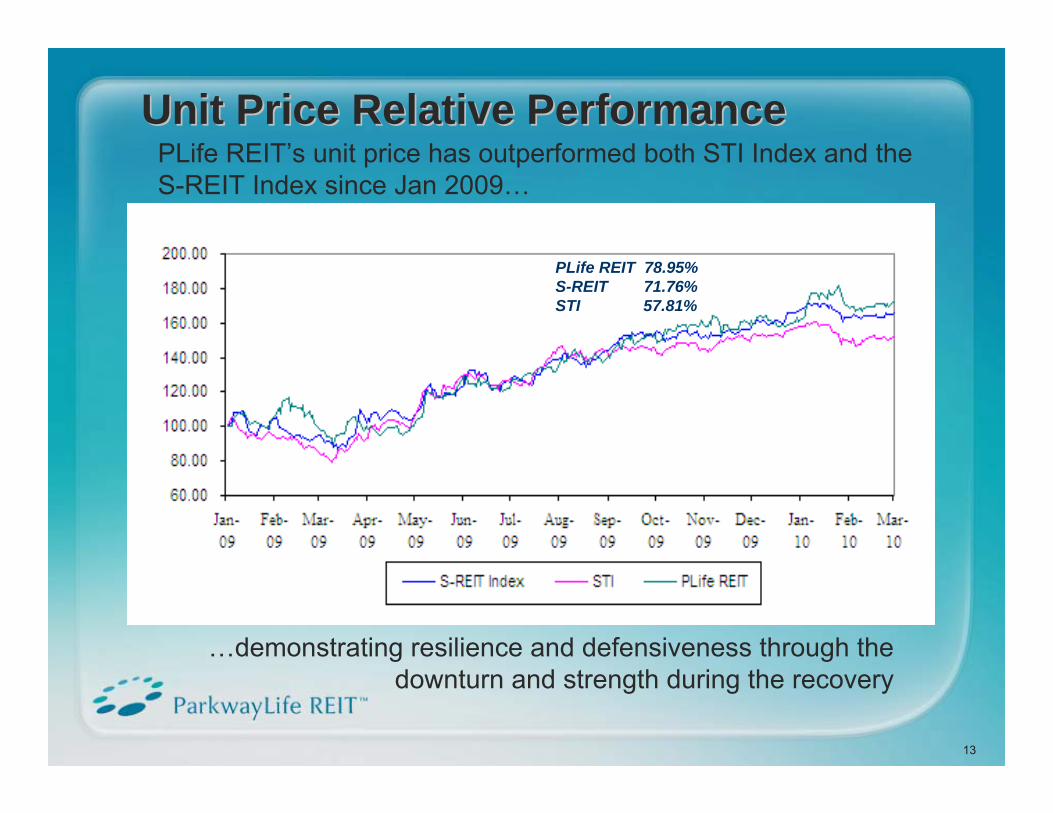
Unit Price Relative PerformanceUnit Price Relative Performance
13
PLife REIT’s unit price has outperformed both STI Index and the S-REIT Index since Jan 2009…
PLife REIT 78.95%S-REIT 71.76%STI 57.81%
…demonstrating resilience and defensiveness through the downturn and strength during the recovery
Distribution DetailsDistribution Details
14
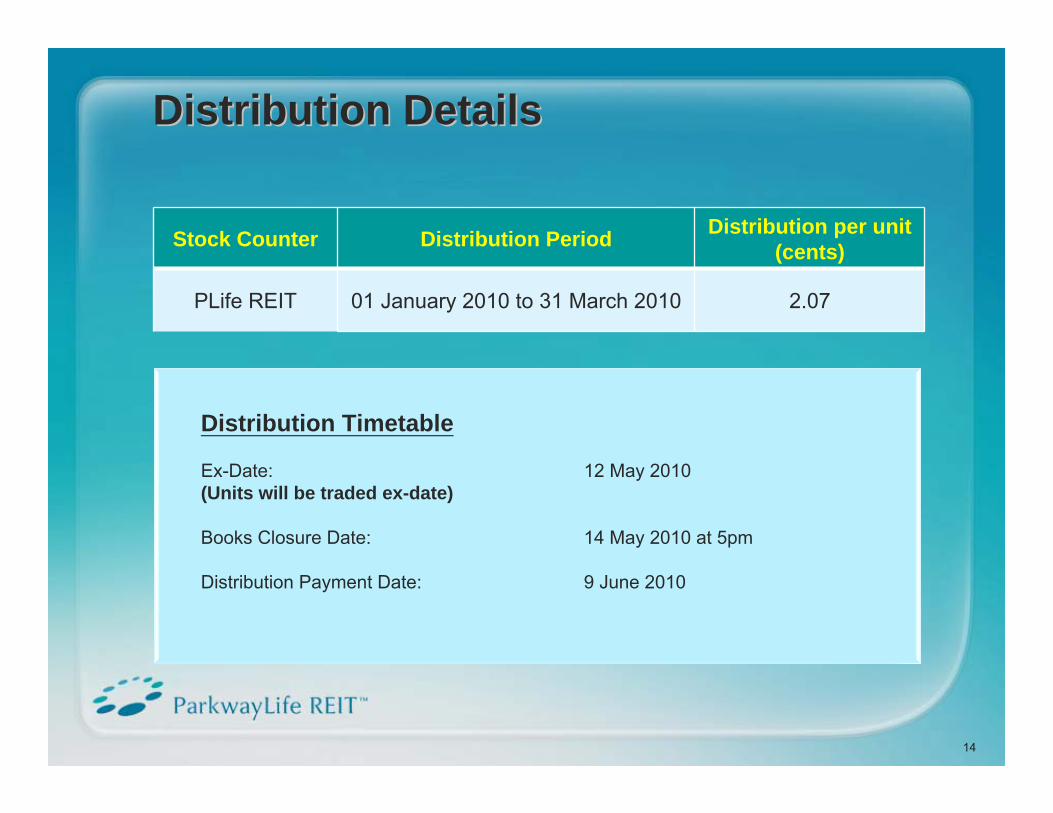
Stock Counter Distribution Period Distribution per unit(cents)
PLife REIT 01 January 2010 to 31 March 2010 2.07
Distribution Timetable
Ex-Date: 12 May 2010(Units will be traded ex-date)
Books Closure Date: 14 May 2010 at 5pm
Distribution Payment Date: 9 June 2010
Capital and Financial Capital and Financial ManagementManagement
15
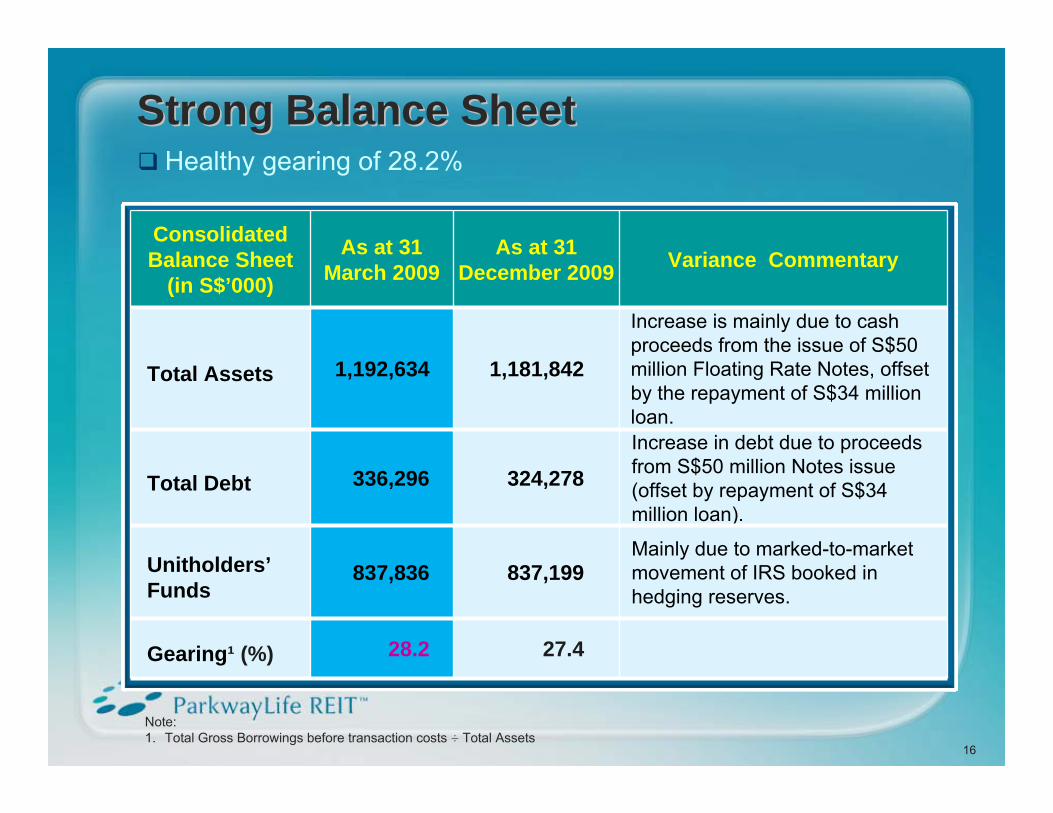
Strong Balance SheetStrong Balance SheetHealthy gearing of 28.2%
16
Note:1. Total Gross Borrowings before transaction costs ÷ Total Assets
Consolidated Balance Sheet
(in S$’000)
As at 31 March 2009
As at 31 December 2009 Variance Commentary
Total Assets 1,192,634 1,181,842
Increase is mainly due to cash proceeds from the issue of S$50 million Floating Rate Notes, offset by the repayment of S$34 million loan.
Total Debt 336,296 324,278Increase in debt due to proceeds from S$50 million Notes issue (offset by repayment of S$34 million loan).
Unitholders’Funds
837,836 837,199Mainly due to marked-to-market movement of IRS booked in hedging reserves.
Gearing¹ (%) 28.2 27.4
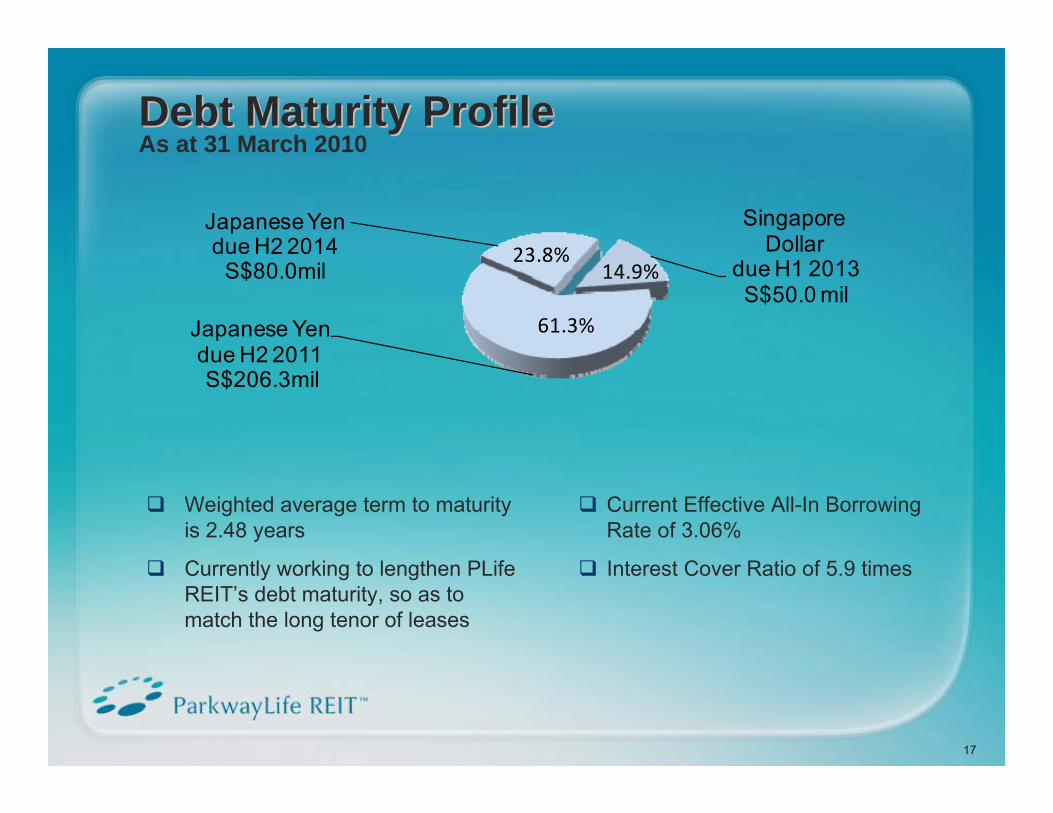
Singapore Dollar
due H1 2013S$50.0 mil
Japanese Yen due H2 2011S$206.3mil
Japanese Yen due H2 2014
S$80.0mil23.8%
61.3%
14.9%
Debt Maturity ProfileDebt Maturity ProfileAs at 31 March 2010
17
Weighted average term to maturity is 2.48 years
Currently working to lengthen PLife REIT’s debt maturity, so as to match the long tenor of leases
Current Effective All-In Borrowing Rate of 3.06%
Interest Cover Ratio of 5.9 times
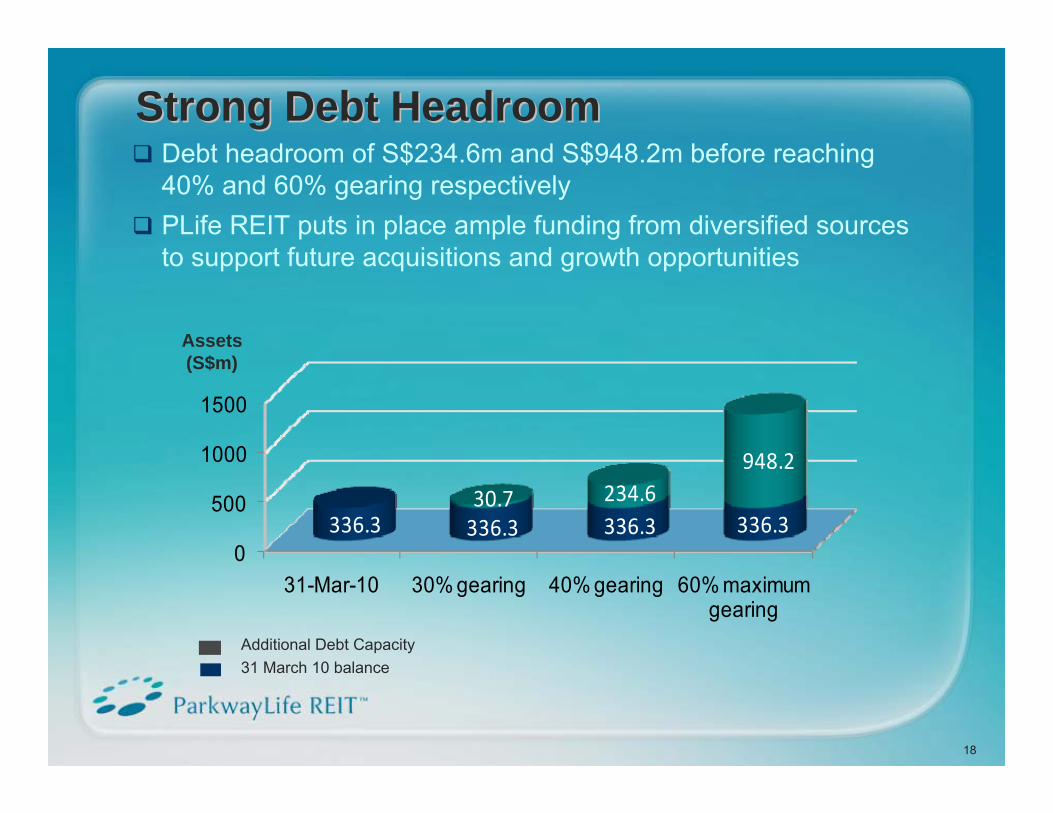
Strong Debt HeadroomStrong Debt HeadroomDebt headroom of S$234.6m and S$948.2m before reaching 40% and 60% gearing respectivelyPLife REIT puts in place ample funding from diversified sources to support future acquisitions and growth opportunities
18
0
500
1000
1500
31-Mar-10 30% gearing 40% gearing 60% maximum gearing
336.3 336.3 336.3 336.330.7 234.6
948.2
Additional Debt Capacity 31 March 10 balance
Assets (S$m)
Appendix AAppendix A
19
Our Growth Strategy
20
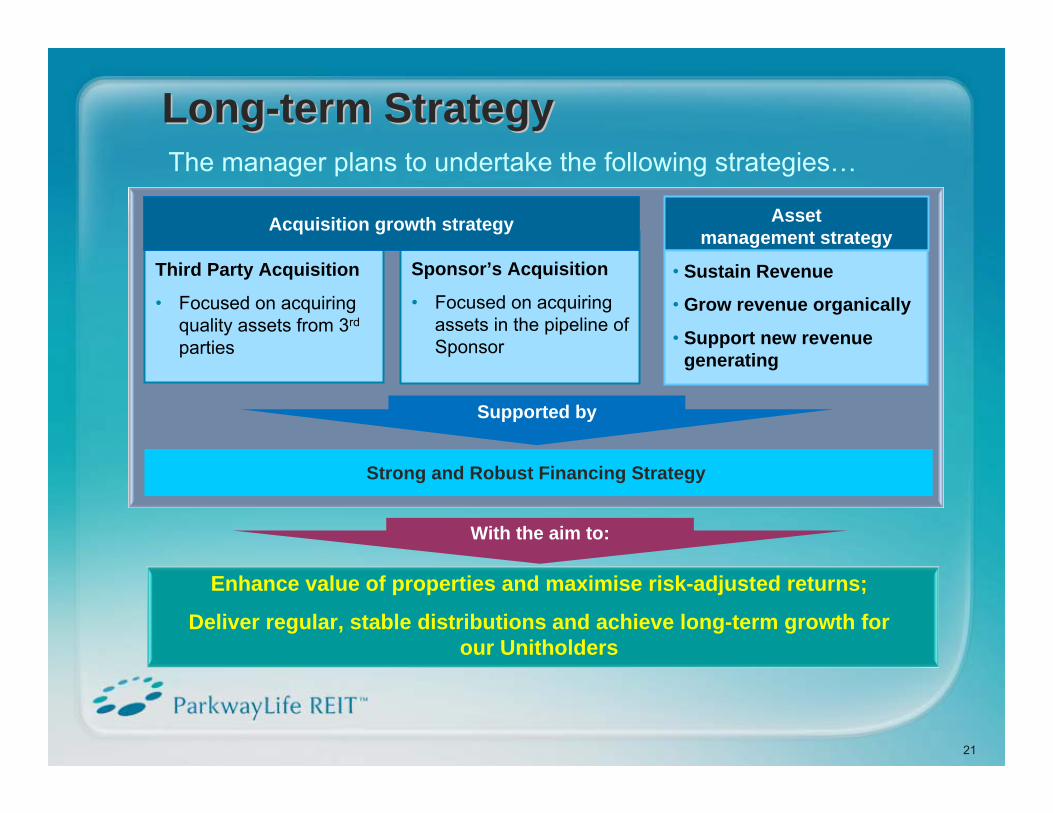
Sponsor’s Acquisition
• Focused on acquiring assets in the pipeline of Sponsor
Third Party Acquisition
• Focused on acquiring quality assets from 3rd
parties
LongLong--term Strategyterm Strategy
Assetmanagement strategy
Acquisition growth strategy
• Sustain Revenue
• Grow revenue organically
• Support new revenue generating
21
With the aim to:
The manager plans to undertake the following strategies…
Strong and Robust Financing Strategy
Enhance value of properties and maximise risk-adjusted returns;
Deliver regular, stable distributions and achieve long-term growth for our Unitholders
Supported by
22
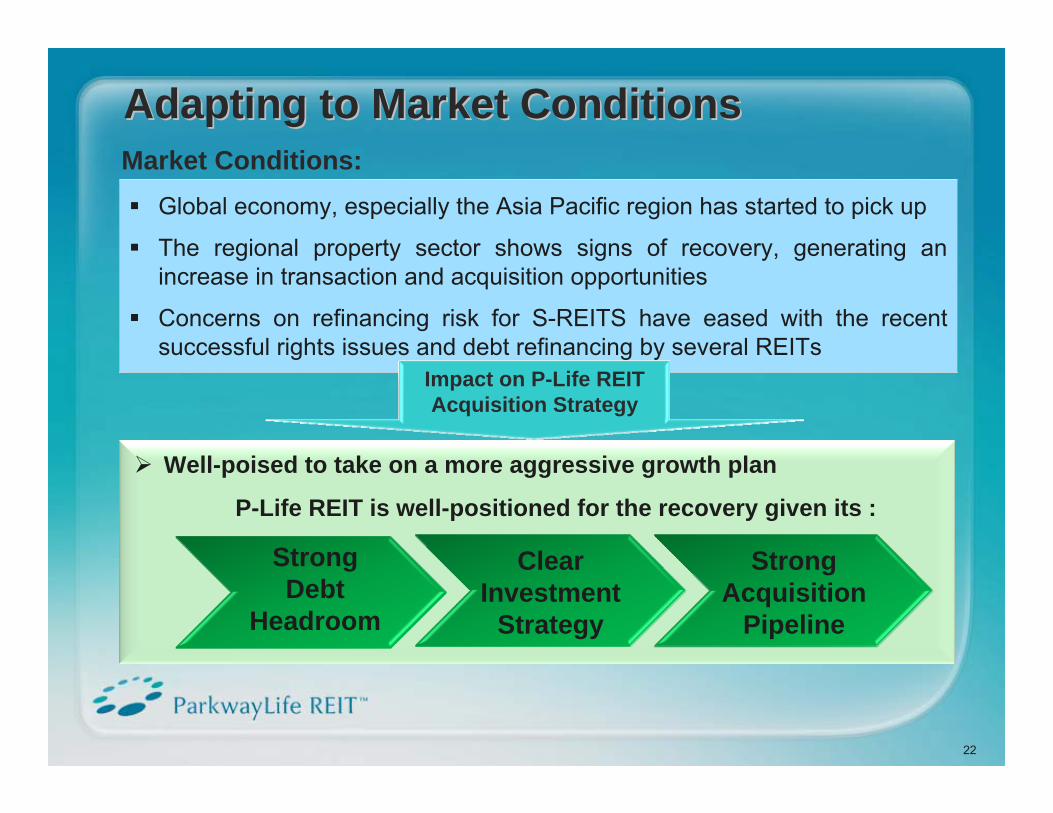
Adapting to Market ConditionsAdapting to Market ConditionsMarket Conditions:
Global economy, especially the Asia Pacific region has started to pick up
The regional property sector shows signs of recovery, generating an increase in transaction and acquisition opportunities
Concerns on refinancing risk for S-REITS have eased with the recent successful rights issues and debt refinancing by several REITs
Well-poised to take on a more aggressive growth plan
P-Life REIT is well-positioned for the recovery given its :
Clear Investment
Strategy
Strong Acquisition
Pipeline
Strong Debt
Headroom
Impact on P-Life REIT Acquisition Strategy
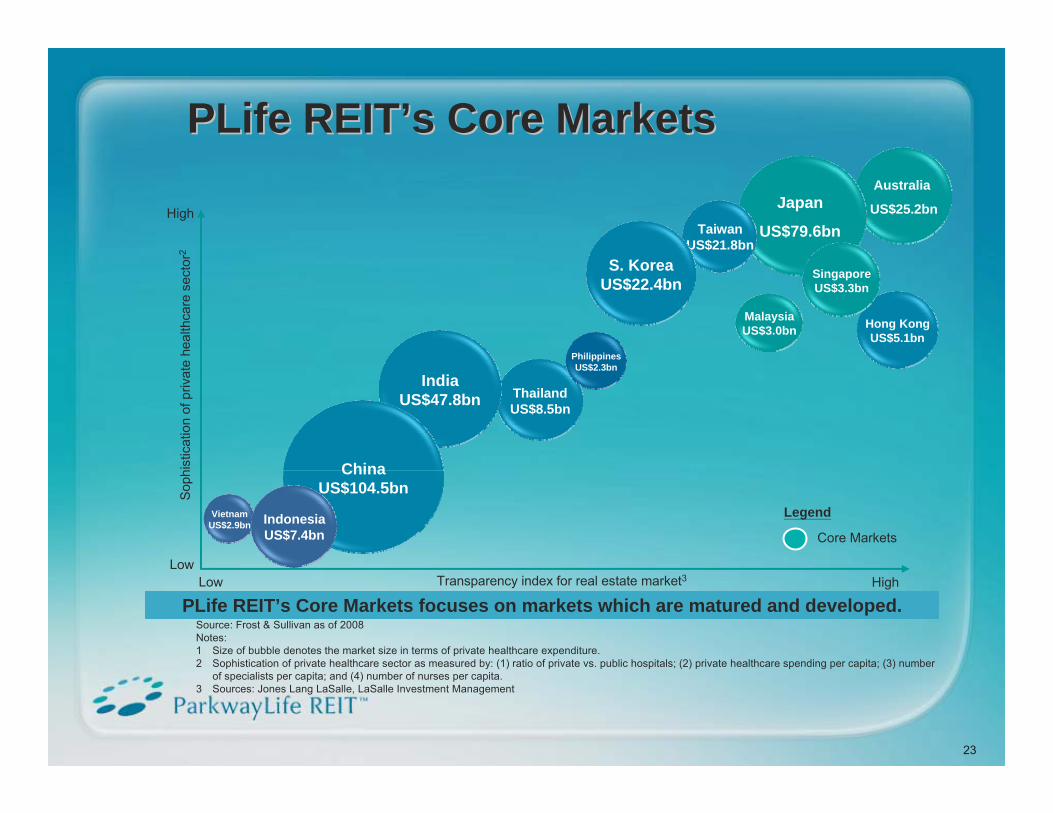
Australia
US$25.2bn
Source: Frost & Sullivan as of 2008Notes:1 Size of bubble denotes the market size in terms of private healthcare expenditure.2 Sophistication of private healthcare sector as measured by: (1) ratio of private vs. public hospitals; (2) private healthcare spending per capita; (3) number
of specialists per capita; and (4) number of nurses per capita.3 Sources: Jones Lang LaSalle, LaSalle Investment Management
Japan
US$79.6bnTaiwanUS$21.8bn
ThailandUS$8.5bn
IndiaUS$47.8bn
Hong KongUS$5.1bn
ChinaUS$104.5bn
VietnamUS$2.9bn Indonesia
US$7.4bn
PhilippinesUS$2.3bn
S. KoreaUS$22.4bn
SingaporeUS$3.3bn
Soph
istic
atio
n of
priv
ate
heal
thca
re s
ecto
r2
High
LowLow HighTransparency index for real estate market3
Legend
Core Markets
23
MalaysiaUS$3.0bn
PLife REIT’s Core Markets focuses on markets which are matured and developed.
PLife REITPLife REIT’’s Core Marketss Core Markets
Portfolio Highlights
24
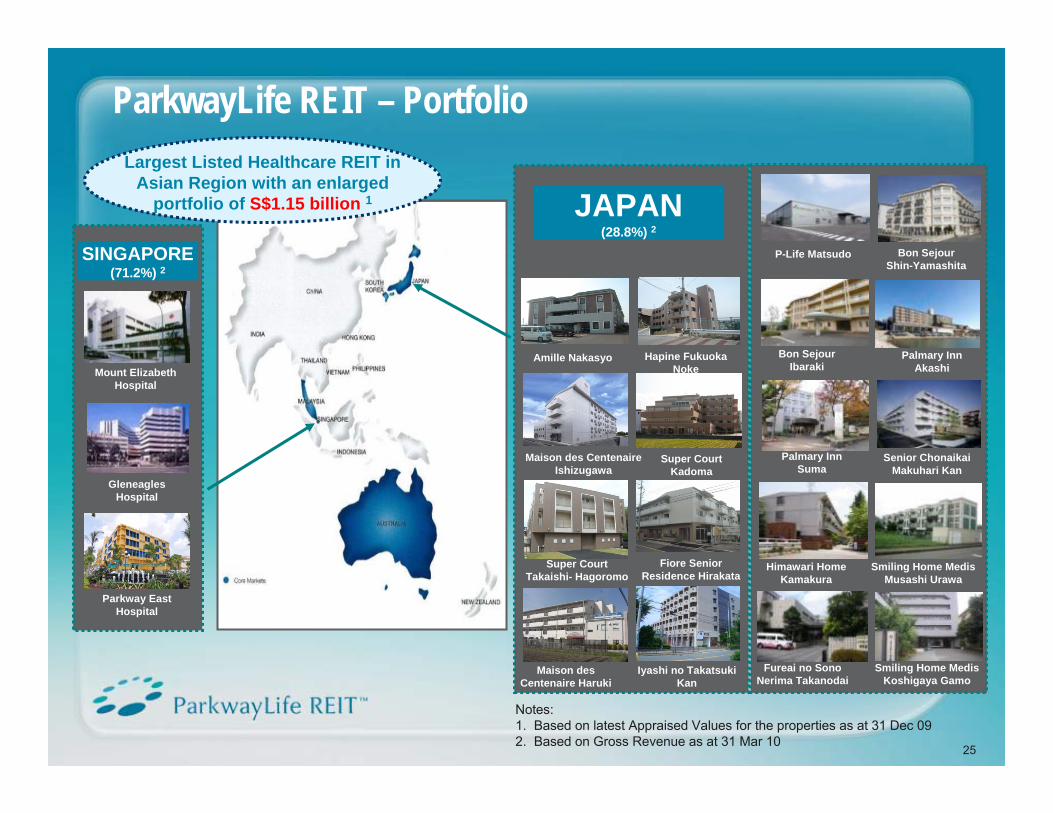
Mount Elizabeth Hospital
Gleneagles Hospital
Parkway East Hospital
Bon SejourShin-Yamashita
P-Life Matsudo
Bon SejourIbaraki
Palmary Inn Akashi
Palmary Inn Suma
Senior ChonaikaiMakuhari Kan
Himawari Home Kamakura
Smiling Home MedisMusashi Urawa
Fureai no SonoNerima Takanodai
Smiling Home MedisKoshigaya Gamo
ParkwayLife REIT – PortfolioLargest Listed Healthcare REIT in
Asian Region with an enlarged portfolio of S$1.15 billion 1
Notes: 1. Based on latest Appraised Values for the properties as at 31 Dec 092. Based on Gross Revenue as at 31 Mar 10
25
Hapine Fukuoka Noke
Amille Nakasyo
Maison des CentenaireIshizugawa
Super Court Kadoma
Super Court Takaishi- Hagoromo
Fiore Senior Residence Hirakata
Maison des Centenaire Haruki
Iyashi no Takatsuki Kan
JAPAN(28.8%) 2
SINGAPORE(71.2%) 2
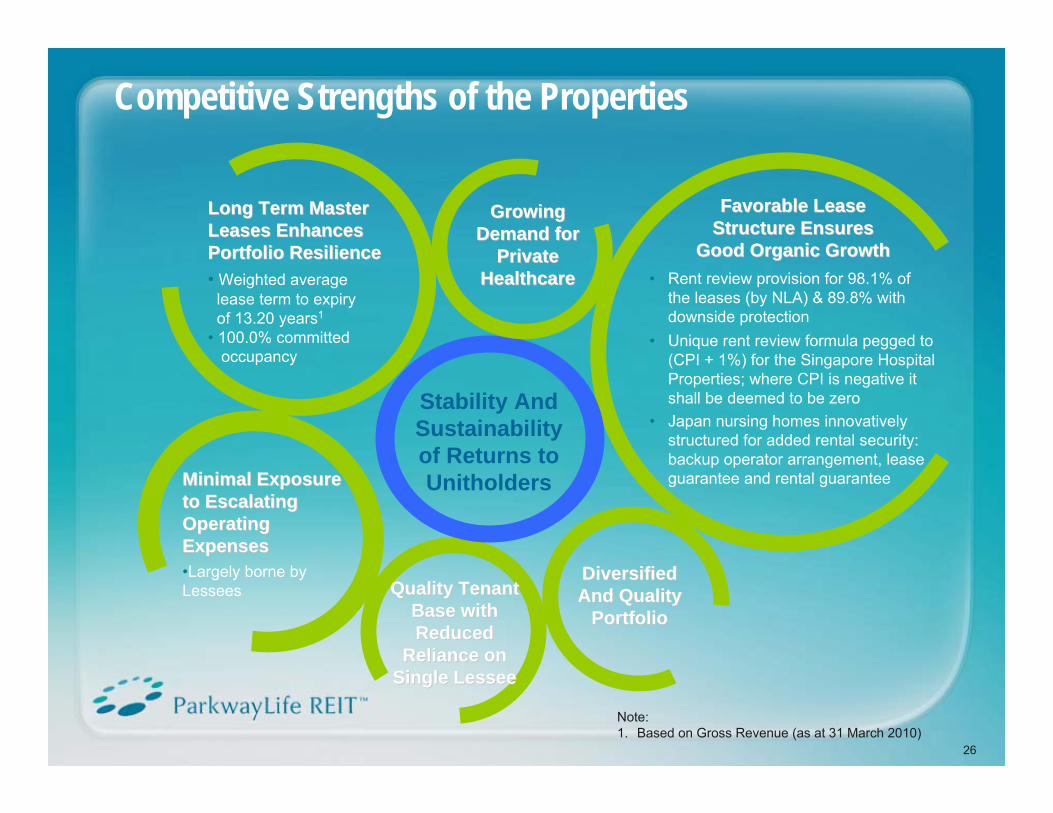
Competitive Strengths of the Properties
Note:1. Based on Gross Revenue (as at 31 March 2010)
26
Stability And Sustainability of Returns to Unitholders
Long Term Master Long Term Master Leases Enhances Leases Enhances Portfolio ResiliencePortfolio Resilience• Weighted average
lease term to expiry of 13.20 years1
• 100.0% committed occupancy
Favorable Lease Favorable Lease Structure Ensures Structure Ensures
Good Organic GrowthGood Organic Growth• Rent review provision for 98.1% of
the leases (by NLA) & 89.8% with downside protection
• Unique rent review formula pegged to (CPI + 1%) for the Singapore Hospital Properties; where CPI is negative it shall be deemed to be zero
• Japan nursing homes innovatively structured for added rental security: backup operator arrangement, lease guarantee and rental guaranteeMinimal Exposure Minimal Exposure
to Escalating to Escalating Operating Operating ExpensesExpenses•Largely borne by Lessees Quality Tenant Quality Tenant
Base with Base with Reduced Reduced
Reliance on Reliance on Single LesseeSingle Lessee
Growing Growing Demand for Demand for
Private Private HealthcareHealthcare
Diversified Diversified And Quality And Quality
PortfolioPortfolio
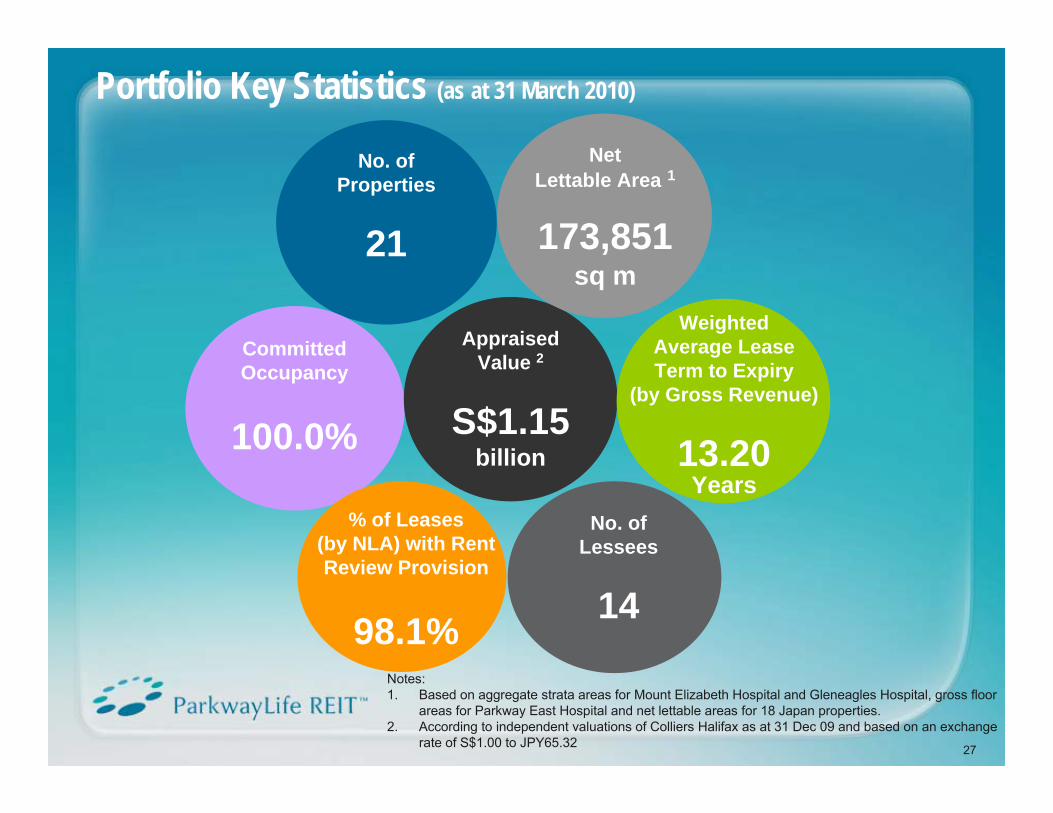
Portfolio Key Statistics (as at 31 March 2010)
Notes:1. Based on aggregate strata areas for Mount Elizabeth Hospital and Gleneagles Hospital, gross floor
areas for Parkway East Hospital and net lettable areas for 18 Japan properties. 2. According to independent valuations of Colliers Halifax as at 31 Dec 09 and based on an exchange
rate of S$1.00 to JPY65.32 27
CommittedOccupancy
100.0%
Appraised Value 2
S$1.15 billion
Weighted Average Lease Term to Expiry
(by Gross Revenue)
13.20 Years
% of Leases (by NLA) with Rent Review Provision
98.1%
Net Lettable Area 1
173,851sq m
No. of Properties
21
No. of Lessees
14
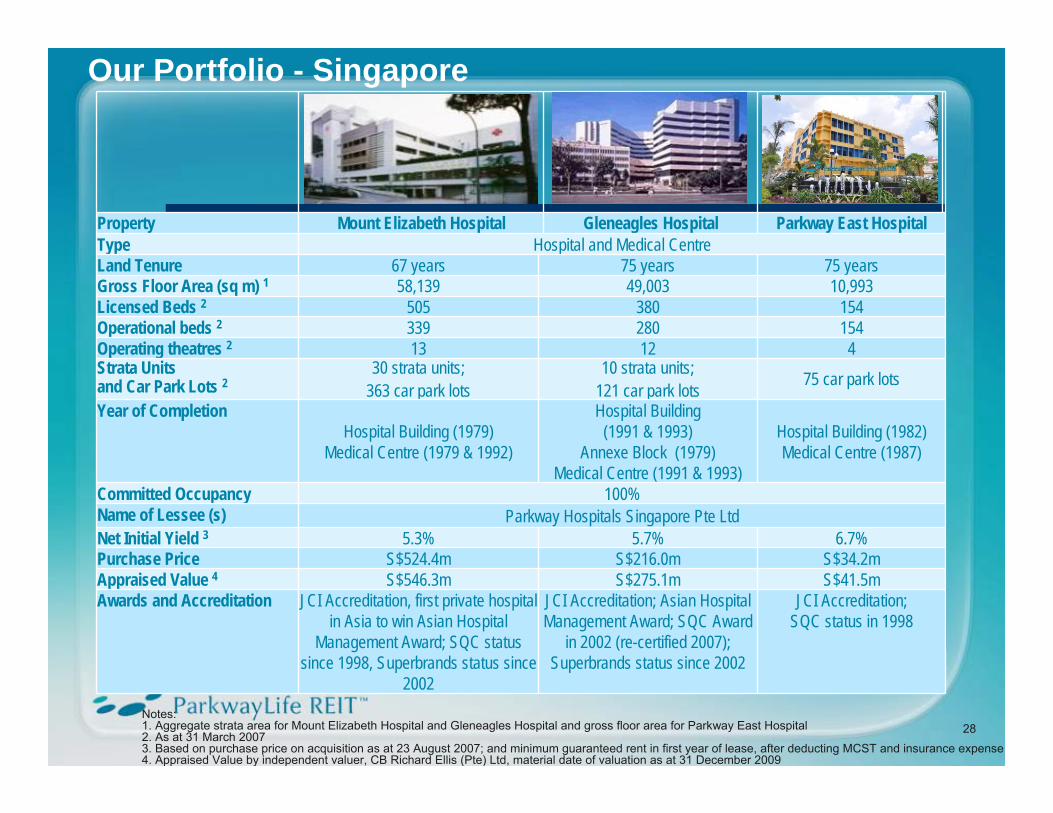
Our Portfolio - Singapore
Property Mount Elizabeth Hospital Gleneagles Hospital Parkway East HospitalType Hospital and Medical CentreLand Tenure 67 years 75 years 75 yearsGross Floor Area (sq m) 1 58,139 49,003 10,993Licensed Beds 2 505 380 154Operational beds 2 339 280 154Operating theatres 2 13 12 4Strata Units and Car Park Lots 2
30 strata units; 363 car park lots
10 strata units; 121 car park lots 75 car park lots
Year of CompletionHospital Building (1979)
Medical Centre (1979 & 1992)
Hospital Building (1991 & 1993)
Annexe Block (1979)Medical Centre (1991 & 1993)
Hospital Building (1982)Medical Centre (1987)
Committed Occupancy 100%Name of Lessee (s) Parkway Hospitals Singapore Pte LtdNet Initial Yield 3 5.3% 5.7% 6.7%Purchase Price S$524.4m S$216.0m S$34.2mAppraised Value 4 S$546.3m S$275.1m S$41.5mAwards and Accreditation JCI Accreditation, first private hospital
in Asia to win Asian Hospital Management Award; SQC status
since 1998, Superbrands status since 2002
JCI Accreditation; Asian Hospital Management Award; SQC Award
in 2002 (re-certified 2007); Superbrands status since 2002
JCI Accreditation; SQC status in 1998
Notes:1. Aggregate strata area for Mount Elizabeth Hospital and Gleneagles Hospital and gross floor area for Parkway East Hospital2. As at 31 March 20073. Based on purchase price on acquisition as at 23 August 2007; and minimum guaranteed rent in first year of lease, after deducting MCST and insurance expense4. Appraised Value by independent valuer, CB Richard Ellis (Pte) Ltd, material date of valuation as at 31 December 2009
28
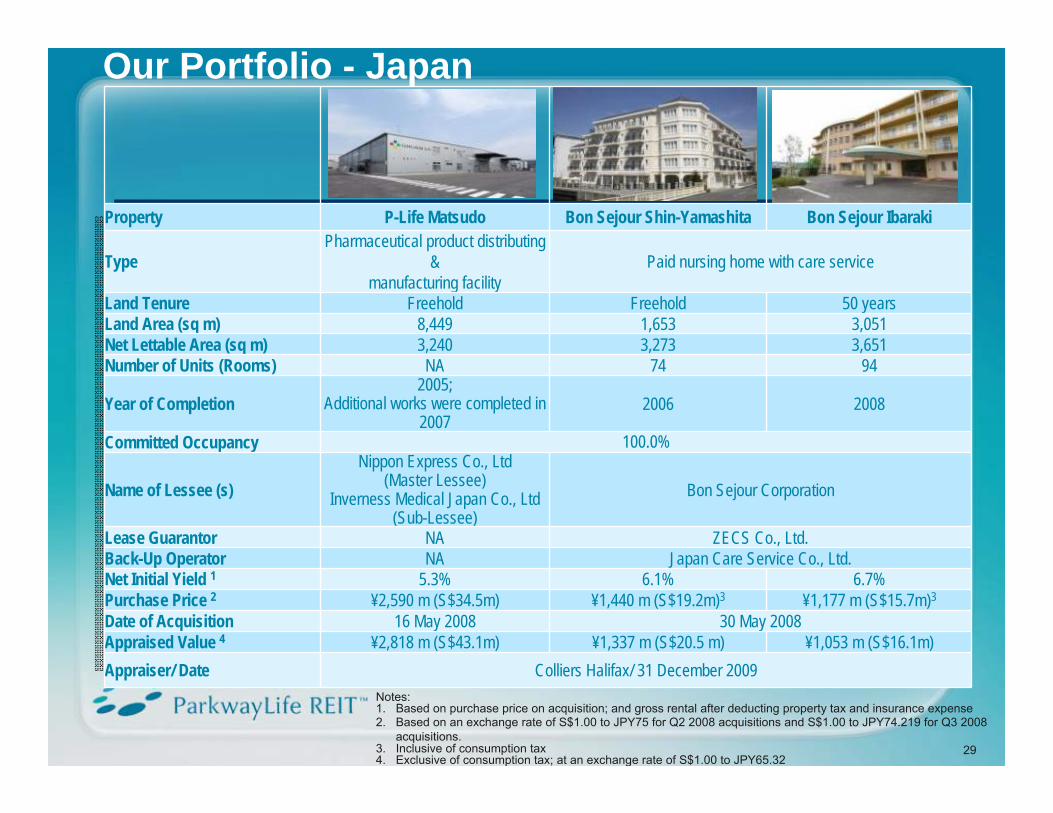
Notes:1. Based on purchase price on acquisition; and gross rental after deducting property tax and insurance expense2. Based on an exchange rate of S$1.00 to JPY75 for Q2 2008 acquisitions and S$1.00 to JPY74.219 for Q3 2008
acquisitions.3. Inclusive of consumption tax4. Exclusive of consumption tax; at an exchange rate of S$1.00 to JPY65.32
Property P-Life Matsudo Bon Sejour Shin-Yamashita Bon Sejour Ibaraki
TypePharmaceutical product distributing
& manufacturing facility
Paid nursing home with care service
Land Tenure Freehold Freehold 50 years Land Area (sq m) 8,449 1,653 3,051 Net Lettable Area (sq m) 3,240 3,273 3,651Number of Units (Rooms) NA 74 94
Year of Completion2005;
Additional works were completed in 2007
2006 2008
Committed Occupancy 100.0%
Name of Lessee (s)Nippon Express Co., Ltd
(Master Lessee)Inverness Medical Japan Co., Ltd
(Sub-Lessee)Bon Sejour Corporation
Lease Guarantor NA ZECS Co., Ltd.Back-Up Operator NA Japan Care Service Co., Ltd.Net Initial Yield 1 5.3% 6.1% 6.7%Purchase Price 2 ¥2,590 m (S$34.5m) ¥1,440 m (S$19.2m)3 ¥1,177 m (S$15.7m)3
Date of Acquisition 16 May 2008 30 May 2008Appraised Value 4 ¥2,818 m (S$43.1m) ¥1,337 m (S$20.5 m) ¥1,053 m (S$16.1m) Appraiser/ Date Colliers Halifax/ 31 December 2009
29
Our Portfolio - Japan
Notes:1. Based on purchase price on acquisition; and gross rental after deducting property tax and insurance expense 2. Based on an exchange rate of S$1.00 to JPY75 for Q2 2008 acquisitions and S$1.00 to JPY74.219 for Q3 2008
acquisitions.3. As at 31 Mar 09. total numbers of units increased from 107 to 108. Operator converted one (1) unit of Twin type
into two (2) units of Single type4. Exclusive of consumption tax; at an exchange rate of S$1.00 to JPY65.32
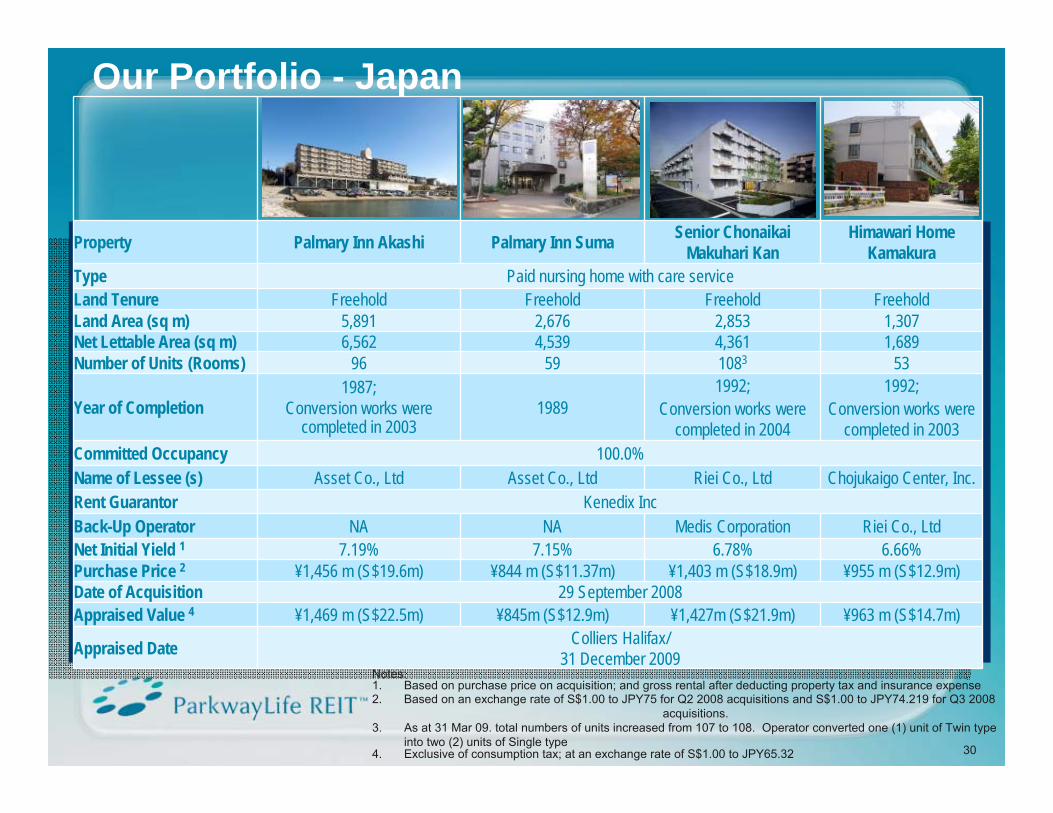
Property Palmary Inn Akashi Palmary Inn Suma Senior ChonaikaiMakuhari Kan
Himawari Home Kamakura
Type Paid nursing home with care serviceLand Tenure Freehold Freehold Freehold FreeholdLand Area (sq m) 5,891 2,676 2,853 1,307Net Lettable Area (sq m) 6,562 4,539 4,361 1,689Number of Units (Rooms) 96 59 1083 53
Year of Completion1987;
Conversion works were completed in 2003
19891992;
Conversion works were completed in 2004
1992; Conversion works were
completed in 2003Committed Occupancy 100.0%Name of Lessee (s) Asset Co., Ltd Asset Co., Ltd Riei Co., Ltd Chojukaigo Center, Inc.Rent Guarantor Kenedix IncBack-Up Operator NA NA Medis Corporation Riei Co., LtdNet Initial Yield 1 7.19% 7.15% 6.78% 6.66%Purchase Price 2 ¥1,456 m (S$19.6m) ¥844 m (S$11.37m) ¥1,403 m (S$18.9m) ¥955 m (S$12.9m) Date of Acquisition 29 September 2008Appraised Value 4 ¥1,469 m (S$22.5m) ¥845m (S$12.9m) ¥1,427m (S$21.9m) ¥963 m (S$14.7m)
Appraised Date Colliers Halifax/31 December 2009
30
Our Portfolio - Japan
Notes:1. Based on purchase price on acquisition; and gross rental after deducting property tax and insurance expense 2. Based on an exchange rate of S$1.00 to JPY75 for Q2 2008 acquisitions and S$1.00 to JPY74.219 for Q3 2008 acquisitions.3. Exclusive of consumption tax; at an exchange rate of S$1.00 to JPY65.32
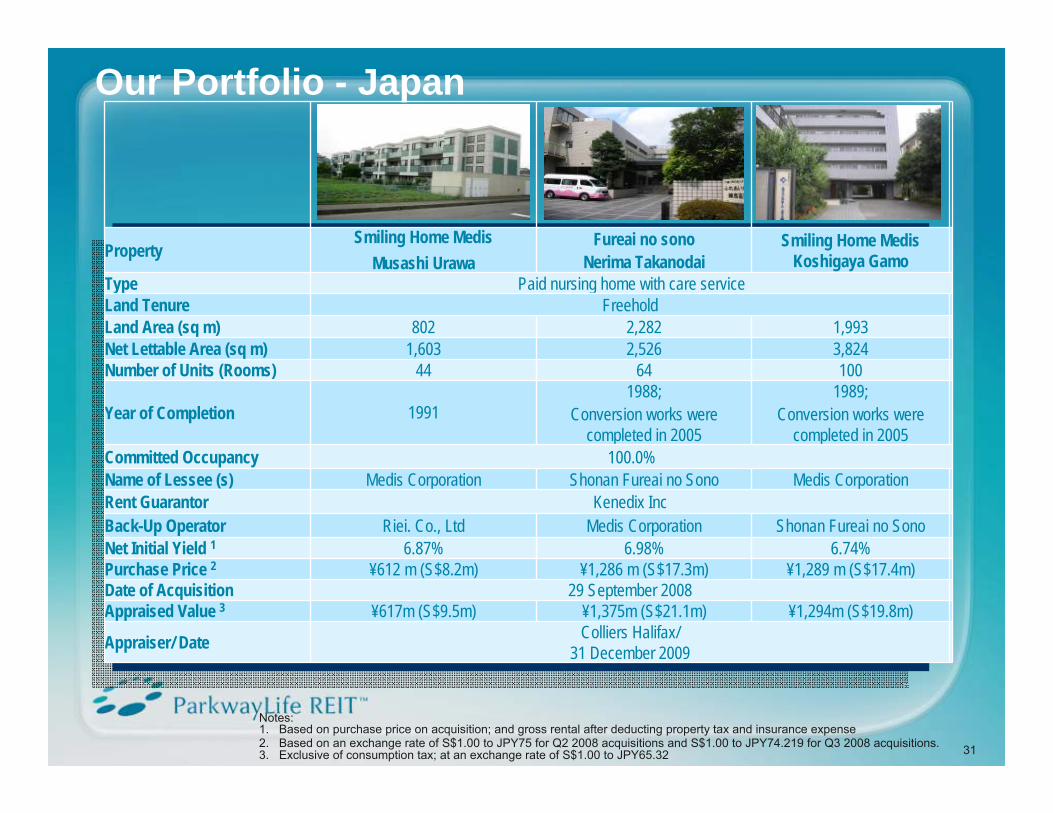
PropertySmiling Home Medis
Musashi UrawaFureai no sono
Nerima TakanodaiSmiling Home Medis
Koshigaya GamoType Paid nursing home with care serviceLand Tenure FreeholdLand Area (sq m) 802 2,282 1,993Net Lettable Area (sq m) 1,603 2,526 3,824Number of Units (Rooms) 44 64 100
Year of Completion 19911988;
Conversion works were completed in 2005
1989; Conversion works were
completed in 2005Committed Occupancy 100.0%Name of Lessee (s) Medis Corporation Shonan Fureai no Sono Medis CorporationRent Guarantor Kenedix IncBack-Up Operator Riei. Co., Ltd Medis Corporation Shonan Fureai no SonoNet Initial Yield 1 6.87% 6.98% 6.74%Purchase Price 2 ¥612 m (S$8.2m) ¥1,286 m (S$17.3m) ¥1,289 m (S$17.4m) Date of Acquisition 29 September 2008Appraised Value 3 ¥617m (S$9.5m) ¥1,375m (S$21.1m) ¥1,294m (S$19.8m)
Appraiser/ Date Colliers Halifax/31 December 2009
31
Our Portfolio - Japan
Our Portfolio - Japan
Notes:1. Based on purchase price on acquisition; and gross rental after deducting property tax and insurance expense 2. Based on an exchange rate of S$1.00 to JPY64.443. Exclusive of consumption tax; at an exchange rate of S$1.00 to JPY65.32
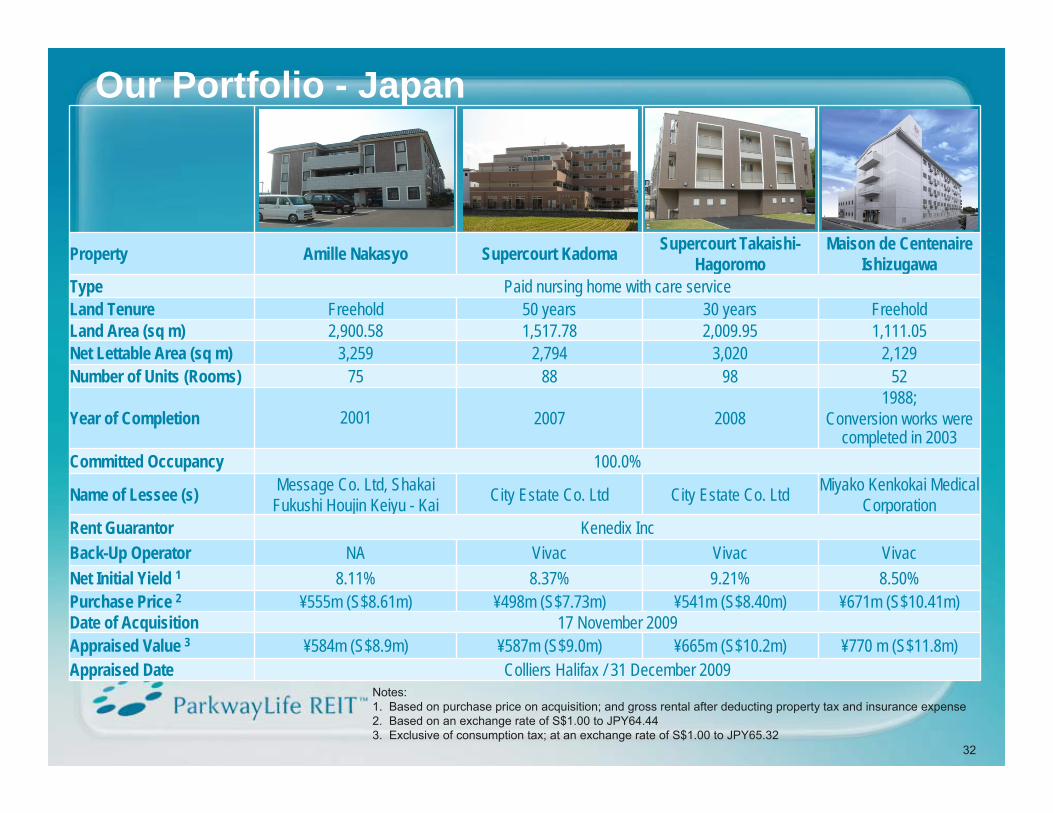
Property Amille Nakasyo Supercourt Kadoma Supercourt Takaishi-Hagoromo
Maison de CentenaireIshizugawa
Type Paid nursing home with care serviceLand Tenure Freehold 50 years 30 years FreeholdLand Area (sq m) 2,900.58 1,517.78 2,009.95 1,111.05Net Lettable Area (sq m) 3,259 2,794 3,020 2,129Number of Units (Rooms) 75 88 98 52
Year of Completion 2001 2007 20081988;
Conversion works were completed in 2003
Committed Occupancy 100.0%
Name of Lessee (s) Message Co. Ltd, ShakaiFukushi Houjin Keiyu - Kai City Estate Co. Ltd City Estate Co. Ltd Miyako Kenkokai Medical
CorporationRent Guarantor Kenedix IncBack-Up Operator NA Vivac Vivac VivacNet Initial Yield 1 8.11% 8.37% 9.21% 8.50%Purchase Price 2 ¥555m (S$8.61m) ¥498m (S$7.73m) ¥541m (S$8.40m) ¥671m (S$10.41m) Date of Acquisition 17 November 2009Appraised Value 3 ¥584m (S$8.9m) ¥587m (S$9.0m) ¥665m (S$10.2m) ¥770 m (S$11.8m) Appraised Date Colliers Halifax / 31 December 2009
32
Our Portfolio - Japan
Notes:1. Based on purchase price on acquisition; and gross rental after deducting property tax and insurance expense 2. Based on an exchange rate of S$1.00 to JPY64.443. Exclusive of consumption tax; at an exchange rate of S$1.00 to JPY65.32
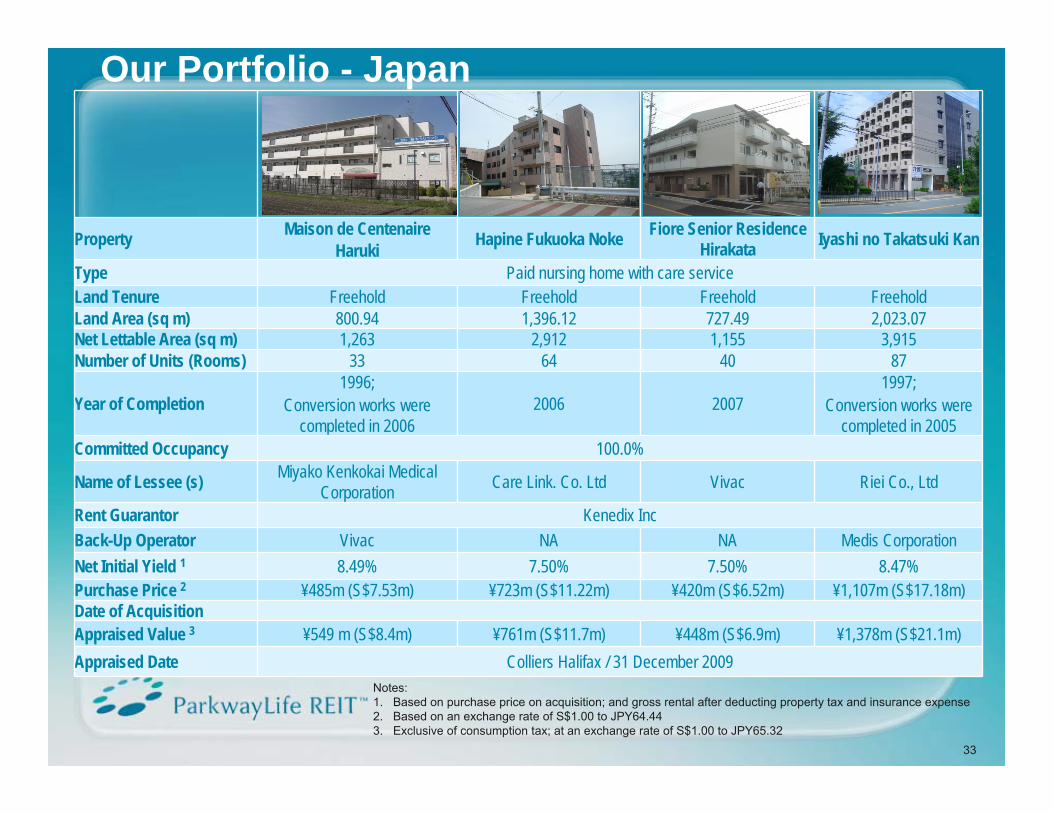
Property Maison de CentenaireHaruki Hapine Fukuoka Noke Fiore Senior Residence
Hirakata Iyashi no Takatsuki Kan
Type Paid nursing home with care serviceLand Tenure Freehold Freehold Freehold FreeholdLand Area (sq m) 800.94 1,396.12 727.49 2,023.07Net Lettable Area (sq m) 1,263 2,912 1,155 3,915Number of Units (Rooms) 33 64 40 87
Year of Completion1996;
Conversion works were completed in 2006
2006 20071997;
Conversion works were completed in 2005
Committed Occupancy 100.0%
Name of Lessee (s) Miyako Kenkokai Medical Corporation Care Link. Co. Ltd Vivac Riei Co., Ltd
Rent Guarantor Kenedix IncBack-Up Operator Vivac NA NA Medis CorporationNet Initial Yield 1 8.49% 7.50% 7.50% 8.47%Purchase Price 2 ¥485m (S$7.53m) ¥723m (S$11.22m) ¥420m (S$6.52m) ¥1,107m (S$17.18m) Date of AcquisitionAppraised Value 3 ¥549 m (S$8.4m) ¥761m (S$11.7m) ¥448m (S$6.9m) ¥1,378m (S$21.1m)Appraised Date Colliers Halifax / 31 December 2009
33
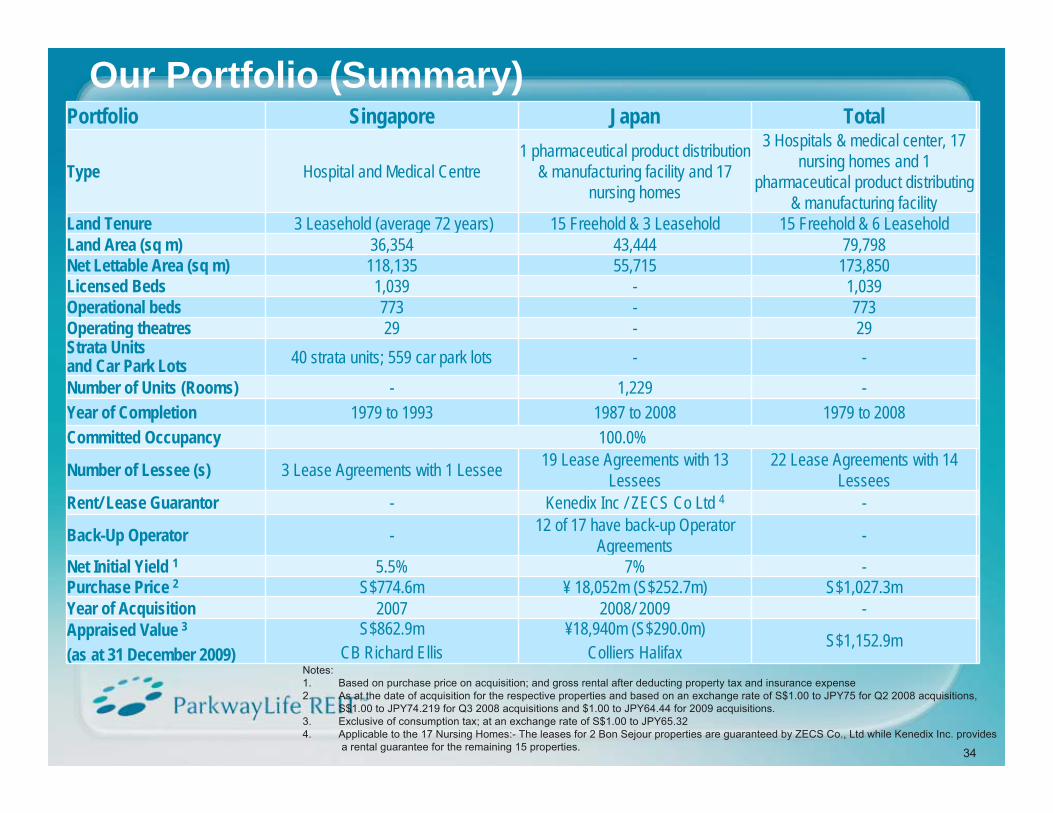
Our Portfolio (Summary)Portfolio Singapore Japan Total
Type Hospital and Medical Centre1 pharmaceutical product distribution
& manufacturing facility and 17 nursing homes
3 Hospitals & medical center, 17 nursing homes and 1
pharmaceutical product distributing & manufacturing facility
Land Tenure 3 Leasehold (average 72 years) 15 Freehold & 3 Leasehold 15 Freehold & 6 LeaseholdLand Area (sq m) 36,354 43,444 79,798Net Lettable Area (sq m) 118,135 55,715 173,850Licensed Beds 1,039 - 1,039Operational beds 773 - 773Operating theatres 29 - 29Strata Units and Car Park Lots 40 strata units; 559 car park lots - -
Number of Units (Rooms) - 1,229 -Year of Completion 1979 to 1993 1987 to 2008 1979 to 2008Committed Occupancy 100.0%
Number of Lessee (s) 3 Lease Agreements with 1 Lessee 19 Lease Agreements with 13 Lessees
22 Lease Agreements with 14 Lessees
Rent/ Lease Guarantor - Kenedix Inc / ZECS Co Ltd 4 -
Back-Up Operator - 12 of 17 have back-up Operator Agreements -
Net Initial Yield 1 5.5% 7% -Purchase Price 2 S$774.6m ¥ 18,052m (S$252.7m) S$1,027.3m Year of Acquisition 2007 2008/ 2009 -Appraised Value 3(as at 31 December 2009)
S$862.9mCB Richard Ellis
¥18,940m (S$290.0m) Colliers Halifax S$1,152.9m
Notes:1. Based on purchase price on acquisition; and gross rental after deducting property tax and insurance expense 2. As at the date of acquisition for the respective properties and based on an exchange rate of S$1.00 to JPY75 for Q2 2008 acquisitions,
S$1.00 to JPY74.219 for Q3 2008 acquisitions and $1.00 to JPY64.44 for 2009 acquisitions.3. Exclusive of consumption tax; at an exchange rate of S$1.00 to JPY65.324. Applicable to the 17 Nursing Homes:- The leases for 2 Bon Sejour properties are guaranteed by ZECS Co., Ltd while Kenedix Inc. provides
a rental guarantee for the remaining 15 properties. 34


![Untitled-1 [] · 16. Those members who have so far not en-cashed their Final Dividend for the years March 31, 2009, March 31, 2010, March 31, 2011, March 31, 2012 March 31, 2013 March](https://img.pdfslide.net/doc/110x75/5f0a630d7e708231d42b62a6/untitled-1-16-those-members-who-have-so-far-not-en-cashed-their-final-dividend.jpg)