Embed Size (px)
Citation preview

9/5/2013
1
The Asphalt Pavement Alliance Presents:A Five‐Part Webinar Series On Mechanistic Empirical Pavement Design Guide (MEPDG) Implementation Specific to Asphalt Pavements
The Asphalt Pavement Alliance Presents:A Five‐Part Webinar Series On Mechanistic Empirical Pavement Design Guide (MEPDG) Implementation Specific to Asphalt Pavements
• Today’s Webinar: Part‐1Pavement Design, Where We’ve Come From and What We’re Trying to Accomplish
•Speaker:David Newcomb, Ph.D., P.E.Senior Research Scientist with the Texas Transportation Institute
•Moderator:Mike Kvach, APA
Webinar Protocol:
• Audio Quality
• Headset Recommended
• External Speakers May Cause an Echo / Feedback
• Questions & Answers• Chat Box – Make sure to change the drop‐down
menu to “Organizer Only”
•Recorded Webinars• www.AsphaltFacts.com/webinars/• Click on: “Five‐Part Series on MEPDG
Implementation Specific to Asphalt Pavements”

9/5/2013
2
The Asphalt Pavement Alliance Presents:A Five‐Part Webinar Series On Mechanistic Empirical Pavement Design Guide (MEPDG) Implementation Specific to Asphalt Pavements
Part 1: Pavement Design, Where We’ve Come From and What We’re Trying to Accomplish
Part 2: Local Calibration
Part 3: Individual Distress Models
Part 4: Major Inputs – Where Do They Come From & How Do We Get Them?
Part 5: Moving Beyond Data Input (Advanced)
• Speaker:David Newcomb, Ph.D., P.E.Senior Research Scientist with the Texas Transportation Institute
Pavement Design, Where We’ve Come From and What We’re Trying to Accomplish:
Kevin D. Hall, Ph.D., P.E.Professor and Head, Dept. of Civil Engineering
21st Century Leadership Chair in Civil Engineering
Dave Newcomb, Ph.D., P.E.Senior Research Engineer
TTI / Texas A&M University
Asphalt Pavement AllianceSeptember 2013

9/5/2013
3
Pavement Design: Where We’ve Come From and Where We Are Going
Overview of Pavement‐ME™Sensitivity of Models to Design InputsLocal Calibration: Pavement‐ME™Case Study: New Pavement DesignGetting the Most From Pavement‐ME™
Final Thoughts and Discussion
Dave NewcombTexas A&M Transportation Institute
Asphalt Pavement AllianceAASHTO Pavement M-E Webinar
2013
Pre-20th Century20th Century
• Early Patents• Early Design Approaches• AASHO Road Test

9/5/2013
4

9/5/2013
5
No Escalation Clause for Labor Rates!
Layered Pavement with Drainage

9/5/2013
6

9/5/2013
7

9/5/2013
8
50 mm (typical) Wearing Course Placed in One Lift (Coarse aggregate 50 to 80% between the ¼” and 3”)
Various Types of Base and Old Pavements
• First successful, reproducible asphalt concrete surfaces
• Maximum aggregate size 75 mm graded down to dust
• F.J. Warren patent issued 1903 (Patent No. 757505)
Warren’s primary patent of 1903—Patent No. 727505 which had the simple title of “Pavement”

9/5/2013
9

9/5/2013
10
Soil is the important thing.Weather is handled according to local
observations.Pavements are designed for the loads
anticipated.• Airfields• Roads
Most asphalt pavements are:• 2 to 6 inches asphalt• 4 to 8 inches of granular base
29
AASHO Road Test
Trucks

9/5/2013
11
LOOP
3 4 12 12
4 6 18 18
5 6 22 22
6 9 30 30
LANE 2
6 24 24
9 32 32
9 40 40
12 48 48
2 Years = 1.1 Million Applications
LANE 1
0
10”
20”ASPHALT surface
CRUSHED STONE base
SANDY GRAVEL subbase
2 3 4 5 6
0 3 6 9
0 4 8 12 16
MATERIAL THICKNESS
3
6
8
.44
.14
.11
4”
9”
16”
= 1.76
= 1.26
= 1.76
= 4.78

9/5/2013
12
LOOP 3 4 5 6
AC .44 .44 .47 .33
STONE .16 .14 .14 .11
GRAVEL .11 .11 .11 .11
34
07.8log32.2
1
10944.0
5.12.4log
20.01log36.9log
19.5
018
RR M
SN
PSI
SNSZW
36
•One Set of Materials
•Two Years of Weathering
•1.1 Million Axles
•Totally Empirical
9/5/2013
13
0
5
10
15
20
25
0.1 1 10 100 1000
HM
A T
hic
kn
ess
, in
.
Traffic, MESAL
AASHTO
PerRoad
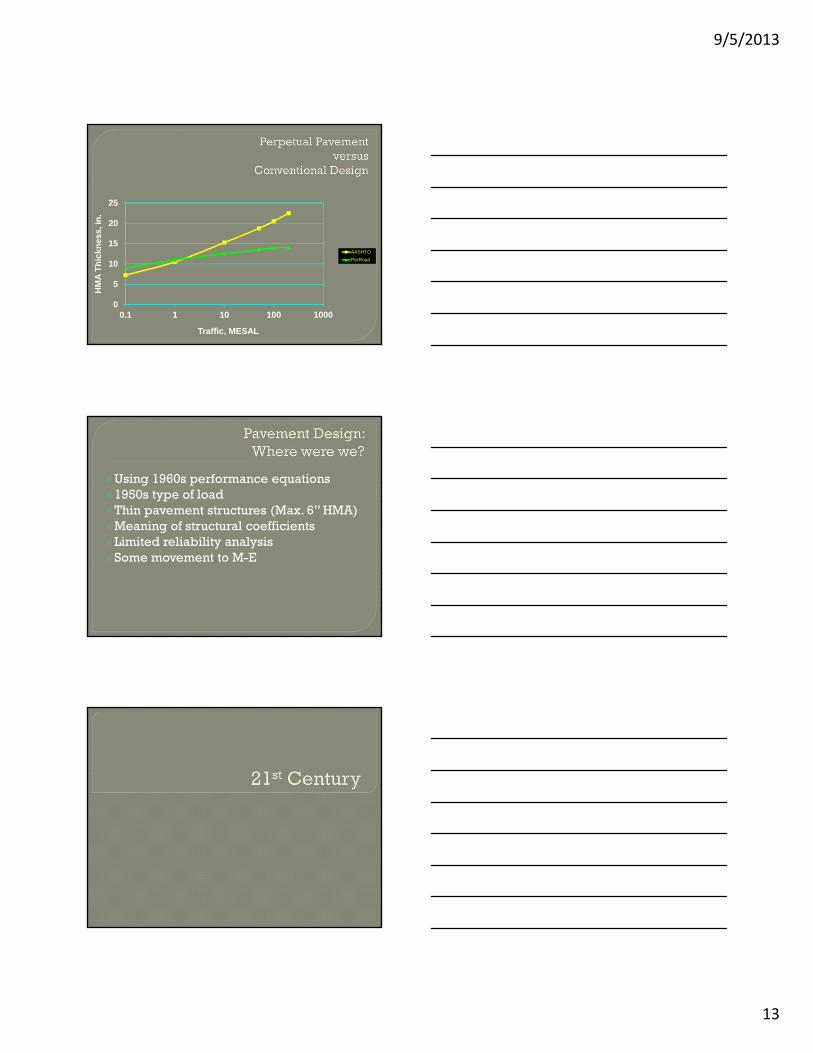
Using 1960s performance equations1950s type of loadThin pavement structures (Max. 6” HMA)Meaning of structural coefficientsLimited reliability analysisSome movement to M-E
9/5/2013
14
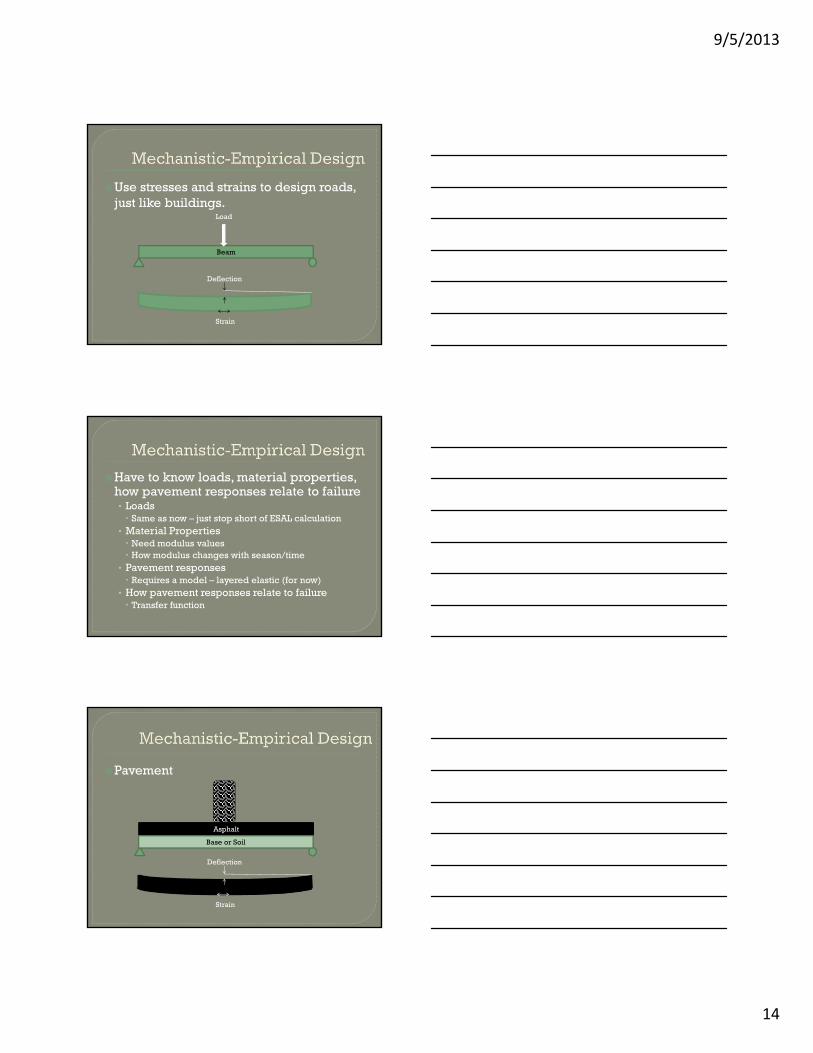
Use stresses and strains to design roads, just like buildings.
Beam
Load
Deflection
Strain
Have to know loads, material properties, how pavement responses relate to failure• Loads Same as now – just stop short of ESAL calculation
• Material Properties Need modulus values How modulus changes with season/time
• Pavement responses Requires a model – layered elastic (for now)
• How pavement responses relate to failure Transfer function
Pavement
Beam
Load
Deflection
Strain
Asphalt
Base or Soil

9/5/2013
15
M-E Design Framework
Model ,
Transfer Function(s)
f
Materials, Layers
Loads
i
i
Nf
nDn
D>1?
D<<1?
Final Design
Traffic Load Spectra
No. Heavy Axles
Data from Traffic
W4 Tables

9/5/2013
16
Figure 1. Definitions of E and .
D
D/2
l
l
l = l/l
t = D/D
E =
= t / l
• bitumen viscosity (dynamic shear rheometer)
• loading frequency
• air voids
• effective bitumen content
• cum. % retained on 19-mm sieve
• cum. % retained on 9.5-mm sieve
• cum. % retained on 4.76-mm sieve
• % passing the 0.075-mm sieve
log . . . ( ) . .
.. . . . ( ) .
( . ` . log( ) . log( ))
E V
V
V V e
a
beff
beff af
1249937 0 29232 0 001767 0 002841 0 058097
08022083871977 0 0021 0 003958 0 000017 0 005470
1
200 2002
4
4 38 382
340 6033 3 0 313351 0 393532

9/5/2013
17

9/5/2013
18
Flexible pavements consist of multiple layers Using physical principles, we can calculate stresses
beneath loads
Pa
H1, E1, 1
H2, E2, 2
En, n
zr
t
Horizontal Shear Stress, rz/p
De
pth
, z/a
1.0
Layer 1
Layer 2
0.0
x
Dep
th, z
Tension Compression
Layer 1
Layer 2

9/5/2013
19
Layer 1HMA
E1
Layer 3Subgrade Soil
E3
h1
h2
No bottom boundary, assume soil goes on infinitely.
Nohorizontalboundary, assumelayersextendinfinitely.
Tire has a total load P, spread over a circulararea with a radius of a, resulting in a contactpressure of p.
PavementReactions
Deflection ()
Tensile Strain (t)
Compressive Strain (v)
Layered Elastic Model Representation of a Pavement.
Layer 2Granular Base
E2
Ho
rizo
nta
l Te
nsi
le S
tra
in (
in./
in.1
0
)
Load Applications (N )f
3
10 10 10 10 10 103 4 5 6 7 8
10
100
1,000
10,000
log N = 15.947 - 3.291 log (––––– ) - 0.854 log (–––– )f t
10-6
E
10
-6
E = 200,000 psi(1,380 MPa)
E = 500,000 psi(3,450 MPa)

9/5/2013
20
Ver
tical
Co
mp
ress
ive
Str
ain
( in
./in.
10
)
N = 1.077 x 10 (–––)
10 10 10 10 10 103 4 5 6 7 8100
1,000
10,00
100,00
f
-6
4.484310 v
Load Applications (N )
18
f
-6
Asphalt Pavement Alliance - 2001 Design must be done by M-E
• Limiting strains – define criteria for perpetual design• Load spectrum – design for heaviest loads• Material properties – seasonal and long-term changes
M-E based design procedures for Perpetual Pavements• PerRoad• Illinois• Texas FPS-19W• Washington DOT – catalog• AASHTO Pavement M-E (formerly Darwin M-E) (formerly
MEPDG)• CalME?

9/5/2013
21
Normal Fatigue Testing Results VersusEndurance Limit Testing
0
200
400
600
800
1000
1200
1000 100000 10000000 1.1E+08
Number of Loads to Failure
Stra
in, (
10E
-06)
Endurance Limit
Normal Range forFatigue Testing
0
200
400
600
800
1000
1200
1000 100000 10000000 1.1E+08
Number of Loads to Failure
Stra
in, (
10E
-06)
Endurance Limit
0
200
400
600
800
1000
1200
1000 100000 10000000 1.1E+08
Number of Loads to Failure
Stra
in, (
10E
-06)
Endurance Limit
Normal Range forFatigue Testing
Resources• APA IM-40 – Perpetual Pavements: A Synthesis• TRB: Circular Number 503• SHRP 2: R-23 – Using Existing Pavement In-Place
and Achieving Long Life – Newt Jackson• International Conferences on Perpetual
Pavements
9/5/2013
22
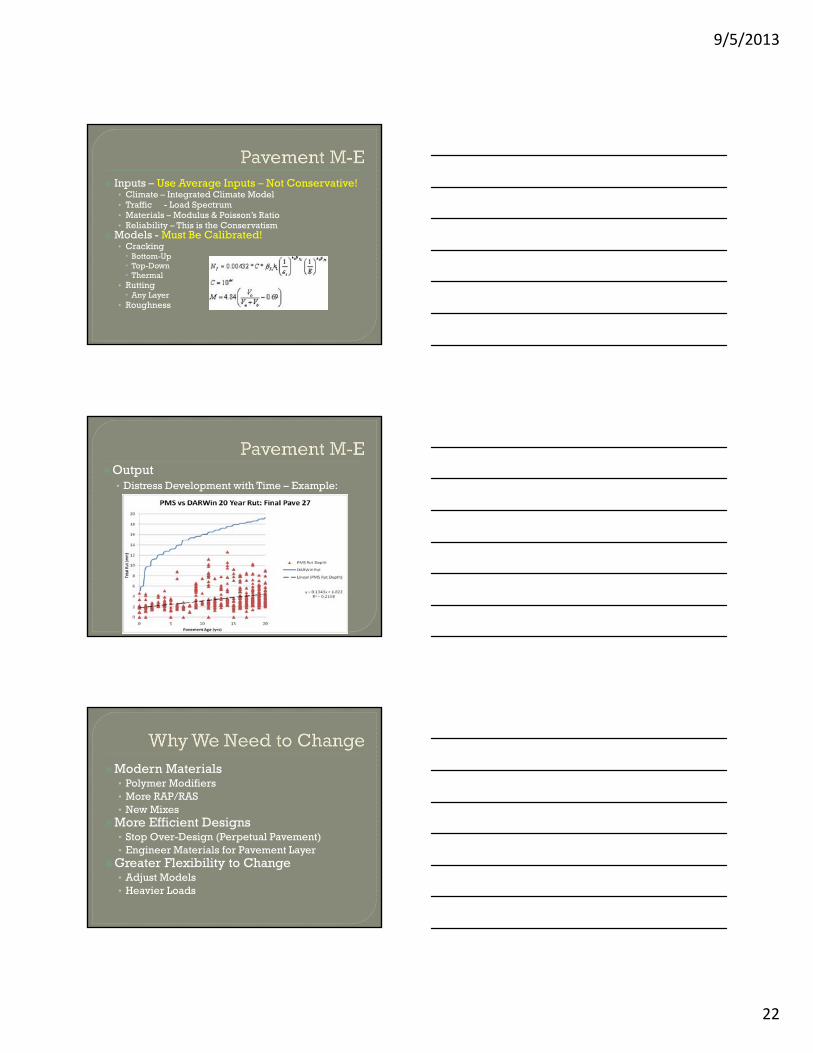
Inputs – Use Average Inputs – Not Conservative!• Climate – Integrated Climate Model• Traffic - Load Spectrum• Materials – Modulus & Poisson’s Ratio• Reliability – This is the Conservatism
Models - Must Be Calibrated!• Cracking Bottom-Up Top-Down Thermal
• Rutting Any Layer
• Roughness
Output• Distress Development with Time – Example:
Alberta
Modern Materials• Polymer Modifiers• More RAP/RAS• New Mixes
More Efficient Designs• Stop Over-Design (Perpetual Pavement)• Engineer Materials for Pavement Layer
Greater Flexibility to Change• Adjust Models• Heavier Loads

9/5/2013
23
Thank You!
Part 2: Local Calibration
Next Webinar: Thursday, September 5th
Register at: AsphaltFACTS.com/webinars