Embed Size (px)
Citation preview

PART 3
ARE YOU READY TO RUMBLE?
CEO PAY FOR PERFORMANCE
- 2017 FTSE100 PROXY SEASON –
21 June, 2017
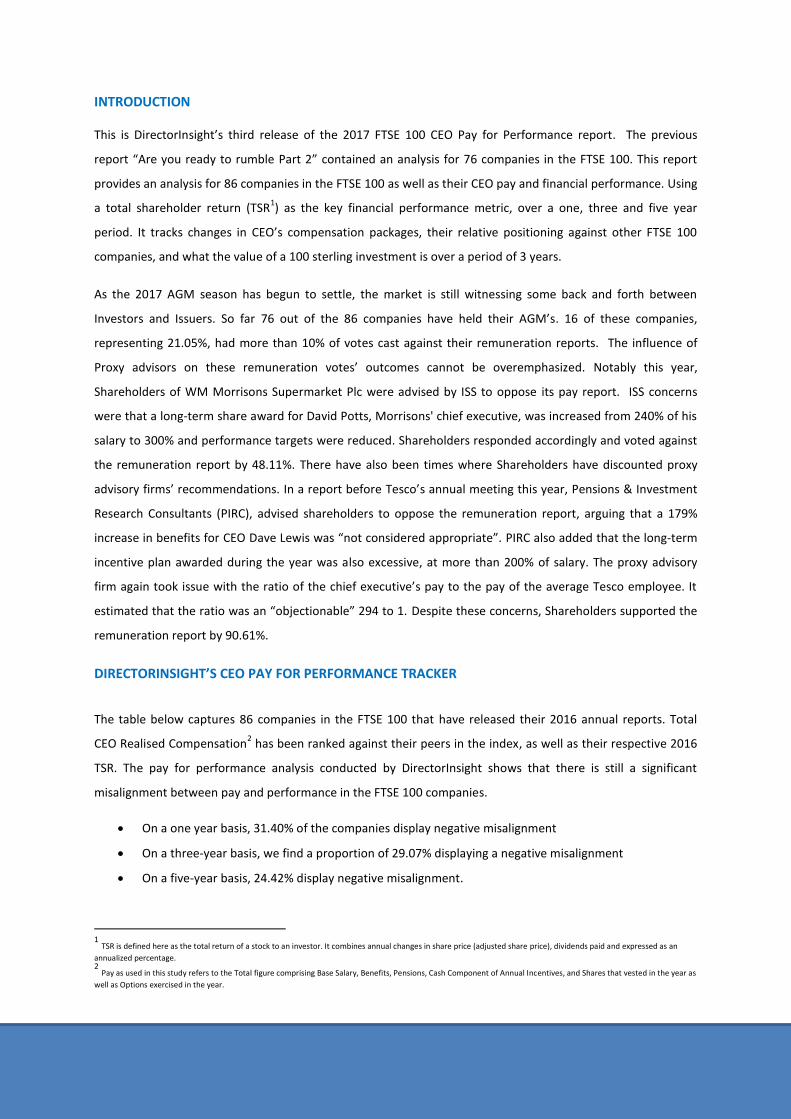
INTRODUCTION
This is DirectorInsight’s third release of the 2017 FTSE 100 CEO Pay for Performance report. The previous
report “Are you ready to rumble Part 2” contained an analysis for 76 companies in the FTSE 100. This report
provides an analysis for 86 companies in the FTSE 100 as well as their CEO pay and financial performance. Using
a total shareholder return (TSR1) as the key financial performance metric, over a one, three and five year
period. It tracks changes in CEO’s compensation packages, their relative positioning against other FTSE 100
companies, and what the value of a 100 sterling investment is over a period of 3 years.
As the 2017 AGM season has begun to settle, the market is still witnessing some back and forth between
Investors and Issuers. So far 76 out of the 86 companies have held their AGM’s. 16 of these companies,
representing 21.05%, had more than 10% of votes cast against their remuneration reports. The influence of
Proxy advisors on these remuneration votes’ outcomes cannot be overemphasized. Notably this year,
Shareholders of WM Morrisons Supermarket Plc were advised by ISS to oppose its pay report. ISS concerns
were that a long-term share award for David Potts, Morrisons' chief executive, was increased from 240% of his
salary to 300% and performance targets were reduced. Shareholders responded accordingly and voted against
the remuneration report by 48.11%. There have also been times where Shareholders have discounted proxy
advisory firms’ recommendations. In a report before Tesco’s annual meeting this year, Pensions & Investment
Research Consultants (PIRC), advised shareholders to oppose the remuneration report, arguing that a 179%
increase in benefits for CEO Dave Lewis was “not considered appropriate”. PIRC also added that the long-term
incentive plan awarded during the year was also excessive, at more than 200% of salary. The proxy advisory
firm again took issue with the ratio of the chief executive’s pay to the pay of the average Tesco employee. It
estimated that the ratio was an “objectionable” 294 to 1. Despite these concerns, Shareholders supported the
remuneration report by 90.61%.
DIRECTORINSIGHT’S CEO PAY FOR PERFORMANCE TRACKER
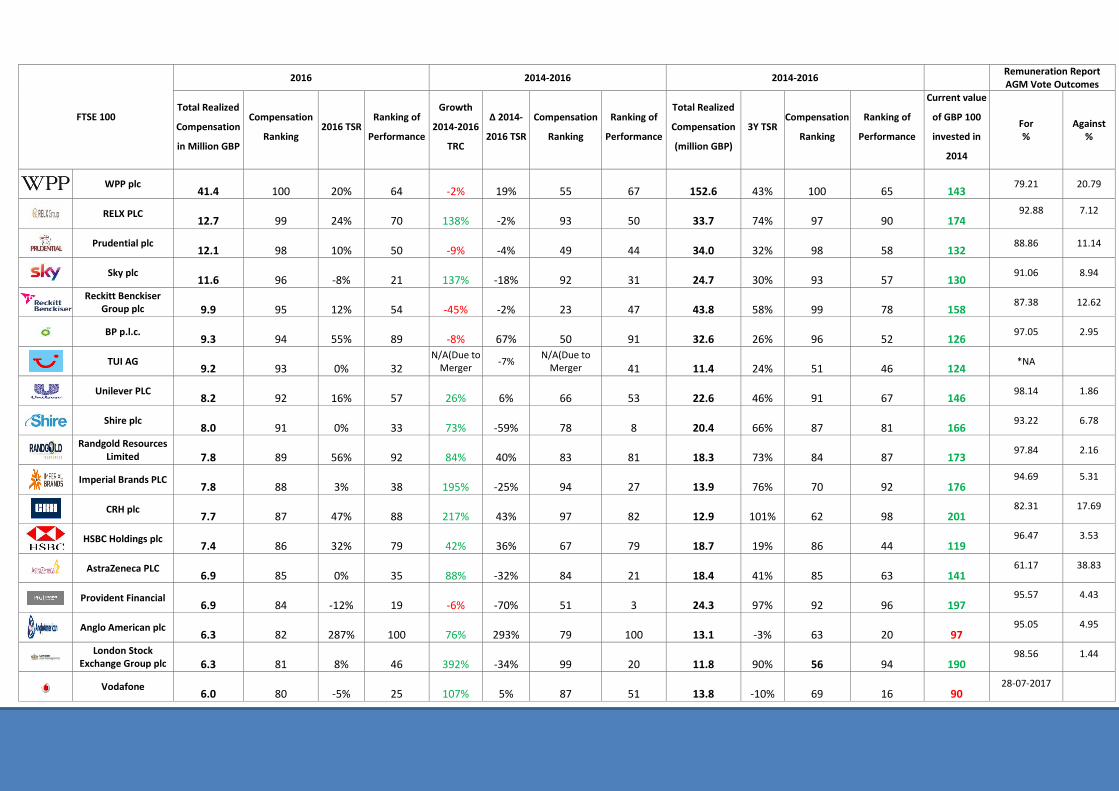
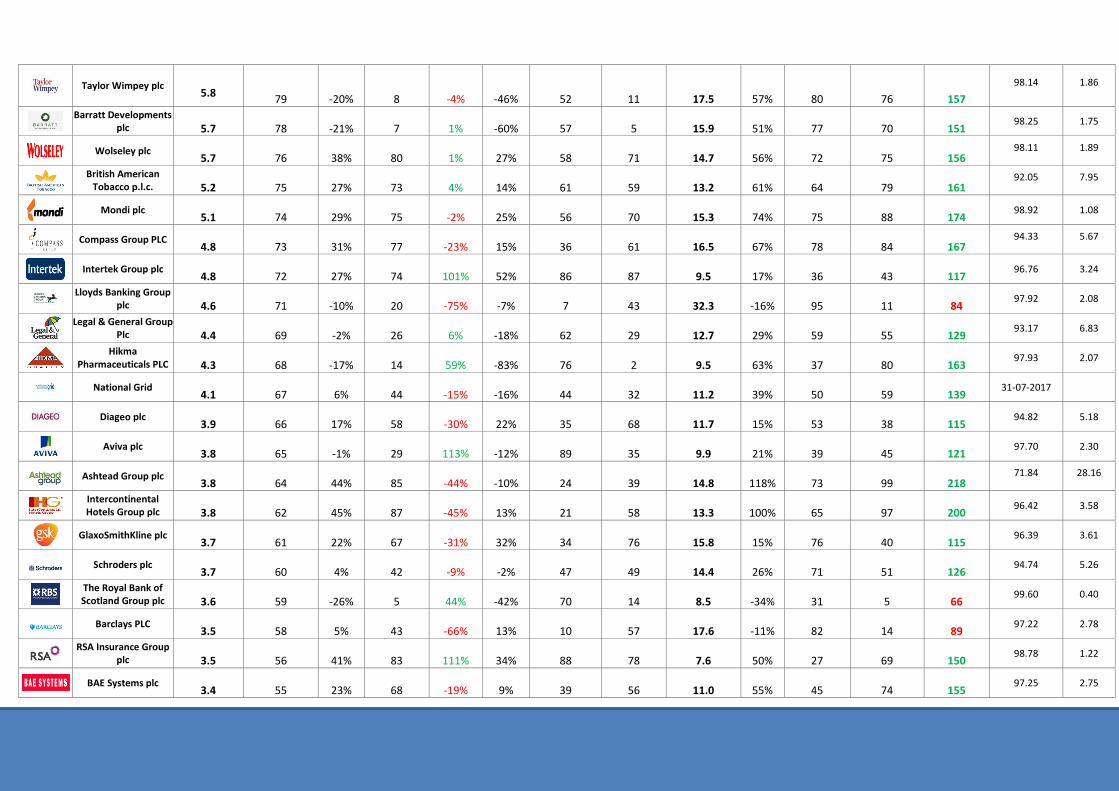
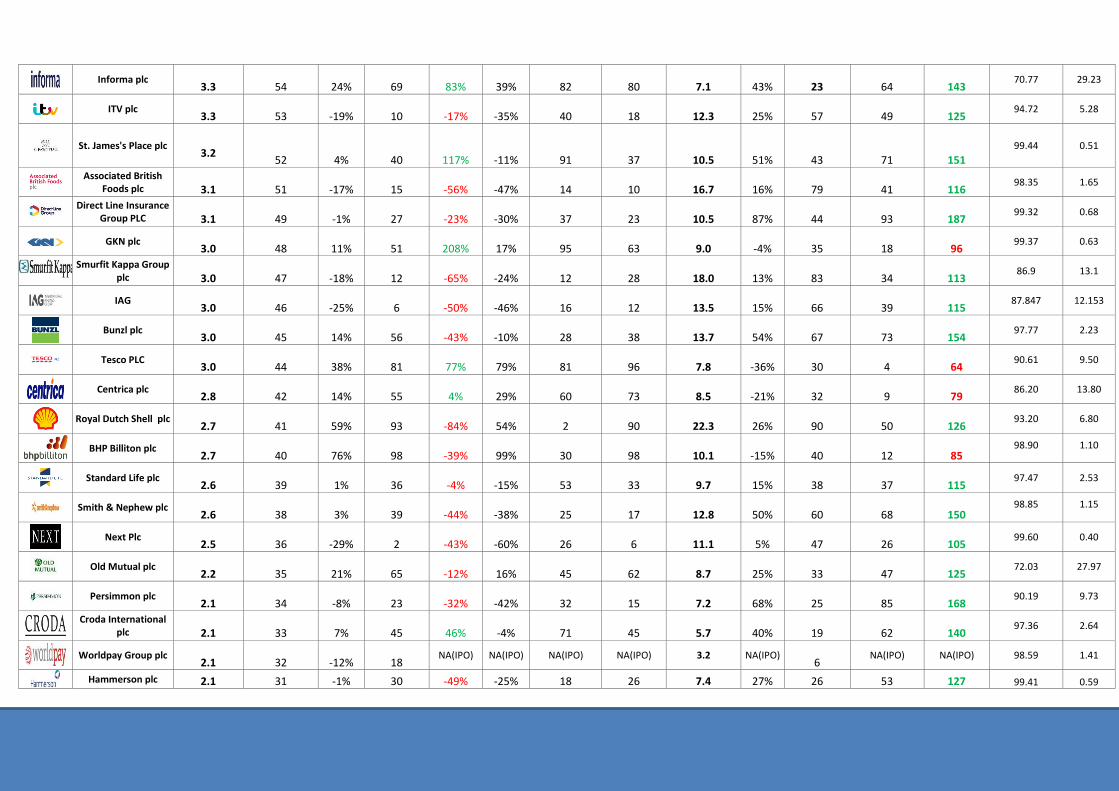
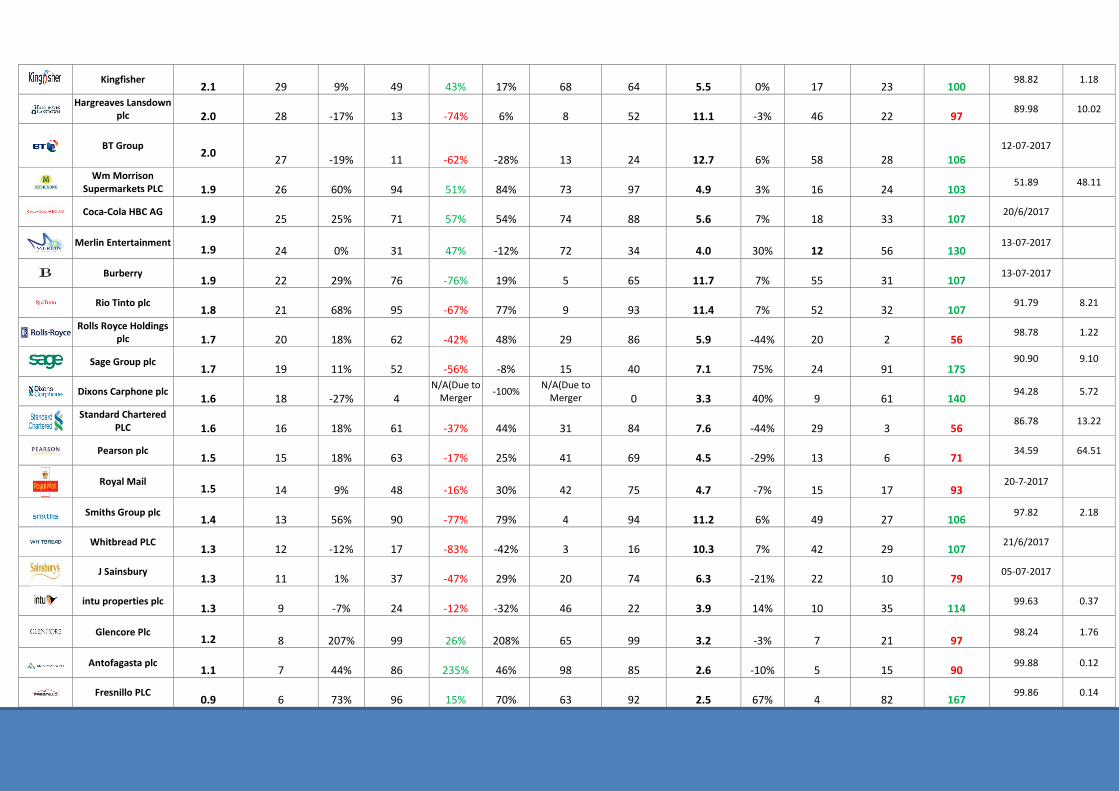
The table below captures 86 companies in the FTSE 100 that have released their 2016 annual reports. Total
CEO Realised Compensation2 has been ranked against their peers in the index, as well as their respective 2016
TSR. The pay for performance analysis conducted by DirectorInsight shows that there is still a significant
misalignment between pay and performance in the FTSE 100 companies.
On a one year basis, 31.40% of the companies display negative misalignment
On a three-year basis, we find a proportion of 29.07% displaying a negative misalignment
On a five-year basis, 24.42% display negative misalignment.
1 TSR is defined here as the total return of a stock to an investor. It combines annual changes in share price (adjusted share price), dividends paid and expressed as an
annualized percentage. 2 Pay as used in this study refers to the Total figure comprising Base Salary, Benefits, Pensions, Cash Component of Annual Incentives, and Shares that vested in the year as
well as Options exercised in the year.
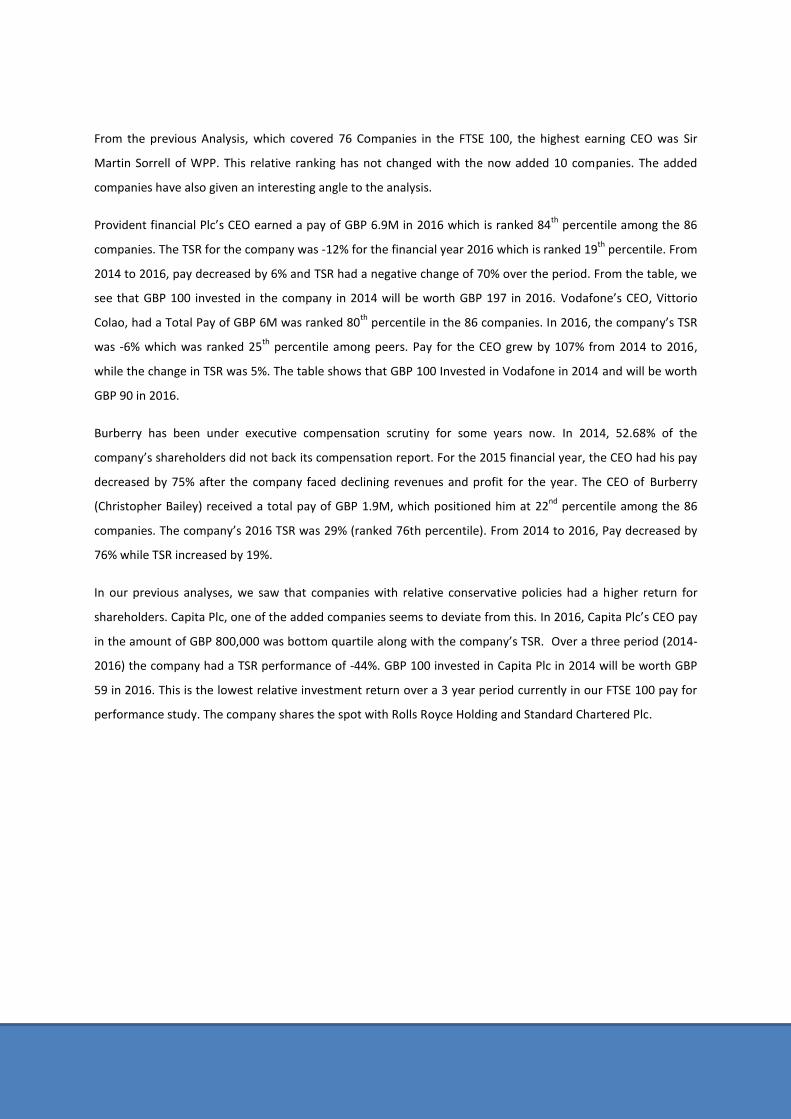
From the previous Analysis, which covered 76 Companies in the FTSE 100, the highest earning CEO was Sir
Martin Sorrell of WPP. This relative ranking has not changed with the now added 10 companies. The added
companies have also given an interesting angle to the analysis.
Provident financial Plc’s CEO earned a pay of GBP 6.9M in 2016 which is ranked 84th
percentile among the 86
companies. The TSR for the company was -12% for the financial year 2016 which is ranked 19th
percentile. From
2014 to 2016, pay decreased by 6% and TSR had a negative change of 70% over the period. From the table, we
see that GBP 100 invested in the company in 2014 will be worth GBP 197 in 2016. Vodafone’s CEO, Vittorio
Colao, had a Total Pay of GBP 6M was ranked 80th
percentile in the 86 companies. In 2016, the company’s TSR
was -6% which was ranked 25th
percentile among peers. Pay for the CEO grew by 107% from 2014 to 2016,
while the change in TSR was 5%. The table shows that GBP 100 Invested in Vodafone in 2014 and will be worth
GBP 90 in 2016.
Burberry has been under executive compensation scrutiny for some years now. In 2014, 52.68% of the
company’s shareholders did not back its compensation report. For the 2015 financial year, the CEO had his pay
decreased by 75% after the company faced declining revenues and profit for the year. The CEO of Burberry
(Christopher Bailey) received a total pay of GBP 1.9M, which positioned him at 22nd
percentile among the 86
companies. The company’s 2016 TSR was 29% (ranked 76th percentile). From 2014 to 2016, Pay decreased by
76% while TSR increased by 19%.
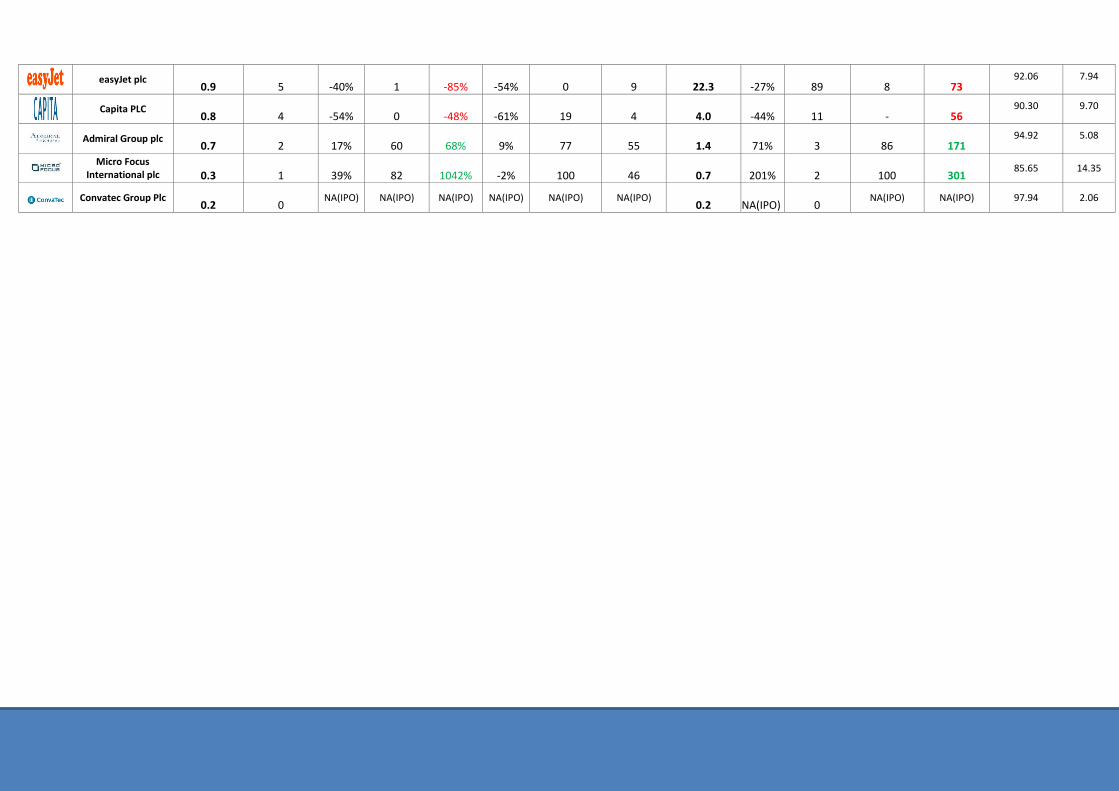
In our previous analyses, we saw that companies with relative conservative policies had a higher return for
shareholders. Capita Plc, one of the added companies seems to deviate from this. In 2016, Capita Plc’s CEO pay
in the amount of GBP 800,000 was bottom quartile along with the company’s TSR. Over a three period (2014-
2016) the company had a TSR performance of -44%. GBP 100 invested in Capita Plc in 2014 will be worth GBP
59 in 2016. This is the lowest relative investment return over a 3 year period currently in our FTSE 100 pay for
performance study. The company shares the spot with Rolls Royce Holding and Standard Chartered Plc.
FTSE 100
2016 2014-2016 2014-2016 Remuneration Report AGM Vote Outcomes
Total Realized
Compensation
in Million GBP
Compensation
Ranking 2016 TSR
Ranking of
Performance
Growth
2014-2016
TRC
Δ 2014-
2016 TSR
Compensation
Ranking
Ranking of
Performance
Total Realized
Compensation
(million GBP)
3Y TSR Compensation
Ranking
Ranking of
Performance
Current value
of GBP 100
invested in
2014
For %
Against %
WPP plc
41.4 100 20% 64 -2% 19% 55 67
152.6 43% 100
65 143
79.21 20.79
RELX PLC
12.7 99 24% 70 138% -2% 93 50
33.7 74% 97
90 174
92.88 7.12
Prudential plc
12.1 98 10% 50 -9% -4% 49 44
34.0 32% 98
58 132
88.86 11.14
Sky plc
11.6 96 -8% 21 137% -18% 92 31
24.7 30% 93
57 130
91.06 8.94
Reckitt Benckiser
Group plc
9.9 95 12% 54 -45% -2% 23 47
43.8 58% 99
78 158
87.38 12.62
BP p.l.c.
9.3 94 55% 89 -8% 67% 50 91
32.6 26% 96
52 126
97.05 2.95
TUI AG
9.2 93 0% 32
N/A(Due to Merger
-7% N/A(Due to
Merger 41
11.4 24% 51
46 124
*NA
Unilever PLC
8.2 92 16% 57 26% 6% 66 53
22.6 46% 91
67 146
98.14 1.86
Shire plc
8.0 91 0% 33 73% -59% 78 8
20.4 66% 87
81 166
93.22 6.78
Randgold Resources
Limited
7.8 89 56% 92 84% 40% 83 81
18.3 73% 84
87 173
97.84 2.16
Imperial Brands PLC
7.8 88 3% 38 195% -25% 94 27
13.9 76% 70
92 176
94.69 5.31
CRH plc
7.7 87 47% 88 217% 43% 97 82
12.9 101% 62
98 201
82.31 17.69
HSBC Holdings plc
7.4 86 32% 79 42% 36% 67 79
18.7 19% 86
44 119
96.47 3.53
AstraZeneca PLC
6.9 85 0% 35 88% -32% 84 21
18.4 41% 85
63 141
61.17 38.83
Provident Financial
6.9 84 -12% 19 -6% -70% 51 3
24.3 97% 92
96 197
95.57 4.43
Anglo American plc
6.3 82 287% 100 76% 293% 79 100
13.1 -3% 63
20 97
95.05 4.95
London Stock
Exchange Group plc
6.3 81 8% 46 392% -34% 99 20
11.8 90% 56
94 190
98.56 1.44
Vodafone
6.0 80 -5% 25 107% 5% 87 51
13.8 -10% 69
16 90
28-07-2017
Taylor Wimpey plc
5.8
79 -20% 8 -4% -46% 52 11
17.5 57% 80
76 157
98.14 1.86
Barratt Developments
plc
5.7 78 -21% 7 1% -60% 57 5
15.9 51% 77
70 151
98.25 1.75
Wolseley plc
5.7 76 38% 80 1% 27% 58 71
14.7 56% 72
75 156
98.11 1.89
British American
Tobacco p.l.c.
5.2 75 27% 73 4% 14% 61 59
13.2 61% 64
79 161
92.05 7.95
Mondi plc
5.1 74 29% 75 -2% 25% 56 70
15.3 74% 75
88 174
98.92 1.08
Compass Group PLC
4.8 73 31% 77 -23% 15% 36 61
16.5 67% 78
84 167
94.33 5.67
Intertek Group plc
4.8 72 27% 74 101% 52% 86 87
9.5 17% 36
43 117
96.76 3.24
Lloyds Banking Group
plc
4.6 71 -10% 20 -75% -7% 7 43
32.3 -16% 95
11 84
97.92 2.08
Legal & General Group Plc
4.4 69 -2% 26 6% -18% 62 29
12.7 29% 59
55 129
93.17 6.83
Hikma Pharmaceuticals PLC
4.3 68 -17% 14 59% -83% 76 2
9.5 63% 37
80 163
97.93 2.07
National Grid
4.1 67 6% 44 -15% -16% 44 32
11.2 39% 50
59 139
31-07-2017
Diageo plc
3.9 66 17% 58 -30% 22% 35 68
11.7 15% 53
38 115
94.82 5.18
Aviva plc
3.8 65 -1% 29 113% -12% 89 35
9.9 21% 39
45 121
97.70 2.30
Ashtead Group plc
3.8 64 44% 85 -44% -10% 24 39
14.8 118% 73
99 218
71.84 28.16
Intercontinental Hotels Group plc
3.8 62 45% 87 -45% 13% 21 58
13.3 100% 65
97 200
96.42 3.58
GlaxoSmithKline plc
3.7 61 22% 67 -31% 32% 34 76
15.8 15% 76
40 115
96.39 3.61
Schroders plc
3.7 60 4% 42 -9% -2% 47 49
14.4 26% 71
51 126
94.74 5.26
The Royal Bank of Scotland Group plc
3.6 59 -26% 5 44% -42% 70 14
8.5 -34% 31
5 66
99.60 0.40
Barclays PLC
3.5 58 5% 43 -66% 13% 10 57
17.6 -11% 82
14 89
97.22 2.78
RSA Insurance Group
plc
3.5 56 41% 83 111% 34% 88 78
7.6 50% 27
69 150
98.78 1.22
BAE Systems plc
3.4 55 23% 68 -19% 9% 39 56
11.0 55% 45
74 155
97.25 2.75
Informa plc
3.3 54 24% 69 83% 39% 82 80
7.1 43% 23
64 143
70.77 29.23
ITV plc
3.3 53 -19% 10 -17% -35% 40 18
12.3 25% 57
49 125
94.72 5.28
St. James's Place plc
3.2 52 4% 40 117% -11% 91 37
10.5 51% 43
71 151
99.44 0.51
Associated British
Foods plc
3.1 51 -17% 15 -56% -47% 14 10
16.7 16% 79
41 116
98.35 1.65
Direct Line Insurance Group PLC
3.1 49 -1% 27 -23% -30% 37 23
10.5 87% 44
93 187
99.32 0.68
GKN plc
3.0 48 11% 51 208% 17% 95 63
9.0 -4% 35
18 96
99.37 0.63
Smurfit Kappa Group plc
3.0 47 -18% 12 -65% -24% 12 28
18.0 13% 83
34 113
86.9 13.1
IAG
3.0 46 -25% 6 -50% -46% 16 12
13.5 15% 66
39 115
87.847 12.153
Bunzl plc
3.0 45 14% 56 -43% -10% 28 38
13.7 54% 67
73 154
97.77 2.23
Tesco PLC
3.0 44 38% 81 77% 79% 81 96
7.8 -36% 30
4 64
90.61 9.50
Centrica plc
2.8 42 14% 55 4% 29% 60 73
8.5 -21% 32
9 79
86.20 13.80
Royal Dutch Shell plc
2.7 41 59% 93 -84% 54% 2 90
22.3 26% 90
50 126
93.20 6.80
BHP Billiton plc
2.7 40 76% 98 -39% 99% 30 98
10.1 -15% 40
12 85
98.90 1.10
Standard Life plc
2.6 39 1% 36 -4% -15% 53 33
9.7 15% 38
37 115
97.47 2.53
Smith & Nephew plc
2.6 38 3% 39 -44% -38% 25 17
12.8 50% 60
68 150
98.85 1.15
Next Plc
2.5 36 -29% 2 -43% -60% 26 6
11.1 5% 47
26 105
99.60 0.40
Old Mutual plc
2.2 35 21% 65 -12% 16% 45 62
8.7 25% 33
47 125
72.03 27.97
Persimmon plc
2.1 34 -8% 23 -32% -42% 32 15
7.2 68% 25
85 168
90.19 9.73
Croda International
plc
2.1 33 7% 45 46% -4% 71 45
5.7 40% 19
62 140
97.36 2.64
Worldpay Group plc
2.1 32 -12% 18
NA(IPO) NA(IPO) NA(IPO) NA(IPO) 3.2 NA(IPO) 6
NA(IPO) NA(IPO) 98.59 1.41
Hammerson plc 2.1 31 -1% 30 -49% -25% 18 26 7.4 27% 26 53 127 99.41 0.59
Kingfisher
2.1 29 9% 49 43% 17% 68 64
5.5 0% 17
23 100
98.82 1.18
Hargreaves Lansdown
plc
2.0 28 -17% 13 -74% 6% 8 52
11.1 -3% 46
22 97
89.98 10.02
BT Group
2.0 27 -19% 11 -62% -28% 13 24
12.7 6% 58
28 106
12-07-2017
Wm Morrison
Supermarkets PLC
1.9 26 60% 94 51% 84% 73 97
4.9 3% 16
24 103
51.89 48.11
Coca-Cola HBC AG
1.9 25 25% 71 57% 54% 74 88
5.6 7% 18
33 107
20/6/2017
Merlin Entertainment
1.9 24 0% 31 47% -12% 72 34
4.0 30% 12
56 130
13-07-2017
Burberry
1.9 22 29% 76 -76% 19% 5 65
11.7 7% 55
31 107
13-07-2017
Rio Tinto plc
1.8 21 68% 95 -67% 77% 9 93
11.4 7% 52
32 107
91.79 8.21
Rolls Royce Holdings
plc
1.7 20 18% 62 -42% 48% 29 86
5.9 -44% 20
2 56
98.78 1.22
Sage Group plc
1.7 19 11% 52 -56% -8% 15 40
7.1 75% 24
91 175
90.90 9.10
Dixons Carphone plc
1.6 18 -27% 4
N/A(Due to Merger
-100% N/A(Due to
Merger 0
3.3 40% 9
61 140
94.28 5.72
Standard Chartered PLC
1.6 16 18% 61 -37% 44% 31 84
7.6 -44% 29
3 56
86.78 13.22
Pearson plc
1.5 15 18% 63 -17% 25% 41 69
4.5 -29% 13
6 71
34.59 64.51
Royal Mail
1.5 14 9% 48 -16% 30% 42 75
4.7 -7% 15
17 93
20-7-2017
Smiths Group plc
1.4 13 56% 90 -77% 79% 4 94
11.2 6% 49
27 106
97.82 2.18
Whitbread PLC
1.3 12 -12% 17 -83% -42% 3 16
10.3 7% 42
29 107
21/6/2017
J Sainsbury
1.3 11 1% 37 -47% 29% 20 74
6.3 -21% 22
10 79
05-07-2017
intu properties plc
1.3 9 -7% 24 -12% -32% 46 22
3.9 14% 10
35 114
99.63 0.37
Glencore Plc
1.2 8 207% 99 26% 208% 65 99
3.2 -3% 7
21 97
98.24 1.76
Antofagasta plc
1.1 7 44% 86 235% 46% 98 85
2.6 -10% 5
15 90
99.88 0.12
Fresnillo PLC
0.9 6 73% 96 15% 70% 63 92
2.5 67% 4
82 167
99.86 0.14
easyJet plc
0.9 5 -40% 1 -85% -54% 0 9
22.3 -27% 89
8 73
92.06 7.94
Capita PLC
0.8 4 -54% 0 -48% -61% 19 4
4.0 -44% 11
- 56
90.30 9.70
Admiral Group plc
0.7 2 17% 60 68% 9% 77 55
1.4 71% 3
86 171
94.92 5.08
Micro Focus
International plc
0.3 1 39% 82 1042% -2% 100 46
0.7 201% 2
100 301
85.65 14.35
Convatec Group Plc
0.2 0 NA(IPO) NA(IPO) NA(IPO) NA(IPO) NA(IPO) NA(IPO)
0.2 NA(IPO) 0
NA(IPO) NA(IPO) 97.94 2.06
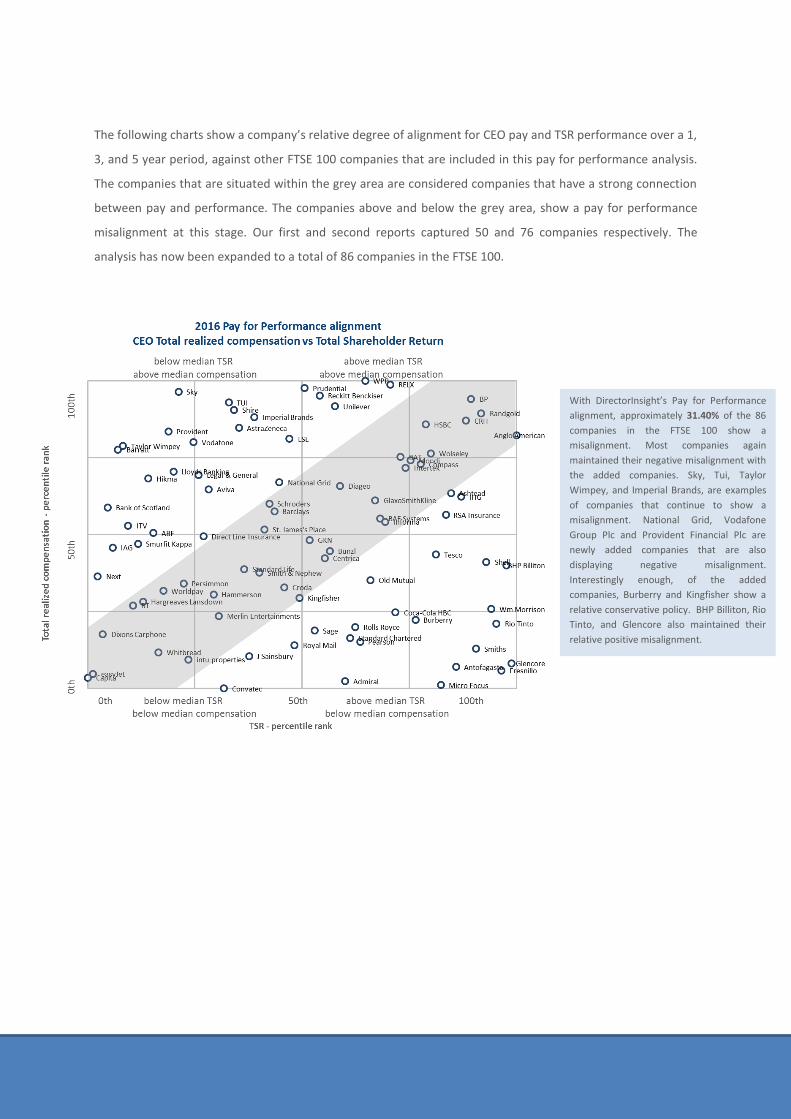
The following charts show a company’s relative degree of alignment for CEO pay and TSR performance over a 1,
3, and 5 year period, against other FTSE 100 companies that are included in this pay for performance analysis.
The companies that are situated within the grey area are considered companies that have a strong connection
between pay and performance. The companies above and below the grey area, show a pay for performance
misalignment at this stage. Our first and second reports captured 50 and 76 companies respectively. The
analysis has now been expanded to a total of 86 companies in the FTSE 100.
With DirectorInsight’s Pay for Performance
alignment, approximately 31.40% of the 86
companies in the FTSE 100 show a
misalignment. Most companies again
maintained their negative misalignment with
the added companies. Sky, Tui, Taylor
Wimpey, and Imperial Brands, are examples
of companies that continue to show a
misalignment. National Grid, Vodafone
Group Plc and Provident Financial Plc are
newly added companies that are also
displaying negative misalignment.
Interestingly enough, of the added
companies, Burberry and Kingfisher show a
relative conservative policy. BHP Billiton, Rio
Tinto, and Glencore also maintained their
relative positive misalignment.
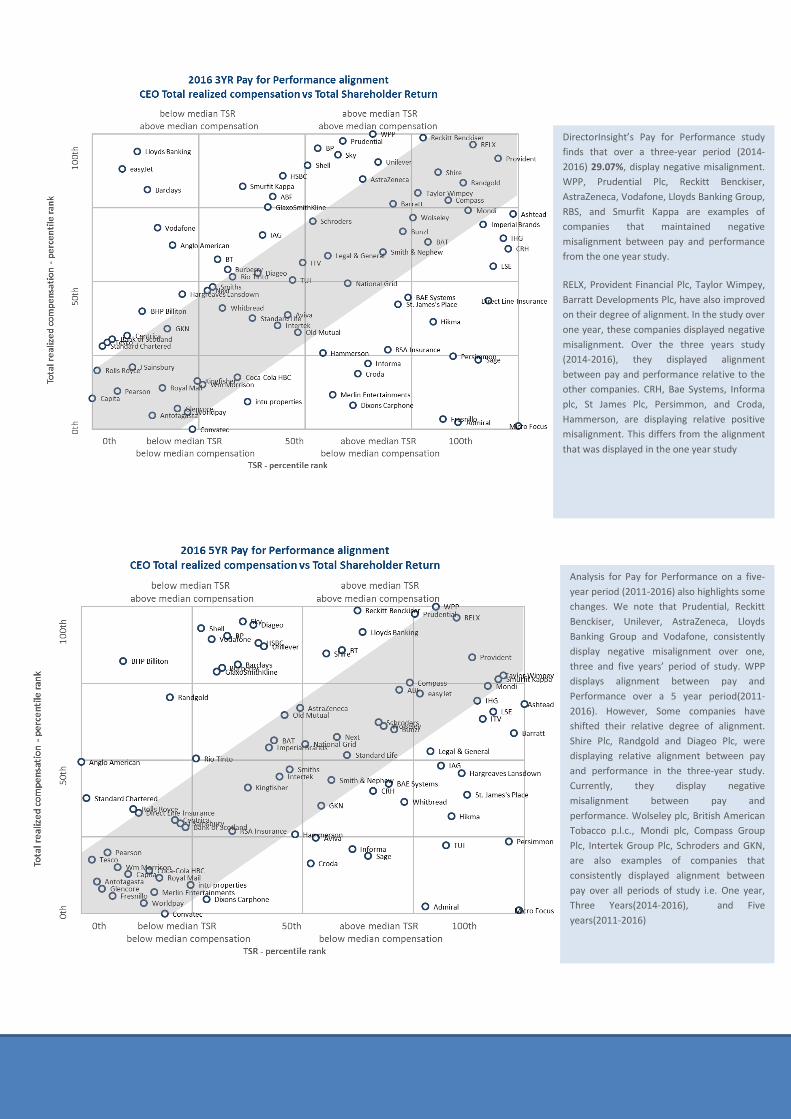
DirectorInsight’s Pay for Performance study
finds that over a three-year period (2014-
2016) 29.07%, display negative misalignment.
WPP, Prudential Plc, Reckitt Benckiser,
AstraZeneca, Vodafone, Lloyds Banking Group,
RBS, and Smurfit Kappa are examples of
companies that maintained negative
misalignment between pay and performance
from the one year study.
RELX, Provident Financial Plc, Taylor Wimpey,
Barratt Developments Plc, have also improved
on their degree of alignment. In the study over
one year, these companies displayed negative
misalignment. Over the three years study
(2014-2016), they displayed alignment
between pay and performance relative to the
other companies. CRH, Bae Systems, Informa
plc, St James Plc, Persimmon, and Croda,
Hammerson, are displaying relative positive
misalignment. This differs from the alignment
that was displayed in the one year study
Analysis for Pay for Performance on a five-
year period (2011-2016) also highlights some
changes. We note that Prudential, Reckitt
Benckiser, Unilever, AstraZeneca, Lloyds
Banking Group and Vodafone, consistently
display negative misalignment over one,
three and five years’ period of study. WPP
displays alignment between pay and
Performance over a 5 year period(2011-
2016). However, Some companies have
shifted their relative degree of alignment.
Shire Plc, Randgold and Diageo Plc, were
displaying relative alignment between pay
and performance in the three-year study.
Currently, they display negative
misalignment between pay and
performance. Wolseley plc, British American
Tobacco p.l.c., Mondi plc, Compass Group
Plc, Intertek Group Plc, Schroders and GKN,
are also examples of companies that
consistently displayed alignment between
pay over all periods of study i.e. One year,
Three Years(2014-2016), and Five
years(2011-2016)
APPENDIX
Our methodology on total realised compensation explained
The realised compensation includes all realised components of compensation in the year of interest. It is
defined as the sum of total indirect compensation realised and total direct compensation realised for one year.
It consists of base salary + benefits + other compensation + bonus + deferred cash bonus + deferred share
bonus + value of performance/restricted shares vested + value of performance/restricted options exercised.
Total realised pay is calculated based on performance indicators that have been met during the performance
period. Most companies clearly disclose the performance period and vesting period, and the percentage that
will be paid in the next year. For example, for shares that will vest on March 31, 2016 but where the
performance period ends at December 31, 2015, shares are included in realised compensation for the financial
year 2015. When the company doesn’t disclose the average share price over the last quarter, we use the
company year-end share price to calculate the value of the vested multiyear share packages. In line with UK
practices, adjustments are usually made in the following year when the company disclose the exact share price
on which the shares vested. For options, we calculate realised pay when the options have actually been
exercised. In the event there were two CEOs in a year for a company, for example due to a change in CEO, we
explored the companies on individual basis and annualized compensations depending on the issue at hand to
make the total realized compensation as realistic as possible.
Total Shareholder Return (TSR)
Total shareholder return is defined as the total return of a stock to an investor. It combines annual changes in
stock price and dividends paid and are expressed as an annualised percentage. This will be calculated over one
year (1Y), three year (3Y) and five year (5Y) period. The growth in 3 yr and 5 yr TSR is calculated by the
percentage points of difference between latest year and 3/5 year prior.
Please note that all figures have been rounded up in the table outlining the CEO pay for performance analysis.
Investment return of 100 sterling
This figure looks to calculate how much an 100 sterling company investment would be worth over a period of
time by indexing the TSR over multiple years.
Pay for performance Analysis
We conducted a study on CEO realised compensation to determine degree of alignment relative to peers in
the FTSE 100 on a 1, 3, 5 years basis. The degree of alignment is determined by subtracting the compensation
rank from the performance rank within a scope of +20 or -20. Results obtained on either side determine a more
generous or a conservative remuneration policy. Therefore for the three and five years’ study, the percentile
rank is calculated by the Total Realised Compensation over the period subtracted from the sum of the period
TSR performance.
Definition of financial years
FTSE 100 companies have different year end dates. The most common year end dates are displayed below;
31/12, 31/3, 31/7 and 30/9. The main rule applied is that in a specific year, financial year end dates until 31/3 is
reported as financial year of the previous year. All financial year end dates after 31/3 are reported as the year
in which the financial year ends.
This article is produced by:
Edna Frimpong, Governance Research Analyst
Aniel Mahabier, CEO DirectorInsight
About us
DirectorInsight is a specialist provider of data analytics and intelligence on the “G” of ESG. We
help corporations, institutional investors, financial institutions and professional services firms to
efficiently and effectively manage the increasing challenges they face in reviewing and addressing
corporate governance risks and associated decision-making. DirectorInsight provides an
integrated web-based, data technology solution, to independently analyze data on the value creation and
governance practices of leading listed companies across the globe, in a single convenient solution. Please
contact us on +31 (0) 20 416 0662 or visit our website when you would like to obtain further information or a
demo.
Disclaimer
This document may contain proprietary and/or confidential information that may be privileged or otherwise protected from disclosure. Any
unauthorized review, use, disclosure or distribution of the information included in this message and any attachment is prohibited.
DirectorInsight is a product of AMA Partners which does not make any representation or warranty, express or implied, of any nature nor
accepts any responsibility or liability of any kind with respect to the accuracy or completeness of the information contained herein. For more
information, please contact [email protected].