Embed Size (px)
Citation preview
NDoT SA Maritime Transport Sector Study / Part 3/ 27 July 2011 i
PART 3: TRANSHIPMENTS CONTENTS 3. Transhipments ..................................... ..................................................................... 3-3
3.1 Scope and aim of the paper ........................................................................................ 3-3
3.2 Introduction ................................................................................................................. 3-3
3.3 Brief history of development of transhipment ports ...................................................... 3-5
3.4 Types of transhipment ports ........................................................................................ 3-6
3.5 Motivation for transhipment ......................................................................................... 3-8
3.6 Infrastructure requirements for transhipment hubs .................................................... 3-10
3.7 Factors influencing the location of transhipment ........................................................ 3-12
3.8 Economics and economic spin-offs of transhipment ports ......................................... 3-15
3.9 Worldwide container flows ......................................................................................... 3-19
3.10 Transhipment at South African ports and recent developments ................................ 3-24
3.11 Opportunities for increasing transhipments ............................................................... 3-30
3.12 Transhipments at hub for IBR traffic .......................................................................... 3-33
3.13 Conclusions .............................................................................................................. 3-38
L IST OF TABLES Table 3.1: Major ‘offshore’ transhipment hub terminals and max berth depth ...................... 3-6
Table 3.2: Percentage share of gross income, costs and estimated return on capital employed in container shipping ......................................................................................... 3-16
Table 3.3: Imported and exported containers by region, 2008 (millions of TEUs) .............. 3-20
Table 3.4: Mainlane container trade, 2008 (millions of TEUs) ........................................... 3-21
Table 3.5: Major transhipment ports in world container trade, 2009 .................................. 3-21
Table 3.6: Number of services of shipping lines of importance for transhipment at a South Africa port, 2007 ............................................................................................................... 3-22
Table 3.7: Container transhipments at South African ports, 2006-2010 (TEUs) ................ 3-25
Table 3.8: Nominal capacities of ships recently employed on the trade routes serving South Africa, 2011 (TEUs) .......................................................................................................... 3-26
Table 3.9: Estimated market shares of the shipping lines on the main routes serving South Africa ................................................................................................................................ 3-26
Table 3.10: Matrix of estimated transhipments at Durban, 2011 (TEUs) ........................... 3-27
Table 3.11: Matrix of estimated transhipments at Ngqura, 2011 (TEUs) ........................... 3-27
Table 3.12: Matrix of estimated transhipments at Durban resulting from CSAV services, 2011 (TEUs) .............................................................................................................................. 3-28
Table 3.13: Operational capacity on liner trade route services (July 2007) ........................ 3-34
Table 3.14: Container shipping services passing and including South Africa, July 2007 ... 3-35
Table 3.15: India’s exports by country/region .................................................................... 3-36
Table 3.16: India’s imports by country/region .................................................................... 3-36
Table 3.17: Estimated number of TEUs exported and imported by India to and from Africa and Latin America for the year ended February 2007 ....................................................... 3-37

NDoT SA Maritime Transport Sector Study / Part 3/ 27 July 2011 ii
L IST OF FIGURES Figure 3.1: PS class ship, Emma Maersk .......................................................................... 3-10
Figure 3.2: Transhipment terminal: Port of Tanjung Pelepas, Malaysia ............................. 3-12
Figure 3.3: Main East-West Route and several transhipment hubs mentioned in text ....... 3-13
Figure 3.4: Prediction of containers to be imported and exported by region in 2015 (TEUs) .... ......................................................................................................................................... 3-20
Figure 3.5: Main East-West Route and feeder routes to West and East Africa .................. 3-23
Figure 3.6: Foreign destinations/origins of existing transhipments at Durban, 2011 .......... 3-28
Figure 3.7: Foreign destinations/origins of existing transhipments at Port of Ngqura, 2011 ...... ......................................................................................................................................... 3-29
Figure 3.8: Main prospects for Port of Ngqura as transhipment hub .................................. 3-31

NDoT SA Maritime Transport Sector Study / Part 3/ 27July 2011 3-3
3. Transhipments
3.1 Scope and aim of the paper
The purpose and scope of Part 3 are fourfold:-
• to analyse the complexities of the demand for the transhipments of containers in international shipping insofar as a hub for that purpose could be established in a South Africa port;
• to explain the economic motivation for such a hub and the advantages; • to dispel unsubstantiated views about the scope for container transhipment in South
Africa as often aired in the media; • to describe the requirements and prospects for a successful transhipment hub in
South Africa and make recommendations.
3.2 Introduction
The development of a hub at a South African port for the transhipment of large numbers of containers shipped on intercontinental routes has often been proposed in the belief that the geographical location and physical attributes of the country’s container ports favour such development. In support of the motivation for the proposal is the fact that the Port of Durban already handles a substantial number of transhipments between ocean-going liners. As the transhipment of containers has become a feature of the logistics of intercontinental liner services and has created a new and rapidly growing maritime industry with economic spin-offs, including job creation, many port authorities have invested large sums fruitlessly in infrastructure and marketing in order to attract transhipments. Their lack of success is attributable to insufficient insight of the complexity of the logistics of liner of operation and the determinants of container transhipment. Those determinants concern inter alia not only the geography of intercontinental trade and ocean transport, but the technology and economics of liner shipping, supply concentration in markets, logistics of container services, repositioning of empty containers, finance, ownership and operation of terminals and supply chain integration, as well as the political stability and maritime policies of the host countries, and the legal implications of transhipment for the finance and insurance of the cargo. Although the term transhipment with reference to container services is taken to mean offloading containers from one ship and the loading on to another, it has, in fact, an important legal connotation in the carriage of cargo. For example, transhipment between different performing carriers not specified in port-to-port bills of lading might result in refutation of payment by banks should the cargo be lost, especially as letters of credit usually do not allow transhipment, whereas transhipment between ships of a contracting carrier need not be specified in bills of lading and port-to-port liability will not be affected. Such legal issues concerning transhipment cannot be dealt with within the scope of this report, although they are taken into account in the planning of transhipments by shippers and liner companies.

NDoT SA Maritime Transport Sector Study / Part 3/ 27July 2011 3-4
In view of the misconceptions about the potential for developing a hub or relay port in South Africa and in order to motivate the conclusions and recommendations in this paper, it is necessary to deal briefly with the history of hub and relay port development and the need for transhipment, as well with the economics and logistics of transhipment and the container flows on which the prospect of a South African hub or relay port depend. A difficulty when analysing those flows is that trends based on recent statistics are distorted by the effect of the downturn in world trade in 2009/2010, as shown in Figures 1.1 to 1.3, section 1.4. As the trend during the past year or so is undoubtedly not in line with the long term trend, assuming that the recent financial crisis in the developing countries will not result in enduring structural changes that render the trends no longer applicable, some of the conclusions have been derived from data relating to the period until 2007, in which year container flows were growing rapidly at a rate container operators expect (or hope) will resume.

NDoT SA Maritime Transport Sector Study / Part 3/ 27July 2011 3-5
3.3 Brief history of development of transhipment ports
Although shipping has always required some transhipment of cargo, ports for general cargo prior to containerisation in the early 1970s were invariably gateway ports providing access to their hinterlands. As the containerisation of general cargo enabled ships of increasing size with lower unit costs to be loaded and unloaded rapidly in ports equipped for that purpose, containers needed to be transhipped to and from smaller vessels and barges in order to serve shallow ports unable to accommodate the large ships and to collect and distribute small numbers of containers. The concept of feeder ports evolved in that manner. Initially those ports were gateway ports with stacking space for the transhipment of the feeder containers. Durban is an example of such a port. Congestion and delays resulting from the intermingling of transhipments with imports and exports and the consequent competition for stacking space motivated the idea of moving transhipment traffic to offshore terminals or ports that could be dedicated for that purpose, especially ports with space for greenfield development. Such ports then evolved into intercontinental hubs for large liners, with spokes of services by smaller liners of different sizes to and from lesser ports. Hub ports were (and now are) chosen by liner companies with regard inter alia to geographic location, depth of water, infrastructure and superstructure, capacity, logistics of services, efficiency and financial arrangements (as the liner companies often participate in financing the investment in hub ports). These considerations are dealt with elsewhere in this paper. Most of the important hub ports worldwide are listed in Table 3.1, which also shows particulars of ownership. As the volumes of containers moving on intercontinental trade routes that cross each other increased, the economies of redistributing containers at the crossings became evident to liner companies and liner alliances and the concept of relay ports was the outcome. At relay ports, containers are transhipped between large liners rather from large to smaller liners as at hub ports. In the distant future, when the volume of east – west trade in the Southern Hemisphere reaches sufficient proportions and if the north – south trade between Europe and South Africa continues to increase, South African ports will be located at a major crossing point in the physical trade of the world.

NDoT SA Maritime Transport Sector Study / Part 3/ 27July 2011 3-6
3.4 Types of transhipment ports
As an outcome of the evolution of transhipment in the logistics of liner shipping, several basic types of transhipment terminals and ports now exist, including:
• gateway ports with stacking space for transhipments;
• gateway ports with separate terminals for the transhipment of feeder cargo; • hub ports usually located away from developed areas (or offshore) with spoke
services feeding containers to and from lesser ports; • relay ports for the transhipment of containers between large ships, located where
major routes for the shipping of containers cross. There are varieties of transhipment facilities that derive from these basic types, each adapted to the requirements of the shipping regions served and the logistics of the liner companies that use the facilities. A relay port is an innovation offering potential savings to liner operators in the position to exploit transhipments between major intercontinental routes. The development of terminals and ports dedicated to transhipment has created opportunities for business by terminal operators and liner companies and a new industry that is among the fastest growing industries in the world’s maritime sector. As the investment in the infrastructure, superstructure and operation of the terminals is usually immense and the return is dependent on the logistics of incorporating transhipment in the intercontinental shipping of containers, the investment involves high risk. In Table 3.1, most of the major hub ports in the world are listed and the depths of water at the berths are shown as well as the identity of the terminal operators/owners.
Table 3.1: Major ‘offshore’ transhipment hub terminals and max berth depth
Port Max berth depth (m) Remarks Algeciras, Spain 16.0 Maersk Line Terminal Malta Freeport 15.5 Grand Alliance Hub Gioia Tauro, Italy 15.0 Contship + Maersk share MITH, Cagliari 14.0 Contship Salalah, Oman 16.0 Maersk Line equity share Sines, Portugal 17.0 PSA terminal Taranto, Italy 16.0 Evergreen terminal Port Said, Egypt 16.0 ECT/Maersk Line Aden 16.0 PSA terminal Manzanillo, Panama 13.0 SSA Freeport, Bahamas 16.0 Hutchison Ports Sepetiba, Brasil 18.5 German operators Colombo 16.0 P&O Ports Tanjung Pelepas, Malaysia 16.0 Maersk Line equity share Kabil, Batam Island 17.0 In course of construction Kitakyushu, Japan 15.0 PSA Kwang Yang, South Korea 15.0 Hanjin/Hyundai Source: Containerisation International Yearbook; Fairplay Ports Guide; Cargo Systems “Opportunities for container ports” Report, 1998.

NDoT SA Maritime Transport Sector Study / Part 3/ 27July 2011 3-7
As shown in Table 3.1, most of the operators, who are also the investors in the terminals, are liner companies and the facilities are for their own use, that of the alliances to which they belong or conferences within which they operate.

NDoT SA Maritime Transport Sector Study / Part 3/ 27July 2011 3-8
3.5 Motivation for transhipment
The reasons for the transhipment of containers at hubs is usually ascribed to the cost savings that the operator of container services derives from the use of larger ships with lower unit costs on long intercontinental voyages, set-off against the costs of additional container handling and the higher unit costs of smaller feeder ships on the short voyages to or from the ports of origin or destination of the container traffic. (For example, it is estimated that the slot costs of a 13000 TEU ship on the Far East – Europe route are some US$150 per TEU lower than an 8500 TEU ship - International Freight Weekly, 28 June 2011). However, that explanation is too simple to motivate the development of hub and relay terminals and ports in recent years. More complicated considerations need to be taken into account in order to assess the prospects for improving the productivity of container services through transhipments and particularly for reaching conclusions about the establishment of a successful South African container hub. The most obvious advantages and disadvantages are believed to be the following: ADVANTAGES
(i) Transhipment enables more frequent services feedering more ports to and from transhipment hubs while large ships shuttle between the hubs, so achieving high utilisation of capacity throughout the transport chain (i.e. by matching the supply to demand on each link in the chain). The alternative is voyages by single ships calling at several ports at each end of the route (or multi-porting), so raising or lowering profitable utilisation of capacity at each call especially when trade is unbalanced, which it usually is at lesser ports.
(ii) Transhipment integrated into the logistics of a network of liner services enables their operators to choose or establish transhipment terminals or hubs at ports that have sufficient depth of water to accommodate large ships and that are uncongested with shipping for other purposes, so avoiding berthing delays that often occur at general ports open to all traffic, which is essential if the economies of the large ships are to be realised.
(iii) Direct port-to-port or hub-to-hub shuttling on intercontinental routes enables optimal efficiency in the utilisation of large liners to be achieved through transhipment, provided that it is rapid and seamless, which requires dedicated infrastructure and loading and offloading equipment.
(iv) Transhipment enables the liner companies with worldwide services to employ logistical strategies that optimise the movement of containers on their networks by matching volumes to capacity, rather than vice versa. By doing so, some of the fixed costs of liner shipping can be rendered variable, which assists in managing fluctuations in trade.
DISADVANTAGES
(i) Liner companies are exposed to greater financial risk from market contraction when their services are logistically locked into shuttle services between transhipment hubs with large ships designed for that purpose This risk was realised by the large liner companies during the recent economic recession in developed countries, while

NDoT SA Maritime Transport Sector Study / Part 3/ 27July 2011 3-9
companies operating smaller liners providing direct calls at several ports in a loop were able to maintain the utilisation of their capacity (although they had to accept lower rates that declined throughout the market).
(ii) The use of larger ships relying on the transhipment of containers to and from feeder services for the collection and distribution of cargo requires transhipment terminals and ports to be properly equipped for that purpose and terminal operators will seek guarantees of traffic before undertaking investment dependent on the particular logistics of a liner company. Otherwise liner companies will need to participate in such investment (as has happened in the development of most of the major hub terminals), which locks them into a logistical scheme and impinges on the otherwise “footloose” characteristic of their industry.
(iii) Liner companies operating large ships dependent on transhipment for their utilisation need to be assured of reliable feeder services, which usually necessitate investment in ships for those services and direct or indirect control of their operations. In the highly competitive market for container transport, rival liner companies are unlikely to be willing to depend upon feeder services controlled by their opposition.
(iv) Where liner companies rely on transhipment at gateway ports operated by public authorities or agencies and are so unable to control the entire port-to-port supply chain, flexibility in the use of their ships needs to be retained, as the productivity of the large ships now being employed depends upon the seamless throughput of cargo between origin and destination. Delays at the ports ruin the economies of their scale with far worse financial consequences than those for smaller ships. There is, however, a cost penalty for ensuring flexibility in ship deployment.
If the features that have motivated the attraction of transhipments to the large hub ports on the major trade routes are taken into account, it is evident that at least the following advantages for liner companies will need to be offered at a potential South African hub:
(i) Fast turnaround time of ships, which requires berthing and departure to occur without delay, and high productivity in loading and offloading. High productivity implies lift rates of 25 - 30 per hour, 200 moves per ship per hour using up to five cranes, land use of 400 -800 TEUs per hectare and quay lengths of 1 000 meters. The lift above rails of the cranes should be at least 46 metres and their reach extend to 60 metres. These facilities should enable a fully laden 6 000 TEU ship or larger to be fully discharged and loaded within 72 hours. Many of the containers are likely to be 40 ft units equivalent to two TEUs;
(ii) Competitive charges for handling at less than the rate for non-transhipments; (iii) Charges based on container lifts irrespective of type of container, especially without
distinguishing between 20 and 40 ft. containers; (iv) Storage slots that enable rapid placement and removal of containers within a dwell
time of up to 5 days; (v) Logistical and other attractions that induce a major liner company to anchor its
transhipments at the terminal/ port.

NDoT SA Maritime Transport Sector Study / Part 3/ 27July 2011 3-10
3.6 Infrastructure requirements for transhipment hubs
As shown in Table 3.1, eleven of the seventeen terminals listed, have maximum berth depths of 16 metres or more. Channels need not be that deep as ships can depart at high tide if the range is adequate to allow for the fully laden ship and squat when under way, but waiting for the tide lowers productivity and liner companies prefer ports without tidal limitations. A depth of 16 metres is probably sufficient for all ships up to the size of so-called Suezmax, which is a ship of a maximum length of 400 metres and beam of 50 metres. As the Suez Canal has been deepened to accept ships drawing 17 metres and Suezmax container ships have been designed with draughts of 15 metres when fully laden, it seems that 16 metres of depth at berths will be adequate for any transhipment port in Southern Africa for some time. The Suezmax container ships are usually typified by reference to the largest container ships in current use, namely the PS class of Maersk Line, comprising seven ships similar to Emma Maersk (see Figure 3.1 below), which has a length of 397metres, beam of 56 metres, draught of 14,5 metres and a capacity in use of 11 000 containers. Ships of that size could be accommodated at the Port of Ngqura (although their lengths exceed the berth dimensions and their beams exceed the reach of the cranes), but it is unlikely that the traffic will be sufficient to require their employment on any of the routes to South Africa in the near future. Even larger ships, the so-called Triple E class, have been ordered for delivery by 2015. These will be only slightly longer than the PS class at a length of 400metres, but with a beam of 59 metres and draught of 14,5 metres and be designed to carry 18 000 containers.
Figure 3.1: PS class ship, Emma Maersk

NDoT SA Maritime Transport Sector Study / Part 3/ 27July 2011 3-11
The depth of water at berths and in the channels is probably the most critical limitation on the infrastructural development of ports as transhipment hubs, apart from the availability of space for the stacking of containers. Ships shuttling on intercontinental routes between hub ports will usually have all their slots occupied, but often the nature of the cargo and the number of empty containers when the trade is unbalanced will result in a draught less than the maximum, enabling admittance to ports too shallow to accommodate the ships when fully laden. For many years, the Conference ships to South Africa from Europe offloaded cargo at Cape Town and Port Elizabeth en-route to Durban and could be admitted to the port that otherwise would not have had sufficient depth for the fully laden liner. With the shift in trade to the Far East and the logistics of liner operation now being based on increasingly larger ships, South African ports without sufficient depth to berth ships requiring depths of at least 15 metres will be relegated to feeder ports. Sufficient space for stacking containers is another requirement of hub ports, although it can be argued that the idea behind transhipment is to move the containers quickly between ships and that space should be limited in order to preclude storage. However, plenty of space is needed to provide slots for the sorting and stacking of containers rapidly offloaded from a ship carrying 7 000 to 9 000 containers or accumulated for loading. The simultaneous offloading and loading between ships is a prospect that requires logistical planning not feasible yet in trade with South Africa, although it does occur in the Far East. With the exception of the Port of Ngqura, South Africa’s container ports are all located near the Central Business Districts of cities and the lack of space has given rise to the so-called “off-dock” concept for the stacking of containers. As that concept cannot be adopted at transhipment hubs, lack of space imposes a limitation on the development of any of the existing South African container ports as a large transhipment hub, except at the Port of Ngqura.

NDoT SA Maritime Transport Sector Study / Part 3/ 27July 2011 3-12
3.7 Factors influencing the location of transhipment
The importance of where liner companies will locate transhipment is evident to a large extent from an examination of the geography of existing hubs and the locational advantages which have induced rivalry. Algeciras (Spain), Gioia Tauro (Italy) and Malta Freeport in the Mediterranean are all located on the major Asia - Europe trade route and in proximity to feeder origins and destinations in Southern Europe and North Africa. Those hubs face competition from Port Said East (Egypt), Tangier (Morocco) and Damietta (Egypt) also in the Mediterranean and located near the main shipping route. Colombo (Sri Lanka) and Dubai (United Arab Emirates) and regional hubs for the Arabian Gulf and Indian sub-continent face competition from Salalah (Oman) and Aden (Yemen) which have more recently come into the market. Singapore which is still the largest transhipment hub for the East - West trade route and the intra-Asia trade is confronted with serious competition from Port Klang and Tanjung Pelepas in Malaysia. The main East-West trade route and several of the important transhipment hubs are illustrated in Figure 3.3.
Figure 3.2: Transhipment terminal: Port of Tanjung Pelepas, Malaysia
Although these competing ports all have the advantage of being located on or near the major East - West trade routes, their future as transhipment hubs depends largely upon the decisions of the liner companies that take account of the total logistical costs of including transhipment in their networks of services. Without any vested interest in particular terminals, liner companies can readily indulge in “hub-hopping”. In order to avoid that happening, liner companies need to be locked into the investment in a transhipment hub, which is usually a satisfactory reciprocal arrangement enabling a high rate of throughput and productivity to be achieved in view of the mutual interest in the financial outcome. An example of such an arrangement is provided by the container hub in Salalah, in which Maersk Line is a major investor together with the Government of Oman.

NDoT SA Maritime Transport Sector Study / Part 3/ 27July 2011 3-13
Table 3.1 listing major transhipment ports and their owners/operators shows that liner companies are participating investors in at least eight of the seventeen shown. As mentioned in the second paragraph of this section, liner companies take into account the total costs of their logistical decisions, which implies that a favourable location of a transhipment hub is not necessarily the overriding factor in its use. Where ports have a substantial gateway function on a major route, it might be worthwhile to divert liners to serve those ports and use their transhipment facilities at the same time. An example is the deviation of 1300 nautical miles from the East - West route to serve Jebel Ali in the United Arab Emirates, as against the deviation of 163 nautical miles to Salalah (Oman) for transhipments only.
Figure 3.3: Main East-West Route and several transhipment hubs mentioned in text
Source: Aurecon, 2011
Another reason why transhipments take place at locations seemingly irrational if only geography is taken into account concerns the network costs. As larger ships are employed on trade routes, less utilised links plied by smaller ships are phased out, so consolidating routes in a coarser network. Traffic might consequently move in different directions instead of direct between the ports of origin and destination. Although the transhipment hubs mentioned in this section might be remote from South Africa and seemingly of no relevance, their influence on the volumes of traffic moving on the networks serving South Africa should not be discounted. An inspection of the bills of lading for South African imports and exports establishes their relevance.

NDoT SA Maritime Transport Sector Study / Part 3/ 27July 2011 3-14
While South Africa’s location well away from all the major trade routes is obviously a drawback when competing for transhipments, some of its locational disadvantages would diminish if the VLCS now on order were to be employed on direct voyagers from the Far East to Ngqura, with feeding to West and East Africa and the East Coast of South America, where draft limitations might restrain their use.

NDoT SA Maritime Transport Sector Study / Part 3/ 27July 2011 3-15
3.8 Economics and economic spin-offs of transhipment ports
The traditional assumption that transhipment invariably adds to both the cost and transit time of shipping cargo is not always valid when direct port-to-port sailings are substituted by two voyages with the transhipment of cargo in between, as the unit cost on one of the voyages can be lowered by combining cargo on several voyages and employing a large ship to the extent of more than compensating for the transhipment costs. As larger (and longer) ships are capable of achieving high speeds, the overall transit might also be shortened if the dwell time of the cargo at the port of transhipment is kept to a minimum. The economics of “trunking” (i.e. combining cargo loads on long intercontinental routes) has justified the employment of increasingly larger containerships on the major trade routes and has necessitated the development of highly efficient transhipment hubs strategically located to serve regions of high production and consumption. Multi-porting at either end of a trunk route is the alternative to the collection and distribution of containers using feeder services to and from hubs at either end of a trunk route. The disadvantages of multi-porting are:
(i) That liner operators need to rely on the efficiency of ports and terminals not dedicated to transhipments and that delays affect the performance of the liners on the entire route.
(ii) That the utilisation of the ships when containers need to be loaded and offloaded at successive ports is unlikely to be optimal, in contrast to the utilisation of the feeder ships with capacities matched to the volumes.
(iii) That hub and spoke operations enable more frequent port calls than multi-port services.
(iv) That the establishment of transhipment hubs located offshore or in undeveloped places results in more economical land use than the development of terminals in ports adjacent to or within city precincts, where the opportunity costs of the land used probably exceeds the value of its occupation for a container terminal.
As often happens in shipping markets, capacity provision overtakes demand, with the consequence that, as at present, container ships ordered need to be taken into service on routes offering insufficient trade to enable the economies of their scale to be achieved. Logistical changes to networks are then necessary in order to combine cargo flows in ways that might seem to be geographically irrational, so long the outcome is to reduce the overall cost of the transport task. It should be borne in mind that most of the costs of operating larger liners on trunk routes are fixed and the marginal costs of utilising spare capacity are incurred mainly in the handling and transhipment of the additional cargo. The economics of transhipment have thus become of cardinal interest to liner companies seeking to benefit from the cost efficiency of including transhipment in the logistics of employing larger containerships. As the investment by liner companies in the larger ships now being taken into service depends upon the scale economies that can be achieved through transhipment at strategic hubs, most of the companies have been unwilling to rely on

NDoT SA Maritime Transport Sector Study / Part 3/ 27July 2011 3-16
the performance of third party hub operators and have invested in hubs. Table 3.1 shows the owners/operators of several large hubs. Mention is made in section 3.5 of some of the essential requirements of hub performance by liner companies. Although South African ports are presently only on the fringe of the intercontinental network of container shipping, traffic into Africa is presently growing faster than anywhere else and opportunities for South African business in transhipment, apart from those described in section 3.11, might ensue. Whether such opportunities would be worthwhile propositions insofar as the risk, return on capital, job creation and socio-economic spin-offs are concerned requires some discussion of the value chain in which transhipment is a link and the services on which transhipment depends. Table 3.2 shows the approximate percentage share of the gross revenue derived from the various inputs in container shipping and the average return on the capital invested.
Table 3.2: Percentage share of gross income, costs and estimated return on capital employed in container shipping
Function Percentage of Revenue
Percentage of Cost
ROCE
Customer sales, shipment routing, capital procurement, customer services, billing, tracking of cargo
15,6 16 50
Ownership of container storage, maintenance, repositioning
3.9 4 9
Ownership and operation of ships 49.8 50 3 Terminal control and operation, container handling
17.0 17 25
Inland transport and handling 13.7 14 34 Source: Derived from MergeGlobal Analysis and estimates.
As shown in Table 3.2, terminal operation earns some 17% of the revenue from container shipping with a return on the capital employed of 25% (before taxes and interest), which renders investment in a transhipment hub worthwhile as a private business venture. Competition in the transhipment business occurs between container carriers (the liner companies), existing terminal operators (to the extent that the geographic location of their terminals allows) and third party terminal operators. Although Transnet monopolises the existing terminal operations in South Africa and no doubt also any prospective terminal operation, alternative locations on both the west and east costs north of South Africa and on the Indian Ocean islands are available. (As mentioned in section 3.11, Maersk Line has established a hub for West African ports at Walvis Bay served directly from the Far East.) In Table 3.2, the percentages of the costs are also shown. Of the costs involved in terminal operation, handling per TEU loaded or offloaded is the most critical element. The prospects for developing a large hub or relay port for the transhipment of containers between foreign origins and destinations, given the demand, will inter alia thus depend largely upon how efficiently the containers can be lifted and positioned. Handling rates exceeding 28

NDoT SA Maritime Transport Sector Study / Part 3/ 27July 2011 3-17
containers per hour will be essential, with the handling rates at the hubs of Algeciras, Tangier and Salalah being adopted as benchmarks to be exceeded. As the efficiency of a transhipment hub also depends upon the economies of scale that can be achieved, it will be necessary to add to the throughput at a South African hub by diverting traffic from other domestic ports, provided the cost savings so justify. On the assumption that the Port of Ngqura is the best bet for the development of a hub or relay terminal, that implies the diversion of import, export and transhipment traffic from other ports. However, there is a limit to the economies of scale that can be achieved, which depends upon the nature of the markets served by the port to be developed for transhipment. Those economies can be maximised when the port has a large share of the market for local throughput, which means that Ngqura would need to serve Gauteng industries. Scale economies to a lesser extent could be achieved by serving specific markets such as the market for motor vehicle manufacturing or by serving specific supply chains with integrated links between origin and destination (which are difficult to construct for South African imports and exports). There is no prospect in the near future for Ngqura to participate to any significant extent in the global market for container shipping, but in any event the scope for scale economies in such markets is limited once the throughput has reached a threshold volume, which is not necessarily high. Adequate scale economies could probably be achieved at Ngqura with volumes of throughput (not container lifts) of less than 700 000 containers per annum.
ECONOMIC SPIN-OFFS The economic spin-offs of transhipment hubs are not obvious, apart from the employment created for the handling and storage of the containers, which has a multiplier effect in the local economy through the expenditure of the wage-earners. Container terminals also generate work on the repair and refurbishment of containers and their scrapping, and on their identification and tracking. Another task that is suitably located at transhipment terminals is the logistical control of empties which comprise some 25% of all containers carried worldwide and in fact is the largest category of cargo transported by container shipping. Logistical strategies to minimise the costs of repositioning empties rely largely on transhipment arrangements and are important to the financial performance of the liner companies. Another spin-off of transhipment hubs that can be developed through industrial incentives is the interception of cargo for intermediate processing (sorting, repackaging, labelling, sampling, inspection, valuation, etc), which is labour intensive and suitable for investment by small industries. Many ports are surrounded by a wide variety of industries processing intercepted cargo – businesses which have expanded, for example, where the origins or place of manufacture need to be obscured and products re-branded. The scope for enterprises involving the processing of cargo between foreign origins and destinations at the Industrial Development Zone at Coega no doubt depends on local wage rates (that probably cannot rival the wage rates at foreign gateway ports competing for transhipments). The establishment of such footloose industries is both an off-shoot of transhipment hubs and a motivation for the development of a hub. It needs to be borne in mind when considering some of the economic spin-offs of transhipment hubs that most liner companies seek hubs that undertake transhipment only

NDoT SA Maritime Transport Sector Study / Part 3/ 27July 2011 3-18
and where the work is unlikely to be disrupted by shipping movements for other purposes or the traffic intercepted for intermediate processing.
NDoT SA Maritime Transport Sector Study / Part 3/ 27July 2011 3-19
3.9 Worldwide container flows
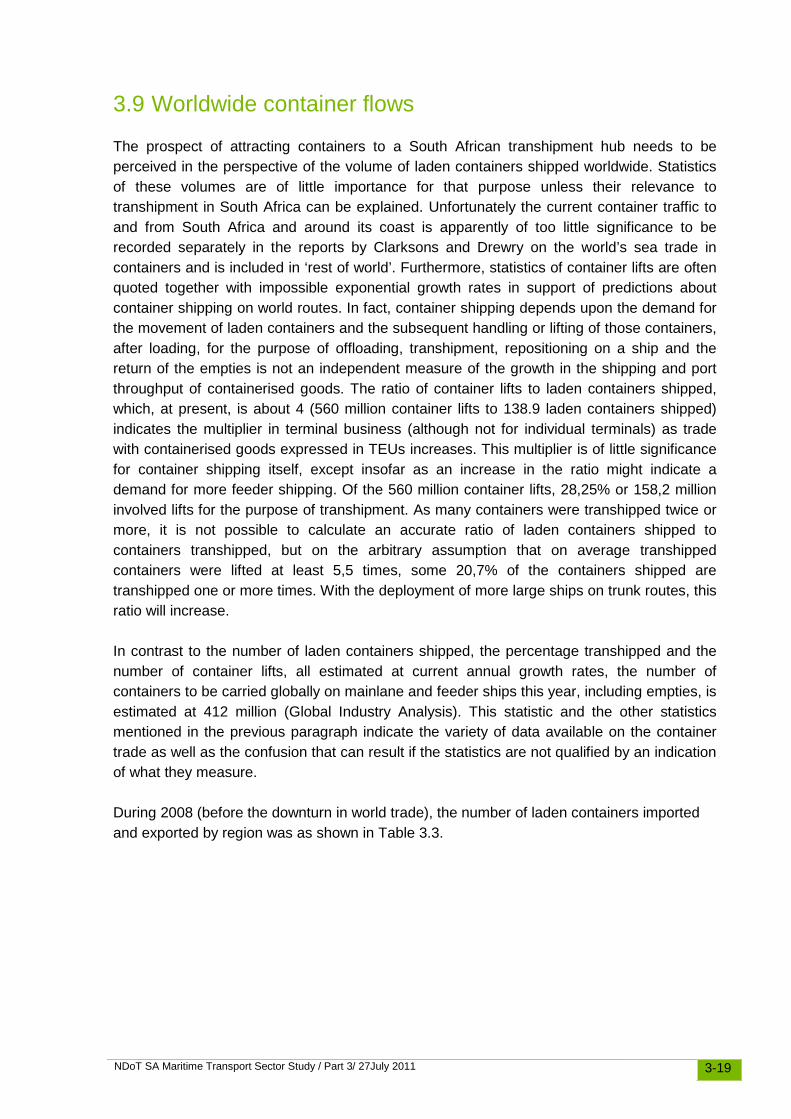
The prospect of attracting containers to a South African transhipment hub needs to be perceived in the perspective of the volume of laden containers shipped worldwide. Statistics of these volumes are of little importance for that purpose unless their relevance to transhipment in South Africa can be explained. Unfortunately the current container traffic to and from South Africa and around its coast is apparently of too little significance to be recorded separately in the reports by Clarksons and Drewry on the world’s sea trade in containers and is included in ‘rest of world’. Furthermore, statistics of container lifts are often quoted together with impossible exponential growth rates in support of predictions about container shipping on world routes. In fact, container shipping depends upon the demand for the movement of laden containers and the subsequent handling or lifting of those containers, after loading, for the purpose of offloading, transhipment, repositioning on a ship and the return of the empties is not an independent measure of the growth in the shipping and port throughput of containerised goods. The ratio of container lifts to laden containers shipped, which, at present, is about 4 (560 million container lifts to 138.9 laden containers shipped) indicates the multiplier in terminal business (although not for individual terminals) as trade with containerised goods expressed in TEUs increases. This multiplier is of little significance for container shipping itself, except insofar as an increase in the ratio might indicate a demand for more feeder shipping. Of the 560 million container lifts, 28,25% or 158,2 million involved lifts for the purpose of transhipment. As many containers were transhipped twice or more, it is not possible to calculate an accurate ratio of laden containers shipped to containers transhipped, but on the arbitrary assumption that on average transhipped containers were lifted at least 5,5 times, some 20,7% of the containers shipped are transhipped one or more times. With the deployment of more large ships on trunk routes, this ratio will increase. In contrast to the number of laden containers shipped, the percentage transhipped and the number of container lifts, all estimated at current annual growth rates, the number of containers to be carried globally on mainlane and feeder ships this year, including empties, is estimated at 412 million (Global Industry Analysis). This statistic and the other statistics mentioned in the previous paragraph indicate the variety of data available on the container trade as well as the confusion that can result if the statistics are not qualified by an indication of what they measure. During 2008 (before the downturn in world trade), the number of laden containers imported and exported by region was as shown in Table 3.3.

NDoT SA Maritime Transport Sector Study / Part 3/ 27July 2011 3-20
Table 3.3: Imported and exported containers by region, 2008 (millions of TEUs)
Region Imported Exported Europe 31.4 27.4
North America 22.1 12.3
Asia 43.7 82.0
Latin American and Caribbean
7.1 6.8
Australia and New Zealand 3.4 2.6
Other 35.6 12.0 Source: Compiled from several sources.
During the same period, South Africa imported 1 228 076 laden containers and exported 1 001 971 containers. A more detailed prediction of the combined percentage of imported and exported containers by world regions in 2015 is illustrated in Figure 3.4. As shown in the figure, Africa is expected to attain 3% of the world total. Most of these will comprise containers of imported cargo.
Figure 3.4: Prediction of containers to be imported and exported by region in 2015 (TEUs)
Source: Container Trade Growth
The main routes on which the containers in Table 3.3 were shipped are shown in Table 3.4.

NDoT SA Maritime Transport Sector Study / Part 3/ 27July 2011 3-21
Table 3.4: Mainlane container trade, 2008 (millions of TEUs)
Route Eastbound Westbound Transpacific 17.7 6.8 Far East – Europe 4.9 13.9 Transatlantic 2.9 3.9 Source: Compiled from several sources.
The routes shown in Table 3.4 accounted for almost one third of global trade. The data in Table 3.4 shows that the preponderance of container traffic is in the Northern Hemisphere and, in fact, all the major transhipment ports are also located north of the equator as shown in Table 3.5.
Table 3.5: Major transhipment ports in world container trade, 2009
Port Country Containers handled (000s)
Percentage transhipments
Singapore Singapore 25 867 82 Hong Kong China 21 040 30 Shanghai China 25 602 43 Kaohshing Taiwan 8 581 52 Busan South Korea 11 955 42 Tanjung Pelapas Malaysia 5 835 96 Rotterdam Netherlands 9 743 40 Dubai UA Emirates 11 129 50 Gioia Tauro Italy 2 857 80 Algeciras Spain 3 043 85 Hamburg Germany 7 007 33 Salalah Oman 3 493 100 Klang Malaysia 7 310 41 Colombo Sri Lanka 2 464 71 Antwerp Belguim 3 710 23 Source: Compiled from several sources.
Table 3.4 also indicates that the Far East - Europe trade route carries the second largest volume of container traffic, virtually all of which is routed through the Suez Canal. Although the physical limitations of the canal impose a restriction on the passage of some VLCCs that are routed around the South African coast between the Middle East and Europe, the dimensions of the canal have repeatedly been increased so that even the very large Triple E-class container ships with capacities of 18 000 containers each, on order for delivery in 2015, will be accommodated. There is consequently no prospect of container traffic between the Far East and Europe being routed via the Cape and affording opportunities of interception by a South African port, especially with the existing routing of traffic for East and West Africa on the mainlane East – West route, with transhipment at hub ports along the route before and after passage through the Suez Canal respectively (See Figure 3.5). Some of the traffic for

NDoT SA Maritime Transport Sector Study / Part 3/ 27July 2011 3-22
both East and West Africa is presently being diverted via South Africa, as explained in section 3.10 – 3.11. The scope for the transhipment of intercontinental container traffic on a substantial scale at a South African port probably depends on the logistics in the future of the liner companies operating on east - west routes in the Southern Hemisphere, interlinked with their north - south trade to Sub-Sahara Africa. In Table 3.6, the number of shipping lines operating services of importance for transhipment at a South Africa port are shown.
Table 3.6: Number of services of shipping lines of importance for transhipment at a South Africa port, 2007
Route Number of services South Africa – Europe 6 South Africa – North America 3 South Africa – Asia 21 West Africa – Europe 33 West Africa – North America 13 Asia – East Coast of South America 6 Source: World Shipping Council
The services shown in Table 3.6 do not count among the top twenty in the world. East Africa does not feature in the table because the traffic is much less than on the services shown and is largely accommodated by multi-porting and feedering. The export cargo carried on the services shown in Table 3.6 expressed in laden containers, is insufficient for any of the countries or regions served to be included in the world’s top twenty exporting countries/regions, while only West Africa with 1.9 million (1.6% of the total) imported TEUs (carrying low valued goods) is included among the top twenty importing countries or regions. The number of services to South Africa in 2007 shown in Table 3.6 generated 3 396 calls at South African ports and the average number of laden containers landed and shipped per call was 368 landed and 255 shipped with 99 transhipped (containers landed). As the frequency of the services differ substantially, these averages are not significant. All the ships and shipping lines currently calling at South African ports are shown in Table 1.9. The purpose of quoting all these statistics is to show that South Africa is the origin and destination of container flows of insignificant numbers to merit mention in comparison with the container trade elsewhere and that the services on which these containers are carried do not intersect any of the major trade routes, with the exception of the routes carrying imports to West Africa. In these circumstances it is evident that the attraction of transhipments in numbers to justify the establishment of a terminal dedicated to that purpose depends upon unique circumstances as discussed in sections 3.10 and 3.11.

NDoT SA Maritime Transport Sector Study / Part 3/ 27July 2011 3-23
Figure 3.5: Main East-West Route and feeder routes to West and East Africa
Source: Aurecon, 2011

NDoT SA Maritime Transport Sector Study / Part 3/ 27July 2011 3-24
3.10 Transhipment at South African ports and recent developments
In Table 3.8, statistics of container transhipments at South African ports during the past 5 years are shown. No conclusions can be reached by examining trends in these statistics as the arrangement of transhipments in the past at these ports do not commit liner companies to future arrangements and, in fact, the arrangements have been changed substantially in the past year or so. Without any investment in the South African ports or terminals used for transhipment, liner companies can and do change their arrangements virtually overnight. However, it is necessary to deal briefly with the transhipment history during the past few years. Prior to 2006 virtually all the transhipment of containers at South African ports served the purpose of feedering cargo between the container and other domestic ports as well as ports on the west and east coast in Southern Africa. As not all the liner services included all these container ports and cargo was sometimes over carried, feeder services also included transhipment between the container ports. Some traffic for West Africa was also transhipped at Cape Town and Port Elizabeth as well as at Durban. Durban has always been the foremost of the South African ports for transhipments, although chronic congestion since the advent of containerisation, delays to ships and the lack of infrastructure, superstructure and organisation that favour transhipment have been a deterrent to the inclusion of the port in the logistics of the liner companies. An examination of the transhipments through Durban in 2008 prior to the opening of the Port of Ngqura shows that 223,533 TEUs were landed for transhipment. Of these transhipments, it is estimated that some 35% was shipped to Angola and West Africa, 14% to East Africa, 13% to intercontinental destinations, and 36% to other South African ports and Walvis Bay. Of the containers transhipped to intercontinental destinations, approximately 86% is estimated to have come from Angola and West and East Africa. Most of the empty containers landed for transhipment were probably received from the west and east coast of Africa and returned overseas. As the same time that the Port of Ngqura was opened for traffic, most of the large liner companies co-incidentally increased the capacity on the networks serving South Africa by employing ships capable of carrying the number of TEUs shown in Table 3.8.

NDoT SA Maritime Transport Sector Study / Part 3/27 July 2011 3-25
Table 3.7: Container transhipments at South African ports, 2006-2010 (TEUs)
Port 2006 2007 2008 2009 2010
Landed Shipped Landed Shipped Landed Shipped Landed Shipped Landed Shipped
Richards Bay Full 0 0 0 0 27 37 81 133 197 3004
Empty 0 0 0 0 0 0 0 15 100 150
Durban Full 189 083 203 315 197 603 197 398 223 533 225 600 228 563 233 787 215 021 220 321
Empty 48 897 48 461 52 423 52 695 70 135 71 383 70 596 71 097 38 504 37 052
East London Full 2 123 16 49 0 0 0 12 1 6
Empty 0 0 0 0 0 0 0 560 0 10
Ngqura Full 0 0 0 0 0 0 2 392 2 951 64 804 65 381
Empty 0 0 0 0 0 0 424 469 36 247 38 390
Port Elizabeth Full 20 850 23 544 23 439 22 863 20 955 20 900 30 765 31 423 48 896 47 814
Empty 113 940 4 674 5 879 1 436 3 053 9 300 8 731 14 441 19 052
Mossel Bay Full 0 0 0 0 0 0 0 0 0 0
Empty 0 0 0 0 0 0 0 0 0 0
Cape Town Full 54 190 59 420 35 980 39 131 41 592 42 565 121 099 126 781 32 094 36 745
Empty 17 429 16 557 20 127 23 079 15 044 13 676 49 995 49 620 10 473 10 589
Saldanha Full 0 0 0 0 0 0 0 0 0 0
Empty 0 0 0 0 0 0 0 0 0 0
Source: Transnet National Ports Authority

NDoT SA Maritime Transport Sector Study / Part 3/ 27July 2011 3-26
Table 3.8: Nominal capacities of ships recently employed on the trade routes serving South Africa, 2011 (TEUs)
Line/Conference Trade route Ship capacities (TEUs) MSC Europe – South Africa 6 000 – 6 500 Maersk Line1) Asia – South Africa 5 500 - 7 000 Maersk Line/HSD Asia – South Africa – ECSA2) 7 100 MOL Asia – South Africa – ECSA 5 500 CSAV/CMA Asia – South Africa 6 500 SAECS Europe – South Africa 4 200 Notes: 1) Maersk Line incorporates APM and Safmarine 2) ECSA: East Coast South America
In Table 3.10, the estimated market shares of the major liner companies on the Europe - South Africa and Far East - South Africa trade routes are shown.
Table 3.9: Estimated market shares of the shipping lines on the main routes serving South Africa
Trade Route Liner company and percentage share Maersk Line MSC MOL Other South Africa – Europe 49 20 23 7 South Africa – Asia 30 18 9 43 Other 42 27 2 29
As explained in section 3.5, the economics and logistics of employment of the large ships listed in Table 3.8 required the consolidation of more traffic on trunk routes through the amalgamation of links in the network of services, with the consequence of a need to reroute traffic sometimes in a seemingly irrational geographic manner. In order to consolidate traffic on trunk routes, while maintaining service levels, efficient transhipment at suitably located terminals or hubs became essential. The Port of Ngqura, with adequate depth of water and a ‘greenfields’ container terminal awaiting traffic immediately met that need. Nqgura, which has none of the physical drawbacks of Durban for transhipments purposes, is also likely to acquire much of its transhipment traffic in the next few years. When the Port of Ngqura opened, MSC initially switched a substantial number of the transhipments generated by its European-South Africa service from Durban to Ngqura and eventually also from its Asia - South Africa service. Furthermore, some of its traffic between Europe and East Africa formerly transhipped at Salalah and feedered through pirate-infested seas, is now being transhipped at Ngqura. Altogether the transhipments at Ngqura have reached about 350 000 TEUs annually as a result of logistical changes, but further increases generated on the particular network will probably depend upon the normal growth in traffic. MOL calls at Ngqura for transhipment on its feeder service between Durban and Namibia/Angola, while Ngqura is also used for the transhipment of empties to the Far East.
NDoT SA Maritime Transport Sector Study / Part 3/ 27July 2011 3-27
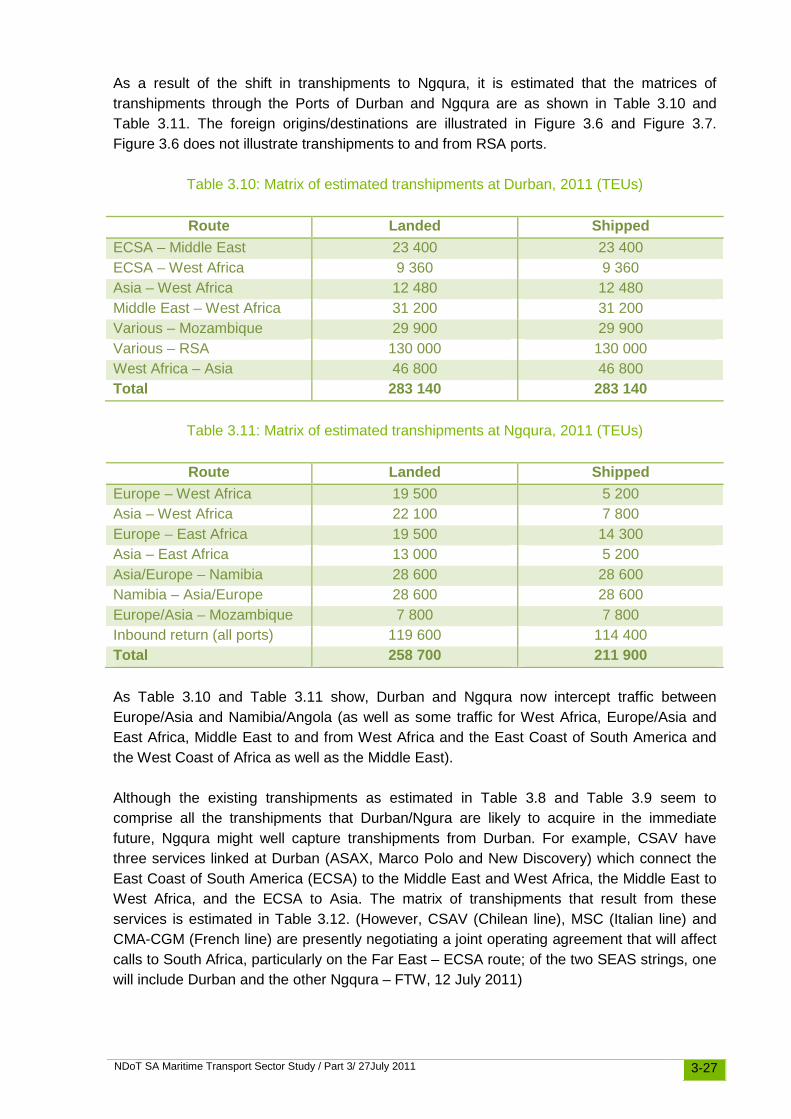
As a result of the shift in transhipments to Ngqura, it is estimated that the matrices of transhipments through the Ports of Durban and Ngqura are as shown in Table 3.10 and Table 3.11. The foreign origins/destinations are illustrated in Figure 3.6 and Figure 3.7. Figure 3.6 does not illustrate transhipments to and from RSA ports.
Table 3.10: Matrix of estimated transhipments at Durban, 2011 (TEUs)
Route Landed Shipped ECSA – Middle East 23 400 23 400 ECSA – West Africa 9 360 9 360 Asia – West Africa 12 480 12 480 Middle East – West Africa 31 200 31 200 Various – Mozambique 29 900 29 900 Various – RSA 130 000 130 000 West Africa – Asia 46 800 46 800 Total 283 140 283 140
Table 3.11: Matrix of estimated transhipments at Ngqura, 2011 (TEUs)
Route Landed Shipped Europe – West Africa 19 500 5 200 Asia – West Africa 22 100 7 800 Europe – East Africa 19 500 14 300 Asia – East Africa 13 000 5 200 Asia/Europe – Namibia 28 600 28 600 Namibia – Asia/Europe 28 600 28 600 Europe/Asia – Mozambique 7 800 7 800 Inbound return (all ports) 119 600 114 400 Total 258 700 211 900 As Table 3.10 and Table 3.11 show, Durban and Ngqura now intercept traffic between Europe/Asia and Namibia/Angola (as well as some traffic for West Africa, Europe/Asia and East Africa, Middle East to and from West Africa and the East Coast of South America and the West Coast of Africa as well as the Middle East). Although the existing transhipments as estimated in Table 3.8 and Table 3.9 seem to comprise all the transhipments that Durban/Ngura are likely to acquire in the immediate future, Ngqura might well capture transhipments from Durban. For example, CSAV have three services linked at Durban (ASAX, Marco Polo and New Discovery) which connect the East Coast of South America (ECSA) to the Middle East and West Africa, the Middle East to West Africa, and the ECSA to Asia. The matrix of transhipments that result from these services is estimated in Table 3.12. (However, CSAV (Chilean line), MSC (Italian line) and CMA-CGM (French line) are presently negotiating a joint operating agreement that will affect calls to South Africa, particularly on the Far East – ECSA route; of the two SEAS strings, one will include Durban and the other Ngqura – FTW, 12 July 2011)

NDoT SA Maritime Transport Sector Study / Part 3/ 27July 2011 3-28
Table 3.12: Matrix of estimated transhipments at Durban resulting from CSAV services, 2011 (TEUs)
Route Landed Shipped ECSA – Middle East 23 400 23 400 ECSA – West Africa 9 360 9 360 Middle East – West Africa 31 200 31 200 West Africa – Asia 46 800 46 800 Total 110 760 110 760 Some of the services could include Ngqura for transhipment although the economies of linking the services at Ngqura instead of Durban depend upon the volumes of traffic for Durban itself.
Figure 3.6: Foreign destinations/origins of existing transhipments at Durban, 2011
Source: Aurecon, 2011

NDoT SA Maritime Transport Sector Study / Part 3/ 27July 2011 3-29
Figure 3.7: Foreign destinations/origins of existing transhipments at Port of Ngqura, 2011
Source: Aurecon, 2011
NDoT SA Maritime Transport Sector Study / Part 3/ 27July 2011 3-30
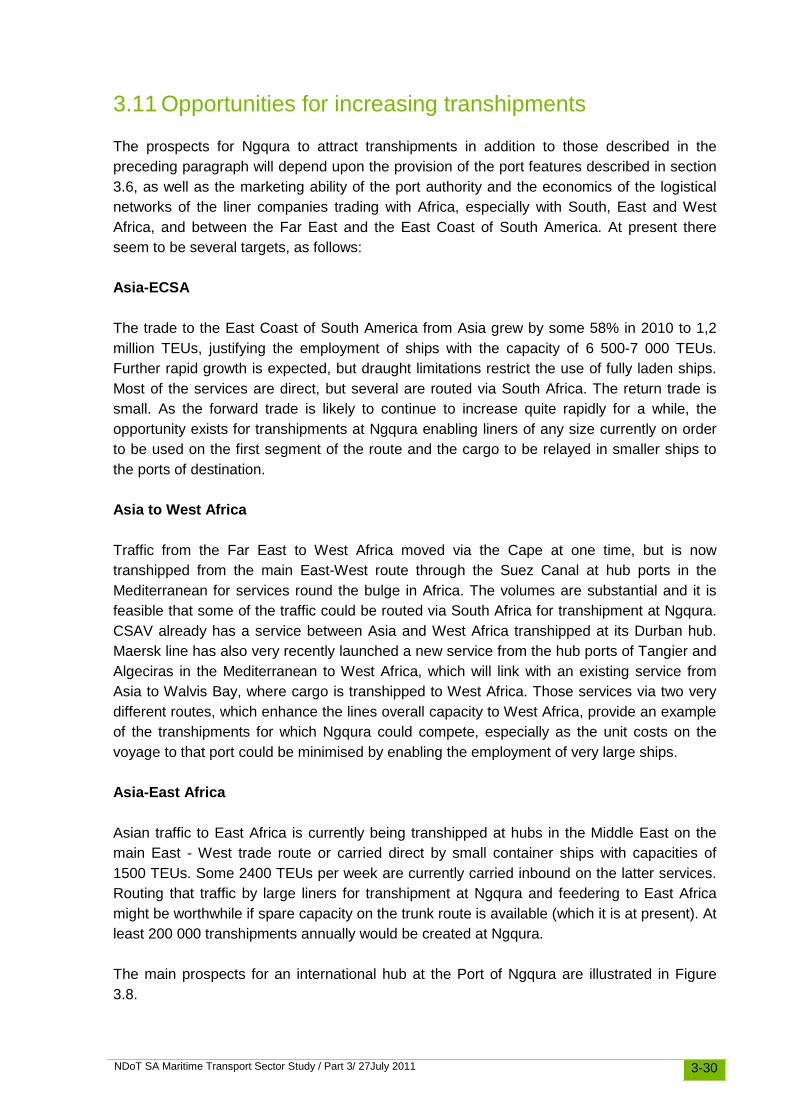
3.11 Opportunities for increasing transhipments
The prospects for Ngqura to attract transhipments in addition to those described in the preceding paragraph will depend upon the provision of the port features described in section 3.6, as well as the marketing ability of the port authority and the economics of the logistical networks of the liner companies trading with Africa, especially with South, East and West Africa, and between the Far East and the East Coast of South America. At present there seem to be several targets, as follows: Asia-ECSA The trade to the East Coast of South America from Asia grew by some 58% in 2010 to 1,2 million TEUs, justifying the employment of ships with the capacity of 6 500-7 000 TEUs. Further rapid growth is expected, but draught limitations restrict the use of fully laden ships. Most of the services are direct, but several are routed via South Africa. The return trade is small. As the forward trade is likely to continue to increase quite rapidly for a while, the opportunity exists for transhipments at Ngqura enabling liners of any size currently on order to be used on the first segment of the route and the cargo to be relayed in smaller ships to the ports of destination. Asia to West Africa Traffic from the Far East to West Africa moved via the Cape at one time, but is now transhipped from the main East-West route through the Suez Canal at hub ports in the Mediterranean for services round the bulge in Africa. The volumes are substantial and it is feasible that some of the traffic could be routed via South Africa for transhipment at Ngqura. CSAV already has a service between Asia and West Africa transhipped at its Durban hub. Maersk line has also very recently launched a new service from the hub ports of Tangier and Algeciras in the Mediterranean to West Africa, which will link with an existing service from Asia to Walvis Bay, where cargo is transhipped to West Africa. Those services via two very different routes, which enhance the lines overall capacity to West Africa, provide an example of the transhipments for which Ngqura could compete, especially as the unit costs on the voyage to that port could be minimised by enabling the employment of very large ships. Asia-East Africa Asian traffic to East Africa is currently being transhipped at hubs in the Middle East on the main East - West trade route or carried direct by small container ships with capacities of 1500 TEUs. Some 2400 TEUs per week are currently carried inbound on the latter services. Routing that traffic by large liners for transhipment at Ngqura and feedering to East Africa might be worthwhile if spare capacity on the trunk route is available (which it is at present). At least 200 000 transhipments annually would be created at Ngqura. The main prospects for an international hub at the Port of Ngqura are illustrated in Figure 3.8.

NDoT SA Maritime Transport Sector Study / Part 3/27 July 2011 3-31
Figure 3.8: Main prospects for Port of Ngqura as transhipment hub
Source: Aurecon, 2011

NDoT SA Maritime Transport Sector Study / Part 3/ 27 July 2011 3-32
Ngqura as hub for South Africa The development of Ngqura as the hub for the feedering of containers to and from other South African ports is dealt with in Part 2, section 2.12. With the transhipments currently undertaken at the port and the transhipment work that could be acquired as described in that section, Ngqura could then attain sufficient status to be included in the list of the world’s important transhipment ports and to attract foreign capital for development and management experienced in competitive hub exploitation. However, the combination of a gateway and hub port might not enable the requisite high efficiency to be attained if the experience at Durban is taken into account.

NDoT SA Maritime Transport Sector Study / Part 3/ 27 July 2011 3-33
3.12 Transhipments at hub for IBR traffic
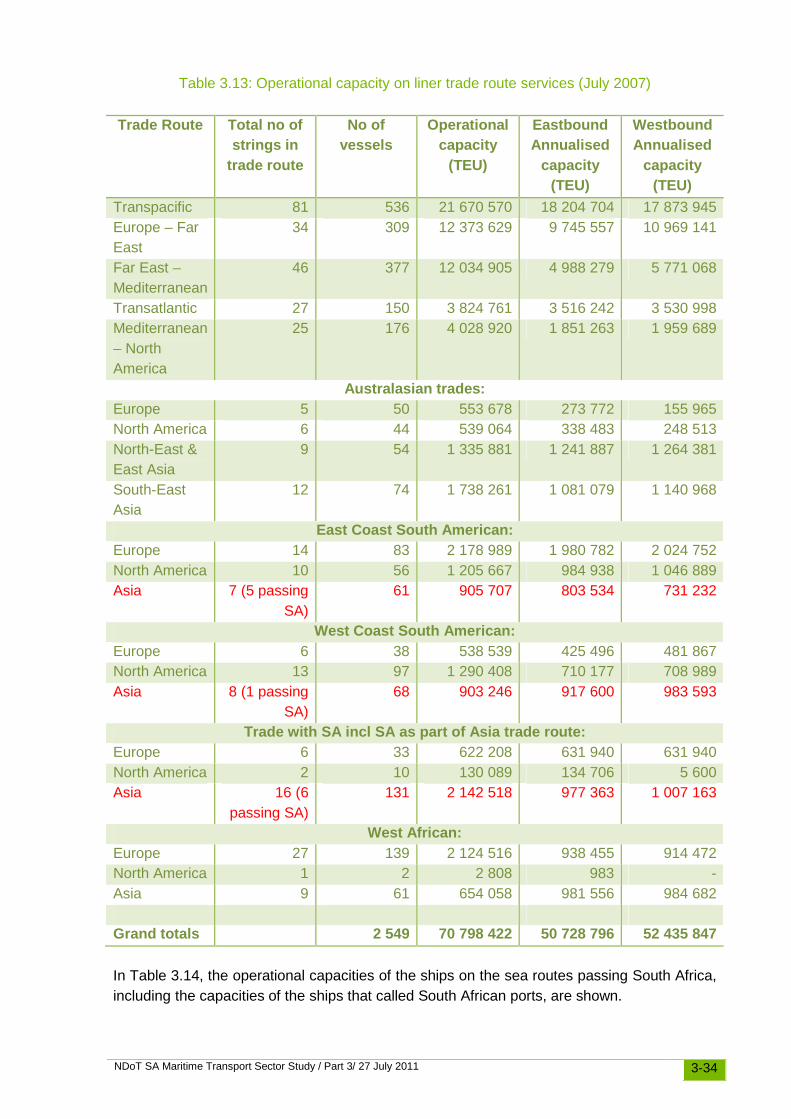
The establishment of a transhipment hub in South Africa to relay traffic between India and Brazil has been proposed in official talks between the three countries, but more precise details of what is envisaged have not been forthcoming. From a discussion with a representative of the Department of International Relations and Co-operation that attended an IBSA conference in New Delhi in 2009 where the proposal was mentioned, it was gathered that more than a transhipment hub was intended - the requirement seemed to be for a specific “off-dock” zone in which cargo could be collected, stored and perhaps processed before onward carriage. Such a zone would presumably need to comprise an in-bond customs area. Although consideration of that proposal is beyond the scope of this study it is necessary in this context to examine the volume of maritime trade between India and Africa and India and Latin America and whether South Africa could fulfil a function in that trade by virtue of its geographic location. In order to establish a transhipment hub in South Africa for the relay of the container traffic between India and the East Coast of Latin America and West Africa, at least 360 000 containers would need to be consolidated annually at the port of origin and carried in 6 000 TEU ships to the hub for transhipment and onward carriage in smaller ships. Some traffic for South Africa could be included in the first leg, but the logistical purpose would not be to construct a hub-and-spoke system, but rather to join intercontinental services in a manner that enables the full utilisation of the capacities of ships on each segment of routes that otherwise would require multi-porting. Unfortunately, insufficient relay traffic for that purpose exists or is likely to develop in the near future, even if the recent reverse in world trade is not taken into account. Data for 2007 probably provides the best reflection of the maritime trade involved. In Table 3.13, the operational capacity on world sea routes in July 2007 is shown. Less than 1,3% is container traffic to, from or past South Africa while less than 0,4% is potential relay traffic for the route described.
NDoT SA Maritime Transport Sector Study / Part 3/ 27 July 2011 3-34
Table 3.13: Operational capacity on liner trade route services (July 2007)
Trade Route Total no of strings in
trade route
No of vessels
Operational capacity
(TEU)
Eastbound Annualised
capacity (TEU)
Westbound Annualised
capacity (TEU)
Transpacific 81 536 21 670 570 18 204 704 17 873 945 Europe – Far East
34 309 12 373 629 9 745 557 10 969 141
Far East – Mediterranean
46 377 12 034 905 4 988 279 5 771 068
Transatlantic 27 150 3 824 761 3 516 242 3 530 998 Mediterranean – North America
25 176 4 028 920 1 851 263 1 959 689
Australasian trades: Europe 5 50 553 678 273 772 155 965 North America 6 44 539 064 338 483 248 513 North-East & East Asia
9 54 1 335 881 1 241 887 1 264 381
South-East Asia
12 74 1 738 261 1 081 079 1 140 968
East Coast South American: Europe 14 83 2 178 989 1 980 782 2 024 752 North America 10 56 1 205 667 984 938 1 046 889 Asia 7 (5 passing
SA) 61 905 707 803 534 731 232
West Coast South American: Europe 6 38 538 539 425 496 481 867 North America 13 97 1 290 408 710 177 708 989 Asia 8 (1 passing
SA) 68 903 246 917 600 983 593
Trade with SA incl SA as part of Asia trade route: Europe 6 33 622 208 631 940 631 940 North America 2 10 130 089 134 706 5 600 Asia 16 (6
passing SA) 131 2 142 518 977 363 1 007 163
West African: Europe 27 139 2 124 516 938 455 914 472 North America 1 2 2 808 983 - Asia 9 61 654 058 981 556 984 682 Grand totals 2 549 70 798 422 50 728 796 52 435 847 In Table 3.14, the operational capacities of the ships on the sea routes passing South Africa, including the capacities of the ships that called South African ports, are shown.

NDoT SA Maritime Transport Sector Study / Part 3/ 27 July 2011 3-35
Table 3.14: Container shipping services passing and including South Africa, July 2007
Trade Route/Operation
Frequency (Days)
No of vessels
Operational capacity
(TEU)
Eastbound Annualised
capacity (TEU)
Westbound Annualised
capacity (TEU)
East Coast South American: Asia SAX1 7 10 190 029 190 029 95 015 SAX2 7 10 136 197 68 099 136 197 ASAX 7 8 113 864 113 864 102 478 Maruba 7 10 132 193 105 754 118 974 Ushuala Express 35 2 19 089 11 453 3 818
West Coast South American: Asia Ushuala Express 35 2 19 089 3 818 15 271
South African : Asia S.America Service
7 11 158 334 - 39 584
SAS1 7 10 190 029 - 05 015 SAS2 7 10 136 197 68 099 - ASAX 7 8 126 785 - 12 679 Maruba SEAS 7 10 132 193 26 439 13 219 Maruba Ushuala 35 2 19 089 3 818 -
West African: Asia WAF1 8 9 104 284 67 785 72 999 WAF3 10 6 55 279 44 223 44 223 ASAF 7 10 88 130 88 130 83 724 WAX 9 8 75 458 75 458 67 912 AFEX 9 8 82 444 65 955 82 444 WAF10 7 9 129 992 129 992 123 492 FAX 10 6 54 967 27 484 43 974 Grand totals 149 1 963 642 1 090 400 1 151 018 In Table 3.15 and Table 3.16, India’s imports and exports by region in US$ for the periods April-February 2006/2007 are shown.

NDoT SA Maritime Transport Sector Study / Part 3/ 27 July 2011 3-36
Table 3.15: India’s exports by country/region
Name of country Export value of goods (US$ millions) April 2005 – Feb 2006 April 2006 – Feb 2007
Europe 22 315.02 25 721.55 EU Countries 20 722.85 23 765.48 WE Countries 1 459.53 1 700.20 East Europe 132.65 255.87 Africa 4 812.24 7 334.63 Southern Africa 1 738.94 2 445.28 West Africa 1 667.14 2 079.67 Central Africa 143.53 181.11 East Africa 1 262.63 2 628.57 America 19 251.61 21 634.00 North America 16 479.84 17 918.32 Latin America 2 771.77 3 715.68 Asia & Asean 43 769.57 56 186.61 CIS & Baltics 1 101.53 1 313.39 Other 202.56 247.48 Total 91 452.53 112 437.66
Table 3.16: India’s imports by country/region
Name of country Import value of goods (US$ millions) April 2005 – Feb 2006 April 2006 – Feb 2007
Europe 27 448.80 33 183.56 EU Countries 20 894.21 23 973.96 WE Countries 6 274.33 8 891.92 East Europe 280.26 317.68 Africa 3 562.16 10 437.94 Southern Africa 2 343.73 2 688.32 West Africa 995.66 7 522.69 Central Africa 13.09 18.44 East Africa 209.68 208.49 America 10 100.61 15 903.87 North America 7 881.98 10 447.66 Latin America 218.63 5 456.21 Asia & Asean 45 491.99 98 817.03 CIS & Baltics 2 755.00 3 213.81 Other 2 686.64 3 078.77 Total 92 045.20 164 634.98

NDoT SA Maritime Transport Sector Study / Part 3/ 27 July 2011 3-37
Table 3.17 shows the estimated number of TEUs imported and exported in the India-Latin America/Africa trades for the year ended February 2007.
Table 3.17: Estimated number of TEUs exported and imported by India to and from Africa and Latin America for the year ended February 2007
TEUs Exports
India – Africa 107 000 India – Latin America 54 000
Imports Africa – India 152 000 Latin America – India 79 000
Even if the assumption is made that many of the containers shown in Table 3.17 could have moved via South Africa, the volumes are too small to justify the establishment of a relay hub anywhere. Some of the containers in the trade between India and Latin America moved through the Suez Canal while others moved direct or via the hub at Mauritius to and from East Africa, which reduces the volumes shown in the table that moved around the South African coast. Furthermore, most of the containers on the latter route were carried by ships in strings serving the origin and destination ports and an economic consideration of the logistics involved does not favour consolidation at any of the ends of the routes served. Although political goodwill creates great hope for IBSA trades, business realities render any conclusions about the traffic the volume of traffic forthcoming largely speculative. At this stage, it would be premature to project any need for a relay or transhipment hub. A customs free zone for processing goods in the trade between South Africa and India is an industrial prospect that cannot be considered within the scope of this report.

NDoT SA Maritime Transport Sector Study / Part 3/ 27 July 2011 3-38
3.13 Conclusions
Among the conclusions that can be derived from the analysis in this part of the study are:
(i) That the geographic advantages of South African ports do not afford singular advantages for the establishment of a hub providing for the transhipment of containers between intercontinental trunk routes and spokes serving ports in Africa, nor for a relay hub for traffic between the Far East and the East Coast of South America.
(ii) That nevertheless the Port of Ngqura can compete for transhipment traffic for East
Africa from the Far East presently shipped on direct services via Salalah or other hubs on the main East - West routes and feasibly for container traffic for West Africa from the Far East presently transhipped at hubs in the Mediterranean and at Walvis Bay.
(iii) That the vested interests in transhipment at Ngqura as well as the ship and container
handling efficiency, infrastructure and superstructure and the pricing of services would need to conform to those of competing hubs in order to acquire transhipments presently undertaken outside of the South African port range.
(iv) That the Port of Ngqura could also serve as the transhipment hub for South Africa’s
containerised imports and exports provided efficient inland transport and coastal shipping feeder services are established, which would enable economies of scale to be achieved as well as savings in the investment and operating costs at other ports.