Embed Size (px)
Citation preview

Part 4 Financial Statements Department of Health and Human Services
Statement of Comprehensive Income for the Year Ended 30 June 2012 210
Statement of Financial Position as at 30 June 2012 212
Statement of Cash Flows for the Year Ended 30 June 2012 213
Statement of Changes in Equity for the Year Ended 30 June 2012 215
Notes to and Forming Part of the Financial Statements for the Year Ended 30 June 2012 216
Independent Auditor’s Report 313
Statement of Certification 315
Tasmanian Ambulance Service
Statement of Comprehensive Income for the Year Ended 30 June 2012 317
Statement of Financial Position as at 30 June 2012 319
Statement of Changes in Equity for the Year Ended 30 June 2012 320
Notes to and Forming Part of the Financial Statements for the Year Ended 30 June 2012 320
Independent Auditor’s Report 351
Statement of Certification 353
DHHS Annual Report 2011-2012 – Part 4 – Financial Statements Page 209 of 355
Financial Statements Department of Health and Human Services

DHHS Annual Report 2011-2012 - Part 4 - Financial Statements Page 210 of 355
Notes2012
Budget$'000
2012Actual
$'000
2011Actual
$'000
Continuing Operations
Revenue and Other Income from Transactions
Revenue from Government
Appropriation revenue - recurrent 2.9(a) 1 488 161 1 530 234 1 522 158
Appropriation revenue - works and services 2.9(a) 480 9 768 1 336
Other revenue from Government 2.9(a) 0 0 2 995
Revenue from Special Capital Investment Funds 13 249 13 249 9 850
Grants 2.9(b), 8.1 65 000 63 600 59 742
Sales of goods and services 2.9(c), 8.2 175 942 185 868 168 958
Interest 2.9(d) 1 371 770 2 344
Contributions received 2.9(e), 8.3 0 0 90
Other revenue 2.9(f), 8.4 24 445 39 554 29 918
Total Revenue and Other Income from Transactions 1 768 648 1 843 043 1 797 391
Expenses from Transactions
Employee benefits 2.10(a), 9.1 964 094 1 002 020 971 688
Depreciation and amortisation 2.10(b), 9.2 51 857 61 044 59 467
Supplies and consumables 9.3 446 807 462 719 471 341
Grants and subsidies 2.10(c), 9.4 275 588 306 187 234 504
Borrowing costs 2.10(d), 9.5 9 623 9 626 9 913
Other expenses 2.10(f), 9.6 71 230 69 056 78 835
Total Expenses from Transactions 1 819 199 1 910 652 1 825 748
Net Result from Transactions (Net Operating Balance) ( 50 551) ( 67 609) ( 28 357)
Department of Health and Human Services Statement of Comprehensive Income for the Year Ended 30 June 2012
DHHS Annual Report 2011-2012 - Part 4 - Financial Statements Page 211 of 355
Notes2012
Budget$'000
2012Actual
$'000
2011Actual
$'000
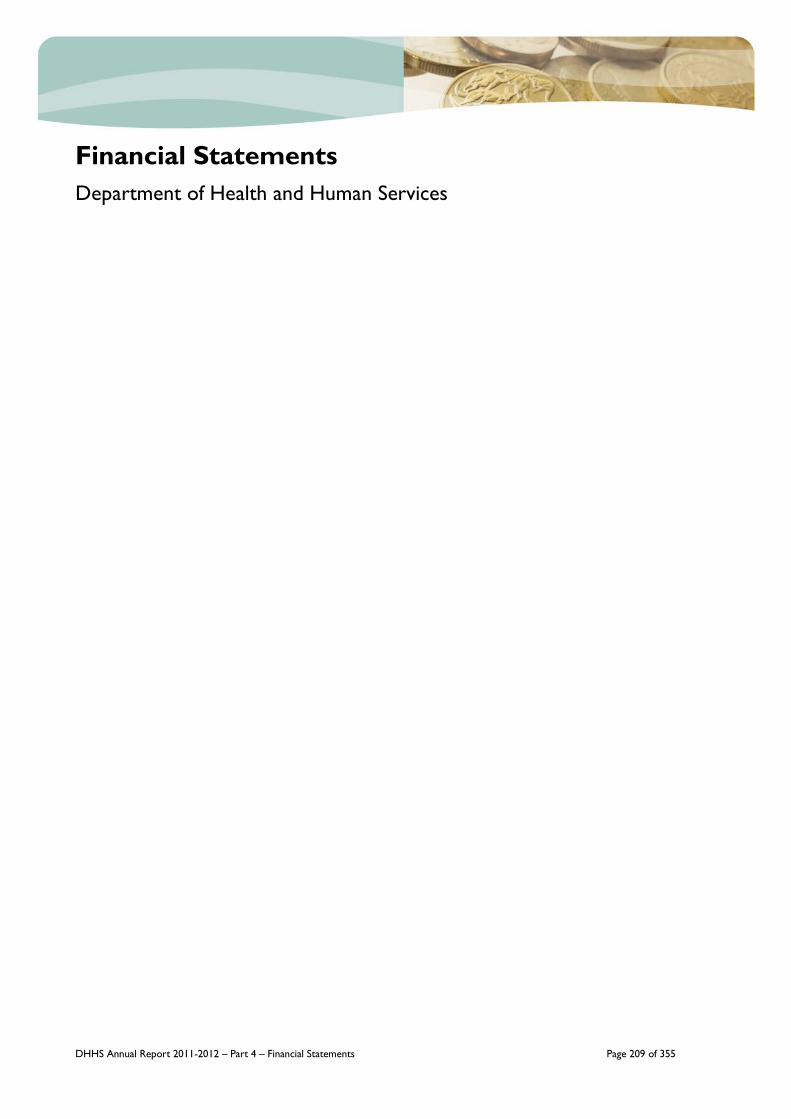
Non-Operational Capital Funding
Revenue from Government
Appropriation revenue - works and services 2.9(a) 112 636 57 673 125 055
Other revenue from Government 2.9(a) 741 367 16 463
Revenue from Special Capital Investment Funds 2.9(a) 95 044 49 678 43 127
Total Non-Operating Capital Funding 208 421 107 718 184 645
Net result from Transactions (Net Operating Balance) 157 870 40 109 156 288
Other Economic Flows Included in Net Result
Net gain/(loss) on non-financial assets 2.11(a)(c), 10.1 9 225 ( 6 783) ( 294)
Net actuarial gains/(losses) of superannuation defined benefit plans 12.4 0 ( 13 921) ( 1 235)
2.12(b), 10.2 0 ( 2 068) ( 910)
Other gains/(losses) from other economic flows 2.12(d), 10.3 0 ( 699) 0
Total Other Economic Flows Included in Net Result 9 225 ( 23 471) ( 2 439)
Net Result from Continuing Operations 167 095 16 638 153 849
Other Economic Flows - Other Non-Owner Changes in Equity
Changes in asset revaluation reserve 14.1 53 436 13 261 226 666
53 436 13 261 226 666
Comprehensive Result 220 531 29 899 380 515
This Statement of Comprehensive Income should be read in conjunction with the accompanying notes. Budget information refers
to original estimates and has not been subject to audit. Explanations of material variances between budget and actual outcomes
are provided in Note 5 of the accompanying notes.
Total Other Economic Flows - Other Non-Owner Changes in Equity
Net gain/(loss) on financial instruments and statutory receivables/payables

DHHS Annual Report 2011-2012 - Part 4 - Financial Statements Page 212 of 355
Notes2012
Budget$'000
2012Actual
$'000
2011Actual
$'000
Assets
Financial Assets
Cash and deposits 2.12(a), 15.1 56 169 85 650 61 035
Receivables 2.12(b), 11.1 23 663 22 783 21 457
Loan advances 2.12(c), 11.2 5 500 4 567 5 855
Equity investments 2.12(d), 11.3 4 059 4 623 3 152
Other financial assets 2.12(e), 11.4 10 095 6 720 10 015
Non-Financial Assets
Inventories 2.12(f), 11.5 13 062 13 832 11 265
Assets held for sale 2.12(g), 11.6 6 839 6 093 8 841
Property, plant and equipment 2.12(h), 11.7 2 991 396 2 898 600 2 867 035
Intangibles 2.12(i), 11.8 11 384 16 399 13 716
Other assets 2.12(j), 11.9 0 5 090 5 377
Total Assets 3 122 167 3 064 357 3 007 748
Liabilities
Payables 2.13(a), 12.1 27 823 38 760 40 431
Interest bearing liabilities 2.13(b), 12.2 209 808 209 808 216 620
Employee benefits 2.13(d), 12.3 217 330 208 492 183 930
Superannuation 2.13(e), 12.4 15 036 29 228 15 645
Other liabilities 2.13(f), 12.5 60 224 43 716 47 255
Total Liabilities 530 221 530 004 503 881
Net Assets 2 591 946 2 534 353 2 503 867
Equity
Contributed capital 6 094 6 094 6 094
Reserves 14.1 1 788 296 1 921 389 1 908 128
Accumulated funds 797 556 606 870 589 645
Total Equity 2 591 946 2 534 353 2 503 867
This Statement of Financial Position should be read in conjunction with the accompanying notes. Budget information refers to original
estimates and has not been subject to audit. Explanations of material variances between budget and actual outcomes are provided in
Note 5 of the accompanying notes.
Department of Health and Human Services Statement of Financial Position as at 30 June 2012

DHHS Annual Report 2011-2012 - Part 4 - Financial Statements Page 213 of 355
Notes2012
Budget$'000
2012Actual
$'000
2011Actual
$'000
Cash Flows from Operating ActivitiesInflows
(Outflows)
Inflows
(Outflows)
Inflows
(Outflows)
Cash Inflows
Appropriation receipts - recurrent 1 488 161 1 530 234 1 519 952
Appropriation receipts - works and services 480 6 980 3 542
13 249 13 249 9 850
Grants 65 000 63 666 60 113
Sales of goods and services 174 518 187 139 165 597
GST receipts 60 061 87 293 87 780
Interest received 1 371 701 2 071
Other cash receipts 28 075 41 306 38 315
Total Cash Inflows 1 830 915 1 930 568 1 887 220
Cash Outflows
Employee benefits ( 855 505) ( 883 839) ( 874 108)
Superannuation ( 86 172) ( 93 307) ( 91 705)
Borrowing costs ( 9 623) ( 9 626) ( 9 913)
GST payments ( 60 060) ( 85 912) ( 90 569)
Grants and transfer payments ( 275 588) ( 260 833) ( 233 987)
Supplies and consumables ( 447 032) ( 469 113) ( 480 365)
Other cash payments ( 70 650) ( 79 467) ( 79 053)
Total Cash Outflows (1 804 630) (1 882 097) (1 859 701)
Net Cash from (Used By) Operating Activities 15.2 26 285 48 471 27 519
Department of Health and Human Services Statement of Cash Flows for the Year Ended 30 June 2012
Receipts from Special Capital Investment Funds

DHHS Annual Report 2011-2012 - Part 4 - Financial Statements Page 214 of 355
Notes2012
Budget$'000
2012Actual
$'000
2011Actual
$'000
Cash Flows from Investing Activities
Cash Inflows
Proceeds from the disposal of non-financial assets 15 640 12 662 17 942
Receipts from non-operational capital funding - Works and services 112 636 60 945 125 472
95 044 50 222 42 583
Receipts from non-operational capital funding - Grants 0 0 0
Repayment of loans by other entities 0 1 167 1 186
Total Cash Inflows 223 320 124 996 187 183
Cash Outflows
Payment for acquisition of non-financial assets ( 238 463) ( 141 479) ( 229 485)
Payments for investments ( 3 400) ( 561) ( 747)
Total Cash Outflows ( 241 863) ( 142 040) ( 230 232)
Net Cash from (Used By) Investing Activities ( 18 543) ( 17 044) ( 43 049)
Cash Flows from Financing Activities
Cash Outflows
Repayment of borrowings ( 6 812) ( 6 812) ( 6 669)
Total Cash Outflows ( 6 812) ( 6 812) ( 6 669)
Net Cash from (Used By) Financing Activities ( 6 812) ( 6 812) ( 6 669)
Net Increase (Decrease) in Cash and Cash Equivalents Held 930 24 615 ( 22 197)
Cash and Deposits at the Beginning of the Reporting Period 55 239 61 035 83 232
Cash and Deposits at the End of the Reporting Period 15.1 56 169 85 650 61 035
Receipts from non-operational capital funding - Special Capital Investment Funds
This Statement of Cash Flows should be read in conjunction with the accompanying notes. Budget information refers to original
estimates and has not been subject to audit. Explanations of material variances between budget and actual outcomes are
provided in Note 5 of the accompanying notes.

DHHS Annual Report 2011-2012 - Part 4 - Financial Statements Page 215 of 355
Contributed Capital
$'000
Reserves $'000
Accumulated
Funds $'000
Total Equity $'000
Balance as at 1 July 2011 6 094 1 908 128 589 645 2 503 867
Adjustment due to prior period error 1 0 0 587 587
Total comprehensive result 0 13 261 16 638 29 899
Balance as at 30 June 2012 6 094 1 921 389 606 870 2 534 353
Contributed Capital
$'000
Reserves $'000
Accumulated
Funds $'000
Total Equity $'000
Balance as at 1 July 2010 6 094 1 681 462 435 728 2 123 285
Adjustment due to prior period error 0 0 65 65
Total comprehensive result 0 226 666 153 852 380 515
Balance as at 30 June 2011 6 094 1 908 128 589 645 2 503 867
This Statement of Changes in Equity should be read in conjunction with the accompanying notes.
Notes:
1 This is a prior period error of $587 000 relating to a correction of Equity Investment recognition.
Department of Health and Human Services Statement of Changes in Equity for the Year Ended 30 June 2012

DHHS Annual Report 2011-2012 - Part 4 - Financial Statements Page 216 of 355
Notes Page No.
Note 1 Administered Financial Statements 219
1.1 Schedule of Administered Income and Expenses 219
1.2 Schedule of Administered Assets and Liabilities 220
1.3 Schedule of Administered Cash Flows 221
1.4 Schedule of Administered Changes in Equity 221
Note 2 Significant Accounting Policies 222
2.1 Objectives and Funding 222
2.2 Basis of Accounting 222
2.3 Reporting Entity 223
2.4 Functional and Presentation Currency 223
2.5 Changes in Accounting Policies 223
2.6 Administered Transactions and Balances 227
2.7 Activities Undertaken Under a Trustee or Agency Relationship 227
2.8 228
2.9 Income from Transactions 228
2.10 Expenses from Transactions 229
2.11 Other Economic Flows Included in Net Result 231
2.12 Assets 232
2.13 Liabilities 234
2.14 Leases 237
2.15 Judgements and Assumptions 237
2.16 Foreign Currency 238
2.17 Comparative Figures 238
2.18 Budget Information 238
2.19 Rounding 238
2.20 Departmental Taxation 238
2.21 Goods and Services Tax 238
Note 3 Agency Output Schedules 239
3.1 Output Group Information 239
3.2 240
3.3 250
3.4 Administered Output Schedule 251
3.5 252
3.6 252
Note 4 Expenditure under Australian Government Funding Arrangements 252
Reconciliation of Total Output Groups Comprehensive Result to Statement of Comprehensive
IncomeReconciliation of Total Output Groups Net Assets to Statement of Financial Position
Reconciliation of Total Administered Output Groups Comprehensive Result to Administered
Statement of Changes in EquityReconciliation of Total Administered Groups' Net Assets to Schedule of Administered Assets and
Liabilities
Notes to and Forming Part of the Financial Statements for the Year Ended 30 June 2012
Transactions by the Government as Owner – Restructuring of Administrative Arrangements

DHHS Annual Report 2011-2012 - Part 4 - Financial Statements Page 217 of 355
Notes Page No.
Note 5 Explanations of Material Variances between Budget and Actual Outcomes 253
5.1 Statement of Comprehensive Income 253
5.2 Statement of Financial Position 255
5.3 Statement of Cash Flows 256
Note 6 Events Occurring After Balance Date 257
Note 7 Underlying Net Operating Balance 259
Note 8 Income from Transactions 260
8.1 Grants 260
8.2 Sales of Goods and Services 261
8.3 Contributions Received 261
8.4 Other Revenue 262
Note 9 Expenses from Transactions 262
9.1 Employee Benefits 262
9.2 Depreciation and Amortisation 263
9.3 Supplies and Consumables 264
9.4 Grants and Subsidies 265
9.5 Borrowing Costs 266
9.6 Other Expenses 266
Note 10 Other Economic Flows Included in Net Result 266
10.1 Net Gain/(Loss) on Non-Financial Assets 266
10.2 Net Gain/(Loss) on Financial Instruments and Statutory Receivables/Payables 266
10.3 Other Gains/(Losses) from Other Economic Flows 267
Note 11 Assets 267
11.1 Receivables 267
11.2 Loan Advances 268
11.3 Equity Investments 268
11.4 Other Financial Assets 268
11.5 Inventories 269
11.6 Assets Held for Sale 269
11.7 Property, Plant and Equipment 270
11.8 Intangibles 273
11.9 Other Assets 274
Note 12 Liabilities 274
12.1 Payables 274
12.2 Interest Bearing Liabilities 275
12.3 Employee Benefits 275
12.4 Superannuation 275
12.5 Other Liabilities 281
Note 13 Commitments and Contingencies 281
13.1 Schedule of Commitments 281
13.2 Contingent Assets and Liabilities 284

DHHS Annual Report 2011-2012 - Part 4 - Financial Statements Page 218 of 355
Notes Page No.
Note 14 Reserves 286
14.1 Reserves 286
Note 15 Cash Flow Reconciliation 286
15.1 Cash and Deposits 286
15.2 Reconciliation of Net Result to Net Cash from Operating Activities 287
15.3 Acquittal of Capital Investment and Special Capital Investment Funds 288
15.4 Financing Facilities 291
Note 16 Financial Instruments 291
16.1 Risk Exposures 291
16.2 Categories of Financial Assets and Liabilities 296
16.3 Reclassifications of Financial Assets 296
16.4 296
16.5 Net Fair Values of Financial Assets and Liabilities 297
Note 17 Details of Consolidated Entities 298
17.1 List of Entities 299
Note 18 Notes to Administered Statements 300
18.1 Explanations of Material Variances Between Budget and Actual Outcomes 300
18.2 Administered Underlying Net Operating Balance 302
18.3 Administered Revenue from Government 303
18.4 Administered Grants 304
18.5 Administered Grants and Subsidies 304
18.6 Administered Receivables 305
18.7 Administered Payables 305
18.8 305
18.9 Financial Instruments (Administered) 306
18.10 Categories of Administered Financial Assets and Liabilities 309
18.11 Comparison Between Carrying Amount and Net Fair Value of Financial Assets and Liabilities 309
18.12 Net Fair Values of Administered Financial Assets and Liabilities 310
Note 19 Transactions and Balances Relating to a Trustee or Agency Arrangement 312
Reconciliation of Administered Net Result to Net Cash from Administered Operating Activities
Comparison Between Carrying Amount and Net Fair Value of Financial Assets and Liabilities

DHHS Annual Report 2011-2012 - Part 4 - Financial Statements Page 219 of 355
Note 1 Administered Financial Statements
1.1 Schedule of Administered Income and Expenses
· Highly Specialised Drugs
· Medical Specialist Outreach Program
· Transitional Care Program
· Extended Aged Care at Home and Community Aged Care Packages and
· Regional Health Services Program.
Notes2012
Budget$'000
2012Actual
$'000
2011Actual
$'000
Administered Revenue and Other Income from Transactions
Revenue from Government
Appropriation revenue - recurrent 2.9(a), 18.3 24 876 34 859 37 550
Grants 2.9(b), 18.4 36 680 45 479 46 133
61 556 80 338 83 683
Administered Expenses from Transactions
Grants and Transfer Payments 2.10(c), 18.5 24 957 35 720 38 734
Transfer to the Consolidated Fund 36 600 46 057 44 020
Total Administered Expenses from Transactions 61 557 81 777 82 754
Total Administered Revenue and Other Income from Transactions
The Agency administers Australian Government revenue collected on behalf of the Consolidated Fund in the form of Commonwealth Recurrent Grants and expenses in relation to Children Abused in Care and Aurora Energy Pensioner Concessions.
Australian Government Recurrent Grants reflect Commonwealth Own Purpose Expenditure (COPE) payments which are paid from the responsible Australian Government Agency to the relevant State Agency and receipted to the Consolidated Fund. Australian Government COPEs in 2011-2012 include:
The Children Abused in Care program is open to people who were abused in State care. The program was scheduled to be completed by 30 June 2011 but some claims remain to be processed.
The Agency provides funding to Aurora Energy for the purpose of providing a subsidy to eligible Tasmanian pensioners and Health Care Card holders on their electricity accounts. In 2010-2011 the Government provided funding of $7.9 million to provide eligible concession holders with a one-off payment of $100 as additional cost of living support for Tasmanian low income households.

DHHS Annual Report 2011-2012 - Part 4 - Financial Statements Page 220 of 355
Notes2012
Budget$'000
2012Actual
$'000
2011Actual
$'000
( 1) ( 1 439) 929
0 0 0
Administered Comprehensive Result ( 1) ( 1 439) 929
1.2 Schedule of Administered Assets and Liabilities
Notes2012
Budget$'000
2012Actual
$'000
2011Actual
$'000
Administered Assets
Administered financial assets
Receivables 2.12(b), 18.6 2 489 3 988 4 446
Total Administered Assets 2 489 3 988 4 446
Administered Liabilities
Payables 2.13(a), 18.7 6 036 8 041 7 059
Total Administered Liabilities 6 036 8 041 7 059
Administered Net Liabilities ( 3 547) ( 4 053) ( 2 614)
Administered Equity
Accumulated Funds ( 3 547) ( 4 053) ( 2 614)
Total Administered Equity ( 3 547) ( 4 053) ( 2 614)
Administered Net Result from Transactions Attributable to the State
Administered other Economic Flows in Administered Net Result
This Schedule of Administered Income and Expenses should be read in conjunction with the accompanying notes. Budget
information refers to original estimates and has not been subject to audit. Explanations of material variances between budget and
actual outcomes are provided in Note 18.1 of the accompanying notes.
This Schedule of Administered Assets and Liabilities should be read in conjunction with the accompanying notes. Budget
information refers to original estimates and has not been subject to audit. Explanations of material variances between budget and
actual outcomes are provided in Note 18.1 of the accompanying notes.

DHHS Annual Report 2011-2012 - Part 4 - Financial Statements Page 221 of 355
1.3 Schedule of Administered Cash Flows
Notes2012
Budget$'000
2012Actual
$'000
2011Actual
$'000
Administered Cash Flows from Operating Activities
Administered Cash Inflows
Appropriation receipts - recurrent 24 876 34 859 37 550
Grants - Continuing operations 36 600 46 057 44 020
Total Administered Cash Inflows 61 476 80 916 81 570
Administered Cash Outflows
Grants and transfer payments ( 24 876) ( 34 859) ( 37 550)
Transfers to the Consolidated Fund ( 36 600) ( 46 057) ( 44 020)
Total Administered Cash Outflows ( 61 476) ( 80 916) ( 81 570)
Administered Net Cash from (Used By) Operating Activities 18.8 0 0 0
Net Increase (Decrease) in Administered Cash Held 0 0 0
0 0 0
0 0 0
1.4 Schedule of Administered Changes in Equity
Accumulated
Deficit $'000
Total Equity $'000
Balance as at 1 July 2011 ( 2 614) ( 2 614)
Total comprehensive result ( 1 439) ( 1 439)
Balance as at 30 June 2012 ( 4 053) ( 4 053)
Accumulated
Deficit$'000
Total Equity $'000
Balance as at 1 July 2010 ( 3 543) ( 3 543)
Total comprehensive result 929 929
Balance as at 30 June 2011 ( 2 614) ( 2 614)
Administered Cash and Deposits at the Beginning of the Reporting Period
Administered Cash and Deposits at the End of the Reporting Period
This Schedule of Administered Cash Flows should be read in conjunction with the accompanying notes. Budget information
refers to original estimates and has not been subject to audit. Explanations of material variances between budget and actual
outcomes are provided in Note 18.1 of the accompanying notes.
This Schedule of Administered Changes in Equity should be read in conjunction with the accompanying notes.
DHHS Annual Report 2011-2012 - Part 4 - Financial Statements Page 222 of 355
Note 2 Significant Accounting Policies
2.1 Objectives and Funding
2.2 Basis of Accounting
·
·
The Financial Statements have been prepared on an accrual basis and, except where stated, are in accordance with the historical cost convention. The accounting policies are generally consistent with the previous year except for those changes outlined in Note 2.5.
Compliance with the Australian Accounting Standards (AAS) may not result in compliance with International Financial Reporting Standards (IFRS), as the AAS include requirements and options available to not-for-profit organisations that are inconsistent with IFRS. The Agency is considered to be not-for-profit and has adopted some accounting policies under the AAS that do not comply with IFRS.
The Financial Statements were signed by the Secretary on 15 August 2012 and were resigned on 27 September 2012.
the Treasurer’s Instructions issued under the provisions of the Financial Management and Audit Act 1990.
The Financial Statements are a general purpose financial report and have been prepared in accordance with:
Australian Accounting Standards and Interpretations issued by the Australian Accounting Standards Board and
The Agency is structured to meet the following outcomes: healthier individuals, stronger families, stronger healthier communities and healthier organisations. Agency activities are classified as either controlled or administered.
Controlled activities involve the use of assets, liabilities, revenues and expenses controlled or incurred by the Agency in its own right. Administered activities involve the management or oversight by the Agency, on behalf of the Government, of items controlled or incurred by the Government.
The Agency is predominantly funded through Parliamentary appropriations. In addition, it provides services to fee paying privately insured patients, or patients who will receive compensation for these expenses due to the circumstances surrounding their injury. It derives rental revenue and asset sale income from Housing Tasmania properties and receives income from borrowers in the Home Ownership Assistance Program (HOAP). The financial report encompasses all funds through which the Agency controls resources to carry on its functions.
The Department of Health and Human Services' (the Agency) objective is to improve the health and wellbeing of Tasmanians.

DHHS Annual Report 2011-2012 - Part 4 - Financial Statements Page 223 of 355
2.3 Reporting Entity
2.4 Functional and Presentation Currency
2.5 Changes in Accounting Policies
(a) Impact of New and Revised Accounting Standards
·
·
·
These Financial Statements are presented in Australian dollars, which is the Agency's functional currency.
The Financial Statements include all the controlled activities of the Agency, including Housing Tasmania and Ambulance Tasmania, with the exception of Tasmanian Affordable Housing Limited (TAHL). The Financial Statements consolidate material transactions and balances of the Agency and entities included in its output groups. Material transactions and balances between the Agency and such entities have been eliminated. Summary information relating to TAHL is disclosed in Note 17 - Details of Consolidated Entities.
The Financial Statements have been prepared as a going concern. The continued existence of the Agency, undertaking its current activities, is dependent on Government policy and on continuing appropriations by Parliament for the Agency’s administration and activities. National Health Reform was implemented in Tasmania from 1 July 2012 with the establishment of three Tasmanian Health Organisations (THOs) under the Tasmanian Health Organisations Act 2011 . The THOs replace the Area Health Services previously managed directly by the Agency. Please refer to Note 6 for further details.
AASB 2010-4 Further Amendments to Australian Accounting Standards arising from the Annual Improvements Project (AASBs 1, 7, 101, and 134 and Interpretation 13) – This Standard amends a range of Australian Accounting Standards and Interpretation as a consequence of the annual improvements project.
AASB 1054 Australian Additional Disclosures – This Standard in conjunction with AASB 2011-1 Amendments to AAS arising from the Trans Tasman Convergence Project, removes disclosure
requirements form other Standards and incorporates them in a single Standard to achieve convergence between Australian and New Zealand Accounting Standards. There is no financial impact.
AASB 2009-12 Amendments to Australian Accounting Standards (AASBs 5, 8, 108, 110, 112, 119, 133, 137, 139, 1023 and 1031 and Interpretations 2, 4, 16, 1039 and 1052) – This Standard makes editorial amendments to a range of Australian Accounting Standards and Interpretations. There is no financial impact.
In the current year, the Agency has adopted all of the new and revised Standards and Interpretations issued by the Australian Accounting Standards Board (AASB) that are relevant to its operations and effective for the current annual reporting period. These include:
DHHS Annual Report 2011-2012 - Part 4 - Financial Statements Page 224 of 355
·
·
·
·
·
·
(b) Impact of New and Revised Accounting Standards Yet to be Applied
·
The amendments to AASB 101 clarify the presentation of the Statements of Changes in Equity. The disaggregation of other comprehensive income reconciling the carrying amount at the beginning and the end of the period for each component of equity is no longer required. There is no financial impact.
The amendments to AASB 7 clarify financial instrument disclosures in relation to credit risk. The carrying amount of financial assets that would otherwise be past due or impaired, whose terms have been renegotiated, is no longer required to be disclosed. There is no financial impact.
AASB 2010-5 Amendments to Australian Accounting Standards (AASBs 1, 3, 4, 5, 101, 107, 112, 118, 119, 121, 132, 133, 134, 137, 139, 140, 1023 and 1038 and Interpretations 112, 115, 127, 132 and 1042) – This Standard makes editorial amendments to a range of Australian Accounting Standards. There is no financial impact.
AASB 2010-6 Amendments to Australian Accounting Standards – Disclosures on Transfers of Financial Assets (AASBs 1 and 7) – This Standard introduces additional disclosure relating to transfers of financial assets in AASB 7. An entity shall disclose all transferred financial assets that are not derecognised and any continuing involvement in a transferred asset, existing at the reporting date, irrespective of when the related transfer transaction occurred. There is no financial impact.
AASB 2011-1 Amendments to Australian Accounting Standards arising from the Trans Tasman Convergence Project (AASBs 1, 5, 101, 107,108, 121, 128, 132 and 134 and Interpretations 2, 112 and 113) - this Standard, in conjunction with AASB 1054, removes disclosure requirements from other Standard and incorporates them in a single Standards to achieve convergence between Australian and New Zealand Accounting Standards. There is no financial impact.
AASB 2011-15 Amendments to Australian Accounting Standards – Extending Relief from Consolidation, the Equity Method and Proportionate Consolidation (AASBs 127, 128 and 131) - t his Standard extends the relief from consolidation, the equity method and proportionate consolidation by removing the requirement for the consolidated financial statements prepared by the ultimate or any intermediate parent entity to be IFRS compliant, provided that the parent entity, investor or venturer and the ultimate or intermediate parent entity are not-for-profit non-reporting entities that comply with Australian Accounting Standards. There is no financial impact.
AASB 9 Financial Instruments – This Standard supersedes AASB 139 Financial Instruments: Recognition and Measurement, introducing a number of changes to accounting treatments. The Standard was reissued in December 2010. The Agency has not yet determined the potential financial impact of the standard.
The following applicable Standards have been issued by the AASB and are yet to be applied:

DHHS Annual Report 2011-2012 - Part 4 - Financial Statements Page 225 of 355
·
·
·
·
·
·
·
·
·
AASB 11 Joint Arrangements – This Standard supersedes AASB 131 Interest in Joint Ventures, introducing a number of changes to accounting treatments. The Standard was issued in August 2011. The Agency has not yet determined the application or the potential impact of the Standard.
AASB 12 Disclosure of Interests in Other Entities - This Standard supersedes disclosure requirements under AASB 127 Consolidated and Separate Financial Statements and AASB 131 Interests in Joint Ventures. The Standard was issue in August 2011. The Agency has not yet determined the application or the potential impact of the Standard.
AASB 13 Fair Value Measurement – This Standard defines fair value, sets out a framework for measuring fair value and requires disclosures about fair value measurements. There is no financial impact.
AASB 119 Employee Benefits – This Standard supersedes AASB 119 Employee Benefits introducing a number of changes to accounting treatments. The Standard was issued in September 2011. The Agency has not yet determined the application or the potential impact of the Standard.
AASB 127 Separate Financial Statements – This standard supersedes requirements under AASB 127 Consolidated and Separate Financial Statements introducing a number of changes to accounting treatments. The Standard was issue in August 2011. The Agency has not yet determined the application or the potential impact of the Standard.
AASB 128 Investments in Associates and Joint Ventures – This Standard supersedes AASB 128 Investments in Associates and introduces a number of changes to accounting treatments. The Standard
was issued in August 2011. The Agency has not yet determined the application or the potential impact
of the Standard.
AASB 1053 Application of Tiers of Australian Accounting Standards – This Standard establishes a differential financial reporting framework consisting of two tiers of reporting requirements for preparing general purpose financial statements. The Standard does not have any financial impact on the Agency. However, it may affect disclosures if reduced disclosure requirements apply.
AASB 2010-2 Amendments to Australian Accounting Standards Arising from Reduced Disclosure Requirements (AASBs 1, 2, 3, 5, 7, 8, 101, 102, 107, 108, 110, 111, 112, 116, 117, 119, 121, 123, 124, 127, 128, 131, 133, 134, 136, 137, 138, 140, 141, 1050, and 1052 and Interpretations 2, 4, 5, 15, 17, 127, 129, and 1052) – This Standard makes amendments to Australian accounting Standards and
Interpretations to introduce reduced disclosure requirements for certain types of entities. There is no financial impact.
AASB 10 Consolidated Financial Statements – This Standard supersedes requirements under AASB 127 Consolidated and Separate Financial Statements and Interpretation 112 Consolidation – Special Purpose Entities , introducing a number of changes to accounting treatments. The standard was issued in August 2011. The Agency has not yet determined the application or the potential impact of the Standard.

DHHS Annual Report 2011-2012 - Part 4 - Financial Statements Page 226 of 355
·
·
·
·
·
·
AASB 2011-8 Amendments to Australian Accounting Standards arising from AASB 13 [AASBs 1, 2, 3, 4, 5, 7, 9, 2009-11, 2010-7, 101, 102, 108, 110, 116, 117, 118, 119, 120, 121, 128, 131, 132, 133, 134, 136,
138, 139, 140, 141, 1004, 1023 and1038 and Interpretations 2, 4, 12, 13, 14, 17, 19, 131 and 132] – This Standard replaces the existing definition of fair value guidance in other Australian Accounting
Standards and Interpretations as the result of issuing AASB 13 in September 2011. There is no expected financial impact.
AASB 2011-9 Amendments to Australian Accounting Standards – Presentation of Items of Other Comprehensive Income [AASBs 1, 5, 7, 101, 112, 120, 121, 132, 133, 134, 1039 and 1049] – This Standard requires to group items presented in other comprehensive income on the basis of whether they are potentially reclassifiable to profit or loss subsequently (reclassification adjustments). It is not expected to have a financial impact.
AASB 2011-6 Amendments to Australian Accounting Standards – Extending Relief from Consolidation, the Equity Method and Proportionate Consolidation – Reduced Disclosure Requirements (AASBs 127, 128 and 131) – This Standard extends relief from consolidation, the equity method and proportionate consolidation by removing the requirement for the consolidated financial statements prepared by the ultimate or any intermediate parent entity to be IFRS compliant, provided that the parent entity, investor or venturer and the ultimate or intermediate parent entity comply with Australian Accounting Standards or Australian Accounting Standards – Reduced Disclosure Requirements. It is not expected to have a financial impact.
AASB 2011-7 Amendments to Australian Accounting Standards arising from the Consolidation and Joint Arrangements Standards (AASBs 1, 2, 3, 5, 7, 9, 2009 11, 101, 107, 112, 118, 121, 124, 132, 133, 136, 138, 139, 1023 and 1038 and Interpretations 5, 9, 16 and 17) – This Standard replaces the existing definition and fair value guidance in other Australian Accounting Standards and Interpretations as the result of issuing AASB 13 in September 2011. It is not expected to have a financial impact.
AASB 2010-7 Amendments to Australian Accounting Standards arising from AASB 9 (December 2010) (AASBs 1, 3, 4, 5, 7, 101, 102, 108, 112, 118, 120, 121, 127, 128, 131, 132, 136, 137, 139, 1023 and 1038 and Interpretations 2, 5, 10, 12, 19, and 127) – This Standard makes consequential amendments to other Australian Accounting Standards and Interpretations as a result of issuing AASB in December 2010. It is not anticipated that there will be any financial impact.
AASB 2011-2 Amendments to Australian Accounting Standards arising from the Trans Tasman Convergence Project – Reduced Disclosure Requirements (AASBs 101 and 1054) – This Standard makes amendments to
introduce reduced disclosure requirements for certain types of entities. There is no expected financial impact of applying these changes, as the Agency is a Tier 1 entity.

DHHS Annual Report 2011-2012 - Part 4 - Financial Statements Page 227 of 355
·
·
(c) Voluntary Changes in Accounting Policy
2.6 Administered Transactions and Balances
2.7 Activities Undertaken Under a Trustee or Agency Relationship
AASB 2011-10 Amendments to Australian Accounting Standards arising from AASB 119 (September 2011) (AASBs 1, 8, 101, 124, 134, 1049 and 2011 8 and Interpretations 14) – This Standard makes amendments to other Australian Accounting Standards and Interpretation as a result of issuing AASB 119 Employee Benefits in September 2011. It is not expected to have a financial impact.
AASB 2011-12 Amendments to Australian Accounting Standards 119 (September 2011) arising from Reduced Disclosure Requirements – This Standard gives effect to Australian Accounting Standards – Reduced Disclosure Requirements for AASB 119 (September 2011). There is no financial impact.
The Agency has not adopted any new accounting policies during the financial year ended 30 June 2012.
The Agency administers, but does not control, certain resources on behalf of the Government as a whole. It is accountable for the transactions involving such administered resources, but does not have the discretion to deploy resources for the achievement of the Agency’s objectives.
Administered assets, liabilities, expenses and revenues are disclosed in Note 1 to the Financial
Transactions relating to activities undertaken by the Agency in a trust or fiduciary (agency) capacity do not form part of the Agency’s activities. Trustee and agency arrangements, and transactions/balances relating to those activities, are neither controlled nor administered.
Fees, commissions earned and expenses incurred in the course of rendering services as a trustee or through an agency arrangement are recognised as controlled transactions.

DHHS Annual Report 2011-2012 - Part 4 - Financial Statements Page 228 of 355
2.9 Income from Transactions
(a) Revenue from Government
(b) Grants
(c) Sales of Goods and Services
(d) Interest
Interest on funds invested is recognised as it accrues using the effective interest rate method.
Amounts earned in exchange for the provision of goods are recognised when the significant risks and rewards of ownership have been transferred to the buyer. Revenue from the provision of services is recognised in proportion to the stage of completion of the transaction at the reporting date. The stage of completion is assessed by reference to surveys of work performed.
Non-reciprocal grants are recognised as revenue when the grant is received or receivable. Conditional grants may be reciprocal or non-reciprocal depending on the terms of the grant.
Grants payable by the Australian Government are recognised as revenue when the Agency gains control of the underlying assets. Where grants are reciprocal, revenue is recognised as performance occurs under the grant.
Appropriations, whether recurrent or capital, are recognised as revenues in the period in which the Agency gains control of the appropriated funds. Except for any amounts identified as carried forward in Note 18.3, control arises in the period of appropriation.
Income is recognised in the Statement of Comprehensive Income when an increase in future economic benefits related to an increase in an asset or a decrease of a liability has arisen that can be measured reliably.
Net assets received under a restructuring of administrative arrangements are designated as contributions by owners and adjusted directly against equity. Net assets relinquished are designated as distributions to owners. Net assets transferred are initially recognised at the amounts at which they were recognised by the transferring agency immediately prior to the transfer. There were no assets received or relinquished during the year.
2.8 Transactions by the Government as Owner – Restructuring of Administrative Arrangements

DHHS Annual Report 2011-2012 - Part 4 - Financial Statements Page 229 of 355
(e) Contributions Received
(f) Other Revenue
2.10 Expenses from Transactions
(a) Employee Benefits
(b) Depreciation and Amortisation
Vehicles 5 years
Plant and equipment 2-20 years
Medical equipment 4-20 years
Buildings 40-50 years
Employee benefits include, where applicable, entitlements to wages and salaries, annual leave, sick leave, long service leave, superannuation and any other post-employment benefits.
Expenses are recognised in the Statement of Comprehensive Income when a decrease in future economic benefits related to a decrease in an asset or an increase of a liability has arisen that can be measured reliably.
Other revenue is primarily the recovery of costs incurred and is recognised when an increase in future economic benefits relating to an increase in an asset or a decrease of a liability has arisen that can be reliably measured.
Contributions of assets at no cost of acquisition or for nominal consideration are recognised at their fair value when the Agency obtains control of the asset, it is probable that future economic benefits comprising the contribution will flow to the Agency and the amount can be measured reliably. However, where the contribution received is from another government agency as a consequence of restructuring of administrative arrangements, where they are recognised as contributions by owners directly within equity. In these circumstances, book values from the transferor agency have been used.
Services received free of charge by the Agency, are recognised as income when a fair value can be reliably determined and at the time the services would have been purchased if they had not been donated. Use of those resources is recognised as an expense.
All applicable non-financial assets having a limited useful life are systematically depreciated over their useful lives in a manner which reflects the consumption of their service potential. Land, being an asset with an unlimited useful life, is not depreciated.
Depreciation is provided for on a straight line basis, using rates which are reviewed annually. Major depreciation periods are:

DHHS Annual Report 2011-2012 - Part 4 - Financial Statements Page 230 of 355
Software 3-5 years
Long-Term Community Housing Program Grant 11 years
(c) Grants and Subsidies
·
·
(d) Borrowing Costs
·
·
·
·
·
(e) Contributions Provided
(f) Other Expenses
Borrowing costs include:
interest on bank overdrafts and short-term and long-term borrowings
unwinding of discounting provisions
Other expenses are recognised when a decrease in future economic benefits related to a decrease in an asset or an increase of a liability has arisen that can be reliably measured.
amortisation of discounts or premiums related to borrowings
amortisation of ancillary costs incurred in connection with the arrangement of borrowings and
finance lease charges.
Contributions provided free of charge by the Agency, to another entity, are recognised as an expense when fair value can be reliably determined. No contributions were provided free of charge during 2011-2012.
Depreciation of Housing Tasmania’s rental dwellings and community rental stock is based on a useful life of 50 years in accordance with the State Housing Authority’s Accounting Policies and Reporting Framework (March 1995). All other buildings are depreciated over their remaining useful life.
All intangible assets having a limited useful life are systematically amortised over their useful lives reflecting the pattern in which the asset’s future economic benefits are expected to be consumed by the Agency.Major amortisation periods are:
Grant and Subsidies expenditure is recognised to the extent that:
the services required to be performed by the grantee have been performed or
the grant eligibility criteria have been satisfied.
A liability is recorded when the Agency has a binding agreement to make the grants but services have not been performed or criteria satisfied. Where grant monies are paid in advance of performance or eligibility, a prepayment is recognised.
All borrowing costs are expensed as incurred using the effective interest method.
DHHS Annual Report 2011-2012 - Part 4 - Financial Statements Page 231 of 355
2.11 Other Economic Flows Included in Net Result
(a) Gain/(Loss) on Sale of Non-Financial Assets
(b) Impairment – Financial Assets
(c) Impairment – Non-Financial Assets
All impairment losses are recognised in the Statement of Comprehensive Income.
In respect of other assets, impairment losses recognised in prior periods are assessed at each reporting date for any indications that the loss has decreased or no longer exists. An impairment loss is reversed if there has been a change in the estimates used to determine the recoverable amount. An impairment loss is reversed only to the extend that the asset’s carrying amount does not exceed the carrying amount that would have been determined, net of depreciation or amortisation, if no impairment loss had been recognised.
Other economic flows measure the change in volume or value of assets or liabilities that do not result from transactions.
Gains or losses from the sale of non-financial assets are recognised when control of the assets has passed to the buyer.
Financial assets are assessed at each reporting date to determine whether there is any objective evidence that there are any financial assets that are impaired. A financial asset is considered to be impaired if objective evidence indicates that one or more events have had a negative effect on the estimated future cash flows of that asset.
An impairment loss, in respect of a financial asset measured at amortised cost, is calculated as the difference between its carrying amount, and the present value of the estimated future cash flows discounted at the original effective interest rate.
All impairment losses are recognised in the Statement of Comprehensive Income.
An impairment loss is reversed if the reversal can be related objectively to an event occurring after the impairment loss was recognised. For financial assets measured at amortised cost the reversal is recognised in the Statement of Comprehensive Income.
All non-financial assets are assessed to determine whether any impairment exists. Impairment exists when the recoverable amount of an asset is less than its carrying amount. Recoverable amount is the
higher of fair value less costs to sell and value in use. The Agency’s assets are not used for the purpose
of generating cash flows; therefore value in use is based on depreciated replacement cost where the asset would be replaced if deprived of it.

DHHS Annual Report 2011-2012 - Part 4 - Financial Statements Page 232 of 355
(d) Other Gains/(Losses) From Other Economic Flows
2.12 Assets
(a) Cash and Deposits
(b) Receivables
(c) Loan Advances
(d) Equity Investments
(e) Other Financial Assets
(f) Inventories
Other gains/(losses) from other economic flows includes gains or losses from reclassifications of amounts from reserves and/or accumulated surplus to net result, and from the revaluation of the present values of
the long service leave liability due to changes in the bond interest rate.
Assets are recognised in the Statement of Financial Position when it is probable that the future economic benefits will flow to the Agency and the asset has a cost or value that can be measured reliably.
Cash means notes, coins, any deposits held at call with a bank or financial institution, as well as funds held in the Special Deposits and Trust Fund, being short-term of three months or less and highly liquid. Deposits are recognised at amortised cost, being their face value.
Receivables are recognised at amortised cost, less any impairment losses, however, due to the short settlement period, receivables are not discounted back to their present value.
Loan advances are borrowings provided to clients for the purchase of homes and are recognised at the balance of the outstanding principal less any impairment losses.
Equity investments are recorded at fair value with any changes in the fair value being recorded as income or expenses in the Statement of Comprehensive Income. Equity investments are not depreciated.
Other financial assets are recorded at fair value.
Inventories held for distribution are valued at cost adjusted, when applicable, for any loss of service potential. Inventories acquired for no cost or nominal consideration are valued at current replacement cost. Inventories held for resale are valued at cost.

DHHS Annual Report 2011-2012 - Part 4 - Financial Statements Page 233 of 355
(g) Assets Held for Sale
(h) Property, Plant, Equipment and Infrastructure
The cost of replacing part of an item of property, plant and equipment is recognised in the carrying amount of the item if it is probable that the future economic benefits embodied within the part will flow to the Agency and its costs can be measured reliably. The carrying amount of the replaced part is derecognised. The costs of day-to-day servicing of property, plant and equipment are recognised in the Statement of Comprehensive Income as incurred.
(iii) Asset Recognition Threshold
The asset capitalisation threshold for tangible assets adopted by the Agency is $10 000. Assets valued at less than $10 000 (or $50 000 for intangible assets) are charged to the Statement of Comprehensive Income in the year of purchase (other than where they form part of a group of similar items which are material in total).
Cost includes expenditure that is directly attributable to the acquisition of the asset. The costs of self‑constructed assets includes the cost of materials and direct labour, any other costs directly attributable to bringing the asset to a working condition for its intended use, and the costs of dismantling and removing the items and restoring the site on which they are located. Purchased software that is integral to the functionality of the related equipment is capitalised as part of that equipment.
When parts of an item of property, plant and equipment have different useful lives, they are accounted for as separate items (major components) of property, plant and equipment.
(ii) Subsequent Costs
Assets held for sale (or disposal groups comprising assets and liabilities) that are expected to be recovered primarily through sale rather than continuing use are classified as held for sale. Immediately before classification as held for sale, the assets (or components of a disposal group) are remeasured in accordance with the Agency’s accounting policies. Thereafter the assets (or disposal group) are measured at the lower of carrying amount and fair value less costs to sell.
(i) Valuation Basis
Land, buildings, infrastructure, heritage and cultural assets and other long-lived assets are recorded at fair value less accumulated depreciation. All other non-current physical assets, including work in progress, are recorded at historic cost less accumulated depreciation and accumulated impairment losses.
DHHS Annual Report 2011-2012 - Part 4 - Financial Statements Page 234 of 355
(i) Intangibles
·
·
(j) Other Assets
Other assets are recorded at fair value and include prepayments.
2.13 Liabilities
(a) Payables
Intangible assets held by the Agency are valued at fair value less any subsequent accumulated amortisation and any subsequent accumulated impairment losses where an active market exists. Where no active market exists, intangible assets held by the Agency are valued at cost less any subsequent accumulated amortisation and any subsequent accumulated impairment losses. The asset capitalisation threshold for intangible assets adopted by the Agency is $50 000.
it is probable that an expected future benefit attributable to the asset will flow to the Agency and
the cost of the asset can be reliably measured.
(iv) Revaluations
The Agency’s land and building assets (excluding Housing Tasmania’s rental properties) were revalued independently by Opteon Pty Ltd (formally known as Brothers and Newton Pty Ltd) as at 30 June 2012 using adjustment indices based on Australian Bureau of Statistics statistical data, Real Estate Institute of Tasmania median house price data, Rawlinsons Index of Construction cost estimates and own sourced research data from the Land Information Systems Tasmania database. Housing Tasmania land and
building assets are revalued annually as at 31 October using a mix of onsite revaluations and suburb based indices adjustments. These annual revaluations are provided by the Valuer-General of Tasmania.
An intangible asset is recognised where:
Liabilities are recognised in the Statement of Financial Position when it is probable that an outflow of resources embodying economic benefits will result from the settlement of a present obligation and the amount at which the settlement will take place can be measured reliably.
Payables, including goods received and services incurred but not yet invoiced, are recognised at amortised cost, which due to the short settlement period, equates to face value, when the Agency becomes obliged to make future payments as a result of a purchase of assets or services.

DHHS Annual Report 2011-2012 - Part 4 - Financial Statements Page 235 of 355
(b) Interest Bearing Liabilities
(c) Provisions
(d) Employee Benefits
(e) Superannuation
A defined contribution plan is a post-employment benefit plan under which an entity pays fixed contributions into a separate entity and will have no legal or constructive obligation to pay further amounts. Obligations for contributions to defined contribution plans are recognised as an expense when they fall due.
Bank loans and other loans are initially measured at fair value, net of transaction costs. Bank loans and other loans are subsequently measured at amortised cost using the effective interest rate method, with interest expense recognised on an effective yield basis.
Liabilities for wages and salaries and annual leave are recognised when an employee becomes entitled to receive a benefit. Those liabilities expected to be realised within 12 months are measured at the amount expected to be paid. Other employee entitlements are measured as the present value of the benefit at 30 June 2012, where the impact of discounting is material, and at the amount expected to be paid if discounting is not material.
A liability for long service leave is recognised, and is measured as the present value of expected future payments to be made in respect of services provided by employees up to the reporting date.
(i) Defined Contribution Plans
The effective interest rate method is a method of calculating the amortised cost of a financial liability and allocating interest expense over the relevant period. The effective interest rate is the rate that exactly discounts estimated future cash payments through the expected life of the financial liability, or where appropriate, a shorter period.
A provision arises if, as a result of a past event, the Agency has a present legal or constructive obligation that can be estimated reliably, and it is probable that an outflow of economic benefits will be required to settle the obligation. Provisions are determined by discounting the expected future cash flows at a rate that reflects current market assessments of the time value of money and the risks specific to the liability. Any right to reimbursement relating to some or all of the provision is recognised as an asset when it is virtually certain that the reimbursement will be received.

DHHS Annual Report 2011-2012 - Part 4 - Financial Statements Page 236 of 355
(f) Other Liabilities
(ii) Defined Benefit PlansA defined benefit plan is a post‑employment benefit plan other than a defined contribution plan.
The Agency makes contributions in respect of certain employees of Ambulance Tasmania to the Tasmanian Ambulance Service Superannuation Scheme being a defined benefit scheme where members receive lump sum benefits on resignation, retirement, death or invalidity. The scheme is closed to new
members. The Agency’s superannuation obligations in respect of this scheme are recognised at the latest actuarial assessment of the member’s entitlements, net of scheme assets. Actuarial gains and losses in respect of this scheme are recognised in the Statement of Comprehensive Income.
With the exception noted below, the Director of Housing does not recognise a liability for the accruing superannuation benefits of Service employees. This liability is held centrally and is recognised within the Finance‑General Division of the Department of Treasury and Finance.
The Director of Housing’s superannuation obligations, in respect of the contributory service of current and past government employees, are recognised at the latest actuarial assessment of the members’
entitlements, net of scheme assets. The valuation is determined by discounting to present value, the gross
benefit payments at a current, market-determined, risk-adjusted discount rate appropriate to the respective plan.
Actuarial gains or losses arising from the actuarial revaluation of superannuation liabilities are recognised in the Statement of Comprehensive Income.
Other liabilities and other financial liabilities are recognised in the Statement of Financial Position when it is probable that an outflow of resources embodying economic benefits will result from the settlement of
a present obligation and the amount at which the settlement will take place can be measured reliably. Other liabilities include revenue received in advance and on costs associated with employee benefits. As
a consequence of the Treasurer's decision to cease levying payroll tax on agencies from 1 October 2012, other liabilities no longer includes a component relating to a provision for payroll tax associated with
employee leave entitlement provisions. Revenue received in advance is measured at amortised cost. On-costs associated with employee benefits expected to be realised within 12 months are measured at the amount expected to be paid. Other on-costs associated with employee benefits are measured at the present value of the cost at 30 June 2012, where the impact of discounting is material, and at the amount expected to be paid if discounting is not material.

DHHS Annual Report 2011-2012 - Part 4 - Financial Statements Page 237 of 355
2.14 Leases
2.15 Judgements and Assumptions
Judgements made by the Agency that have significant effects on the Financial Statements are disclosed in the relevant notes to the Financial Statements. In particular, information about significant areas of estimation, uncertainty and critical judgements in applying accounting policies that have the most significant effect on the amounts recognised in the financial statements are described in the following notes:
· 2.12(h) and 11.7(a) Property, Plant Equipment and Infrastructure and
· 2.10(b) Depreciation and Amortisation
· 2.13(e) and 12.4 Superannuation.
These judgements relate to adoption of the recommendations by the valuer, Opteon Pty Ltd, in respect of land and building valuations and the Valuer-General for valuation of the Housing Tasmania rental properties and the recommendations of the State Actuary in respect of the Superannuation liabilities.
The Treasurer has announced the policy decision to cease levying payroll tax on agencies from 1 October 2012. This decision has been factored into the calculation of employee entitlement provisions and the associated on cost liabilities as at 30 June have been stated, exclusive of payroll tax.
The Agency has entered into a number of operating lease agreements for property, plant and equipment, where the lessors effectively retain all the risks and benefits incidental to ownership of the items leased. Equal instalments of lease payments are charged to the Statement of Comprehensive Income over the lease term, as this is representative of the pattern of benefits to be derived from the leased property.
The Agency is prohibited by Treasurer’s Instruction 502 Leases from holding finance leases.
In the application of Australian Accounting Standards, the Agency is required to make judgements, estimates and assumptions about carrying values of assets and liabilities that are not readily apparent from other sources. The estimates and associated assumptions are based on historical experience and various other factors that are believed to be reasonable under the circumstances, the results of which form the basis of making the judgements. Actual results may differ from these estimates.
The estimates and underlying assumptions are reviewed on an ongoing basis. Revisions to accounting estimates are recognised in the period in which the estimate is revised if the revision affects only that period or in the period of the revision and future periods if the revision affects both current and future periods.
The Agency has made no other judgements or assumptions that may cause a material adjustment to the carrying amounts of assets and liabilities.

DHHS Annual Report 2011-2012 - Part 4 - Financial Statements Page 238 of 355
2.16 Foreign Currency
2.17 Comparative Figures
2.18 Budget Information
2.19 Rounding
2.20 Departmental Taxation
2.21 Goods and Services Tax
Budget information refers to original estimates as disclosed in the 2011-2012 Budget Papers and is not subject to audit.
All amounts in the Financial Statements have been rounded to the nearest thousand dollars, unless otherwise stated. Where the result of expressing amounts to the nearest thousand dollars would result in an amount of zero, the financial statement will contain a note expressing the amount to the nearest whole dollar.
The Agency is exempt from all forms of taxation except Fringe Benefits Tax, Payroll Tax and the Goods and Services Tax (GST).
Revenue, expenses and assets are recognised net of the amount of GST, except where the GST incurred is not recoverable from the Australian Taxation Office (ATO). Receivables and payables are stated inclusive of GST. The net amount recoverable, or payable, to the ATO is recognised as an asset or liability within the Statement of Financial Position.
In the Statement of Cash Flows, the GST component of cash flows arising from operating, investing or financing activities which is recoverable from, or payable to, the Australian Taxation Office is, in accordance with the Australian Accounting Standards, classified as operating cash flows.
Transactions denominated in a foreign currency are converted at the exchange rate at the date of the transaction. Foreign currency receivables and payables are translated at the exchange rates current as at balance date.
Comparative figures have been adjusted to reflect any changes in accounting policy or the adoption of new standards. Details of the impact of changes in accounting policy on comparative figures and amendments to comparative figures arising from correction of an error are disclosed at Note 2.5.
Where amounts have been reclassified within the Financial Statements, the comparative statements have been restated.
Restructures of Outputs within the Agency (internal restructures) that do not affect the results shown on the face of the Financial Statements are reflected in the comparatives in the Output Schedule at Notes 3.1 and 3.2.

DHHS Annual Report 2011-2012 - Part 4 - Financial Statements Page 239 of 355
Note 3 Agency Output Schedules3.1 Output Group Information
2012Budget
$'000
2012Actual
$'000
2011Actual
$'000
Continuing Operations
Revenue and Other Income from Transactions
Revenue from appropriation 784 186 819 092 814 634
Grants 65 000 63 600 59 742
Sales of goods and services 75 189 89 564 77 338
Interest income 758 533 935
Contributions received 0 0 90
Other revenue 18 903 23 483 20 087
Total Revenue and Other Income from Transactions 944 036 996 272 972 826
Expenses from Transactions
Employee entitlements
Salaries and wages 564 398 583 355 561 663
Other employee related expenses 12 624 12 184 14 682
Superannuation expenses 53 057 70 501 59 866
Depreciation and amortisation 24 269 26 557 25 710
Supplies and consumables
Consultants 1 750 1 030 1 886
Maintenance and property services 30 491 27 499 28 956
Communications 3 584 4 925 4 491
Information technology 11 100 8 827 10 428
Travel and transport 7 808 10 178 9 537
Medical, surgical and pharmacy supplies 158 151 162 034 164 343
Advertising and promotion 102 118 145
Output Group 1 – Acute Health Services
Budget information refers to original estimates and has not been subject to audit.
Comparative information has not been restated for external administrative restructures.

DHHS Annual Report 2011-2012 - Part 4 - Financial Statements Page 240 of 355
2012Budget
$'000
2012Actual
$'000
2011Actual
$'000
Other supplies and consumables 60 662 49 797 54 923
Grants and subsidies 1 465 2 995 934
Borrowing costs 0 2 0
Other expenses 40 785 43 995 49 093
Total Expenses from Transactions 970 246 1 003 997 986 657
Net Result from Transactions (Net Operating Balance) ( 26 210) ( 7 725) ( 13 831)
Other Economic Flows Included in Net Result
Net gain/(loss) on sale of non financial assets 40 47 85
0 ( 1 137) ( 72)
Net actuarial gains/(losses) of superannuation defined benefit plans 0 ( 8 902) ( 2 505)
Total Other Economic Flows Included in Net Result 40 ( 9 992) ( 2 492)
Net Result from Continuing Operations ( 26 170) ( 17 717) ( 16 323)
Other Economic Flows - Other Non-Owner Changes in Equity
Changes in physical asset revaluation reserve 620 13 056 17 752
Total Other Economic Flows - Other Non-Owner Changes in Equity 620 13 056 17 752
Comprehensive Result ( 25 550) ( 4 661) 1 429
Expense by Output
1.1 Clinical Support Services 45 871 46 180 44 685
1.2 Medical Services 381 003 391 352 379 892
1.3 Surgical Services 238 311 245 598 252 067
1.4 Women's and Children's Services 109 454 113 858 112 240
1.5 Diagnostic and Pharmacy Services 135 483 144 947 141 169
1.6 Ambulance Services 57 770 59 651 54 423
1.7 Forensic Medicine Services 2 354 2 411 2 180
Total 970 246 1 003 997 986 656
Net Assets
Total assets deployed for Acute Health Services 690 499 579 977
Total liabilities incurred for Acute Health Services ( 202 746) ( 179 965)
Net Assets Deployed for Acute Health Services 487 753 400 012
Net gain/(loss) on financial instruments and statutory receivables/payables

DHHS Annual Report 2011-2012 - Part 4 - Financial Statements Page 241 of 355
2012Budget
$'000
2012Actual
$'000
2011Actual
$'000
Continuing Operations
Revenue and Other Income from Transactions
Revenue from appropriation 381 098 374 899 365 798
Grants 0 0 0
Sales of goods and services 14 572 18 159 17 492
Interest income 6 0 6
Contributions received 0 0 0
Other revenue 4 080 5 411 4 625
Total Revenue and Other Income from Transactions 399 756 398 469 387 921
Expenses from Transactions
Employee entitlements
Salaries and wages 226 113 219 810 214 635
Other employee related expenses 4 773 3 665 5 858
Superannuation expenses 24 838 27 314 24 049
Depreciation and amortisation 4 656 6 286 6 174
Supplies and consumables
Consultants 671 615 788
Maintenance and property services 15 481 14 878 16 444
Communications 2 293 2 282 2 489
Information technology 3 317 3 902 4 125
Travel and transport 6 202 6 327 6 909
Medical, surgical pharmacy supplies 18 807 16 876 17 470
Advertising and promotion 193 224 251
Other supplies and consumables 21 123 17 914 19 977
Grants and subsidies 58 392 61 885 50 166
Other expenses 19 758 17 757 19 921
Total Expenses from Transactions 406 617 399 735 389 256
Net Result from Transactions (Net Operating Balance) ( 6 861) ( 1 266) ( 1 335)
Output Group 2 – Community Health Services

DHHS Annual Report 2011-2012 - Part 4 - Financial Statements Page 242 of 355
2012Budget
$'000
2012Actual
$'000
2011Actual
$'000
Other Economic Flows Included in Net Result
Net gain/(loss) on sale of non financial assets 0 ( 2 376) 17
0 ( 121) ( 58)
Total Other Economic Flows Included in Net Results 0 ( 2 497) ( 41)
Net Result from Continuing Operations ( 6 861) ( 3 763) ( 1 376)
Other Economic Flows - Other Non-Owner Changes in Equity
Changes in physical asset revaluation reserve 30 919 3 568 6 140
Total Other Economic Flows - Other Non-Owner Changes in Equity 30 919 3 568 6 140
Comprehensive Result 24 058 ( 195) 4 764
Expense by Output
2.1 Primary Health Services 191 260 191 378 179 511
2.2 Oral Health Services 26 317 27 555 26 674
2.3 Population Health Services 39 600 36 820 37 023
2.4 Mental Health Services 149 440 143 982 146 048
Total 406 617 399 735 389 256
Net Assets
Total assets deployed for Community Health Services 244 559 235 531
Total liabilities incurred for Community Health Services ( 67 073) ( 62 919)
Net Assets Deployed for Community Health Services 177 486 172 612
Net gain/(loss) on financial instruments and statutory receivables/payables

DHHS Annual Report 2011-2012 - Part 4 - Financial Statements Page 243 of 355
2012Budget
$'000
2012Actual
$'000
2011Actual
$'000
Continuing Operations
Revenue and Other Income from Transactions
Revenue from appropriation 322 124 335 442 340 974
Grants 0 0 0
Sales of goods and services 82 287 78 038 73 797
Interest income 607 237 1 403
Other revenue ( 2 239) 1 682 2 898
Total Revenue and Other Income from Transactions 402 779 415 399 419 072
Expenses from Transactions
Employee entitlements
Salaries and wages 67 353 70 929 77 289
Other employee related expenses 1 982 552 613
Superannuation expenses 8 129 9 877 9 541
Depreciation and amortisation 22 932 27 991 27 347
Supplies and consumables
Consultants 1 022 568 590
Maintenance and property services 67 642 73 282 71 819
Communications 1 594 1 370 1 554
Information technology 1 945 1 885 1 988
Travel and transport 3 028 2 696 3 487
Medical, surgical pharmacy supplies 318 74 71
Advertising and promotion 622 769 725
Other supplies and consumables 25 997 44 930 41 773
Grants and subsidies 204 517 237 198 178 845
Borrowing costs 9 623 9 624 9 913
Other expenses 8 762 7 041 9 593
Total Expenses from Transactions 425 466 488 786 435 148
Net Result from Transactions (Net Operating Balance) ( 22 687) ( 73 387) ( 16 077)
Output Group 3 – Human Services

DHHS Annual Report 2011-2012 - Part 4 - Financial Statements Page 244 of 355
2012Budget
$'000
2012Actual
$'000
2011Actual
$'000
Other Economic Flows Included in Net Result
Net gain/(loss) on sale of non financial assets ( 15 415) ( 16 726) ( 27 396)
0 ( 810) ( 780)
Net actuarial gains/(losses) of superannuation defined benefit plans 0 ( 5 019) 1 270
Other gains/(losses) from other economic flows 0 1 134 0
Total Other Economic Flows Included in Net Results ( 15 415) ( 21 421) ( 26 906)
Net Result from Continuing Operations ( 38 102) ( 94 808) ( 42 983)
Other Economic Flows - Other Non-Owner Changes in Equity
Changes in physical asset revaluation reserve 21 897 ( 3 363) 202 774
Total Other Economic Flows - Other Non-Owner Changes in Equity 21 897 ( 3 363) 202 774
Comprehensive Result ( 16 205) ( 98 171) 159 791
Expense by Output
3.1 Child and Family Service 96 075 107 330 115 820
3.2 Youth Justice Services 14 762 15 184 14 970
3.3 Disability Services 163 152 164 628 148 205
3.4 Housing Services 151 477 201 644 156 153
Total 425 466 488 786 435 148
Net Assets
Total assets deployed for Human Services 2 129 258 2 192 179
Total liabilities incurred for Human Services ( 260 065) ( 260 867)
Net Assets Deployed for Human Services 1 869 193 1 931 312
Net gain/(loss) on financial instruments and statutory receivables/payables

DHHS Annual Report 2011-2012 - Part 4 - Financial Statements Page 245 of 355
2012Budget
$'000
2012Actual
$'000
2011Actual
$'000
Continuing Operations
Revenue and Other Income from Transactions
Revenue from Appropriation 753 802 752
Sales of Goods and Services 3 15 16
Other Revenue 1 0 0
Total Revenue and Other Income from Transactions 757 817 768
Expenses from Transactions
Employee entitlements
Salaries and wages 522 491 473
Other employee related expenses 10 4 19
Superannuation expenses 56 60 51
Depreciation and amortisation 0 1 1
Supplies and consumables
Consultants 2 30 35
Maintenance and property services 57 64 60
Communications 10 16 15
Information technology 6 6 9
Travel and transport 29 23 42
Medical, surgical pharmacy supplies 1 0 0
Advertising and promotion 1 0 1
Other supplies and consumables 32 71 35
Grants and subsidies 1 0 0
Other expenses 37 37 41
Total Expenses from Transactions 764 803 782
Net Result from Transactions (Net Operating Balance) ( 7) 14 ( 14)
Output Group 4 – Independent Children’s Review

DHHS Annual Report 2011-2012 - Part 4 - Financial Statements Page 246 of 355
2012Budget
$'000
2012Actual
$'000
2011Actual
$'000
Other Economic Flows Included in Net Result
Net gain/(loss) on sale of non financial assets 0 0 0
0 0 0
Total other Economic Flows Included in Net Results 0 0 0
Net result from Continuing Operations ( 7) 14 ( 14)
Other Economic Flows - Other Non-Owner Changes in Equity
Changes in physical asset revaluation reserve 0 0 0
Total Other Economic Flows - Other Non-Owner Changes in Equity 0 0 0
Comprehensive Result ( 7) 14 ( 14)
Expense by Output
4.1 Office of the Commissioner for Children 764 803 784
Total 764 803 784
Net Liabilities
Total assets deployed for Independent Children’s Review 41 61
Total liabilities incurred for Independent Children’s Review ( 120) ( 130)
Net Liabilities Deployed for Independent Children’s Review ( 79) ( 69)
2012Budget
$'000
2012Actual
$'000
2011Actual
$'000
Continuing Operations
Revenue and Other Income from Transactions
Revenue from appropriation 113 857 67 807 145 849
Sales of goods and services 3 891 30 270
Other revenue 3 700 8 975 2 306
Total Revenue and Other Income from Transactions 121 448 76 812 148 425
Output Group – Capital Investment Program
Net gain/(loss) on financial instruments and statutory receivables/payables

DHHS Annual Report 2011-2012 - Part 4 - Financial Statements Page 247 of 355
2012Budget
$'000
2012Actual
$'000
2011Actual
$'000
Expenses from Transactions
Employee entitlements
Salaries and wages 230 568 1 121
Other employee related expenses 0 8 11
Superannuation expenses 9 68 91
Supplies and consumables
Consultants 0 63 409
Maintenance and property services 0 486 177
Communications 0 99 15
Information technology 0 171 27
Travel and transport 0 24 36
Medical, surgical pharmacy supplies 0 18 9
Advertising and promotion 0 20 2
Other supplies and consumables 730 1 685 1 625
Grants and subsidies 0 1 862 800
Other expenses 1 888 51 56
Total Expenses from Transactions 2 857 5 123 4 379
Net Result from Transactions (Net Operating Balance) 118 591 71 689 144 047
Other Economic Flows Included in Net Result
Net gain/(loss) on sale of non financial assets 24 600 12 277 27 000
Other gains/(losses) from other economic flows 0 ( 1 833) 0
Total Other Economic Flows Included in Net Results 24 600 10 444 27 000
Net Result from Continuing Operations 143 191 82 133 171 047
Other Economic Flows - Other Non-Owner Changes in Equity
Changes in physical asset revaluation reserve 0 0 0
Total Other Economic Flows - Other Non-Owner Changes in Equity 0 0 0
Comprehensive Result 143 191 82 133 171 047

DHHS Annual Report 2011-2012 - Part 4 - Financial Statements Page 248 of 355
2012Budget
$'000
2012Actual
$'000
2011Actual
$'000
Expense by Output
Capital Investment Program 2 857 5 123 4 379
Total 2 857 5 123 4 379
Net Assets
Total assets deployed for Capital Investment Program 0 0
Total liabilities incurred for Capital Investment Program 0 0
Net Assets Deployed for Output Capital Investment Program 0 0
2012Budget
$'000
2012Actual
$'000
2011Actual
$'000
Continuing Operations
Revenue and Other Income from Transactions
Revenue from Special Capital Investment Funds 108 293 62 927 52 977
Sales of goods and services 0 62 45
Other revenue 0 3 2
Total Revenue and Other Income from Transactions 108 293 62 992 53 024
Expenses from Transactions
Employee entitlements
Salaries and wages 0 2 465 1 847
Other employee related expenses 0 ( 133) ( 399)
Superannuation expenses 0 302 278
Depreciation and amortisation 0 209 235
Output Group – Special Capital Investment Funds

DHHS Annual Report 2011-2012 - Part 4 - Financial Statements Page 249 of 355
2012Budget
$'000
2012Actual
$'000
2011Actual
$'000
Supplies and consumables
Consultants 965 119 438
Maintenance and property services 0 2 499 1 826
Communications 0 43 34
Information technology 1 071 3 183 763
Travel and transport 0 18 36
Medical, surgical pharmacy supplies 0 5 1
Advertising and promotion 0 20 7
Other supplies and consumables 0 1 056 570
Grants and subsidies 11 213 2 247 3 759
Other expenses 0 175 131
Total Expenses from Transactions 13 249 12 208 9 526
Net Result from Transactions (Net Operating Balance) 95 044 50 784 43 498
Other Economic Flows Included in Net Result
Net gain/(loss) on sale of non financial assets 0 ( 5) 0
Total Other Economic Flows Included in Net Results 0 ( 5) 0
Net Result from Continuing Operations 95 044 50 779 43 498
Other Economic Flows - Other Non-Owner Changes in Equity
Changes in physical asset revaluation reserve 0 0 0
Total Other Economic Flows - Other Non-Owner Changes in Equity 0 0 0
Comprehensive Result 95 044 50 779 43 498
Expense by Output
Special Capital Investment Funds 13 249 12 208 9 526
Total 13 249 12 208 9 526
Net Assets
Total assets deployed for Special Capital Investment Funds 0 0
Total liabilities incurred for Special Capital Investment Funds 0 0
Net Assets Deployed for Output Special Capital Investment Funds 0 0

DHHS Annual Report 2011-2012 - Part 4 - Financial Statements Page 250 of 355
2012Budget
$'000
2012Actual
$'000
2011Actual
$'000
Total Comprehensive Result of Output Groups
Acute Health Services ( 25 550) ( 4 661) 1 429
Community Health Services 24 058 ( 195) 4 764
Human Services ( 16 205) ( 98 171) 159 791
Independent Children’s Review ( 7) 14 ( 14)
Capital Investment Program 143 191 82 133 171 047
Special Capital Investment Funds 95 044 50 779 43 498
Total Comprehensive Result 220 531 29 899 380 515
Comprehensive Result 220 531 29 899 380 515
2012Actual
$'000
2011Actual
$'000
Total Net Assets Deployed for Output Groups
Acute Health Services 487 753 400 012
Community Health Services 177 486 172 612
Human Services 1 869 193 1 931 312
Independent Children’s Review ( 79) ( 69)
Total Net Assets Deployed 2 534 353 2 503 867
Net Assets 2 534 353 2 503 867
3.3 Reconciliation of Total Output Groups Net Assets to Statement of Financial Position
3.2 Reconciliation of Total Output Groups Comprehensive Result to Statement of Comprehensive Income

DHHS Annual Report 2011-2012 - Part 4 - Financial Statements Page 251 of 355
3.4 Administered Output Schedule
2012Budget
$'000
2012Actual
$'000
2011Actual
$'000
Administered Revenue and Other Income from Transactions
Revenue from appropriation 24 876 34 859 37 550
Grants 36 680 23 902 25 813
Sales of goods and services 0 21 577 20 007
Other revenue 0 0 313
Total Revenue and Other Income from Transactions 61 556 80 338 83 683
Administered Expenses from Transactions
Grants and transfer payments 24 957 35 720 38 734
Transfer to the consolidated fund 36 600 46 057 44 020
Total Administered Expenses from Transactions 61 557 81 777 82 754
( 1) ( 1 439) 929
( 1) ( 1 439) 929
Total Administered Comprehensive Result ( 1) ( 1 439) 929
Administered Expense
Administered payments 61 557 81 777 82 754
Total 61 557 81 777 82 754
Administered Financial Assets
Receivables 2 489 3 988 4 446
Total Administered Financial Assets 2 489 3 988 4 446
Total Administered Assets 2 489 3 988 4 446
Administered Liabilities
Payables 6 036 8 041 7 060
Total Administered Liabilities 6 036 8 041 7 060
Total Administered Net Liabilities ( 3 547) ( 4 053) ( 2 614)
Administered Net Liabilities
Total administered assets deployed for Administered Payments 3 988 4 446
Total administered liabilities incurred for Administered Payments ( 8 041) ( 7 060)
( 4 053) ( 2 614)
Administered Net Result from Transactions (Net Operating Balance)
Administered Net Liabilities Deployed for Administered Payments
Output Group 1 – Administered Payments
Budget information refers to original estimates and has not been subject to audit.Comparative information has not been restated for external administrative restructures.
Administered Net Operating Result from Continuing Operations

DHHS Annual Report 2011-2012 - Part 4 - Financial Statements Page 252 of 355
2012Budget
$'000
2012Actual
$'000
2011Actual
$'000
Total Administered Net Result ( 1) ( 1 439) 929
Net Surplus (deficit) ( 1) ( 1 439) 929
2012Actual
$'000
2011Actual
$'000
Total Administered Net Assets Deployed ( 4 053) ( 2 614)
Administered Net Assets ( 4 053) ( 2 614)
StateFunds
AustralianGovernment
Funds
StateFunds
AustralianGovernment
Funds2012
Actual$'000
2012Actual
$'000
2011Actual
$'000
2011Actual
$'000
Specific Purpose Payments
Disability Services 119 595 29 537 107 257 32 468
Affordable Housing 0 32 569 0 33 545
Health 0 279 619 500 275 740
National Partnership Payments
Health Services 14 751 61 877 11 756 51 723
Housing 3 933 12 756 2 060 6 591
Community Services 1 824 13 371 27 074 34 921
Commonwealth Own Purpose Expenditures
Mersey 9 995 63 600 9 264 60 000
Other 9 976 21 970 45 093 49 947
Housing 0 16 029 0 69 548
Total 160 074 531 328 203 004 614 483
Australian Government Nation Building and Economic Stimulus Package
Note 4 Expenditure Under Australian Government Funding Arrangements
3.5 Reconciliation of Total Administered Output Groups Comprehensive Result to Administered Statement of Changes in Equity
3.6 Reconciliation of Total Administered Groups' Net Assets to Schedule of Administered Assets and Liabilities

DHHS Annual Report 2011-2012 - Part 4 - Financial Statements Page 253 of 355
5.1 Statement of Comprehensive Income
NoteBudget
$'000Actual
$'000Variance
$'000Variance
%
Appropriation revenue - recurrent (a) 1 488 161 1 530 234 42 073 2.8
(b) 480 9 768 9 288 1935.0
Sales of goods and services (c) 175 942 185 868 9 926 5.6
Other revenue (d) 24 445 39 554 15 109 61.8
Employee benefits (e) 964 094 1 002 020 ( 37 926) (3.9)
Depreciation and amortisation (f) 51 857 61 044 ( 9 187) (17.7)
Supplies and consumables (g) 446 807 462 719 ( 15 912) (3.6)
Grants and subsidies (h) 275 588 306 187 ( 30 599) (11.1)
(i) 112 636 57 673 54 963 48.8
Revenue from Special Capital Investment Funds (j) 95 044 49 678 45 366 47.7
Net gain/(loss) on non-financial assets (k) 9 225 ( 6 783) ( 16 008) (173.5)
(l) 0 ( 13 921) ( 13 921) n/a
The following are brief explanations of material variances between budget estimates and actual outcomes. Variances are considered material where the variance exceeds the greater of 10 per cent of Budget estimate or $8 000 000.
The Australian Government Nation Building and Economic Stimulus Package was designed to stimulate the economy with the Australian Government funding projects that boost local infrastructure and support jobs. This funded new houses through direct investment and assistance of the social housing sector and also urgent maintenance to upgrade social houses. The funding was received in two stages.
Appropriation revenue - works and services (continuing
operations)
Net actuarial gain/(loss) of superannuation defined benefit plans
Commonwealth Own Purpose Expenditure is funding paid directly from the Australian Government to the states and territories for the provision of services identified as a priority by the Australian Government.
Appropriation revenue - works and services
(non-operational capital funding)
Specific Purpose Payments (SPPs) are payments from the Australian Government to the governments of the states and territories arising from national agreements that set out the government's agreed objectives and outcomes, outputs, roles and responsibilities and performance indicators for each sector. SPPs are distributed to the states on the basis of their population shares.
National Partnership Payments (NPPs) are similar to SPPs but are provided for the purpose of the delivery of specified projects, facilitate reforms or reward jurisdictions that deliver nationally significant reforms.
Note 5 Explanations of Material Variances between Budget and Actual Outcomes

DHHS Annual Report 2011-2012 - Part 4 - Financial Statements Page 254 of 355
Notes to Statement of Comprehensive Income Variances
(c) The increase in sales of goods and services predominately relates to above budgeted revenue for prostheses, private patients, Department of Veteran Affairs and Pharmaceutical Benefit Scheme.
(b) The increase in appropriation revenue – works and services (continuing operations) predominately relates to additional funding provided for increased salary and wages and consultant costs along with funding for the outsourced construction of the Patient Support Centre in Launceston by the Cancer Council of Tasmania.
(a) The increase in appropriation revenue - recurrent predominately relates to additional funding provided to meet rising cost pressures in the health system and additional funding for Australian Government programs.
(d) The increase in other revenue predominantly relates to salary and wages, workers compensation and other recoveries that were not budgeted.
(e) The increase in employee benefits predominantly reflects the payment of Targeted Voluntary Redundancy Arrangements, including the payment of staff employed via a third party.
(f) The original budget amount for depreciation and amortisation did not accurately reflect the 30 June 2011 balance of $59.5 million.
(g) The increase in supplies and consumables is predominately the result of increased costs associated with property services, medical and surgical services and information technology.
(l) The net loss on superannuation defined benefits plans represents the actuarial loss that was unbudgeted.
(j) The reduction in Revenue from Special Capital Funds predominantly reflects delays in projects being progressed, primarily relating to the Royal Hobart Hospital $100 million due to the inability to occupy leased space in the Wellington Centre and the Housing Fund due to delays in announcing the round four proponents for the National Rental Affordability Scheme.
(k) The net gain(loss) on non-financial assets represents the gain(loss) on disposal of physical assets offset by the impairment of non-financial assets. At the time of budgeting it was anticipated that disposals would generate net gains for the Agency.
(h) The increase in grants and subsidies represents the finalised activity under the National Building Economic Stimulus Program. The grants are for the development of social housing, where title to the properties are held by the non-government sector.
(i) The reduction in appropriation revenue - works and services (non-operational capital funding) reflects the delay in major projects including the RHH Redevelopment, the Launceston General
Hospital Acute Medical and Surgical Unit, the National Health and Hospitals Network Reform and Statewide Cancer Services.

DHHS Annual Report 2011-2012 - Part 4 - Financial Statements Page 255 of 355
5.2 Statement of Financial Position
NoteBudget
$'000Actual
$'000Variance
$'000Variance
%
Cash and deposits (a) 56 169 85 650 29 481 52.5
Property, plant and equipment (b) 2 991 396 2 898 600 ( 92 796) (3.1)
Payables (c) 27 823 38 760 ( 10 937) (39.3)
Employee benefits (d) 217 330 208 492 8 838 4.1
Superannuation (e) 15 036 29 228 ( 14 192) (94.4)
Other liabilities (f) 60 224 43 716 16 508 27.4
Notes to Statement of Financial Position Variances
(d) The reduction in employee benefits primarily relates to a reduction in the discount rate in calculating the accrual and as a consequence of the Treasurer's decision to cease levying payroll tax on agencies from 1 October 2012.
(b) The decrease in property, plant and equipment predominantly comprises a decrement in the revaluation of land and buildings and a reallocation of expenditure from work in progress to grants relating to social housing.
(c) and (f) The variance in payables and other liabilities is predominately a result of accrued expenses being reported against other liabilities in the Budget and reported as a payable in the Actual.
(a) The original budget amount for cash and deposits did not accurately reflect the 30 June 2011 balance which has resulted in the variance above.
(e) The variance in superannuation is due to an unbudgeted actuarial loss on the superannuation defined benefit plans.

DHHS Annual Report 2011-2012 - Part 4 - Financial Statements Page 256 of 355
5.3 Statement of Cash Flows
NoteBudget
$'000Actual
$'000Variance
$'000Variance
%
Appropriation receipts - recurrent (a) 1 488 161 1 530 234 42 073 2.8
Sales of goods and services (b) 174 518 187 139 12 621 7.2
GST receipts (c) 60 061 87 293 27 232 45.3
Other cash receipts (d) 28 075 41 306 13 231 47.1
Employee benefits (e) ( 855 505) ( 883 839) ( 28 334) (3.3)
GST payments (f) ( 60 060) ( 85 912) ( 25 852) (43.0)
Grants and transfer payments (g) ( 275 588) ( 260 833) 14 755 5.4
Supplies and consumables (h) ( 447 032) ( 469 113) ( 22 081) (4.9)
Other cash payments (i) ( 70 650) ( 79 467) ( 8 817) (12.5)
(j) 112 636 60 945 ( 51 691) (45.9)
(k) 95 044 50 222 ( 44 822) (47.2)
Payment for acquisition of non-financial assets (l) ( 238 463) ( 141 479) 96 984 40.7
Notes to Statement of Cash Flows Variances
(c) The increase in GST receipts reflects an increase in the level of sales of goods and services as well as changes in the level of GST able to be claimed back by Disability, Housing and Community Services.
(d) The increase in other cash receipts predominantly relates to salary and wages, workers compensation and other recoveries that were not budgeted.
(a) The increase in appropriation revenue - recurrent predominately relates to additional funding provided to meet rising cost pressures in the health system and additional funding for Australian Government programs.
(b) The increase in sales of goods and services predominately relates to above budgeted revenue for prostheses, private patients, Department of Veteran Affairs, Pharmaceutical Benefits Scheme and miscellaneous revenue.
(e) The increase in employee benefits predominantly reflects the payment of Targeted Voluntary Redundancy Arrangements, including the associated leave payout and the payment of staff employed via a third party.
Receipts from non-operational capital funding - works and
servicesReceipts from non-operational capital funding - Special Capital
Investment Funds

DHHS Annual Report 2011-2012 - Part 4 - Financial Statements Page 257 of 355
Note 6 Events Occurring After Balance Date
National Health Reform
Each THO is a statutory authority with a Governing Council established under the Act. Operational management for public hospitals has been devolved to the local level. This will mean a major shift in the way services are funded and delivered in Tasmania and will enable THOs to be the direct managers of public hospitals and to be held directly accountable for hospital performance.
The THOs replace the Area Health Services previously managed by the Department of Health and Human Services. This will have a significant impact on the quantum and type of expenditure managed by
the Agency and presented in its financial statements from 1 July 2012.
(g) The decrease in grants and transfer payments is a result of the full provision being included in the budget for the transfer to unit pricing within Disability Services. However, the grant payments were phased in during 2011-2012, with full implementation expected in 2012-2013.
National Health Reform was implemented in Tasmania on 1 July 2012 with the establishment of three Tasmanian Health Organisations (THOs) under the Tasmanian Health Organisation Act 2011 (the Act), which received Royal Assent on 22 December 2011.
There have been no events subsequent to the balance date which would have a material affect on the Department of Health and Human Services’ Financial Statements as at 30 June 2012.
(f) The increase in GST payments reflects an increase in the level of expenditure on operating costs.
(j) The reduction in receipts from non-operational capital funding - works and services reflects the delay in major projects including the Royal Hobart Hospital Redevelopment, the Launceston General Hospital Acute Medical and Surgical Unit, the National Health and Hospitals Network Reform and the Statewide Cancer Services.
(k) The reduction in receipts from non-operational capital funding - Special Capital Investment Funds predominantly reflects delays in projects being progressed, primarily relating to the Royal Hobart Hospital $100 million due to the inability to occupy leased space in the Wellington Centre and the Housing Fund due to delays in announcing the round four proponents for the National Rental Affordability Scheme.
(l) The reduction in payment for acquisition of non-financial assets is a result of the delays in the capital program.
(h) The increase in supplies and consumables is a result of increased costs incurred during the financial year, including additional consultancy and property costs within the capital program and increased medical and surgical costs.
(i) An increase in other cash payments reflects an increase in payroll tax and workers compensation premiums that were unbudgeted.

DHHS Annual Report 2011-2012 - Part 4 - Financial Statements Page 258 of 355
Total Agency
balance at30 June 2012
$'000
Transfers on 1 July 2012
$'000
Net Agency balance at 1 July 2012
$'000
Assets
Financial Assets
Cash and deposits 85 650 ( 29 552) 56 098
Receivables 22 783 ( 12 164) 10 619
Loan advances 4 567 0 4 567
Equity investments 4 623 0 4 623
Other financial assets 6 720 ( 997) 5 723
Non-Financial Assets 0
Inventories 13 832 ( 8 952) 4 880
Assets held for sale 6 093 0 6 093
Property, plant and equipment 0
Land and and buildings 2 837 468 0 2 837 468
Plant, medical, computer equipment and vehicles 61 132 ( 40 465) 20 667
Intangibles 16 399 0 16 399
Other assets 5 090 ( 2 247) 2 843
Total Assets 3 064 357 ( 94 377) 2 969 980
Income Statement
Balance Sheet
The most significant impact on the Agency is a substantial reduction in employee related expenditure and an increase in grants paid by the Agency to the THOs.
Under National Health Reforms, the majority of funding previously provided by the Australian Government under Health Specific Purpose Payments (SPP) is now provided directly to the THOs via accounts held in the National Pool. In 2011-2012, this funding was paid to the Agency by way of a recurrent appropriation. In 2012-2013 this funding will flow as a grant to the THOs.
Also, under the new administrative arrangements in place for 2012-2013, funding due to the Agency under National Partnership Agreements with the Australian Government and Commonwealth Own Purpose Expenditure will be paid as grants rather than by way of appropriation. This represents a substantial reduction in revenue from appropriation and an increase in grants received by the Agency.

DHHS Annual Report 2011-2012 - Part 4 - Financial Statements Page 259 of 355
Total Agency
balance at30 June 2012
$'000
Transfers on 1 July 2012
$'000
Net Agency balance at 1 July 2012
$'000
Liabilities
Payables 38 760 ( 11 142) 27 618
Interest bearing liabilities 209 808 0 209 808
Employee benefits 208 492 ( 149 009) 59 483
Superannuation 29 228 0 29 228
Other liabilities 43 716 ( 11 083) 32 633
Total Liabilities 530 004 ( 171 234) 358 770
Net Assets (Liabilities) 2 534 353 76 857 2 611 210
Equity
Contributed capital 6 094 0 6 094
Reserves 1 921 389 0 1 921 389
Accumulated funds 606 870 76 857 683 727
Total Equity 2 534 353 76 857 2 611 210
Note 7 Underlying Net Operating BalanceNon-operational capital funding is the income from transactions relating to funding for capital projects. This funding is classified as income from transactions and included in the net operating balance. However, the corresponding capital expenditure is not included in the calculation of the net operating balance. Accordingly, the net operating balance will portray a position that is better than the true underlying financial result.
For this reason, the net operating result is adjusted to remove the effects of funding for capital projects.

DHHS Annual Report 2011-2012 - Part 4 - Financial Statements Page 260 of 355
2012Budget
$'000
2012Actual
$'000
2011Actual
$'000
Net Result from Transactions (Net Operating Balance) 157 870 40 109 156 288
Less Impact of Non-operational Ccapital Funding
Revenue from Government - works and services 112 636 57 673 125 055
Other revenue from Government 741 367 16 463
Revenue from Special Capital Investment Funds 95 044 49 678 43 127
Total 208 421 107 718 184 645
Underlying Net Operating Balance ( 50 551) ( 67 609) ( 28 357)
Note 8 Income from Transactions
8.1 Grants
2012$'000
2011$'000
Continuing Operations
Grants from the Australian Government
Specific Grant - Mersey Community Hospital 63 600 59 742
Total 63 600 59 742
Total Revenue from Grants 63 600 59 742
Grants received from the Australian Government for the Mersey Community Hospital are provided on the condition that the Hospital operates as a public hospital in terms of an agreement between the
Crown and the Commonwealth of Australia commencing 1 July 2011 and ending 30 June 2014.

DHHS Annual Report 2011-2012 - Part 4 - Financial Statements Page 261 of 355
8.2 Sales of Goods and Services
2012$'000
2011$'000
Residential rent income 127 271 118 669
Less rebates ( 52 760) ( 49 120)
Net rentals received from Housing tenants 74 511 69 549
Commercial rent income 795 726
Income from purchase of dwellings 133 142
Pharmacy non-PBS 1 859 1 816
Prostheses 6 631 5 280
Inpatient, outpatient nursing home fees 43 805 41 420
Ambulance fees 5 516 4 413
Dental 2 316 2 152
PBS co-payments 853 252
PBS revenue from Medicare 3 515 1 221
Private Patient Scheme 22 350 18 535
Other client revenue 1 900 2 955
Hobart Private Hospital revenue 2 734 2 751
Other user charges 18 950 17 746
Total 185 868 168 958
8.3 Contributions Received
2012$'000
2011$'000
Fair value of assets assumed at no cost or for nominal consideration 0 90
Total 0 90

DHHS Annual Report 2011-2012 - Part 4 - Financial Statements Page 262 of 355
8.4 Other Revenue
2012$'000
2011$'000
Salaries and wages recoveries 7 930 6 945
Food recoveries 4 968 5 537
Multipurpose Centre recoveries 372 359
Workers compensation recoveries 7 868 2 825
Operating recoveries 12 974 9 877
Donations 2 698 2 071
Industry funds 2 744 2 304
Total 39 554 29 918
Note 9 Expenses from Transactions
9.1 Employee Benefits
2012$'000
2011$'000
Wages and salaries including FBT 790 188 776 467
Annual leave 61 743 54 755
Long service leave 5 658 7 039
Other post-employment benefits 8 096 11 366
Sick leave 26 604 25 330
Other employee expenses - other staff allowances 1 609 2 855
Superannuation expenses - defined contribution and benefits schemes 108 122 93 876
Total 1 002 020 971 688
Operating recoveries includes a $4 million contribution from the University of Tasmania in respect of the Northern Integrated Care Service project and $4 million of housing insurance and other recoveries.
Donations are made to the Agency from the general public and through fund raising efforts.

DHHS Annual Report 2011-2012 - Part 4 - Financial Statements Page 263 of 355
9.2 Depreciation and Amortisation
(a) Depreciation
2012$'000
2011$'000
Plant, equipment and vehicles 13 360 12 669
Buildings 46 840 46 261
Total 60 200 58 930
Superannuation expenses for defined benefits schemes relate to payments into the Superannuation Provision Account held centrally and recognised within the Finance‑General Division of the Department of Treasury and Finance. The amount of the payment is based on an employer contribution rate determined by the Treasurer, on the advice of the State Actuary. The current employer contribution is 12.3 per cent of salary.
Superannuation expenses relating to defined contribution schemes are paid directly to nominated superannuation funds at a rate of nine per cent of salary. In addition, agencies are also required to pay into the SPA a “gap” payment equivalent to 3.3 per cent of salary in respect of employees who are members of contribution schemes.

DHHS Annual Report 2011-2012 - Part 4 - Financial Statements Page 264 of 355
(b) Amortisation
2012$'000
2011$'000
Intangibles 817 510
Long-term community housing grant 27 27
Total 844 537
Total Depreciation and Amortisation 61 044 59 467
9.3 Supplies and Consumables
2012$'000
2011$'000
Consultants 2 424 4 146
Property services 74 813 72 711
Maintenance 43 894 46 571
Communications 8 735 8 598
Information technology 17 974 17 339
Travel and transport 19 268 20 047
Medical, surgical and pharmacy supplies 179 016 181 895
Advertising and promotion 1 152 1 131
Patient and client services 66 706 62 396
Leasing costs 3 240 4 129
Equipment and furniture 7 803 7 097
Administration 9 905 10 399
Food production costs 8 821 9 323
Other supplies and consumables 9 470 17 327
Service fees 9 131 7 832
Audit fees - financial audit 367 399
Total 462 719 471 341

DHHS Annual Report 2011-2012 - Part 4 - Financial Statements Page 265 of 355
9.4 Grants and Subsidies
2012$'000
2011$'000
Grant - Disability Services 116 061 98 156
Grant - Community Support 28 152 23 769
Grant - Mental Health 9 130 8 389
Grant - Disability Gateway Service 2 066 4 982
Grant - National Rental Affordability Scheme 1 236 5 288
Grant - other 93 592 35 941
Subsidies - Home and Community Care 40 629 36 422
Subsidies - Supported Accommodation Assistance 15 321 16 816
Subsidies - Private Rental Assistance Scheme 0 4 741
Total 306 187 234 504
The Agency provides supported accommodation assistance including crisis accommodation and related support for people who are experiencing homelessness or who are at imminent risk of becoming homeless and private rental support.
The Agency provides assistance for home and community care including community nursing, home help and maintenance, respite, personal care, transport, packages of care and delivered meals across the State.
The Agency provides grants for a range of services, including disability services including carer support, respite, accommodation support, information, advocacy, education, day support, specialist equipment, personal care and other individual support services. Grants are also provided for mental health, community support, palliative care, Disability Gateway Services and other community assistance grants.
Grants - other includes $48 million in Housing Grants, of which $44 million related to a reclassification of works in progress expenditure in relation to Non-Government Organisation Community Housing. It
also includes $6.5 million for community support and $15 million for personal care and individual support services.

DHHS Annual Report 2011-2012 - Part 4 - Financial Statements Page 266 of 355
9.5 Borrowing Costs
2012$'000
2011$'000
Interest Expense
Interest on bank overdrafts and loans 9 626 9 913
Total 9 626 9 913
9.6 Other Expenses
2012$'000
2011$'000
Salary on-costs 62 050 71 293
Tasmanian Risk Management Fund premium 6 006 7 006
Other 1 000 536
Total 69 056 78 835
Note 10 Other Economic Flows Included in Net Result
10.1 Net Gain/(Loss) on Non-Financial Assets
2012$'000
2011$'000
Impairment of non-financial assets ( 1 842) ( 2 731)
Net gain/(loss) on disposal of physical assets ( 4 941) 2 437
Total Net Gain/(Loss) on Non-Financial Assets ( 6 783) ( 294)
2012$'000
2011$'000
Impairment of loans and receivables ( 2 068) ( 910)
Total ( 2 068) ( 910)
The impairment of non-financial assets includes demolition of partially destroyed rental properties.
The impairment loss on receivables relates to an increase in the Provision for Impairment.
10.2 Net Gain/(Loss) on Financial Instruments and Statutory Receivables/Payables

DHHS Annual Report 2011-2012 - Part 4 - Financial Statements Page 267 of 355
10.3 Other Gains/(Losses) from Other Economic Flows
2012$'000
2011$'000
Net gain/(loss) on disposal of equity investments ( 699) 0
Total net gain/(loss) from other economic flows ( 699) 0
Note 11 Assets
11.1 Receivables
2012$'000
2011$'000
Receivables 25 671 23 630
Less: Provision for impairment ( 2 888) ( 2 173)
Total 22 783 21 457
Sales of goods and services (inclusive of GST) 22 783 21 457
Total 22 783 21 457
Settled within 12 months 22 783 21 457
Total 22 783 21 457
Reconciliation of Movement in Provision for Impairment of Receivables
2012$'000
2011$'000
Carrying Amount at 1 July 2 173 2 183
Amounts written off during the year ( 516) ( 843)
Amounts recovered during the year ( 837) ( 77)
Increase/(decrease) in provision recognised in profit or loss 2 068 910
Carrying Amount at 30 June 2 888 2 173
During 2011-2012, a portion of the accounts receivable ledger was assessed as being impaired. The impairment arose as a result of being long outstanding and assessed as being unlikely to be received or matters in dispute or being assessed for write-off. The amount of the impairment loss recognised is $2.888 million and has been deducted from receivables.

DHHS Annual Report 2011-2012 - Part 4 - Financial Statements Page 268 of 355
11.2 Loan Advances
2012$'000
2011$'000
Loan Advances
Loan sdvances 4 567 5 855
Provision for impairment 0 0
Total 4 567 5 855
Settled within 12 months 2 726 2 805
Settled in more than 12 months 1 841 3 050
Total 4 567 5 855
11.3 Equity Investments2012$'000
2011$'000
Home share equity investment 4 680 3 152
Less: orovision for impairment ( 57) 0
Total 4 623 3 152
Settled within 12 months 4 623 3 152
Total 4 623 3 152
11.4 Other Financial Assets
2012$'000
2011$'000
Accrued interest 47 175
Accrued revenue 1 113 2 734
Tax assets 5 560 7 106
Total 6 720 10 015
Settled within 12 months 6 720 10 015
Total 6 720 10 015
During 2011-2012 no new loans were advanced and no loan advances were assessed as being impaired as considerable asset coverage exists against the loans.
During 2011-2012 a $57 000 impairment provision in respect of equity investment assets was provided. No impairment of this asset class was recognised in 2010-2011.
The Treasurer made a policy decision in 2010-2011 to restrict the type of accounts that were eligible to receive interest revenue on cash balances. As a result, only true trust accounts are now eligible to receive interest revenue.

DHHS Annual Report 2011-2012 - Part 4 - Financial Statements Page 269 of 355
11.5 Inventories
2012$'000
2011$'000
Pharmacy 8 447 7 042
Catering 595 551
Linen 2 576 1 970
General supplies 2 214 1 702
Total 13 832 11 265
Utilised within 12 months 13 832 11 265
Total 13 832 11 265
11.6 Assets Held for Sale
2012$'000
2011$'000
Land 3 047 4 186
Buildings 3 046 4 655
Less: accumulated depreciation 0 0
Total 6 093 8 841
Settled within 12 months 6 093 8 841
Total 6 093 8 841
Inventories relate to stocks held for distribution at no or nominal consideration, predominantly at hospitals, in the ordinary course of operations as detailed above.
Department of Health and Human Services assets held for sale (excluding Director of Housing assets held for sale) include six properties identified as no longer meeting the needs of the Agency. The assets will be disposed of via public sale, offered to existing tenants or transferred to the local council. The properties are expected to be sold, at a value determined by the Valuer-General, over the coming year.
Assets held for sale include residential dwellings from the public housing portfolio identified for sale as part of the ongoing strategic asset management plan (SAMP), as well as land lots developed for sale under the Australian Government's Housing Affordability Fund (HAF). Where appropriate, existing dwellings
may be offered for sale to the sitting tenants supported by government programs such as the HomeShare Shared Equity Sales program or the Streets Ahead Assistance Program. All remaining properties are offered for sale through the open market, with all properties sold at a minimum of the market value as assessed by the Valuer-General.
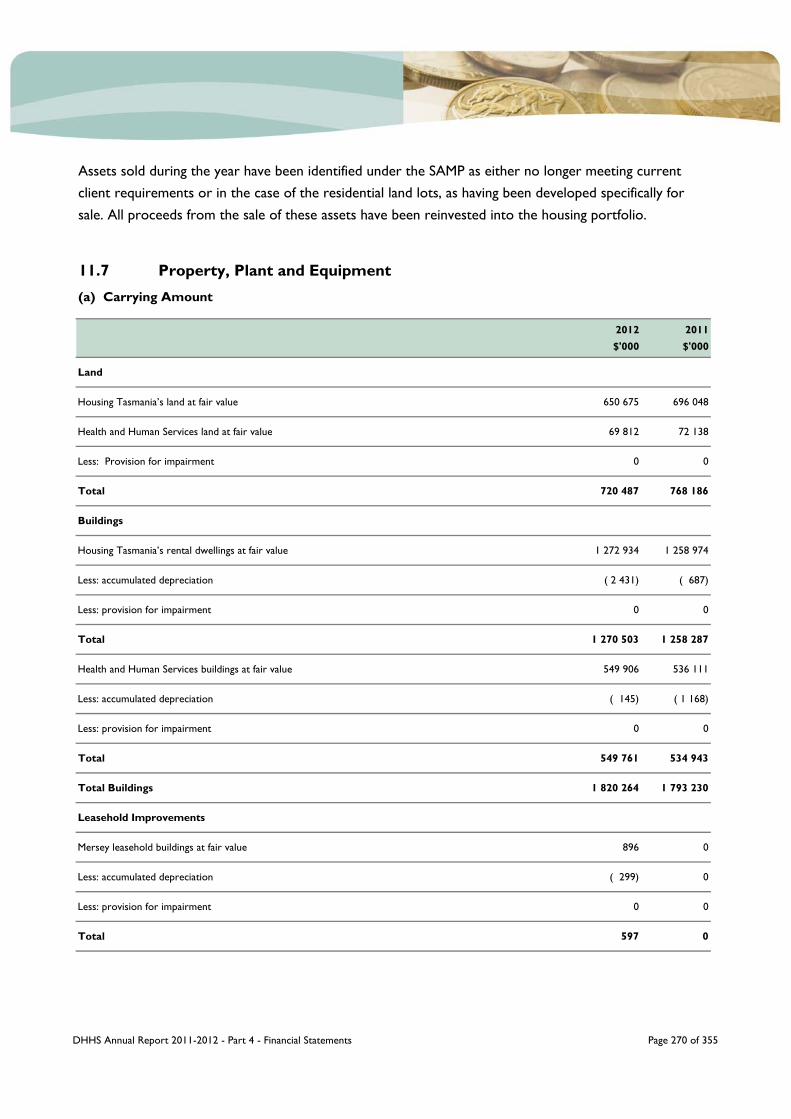
DHHS Annual Report 2011-2012 - Part 4 - Financial Statements Page 270 of 355
11.7 Property, Plant and Equipment
(a) Carrying Amount
2012$'000
2011$'000
Land
Housing Tasmania’s land at fair value 650 675 696 048
Health and Human Services land at fair value 69 812 72 138
Less: Provision for impairment 0 0
Total 720 487 768 186
Buildings
Housing Tasmania’s rental dwellings at fair value 1 272 934 1 258 974
Less: accumulated depreciation ( 2 431) ( 687)
Less: provision for impairment 0 0
Total 1 270 503 1 258 287
Health and Human Services buildings at fair value 549 906 536 111
Less: accumulated depreciation ( 145) ( 1 168)
Less: provision for impairment 0 0
Total 549 761 534 943
Total Buildings 1 820 264 1 793 230
Leasehold Improvements
Mersey leasehold buildings at fair value 896 0
Less: accumulated depreciation ( 299) 0
Less: provision for impairment 0 0
Total 597 0
Assets sold during the year have been identified under the SAMP as either no longer meeting current client requirements or in the case of the residential land lots, as having been developed specifically for sale. All proceeds from the sale of these assets have been reinvested into the housing portfolio.

DHHS Annual Report 2011-2012 - Part 4 - Financial Statements Page 271 of 355
2012$'000
2011$'000
Community Housing Stock
At fair value 109 331 88 398
Less: accumulated amortisation ( 208) ( 13)
Less: provision for impairment 0 0
Total 109 123 88 385
Plant, Equipment and Vehicles
At cost 160 854 151 460
Less: accumulated depreciation ( 106 040) ( 95 999)
Less: provision for impairment 0 0
Total 54 814 55 461
Work in Progress
Housing Tasmania’s rental dwellings 24 196 60 849
Health and Human Services buildings 157 305 93 461
Mersey leasehold buildings 5 496 0
Plant, equipment and vehicles 6 318 7 463
Total 193 315 161 773
Total Property, Plant and Equipment 2 898 600 2 867 035
(b) Reconciliation of Movements
The Agency’s land and building assets (excluding Housing Tasmania’s rental properties) were revalued independently by Opteon Pty Ltd (formally known as Brothers and Newton Pty Ltd) as at 30 June 2012 using adjustment indices based on Australian Bureau of Statistics statistical data, Real Estate Institute of Tasmania median house price data, Rawlinsons Index of construction cost estimates and own sourced research data from the Land Information Systems Tasmania database. Housing Tasmania land and
building assets are revalued annually as at 31 October using a mix of onsite revaluations and suburb based indices adjustments. These annual revaluations are provided by the Valuer-General of Tasmania.
Reconciliations of the carrying amounts of each class of Property, plant and equipment at the beginning and end of the current and previous financial year are set out below. Carrying value means the net amount after deducting accumulated depreciation and accumulated impairment losses.

DHHS Annual Report 2011-2012 - Part 4 - Financial Statements Page 272 of 355
2012
Land $'000
Buildings $'000
Community
HousingStock $'000
MerseyLeasehold
Improvements
$'000
Plant Equipment
and Vehicles
$'000
Works in Progress
$'000
Total $'000
Carrying value at 1 July 768 186 1 793 230 88 385 0 55 461 161 773 2 867 035
Additions 348 845 13 896 7 202 129 307 138 611
Disposals ( 4 480) ( 5 961) 0 0 ( 86) 0 ( 10 527)
( 44 716) 52 854 4 575 0 0 0 12 713
Impairment losses 0 ( 1 784) 0 0 0 0 ( 1 784)
Assets held for sale ( 1 935) ( 1 069) 0 0 0 0 ( 3 004)
Grants transfers 0 0 0 0 0 ( 44 244) ( 44 244)
Net transfers 3 084 26 859 17 981 0 5 597 ( 53 521) 0
0 ( 44 710) ( 1 831) ( 299) ( 13 360) 0 ( 60 200)
720 487 1 820 264 109 123 597 54 814 193 315 2 898 600
2011
Land $'000
Buildings $'000
Community
HousingStock $'000
MerseyLeasehold
Improvements
$'000
Plant Equipment
and Vehicles
$'000
Works in Progress
$'000
Total $'000
Carrying value at 1 July 607 872 1 715 326 47 152 0 52 154 63 875 2 486 379
Additions 8 409 38 358 0 0 11 064 177 824 235 655
Disposals ( 7 326) ( 6 073) 0 0 ( 11) 0 ( 13 410)
158 631 26 118 41 918 0 0 0 226 667
Impairment losses 0 ( 2 407) ( 65) 0 0 0 ( 2 472)
Assets held for sale ( 2 618) ( 4 236) 0 0 0 0 ( 6 854)
Net transfers 3 218 71 448 334 0 4 926 ( 79 926) 0
0 ( 45 304) ( 954) 0 ( 12 672) 0 ( 58 930)
768 186 1 793 230 88 385 0 55 461 161 773 2 867 035
Revaluation increments
(decrements)
Depreciation
Depreciation
Carrying value at 30 June
Carrying value at 30 June
Revaluation increments
(decrements)

DHHS Annual Report 2011-2012 - Part 4 - Financial Statements Page 273 of 355
11.8 Intangibles
(a) Carrying Amount
2012$'000
2011$'000
Intangibles with a Finite Useful Life
Other non-current assets 10 399 9 734
Less: accumulated amortisation ( 2 624) ( 1 624)
Total 7 775 8 110
Intangibles with an Infinite Useful Life
Other non-current assets 300 300
Less: provision for impairment ( 300) ( 273)
Total 0 27
Capital work in progress 8 624 5 579
Total Intangibles 16 399 13 716
(b) Reconciliation of Movements
2012$'000
2011$'000
Carrying Amount at 1 July 13 716 11 952
Intangible assets - purchases 665 8 503
Transfers - to computer equipment ( 183) 0
Work in progress at cost 3 045 ( 6 203)
Amortisation - intangible assets ( 844) ( 536)
Carrying Amount at 30 June 16 399 13 716
Intangible assets with a finite useful life held by the Agency principally comprise computer software. In addition, the Agency had an intangible asset, being a long-term Community Housing Program Grant, which has been progressively recognised over a period of 11 years and is now finalised.

DHHS Annual Report 2011-2012 - Part 4 - Financial Statements Page 274 of 355
11.9 Other Assets
(a) Carrying Amount
2012$'000
2011$'000
Prepayments 5 090 5 377
Total 5 090 5 377
Utilised within 12 months 3 903 5 377
Utilised in more than 12 months 1 187 0
Total 5 090 5 377
(b) Reconciliation of Movements
2012$'000
2011$'000
Carrying Amount at 1 July 5 377 2 491
Additions 5 090 5 377
Utilised ( 5 377) ( 2 491)
Carrying Amount at 30 June 5 090 5 377
Note 12 Liabilities
12.1 Payables
2012$'000
2011$'000
Creditors 16 549 15 061
Accrued expenses 22 211 25 370
Total 38 760 40 431
Settled within 12 months 38 760 40 431
Total 38 760 40 431
Prepayments are generally utilised within 12 months. An upfront contract payment of $1.5 million to Philips Healthcare Australia in respect of 10 years access to the Statewide Radiology Information and Picture Archive Communication Scheme (RISPACS) has been recognised as a prepayment asset.

DHHS Annual Report 2011-2012 - Part 4 - Financial Statements Page 275 of 355
12.2 Interest Bearing Liabilities
2012$'000
2011$'000
Loans from State Government 111 253 113 277
Loans from Australian Government 98 555 103 343
Total 209 808 216 620
Settled within 12 months 6 968 6 812
Settled in more than 12 months 202 840 209 808
Total 209 808 216 620
12.3 Employee Benefits
2012$'000
2011$'000
Accrued salaries 18 381 13 224
Annual leave 76 888 67 275
Long service leave 104 426 95 536
Sabbatical leave 3 728 2 953
Development leave, time off in lieu and state service accumulated leave scheme 5 069 4 942
Total 208 492 183 930
Settled within 12 months 88 973 76 301
Settled in more than 12 months 119 519 107 629
Total 208 492 183 930
12.4 Superannuation
(a) Type of Plan
The increase in employee benefits, notwithstanding the reduction in numbers of employees, has occurred due to the reduction in market interest rates and correspondingly the rate used for discounting employee leave entitlements.
Tasmanian Ambulance Service Superannuation Scheme
The Tasmanian Ambulance Service Superannuation Scheme (TASSS) balances reported are provided in respect of those employees who are defined benefit members.

DHHS Annual Report 2011-2012 - Part 4 - Financial Statements Page 276 of 355
(b) Superannuation Liability
2012$'000
2011$'000
2012$'000
2011$'000
2012$'000
2011$'000
Present value of gross liability 50 901 40 658 17 402 12 468 68 303 53 126
Fair value of plan assets ( 39 075) ( 37 481) 0 0 ( 39 075) ( 37 481)
Total 11 826 3 177 17 402 12 468 29 228 15 645
Present value of unfunded liability 11 826 3 177 17 402 12 468 29 228 15 645
(Surplus)/Deficit 11 826 3 177 17 402 12 468 29 228 15 645
Net actuarial gains not recognised 0 0 0 0 0 0
Restrictions on assets recognised 0 0 0 0 0 0
Total 0 0 0 0 0 0
Settled within 12 months 1 511 3 177 784 784 2 295 3 961
Settled in more than 12 months 10 315 0 16 618 11 684 26 933 11 684
Total 11 826 3 177 17 402 12 468 29 228 15 645
Housing Tasmania is required to meet the emerging cost of pension payments paid in respect of retired employees, where those employees had a superannuation entitlement that accrued before 1 July 1994.
The State Actuary undertook a revaluation of the present value of the benefit obligation and the fair value of the plan assets as at 30 June 2012 using the process outlined in Australian Accounting Standards Board Standard 119 Employee Benefits. As a result of the revaluation it was determined that the TASSS was in deficit by $11.8 million (2011 $3.18 million deficit). The movement over the financial year was primarily caused by an actuarial loss.
The State Actuary undertook a revaluation of the present value of the benefit obligation and the fair value of the plan assets as at 30 June 2012 using the process outlined in Australian Accounting Standards Board standard 119 Employee Benefits. As a result of the revaluation it was determined that the Housing Tasmania Superannuation Provision totalled $17.4 million (2011 $12.47 million deficit).
The valuation of the superannuation liability relates to the entitlements that accrued before 1 July 1994 for current employees of Housing Tasmania who are members of the Retirement Benefits Fund Contributory Scheme and former employees who were either contributors or non-contributors and who have retained benefits or are current pensioners.
Housing Tasmania Superannuation Provision
Housing Tasmania Superannuation Provision
Total LiabilityTasmanian Ambulance Service Superannuation
Scheme

DHHS Annual Report 2011-2012 - Part 4 - Financial Statements Page 277 of 355
(c) Key Actuarial Assumptions
2012%
2011%
2012%
2011%
Discount rate (net of tax) 3.10 4.80 3.45 5.50
Expected return on assets 7.00 7.50 7.50 7.50
Expected rate of salary increases 4.50 4.50 3.50 4.50
n/a n/a 3.75 4.50
Inflation (pension) n/a n/a 2.50 2.50
(d) Reconciliation of Movements in Present Value of Superannuation Liability
2012$'000
2011$'000
2012$'000
2011$'000
2012$'000
2011$'000
Balance at 1 July 40 658 34 541 12 468 13 726 53 126 48 267
Current service cost 1 909 1 591 0 0 1 909 1 591
Interest cost 1 830 1 628 664 716 2 494 2 344
915 989 0 0 915 989
Actuarial losses/(gains) 7 314 3 086 5 019 ( 1 270) 12 333 1 816
Benefits paid ( 1 144) ( 671) ( 749) ( 704) ( 1 893) ( 1 375)
Other ( 581) ( 506) 0 0 ( 581) ( 506)
Balance at 30 June 50 901 40 658 17 402 12 468 68 303 53 126
Tasmanian Ambulance Service Superannuation
Scheme
Housing Tasmania Superannuation Provision
Contributions by members and transfers from
other funds
Tasmanian Ambulance Service Superannuation
Scheme
Total Liability
Housing Tasmania Superannuation Provision
Expected rate of increase of compulsory
preserved amounts

DHHS Annual Report 2011-2012 - Part 4 - Financial Statements Page 278 of 355
(e) Reconciliation of Movements in Plan Assets
2012$'000
2011$'000
2012$'000
2011$'000
2012$'000
2011$'000
Balance at 1 July 37 481 33 389 0 0 37 481 33 389
Expected return on plan assets 2 548 2 319 0 0 2 548 2 319
Actuarial losses/(gains) ( 1 588) 581 0 0 ( 1 588) 581
Employer contributions 1 445 1 380 749 704 2 194 2 084
Contributions by plan participants 914 989 0 0 914 989
Benefits paid ( 1 144) ( 671) ( 749) ( 704) ( 1 893) ( 1 375)
Other ( 581) ( 506) 0 0 ( 581) ( 506)
Balance at 30 June 39 075 37 481 0 0 39 075 37 481
(f) Return on Plan Assets
RBF assets allocated to the Housing Tasmania Superannuation Provision are nil. Accordingly there is no return on assets for the Housing Tasmania Superannuation Provision.
Housing Tasmania Superannuation Provision
The actual return on plan assets was a $960 000 gain. (2011 $2.9 million gain or approximately 2.51 per cent of average plan assets.) The difference between the expected return on plan assets and the actual return on plan assets is recognised as an actuarial gain or loss.
The expected rate of return on plan assets is based on expected future investment returns for each major asset class net of investment tax and investment fees. The long term expected rate of return (net
of investment tax and investment fees) is 7.50 per cent per annum for the strategic asset allocation of the
plan assets.
Tasmanian Ambulance Service Superannuation
Scheme
Housing Tasmania Superannuation Provision
Total Liability
Tasmanian Ambulance Service Superannuation Scheme

DHHS Annual Report 2011-2012 - Part 4 - Financial Statements Page 279 of 355
2012%
2011%
2012$'000
2011$'000
Australian equity instruments 29.00 26.00 11 332 9 745
International equity instruments 17.00 23.00 6 643 8 621
Fixed income 12.00 12.00 4 689 4 498
Property 32.00 16.00 12 504 5 997
Alternatives/other investments 5.00 19.00 1 954 7 121
Cash 5.00 4.00 1 954 1 499
Total 100.00 100.00 39 075 37 481
2012$'000
2011$'000
2010$'000
2009$'000
2008$'000
Fair value of plan assets 39 075 37 481 33 389 29 934 34 300
Present value of defined benefit obligation 50 901 40 658 34 541 33 490 32 262
Surplus/(deficit) 11 826 3 177 1 152 3 556 ( 2 038)
Experience adjustments on plan liabilities ( 1 203) ( 2 910) 1 299 1 140 ( 317)
Experience adjustments on plan assets ( 1 588) 581 787 ( 6 576) ( 4 401)
2012$'000
2011$'000
2010$'000
2009$'000
2008$'000
Fair value of plan assets 0 0 0 0 0
Present value of defined benefit obligation 17 402 12 468 13 726 13 695 31 097
Surplus/(deficit) 17 402 12 468 13 726 13 695 31 097
Experience adjustments on plan liabilities ( 1 263) 1 060 760 1 196 ( 986)
Experience adjustments on plan assets 0 0 0 0 0
The history of experience adjustments is as follows:
Tasmanian Ambulance Service Superannuation Scheme
Housing TasmaniaSuperannuation Provision
The analysis of the plan assets and the expected rate of return at the balance date is as follows:
Asset Allocation Fair Value of Plan Assets

DHHS Annual Report 2011-2012 - Part 4 - Financial Statements Page 280 of 355
(g) Amounts Recognised in Comprehensive Income
2012$'000
2011$'000
2012$'000
2011$'000
2012$'000
2011$'000
Net Return from Transactions
Current service cost 1 909 1 591 0 0 1 909 1 591
Interest cost 1 830 1 628 664 716 2 494 2 344
Expected return on plan assets ( 2 548) ( 2 319) 0 0 ( 2 548) ( 2 319)
Other Economic Flows Included in Net Result
Actuarial (gains)/losses 8 902 2 505 5 019 ( 1 270) 13 921 1 235
0 0 0 0 0 0
Total 10 093 3 405 5 683 ( 554) 15 776 2 851
(h) Funding Arrangements
The Agency expects to make a contribution of $1.511 million (2011 $1.488 million) to the defined benefit plan for the Tasmanian Ambulance Superannuation Scheme during the next financial year and a contribution of $784 000 (2011 $784 000) for the Housing Tasmania Superannuation Provision.
Adjustments for restrictions on the defined
benefit asset
Housing Tasmania Superannuation Provision
Total Liability
The change for the year has been included in the employee entitlements expense in the Statement of Comprehensive Income.
Contributions to the Tasmanian Ambulance Superannuation Scheme and Housing Tasmania Superannuation Provision in respect of defined benefit schemes are made on an emerging cost basis.
Tasmanian Ambulance Service Superannuation
Scheme

DHHS Annual Report 2011-2012 - Part 4 - Financial Statements Page 281 of 355
12.5 Other Liabilities
2012$'000
2011$'000
Revenue Received in Advance
485 367
Other revenue received in advance 2 589 2 092
Other Liabilities
Employee benefits - on-costs 4 091 13 279
Other liabilities - bank guarantees 404 150
Payroll accrual 27 429 25 319
Other liabilities 8 718 6 048
Total 43 716 47 255
Settled within 12 months 43 302 38 801
Settled in more than 12 months 414 8 454
Total 43 716 47 255
Note 13 Commitments and Contingencies
13.1 Schedule of Commitments
2012$'000
2011$'000
By Type
Capital Commitments
Property, plant and equipment 57 527 71 257
Infrastructure 4 417 50 791
Total Capital Commitments 61 944 122 048
Operating Lease Commitments
Motor vehicles 11 648 28 985
Medical equipment 9 519 6 483
Rent on buildings 62 268 72 225
Information technology 9 797 22 856
Total Lease Commitments 93 232 130 549
Appropriation carried forward from current and previous years under section 8A(2) of the
Public Account Act 1986

DHHS Annual Report 2011-2012 - Part 4 - Financial Statements Page 282 of 355
2012$'000
2011$'000
Other Commitments
RFDS air ambulance standing charge 19 261 1 162
CSHA debt interest 131 197 140 820
Miscellaneous grants 276 423 382 744
Miscellaneous goods and services contracts 12 928 23 470
Total Other Commitments 439 809 548 196
Total 594 985 800 793
By Maturity
Capital Commitments
One year or less 53 941 115 206
From one to five years 8 003 6 842
More than five years 0 0
Total Capital Commitments 61 944 122 048
Operating Lease Commitments
One year or less 33 729 45 649
From one to five years 53 526 68 376
More than five years 5 977 16 524
Total Operating Lease Commitments 93 232 130 549
Other Commitments
One year or less 228 650 254 637
From one to five years 115 144 197 563
More than five years 96 015 95 996
Total Other Commitments 439 809 548 196
Total 594 985 800 793

DHHS Annual Report 2011-2012 - Part 4 - Financial Statements Page 283 of 355
The Agency is party to a Master Facility Agreement. No restrictions, provisions for price adjustments or purchase options are contained in the lease agreement. Terms of leases are set for specific periods. The average period of a lease is six years with an option to renew for a period of twelve months or the initial term, whichever is the lesser.
Medical Equipment (Operating lease)
The Government Motor Vehicle Fleet is managed as part of a Whole-of-Government arrangement with the Agency of Treasury and Finance as lessor. Lease payments vary according to the type of vehicle and, where applicable, the price received for trade-in vehicles. Lease terms for the majority of existing
vehicles are for a period of two years or 40 000 kilometres, whichever comes first, with no change to the lease rate. New vehicle leases are for a period of three years. No restrictions or purchase options are contained in the lease. The 2012 commitment was calculated on the basis of a monthly lease payment and registration but was over reported as the amount used in the calculation was not a monthly payment. The 2013 commitment was calculated on the basis of the annual lease payment plus registration cost of existing vehicles leased as at 30 June 2012. The cost of leases has decreased due to a reduction in lease vehicles to 1 055.
Motor Vehicles (Operating lease)
There has been a significant reduction in Housing Tasmania capital commitments in 2011-2012 from that in 2010-2011 which reflects the completion of commitments undertaken as part of delivery under the Commonwealth Economic Stimulus Program. Capital commitments include $4.4 million for the General Housing program which included $500 000 for the Commonwealth Economic Stimulus Program; $2 million under the State Housing Fund; and, $1.9 million for the development of a Community Centre and two subdivisions at Clarendon Vale. This is a reduction from the prior year, which included more significant commitments in regard to the Commonwealth Economic Stimulus Program. Capital projects for which a contract has not yet been executed include Stainforth Court, North West Land Release, Better Housing Futures Stage 1 and National Partnership Remote Indigenous Housing Stage 3.
Infrastructure
Property, plant and equipment commitments include commitments to either build or improve existing Health and Human Services properties totalling $57.5 million. This includes works associated with the major redevelopment of the Royal Hobart Hospital to a value of $46.5 million; the Launceston General Hospital redevelopment of the Acute Medical and Surgical Unit $1.4 million; Clarence Integrated Care Centre $1.1 million; North West Regional Hospital Car Park $4 million; North West Cancer Care Centre $800 000; and $1.2 million for the redevelopment of the health and hospital facility on King Island.
Property, Plant and Equipment

DHHS Annual Report 2011-2012 - Part 4 - Financial Statements Page 284 of 355
13.2 Contingent Assets and Liabilities
(a) Quantifiable Contingencies
A quantifiable contingent liability is a possible obligation that arises from past events and whose existence will be confirmed only by the occurrence or non-occurrence of one or more uncertain future events not wholly within the control of the entity; or a present obligation that arises from past events but is not recognised because it is not probable that an outflow of resources embodying economic benefits will be required to settle the obligation.
A quantifiable contingent asset is a possible asset that arises from past events and whose existence will be confirmed only by the occurrence or non-occurrence of one or more uncertain future events not wholly within the control of the entity.
Miscellaneous goods and services contracts include Tasmania Affordable Housing Ltd (TAHL) ($2.2 million); $1.8 million to Population Health Services including maintenance services agreements for
Cancer Screening units to a value of $0.5 million; G4S contract of $2.3 million for the security contract at Wilfred Lopes Unit at Risdon Prison; and, $1.2 million medical services for St Helens, Flinders Island and Cape Barren Island.
Miscellaneous Goods and Services Contracts
The Agency’s Grants Unit has commitments of $276.4 million for Disability Services; Home and Community Care Services; Mental Health Support Services; Alcohol and Drug Support Services;
Supported Accommodation Assistance Program projects; and Population Health initiatives. The reduction in commitment reflects the completion of two of the three year terms of Disability Services Grants ($102 million).
Miscellaneous Grants
The Royal Flying Doctor Service (RFDS) charge covers availability of the aircraft and a back up aircraft with pilots available 24 hours a day with other fixtures including a hanger. It does not include variable costs such as flying hours and aviation charges.
Royal Flying Doctor Service Air Ambulance Standing Charge
Contingent assets and liabilities are not recognised in the Statement of Financial Position due to uncertainty regarding the amount or timing of the underlying claim or obligation.
Information Technology has infrastructure and software licence commitments. The reduction in commitment is mainly due to reassessing one-off contracts and contracts that are coming to a close. The Microsoft contract is due to be renegotiated for a three year renewal in December 2012.
Rent on Buildings (Operating Lease)
The Agency leases a range of properties/tenancies around the State for service delivery purposes.
Information Technology

DHHS Annual Report 2011-2012 - Part 4 - Financial Statements Page 285 of 355
2012$'000
2011$'000
Quantifiable Contingent Liabilities
Contingent Claims
Medical and other legal claims 25 165 24 395
Workers compensation 15 208 17 583
Total Quantifiable Contingent Liabilities 40 373 41 978
Quantifiable Contingent Assets
Community housing properties 73 182 54 263
Less accumulated depreciation and amortisation ( 5 401) ( 1 643)
Total Quantifiable Contingent Assets 67 781 52 620
The Agency has 593 open workers’ compensation claims (2011 – 842 open claims). The Agency insures through the TRMF. A one week excess on weekly benefits is payable on every claim. Amounts over the
excess are met by the Fund. The significant number of open claims and value of claims in 2010-2011 reflected the consequence of new workers compensation legislation that commenced on 1 July 2010 and
delays in closing claims. The number of claims has now settled to a more normal level following the spike as a result of the changes to the legislation last financial year.
The Agency manages its legal claims through the Tasmanian Risk Management Fund (TRMF). A $50 000 excess remains payable for every claim. Amounts over that excess are met by the TRMF. Further actuarial advice is being obtained which will be utilised in setting future TRMF premiums.
At 30 June 2012, the Agency had a number of legal claims against it for medical and other liability claims. At the reporting date the amounts of any eventual payments that may be required in relation to these claims have been estimated on information provided by Crown Law for Medical and Other Legal claims and Marsh Pty Ltd for the estimated value of outstanding Workers Compensation contingent claims.
Community housing properties represent dwellings for which legal title is held by community organisations, but for which the Director of Housing holds a legal interest which may be recognised subject to the future management of the properties and viability of the organisations. The Contingent Assets have not been recorded in the Agency's Financial Statements.

DHHS Annual Report 2011-2012 - Part 4 - Financial Statements Page 286 of 355
Note 14 Reserves
14.1 Reserves
2012DHHS
$'000Housing
$'000Total$'000
Asset Revaluation Reserve
Balance at the beginning of financial year 362 314 1 545 814 1 908 128
Revaluation increments/(decrements) 17 244 ( 3 983) 13 261
Balance at End of Financial Year 379 558 1 541 831 1 921 389
2011DHHS
$'000Housing
$'000Total$'000
Asset Revaluation Reserve
Balance at the beginning of financial year 337 061 1 344 401 1 681 462
Revaluation increments/(decrements) 25 253 201 413 226 666
Balance at End of Financial Year 362 314 1 545 814 1 908 128
2012$'000
2011$'000
Contributed Capital Reserve
Balance at the beginning of financial year 6 094 6 094
Balance at End of Financial Year 6 094 6 094
Note 15 Cash Flow Reconciliation
15.1 Cash and Deposits
Asset Revaluation Reserve
The Asset Revaluation Reserve is used to record increments and decrements on the revaluation of Non‑financial assets, as described in Note 2.12 (h).
Capital Contributed ReserveCapital Contributed records capital contributed on formation of the Home Ownership Assistance Program within the Director of Housing.
Cash and deposits includes the balance of the Special Deposits and Trust Fund Accounts held by the Agency, and other cash held, excluding those accounts which are administered or held in a trustee capacity or agency arrangement.

DHHS Annual Report 2011-2012 - Part 4 - Financial Statements Page 287 of 355
2012$'000
2011$'000
Special Deposits and Trust Fund Balance
T440 Tasmanian Guardianship Fund Account 2 2
T470 Patient Trust and Hospital Bequest Account 18 190 15 944
T510 DHHS Operating Account 51 577 29 028
T592 Housing Services Operating Account 7 113 5 494
T647 Home Ownership Assistance Program 11 188 11 940
T680 New Town Mothercraft Home Account 28 28
Total 88 098 62 436
Less Other Cash Held
Patient Trust and Hospital Bequest Account - Legal Trust Funds (720) ( 3 193) ( 2 128)
Other cash equivalents not included above 745 726
Total ( 2 448) ( 1 402)
Total Cash and Deposits 85 650 61 035
15.2 Reconciliation of Net Result to Net Cash from Operating Activities
2012$'000
2011$'000
Net result from transactions (net operating balance) ( 67 609) ( 28 357)
Depreciation and amortisation 61 044 59 467
Prior year grants adjustment 44 244 0
Recognition of assets as a result of stocktake/donations 0 ( 90)
Decrease (increase) in receivables ( 2 041) ( 3 338)
Decrease (increase) in other assets ( 2 159) ( 3 201)
Decrease (increase) in inventories ( 2 567) 631
Increase (decrease) in employee entitlements 24 562 7 177
Increase (decrease) in superannuation 296 768
Increase (decrease) in payables ( 3 760) ( 2 289)
Increase (decrease) in other liabilities ( 3 539) ( 3 249)
Net Cash from (Used By) Operating Activities 48 471 27 519

DHHS Annual Report 2011-2012 - Part 4 - Financial Statements Page 288 of 355
15.3 Acquittal of Capital Investment and Special Capital Investment Funds
(a) Project Expenditure
2012Budget
$'000
2012Actual
$'000
2011Actual
$'000
Capital Investment Program
Disability Services – Supported Accommodation 0 0 2 197
Launceston General Hospital Acute Medical and Surgical Unit 15 931 7 545 16 092
Nation Building - Economic Stimulus Plan: Housing - New Construction Stage 1 0 0 1 522
Nation Building - Economic Stimulus Plan: Housing - New Construction Stage 2 14 794 15 509 70 642
Nation Building - Economic Stimulus Plan: Housing - Repairs and Maintenance 0 0 0
PET-CT Scanner at the Royal Hobart Hospital 0 470 3 837
CCTV Project at Ashley Youth Detention Centre 0 0 263
Clarence GP Super Clinic 500 500 3 617
Housing – new projects 13 786 23 163 25 577
North West Regional Hospital 0 0 29 000
More car parking for North West Regional Hospital 4 000 1 225 29
East Coast Hhlipads 40 10 0
Statewide Cancer Services 13 236 13 579 1 592
National Health and Hospital Network Reforms: Emergency Agencys 3 900 2 894 0
National Health and Hospital Network Reforms: Elective Surgery 3 600 280 0
National Health and Hospital Network Reforms: Flexible Pool 3 200 0 0
Launceston Integrated Care Centre 3 878 6 957 10 310
Launceston General Hospital Emergency Agency 6 251 6 475 4 256
New ambulances 0 0 102
Housing – debt repayment and other 0 7 280 6 669
The Agency received Works and Services Appropriation funding and revenues from Special Capital Investment Funds to fund specific projects.
Cash outflows relating to these projects are listed below by category.
Budget information refers to original estimates and has not been subject to audit.

DHHS Annual Report 2011-2012 - Part 4 - Financial Statements Page 289 of 355
2012Budget
$'000
2012Actual
$'000
2011Actual
$'000
Launceston General Hospital Gas Conversion 0 0 0
Royal Hobart Hospital Redevelopment 20 000 0 0
Royal Hobart Hospital Women's and Children's Hospital 10 000 7 164 0
Total Capital Investment Program 113 116 93 051 175 705
Special Capital Investment Funds
Economic and Social Infrastructure Fund
Hospital Equipment Fund 2 291 1 157 432
Infrastructure Tasmania Fund
Health Information Technology
Child Health Information System 0 0 197
Child Protection Information System Phase Two 0 0 0
Enterprise storage solution 0 0 395
LAN and infrastructure upgrade 1 000 1 002 494
Medical imaging project 965 941 1 691
Mental Health Services Electronic Client Management and Reporting System 1 078 837 440
Messaging and identifier systems 500 499 467
Patient Administration System 0 0 0
Health Infrastructure
Bruny Island Community Health Centre upgrade 0 0 7
Clarence GP Superclinic/ICC 7 846 7 069 4 699
Flinders Island Multi Purpose Centre upgrade 4 877 62 318
Glenorchy – Tier Three Community Health Services Facility 750 257 55
Longford / Westbury Health Centre upgrade 0 159 1 695
Launceston ICC 2 000 860 500
King Island Hospital and Health Centre upgrade 3 200 3 705 392
Kingston – Tier Three Community Health Services Facility 1 000 0 0
Tasmanian Ambulance Service Station upgrade 0 41 49

DHHS Annual Report 2011-2012 - Part 4 - Financial Statements Page 290 of 355
2012Budget
$'000
2012Actual
$'000
2011Actual
$'000
Primary Health Plan implementation – minor works 0 0 3
Launceston General Hospital fire detection system upgrade 0 0 295
Tasmanian Ambulance Station Headquarters upgrade 0 100 2 302
Central Highlands Community Health Centre 0 45 1 291
Hospitals Capital Fund
Launceston General Hospital car park 8 324 8 097 4 563
North West Regional Hospital 0 0 720
Royal Hobart Hospital 51 000 31 527 16 095
Urban Renewal and Heritage Fund
Urban renewal – Bridgewater/Gagebrook 0 136 452
Urban renewal – Bethlehem House 0 0 5
Housing Fund
Housing Fund 23 462 7 868 14 414
Royal Hobart Hospital Redevelopment Fund
Royal Hobart Hospital redevelopment project 0 0 13
Total Special Capital Investment Fund 108 293 64 362 51 984
Total 221 409 157 413 227 689
(b) Reconciliation of Funding Sources
2012$'000
2011$'000
Funding Source Outflows
Expenditure from appropriation receipts - capital 67 925 145 849
Expenditure from revenue streams 26 017 29 856
Expenditure from SCIF 63 471 51 984
Total Cash Outflows 157 413 227 689

DHHS Annual Report 2011-2012 - Part 4 - Financial Statements Page 291 of 355
(c) Classification of Cash Flows
2012$'000
2011$'000
Cash Outflows
Employee benefits 3 687 3 651
Supplies and consumables 12 245 10 549
Grants 5 234 4 559
Payments for acquisition of assets 129 186 202 017
Debt repayment 6 812 6 669
Other cash payments 249 244
Total Cash Outflows 157 413 227 689
15.4 Financing Facilities
Note 16 Financial Instruments
16.1 Risk Exposures
(a) Risk Management Policies
· credit risk
· liquidity risk and
· market risk.
The Head of Agency has overall responsibility for the establishment and oversight of the Agency’s risk management framework. Risk management policies are established to identify and analyse risks faced by the Agency, to set appropriate risk limits and controls, and to monitor risks and adherence to limits.
The project expenditure above is reflected in the Statement of Cash Flows as follows.
The Agency does not have any financing facilities. The balance of the Agency's Westpac Banking Corporation Credit Card settlement account as at 30 June 2012 was $108 000 (30 June 2011 it was $126 000).
The Agency has exposure to the following risks from its use of financial instruments:

DHHS Annual Report 2011-2012 - Part 4 - Financial Statements Page 292 of 355
(b) Credit Risk Exposures
2012$'000
2011$'000
Guarantee provided 0 0
Total 0 0
Loans and receivables are recognised at the nominal amounts
due, less any provision for impairment.
Collectability of debts is reviewed on a monthly basis.
Provisions are made when the collection of the debt is judged
to be less rather than more likely.
Equity Investments are recognised at the nominal amounts due,
less any provision for impairment.
Other financial assets are recognised at the nominal amounts
due, less any provision for impairment.
Cash and deposits are recognised at face value.
Accounting and Strategic Policies (Including
Recognition Criteria and Measurement Basis)
Credit risk is the risk of financial loss to the Agency if a customer or counterparty to a financial instrument fails to meet its contractual obligations.
Financial Instrument
Cash means notes, coins and any deposits
held at call with a bank or financial institution.
Other financial assets credit terms are
generally 45 days.
Equity investments credit terms require the
repayment of the Agency equity interest in a
land and building asset, in cash, within a
maximum term of 15 years.
Loans and Receivables
Nature of Underlying Instrument (Including Significant Terms and Conditions Affecting the Amount, Timing and Certainty of Cash Flows)
Receivables credit terms are generally 45
days.
Equity Investments
Financial Assets
Other Financial Assets
Cash and Deposits
The Agency has made no changes to its credit risk policy during 2011-2012. The Agency does not hold any security instrument for its Cash and deposits, Other financial assets and receivables. Loan advances are secured by a mortgage over real property. Equity investments represent the Agency’s equity interest in land and building assets sold to Housing Tasmania clients and payable in cash within 15 years. The equity investments are revalued on a yearly basis. No credit terms on any Agency financial assets have been renegotiated.
Except as detailed in the following table, the carrying amount of financial assets recorded in the Financial Statements, net of any allowances for losses, represents the Agency's maximum exposure to credit risk
without taking into account any collateral or other security:

DHHS Annual Report 2011-2012 - Part 4 - Financial Statements Page 293 of 355
Analysis of financial assets that are past due at 30 June 2012 but not impaired.
Past due < 30 days
$'000
Past due 30-120 days
$'000
Past due >120 days
$'000
Total $'000
Receivables 3 624 1 879 5 853 11 356
Analysis of financial assets that are past due at 30 June 2011 but not impaired.Past due
< 30 days $'000
Past due 30-120 days
$'000
Past due >120 days
$'000
Total $'000
Receivables 2 133 1 426 2 550 6 109
(c) Liquidity Risk
Financial Liabilities
The Agency regularly reviews budgeted and actual cash
outflows to ensure that there is sufficient cash to meet all
obligations.
Other Financial Liabilities
Accounting and strategic policies (including recognition
criteria and measurement basis)
Loans are initially measured at fair value net of transaction
costs. Loans are subsequently measured at amortised cost
using the effective interest rate method, with interest expense
recognised on an effective yield basis.
Settlement is usually made within 30 days.Payables, including goods received and services incurred but
not yet invoiced, are recognised at amortised cost, which due
to the short settlement period equates to face value, when the
Agency becomes obliged to make future payments as a result
of a purchase of assets or services.
Payables
Other financial liabilities are recognised at amortised cost,
which due to the short settlement period equates to face value,
when the Agency becomes obliged to make payments as a
result of the purchase of assets or services.
The following tables analyse financial assets that are past due but not impaired.
Liquidity risk is the risk that the Agency will not be able to meet its financial obligations as they fall due. The Agency’s approach to managing liquidity is to ensure that it will always have sufficient liquidity to meet its liabilities when they fall due.
Financial Instrument Nature of underlying instrument (including significant terms and conditions affecting the amount, timing and certainty of cash flows)
Contractual payments are made in
accordance with contractual terms.
Interest Bearing Liabilities
Settlement is usually made within 30 days.

DHHS Annual Report 2011-2012 - Part 4 - Financial Statements Page 294 of 355
Maturity Analysis for Financial Liabilities
1 Year$'000
2 Years$'000
3 Years$'000
4 Years$'000
5 Years$'000
More than 5 Years
$'000
Undiscounted
TotalCarrying Amount
$'000
Financial Liabilities
Payables 38 760 0 0 0 0 0 38 760 38 760
6 968 7 147 7 328 7 456 7 617 173 292 209 808 209 808
36 147 0 0 0 0 0 36 147 36 147
Total 81 875 7 147 7 328 7 456 7 617 173 292 284 715 284 715
Maturity Analysis for Financial Liabilities
1 Year$'000
2 Years$'000
3 Years$'000
4 Years$'000
5 Years$'000
More than 5 Years
$'000
Undiscounted
TotalCarrying Amount
$'000
Financial Liabilities
Payables 40 431 0 0 0 0 0 40 431 40 431
6 812 6 968 7 147 7 328 7 456 180 909 216 620 216 620
31 367 0 0 0 0 0 31 367 31 367
Total 78 610 6 968 7 147 7 328 7 456 180 909 288 418 288 418
(d) Market Risk
2012
2011
Other financial
liabilities
Interest bearing
liabilitiesOther financial
liabilities
Market risk is the risk that the fair value of future cash flows of a financial instrument will fluctuate because of changes in market prices. The primary market risk that the Agency is exposed to is interest rate risk.
The Agency currently has the majority of its financial liabilities at fixed interest rates with the effect that any exposure to movements in interest rates is minimised.
The following tables detail the undiscounted cash flows payable by the Agency by remaining contractual maturity for its financial liabilities. It should be noted that as these are undiscounted, totals may not reconcile to the carrying amounts presented in the Statement of Financial Position.
Interest bearing
liabilities

DHHS Annual Report 2011-2012 - Part 4 - Financial Statements Page 295 of 355
2012$'000
2011$'000
Fixed Rate Instruments
Financial assets 0 0
Financial liabilities 209 808 216 620
Total 209 808 216 620
Variable Rate Instruments
Financial assets 4 567 5 855
Financial liabilities 0 0
Total 4 567 5 855
Sensitivity Analysis of Agency’s Exposure to Possible Changes in Interest Rates
100 basis points
increase$'000
100 basis points
decrease$'000
100 basis points
increase$'000
100 basis points
decrease$'000
30 June 2012
Financial assets 46 ( 46) 46 ( 46)
Financial liabilities 0 0 0 0
Net sensitivity 46 ( 46) 46 ( 46)
30 June 2011
Financial assets 59 ( 59) 59 ( 59)
Financial liabilities 0 0 0 0
Net sensitivity 59 ( 59) 59 ( 59)
This analysis assumes all other variables remain constant. The analysis was performed on the same basis for 2011.
Statement of Comprehensive Income
At the reporting date, the interest rate profile of the Agency’s interest bearing financial instruments was:
(e) Changes in variable rates of 100 basis points at reporting date would have the following effect on the Agency’s profit or loss and equity:
Equity
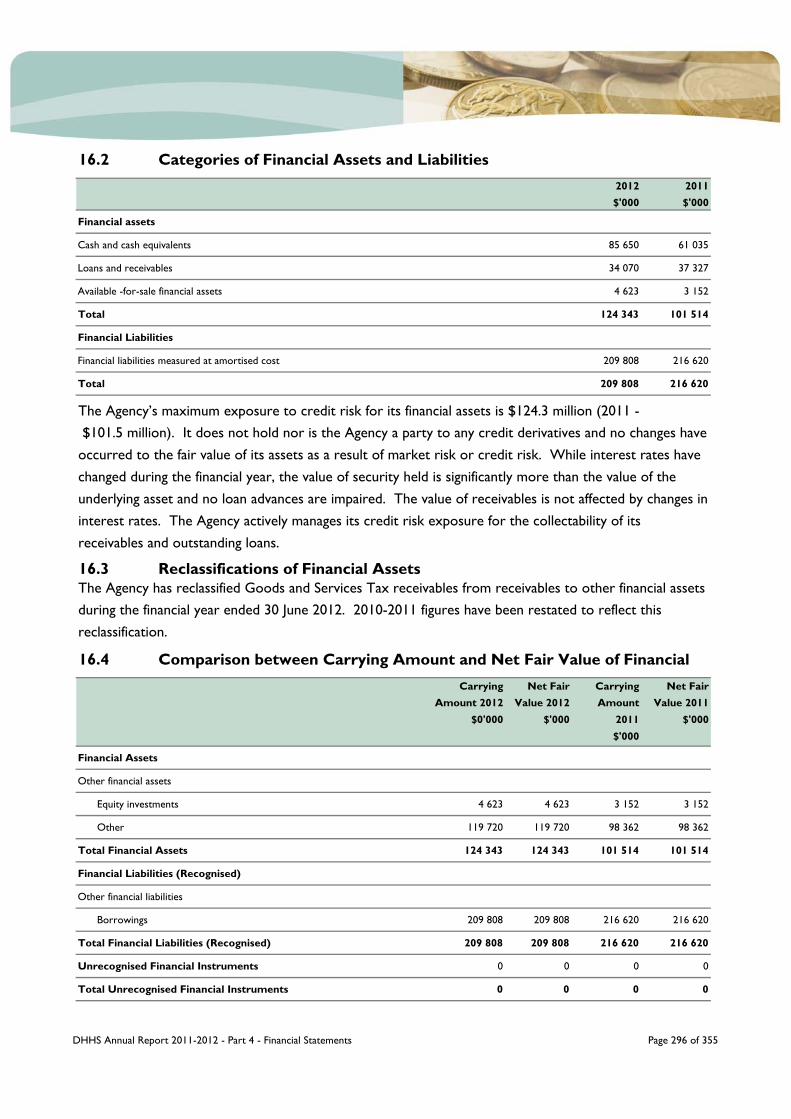
DHHS Annual Report 2011-2012 - Part 4 - Financial Statements Page 296 of 355
16.2 Categories of Financial Assets and Liabilities2012$'000
2011$'000
Financial assets
Cash and cash equivalents 85 650 61 035
Loans and receivables 34 070 37 327
Available -for-sale financial assets 4 623 3 152
Total 124 343 101 514
Financial Liabilities
Financial liabilities measured at amortised cost 209 808 216 620
Total 209 808 216 620
16.3 Reclassifications of Financial Assets
Carrying Amount 2012
$0'000
Net Fair Value 2012
$'000
Carrying Amount
2011$'000
Net Fair Value 2011
$'000
Financial Assets
Other financial assets
Equity investments 4 623 4 623 3 152 3 152
Other 119 720 119 720 98 362 98 362
Total Financial Assets 124 343 124 343 101 514 101 514
Financial Liabilities (Recognised)
Other financial liabilities
Borrowings 209 808 209 808 216 620 216 620
Total Financial Liabilities (Recognised) 209 808 209 808 216 620 216 620
Unrecognised Financial Instruments 0 0 0 0
Total Unrecognised Financial Instruments 0 0 0 0
The Agency has reclassified Goods and Services Tax receivables from receivables to other financial assets during the financial year ended 30 June 2012. 2010-2011 figures have been restated to reflect this reclassification.
The Agency’s maximum exposure to credit risk for its financial assets is $124.3 million (2011 - $101.5 million). It does not hold nor is the Agency a party to any credit derivatives and no changes have occurred to the fair value of its assets as a result of market risk or credit risk. While interest rates have changed during the financial year, the value of security held is significantly more than the value of the underlying asset and no loan advances are impaired. The value of receivables is not affected by changes in interest rates. The Agency actively manages its credit risk exposure for the collectability of its receivables and outstanding loans.
16.4 Comparison between Carrying Amount and Net Fair Value of Financial

DHHS Annual Report 2011-2012 - Part 4 - Financial Statements Page 297 of 355
16.5 Net Fair Values of Financial Assets and LiabilitiesNet Fair
Value Level 1$'000
Net Fair Value Level
2$'000
Net Fair Value Level
3$'000
Net Fair Value Total
$000
Financial Assets
Other financial assets
Equity investments 4 623 0 0 4 623
Other 0 0 0 0
Total Financial Assets 4 623 0 0 4 623
Financial Liabilities (Recognised)
Other financial liabilities
Borrowings 0 0 0 0
Other 0 0 0 0
Total Financial Liabilities (Recognised) 0 0 0 0
Unrecognised Financial Instruments 0 0 0 0
Total Unrecognised Financial Instruments 0 0 0 0
Net Fair Value Level 1
$'000
Net Fair Value Level
2$'000
Net Fair Value Level
3$'000
Net Fair Value Total
$000
Financial Assets
Other financial assets
Equity investments 3 152 0 0 3 152
Other 0 0 0 0
Total Financial Assets 3 152 0 0 3 152
Financial Liabilities (Recognised)
Other financial liabilities
Borrowings 0 0 0 0
Other 0 0 0 0
Total Financial Liabilities (Recognised) 0 0 0 0
Unrecognised Financial Instruments 0 0 0 0
Total Unrecognised Financial Instruments 0 0 0 0
2012
2011

DHHS Annual Report 2011-2012 - Part 4 - Financial Statements Page 298 of 355
Transfer between Categories
Financial Assets
Financial Liabilities
Unrecognised Financial Instruments
Level 3 – the fair value is estimated using inputs for the asset or liability that are not based on observable market data.
The net fair values of cash and non-interest bearing monetary financial assets approximate their carrying amounts.
The net fair values of Equity investments are based on the Agency interest in the various land and building assets. An active market exists for the underlying assets that provides for a reliable measurement of the fair value of the Equity investment. The land and building assets were valued as at 31 October 2011 by the Valuer-General using a mix of onsite revaluations and suburb based indices adjustments with the increase or decrease recognised in the Statement of Comprehensive Income.
The net fair values of Borrowings and Other financial liabilities are based on the outstanding value owed by the Agency and are approximated by their carrying amounts.
The net fair values of indemnities are regarded as the maximum possible loss which the State faces while the indemnity remains current.
The Agency did not transfer any financial assets or financial liabilities between Level 1 and Level 2. The Agency does not have any Level 3 instruments.
The recognised fair values of financial assets and financial liabilities are classified according to the fair value hierarchy that reflects the significance of the inputs used in making these measurements. The Agency uses various methods in estimating the fair value of a financial instrument. The methods comprise:
Level 1 – the fair value is calculated using quoted prices in active markets
Level 2 – the fair value is estimated using inputs other than quoted prices included in Level 1 that are observable for the asset or liability, either directly (as prices) or indirectly (derived from prices) and

DHHS Annual Report 2011-2012 - Part 4 - Financial Statements Page 299 of 355
Note 17 Details of Consolidated Entities
17.1 List of Entities
Director of Housing 100 per cent per annum
Director of Ambulance Services 100 per cent per annum
Tasmanian Affordable Housing Limited
Statement of Comprehensive Income for the Year Ending 30 June 20122012$'000
2011$'000
Total Revenue and Other Income from Transactions 2 122 2 550
Expenses from Transactions
Property management expenses 1 778 1 072
Management expenses 251 395
Other expenses 46 115
Total Expenses from Transactions 2 075 1 582
Net Result from Transactions (Net Operating Balance) 47 968
Comprehensive Result 47 968
The following entities have been consolidated by the Agency:
TAHL has not been consolidated into the Agency’s financial statements as at 30 June 2012. The unaudited Statement of Comprehensive Income for the year ending 30 June 2012 and Statement of Financial Position as at 30 June 2012 are provided below.
On 11 March 2011, the Crown, represented by the Minister for Human Services, became the sole shareholder of the shares in Tasmanian Affordable Housing Limited (TAHL), thus assuming control of TAHL as a wholly owned Government entity.
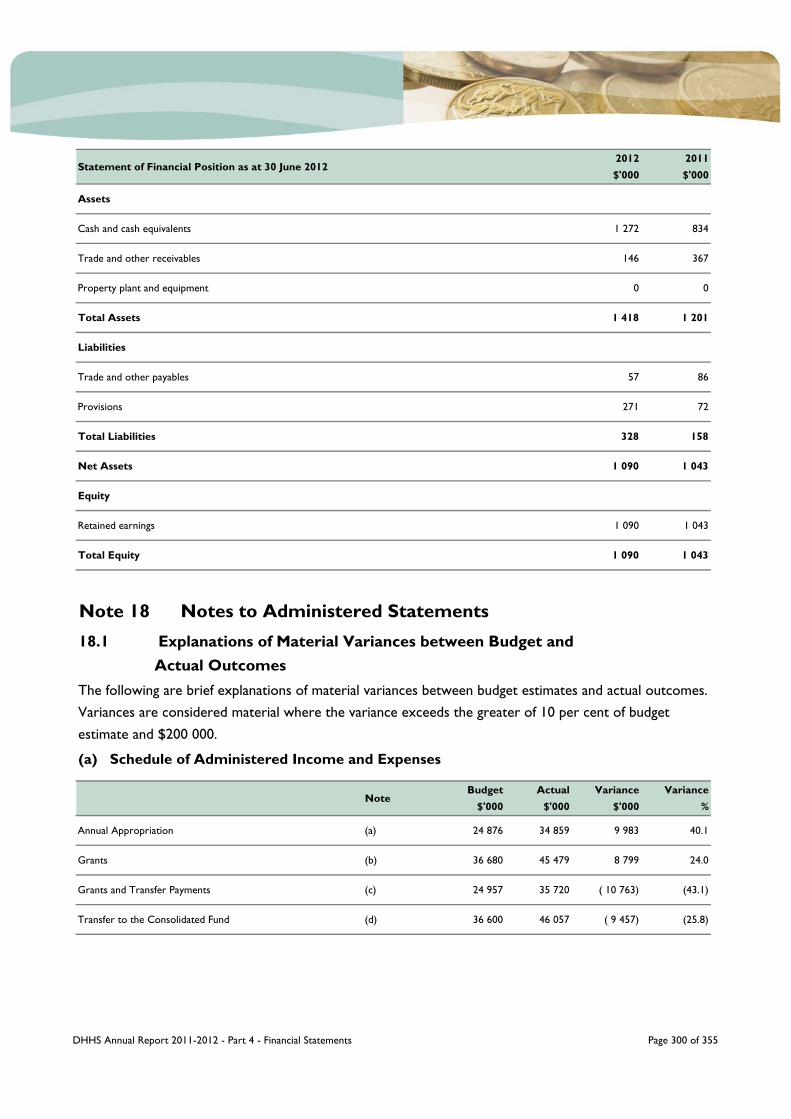
DHHS Annual Report 2011-2012 - Part 4 - Financial Statements Page 300 of 355
Statement of Financial Position as at 30 June 20122012$'000
2011$'000
Assets
Cash and cash equivalents 1 272 834
Trade and other receivables 146 367
Property plant and equipment 0 0
Total Assets 1 418 1 201
Liabilities
Trade and other payables 57 86
Provisions 271 72
Total Liabilities 328 158
Net Assets 1 090 1 043
Equity
Retained earnings 1 090 1 043
Total Equity 1 090 1 043
Note 18 Notes to Administered Statements
(a) Schedule of Administered Income and Expenses
NoteBudget
$'000Actual
$'000Variance
$'000Variance
%
Annual Appropriation (a) 24 876 34 859 9 983 40.1
Grants (b) 36 680 45 479 8 799 24.0
Grants and Transfer Payments (c) 24 957 35 720 ( 10 763) (43.1)
Transfer to the Consolidated Fund (d) 36 600 46 057 ( 9 457) (25.8)
The following are brief explanations of material variances between budget estimates and actual outcomes. Variances are considered material where the variance exceeds the greater of 10 per cent of budget estimate and $200 000.
18.1 Explanations of Material Variances between Budget and Actual Outcomes

DHHS Annual Report 2011-2012 - Part 4 - Financial Statements Page 301 of 355
(b) Schedule of Administered Assets and Liabilities
NoteBudget
$'000Actual
$'000Variance
$'000Variance
%
Schedule of Administered Assets and Liabilities
Receivables (a) 2 489 3 988 1 499 60.2
Payables (b) 6 036 8 041 ( 2 005) (33.2)
(d) Relates to an increase in Australian Government funding for Commonwealth Own Purpose Expenditure, such as high cost drugs.
(b) Relates to an increase in Australian Government funding for Commonwealth Own Purpose Expenditure, such as high cost drugs.
(c) Relates to higher than budgeted Community Service Obligation claims from Aurora Energy and unbudgeted ex-gratia payments in relation to Listen to the Children compensation scheme
Notes to Schedule of Administered Income and Expenses Variances
(a) Relates to higher than budgeted Community Service Obligation claims from Aurora Energy and unbudgeted ex-gratia payments in relation to Listen to the Children compensation scheme

DHHS Annual Report 2011-2012 - Part 4 - Financial Statements Page 302 of 355
(c) Schedule of Administered Cash Flows
NoteBudget
$'000Actual
$'000Variance
$'000Variance
%
Schedule of Administered Cash Flows
Annual appropriation (a) 24 876 34 859 9 983 40.1
Grants (b) 36 600 46 057 9 457 25.8
Grants and transfer payments (c) ( 24 876) ( 34 859) ( 9 983) (40.1)
Transfer to the consolidated fund (d) ( 36 600) ( 46 057) ( 9 457) (25.8)
18.2 Administered Underlying Net Operating Balance
(b) Represents higher than budgeted Aurora Energy Community Service Obligation claim accrued as at 30 June 2012 in respect of April-June 2012 quarter.
Notes to Schedule of Administered Cash Flow Variances
(a) Relates to higher than budgeted Community Service Obligation claims from Aurora Energy and unbudgeted ex-gratia payments in relation to Listen to the Children compensation scheme
(a) Reflects higher than budgeted Australian Government Grants accrued but not paid as at 30 June 2012.
Notes to Schedule of Administered Assets and Liabilities Variances
Administered non-operational capital funding is the income from transactions relating to funding for capital projects. This funding is classified as income from transactions and included in the net operating balance. However, the corresponding capital expenditure is not included in the calculation of the net operating balance. Accordingly, the net operating balance will portray a position that is better than the true underlying financial position.
For this reason, the net operating result is adjusted to remove the effects of funding for capital projects.
(b) Relates to an increase in Australian Government funding for Commonwealth Own Purpose Expenditure, including high cost drug expenditure.
(c) Relates to higher than budgeted Community Service Obligation claims from Aurora Energy and unbudgeted ex-gratia payments in relation to Listen to the Children compensation scheme.
(d) Relates to an increase in Australian Government funding for Commonwealth Own Purpose Expenditure, including high cost drug expenditure.
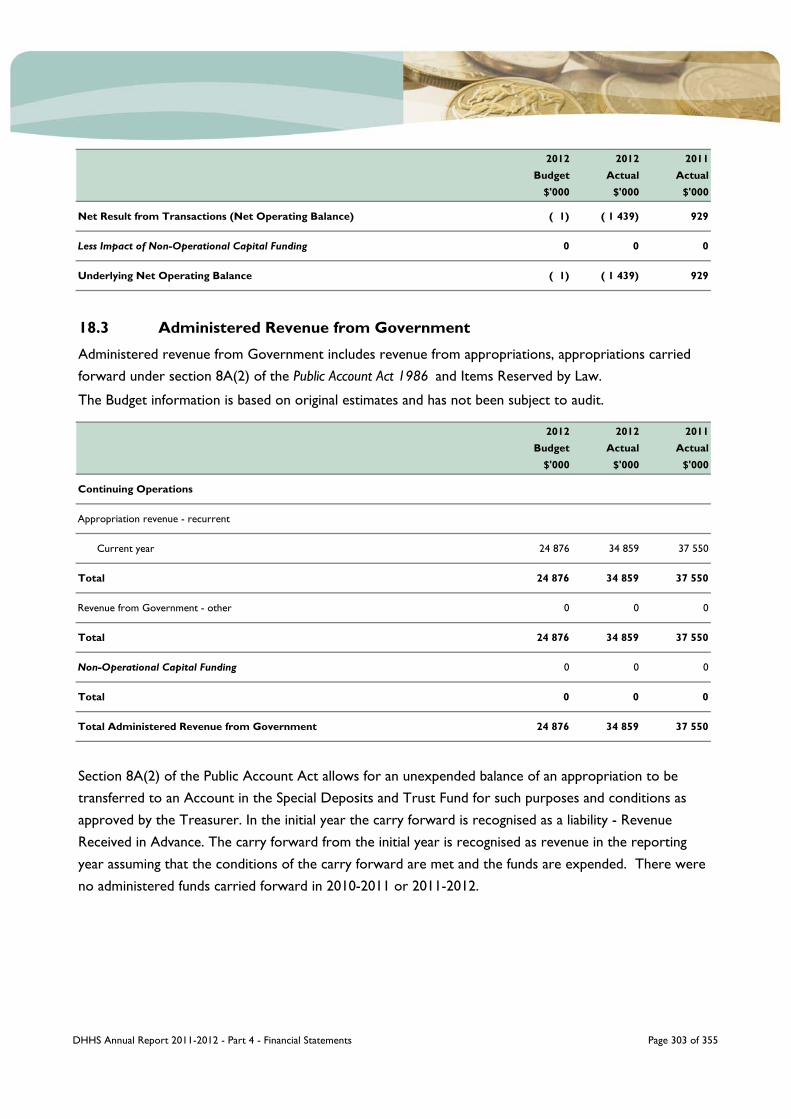
DHHS Annual Report 2011-2012 - Part 4 - Financial Statements Page 303 of 355
2012Budget
$'000
2012Actual
$'000
2011Actual
$'000
Net Result from Transactions (Net Operating Balance) ( 1) ( 1 439) 929
Less Impact of Non-Operational Capital Funding 0 0 0
Underlying Net Operating Balance ( 1) ( 1 439) 929
18.3 Administered Revenue from Government
2012Budget
$'000
2012Actual
$'000
2011Actual
$'000
Continuing Operations
Appropriation revenue - recurrent
Current year 24 876 34 859 37 550
Total 24 876 34 859 37 550
Revenue from Government - other 0 0 0
Total 24 876 34 859 37 550
Non-Operational Capital Funding 0 0 0
Total 0 0 0
Total Administered Revenue from Government 24 876 34 859 37 550
Administered revenue from Government includes revenue from appropriations, appropriations carried forward under section 8A(2) of the Public Account Act 1986 and Items Reserved by Law.
The Budget information is based on original estimates and has not been subject to audit.
Section 8A(2) of the Public Account Act allows for an unexpended balance of an appropriation to be transferred to an Account in the Special Deposits and Trust Fund for such purposes and conditions as approved by the Treasurer. In the initial year the carry forward is recognised as a liability - Revenue Received in Advance. The carry forward from the initial year is recognised as revenue in the reporting
year assuming that the conditions of the carry forward are met and the funds are expended. There were no administered funds carried forward in 2010-2011 or 2011-2012.

DHHS Annual Report 2011-2012 - Part 4 - Financial Statements Page 304 of 355
18.4 Administered Grants
2012$'000
2011$'000
Continuing Operations
Grants from the Australian Government
General grants 45 479 46 133
Total Administered Revenue from Grants 45 479 46 133
18.5 Administered Grants and Subsidies
2012$'000
2011$'000
Grants and Transfer Payments 35 720 38 734
Total 35 720 38 734
Recurrent and Capital grants received from the Australian Government are specific purpose grants provided for the Australian Health Care Agreement; specialised drugs; home and community care; public health outcomes funding agreement; Commonwealth-State housing agreement; supported accommodation assistance; disability services; general housing and health. All monies have been paid to the Department of Treasury and Finance in terms of the agreement. From 1 July 2009 the Australian Government and the state and territory governments agreed to pay any grants direct to the state and territory Treasury Agencies.
The Agency provides ex-gratia payments of $2.6 million as part of the Children Abused in Care program.
The Agency provides funding of $33.1 million to Aurora Energy Pty Ltd for the purpose of providing a subsidy to eligible Tasmanian pensioners and Health Care Card holders on their electricity accounts.

DHHS Annual Report 2011-2012 - Part 4 - Financial Statements Page 305 of 355
18.6 Administered Receivables
2012$'000
2011$'000
Receivables 3 988 4 446
Less: provision for Impairment 0 0
Total 3 988 4 446
Sales of goods and services (inclusive of GST) 3 988 4 446
Total 3 988 4 446
Settled within 12 months 3 988 4 446
Total 3 988 4 446
18.7 Administered Payables
2012$'000
2011$'000
Other creditors 8 041 7 059
Total 8 041 7 059
Settled within 12 months 8 041 7 059
Total 8 041 7 059
2012$'000
2011$'000
Net result from transactions (net operating balance) ( 1 439) 929
Decrease (increase) in receivables 458 ( 2 113)
Increase (decrease) in payables 981 1 184
Net Cash From (Used By) Operating Activities 0 0
18.8 Reconciliation of Administered Net Result to Net Cash from Administered Operating Activities

DHHS Annual Report 2011-2012 - Part 4 - Financial Statements Page 306 of 355
18.9 Financial Instruments (Administered)
(a) Risk Management Policies
· credit risk
· liquidity risk and
· market risk.
(b) Credit Risk Exposures
Analysis of administered financial assets that are past due at 30 June 2012 but not impaired.Past due
< 30 days $'000
Past due 30-120 days
$'000
Past due >120 days
$'000
Total $'000
Receivables 0 0 2 544 2 544
Analysis of administered financial assets that are past due at 30 June 2011 but not impaired.Past due
< 30 days $'000
Past due 30-120 days
$'000
Past due >120 days
$'000
Total $'000
Receivables 2 622 0 0 2 622
The Head of Agency has overall responsibility for the establishment and oversight of the Agency’s risk management framework. Risk management policies are established to identify and analyse risks faced by the Agency, to set appropriate risk limits and controls, and to monitor risks and adherence to limits.
Credit risk is the risk of financial loss to the Agency if a customer or counterparty to a financial instrument fails to meet its contractual obligations.
The carrying amount of administered financial assets recorded in the Financial Statements, net of any allowances for losses, represents the Agencys maximum exposure to credit risk.
The following tables analyse financial assets that are past due but not impaired.
Financial Assets
The Agency has exposure to the following risks from its use of financial instruments:
Financial Instrument
Receivables are recognised at the nominal
amounts due, less any provision for
impairment.
Collectability of debts is reviewed on a
monthly basis. Provisions are made when the
collection of the debt is judged to be less
rather than more likely.
Receivables Receivables credit terms are generally 45 days.
Cash and Deposits Cash and deposits are recognised at face
value.
Cash means notes, coins and any deposits held at call with a
bank or financial institution.
Accounting and Strategic Policies (Including Recognition Criteria and Measurement Basis)
Nature of Underlying Instrument (Including Significant Terms and Conditions Affecting the Amount, Timing and Certainty of Cash Flows)

DHHS Annual Report 2011-2012 - Part 4 - Financial Statements Page 307 of 355
(c) Liquidity Risk
Maturity Analysis for Administered Financial Liabilities
1 Year $'000 2 Years $'000
3 Years $'000
4 Years $'000
5 Years $'000
More than 5 Years
$'000
Undiscounted
Total$'000
Carrying Amount
$'000
Financial liabilities
Payables 8 041 0 0 0 0 0 8 041 8 041
Total 8 041 0 0 0 0 0 8 041 8 041
Maturity Analysis for Administered Financial Liabilities
1 Year $'000 2 Years $'000
3 Years $'000
4 Years $'000
5 Years $'000
More than 5 Years
$'000
Undiscounted
Total$'000
Carrying Amount
$'000
Financial Liabilities
Payables 7 059 0 0 0 0 0 7 059 7 059
Total 7 059 0 0 0 0 0 7 059 7 059
Financial InstrumentAccounting and Strategic Policies (Including Recognition Criteria and Measurement Basis)
Nature of Underlying Instrument (Including Significant Terms and Conditions Affecting the Amount, Timing and Certainty of Cash Flows)
Liquidity risk is the risk that the Agency will not be able to meet its financial obligations as they fall due. The Agency’s approach to managing liquidity is to ensure that it will always have sufficient liquidity to meet its liabilities when they fall due.
2011
2012
The following tables detail the undiscounted cash flows payable by the Agency by remaining contractual maturity for its financial liabilities. It should be noted that as these are undiscounted, totals may not reconcile to the carrying amounts presented in the Statement of Financial Position.
Financial Liabilities
Payables, including goods received and
services incurred but not yet invoiced, are
recognised at amortised cost, which due to
the short settlement period equates to face
value, when the Agency becomes obliged to
make future payments as a result of a
purchase of assets or services.
The Agency regularly reviews budgeted and
actual cash outflows to ensure that there is
sufficient cash to meet all obligations
Payables Settlement is usually made within 30 days.

DHHS Annual Report 2011-2012 - Part 4 - Financial Statements Page 308 of 355
(d) Market Risk
2012$'000
2011$'000
Administered Fixed Rate Instruments
Financial assets 0 0
Financial liabilities 0 0
Total 0 0
Administered Variable Rate Instruments
Financial assets 0 0
Financial liabilities 0 0
Total 0 0
Sensitivity Analysis of Agency’s Exposure to Possible Changes in Interest Rates
100 Basis Points
Increase $'000
100 Basis Points
Increase $'000
100 Basis Points
Increase $'000
100 Basis Points
Increase $'000
30 June 2012
Financial assets 0 0 0 0
Financial liabilities 0 0 0 0
Net Sensitivity 0 0 0 0
30 June 2011
Financial assets 0 0 0 0
Financial liabilities 0 0 0 0
Net Sensitivity 0 0 0 0
At the reporting date, the Agency did not have any administered interest bearing financial instruments. Accordingly, exposure to interest rate risk from administered interest bearing financial instruments was nil.
The Agency did not have any administered interest bearing financial instruments. Accordingly changes in variable rates of 100 basis points at reporting date would have a nil effect on the Agency’s surplus or deficit and equity.
Statement of Comprehensive Income
This analysis assumes all other variables remain constant. The analysis was performed on the same basis for 2011.
Market risk is the risk that the fair value of future cash flows of a financial instrument will fluctuate because of changes in market prices. The primary market risk that the Agency is exposed to is interest rate risk.
Equity

DHHS Annual Report 2011-2012 - Part 4 - Financial Statements Page 309 of 355
18.10 Categories of Administered Financial Assets and Liabilities
2012$'000
2011$'000
Administered Financial Assets
Loans and receivables 3 988 4 446
Total 3 988 4 446
Administered Financial Liabilities
Financial liabilities at fair value through profit and loss 8 041 7 059
Total 8 041 7 059
Net Fair Value Level
1$'000
Net Fair Value Level
2$'000
Net Fair Value Level
3$'000
Net Fair Value Total
$000
Administered Financial Assets
Receivables 3 988 3 988 4 446 4 446
Total Administered Financial Assets 3 988 3 988 4 446 4 446
Administered Financial Liabilities (Recognised)
Trade creditors 8 041 8 041 7 059 7 059
Total Administered Financial Liabilities (Recognised) 8 041 8 041 7 059 7 059
Unrecognised Administered Financial Instruments 0 0 0 0
Total Unrecognised Administered Financial Instruments 0 0 0 0
18.11 Comparison between Carrying Amount and Net Fair Value of Financial Assets and Liabilities

DHHS Annual Report 2011-2012 - Part 4 - Financial Statements Page 310 of 355
18.12 Net Fair Values of Administered Financial Assets and Liabilities2012 Net Fair
Value Level 1
$'000
Net Fair Value Level
2$'000
Net Fair Value Level
3$'000
Net Fair Value Total
$000
Administered Financial Assets
Other 0 0 0 0
Total Administered Financial Assets 0 0 0 0
Administered Financial Liabilities (Recognised)
Other 0 0 0 0
Total Administered Financial Liabilities (Recognised) 0 0 0 0
Unrecognised Administered Financial Instruments 0 0 0 0
Total Unrecognised Administered Financial Instruments 0 0 0 0
2011 Net Fair Value Level 1
$'000
Net Fair Value Level
2$'000
Net Fair Value Level
3$'000
Net Fair Value Total
$000
Administered Financial Assets
Other 0 0 0 0
Total Administered Financial Assets 0 0 0 0
Administered Financial Liabilities (Recognised)
Other 0 0 0 0
Total Administered Financial Liabilities (Recognised) 0 0 0 0
Unrecognised Administered Financial Instruments 0 0 0 0
Total Unrecognised Administered Financial Instruments 0 0 0 0
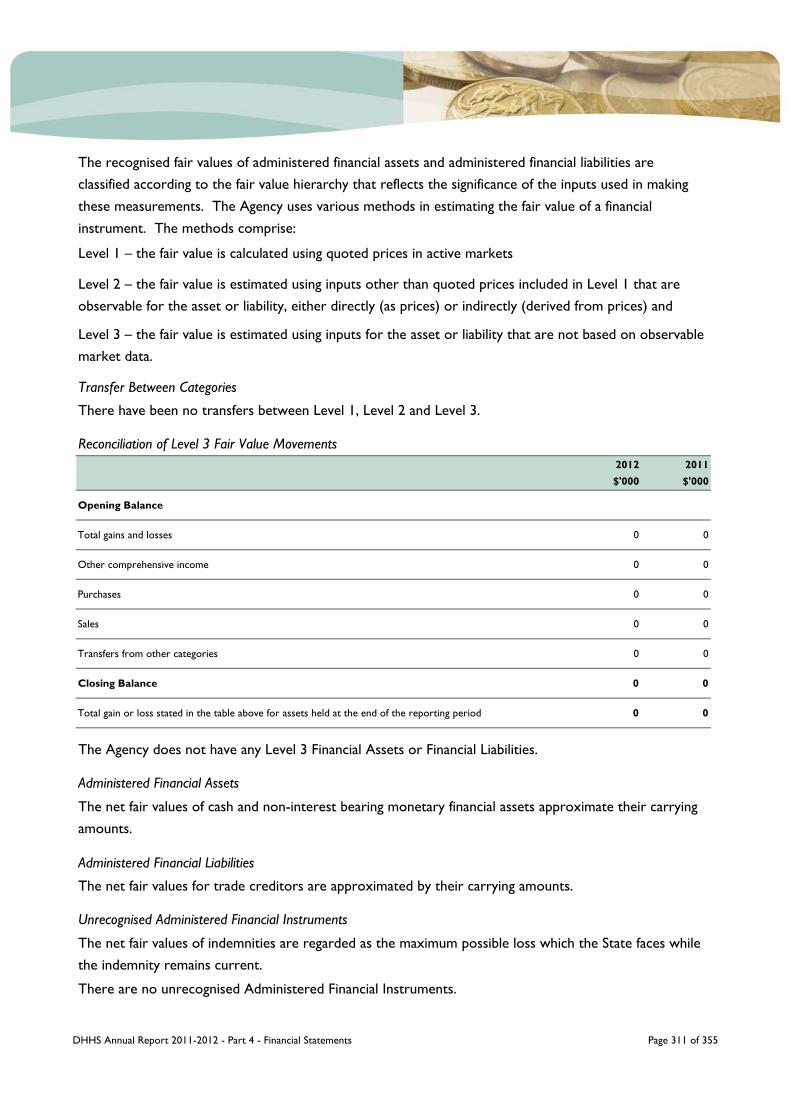
DHHS Annual Report 2011-2012 - Part 4 - Financial Statements Page 311 of 355
2012$'000
2011$'000
Opening Balance
Total gains and losses 0 0
Other comprehensive income 0 0
Purchases 0 0
Sales 0 0
Transfers from other categories 0 0
Closing Balance 0 0
Total gain or loss stated in the table above for assets held at the end of the reporting period 0 0
Administered Financial Assets
The net fair values of cash and non-interest bearing monetary financial assets approximate their carrying amounts.
Level 1 – the fair value is calculated using quoted prices in active markets
Level 2 – the fair value is estimated using inputs other than quoted prices included in Level 1 that are observable for the asset or liability, either directly (as prices) or indirectly (derived from prices) and
Level 3 – the fair value is estimated using inputs for the asset or liability that are not based on observable market data.
Transfer Between Categories
There have been no transfers between Level 1, Level 2 and Level 3.
Reconciliation of Level 3 Fair Value Movements
The Agency does not have any Level 3 Financial Assets or Financial Liabilities.
The net fair values for trade creditors are approximated by their carrying amounts.
Unrecognised Administered Financial Instruments
The net fair values of indemnities are regarded as the maximum possible loss which the State faces while the indemnity remains current.
There are no unrecognised Administered Financial Instruments.
The recognised fair values of administered financial assets and administered financial liabilities are classified according to the fair value hierarchy that reflects the significance of the inputs used in making these measurements. The Agency uses various methods in estimating the fair value of a financial instrument. The methods comprise:
Administered Financial Liabilities

DHHS Annual Report 2011-2012 - Part 4 - Financial Statements Page 312 of 355
Account/Activity
Opening Balance
$'000
Net Transactions
During2011-2012
$'000
Closing Balance
$'000
T470 Patient Trust and Bequest Account – Legal Trusts 2 128 1 065 3 193
Royal Hobart Hospital Patients Trust Account 6 0 6
Royal Hobart Hospital Private Patients Scheme 438 223 661
Mental Health Services Client Trust Account 157 ( 102) 55
Campbell Town District Hospital Patients Trust Account 25 ( 18) 7
Note 19 Transactions and Balances Relating to a Trustee or Agency Arrangement

DHHS Annual Report 2011-2012 - Part 4 - Financial Statements Page 313 of 355

DHHS Annual Report 2011-2012 - Part 4 - Financial Statements Page 314 of 355
DHHS Annual Report 2011-2012 - Part 4 - Financial Statements Page 315 of 355
Statement of Certification

DHHS Annual Report 2011-2012 - Part 4 - Financial Statements Page 316 of 355
Special Purpose Financial StatementsAmbulance Tasmania

DHHS Annual Report 2011-2012 - Part 4 - Financial Statements Page 317 of 355
Notes2012
Actual$'000
2011Actual
$'000
Continuing Operations
Revenue and Other Income from Transactions
Revenue from Government
Attributed appropriation revenue - recurrent 1.6(a) 49 895 49 008
Attributed appropriation revenue - works and services 1.6(a) 10 0
Revenue from Special Capital Investment Funds 22 172
Sales of goods and services 1.6(c), 3.1 6 378 4 607
Contributions received 1.6(e), 3.2 1 768 441
Other revenue 1.6(f), 3.3 3 334 2 451
Total Revenue and Other Income from Transactions 61 407 56 679
Expenses from Transactions
Employee benefits 1.7(a), 4.1 37 940 35 042
Depreciation 1.7(b), 4.2 3 045 2 764
Supplies and consumables 4.3 15 715 13 695
Grants and subsidies 1.7(c), 4.4 25 25
Other expenses 1.7(d), 4.5 2 800 3 078
Total Expenses from Transactions 59 525 54 604
Net Result from Transactions (Net Operating Balance) 1 882 2 075
Non-Operational Capital Funding
Revenue from Government
Revenue from Special Capital Investment Funds 119 2 210
Total Non-Operating Capital Funding 119 2 210
Net Result from Transactions (Net Operating Balance) 2 001 4 285
Ambulance Tasmania Statement of Comprehensive Income for the Year Ended 30 June 2012

DHHS Annual Report 2011-2012 - Part 4 - Financial Statements Page 318 of 355
Notes2012
Actual$'000
2011Actual
$'000
Other Economic Flows Included in Net Result
Net gain/(loss) on non-financial assets 1.8(a)(c), 5.1 65 50
Net actuarial gains/(losses) of superannuation defined benefit plans 7.3(c) ( 8 902) ( 2 505)
1.8(b), 5.2 22 ( 118)
Total Other Economic Flows Included in Net Result ( 8 815) ( 2 573)
Net Result from Continuing Operations ( 6 814) 1 712
Other Economic Flows - Other Non-owner Changes in Equity
Changes in asset revaluation reserve 9.1 58 219
58 219
Comprehensive Result ( 6 756) 1 931
This Statement of Comprehensive Income should be read in conjunction with the accompanying notes.
Net gain/(loss) on financial instruments and statutory receivables/payables
Total Other Economic Flows - Other Non-owner Changes in Equity

DHHS Annual Report 2011-2012 - Part 4 - Financial Statements Page 319 of 355
Notes2012
Actual$'000
2011Actual
$'000
Assets
Financial Assets
Cash and deposits 1.9(a) 0 0
Receivables 1.9(b), 6.1 5 348 3 215
Loan Advances 1.9(c), 6.2 0 1
Non-Financial Assets
Inventories 1.9(d), 6.3 556 482
Assets held for sale 1.9(e), 6.4 99 99
Property, plant and equipment 1.9(f), 6.5 33 160 33 080
Intangibles 1.9(g), 6.6 126 41
Other assets 1.9(h), 6.7 98 236
Total Assets 39 387 37 154
Liabilities
Payables 1.10(a), 7.1 713 624
Employee benefits 1.10(c), 7.2 9 868 9 151
Superannuation 1.10(d), 7.3 11 826 3 177
Other liabilities 1.10(e), 7.4 217 683
Total Liabilities 22 624 13 635
Net Assets 16 763 23 519
Equity
Reserves 9.1 16 732 16 674
Accumulated funds 31 6 845
Total Equity 16 763 23 519
This Statement of Financial Position should be read in conjunction with the accompanying notes.
Ambulance Tasmania Statement of Financial Position as at 30 June 2012

DHHS Annual Report 2011-2012 - Part 4 - Financial Statements Page 320 of 355
Accumulated
Funds Total
Equity
$'000 $'000
Balance as at 1 July 2011 16 674 6 845 23 519
Total comprehensive result 58 ( 6 814) ( 6 756)
Balance as at 30 June 2012 16 732 31 16 763
Reserves$'000
Accumulated
FundsTotal
Equity
$'000 $'000
Balance as at 1 July 2010 16 455 5 133 21 588
Total comprehensive result 219 1 712 1 931
Balance as at 30 June 2011 16 674 6 845 23 519
This Statement of Changes in Equity should be read in conjunction with the accompanying notes.
Notes Page No.
Note 1 Significant Accounting Policies 322
1.1 Objectives and Funding 322
1.2 Basis of Accounting 322
1.3 Reporting Entity 323
1.4 Functional and Presentation Currency 323
1.5 Changes in Accounting Policies 323
1.6 Revenue and other Income from Transactions 327
1.7 Expenses from Transactions 328
1.8 Other Economic Flows Included in Net Result 329
1.9 Assets 330
1.10 Liabilities 331
1.11 Leases 333
1.12 Judgements and Assumptions 333
1.13 Foreign Currency 334
1.14 Comparative Figures 334
1.15 Rounding 334
1.16 Departmental Taxation 334
1.17 Goods and Services Tax 334
Ambulance Tasmania Statement of Changes in Equity for the Year Ended 30 June 2012
Reserves$'000
Notes to and Forming Part of the Financial Statements for the Year Ended 30 June 2012

DHHS Annual Report 2011-2012 - Part 4 - Financial Statements Page 321 of 355
Notes Page No.
Note 2 Underlying Net Operating Balance 335
Note 3 Income from Transactions 335
3.1 Sales of Goods and Services 335
3.2 Contributions Received 335
3.3 Other Revenue 336
Note 4 Expenses from Transactions 336
4.1 Employee Benefits 336
4.2 Depreciation 337
4.3 Supplies and Consumables 337
4.4 Grants and Subsidies 338
4.5 Other Expenses 338
Note 5 Other Economic Flows Included in Net Result 338
5.1 Net Gain/(Loss) on Non-Financial Assets 338
5.2 Net Gain/(Loss) on Financial Instruments and Statutory Receivables/Payables 338
Note 6 Assets 339
6.1 Receivables 339
6.2 Loan Advances 339
6.3 Inventories 340
6.4 Assets Held for Sale 340
6.5 Property, Plant and Equipment 341
6.6 Intangibles 343
6.7 Other Assets 343
Note 7 Liabilities 344
7.1 Payables 344
7.2 Employee Benefits 345
7.3 Superannuation 345
7.4 Other Liabilities 347
Note 8 Commitments and Contingencies 348
8.1 Schedule of Commitments 348
Note 9 Reserves 350
9.1 Reserves 350

DHHS Annual Report 2011-2012 - Part 4 - Financial Statements Page 322 of 355
Note 1 Significant Accounting Policies
1.1 Objectives and Funding
1.2 Basis of Accounting
·
·
Australian Accounting Standards and Interpretations issued by the Australian Accounting Standards Board and
the Treasurer’s Instructions issued under the provisions of the Financial Management and Audit Act 1990.
The changes include omission of the Cash Flow Statement (because the Service does not operate its own bank account), reconciliation of Cash to Net Operating Result, Financial Instruments and reduced disclosure in terms of Superannuation Reporting.
The Financial Statements were signed by the Secretary of the Department of Health and Human Services, Director of Ambulance Services and Deputy Chief Financial Officer of the Department of Health and Human Services on 15 August 2012.
Compliance with the Australian Accounting Standards (AAS) may not result in compliance with International Financial Reporting Standards (IFRS), as the AAS include requirements and options available to not-for-profit organisations that are inconsistent with IFRS. The Department of Health and Human
Services and Tasmanian Ambulance Service are considered to be not-for-profit and have adopted some accounting policies under the AAS that do not comply with IFRS.
The Financial Statements have been prepared on an accrual basis and, except where stated, are in accordance with the historical cost convention. The accounting policies are generally consistent with the previous year except for those changes outlined in Note 1.5.
The Financial Statements have been prepared as a going concern. The continued existence of the Agency and the Service in their present form, undertaking its current activities, is dependent on Government policy and on continuing appropriations by Parliament for the Agency's and the Service's administration and activities.
The Tasmanian Ambulance Service (the Service) provides emergency ambulance, transport and care services, and a non-emergency patient transport service. The provision of ambulance services in rural communities relies on the strength and commitment of volunteer ambulance officers working in volunteer units, branch stations and independent services. The Service is predominantly funded through funds from the Department of Health and Human Services (the Agency). In addition, the Service provides services to fee paying, privately insured patients or patients who will receive compensation for these expenses due to the circumstances surrounding the injury.
By agreement with the Auditor-General, the Financial Statements have been prepared for the first time as a Special Purpose Financial Report in accordance, except where stated, with:
DHHS Annual Report 2011-2012 - Part 4 - Financial Statements Page 323 of 355
1.3 Reporting Entity
1.4 Functional and Presentation Currency
1.5 Changes in Accounting Policies
(a) Impact of New and Revised Accounting Standards
·
·
·
·
·
·
In the current year, the Service has adopted all of the new and revised Standards and Interpretations issued by the Australian Accounting Standards Board (AASB) that are relevant to its operations and effective for the current annual reporting period. These include:
AASB 1054 Australian Additional Disclosures – This Standard, in conjunction with AASB 2011-1 Amendments to Australian Accounting Standards arising from the Trans Tasman Convergence Project, removes disclosure requirements from other Standards and incorporates them in a single Standard to achieve convergence between Australian and New Zealand Accounting Standards. There is no financial impact.
AASB 2009-12 Amendments to Australian Accounting Standards (AASBs 5, 8, 108, 110, 112, 119, 133, 137, 139, 1023 and 1031 and Interpretations 2, 4, 16, 1039 and 1052) – This Standard makes editorial amendments to a range of Australian Accounting Standards and Interpretations. There is no financial impact.
AASB 2010-4 Further Amendments to Australian Accounting Standards arising from the Annual Improvements Project (AASBs 1, 7, 101, and 134 and Interpretation 13) – This Standard amends a range of Australian Accounting Standards and Interpretations as a consequence of the annual improvements
project.
The amendments to AASB 7 clarify financial instrument disclosures in relation to credit risk. The carrying amount of financial assets that would otherwise be past due or impaired, whose terms have been renegotiated, is no longer required to be disclosed. There is no financial impact.The amendments to AASB 101 clarify the presentation of the Statements of Changes in Equity. The disaggregation of other comprehensive income reconciling the carrying amount at the beginning and
the end of the period for each component of equity is no longer required. There is no financial impactAASB 2010-5 Amendments to Australian Accounting Standards (AASBs 1, 3, 4, 5, 101, 107, 112, 118, 119, 121, 132, 133, 134, 137, 139, 140, 1023 and 1038 and Interpretations 112, 115, 127, 132 and 1042) – This Standard makes editorial amendments to a range of Australian Accounting Standards. There is no financial impact.
The Financial Statements include all the controlled activities of the Service. The Financial Statements consolidate material transactions and balances of the Service.
These Financial Statements are presented in Australian dollars, which is the Service's functional currency.

DHHS Annual Report 2011-2012 - Part 4 - Financial Statements Page 324 of 355
·
·
·
(b) Impact of New and Revised Accounting Standards Yet to be Applied
·
·
·
·
AASB 2011-15 Amendments to Australian Accounting Standards – Extending Relief from Consolidation, the Equity Method and Proportionate Consolidation (AASBs 127, 128 and 131) – This Standard extends the relief from consolidation, the equity method and proportionate consolidation by removing the requirement for the consolidated financial statements prepared by the ultimate or any intermediate parent entity to be IFRS compliant, provided that the parent entity, investor or venturer and the ultimate or intermediate parent entity are not for profit non reporting entities that comply with Australian Accounting Standards. There is no financial impact.
The following applicable Standards have been issued by the AASB and are yet to be applied:
AASB 9 Financial Instruments – This Standard supersedes AASB 139 Financial Instruments: Recognition and Measurement, introducing a number of changes to accounting treatments. The Standard was reissued in December 2010. The Service has not yet determined the potential financial impact of the
standard.
AASB 10 Consolidated Financial Statements – This Standard supersedes requirements under AASB 127 Consolidated and Separate Financial Statements and Interpretation 112 Consolidation – Special Purpose Entities, introducing a number of changes to accounting treatments. The standard was issued
in August 2011. The Service has not yet determined the application or the potential impact of the Standard.
AASB 11 Joint Arrangements – This Standard supersedes AASB 131 Interest in Joint Ventures, introducing a number of changes to accounting treatments. The Standard was issued in August 2011. The Service has not yet determined the application or the potential impact of the Standard.
AASB 12 Disclosure of Interests in Other Entities – This Standard supersedes disclosure requirements under AASB 127 Consolidated and Separate Financial Statements and AASB 131 Interests in Joint Ventures. The Standard was issued in August 2011. The Service has not yet determined the application or the potential impact of the Standard.
AASB 2010-6 Amendments to Australian Accounting Standards – Disclosures on Transfers of Financial Assets (AASBs 1 and 7) – This Standard introduces additional disclosure relating to transfers of financial assets in AASB 7. An entity shall disclose all transferred financial assets that are not derecognised and any continuing involvement in a transferred asset, existing at the reporting date, irrespective of when the related transfer transaction occurred. There is no financial impact.
AASB 2011-1 Amendments to Australian Accounting Standards arising from the Trans Tasman Convergence Project (AASBs 1, 5, 101, 107,108, 121, 128, 132 and 134 and Interpretations 2, 112 and 113) – This
Standard, in conjunction with AASB 1054, removes disclosure requirements from other Standards and incorporates them in a single Standards to achieve convergence between Australian and New Zealand Accounting Standards. There is no financial impact.

DHHS Annual Report 2011-2012 - Part 4 - Financial Statements Page 325 of 355
·
·
·
·
·
·
·
·
AASB 128 Investments in Associates and Joint Ventures – This Standard supersedes AASB 128 Investments in Associates and introduces a number of changes to accounting treatments. The Standard was issued in August 2011. The Service has not yet determined the application or the potential impact of the Standard.
AASB 1053 Application of Tiers of Australian Accounting Standards – This Standard establishes a differential financial reporting framework consisting of two tiers of reporting requirements for preparing general purpose financial statements. The Standard does not have any financial impact on the Service. However, it may affect disclosures if reduced disclosure requirements apply.
AASB 2010-2 Amendments to Australian Accounting Standards arising from Reduced Disclosure Requirements (AASBs 1, 2, 3, 5, 7, 8, 101, 102, 107, 108, 110, 111, 112, 116, 117, 119, 121, 123, 124, 127, 128, 131, 133, 134, 136, 137, 138, 140, 141, 1050, and 1052 and Interpretations 2, 4, 5, 15, 17, 127, 129, and 1052) – This Standard makes amendments to Australian accounting Standards and
Interpretations to introduce reduced disclosure requirements for certain types of entities. There is no financial impact.
AASB 2010-7 Amendments to Australian Accounting Standards arising from AASB 9 (December 2010) (AASBs 1, 3, 4, 5, 7, 101, 102, 108, 112, 118, 120, 121, 127, 128, 131, 132, 136, 137, 139, 1023 and 1038 and Interpretations 2, 5, 10, 12, 19, and 127) – This Standard makes consequential amendments
to other Australian Accounting Standards and Interpretations as a result of issuing AASB in December 2010. It is not anticipated that there will be any financial impact.
AASB 2011-2 Amendments to Australian Accounting Standards arising from the Trans Tasman Convergence Project – Reduced Disclosure Requirements (AASBs 101 and 1054) – This Standard makes amendments to introduce reduced disclosure requirements for certain types of entities. There is no expected financial
impact of applying these changes, as the Service is a Tier 1 entity.
AASB 13 Fair Value Measurement – This Standard defines fair value, sets out a framework for measuring fair value and requires disclosures about fair value measurements. There is no financial impact.
AASB 119 Employee Benefits – This Standard supersedes AASB 119 Employee Benefits, introducing a number of changes to accounting treatments. The Standard was issued in September 2011. The Service has not yet determined the application or the potential impact of the Standard.
AASB 127 Separate Financial Statements – This standard supersedes requirements under AASB 127 Consolidated and Separate Financial Statements, introducing a number of changes to accounting treatments. The Standard was issued in August 2011. The Service has not yet determined the application or the potential impact of the Standard.

DHHS Annual Report 2011-2012 - Part 4 - Financial Statements Page 326 of 355
·
·
·
·
·
·
(c) Voluntary Changes in Accounting Policy
AASB 2011-10 Amendments to Australian Accounting Standards arising from AASB 119 (September 2011) (AASBs 1, 8, 101, 124, 134, 1049 and 2011 8 and Interpretations 14) – This Standard makes amendments to other Australian Accounting Standards and Interpretations as a result of issuing AASB 119 Employee Benefits in September 2011. It is not expected to have a financial impact.
AASB 2011-12 Amendments to AASB 119 (September 2011) arising from Reduced Disclosure Requirements – This Standard gives effect to Australian Accounting Standards – Reduced Disclosure Requirements for AASB 119 (September 2011). There is no financial impact.
The Service has not adopted any new accounting policies during the financial year ended 30 June 2012.
AASB 2011-6 Amendments to Australian Accounting Standards – Extending Relief from Consolidation, the Equity Method and Proportionate Consolidation – Reduced Disclosure Requirements (AASBs 127, 128 and 131) – This Standard extends relief from consolidation, the equity method and proportionate consolidation by removing the requirement for the consolidated financial statements prepared by the ultimate or any intermediate parent entity to be IFRS compliant, provided that the parent entity, investor or venturer and the ultimate or intermediate parent entity comply with Australian Accounting Standards or Australian Accounting Standards – Reduced Disclosure Requirements. It is not expected to have a financial impact.
AASB 2011-7 Amendments to Australian Accounting Standards arising from the Consolidation and Joint Arrangements Standards (AASBs 1, 2, 3, 5, 7, 9, 2009 11, 101, 107, 112, 118, 121, 124, 132, 133, 136, 138, 139, 1023 and 1038 and Interpretations 5, 9, 16 and 17) – This Standard replaces the existing definition and fair value guidance in other Australian Accounting Standards and Interpretations as the result of issuing AASB 13 in September 2011. It is not expected to have a financial impact.
AASB 2011-8 Amendments to Australian Accounting Standards arising from AASB 13 (AASBs 1, 2, 3, 4, 5, 7, 9, 2009 11, 2010 7,101, 102, 108, 110, 116, 117, 118, 119, 120, 121, 128, 131, 132, 133, 134, 136, 138, 139, 140, 141, 1004, 1023 and 1038 and Interpretations 2, 4, 12, 13, 14, 17, 19, 131 and 132) – This Standard replaces the existing definition of fair value guidance in other Australian Accounting Standards and Interpretations as the result of issuing AASB 13 in September 2011. There is no expected financial impact.
AASB 2011-9 Amendments to Australian Accounting Standards – Presentation of Items of Other Comprehensive Income (AASBs 1, 5, 7, 101, 112, 120, 121, 132, 133, 134, 1039 and 1049) – This Standard requires to group items presented in other comprehensive income on the basis of whether they are potentially reclassifiable to profit or loss subsequently (reclassification adjustments). It is not expected to have a financial impact.

DHHS Annual Report 2011-2012 - Part 4 - Financial Statements Page 327 of 355
1.6 Revenue and Other Income from Transactions
(a) Revenue from Government
(b) Grants
(c) Sales of Goods and Services
(d) Interest
(e) Contributions Received
(f) Other Revenue
Services received free of charge by the Service, are recognised as income when a fair value can be reliably determined and at the time the services would have been purchased if they had not been donated. Use of those resources is recognised as an expense.
Contributions of assets at no cost of acquisition or for nominal consideration are recognised at their fair value when the Service obtains control of the asset, it is probable that future economic benefits comprising the contribution will flow to the Service and the amount can be measured reliably. However, where the contribution received is from another government agency as a consequence of restructuring of administrative arrangements, where they are recognised as contributions by owners directly within equity. In these circumstances, book values from the transferor agency have been used.
Other revenue is primarily the recovery of costs incurred and is recognised when an increase in future economic benefits relating to an increase in an asset or a decrease of a liability has arisen that can be reliably measured.
Income is recognised in the Statement of Comprehensive Income when an increase in future economic benefits related to an increase in an asset or a decrease of a liability has arisen that can be measured reliably.
Appropriations, whether recurrent or capital, are recognised as revenues in the period in which the Agency gains control of the appropriated funds.
Grants payable by the Australian Government are recognised as revenue when the Service gains control of the underlying assets. Where grants are reciprocal, revenue is recognised as performance occurs under the grant.
Non-reciprocal grants are recognised as revenue when the grant is received or receivable. Conditional grants may be reciprocal or non-reciprocal depending on the terms of the grant.
Amounts earned in exchange for the provision of goods are recognised when the significant risks and rewards of ownership have been transferred to the buyer. Revenue from the provision of services is recognised in proportion to the stage of completion of the transaction at the reporting date. The stage of completion is assessed by reference to surveys of work performed.
Interest on funds invested is recognised as it accrues using the effective interest rate method.

DHHS Annual Report 2011-2012 - Part 4 - Financial Statements Page 328 of 355
1.7 Expenses from Transactions
(a) Attributed Employee Benefits
(b) Depreciation and Amortisation
Vehicles 5 years
Plant and equipment 2-20 years
Medical equipment 4-20 years
Buildings 40-50 years
Software 3-5 years
(c) Grants and Subsidies
·
·
(d) Other Expenses
All buildings are depreciated over their remaining useful life.All intangible assets having a limited useful life are systematically amortised over their useful lives reflecting the pattern in which the asset’s future economic benefits are expected to be consumed by the ServiceMajor amortisation periods are:
Grants and subsidies expenditure is recognised to the extent that:
the services required to be performed by the grantee have been performed or
the grant eligibility criteria have been satisfied.
A liability is recorded when the Service has a binding agreement to make the grants but services have not been performed or criteria satisfied. Where grant monies are paid in advance of performance or eligibility, a prepayment is recognised.
Other expenses are recognised when a decrease in future economic benefits related to a decrease in an asset or an increase of a liability has arisen that can be reliably measured.
Expenses are recognised in the Statement of Comprehensive Income when a decrease in future economic benefits related to a decrease in an asset or an increase of a liability has arisen that can be measured reliably.
Attributed employee benefits include, where applicable, entitlements to wages and salaries, annual leave, sick leave, long service leave, superannuation and any other post-employment benefits.
All applicable non-financial assets having a limited useful life are systematically depreciated over their useful lives in a manner which reflects the consumption of their service potential. Land, being an asset with an unlimited useful life, is not depreciated.
Depreciation is provided for on a straight line basis, using rates which are reviewed annually. Major depreciation periods are:

DHHS Annual Report 2011-2012 - Part 4 - Financial Statements Page 329 of 355
1.8 Other Economic Flows Included in Net Result
(a) Gain/(Loss) on Sale of Non-Financial Assets
(b) Impairment – Financial Assets
(c) Impairment – Non-Financial Assets
(d) Other Gains/(Losses) From Other Economic Flows
Other gains/(losses) from other economic flows includes gains or losses from reclassifications of amounts from reserves and/or accumulated surplus to net result, and from the revaluation of the present values of
the long service leave liability due to changes in the bond interest rate.
Other economic flows measure the change in volume or value of assets or liabilities that do not result from transactions.
Gains or losses from the sale of non-financial assets are recognised when control of the assets has passed to the buyer.
Financial assets are assessed at each reporting date to determine whether there is any objective evidence that there are any financial assets that are impaired. A financial asset is considered to be impaired if objective evidence indicates that one or more events have had a negative affect on the estimated future cash flows of that asset.
An impairment loss, in respect of a financial asset measured at amortised cost, is calculated as the difference between its carrying amount, and the present value of the estimated future cash flows discounted at the original effective interest rate.
All impairment losses are recognised in the Statement of Comprehensive Income.
An impairment loss is reversed if the reversal can be related objectively to an event occurring after the impairment loss was recognised. For financial assets measured at amortised cost the reversal is recognised in the Statement of Comprehensive Income.
All non‑financial assets are assessed to determine whether any impairment exists. Impairment exists when the recoverable amount of an asset is less than its carrying amount. Recoverable amount is the higher of fair value less costs to sell and value in use. The Service’s assets are not used for the purpose
of generating cash flows; therefore value in use is based on depreciated replacement cost where the asset would be replaced if deprived of it.
All impairment losses are recognised in the Statement of Comprehensive Income.
In respect of other assets, impairment losses recognised in prior periods are assessed at each reporting date for any indications that the loss has decreased or no longer exists. An impairment loss is reversed if there has been a change in the estimates used to determine the recoverable amount. An impairment loss is reversed only to the extend that the asset’s carrying amount does not exceed the carrying amount that would have been determined, net of depreciation or amortisation, if no impairment loss had been recognised.

DHHS Annual Report 2011-2012 - Part 4 - Financial Statements Page 330 of 355
1.9 Assets
(a) Cash and Deposits
(b) Receivables
(c) Other Financial Assets
(d) Inventories
(e) Assets Held for Sale
(f) Property, Plant and Equipment
Cost includes expenditure that is directly attributable to the acquisition of the asset. The costs of self‑constructed assets includes the cost of materials and direct labour, any other costs directly attributable to bringing the asset to a working condition for its intended use, and the costs of dismantling and removing the items and restoring the site on which they are located. Purchased software that is integral to the functionality of the related equipment is capitalised as part of that equipment.
When parts of an item of property, plant and equipment have different useful lives, they are accounted for as separate items (major components) of property, plant and equipment.
Assets are recognised in the Statement of Financial Position when it is probable that the future economic benefits will flow to the Service and the asset has a cost or value that can be measured reliably.
Cash means notes, coins, any deposits held at call with a bank or financial institution, as well as funds held in the Special Deposits and Trust Fund, being short-term of three months or less and highly liquid. Deposits are recognised at amortised cost, being their face value.
Receivables are recognised at amortised cost, less any impairment losses, however, due to the short settlement period, receivables are not discounted back to their present value.
Other financial assets are recorded at fair value and include loan advances and, when in debit, the Tasmanian Ambulance Service Superannuation Scheme.
Inventories held for distribution are valued at cost adjusted, when applicable, for any loss of service potential. Inventories acquired for no cost or nominal consideration are valued at current replacement cost. Inventories held for resale are valued at cost.
Assets held for sale (or disposal groups comprising assets and liabilities) that are expected to be recovered primarily through sale rather than continuing use are classified as held for sale. Immediately before classification as held for sale, the assets (or components of a disposal group) are remeasured in
accordance with the Service’s accounting policies. Thereafter the assets (or disposal group) are measured at the lower of carrying amount and fair value less costs to sell.
(i) Valuation Basis
Land, buildings and other long-lived assets are recorded at fair value less accumulated depreciation. All other non-current physical assets, including work in progress, are recorded at historic cost less accumulated depreciation and accumulated impairment losses.

DHHS Annual Report 2011-2012 - Part 4 - Financial Statements Page 331 of 355
(g) Intangibles
·
·
(h) Other Assets
Other assets are recorded at fair value and include prepayments.
1.10 Liabilities
it is probable that an expected future benefit attributable to the asset will flow to the Service and
the cost of the asset can be reliably measured.
Intangible assets held by the Service are valued at fair value less any subsequent accumulated amortisation and any subsequent accumulated impairment losses where an active market exists. Where no active market exists, intangible assets held by the Service are valued at cost less any subsequent accumulated amortisation and any subsequent accumulated impairment losses. The asset capitalisation threshold for intangible assets adopted by the Service is $50 000.
Liabilities are recognised in the Statement of Financial Position when it is probable that an outflow of resources embodying economic benefits will result from the settlement of a present obligation and the amount at which the settlement will take place can be measured reliably.
(ii) Subsequent Costs
The cost of replacing part of an item of property, plant and equipment is recognised in the carrying amount of the item if it is probable that the future economic benefits embodied within the part will flow to the Service and its costs can be measured reliably. The carrying amount of the replaced part is derecognised. The costs of day-to-day servicing of property, plant and equipment are recognised in the Statement of Comprehensive Income as incurred.
(iii) Asset Recognition Threshold
The asset capitalisation threshold for tangible assets adopted by the Service is $10 000. Assets valued at less than $10 000 (or $50 000 for intangible assets) are charged to the Statement of Comprehensive Income in the year of purchase (other than where they form part of a group of similar items which are material in total).
(iv) Revaluations
The Service’s land and building assets were revalued independently by Opteon Pty Ltd (formally known as Brothers and Newton Pty Ltd) as at 30 June 2012 using adjustment indices based on Australian Bureau of Statistics statistical data, Real Estate Institute of Tasmania median house price data, Rawlinsons Index of construction cost estimates and own sourced research data from the Land Information Systems Tasmania database.
An intangible asset is recognised where:

DHHS Annual Report 2011-2012 - Part 4 - Financial Statements Page 332 of 355
(a) Payables
(b) Provisions
(c) Employee Benefits
(d) Superannuation
A defined contribution plan is a post‑employment benefit plan under which an entity pays fixed contributions into a separate entity and will have no legal or constructive obligation to pay further
amounts. Obligations for contributions to defined contribution plans are recognised as an expense when they fall due.
(ii) Defined Benefit Plans
A defined benefit plan is a post‑employment benefit plan other than a defined contribution plan.
The Service makes contributions in respect of certain employees of Ambulance Tasmania to the Tasmanian Ambulance Service Superannuation Scheme being a defined benefit scheme where members receive lump sum benefits on resignation, retirement, death or invalidity. The scheme is closed to new members. The Service’s superannuation obligations in respect of this scheme are recognised at the latest actuarial assessment of the member’s entitlements, net of scheme assets. Actuarial gains and losses in respect of this scheme are recognised in the Statement of Comprehensive Income.
Actuarial gains or losses arising from the actuarial revaluation of superannuation liabilities are recognised in the Statement of Comprehensive Income.
Payables, including goods received and services incurred but not yet invoiced, are recognised at amortised cost, which due to the short settlement period, equates to face value, when the Service becomes obliged to make future payments as a result of a purchase of assets or services.
A provision arises if, as a result of a past event, the Service has a present legal or constructive obligation that can be estimated reliably, and it is probable that an outflow of economic benefits will be required to settle the obligation. Provisions are determined by discounting the expected future cash flows at a rate that reflects current market assessments of the time value of money and the risks specific to the liability. Any right to reimbursement relating to some or all of the provision is recognised as an asset when it is virtually certain that the reimbursement will be received.
Liabilities for wages and salaries and annual leave are recognised when an employee becomes entitled to receive a benefit. Those liabilities expected to be realised within 12 months are measured at the amount expected to be paid. Other employee entitlements are measured as the present value of the benefit at 30 June 2012, where the impact of discounting is material, and at the amount expected to be paid if discounting is not material.
A liability for long service leave is recognised, and is measured as the present value of expected future payments to be made in respect of services provided by employees up to the reporting date.
(i) Defined Contribution Plans

DHHS Annual Report 2011-2012 - Part 4 - Financial Statements Page 333 of 355
(e) Other Liabilities
1.11 Leases
1.12 Judgements and Assumptions
·
·
·
The estimates and underlying assumptions are reviewed on an ongoing basis. Revisions to accounting estimates are recognised in the period in which the estimate is revised if the revision affects only that period or in the period of the revision and future periods if the revision affects both current and future periods.
Judgements made by the Service that have significant effects on the Financial Statements are disclosed in the relevant notes to the Financial Statements. In particular, information about significant areas of estimation, uncertainty and critical judgements in applying accounting policies that have the most significant effect on the amounts recognised in the financial statements are described in the following notes:
1.9(f) and 6.5 property, plant and equipment and
1.10(d) and 7.3 superannuation.
1.7(b) depreciation and amortisation
On-costs associated with employee benefits expected to be realised within 12 months are measured at the amount expected to be paid. Other on-costs associated with employee benefits are measured at the present value of the cost at 30 June 2012, where the impact of discounting is material, and at the amount expected to be paid if discounting is not material.
The Service has entered into a number of operating lease agreements for property, plant and equipment, where the lessors effectively retain all the risks and benefits incidental to ownership of the items leased. Equal instalments of lease payments are charged to the Statement of Comprehensive Income over the lease term, as this is representative of the pattern of benefits to be derived from the leased property.
The Service is prohibited by Treasurer’s Instruction 502 - Leases from holding finance leases.
In the application of Australian Accounting Standards, the Service is required to make judgements, estimates and assumptions about carrying values of assets and liabilities that are not readily apparent from other sources. The estimates and associated assumptions are based on historical experience and various other factors that are believed to be reasonable under the circumstances, the results of which form the basis of making the judgements. Actual results may differ from these estimates.
Other liabilities and other financial liabilities are recognised in the Statement of Financial Position when it is probable that an outflow of resources embodying economic benefits will result from the settlement of a present obligation and the amount at which the settlement will take place can be measured reliably. Other liabilities include revenue received in advance and on costs associated with employee benefits.
As a consequence of the Treasurer's decision to cease levying payroll tax on agencies from 1 October 2012, other liabilities no longer includes a component relating to a provision for payroll tax associated with employee leave entitlement provisions. Revenue received in advance is measured at amortised cost.

DHHS Annual Report 2011-2012 - Part 4 - Financial Statements Page 334 of 355
1.13 Foreign Currency
1.14 Comparative Figures
1.15 Rounding
1.16 Departmental Taxation
1.17 Goods and Services Tax
All amounts in the Financial Statements have been rounded to the nearest thousand dollars, unless otherwise stated. Where the result of expressing amounts to the nearest thousand dollars would result in an amount of zero, the financial statement will contain a note expressing the amount to the nearest whole dollar.
The Service is exempt from all forms of taxation except Fringe Benefits Tax, Payroll Tax and the Goods and Services Tax (GST). Levying of Payroll Tax will cease from 1 October 2012 as a result of the Treasurer's decision as detailed in Note 1.10(e).
Revenue, expenses and assets are recognised net of the amount of GST, except where the GST incurred is not recoverable from the Australian Taxation Office. Receivables and payables are stated exclusive of GST.
These judgements relate to adoption of the recommendations by the valuer, Opteon Pty Ltd, in respect of land and building valuations and the recommendations of the State Actuary in respect of the Superannuation liabilities.
The Treasurer has announced the policy decision to cease levying payroll tax on agencies from 1 October 2012. This decision has been factored into the calculation of the employee entitlement provisions and the associated on cost liabilities as at 30 June have been stated, exclusive of payroll tax. The Service has made no other judgements or assumptions that may cause a material adjustment to the carrying amounts of assets and liabilities.
Transactions denominated in a foreign currency are converted at the exchange rate at the date of the transaction. Foreign currency receivables and payables are translated at the exchange rates current as at balance date.
Comparative figures have been adjusted to reflect any changes in accounting policy or the adoption of new standards. Details of the impact of changes in accounting policy on comparative figures and amendments to comparative figures arising from correction of an error are disclosed at Note 1.5.
Where amounts have been reclassified within the Financial Statements, the comparative statements have been restated.

DHHS Annual Report 2011-2012 - Part 4 - Financial Statements Page 335 of 355
Note 2 Underlying Net Operating Balance
2012Actual
$'000
2011Actual
$'000
Net Result from Transactions (Net Operating Balance) 2 001 4 285
Less impact of Non-operational Capital Funding
Revenue from Special Capital Investment Funds 119 2 210
Total 119 2 210
Underlying Net Operating Balance 1 882 2 075
Note 3 Income from Transactions3.1 Sales of Goods and Services
2012$'000
2011$'000
Ambulance fees 5 747 4 584
Other user charges 631 23
Total 6 378 4 607
3.2 Contributions Received 2012$'000
2011$'000
Fair value of assets assumed at no cost or for nominal consideration 1 768 441
Total 1 768 441
Non-operational capital funding is the income from transactions relating to funding for capital projects. This funding is classified as income from transactions and included in the net operating balance. However, the corresponding capital expenditure is not included in the calculation of the net operating balance. Accordingly, the net operating balance will portray a position that is better than the true underlying financial result.
For this reason, the net operating result is adjusted to remove the effects of funding for capital projects.
Contributions received for no cost represent asset expenditure relating to the Ambulance Communications Centre that have
been funded by the Agency.

DHHS Annual Report 2011-2012 - Part 4 - Financial Statements Page 336 of 355
3.3 Other Revenue2012$'000
2011$'000
Salaries and wages recoveries 1 255 27
Workers compensation recoveries 716 72
Corporate overhead funding 1 145 1 959
Operating recoveries 218 393
Total 3 334 2 451
Note 4 Expenses from Transactions4.1 Employee Benefits
2012$'000
2011$'000
Wages and salaries including FBT 28 650 25 667
Annual leave 3 049 3 181
Long service leave 550 847
Other post-employment benefits 222 305
Sick leave 1 123 1 035
Other employee expenses - other staff allowances 328 346
Superannuation expenses - defined contribution and benefits schemes 4 018 3 661
Total 37 940 35 042
Superannuation expenses relating to defined contribution schemes are paid directly to nominated superannuation funds at a rate
of nine per cent of salary. In addition, Departments are also required to pay into the SPA a “gap” payment equivalent to
3.3 per cent of salary in respect of employees who are members of contribution schemes.
The increase in salaries and wages recoveries relates to the recovery of Royal Flying Doctors Service costs and the
reimbursement by the Department of Immigration and Citizenship for the cost of increasing the capacity of the
Bridgewater Ambulance Tasmania Station. This is as a consequence of the Pontville Immigration Detention facility.
Workers compensation claims were higher than average throughout 2011-2012 which resulted in an increase in recoveries.
Superannuation expenses for defined benefits schemes relate to payments into the Superannuation Provision Account held
centrally and recognised within the Finance‑General Division of the Department of Treasury and Finance. The amount of the
payment is based on an employer contribution rate determined by the Treasurer, on the advice of the State Actuary. The
current employer contribution is 12.3 per cent of salary.

DHHS Annual Report 2011-2012 - Part 4 - Financial Statements Page 337 of 355
4.2 Depreciation2012$'000
2011$'000
Plant, equipment and vehicles 2 664 2 477
Buildings 381 287
Total 3 045 2 764
4.3 Supplies and Consumables2012$'000
2011$'000
Consultants 59 475
Property services 735 863
Maintenance 252 260
Communications 1 094 419
Information technology 317 633
Travel and transport 2 147 1 976
Medical, surgical and pharmacy supplies 1 064 1 207
Advertising and promotion 9 48
Patient and client services 5 641 4 180
Leasing costs 15 17
Equipment and furniture 1 134 555
Administration 267 179
Food production costs 49 52
Other supplies and consumables 131 129
Corporate overhead charge 2 774 2 669
Service fees 0 18
Audit fees - financial audit 27 15
Total 15 715 13 695
The increase in communications expense relates to payments to the State Fire Commission in respect of the radio
communications network.

DHHS Annual Report 2011-2012 - Part 4 - Financial Statements Page 338 of 355
4.4 Grants and Subsidies2012$'000
2011$'000
Grant - other 25 25
Total 25 25
4.5 Other Expenses2012$'000
2011$'000
Salary on-costs 2 722 2 857
Tasmanian Risk Management Fund premium 69 73
Other 9 148
Total 2 800 3 078
Note 5 Other Economic Flows Included in Net Result5.1 Net Gain/(Loss) on Non-financial Assets
2012$'000
2011$'000
Impairment of non-financial assets 4 0
Net gain/(loss) on disposal of physical assets 61 50
Total Net Gain/(Loss) on Non-Financial Assets 65 50
2012$'000
2011$'000
Impairment of receivables 22 ( 118)
Total 22 ( 118)
Patient and client services expenditure predominantly relates to costs for patient transfers via the Royal Flying Doctors Service
and payments to the Department of Police and Emergency Management for the use of the emergency services helicopter.
The increase in equipment and furniture relates to the purchase of 99 new stretchers.
5.2 Net Gain/(Loss) on Financial Instruments and Statutory Recievables/Payables
The impairment loss on receivables relates to a general increase in the provision for impairment.

DHHS Annual Report 2011-2012 - Part 4 - Financial Statements Page 339 of 355
Note 6 Assets6.1 Receivables
2012$'000
2011$'000
Receivables 5 454 3 469
Less: Provision for impairment ( 106) ( 254)
Total 5 348 3 215
Settled within 12 months 5 348 3 215
Total 5 348 3 215
2012$'000
2011$'000
Carrying amount at 1 July 254 188
Amounts written off during the year ( 127) ( 52)
Amounts recovered during the year 1 0
Increase/(decrease) in provision recognised in profit or loss ( 22) 118
Carrying amount at 30 June 106 254
6.2 Loan Advances2012$'000
2011$'000
Loan Advances
Loan advances 0 1
Provision for impairment 0 0
Total 0 1
Settled within 12 months 0 1
Settled in more than 12 months 0 0
Total 0 1
During 2011-2012, a portion of the accounts receivable ledger was assessed as being impaired. The impairment arose as a result
of being long outstanding and assessed as being unlikely to be received, matters in dispute or being assessed for writeoff.
Loan advances relate to university fees paid by the Service and being repaid progressively by employees. Loan advances have
been reclassified as receivables.

DHHS Annual Report 2011-2012 - Part 4 - Financial Statements Page 340 of 355
6.3 Inventories2012$'000
2011$'000
Medical and pharmacy supplies 524 445
General supplies 32 37
Total 556 482
Utilised within 12 months 556 482
Total 556 482
6.4 Assets Held for Sale2012$'000
2011$'000
Land 50 50
Buildings 49 49
Less: Accumulated depreciation 0 0
Total 99 99
Settled within 12 months 99 99
Total 99 99
Inventories relate to stocks held for distribution at no or nominal consideration, predominantly at hospitals, in the ordinary
course of operations as detailed above.
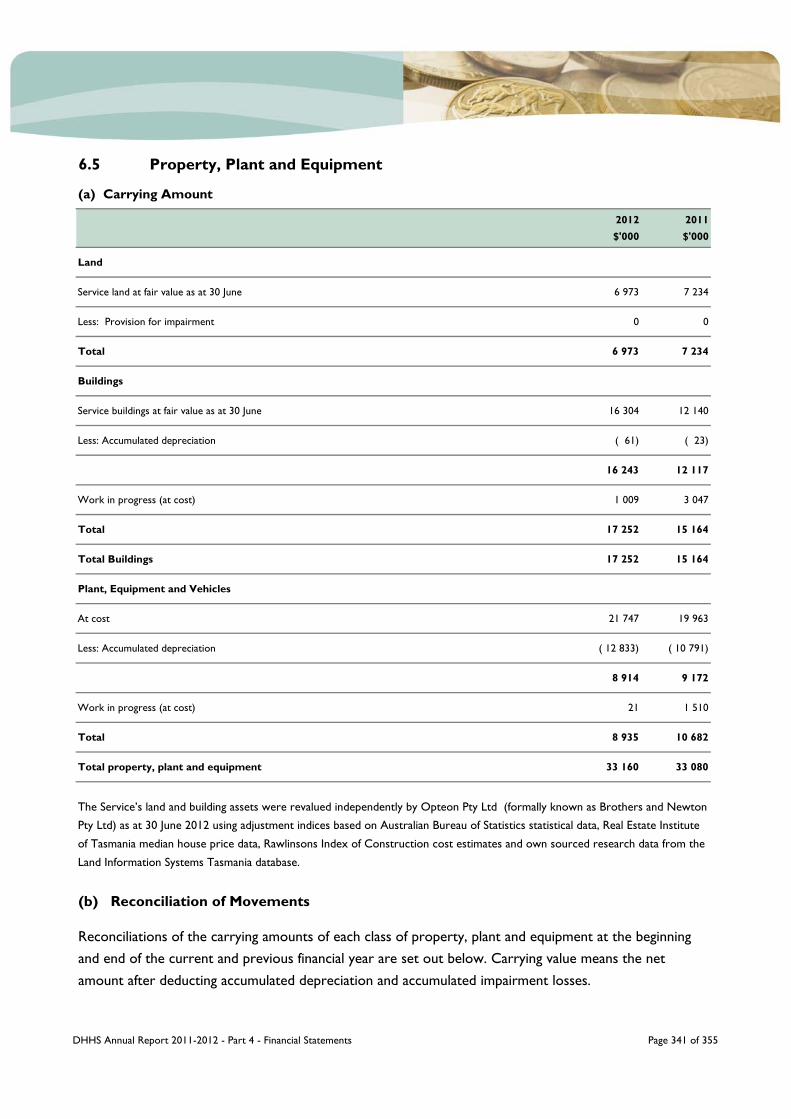
DHHS Annual Report 2011-2012 - Part 4 - Financial Statements Page 341 of 355
6.5 Property, Plant and Equipment
(a) Carrying Amount
2012$'000
2011$'000
Land
Service land at fair value as at 30 June 6 973 7 234
Less: Provision for impairment 0 0
Total 6 973 7 234
Buildings
Service buildings at fair value as at 30 June 16 304 12 140
Less: Accumulated depreciation ( 61) ( 23)
16 243 12 117
Work in progress (at cost) 1 009 3 047
Total 17 252 15 164
Total Buildings 17 252 15 164
Plant, Equipment and Vehicles
At cost 21 747 19 963
Less: Accumulated depreciation ( 12 833) ( 10 791)
8 914 9 172
Work in progress (at cost) 21 1 510
Total 8 935 10 682
Total property, plant and equipment 33 160 33 080
(b) Reconciliation of Movements
The Service’s land and building assets were revalued independently by Opteon Pty Ltd (formally known as Brothers and Newton
Pty Ltd) as at 30 June 2012 using adjustment indices based on Australian Bureau of Statistics statistical data, Real Estate Institute
of Tasmania median house price data, Rawlinsons Index of Construction cost estimates and own sourced research data from the
Land Information Systems Tasmania database.
Reconciliations of the carrying amounts of each class of property, plant and equipment at the beginning and end of the current and previous financial year are set out below. Carrying value means the net amount after deducting accumulated depreciation and accumulated impairment losses.

DHHS Annual Report 2011-2012 - Part 4 - Financial Statements Page 342 of 355
2012 Land$'000
Buildings$'000
Plant equipment
and vehicles$'000
Building works in progress
$'000
Total$'000
Carrying value at 1 July 7 234 12 117 10 682 3 047 33 080
Additions 0 4 184 2 453 0 6 637
Disposals 0 0 ( 48) 0 ( 48)
Revaluation increments (decrements) ( 261) 319 0 0 58
Impairment losses 0 4 0 0 4
Net transfers 0 0 ( 1 489) ( 2 426) ( 3 915)
Work in progress at cost 0 0 0 388 388
Depreciation 0 ( 381) ( 2 664) 0 ( 3 045)
6 973 16 243 8 934 1 009 33 159
2011 Land$'000
Buildings$'000
Plant equipment
and vehicles$'000
Building works in progress
$'000
Total$'000
Carrying value at 1 July 7 461 10 178 10 297 1 832 29 768
Additions 0 0 1 434 0 1 434
Disposals 0 0 ( 82) 0 ( 82)
Revaluation increments (decrements) ( 257) 476 0 0 219
Assets held for sale ( 50) ( 49) 0 0 ( 99)
Net transfers 80 1 799 0 ( 1 879) 0
Work in progress at cost 0 0 1 510 3 094 4 604
Depreciation 0 ( 287) ( 2 477) 0 ( 2 764)
7 234 12 117 10 682 3 047 33 080Carrying value at 30 June
Carrying value at 30 June

DHHS Annual Report 2011-2012 - Part 4 - Financial Statements Page 343 of 355
6.6 Intangibles
(a) Carrying Amount
2012$'000
2011$'000
Intangibles with a Finite Useful Life
Other non-current assets 0 0
Less: accumulated amortisation 0 0
Total 0 0
Intangibles with an Infinite Useful Life
Other non-current assets 0 0
Less: provision for impairment 0 0
Total 0 0
Capital Work in progress 126 41
Total Intangibles 126 41
(b) Reconciliation of Movements
2012$'000
2011$'000
Carrying Amount at 1 July 41 0
Intangible assets - purchases 0 0
Transfers from plant and equipment 85 0
Work in progress at cost 0 41
Amortisation - intangible assets 0 0
Carrying Amount at 30 June 126 41
Intangible assets with a finite useful life held by the Service principally comprise of computer software.
The work in progress for intangible assets represents expenditure for the In Vehicle Information System (IVIS).

DHHS Annual Report 2011-2012 - Part 4 - Financial Statements Page 344 of 355
6.7 Other Assets
(a) Carrying Amount
2012$'000
2011$'000
Prepayments 98 236
Total 98 236
Utilised within 12 months 98 236
Utilised in more than 12 months 0 0
98 236
(b) Reconciliation of Movements
2012$'000
2011$'000
Carrying Amount at 1 July 236 0
Additions 98 236
Utilised ( 236) 0
Carrying Amount at 30 June 98 236
Note 7 Liabilities7.1 Payables
2012$'000
2011$'000
Creditors 147 624
Accrued expenses 566 0
Total 713 624
Settled within 12 months 713 624
Total 713 624
The Prepayment relates to the first instalment for the provision of 2012-2013 services under the radio maintenance agreement
with the State Fire Commission. Prepayments are generally utilised within 12 months.

DHHS Annual Report 2011-2012 - Part 4 - Financial Statements Page 345 of 355
7.2 Employee Benefits2012$'000
2011$'000
Accrued salaries 688 412
Annual leave 4 367 4 596
Long service leave 4 813 4 143
Total 9 868 9 151
Settled within 12 months 3 529 2 909
Settled in more than 12 months 6 339 6 242
Total 9 868 9 151
7.3 Superannuation
(a) Type of Plan
The increase in employee benefits, notwithstanding the reduction in numbers of employees, has occurred due to the reduction in
market interest rates and correspondingly the rate used for discounting employee leave entitlements.
Tasmanian Ambulance Service Superannuation Scheme
The Tasmanian Ambulance Service Superannuation Scheme (TASSS) balances reported are provided in respect of those employees who are defined benefit members.
The State Actuary undertook a revaluation of the present value of the benefit obligation and the fair value of the plan assets as at 30 June 2012 using the process outlined in Australian Accounting Standards Board Standard 119 Employee Benefits. As a result of the revaluation it was determined that the TASSS
was in deficit by $11.8 million (in 2011, $3.18 million deficit). The movement over the financial year was primarily caused by an actuarial loss.

DHHS Annual Report 2011-2012 - Part 4 - Financial Statements Page 346 of 355
(b) Superannuation Liability
Present value of gross liability 50 901 40 658
Fair value of plan assets ( 39 075) ( 37 481)
11 826 3 177
Present value of unfunded liability 11 826 3 177
(Surplus)/Deficit 11 826 3 177
Net actuarial gains not recognised 0 0
Restrictions on assets recognised 0 0
Total 0 0
Settled within 12 months 1 511 1 488
Settled in more than 12 months 10 315 1 689
Total 11 826 3 177
(c) Amounts Recognised in Comprehensive Income
Net Result from Transactions
Current service cost 1 909 1 591
Interest cost 1 830 1 628
Expected return on plan assets ( 2 548) ( 2 319)
1 191 900
Other Economic Flows Included in Net Result
Actuarial (gains)/losses 8 902 2 505
0 0
Total 10 093 3 405
Adjustments for restrictions on the defined benefit asset
The current service cost, interest cost and expected return on plan assets have been included in the employee entitlements
expense in the Statement of Comprehensive Income.
Tasmanian Ambulance Service Superannuation Scheme 2012$'000
Tasmanian Ambulance Service Superannuation Scheme 2012$'000
2011$'000
2011$'000

DHHS Annual Report 2011-2012 - Part 4 - Financial Statements Page 347 of 355
7.4 Other Liabilities2012$'000
2011$'000
Revenue Received in Advance
30 0
Revenue Received in Advance (SCIF) 0 3
Other Liabilities
Employee benefits - on-costs 187 680
Total 217 683
Settled within 12 months 183 196
Settled in more than 12 months 34 487
Total 217 683
Attributed appropriation carried forward from current and previous years under section 8A(2) of the
Public Account Act 1986

DHHS Annual Report 2011-2012 - Part 4 - Financial Statements Page 348 of 355
Note 8 Commitments and Contingencies8.1 Schedule of Commitments
2012$'000
2011$'000
By Type
Operating lease commitments
Motor vehicles 813 1 402
Information technology 7 0
Total lease commitments 820 1 402
Other commitments
RFDS air ambulance standing charge 19 261 1 162
Miscellaneous goods and services contracts 1 909 1 086
Total other commitments 21 170 2 248
Total 21 990 3 650
By Maturity
Operating lease commitments
One year or less 400 852
From one to five years 420 550
More than five years 0 0
Total operating lease commitments 820 1 402
Other commitments
One year or less 2 241 1 204
From one to five years 10 602 1 019
More than five years 8 327 25
Total other commitments 21 170 2 248
Total 21 990 3 650

DHHS Annual Report 2011-2012 - Part 4 - Financial Statements Page 349 of 355
Miscellaneous goods and services contracts include commitments under the Tasmanian Fire Service Radio Maintenance Contract.
Motor Vehicles (Operating Lease)
The Service's Motor Vehicle Fleet is managed by LeasePlan Australia as part of a Whole-of-Government arrangement with the Department of Treasury and Finance as lessor. Lease payments vary according to the type of vehicle and, where applicable, the price received for trade-in vehicles. Lease terms for the majority of existing vehicles are for a period of two years or 40 000 kilometres, whichever comes first, with no change to the lease rate. New vehicle leases are for a period of three years. No restrictions or purchase options are contained in the lease. The 2012 commitment was calculated on the basis of the monthly lease payment plus registration cost of existing vehicles leased as at 30 June 2012. The cost of leases has decreased due to the usage of 12 months worth of current leases.
Information Technology
Information Technology commitments relate to software licence commitments.
RFDS Air Ambulance Standing Charge
The Royal Flying Doctor Service (RFDS) air ambulance standing charge covers availability of the aircraft and a back up aircraft with pilots available 24 hours a day with other fixtures including a hanger. It does not include variable costs such as flying hours and aviation charges. For the 2010-2011 Financial Statements the commitment was calculated as a six month commitment because a new tender was in progress. As at 30 June 2012, a new contract covering the period up to 30 June 2020 has been signed.
Miscellaneous Goods and Services Contracts

DHHS Annual Report 2011-2012 - Part 4 - Financial Statements Page 350 of 355
Note 9 Reserves9.1 Reserves
2012Total$'000
Asset Revaluation Reserve
Balance at the beginning of financial year 16 674
Revaluation increments/(decrements) 58
Balance at End of Financial Year 16 732
2011Total$'000
Asset Revaluation Reserve
Balance at the beginning of financial year 16 455
Revaluation increments/(decrements) 219
Balance at End of Financial Year 16 674
Asset Revaluation Reserve
The Asset Revaluation Reserve is used to record increments and decrements on the revaluation of non‑financial assets, as described in Note 1.9 (f).

DHHS Annual Report 2011-2012 - Part 4 - Financial Statements Page 351 of 355

DHHS Annual Report 2011-2012 - Part 4 - Financial Statements Page 352 of 355

DHHS Annual Report 2011-2012 - Part 4 - Financial Statements Page 353 of 355
Statement of Certification
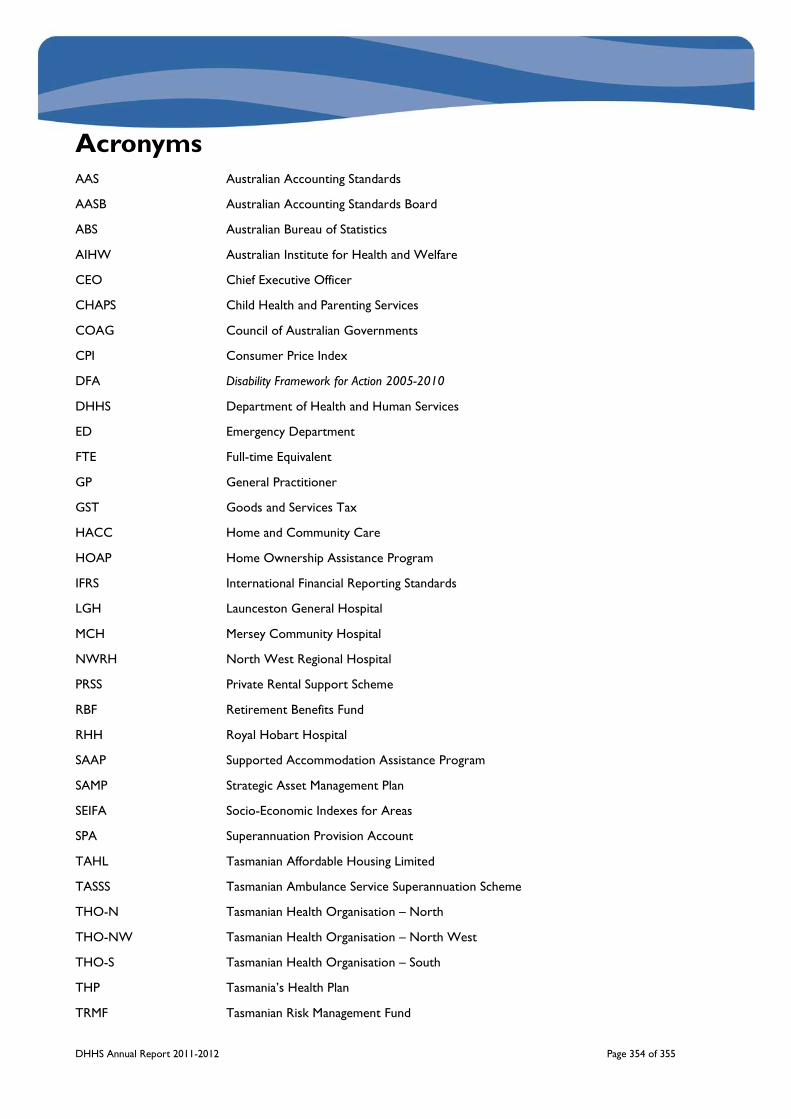
DHHS Annual Report 2011-2012 Page 354 of 355
Acronyms AAS Australian Accounting Standards
AASB Australian Accounting Standards Board
ABS Australian Bureau of Statistics
AIHW Australian Institute for Health and Welfare
CEO Chief Executive Officer
CHAPS Child Health and Parenting Services
COAG Council of Australian Governments
CPI Consumer Price Index
DFA Disability Framework for Action 2005-2010
DHHS Department of Health and Human Services
ED Emergency Department
FTE Full-time Equivalent
GP General Practitioner
GST Goods and Services Tax
HACC Home and Community Care
HOAP Home Ownership Assistance Program
IFRS International Financial Reporting Standards
LGH Launceston General Hospital
MCH Mersey Community Hospital
NWRH North West Regional Hospital
PRSS Private Rental Support Scheme
RBF Retirement Benefits Fund
RHH Royal Hobart Hospital
SAAP Supported Accommodation Assistance Program
SAMP Strategic Asset Management Plan
SEIFA Socio-Economic Indexes for Areas
SPA Superannuation Provision Account
TAHL Tasmanian Affordable Housing Limited
TASSS Tasmanian Ambulance Service Superannuation Scheme
THO-N Tasmanian Health Organisation – North
THO-NW Tasmanian Health Organisation – North West
THO-S Tasmanian Health Organisation – South
THP Tasmania’s Health Plan
TRMF Tasmanian Risk Management Fund

DHHS Annual Report 2011-2012 Page 355 of 355
Contacting the Department of Health and Human Services Corporate Office
Street Address: 34 Davey Street
Hobart TAS 7000
Postal Address: GPO Box 125
Hobart TAS 7001
Internet Email: www.dhhs.tas.gov.au/contact
Telephone Reception: (03) 6233 4712
General Enquiries
Service Tasmania operates one number for the Government which directs calls to the appropriate area within the State Government. Simply call 1300 135 513 to contact the area of the Agency that you require.