Embed Size (px)
DESCRIPTION
tgvd
Citation preview

WBS-IARF Model-Manual Log-Log- Analysis-WTA 1
MOnur Sept. 2013
WBS-IARF Model-Manual Log-Log- Analysis-WTA 2
MOnur Sept. 2013
WBS-IARF Model-Manual Log-Log- Analysis-WTA 3
Here tw is any time value to be chosen on the unit-
MOnur Sept. 2013
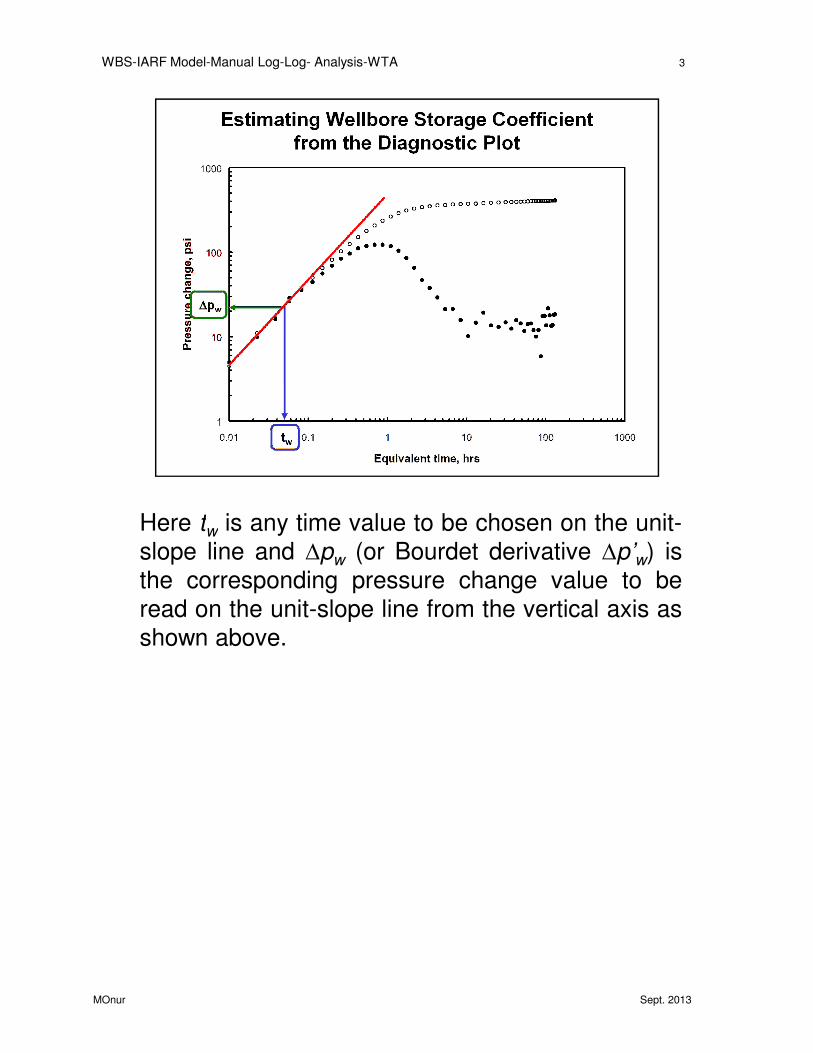
Here tw is any time value to be chosen on the unit-
slope line and ∆pw (or Bourdet derivative ∆p’w) is
the corresponding pressure change value to be
read on the unit-slope line from the vertical axis as
shown above.
WBS-IARF Model-Manual Log-Log- Analysis-WTA 4
MOnur Sept. 2013
WBS-IARF Model-Manual Log-Log- Analysis-WTA 5
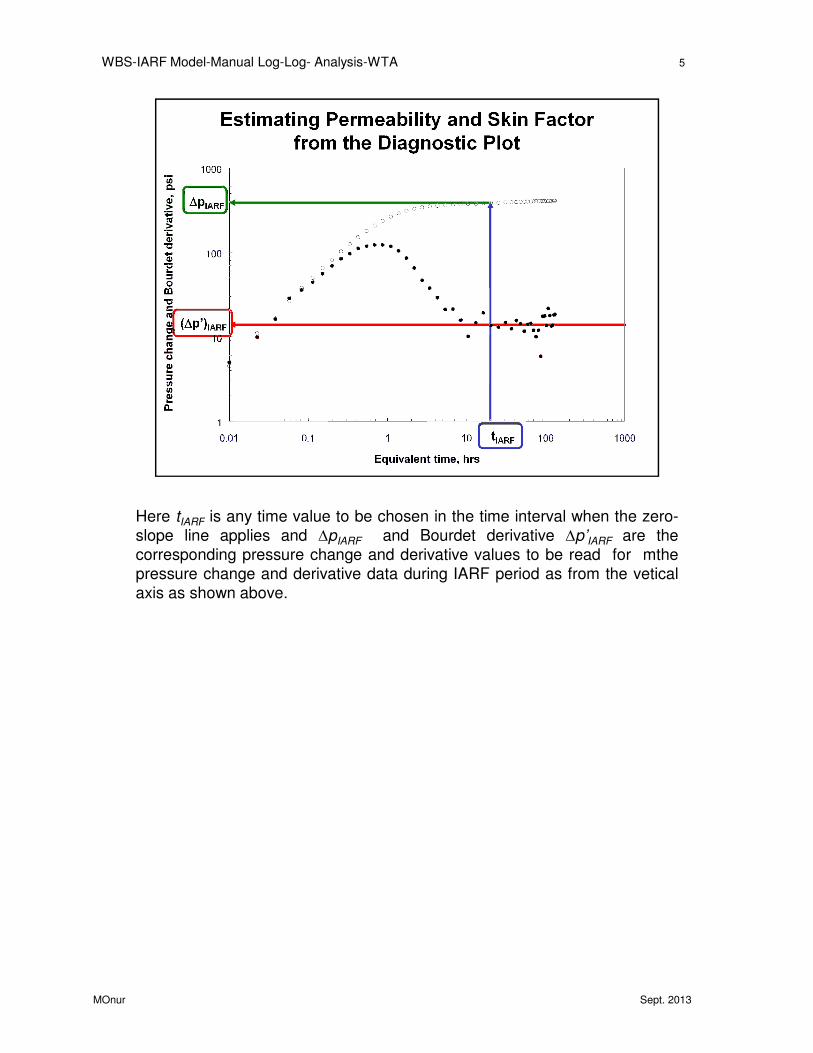
Here tIARF is any time value to be chosen in the time interval when the zero-
MOnur Sept. 2013
IARF
slope line applies and ∆pIARF and Bourdet derivative ∆p’IARF are the
corresponding pressure change and derivative values to be read for mthe
pressure change and derivative data during IARF period as from the vetical
axis as shown above.

WBS-IARF Model-Manual Log-Log- Analysis-WTA 6
MOnur Sept. 2013
WBS-IARF Model-Manual Log-Log- Analysis-WTA 7
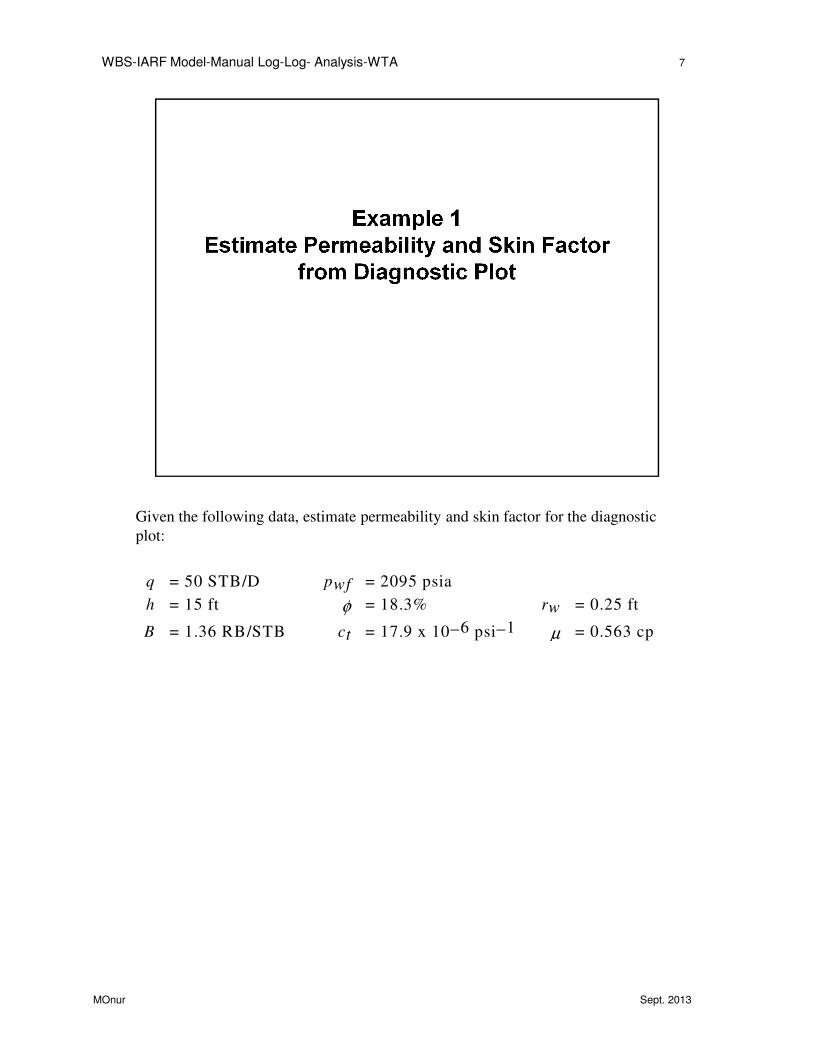
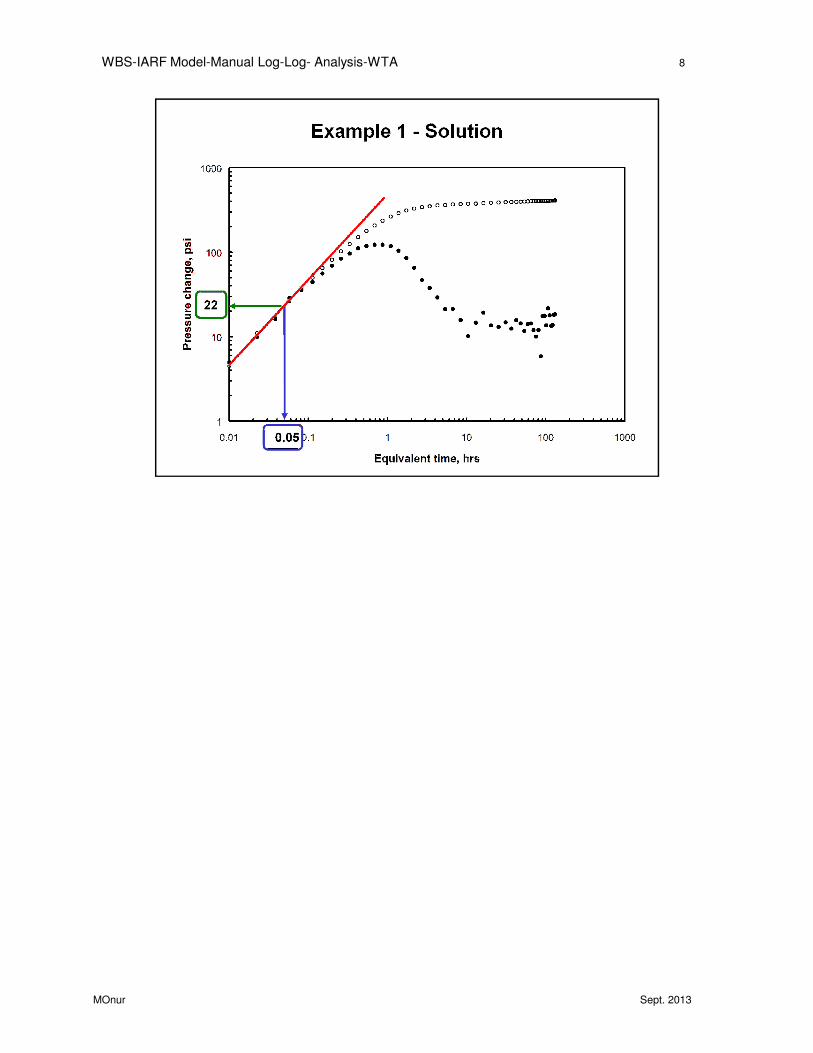
Given the following data, estimate permeability and skin factor for the diagnostic
MOnur Sept. 2013
plot:
q = 50 STB/D pwf = 2095 psia
h = 15 ft φ = 18.3% rw = 0.25 ft
B = 1.36 RB/STB ct = 17.9 x 10⁻⁶ psi−1 µ = 0.563 cp
WBS-IARF Model-Manual Log-Log- Analysis-WTA 8
MOnur Sept. 2013

WBS-IARF Model-Manual Log-Log- Analysis-WTA 9
MOnur Sept. 2013

WBS-IARF Model-Manual Log-Log- Analysis-WTA 10
From the horizontal part of the field data derivative curve,
MOnur Sept. 2013
From the horizontal part of the field data derivative curve,
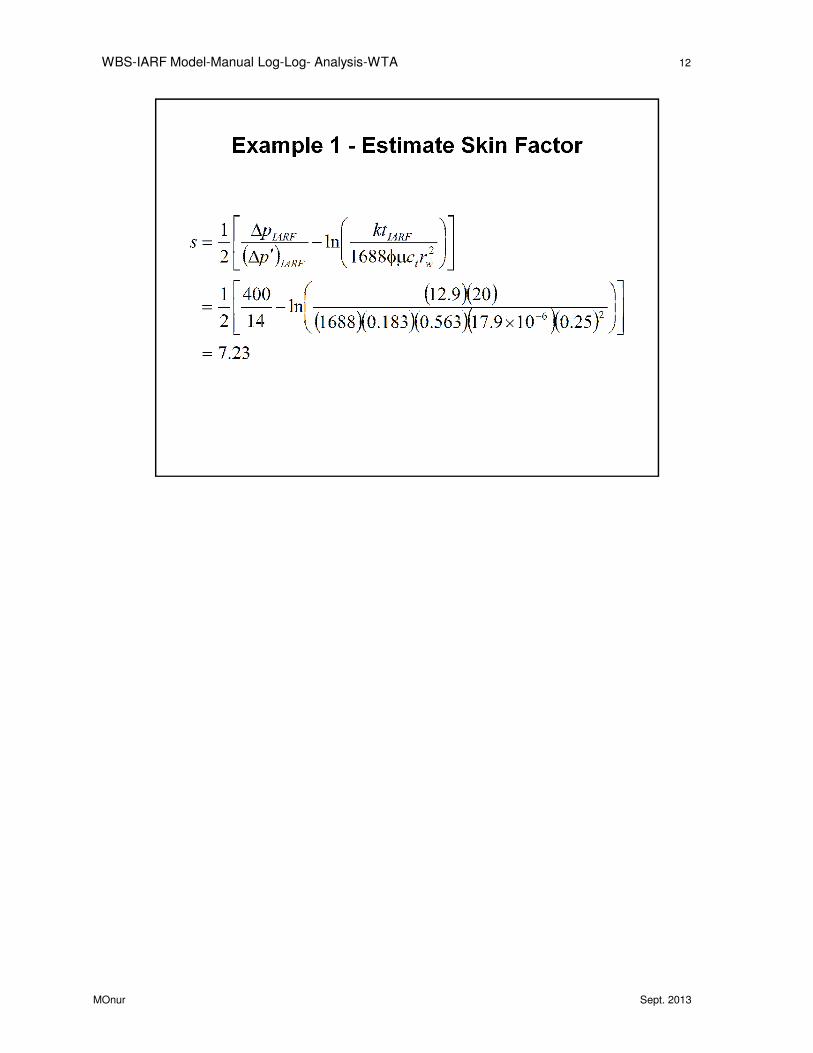
we estimate (∆p’)IARF. to be 14.
We pick a convenient time tIARF, 20, within the horizontal
portion of the derivative, and read the coordinates of the
field data pressure change curve at that time, ∆pIARF to
be 400.

WBS-IARF Model-Manual Log-Log- Analysis-WTA 11
MOnur Sept. 2013
WBS-IARF Model-Manual Log-Log- Analysis-WTA 12
MOnur Sept. 2013

WBS-IARF Model-Manual Log-Log- Analysis-WTA 13
Given the following data, analyze the data in the log-log
MOnur Sept. 2013
Given the following data, analyze the data in the log-log
graph above. Answer: C = 2.3x10⁻³ bbl/psi, k = 41 md, s =
0.
q = 50 STB/D
h = 25 ft φ = 27.6 % rw = 0.36 ft
Bo = 1.099 RB/STB ct = 9.4 x 10⁻⁶ psi−1 µο = 5.28 cp
WBS-IARF Model-Manual Log-Log- Analysis-WTA 14
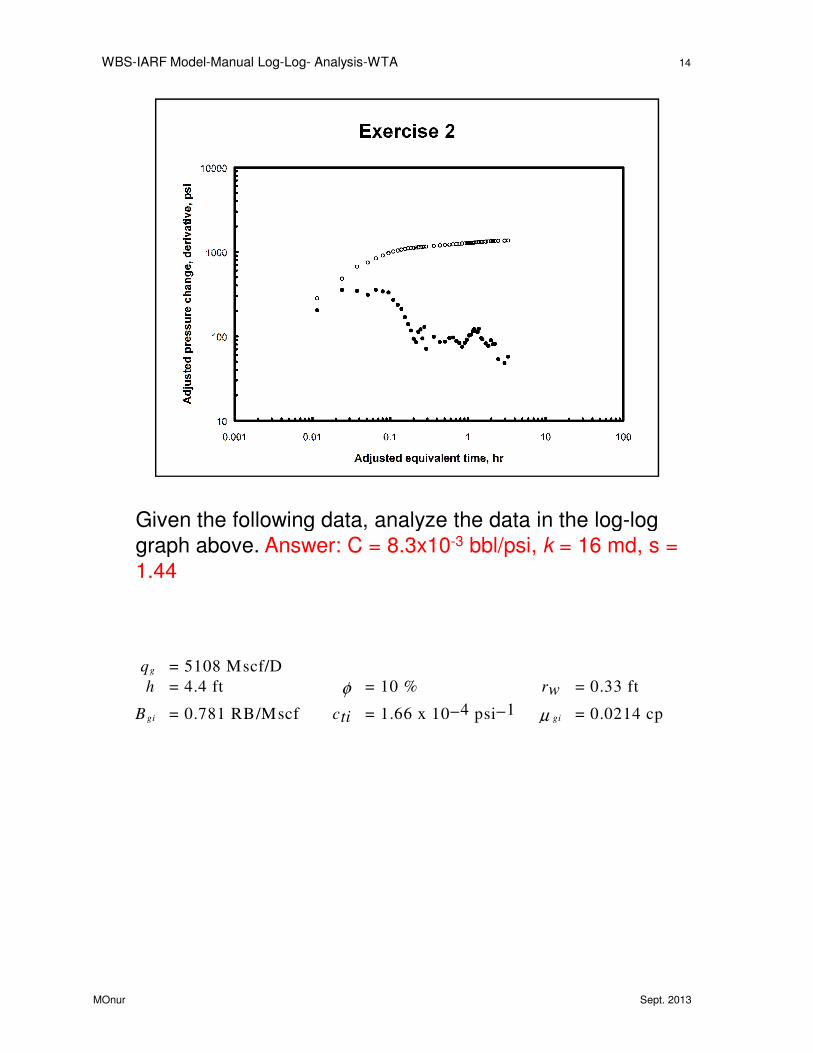
Given the following data, analyze the data in the log-log
MOnur Sept. 2013
Given the following data, analyze the data in the log-log
graph above. Answer: C = 8.3x10⁻³ bbl/psi, k = 16 md, s =
1.44
qg = 5108 Mscf/D
h = 4.4 ft φ = 10 % rw = 0.33 ft
Bgi = 0.781 RB/Mscf cti = 1.66 x 10⁻⁴ psi−1 µ gi = 0.0214 cp

![[Project Name]project-management.magt.biz/templates/02-scope-mgmt/02-120-wbs&… · WBS DICTIONARY The WBS Dictionary is a document that describes each WBS component including a brief](https://img.pdfslide.net/doc/110x75/5aedf65d7f8b9a90319062ce/project-nameproject-wbs-dictionary-the-wbs-dictionary-is-a-document-that-describes.jpg)