Embed Size (px)
Citation preview
World Geography 3202 August 2009Page 1 of 30
PART I
Instructions: Shade the letter of the correct answer on the machine scorable answer sheet
provided.
SECTION A TOTAL VALUE: 42%
Instructions: Do ALL of the Questions in Part I, Section A.
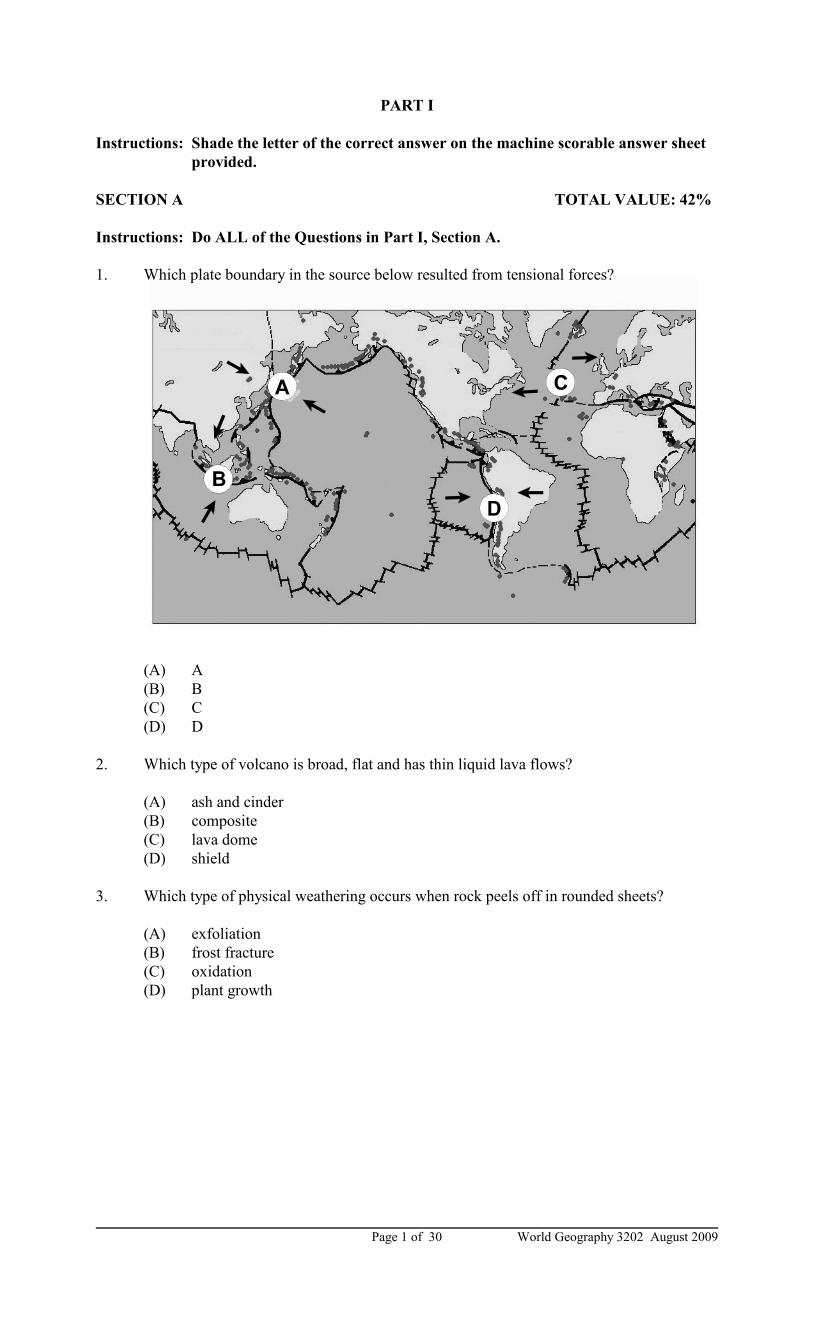
1. Which plate boundary in the source below resulted from tensional forces?
(A) A
(B) B
(C) C
(D) D
2. Which type of volcano is broad, flat and has thin liquid lava flows?
(A) ash and cinder
(B) composite
(C) lava dome
(D) shield
3. Which type of physical weathering occurs when rock peels off in rounded sheets?
(A) exfoliation
(B) frost fracture
(C) oxidation
(D) plant growth
World Geography 3202 August 2009 Page 2 of 30
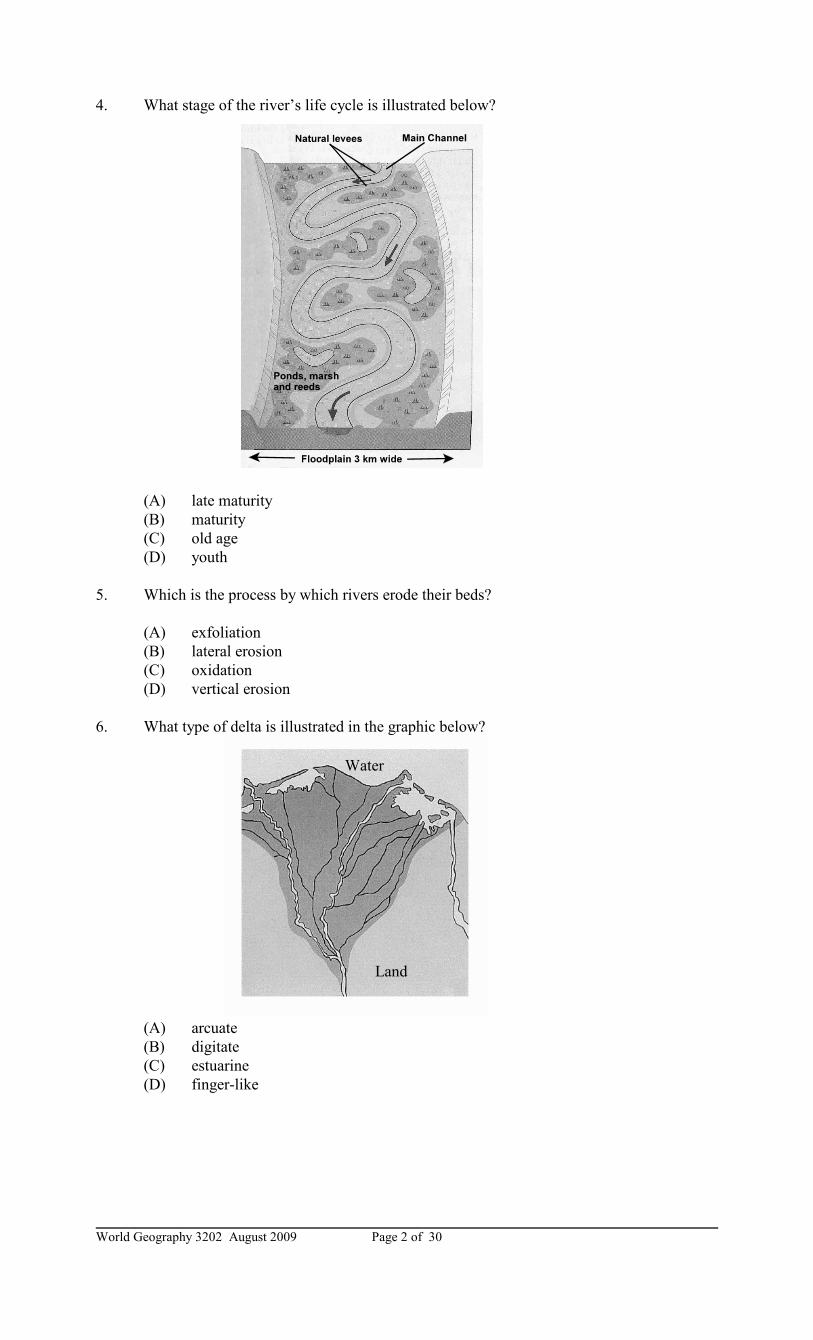
4. What stage of the river’s life cycle is illustrated below?
(A) late maturity
(B) maturity
(C) old age
(D) youth
5. Which is the process by which rivers erode their beds?
(A) exfoliation
(B) lateral erosion
(C) oxidation
(D) vertical erosion
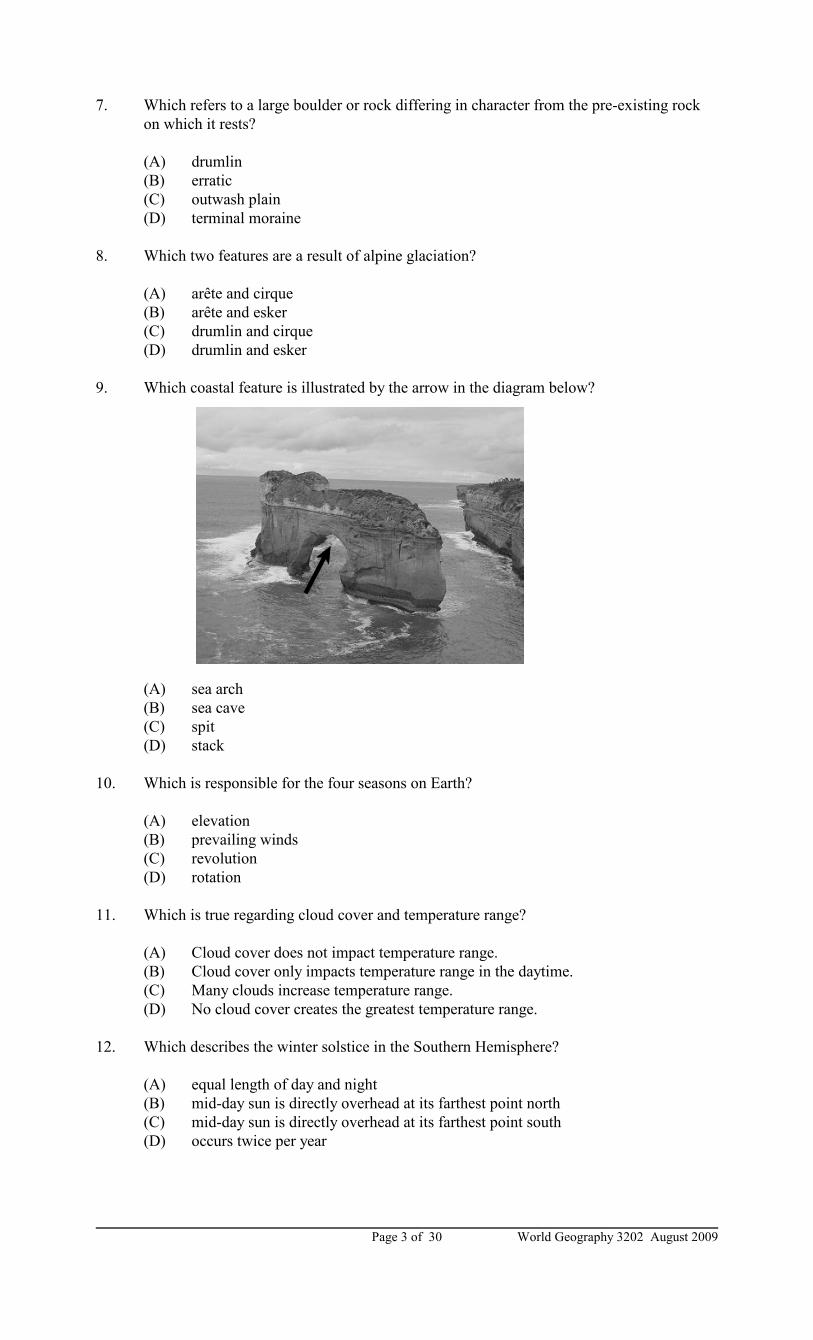
6. What type of delta is illustrated in the graphic below?
(A) arcuate
(B) digitate
(C) estuarine
(D) finger-like
Water
Land
World Geography 3202 August 2009Page 3 of 30
7. Which refers to a large boulder or rock differing in character from the pre-existing rock
on which it rests?
(A) drumlin
(B) erratic
(C) outwash plain
(D) terminal moraine
8. Which two features are a result of alpine glaciation?
(A) arête and cirque
(B) arête and esker
(C) drumlin and cirque
(D) drumlin and esker
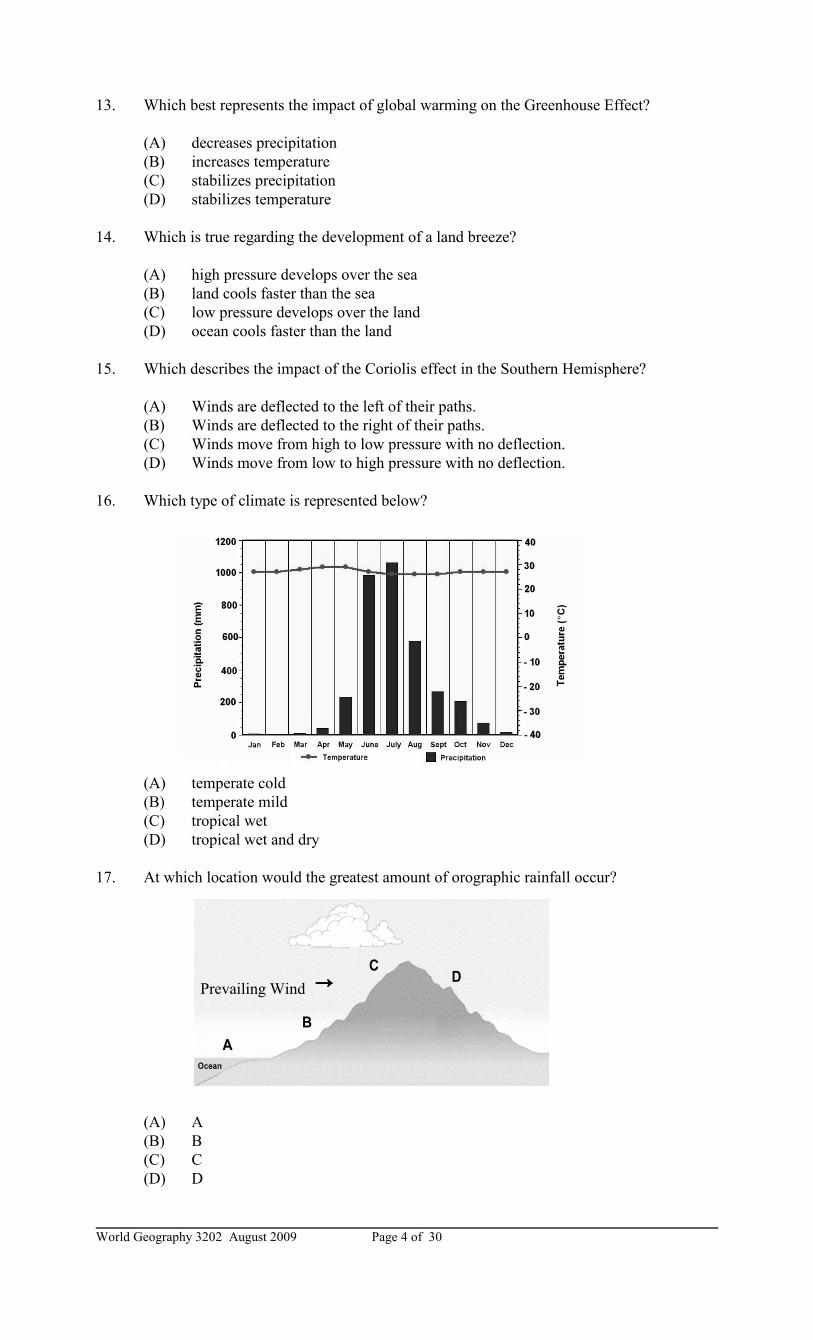
9. Which coastal feature is illustrated by the arrow in the diagram below?
(A) sea arch
(B) sea cave
(C) spit
(D) stack
10. Which is responsible for the four seasons on Earth?
(A) elevation
(B) prevailing winds
(C) revolution
(D) rotation
11. Which is true regarding cloud cover and temperature range?
(A) Cloud cover does not impact temperature range.
(B) Cloud cover only impacts temperature range in the daytime.
(C) Many clouds increase temperature range.
(D) No cloud cover creates the greatest temperature range.
12. Which describes the winter solstice in the Southern Hemisphere?
(A) equal length of day and night
(B) mid-day sun is directly overhead at its farthest point north
(C) mid-day sun is directly overhead at its farthest point south
(D) occurs twice per year
World Geography 3202 August 2009 Page 4 of 30
13. Which best represents the impact of global warming on the Greenhouse Effect?
(A) decreases precipitation
(B) increases temperature
(C) stabilizes precipitation
(D) stabilizes temperature
14. Which is true regarding the development of a land breeze?
(A) high pressure develops over the sea
(B) land cools faster than the sea
(C) low pressure develops over the land
(D) ocean cools faster than the land
15. Which describes the impact of the Coriolis effect in the Southern Hemisphere?
(A) Winds are deflected to the left of their paths.
(B) Winds are deflected to the right of their paths.
(C) Winds move from high to low pressure with no deflection.
(D) Winds move from low to high pressure with no deflection.
16. Which type of climate is represented below?
(A) temperate cold
(B) temperate mild
(C) tropical wet
(D) tropical wet and dry
17. At which location would the greatest amount of orographic rainfall occur?
(A) A
(B) B
(C) C
(D) D
Prevailing Wind 6666
World Geography 3202 August 2009Page 5 of 30
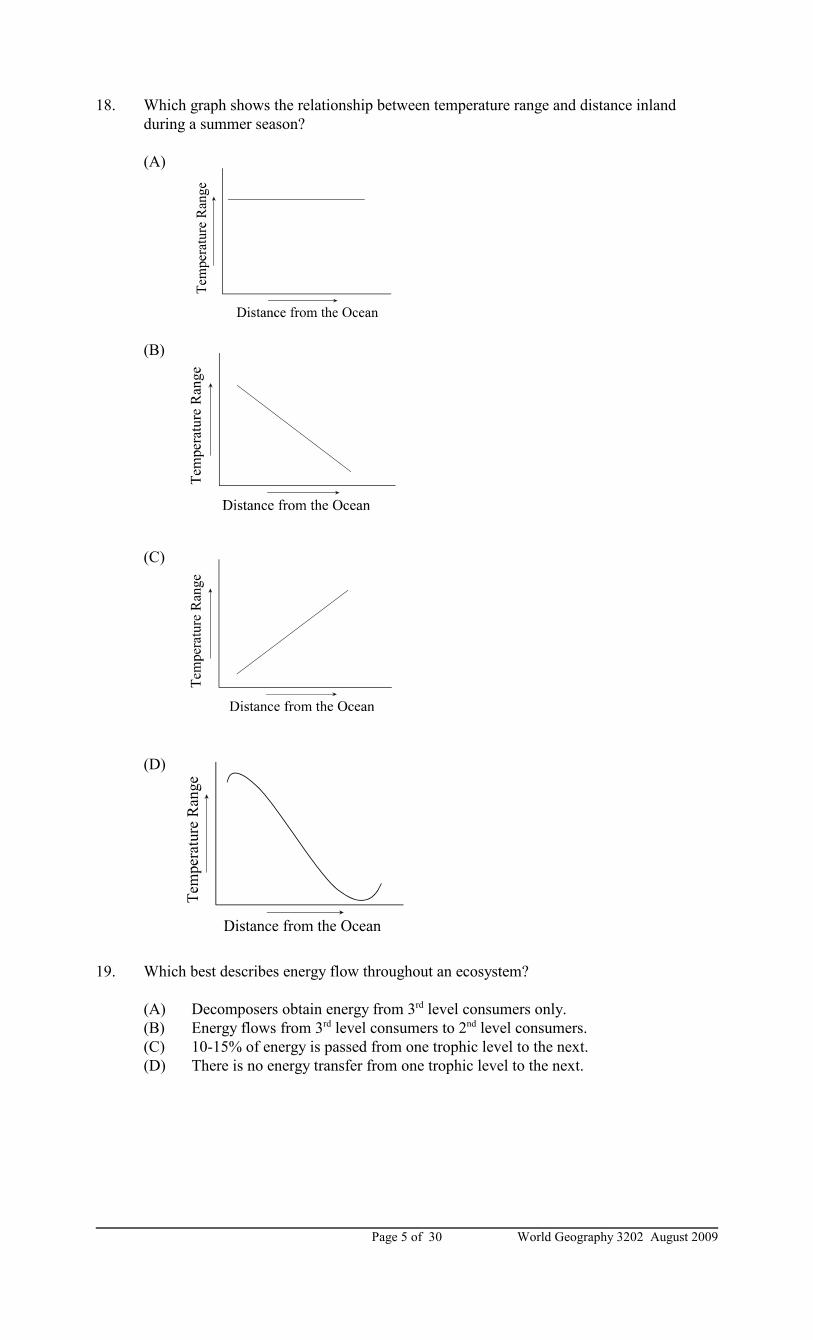
18. Which graph shows the relationship between temperature range and distance inland
during a summer season?
(A)
(B)
(C)
(D)
19. Which best describes energy flow throughout an ecosystem?
(A) Decomposers obtain energy from 3rd level consumers only.
(B) Energy flows from 3rd level consumers to 2nd level consumers.
(C) 10-15% of energy is passed from one trophic level to the next.
(D) There is no energy transfer from one trophic level to the next.
World Geography 3202 August 2009 Page 6 of 30
• long, snowy winters
• summers have moderate temperatures
• vegetation is dominated by thick forests of needle-leaf trees
20. Which world ecosystem matches the description below?
(A) boreal forest
(B) savanna
(C) scrub
(D) temperate forest
21. Which pattern best describes the change in ecosystems from polar regions to the equator?
(A) boreal forest º temperate forest º tropical rain forest º tundra
(B) boreal forest º temperate forest º tundra º tropical rain forest
(C) tundra º boreal forest º temperate forest º tropical rain forest
(D) tundra º boreal forest º tropical rain forest º temperate forest
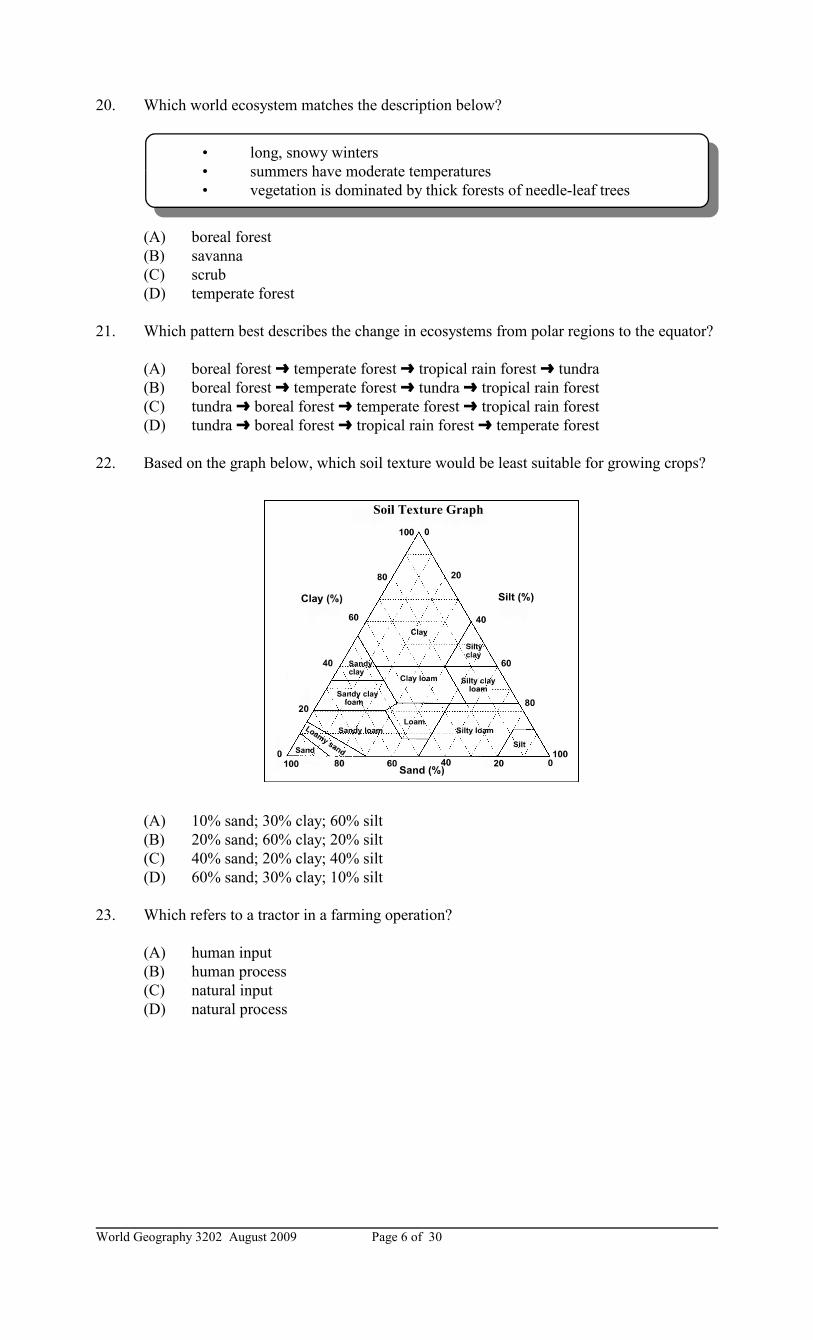
22. Based on the graph below, which soil texture would be least suitable for growing crops?
(A) 10% sand; 30% clay; 60% silt
(B) 20% sand; 60% clay; 20% silt
(C) 40% sand; 20% clay; 40% silt
(D) 60% sand; 30% clay; 10% silt
23. Which refers to a tractor in a farming operation?
(A) human input
(B) human process
(C) natural input
(D) natural process
World Geography 3202 August 2009Page 7 of 30
• large annual temperature range (-10EC to 25EC)
• less than 75 cm of annual precipitation
24. Which crop is most suited to the climatic conditions described below?
(A) olives
(B) oranges
(C) watermelon
(D) wheat
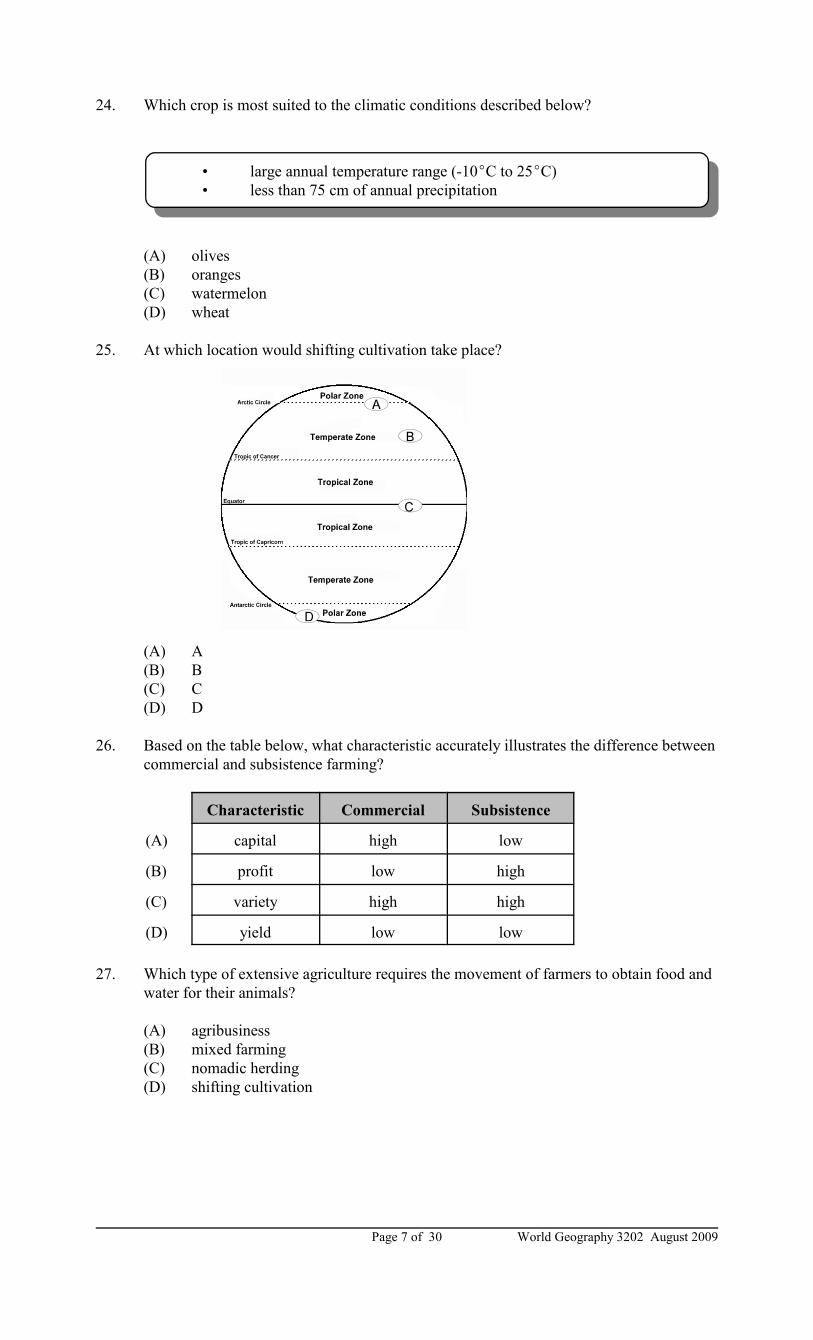
25. At which location would shifting cultivation take place?
(A) A
(B) B
(C) C
(D) D
26. Based on the table below, what characteristic accurately illustrates the difference between
commercial and subsistence farming?
Characteristic Commercial Subsistence
(A) capital high low
(B) profit low high
(C) variety high high
(D) yield low low
27. Which type of extensive agriculture requires the movement of farmers to obtain food and
water for their animals?
(A) agribusiness
(B) mixed farming
(C) nomadic herding
(D) shifting cultivation
World Geography 3202 August 2009 Page 8 of 30
28. Which is true regarding selective cutting?
(A) few roads to be maintained
(B) high yields
(C) least ecologically damaging
(D) very inexpensive
29. Which would be considered a human factor in an offshore oil and gas operation?
(A) anticline trap
(B) fault trap
(C) oil deposit
(D) oil rig
30. Which type of oil rig is most suitable for drilling in water greater than 2000 metres deep?
(A) jack-up
(B) semi-submersible anchored
(C) semi-submersible dynamically positioned
(D) submersible
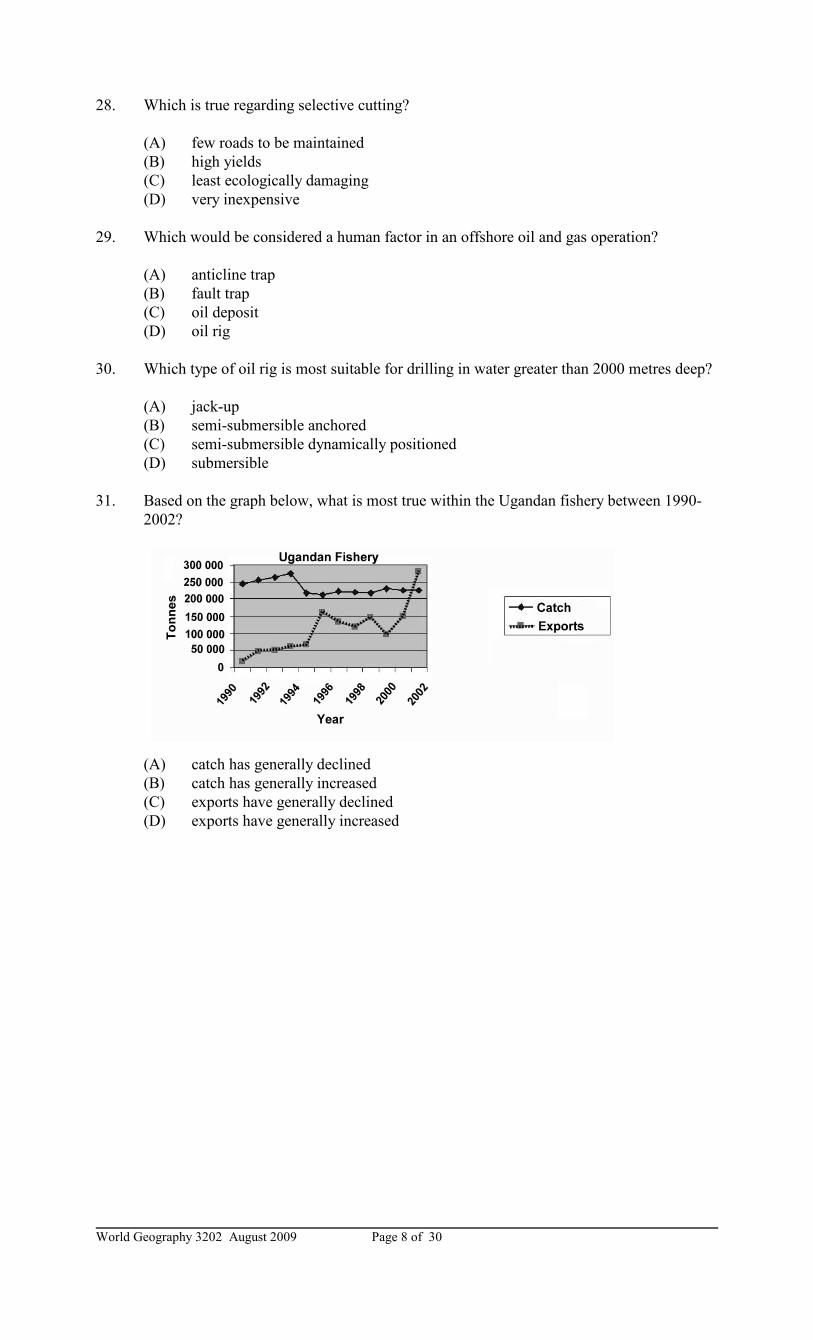
31. Based on the graph below, what is most true within the Ugandan fishery between 1990-
2002?
(A) catch has generally declined
(B) catch has generally increased
(C) exports have generally declined
(D) exports have generally increased
World Geography 3202 August 2009Page 9 of 30
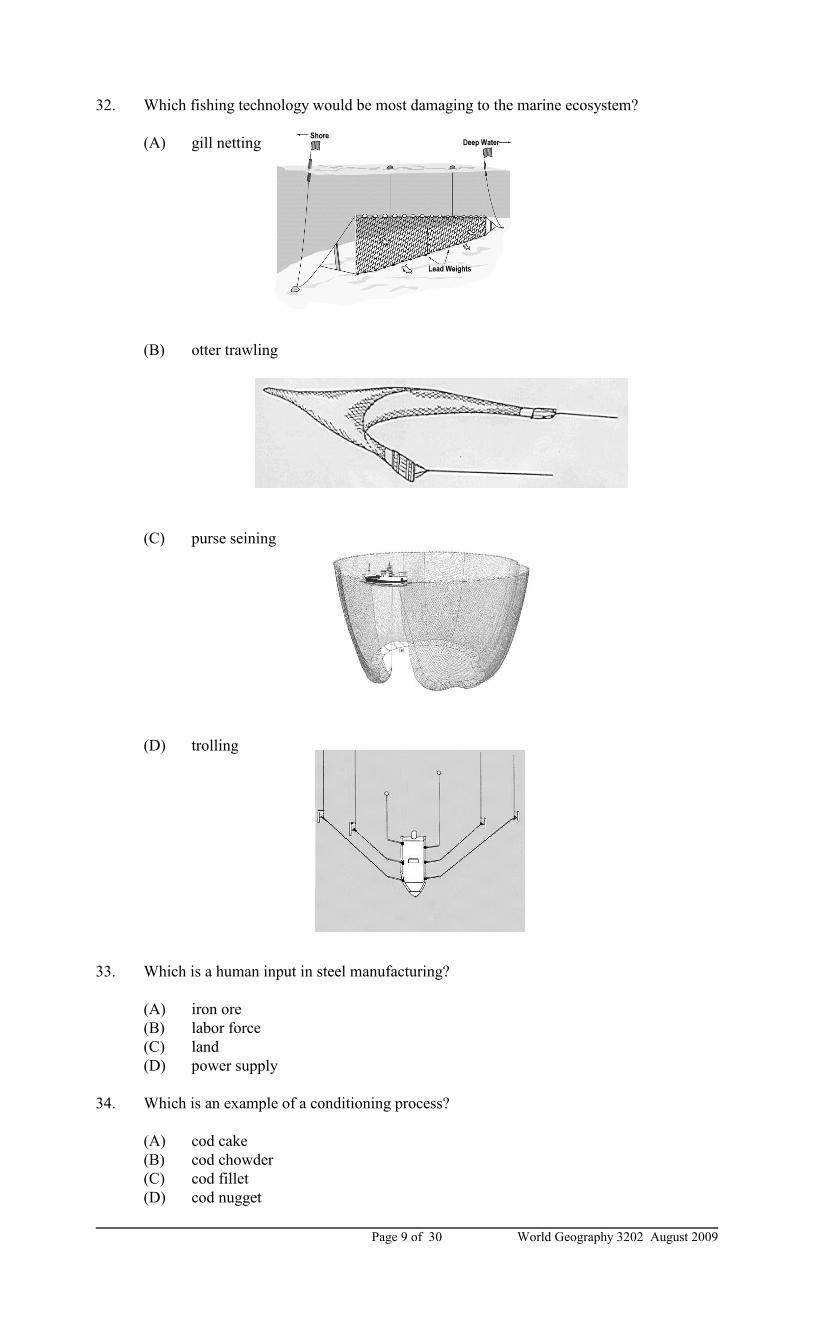
32. Which fishing technology would be most damaging to the marine ecosystem?
(A) gill netting
(B) otter trawling
(C) purse seining
(D) trolling
33. Which is a human input in steel manufacturing?
(A) iron ore
(B) labor force
(C) land
(D) power supply
34. Which is an example of a conditioning process?
(A) cod cake
(B) cod chowder
(C) cod fillet
(D) cod nugget
World Geography 3202 August 2009 Page 10 of 30
• raw materials are heavy and relatively low value for weight
• processing results in overall weight decrease
35. Which manufacturing operations are best illustrated by custom jewelry-making?
(A) capital-intensive and heavy-industry
(B) capital-intensive and light industry
(C) labour-intensive and heavy industry
(D) labour intensive and light industry
36. Which describes products created by heavy industry?
(A) created for the general consumer
(B) generally light in weight
(C) made from bulky raw materials
(D) usually transported by air
37. Which type of industry location is described below?
(A) agglomerating tendency
(B) market-oriented
(C) resource-oriented
(D) tertiary activity
38. Which is the best example of a private tertiary activity?
(A) emergency room doctor
(B) fireman
(C) insurance broker
(D) police officer
39. Which sector of the economy is directly involved in the development of technology and
information services?
(A) primary
(B) quaternary
(C) secondary
(D) tertiary
40. Which is true regarding tertiary activities?
(A) As a country becomes wealthier, the tertiary sector expands.
(B) As a country becomes wealthier, the tertiary sector shrinks.
(C) Developed countries have low levels of tertiary employment.
(D) Developing countries have high levels of tertiary employment.
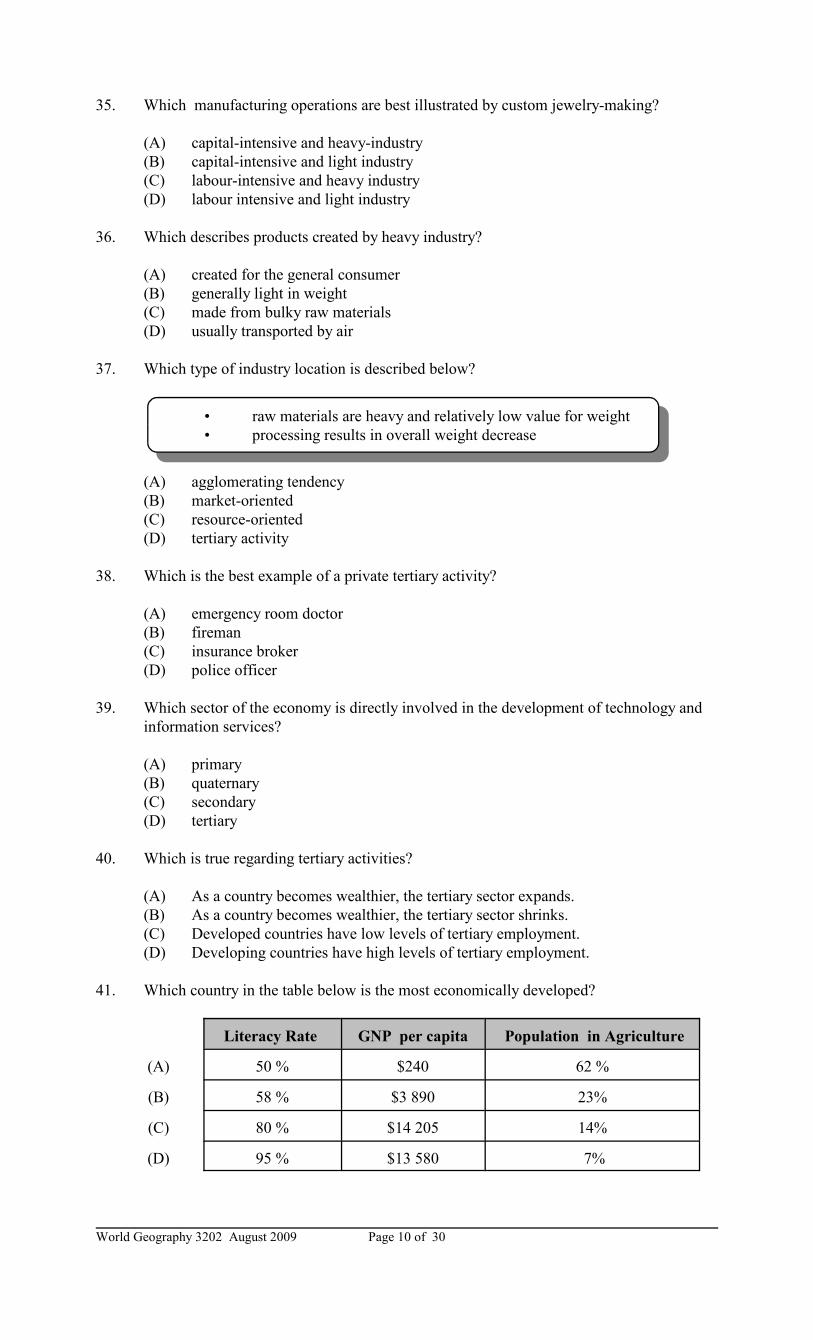
41. Which country in the table below is the most economically developed?
Literacy Rate GNP per capita Population in Agriculture
(A) 50 % $240 62 %
(B) 58 % $3 890 23%
(C) 80 % $14 205 14%
(D) 95 % $13 580 7%
World Geography 3202 August 2009Page 11 of 30
At the present rate of population growth, the population of Country X will double in
1500 years; whereas, the population of Country Y will double in 8 years.
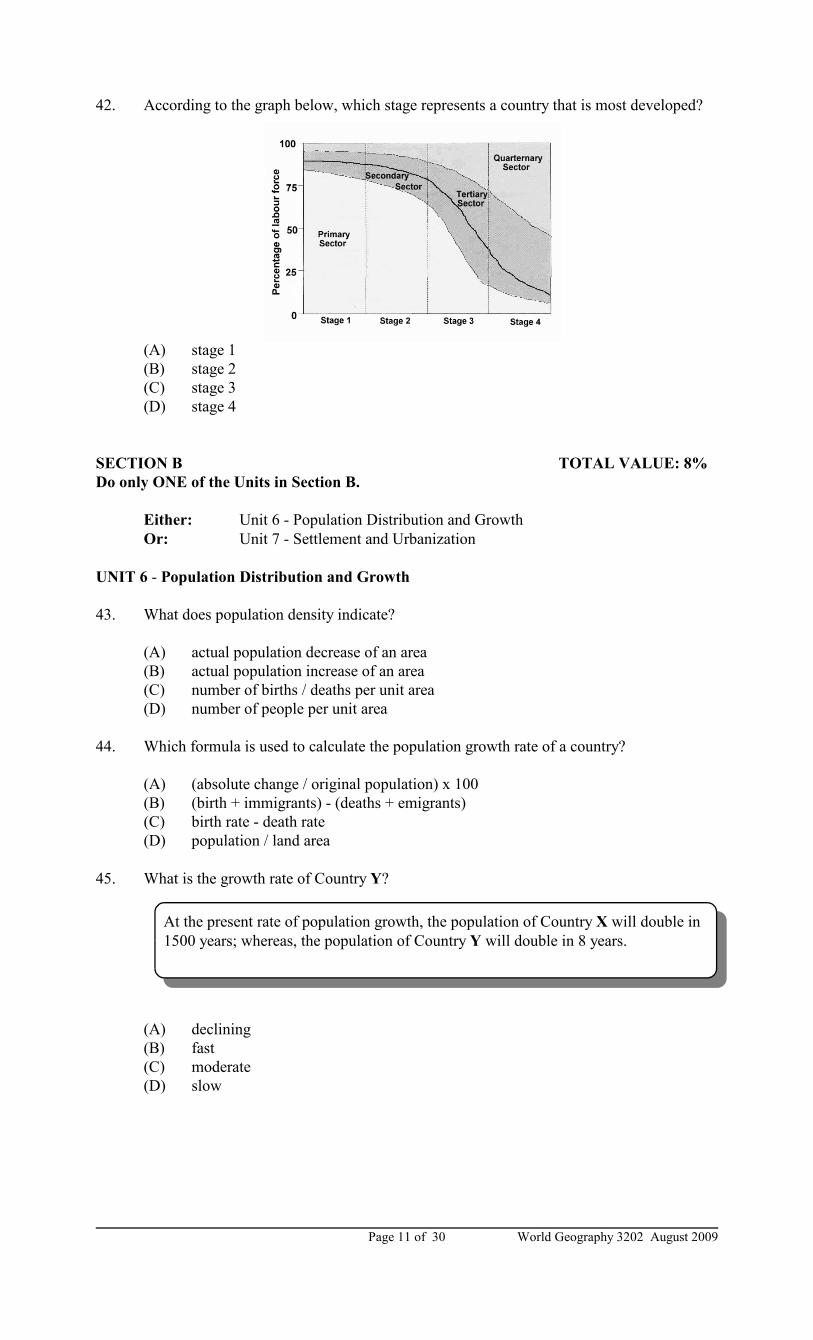
42. According to the graph below, which stage represents a country that is most developed?
(A) stage 1
(B) stage 2
(C) stage 3
(D) stage 4
SECTION B TOTAL VALUE: 8%
Do only ONE of the Units in Section B.
Either: Unit 6 - Population Distribution and Growth
Or: Unit 7 - Settlement and Urbanization
UNIT 6 - Population Distribution and Growth
43. What does population density indicate?
(A) actual population decrease of an area
(B) actual population increase of an area
(C) number of births / deaths per unit area
(D) number of people per unit area
44. Which formula is used to calculate the population growth rate of a country?
(A) (absolute change / original population) x 100
(B) (birth + immigrants) - (deaths + emigrants)
(C) birth rate - death rate
(D) population / land area
45. What is the growth rate of Country Y?
(A) declining
(B) fast
(C) moderate
(D) slow
World Geography 3202 August 2009 Page 12 of 30
• unsanitary living conditions
• epidemics
• low life expectancy
46. Which best reflects the problem of overpopulation resulting from the characteristics
below?
(A) economic
(B) environmental
(C) health / social
(D) political
47. Which factor contributes to a graying population?
(A) environmental pollutants
(B) improved medical care
(C) increasing death rates
(D) low life expectancy
48. Which population concept is represented by the arrival of refugees into Canada?
(A) emigration
(B) immigration
(C) intervening obstacle
(D) repel factor
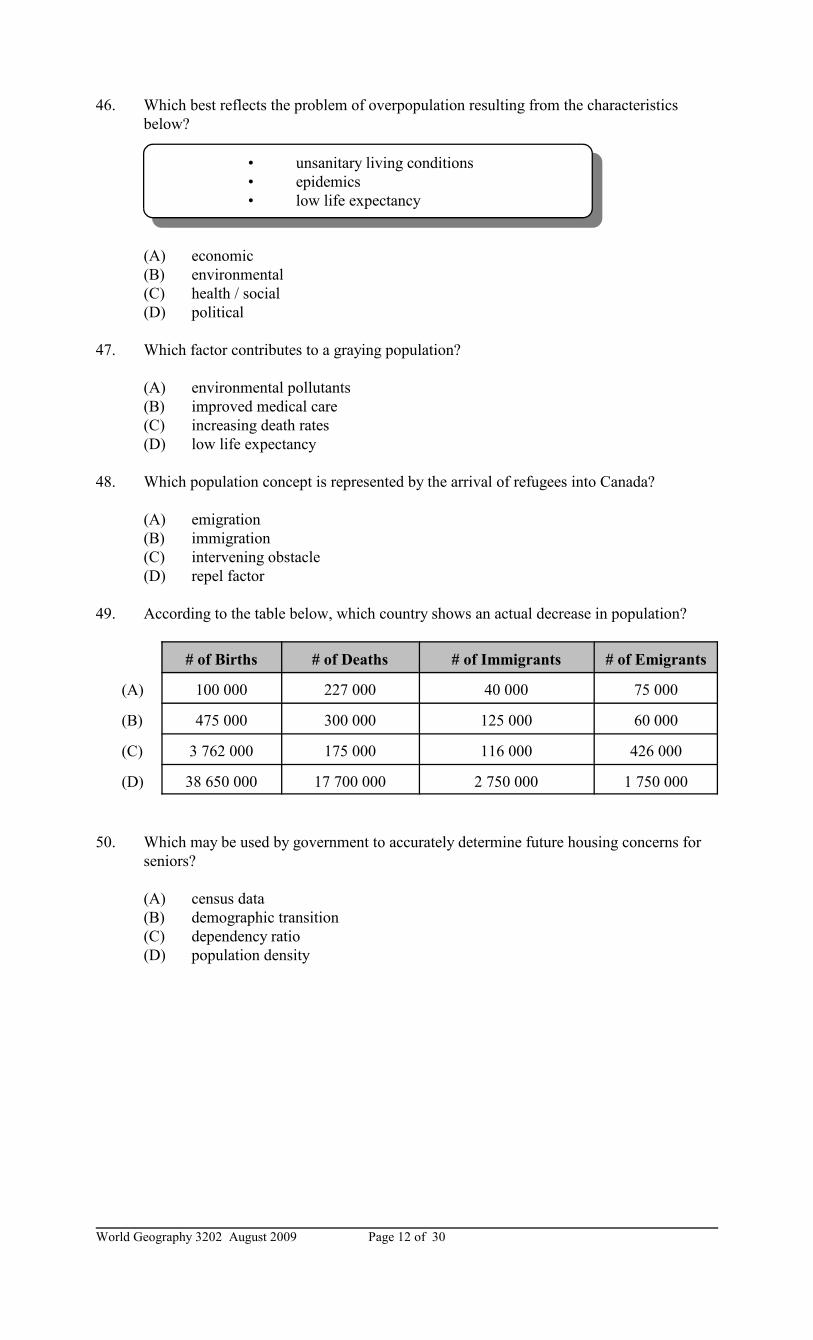
49. According to the table below, which country shows an actual decrease in population?
# of Births # of Deaths # of Immigrants # of Emigrants
(A) 100 000 227 000 40 000 75 000
(B) 475 000 300 000 125 000 60 000
(C) 3 762 000 175 000 116 000 426 000
(D) 38 650 000 17 700 000 2 750 000 1 750 000
50. Which may be used by government to accurately determine future housing concerns for
seniors?
(A) census data
(B) demographic transition
(C) dependency ratio
(D) population density
World Geography 3202 August 2009Page 13 of 30
any built-up area with a population of 1000 or more and a population density of 400
or more per square kilometre
Unit 7 - Settlement and Urbanization
Note: If you are completing this unit, please ensure you shade bubbles for 51-58.
51. Which term is best defined by the statement below?
(A) linear settlement
(B) loose knit settlement
(C) rural area
(D) urban area
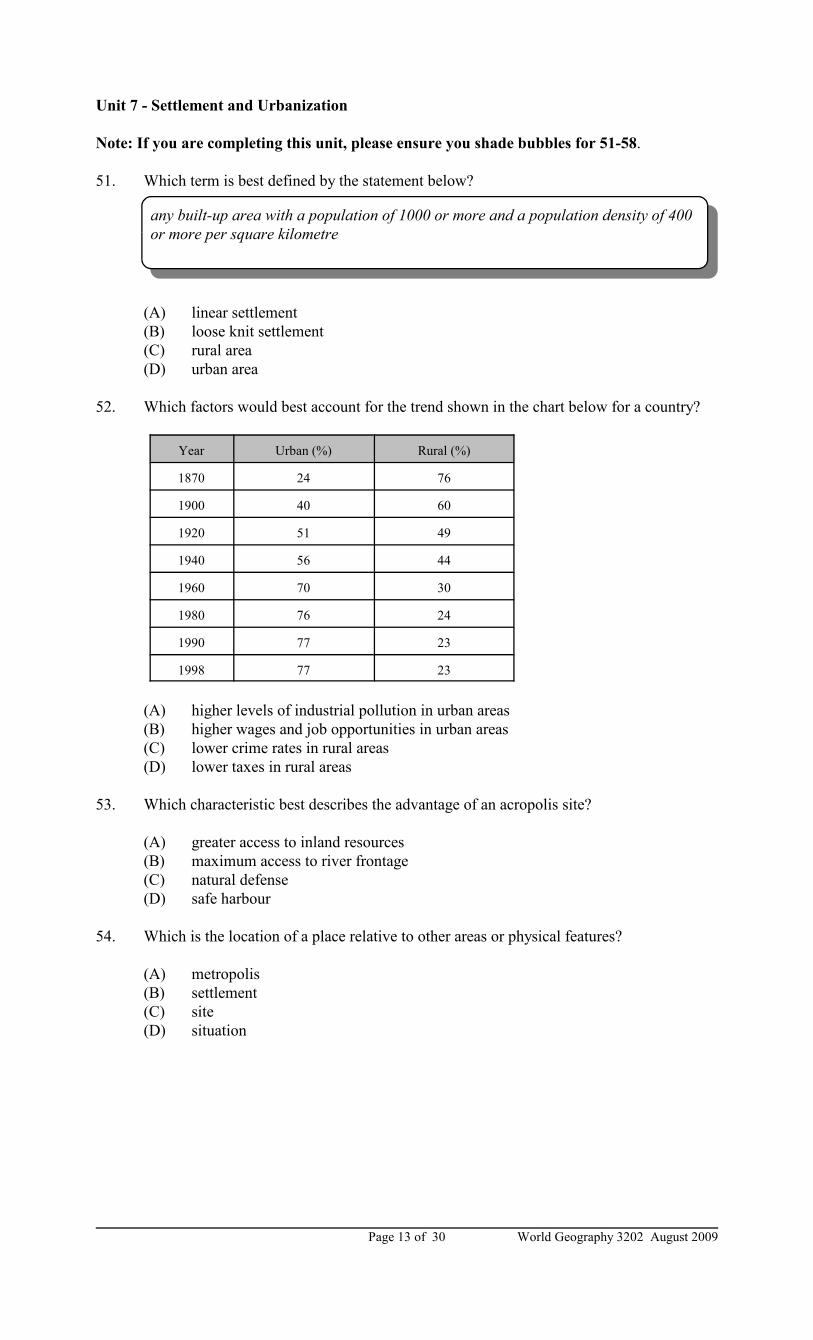
52. Which factors would best account for the trend shown in the chart below for a country?
Year Urban (%) Rural (%)
1870 24 76
1900 40 60
1920 51 49
1940 56 44
1960 70 30
1980 76 24
1990 77 23
1998 77 23
(A) higher levels of industrial pollution in urban areas
(B) higher wages and job opportunities in urban areas
(C) lower crime rates in rural areas
(D) lower taxes in rural areas
53. Which characteristic best describes the advantage of an acropolis site?
(A) greater access to inland resources
(B) maximum access to river frontage
(C) natural defense
(D) safe harbour
54. Which is the location of a place relative to other areas or physical features?
(A) metropolis
(B) settlement
(C) site
(D) situation
World Geography 3202 August 2009 Page 14 of 30
55. Which set of city population statistics best illustrates a rank-size city arrangement?
Population of
Largest City
Population of 2nd
Largest City
Population of 3rd
Largest City
Population of 4th
Largest City
(A) 800 000 725 000 475 000 250 000
(B) 4 300 000 3 500 000 1 800 000 1 000 000
(C) 7 750 000 3 250 000 2 250 000 1 850 000
(D) 8 250 000 1 500 000 750 000 250 000
56. Which generally results when large cities plan land use activities?
(A) conflict between residential and industrial areas is avoided
(B) industrial agglomeration is avoided
(C) size of public areas is reduced
(D) traffic speeds are reduced
57. Which is a settlement where buildings are grouped closely together, usually having a
well-defined nucleus?
(A) compact
(B) composite
(C) linear
(D) loose-knit
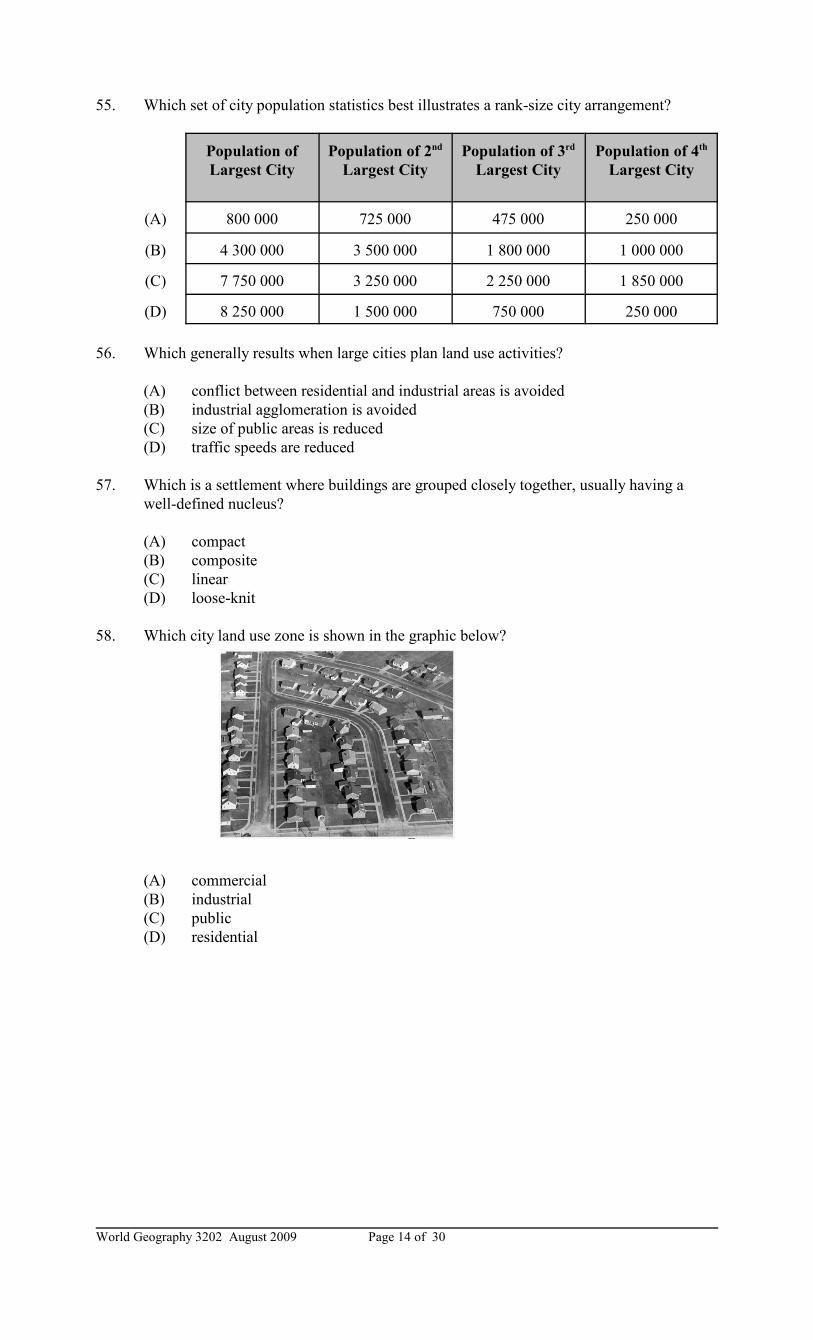
58. Which city land use zone is shown in the graphic below?
(A) commercial
(B) industrial
(C) public
(D) residential
World Geography 3202 August 2009Page 15 of 30
PART II
SECTION A TOTAL VALUE: 8%
Instructions: Do ALL questions in PART II, Section A.
Value
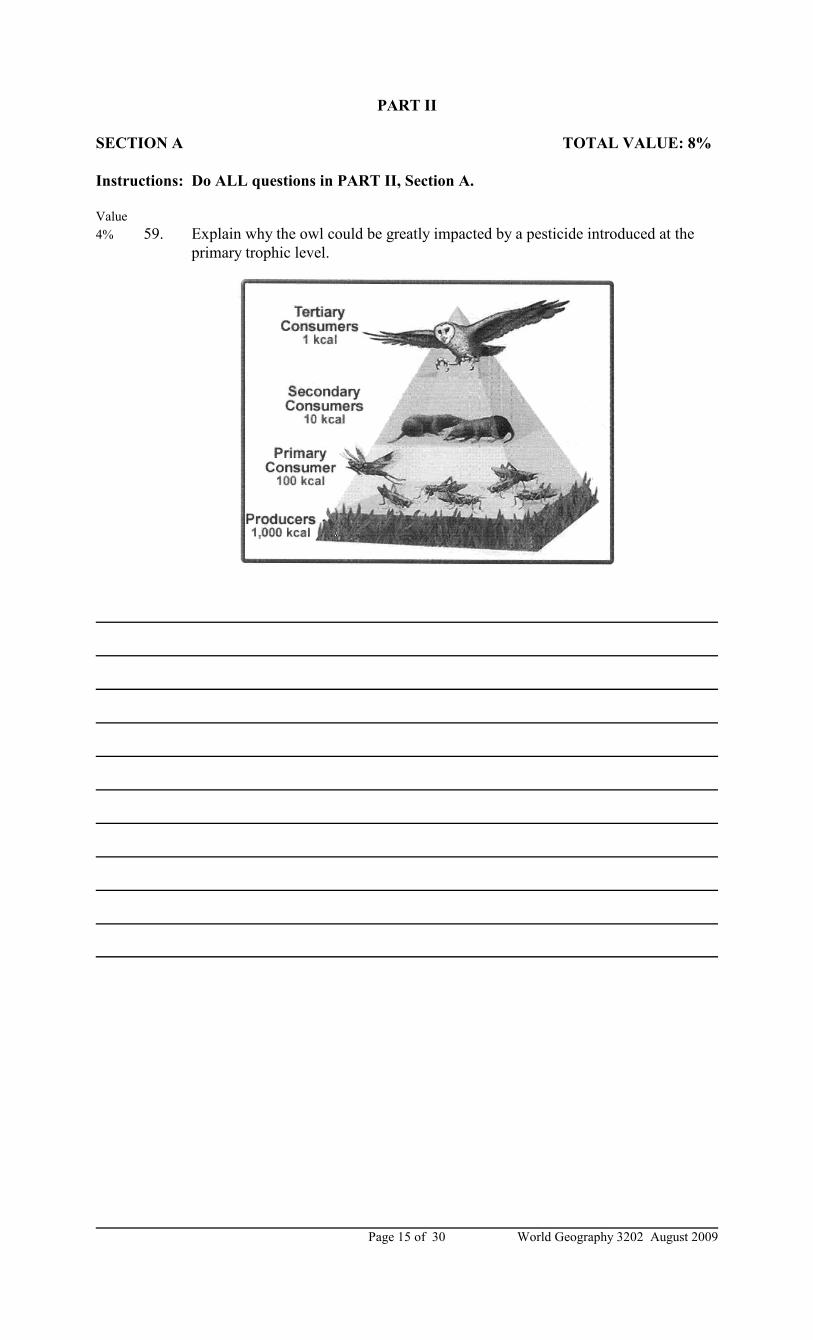
4% 59. Explain why the owl could be greatly impacted by a pesticide introduced at the
primary trophic level.
World Geography 3202 August 2009 Page 16 of 30
Value
4% 60. Many countries have rich offshore oil resources they have known about for many
years and have not developed. Explain two factors which could account for this
lack of development.
World Geography 3202 August 2009Page 17 of 30
SECTION B TOTAL VALUE: 4%
Do only ONE of the Units in Section B.
Either: Unit 6 - Population Distribution and Growth (# 61)
Or: Unit 7 - Settlement and Urbanization (# 62)
UNIT 6 - Population Distribution and Growth
Value
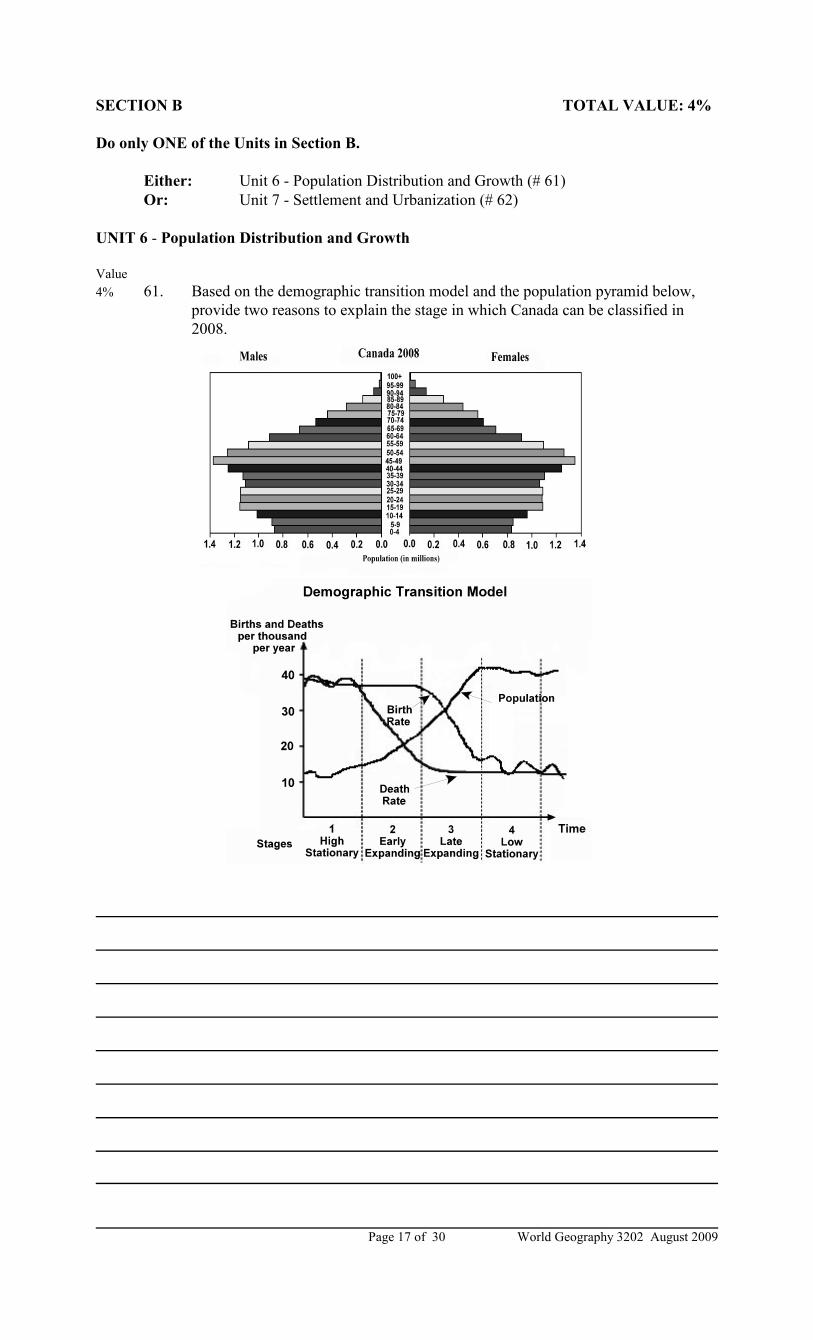
4% 61. Based on the demographic transition model and the population pyramid below,
provide two reasons to explain the stage in which Canada can be classified in
2008.
World Geography 3202 August 2009 Page 18 of 30
UNIT 7 - Settlement and Urbanization
Value
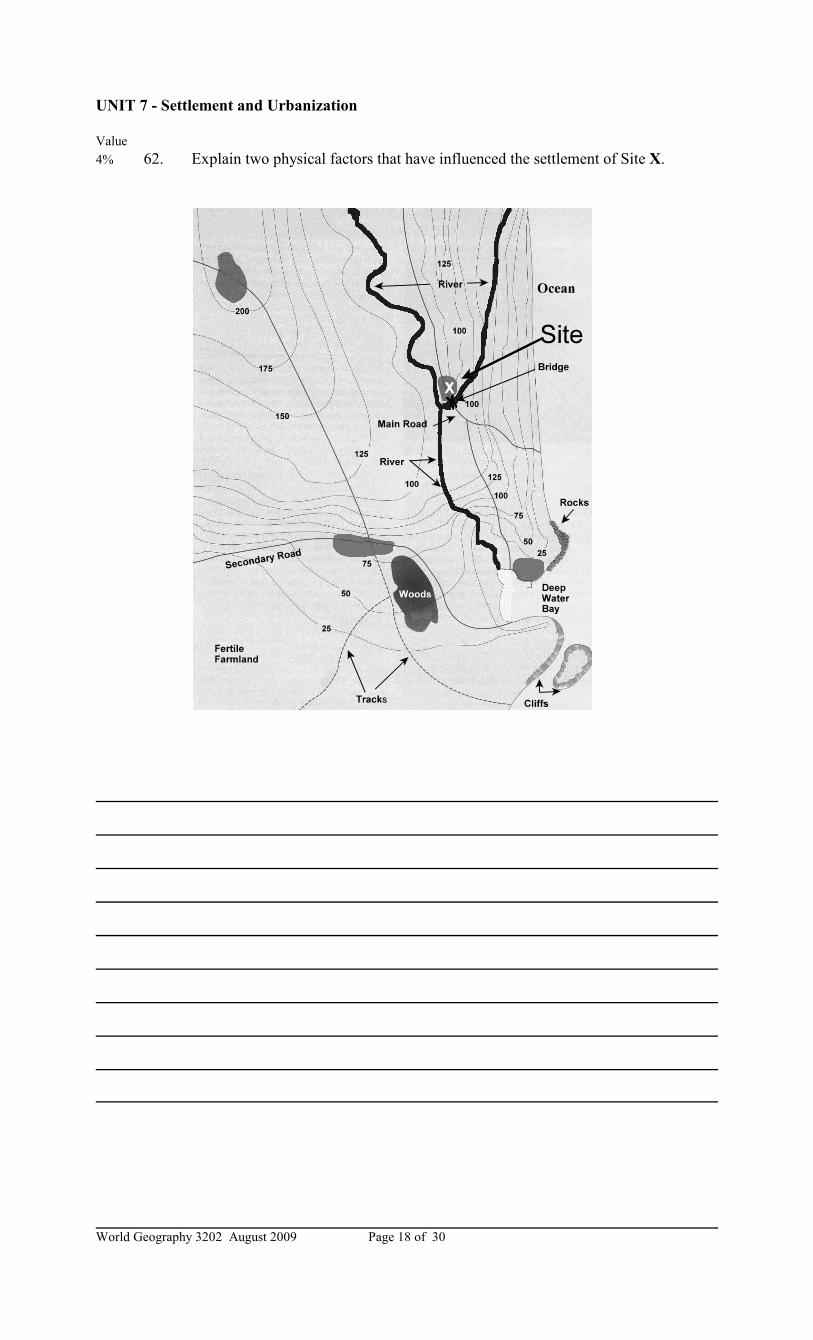
4% 62. Explain two physical factors that have influenced the settlement of Site X.
World Geography 3202 August 2009Page 19 of 30
Part II
Section C TOTAL VALUE: 28%
Instructions: Do ALL questions in PART II, Section C.
Units 1-5
CASE STUDY 1: Earthquake Destruction: A Closer Look
An earthquake is a phenomenon that results from and is powered by the sudden release of stored
energy in the crust that transmits seismic waves. At Earth’s surface, earthquakes may manifest
themselves by a shaking or displacement of the ground and sometimes results in large waves
known as tsunamis.
Most of the world’s earthquakes take place in the
40 000 km long, horseshoe-shaped zone called
the Pacific Ring of Fire, which for the most part
bounds the Pacific Plate. Massive earthquakes
tend to occur along other plate boundaries, too,
such as the Himalaya Mountains. Minor
earthquakes happen every day around the world,
but most of them go unnoticed and cause no
damage. Large earthquakes, however, can cause
serious destruction, loss of property, and loss of
life. Most large earthquakes are also
accompanied by other, smaller ones that can
occur either before or after the main shock.
The severity of an earthquake can be measured in
terms of intensity and magnitude. The analysis of
earthquake severity allows scientists to estimate
the locations and likelihood of future
earthquakes. This helps identify areas of greatest
hazard and ensures the safety of people and
infrastructure located in such areas.
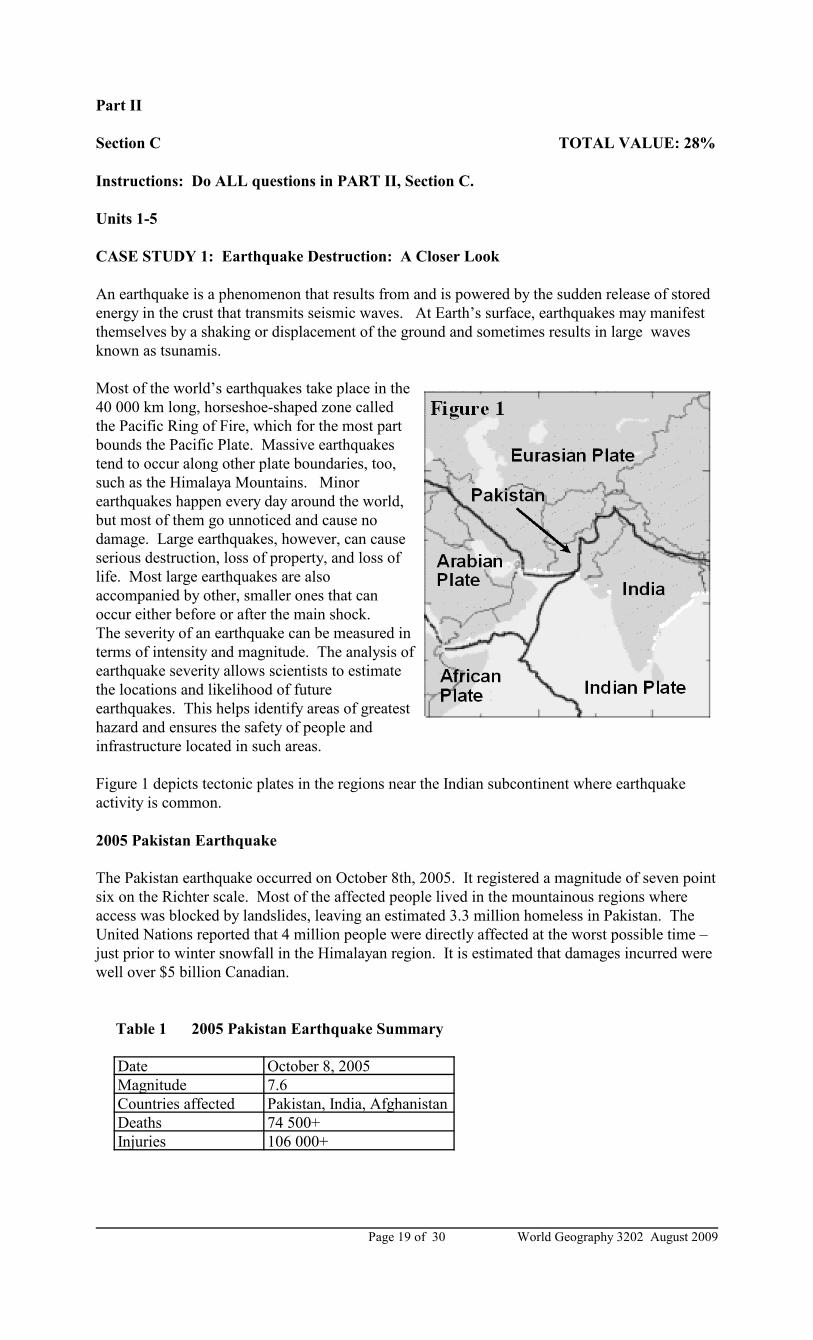
Figure 1 depicts tectonic plates in the regions near the Indian subcontinent where earthquake
activity is common.
2005 Pakistan Earthquake
The Pakistan earthquake occurred on October 8th, 2005. It registered a magnitude of seven point
six on the Richter scale. Most of the affected people lived in the mountainous regions where
access was blocked by landslides, leaving an estimated 3.3 million homeless in Pakistan. The
United Nations reported that 4 million people were directly affected at the worst possible time –
just prior to winter snowfall in the Himalayan region. It is estimated that damages incurred were
well over $5 billion Canadian.
Table 1 2005 Pakistan Earthquake Summary
Date October 8, 2005
Magnitude 7.6
Countries affected Pakistan, India, Afghanistan
Deaths 74 500+
Injuries 106 000+
World Geography 3202 August 2009 Page 20 of 30
“In those camps where 40 000 people live, they have not had a lot of attention since last
year, so the tents are run down and the facilities have not been maintained as well as they
could have been.”
Kate Simpson – International Aid Worker (Oxfam)
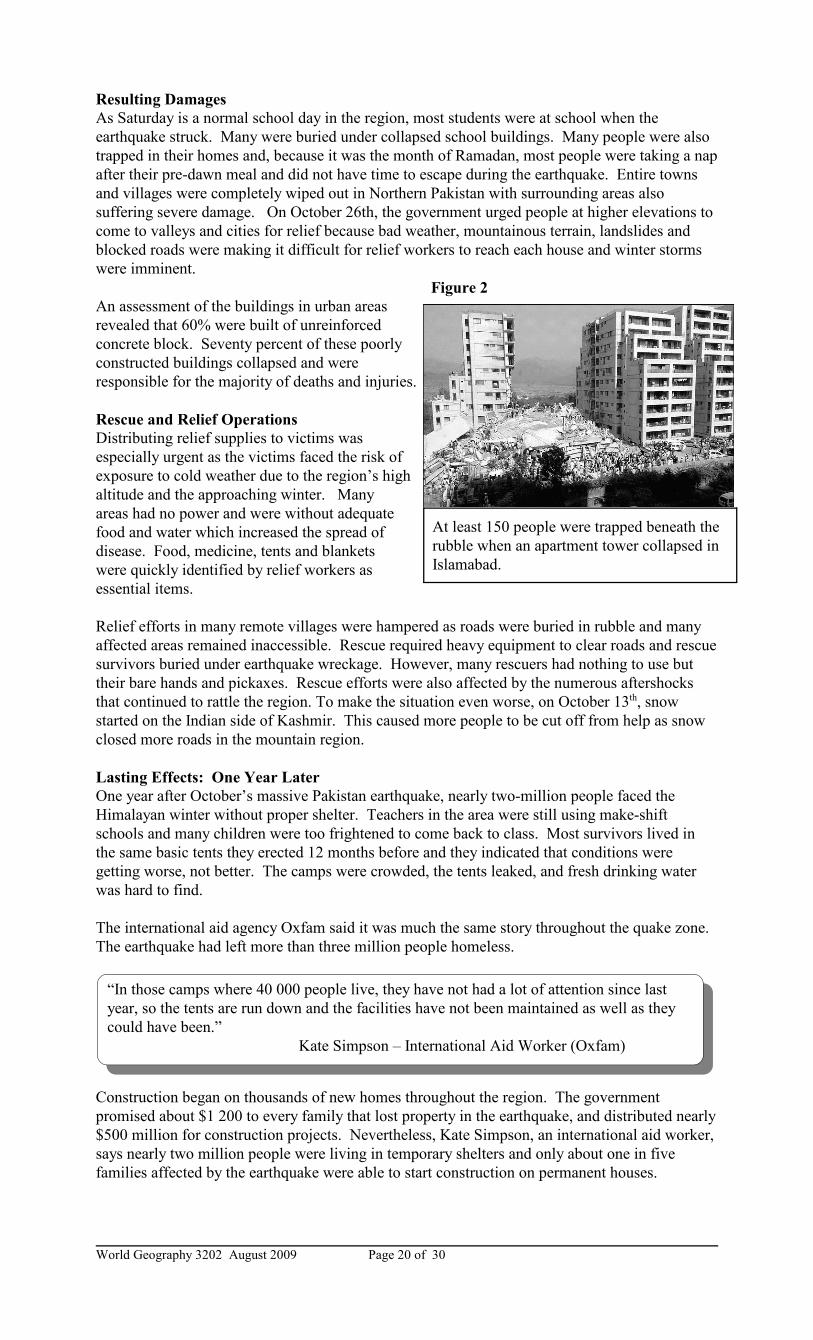
At least 150 people were trapped beneath the
rubble when an apartment tower collapsed in
Islamabad.
Resulting Damages
As Saturday is a normal school day in the region, most students were at school when the
earthquake struck. Many were buried under collapsed school buildings. Many people were also
trapped in their homes and, because it was the month of Ramadan, most people were taking a nap
after their pre-dawn meal and did not have time to escape during the earthquake. Entire towns
and villages were completely wiped out in Northern Pakistan with surrounding areas also
suffering severe damage. On October 26th, the government urged people at higher elevations to
come to valleys and cities for relief because bad weather, mountainous terrain, landslides and
blocked roads were making it difficult for relief workers to reach each house and winter storms
were imminent.
Figure 2
An assessment of the buildings in urban areas
revealed that 60% were built of unreinforced
concrete block. Seventy percent of these poorly
constructed buildings collapsed and were
responsible for the majority of deaths and injuries.
Rescue and Relief Operations
Distributing relief supplies to victims was
especially urgent as the victims faced the risk of
exposure to cold weather due to the region’s high
altitude and the approaching winter. Many
areas had no power and were without adequate
food and water which increased the spread of
disease. Food, medicine, tents and blankets
were quickly identified by relief workers as
essential items.
Relief efforts in many remote villages were hampered as roads were buried in rubble and many
affected areas remained inaccessible. Rescue required heavy equipment to clear roads and rescue
survivors buried under earthquake wreckage. However, many rescuers had nothing to use but
their bare hands and pickaxes. Rescue efforts were also affected by the numerous aftershocks
that continued to rattle the region. To make the situation even worse, on October 13th, snow
started on the Indian side of Kashmir. This caused more people to be cut off from help as snow
closed more roads in the mountain region.
Lasting Effects: One Year Later
One year after October’s massive Pakistan earthquake, nearly two-million people faced the
Himalayan winter without proper shelter. Teachers in the area were still using make-shift
schools and many children were too frightened to come back to class. Most survivors lived in
the same basic tents they erected 12 months before and they indicated that conditions were
getting worse, not better. The camps were crowded, the tents leaked, and fresh drinking water
was hard to find.
The international aid agency Oxfam said it was much the same story throughout the quake zone.
The earthquake had left more than three million people homeless.
Construction began on thousands of new homes throughout the region. The government
promised about $1 200 to every family that lost property in the earthquake, and distributed nearly
$500 million for construction projects. Nevertheless, Kate Simpson, an international aid worker,
says nearly two million people were living in temporary shelters and only about one in five
families affected by the earthquake were able to start construction on permanent houses.
World Geography 3202 August 2009Page 21 of 30
“Many of the quake survivors are also starved for information; how to apply for
compensation, where to pick up the money and, critically, how to properly rebuild their
homes. Because the risk of future earthquakes is a significant issue, when people are
rebuilding they need information on how to rebuild safely.”
Kate Simpson – International Aid Worker (Oxfam)
Value
4% 63. Using the case study and your geographical knowledge, provide two ways
residents of this region respond to earthquake destruction.
Value
4% 64. Pakistan’s and Kashmir’s low level of development has slowed recovery efforts
from the earthquake. Describe two social or economic factors that contributed to
this problem.
World Geography 3202 August 2009 Page 22 of 30
Value
6% 65. Using the case study and your geographical knowledge, propose three possible
solutions to decrease deaths, injuries and the amount of property damage that may
occur in future earthquakes.
World Geography 3202 August 2009Page 23 of 30
Units 1-5
CASE STUDY 2: The Power of Place
General Motors (GM) announced in January 1985 that it was designing an entirely new car called
the Saturn, and it would need a factory somewhere in the United States to build it. The
announcement touched off a fierce competition among states and localities to become home for
the plant. General Motors used geographic factors of site and situation to narrow the choice of
locations and to make the final selection.
General Motors felt that the most critical factor was the cost of delivering assembled vehicles
from the factory to the consumer. The company calculated the optimal location for the plant to
be within a 1.2 million square kilometre area with a radius of roughly 500 kilometres centered on
south central Ohio. Locations outside the circle were calculated to add between $400 and $500
per vehicle in freight charges, in part because truck drivers would be required to stop overnight
more often, as well as drive longer distances.
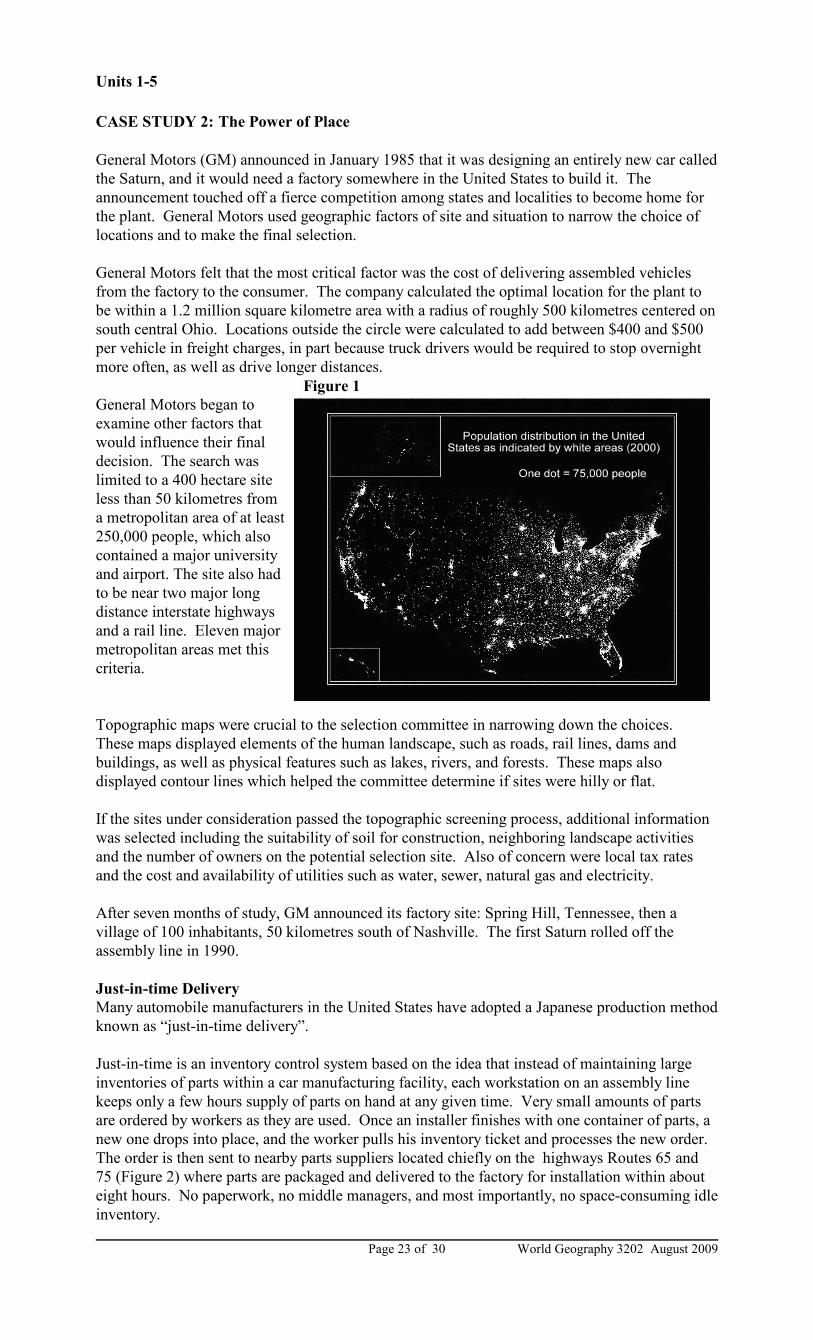
Figure 1
General Motors began to
examine other factors that
would influence their final
decision. The search was
limited to a 400 hectare site
less than 50 kilometres from
a metropolitan area of at least
250,000 people, which also
contained a major university
and airport. The site also had
to be near two major long
distance interstate highways
and a rail line. Eleven major
metropolitan areas met this
criteria.
Topographic maps were crucial to the selection committee in narrowing down the choices.
These maps displayed elements of the human landscape, such as roads, rail lines, dams and
buildings, as well as physical features such as lakes, rivers, and forests. These maps also
displayed contour lines which helped the committee determine if sites were hilly or flat.
If the sites under consideration passed the topographic screening process, additional information
was selected including the suitability of soil for construction, neighboring landscape activities
and the number of owners on the potential selection site. Also of concern were local tax rates
and the cost and availability of utilities such as water, sewer, natural gas and electricity.
After seven months of study, GM announced its factory site: Spring Hill, Tennessee, then a
village of 100 inhabitants, 50 kilometres south of Nashville. The first Saturn rolled off the
assembly line in 1990.
Just-in-time Delivery
Many automobile manufacturers in the United States have adopted a Japanese production method
known as “just-in-time delivery”.
Just-in-time is an inventory control system based on the idea that instead of maintaining large
inventories of parts within a car manufacturing facility, each workstation on an assembly line
keeps only a few hours supply of parts on hand at any given time. Very small amounts of parts
are ordered by workers as they are used. Once an installer finishes with one container of parts, a
new one drops into place, and the worker pulls his inventory ticket and processes the new order.
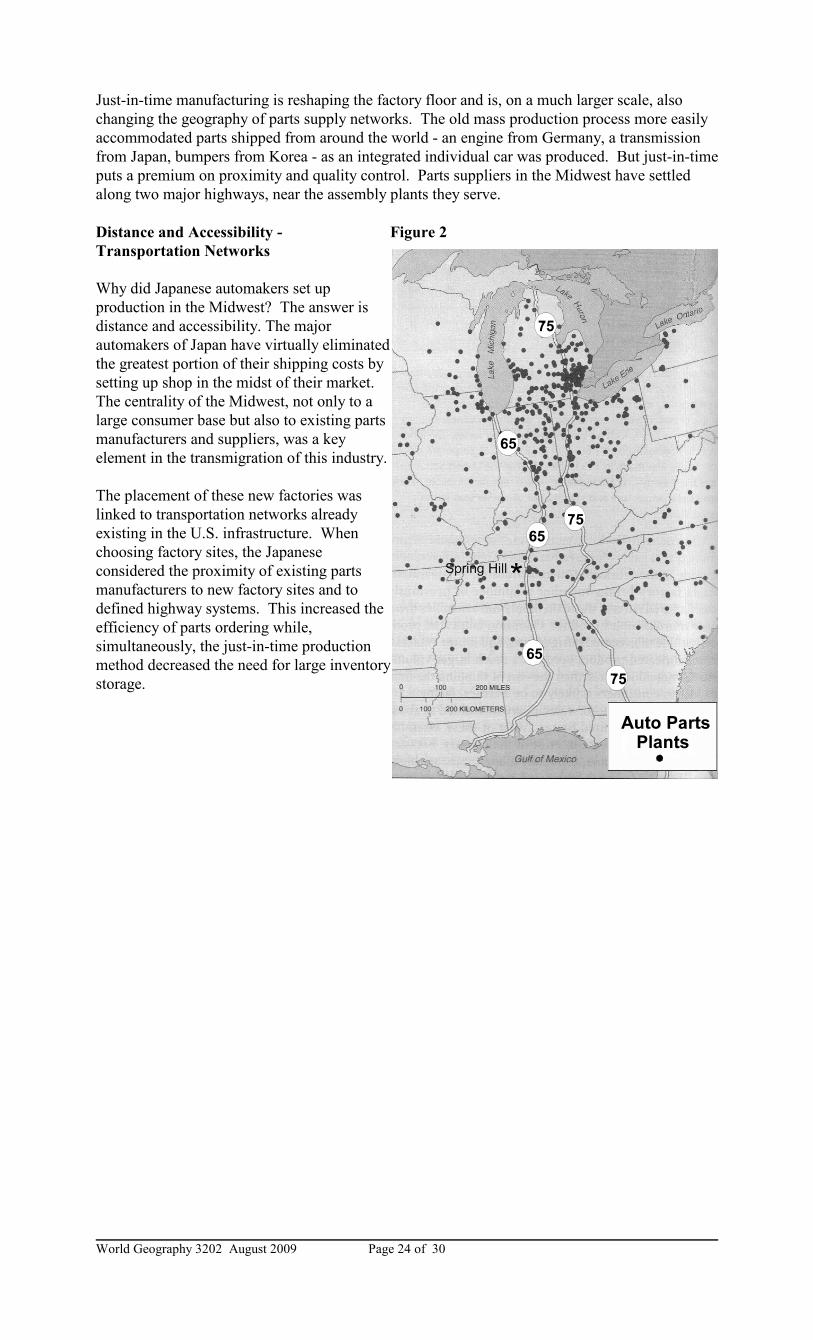
The order is then sent to nearby parts suppliers located chiefly on the highways Routes 65 and
75 (Figure 2) where parts are packaged and delivered to the factory for installation within about
eight hours. No paperwork, no middle managers, and most importantly, no space-consuming idle
inventory.
World Geography 3202 August 2009 Page 24 of 30
Just-in-time manufacturing is reshaping the factory floor and is, on a much larger scale, also
changing the geography of parts supply networks. The old mass production process more easily
accommodated parts shipped from around the world - an engine from Germany, a transmission
from Japan, bumpers from Korea - as an integrated individual car was produced. But just-in-time
puts a premium on proximity and quality control. Parts suppliers in the Midwest have settled
along two major highways, near the assembly plants they serve.
Distance and Accessibility - Figure 2
Transportation Networks
Why did Japanese automakers set up
production in the Midwest? The answer is
distance and accessibility. The major
automakers of Japan have virtually eliminated
the greatest portion of their shipping costs by
setting up shop in the midst of their market.
The centrality of the Midwest, not only to a
large consumer base but also to existing parts
manufacturers and suppliers, was a key
element in the transmigration of this industry.
The placement of these new factories was
linked to transportation networks already
existing in the U.S. infrastructure. When
choosing factory sites, the Japanese
considered the proximity of existing parts
manufacturers to new factory sites and to
defined highway systems. This increased the
efficiency of parts ordering while,
simultaneously, the just-in-time production
method decreased the need for large inventory
storage.
World Geography 3202 August 2009Page 25 of 30
Value
4% 66. Automobile manufacturers use site and situation factors in deciding the location
of their factories. Explain the concepts of site and situation and provide one
example of each from the case study.
Value
4% 67. Using evidence from the case study, explain whether GM’s Saturn factory is
either market or resource-oriented. Provide two pieces of evidence to support
your choice.
World Geography 3202 August 2009 Page 26 of 30
Value
6% 68. Anytime factories locate in an area, there is concern about pollution and the
environment. Industry has grown in the Spring Hill area in recent years creating
environmental concerns. Identify three environmental risks threatening the
Spring Hill area and propose a solution for each.
World Geography 3202 August 2009Page 27 of 30
SECTION D TOTAL VALUE: 10%
Do only ONE of the Units in Section D. Note: Both units use Case Study 3 below.
Either: Unit 6 - Population Distribution and Growth (#s 69 and 70)
Or: Unit 7 - Settlement and Urbanization (#s 71 and 72)
CASE STUDY 3: Population Change and Urbanization
Throughout most of human history the world’s population has lived a rural lifestyle, but its
population is quickly moving to cities. For example, in 1950, less than 30% of people lived in
urban areas. This figure grew to 47% by the year 2000 and is expected to exceed 60% by 2025.
Presently, developed countries have a higher percentage of urban residents than developing
countries; nevertheless, it is expected that most of the future urban growth will take place in
poorer countries. The rate of urbanization in both types of countries is significantly impacting
the land.
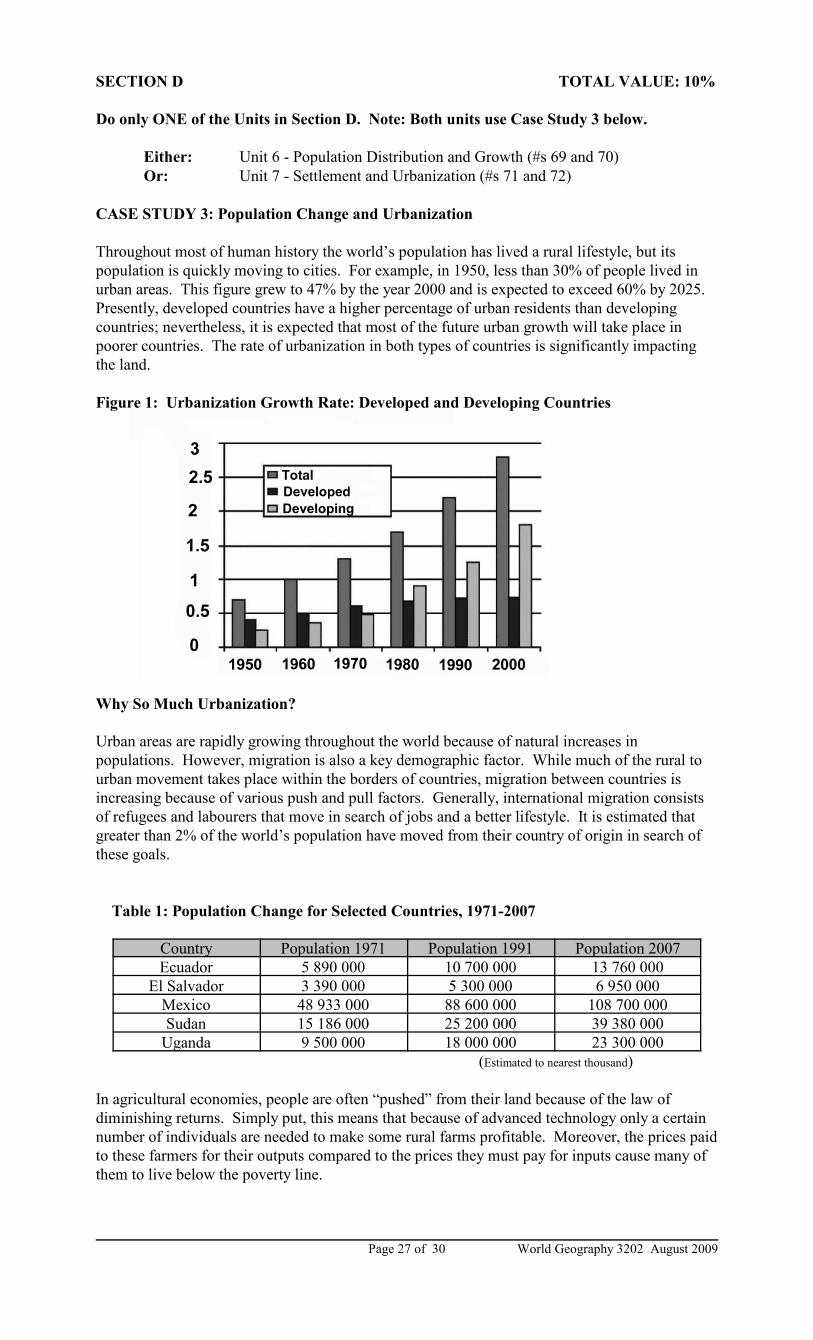
Figure 1: Urbanization Growth Rate: Developed and Developing Countries
Why So Much Urbanization?
Urban areas are rapidly growing throughout the world because of natural increases in
populations. However, migration is also a key demographic factor. While much of the rural to
urban movement takes place within the borders of countries, migration between countries is
increasing because of various push and pull factors. Generally, international migration consists
of refugees and labourers that move in search of jobs and a better lifestyle. It is estimated that
greater than 2% of the world’s population have moved from their country of origin in search of
these goals.
Table 1: Population Change for Selected Countries, 1971-2007
Country Population 1971 Population 1991 Population 2007
Ecuador 5 890 000 10 700 000 13 760 000
El Salvador 3 390 000 5 300 000 6 950 000
Mexico 48 933 000 88 600 000 108 700 000
Sudan 15 186 000 25 200 000 39 380 000
Uganda 9 500 000 18 000 000 23 300 000
(Estimated to nearest thousand)
In agricultural economies, people are often “pushed” from their land because of the law of
diminishing returns. Simply put, this means that because of advanced technology only a certain
number of individuals are needed to make some rural farms profitable. Moreover, the prices paid
to these farmers for their outputs compared to the prices they must pay for inputs cause many of
them to live below the poverty line.
World Geography 3202 August 2009 Page 28 of 30
In addition to the push factors which drive many from rural lands, strong pull factors exist which
attract these individuals to urban areas. The strongest factor is “agglomerating economies.” In
summary, geographers use this term to refer to the savings one can get by serving the needs of a
large and growing market place in a concentrated urban area. As a result, distance is reduced
between producer and consumer, thereby favouring many potential labourers.
Population Growth and Urbanization
An interesting aspect of urbanization started in North America following the Second World War.
Suburban living symbolized the American dream of returning to nature in search of a better
quality of life. In Europe, as well, urbanization continued. It is estimated, for example, that
between 1969 and 1999 the urbanized land areas of France increased five times. Opponents of
such rapid growth are concerned with increased traffic, pollution of air and water, flooding and
loss of agricultural land, parks and open space. They also believe the strain placed on
transportation and water and sewer infrastructures are issues which need to be addressed.
The pattern of urban growth in many developing countries, as illustrated in Figure 1, is also
requiring the usage of more land. In many of the countries of East Asia, for example, improved
communication and transportation linkages make outlying areas more accessible to the migrant
workforce. As a result, some of these areas are transformed from agriculture to manufacturing
economies. Conversely while some areas are beginning to prosper, in other large cities
throughout the world such as Mexico City, nearly 40% of the city-dwellers face issues related to
poverty and destruction of the environment.
“As roads stretch cities to new limits, paving over farms and forests, polluting air and water,
and wasting motor fuel, {urbanization} is beginning to seriously endanger the planet. What
we need now is for some prominent national capitals to demonstrate what a shift toward
more compact, energy efficient, and people - friendly urban design can do.”
Molly O’ Meara Sheehan, Author, “What Will It Take to Halt Sprawl?”
“... we now need to build urban areas yet again that are at least equivalent in size to the
cities we have already built, we need to do it better, and we need to do it in a very short
time.”
S. Angel, Dynamics of Global Expansion
World Geography 3202 August 2009Page 29 of 30
SECTION D TOTAL VALUE: 10%
Do only ONE of the Units in Section D.
Either: Unit 6 - Population Distribution and Growth (#s 69 and 70)
Or: Unit 7 - Settlement and Urbanization (#s 71 and 72)
Unit 6 - Population Distribution and Growth
Value
4% 69. Using examples from the case study, describe two push and/or pull factors that
may influence a person’s decision to migrate from rural to urban areas.
Value
6% 70. Table 1 illustrates the trends of population change for selected developing
countries. Based on the information from the case study and your geographic
knowledge, should these countries control their population growth rates? Using
three reasons, explain why or why not.
World Geography 3202 August 2009 Page 30 of 30
Unit 7 - Settlement and Urbanization
Value
4% 71. Using two examples from the case study, explain how situation influenced the
continuing trend of urbanization.
Value
6% 72. Using problems identified in the case study, suggest three strategies that could be
used to improve the quality of life in cities.