Embed Size (px)
Citation preview
Part I: Introduction to Nanoparticle Characterization with AFM
Jennifer Scalf, Paul West
Pacific Nanotechnology, Inc.3350 Scott Blvd., Suite 29
Santa Clara, CA 95054www.nanoparticles.pacificnanotech.com
Revision.1/16/06.A
Part I: Introduction to Nanoparticle Characterization with AFM 1
Revision.1/16/06.A
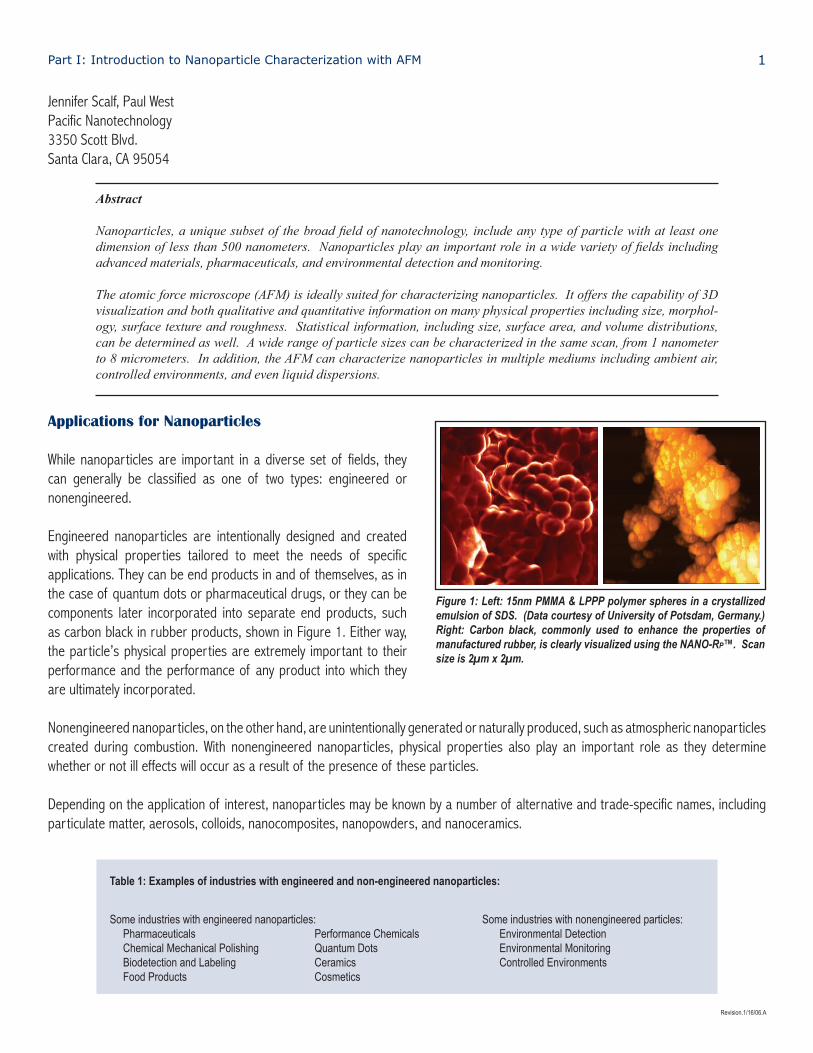
Applications for Nanoparticles While nanoparticles are important in a diverse set of fields, they can generally be classified as one of two types: engineered or nonengineered. Engineered nanoparticles are intentionally designed and created with physical properties tailored to meet the needs of specific applications. They can be end products in and of themselves, as in the case of quantum dots or pharmaceutical drugs, or they can be components later incorporated into separate end products, such as carbon black in rubber products, shown in Figure 1. Either way, the particle’s physical properties are extremely important to their performance and the performance of any product into which they are ultimately incorporated.
Nonengineered nanoparticles, on the other hand, are unintentionally generated or naturally produced, such as atmospheric nanoparticles created during combustion. With nonengineered nanoparticles, physical properties also play an important role as they determine whether or not ill effects will occur as a result of the presence of these particles.
Depending on the application of interest, nanoparticles may be known by a number of alternative and trade-specific names, including particulate matter, aerosols, colloids, nanocomposites, nanopowders, and nanoceramics.
Figure 1: Left: 15nm PMMA & LPPP polymer spheres in a crystallized emulsion of SDS. (Data courtesy of University of Potsdam, Germany.) Right: Carbon black, commonly used to enhance the properties of manufactured rubber, is clearly visualized using the NANO-RP™. Scan size is 2µm x 2µm.
Abstract
Nanoparticles, a unique subset of the broad field of nanotechnology, include any type of particle with at least one dimension of less than 500 nanometers. Nanoparticles play an important role in a wide variety of fields including advanced materials, pharmaceuticals, and environmental detection and monitoring. The atomic force microscope (AFM) is ideally suited for characterizing nanoparticles. It offers the capability of 3D visualization and both qualitative and quantitative information on many physical properties including size, morphol-ogy, surface texture and roughness. Statistical information, including size, surface area, and volume distributions, can be determined as well. A wide range of particle sizes can be characterized in the same scan, from 1 nanometer to 8 micrometers. In addition, the AFM can characterize nanoparticles in multiple mediums including ambient air, controlled environments, and even liquid dispersions.
Jennifer Scalf, Paul WestPacific Nanotechnology3350 Scott Blvd.Santa Clara, CA 95054
Table 1: Examples of industries with engineered and non-engineered nanoparticles:
Some industries with engineered nanoparticles: Some industries with nonengineered particles: Pharmaceuticals Performance Chemicals Environmental Detection Chemical Mechanical Polishing Quantum Dots Environmental Monitoring Biodetection and Labeling Ceramics Controlled Environments Food Products Cosmetics
Part I: Introduction to Nanoparticle Characterization with AFM 2
Revision.1/16/06.A
AFM Capabilities in Nanoparticle Characterization Qualitative Analysis Using the AFM, individual particles and groups of particles can be resolved. Microscope images are essential in research and development projects and can be critical when troubleshooting quality control issues.
The AFM offers visualization in three dimensions. Resolution in the vertical, or Z, axis is limited by the vibration environment of the instrument: whereas resolution in the horizontal, or X-Y, axis is limited by the diameter of tip utilized for scanning.
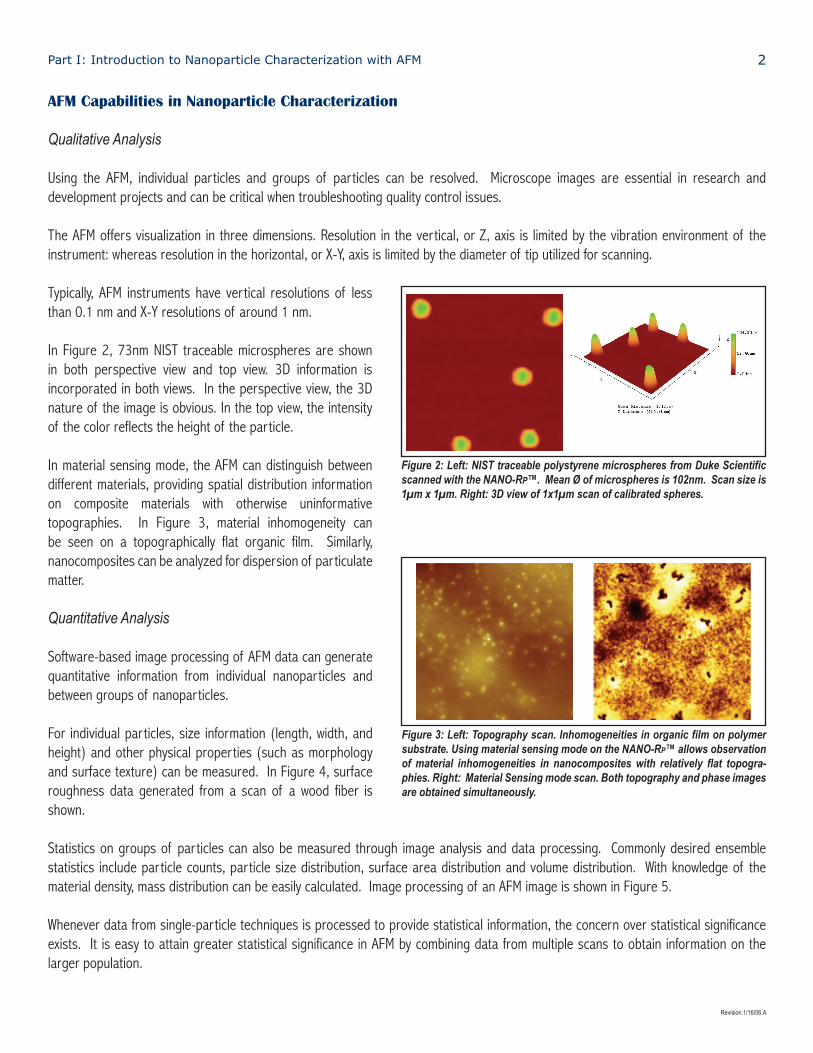
Typically, AFM instruments have vertical resolutions of less than 0.1 nm and X-Y resolutions of around 1 nm. In Figure 2, 73nm NIST traceable microspheres are shown in both perspective view and top view. 3D information is incorporated in both views. In the perspective view, the 3D nature of the image is obvious. In the top view, the intensity of the color reflects the height of the particle.
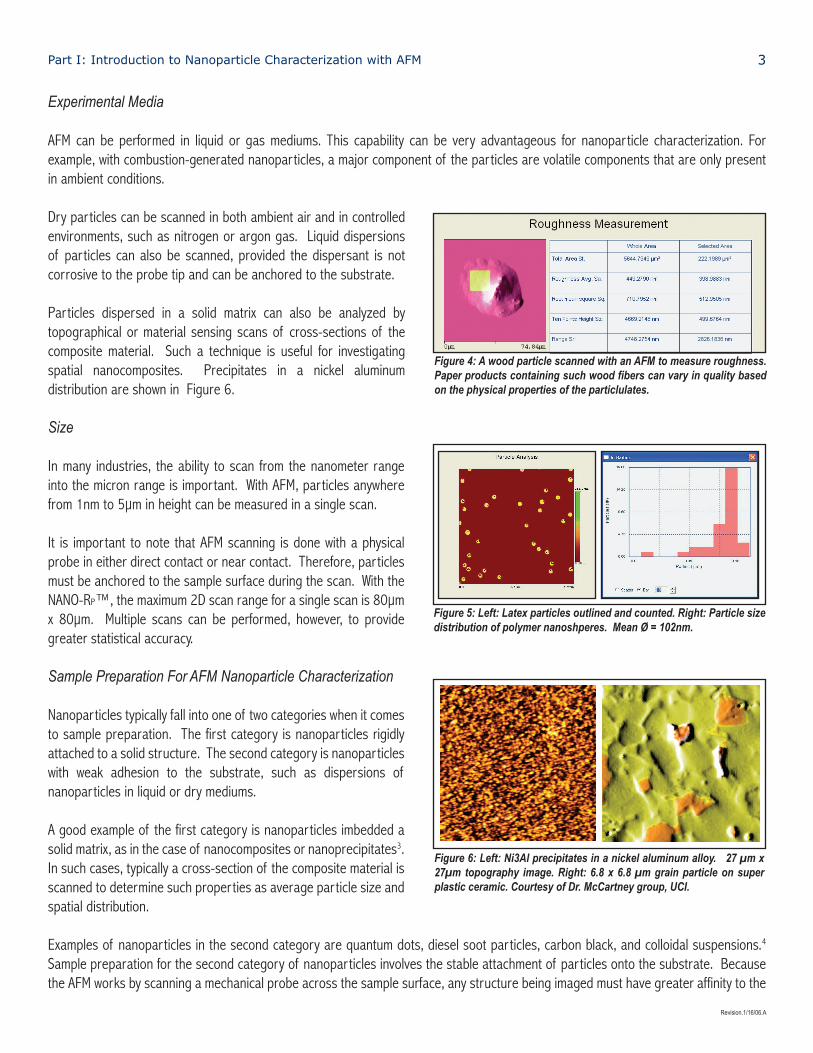
In material sensing mode, the AFM can distinguish between different materials, providing spatial distribution information on composite materials with otherwise uninformative topographies. In Figure 3, material inhomogeneity can be seen on a topographically flat organic film. Similarly, nanocomposites can be analyzed for dispersion of particulate matter.
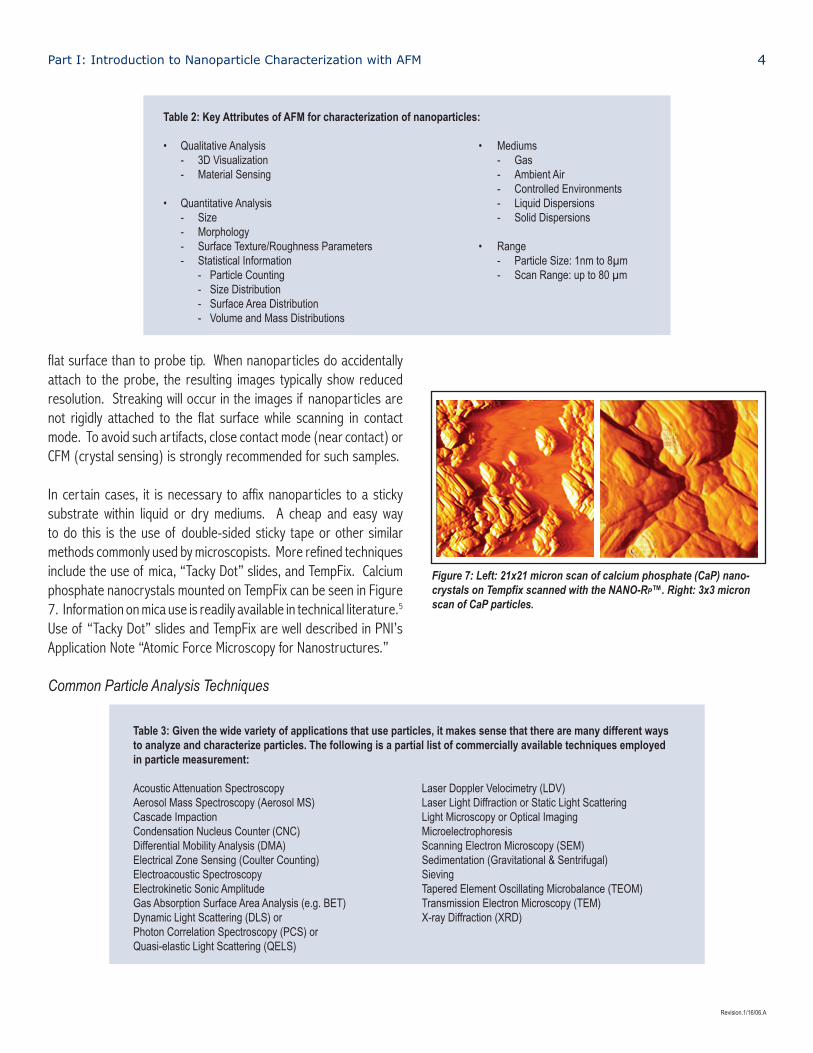
Quantitative Analysis Software-based image processing of AFM data can generate quantitative information from individual nanoparticles and between groups of nanoparticles. For individual particles, size information (length, width, and height) and other physical properties (such as morphology and surface texture) can be measured. In Figure 4, surface roughness data generated from a scan of a wood fiber is shown.
Statistics on groups of particles can also be measured through image analysis and data processing. Commonly desired ensemble statistics include particle counts, particle size distribution, surface area distribution and volume distribution. With knowledge of the material density, mass distribution can be easily calculated. Image processing of an AFM image is shown in Figure 5.
Whenever data from single-particle techniques is processed to provide statistical information, the concern over statistical significance exists. It is easy to attain greater statistical significance in AFM by combining data from multiple scans to obtain information on the larger population.
Figure 2: Left: NIST traceable polystyrene microspheres from Duke Scientific scanned with the NANO-RP™. Mean Ø of microspheres is 102nm. Scan size is 1µm x 1µm. Right: 3D view of 1x1µm scan of calibrated spheres.
Figure 3: Left: Topography scan. Inhomogeneities in organic film on polymer substrate. Using material sensing mode on the NANO-RP™ allows observation of material inhomogeneities in nanocomposites with relatively flat topogra-phies. Right: Material Sensing mode scan. Both topography and phase images are obtained simultaneously.
Part I: Introduction to Nanoparticle Characterization with AFM 3
Revision.1/16/06.A
Experimental Media
AFM can be performed in liquid or gas mediums. This capability can be very advantageous for nanoparticle characterization. For example, with combustion-generated nanoparticles, a major component of the particles are volatile components that are only present in ambient conditions.
Dry particles can be scanned in both ambient air and in controlled environments, such as nitrogen or argon gas. Liquid dispersions of particles can also be scanned, provided the dispersant is not corrosive to the probe tip and can be anchored to the substrate.
Particles dispersed in a solid matrix can also be analyzed by topographical or material sensing scans of cross-sections of the composite material. Such a technique is useful for investigating spatial nanocomposites. Precipitates in a nickel aluminum distribution are shown in Figure 6. Size In many industries, the ability to scan from the nanometer range into the micron range is important. With AFM, particles anywhere from 1nm to 5µm in height can be measured in a single scan. It is important to note that AFM scanning is done with a physical probe in either direct contact or near contact. Therefore, particles must be anchored to the sample surface during the scan. With the NANO-RP™, the maximum 2D scan range for a single scan is 80µm x 80µm. Multiple scans can be performed, however, to provide greater statistical accuracy.
Sample Preparation For AFM Nanoparticle Characterization
Nanoparticles typically fall into one of two categories when it comes to sample preparation. The first category is nanoparticles rigidly attached to a solid structure. The second category is nanoparticles with weak adhesion to the substrate, such as dispersions of nanoparticles in liquid or dry mediums. A good example of the first category is nanoparticles imbedded a solid matrix, as in the case of nanocomposites or nanoprecipitates3. In such cases, typically a cross-section of the composite material is scanned to determine such properties as average particle size and spatial distribution.
Examples of nanoparticles in the second category are quantum dots, diesel soot particles, carbon black, and colloidal suspensions.4 Sample preparation for the second category of nanoparticles involves the stable attachment of particles onto the substrate. Because the AFM works by scanning a mechanical probe across the sample surface, any structure being imaged must have greater affinity to the
Figure 4: A wood particle scanned with an AFM to measure roughness. Paper products containing such wood fibers can vary in quality based on the physical properties of the particlulates.
Figure 5: Left: Latex particles outlined and counted. Right: Particle size distribution of polymer nanoshperes. Mean Ø = 102nm.
Figure 6: Left: Ni3Al precipitates in a nickel aluminum alloy. 27 µm x 27µm topography image. Right: 6.8 x 6.8 µm grain particle on super plastic ceramic. Courtesy of Dr. McCartney group, UCI.
Part I: Introduction to Nanoparticle Characterization with AFM 4
Revision.1/16/06.A
flat surface than to probe tip. When nanoparticles do accidentally attach to the probe, the resulting images typically show reduced resolution. Streaking will occur in the images if nanoparticles are not rigidly attached to the flat surface while scanning in contact mode. To avoid such artifacts, close contact mode (near contact) or CFM (crystal sensing) is strongly recommended for such samples. In certain cases, it is necessary to affix nanoparticles to a sticky substrate within liquid or dry mediums. A cheap and easy way to do this is the use of double-sided sticky tape or other similar methods commonly used by microscopists. More refined techniques include the use of mica, “Tacky Dot” slides, and TempFix. Calcium phosphate nanocrystals mounted on TempFix can be seen in Figure 7. Information on mica use is readily available in technical literature.5 Use of “Tacky Dot” slides and TempFix are well described in PNI’s Application Note “Atomic Force Microscopy for Nanostructures.”
Common Particle Analysis Techniques
Figure 7: Left: 21x21 micron scan of calcium phosphate (CaP) nano-crystals on Tempfix scanned with the NANO-RP™. Right: 3x3 micron scan of CaP particles.
Table 2: Key Attributes of AFM for characterization of nanoparticles:
• Qualitative Analysis • Mediums - 3D Visualization - Gas - Material Sensing - Ambient Air - Controlled Environments • Quantitative Analysis - Liquid Dispersions - Size - Solid Dispersions - Morphology - Surface Texture/Roughness Parameters • Range - Statistical Information - Particle Size: 1nm to 8µm - Particle Counting - Scan Range: up to 80 µm - Size Distribution - Surface Area Distribution - Volume and Mass Distributions
Table 3: Given the wide variety of applications that use particles, it makes sense that there are many different ways to analyze and characterize particles. The following is a partial list of commercially available techniques employed in particle measurement:
Acoustic Attenuation Spectroscopy Laser Doppler Velocimetry (LDV) Aerosol Mass Spectroscopy (Aerosol MS) Laser Light Diffraction or Static Light Scattering Cascade Impaction Light Microscopy or Optical Imaging Condensation Nucleus Counter (CNC) Microelectrophoresis Differential Mobility Analysis (DMA) Scanning Electron Microscopy (SEM) Electrical Zone Sensing (Coulter Counting) Sedimentation (Gravitational & Sentrifugal) Electroacoustic Spectroscopy Sieving Electrokinetic Sonic Amplitude Tapered Element Oscillating Microbalance (TEOM) Gas Absorption Surface Area Analysis (e.g. BET) Transmission Electron Microscopy (TEM) Dynamic Light Scattering (DLS) or X-ray Diffraction (XRD) Photon Correlation Spectroscopy (PCS) or Quasi-elastic Light Scattering (QELS)
Part I: Introduction to Nanoparticle Characterization with AFM 5
Revision.1/16/06.A
Ensemble vs. Single-Particle Techniques Particle analysis techniques can generally be classified as ensemble or single-particle techniques. With ensemble techniques, individual particles cannot be isolated. Instead, ensemble techniques measure the response from statistically significant numbers of particles simultaneously. Laser light diffraction is a commonly employed ensemble technique. In contrast with ensemble techniques, single-particle techniques isolate and identify data from individual particles. Statistical information from groups of particles can be obtained by processing the combined measurements of many different individual particles. A common example of a single-particle technique is optical imaging combined with image processing to measure and analyze particles. In general, morphological information, such as shape and aspect ratio, as well as surface information, such as texture and roughness parameters, cannot be obtained using ensemble techniques. Only single-particle techniques, which look at individual particles, can supply such information. Physical parameters for each particle within a set of particles are recorded to generate a statistical distribution for the entire set of particles.
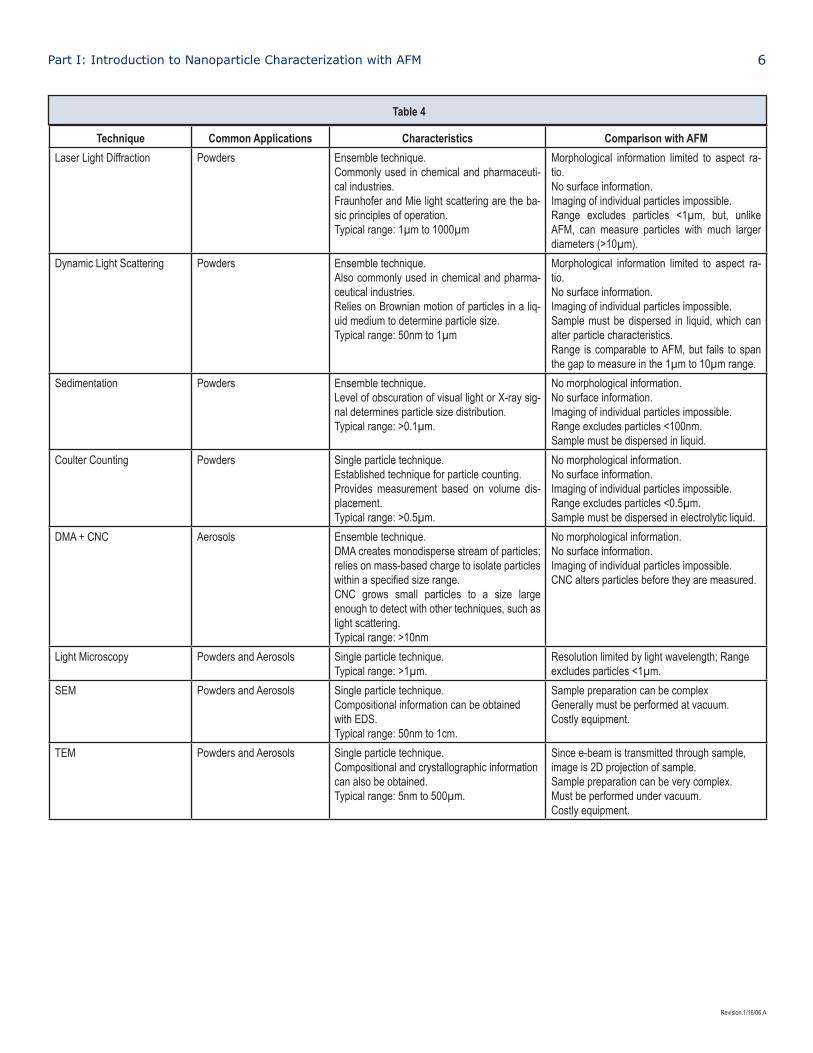
Which Technique is “The Best”? Obviously, there is not one single “best technique” for all situations. Determining the best technique for a particular situation requires knowledge of the particles being analyzed, the ultimate application of the particles, and the limitations of techniques being considered. Depending on the application of interest, a number of techniques can be used to analyze and characterize nanoparticles. In industries where aerosols play an important role, tools such as the Differential Mobility Analyzer (DMA) are commonplace. With fine powders, light scattering techniques are common. Table 4 describes some common particle analysis techniques and their benefits and drawbacks in comparison with the AFM.
Part I: Introduction to Nanoparticle Characterization with AFM 6
Revision.1/16/06.A
Technique Common Applications Characteristics Comparison with AFM
Laser Light Diffraction Powders Ensemble technique.Commonly used in chemical and pharmaceuti-cal industries. Fraunhofer and Mie light scattering are the ba-sic principles of operation.Typical range: 1µm to 1000µm
Morphological information limited to aspect ra-tio.No surface information.Imaging of individual particles impossible. Range excludes particles <1µm, but, unlike AFM, can measure particles with much larger diameters (>10µm).
Dynamic Light Scattering Powders Ensemble technique.Also commonly used in chemical and pharma-ceutical industries.Relies on Brownian motion of particles in a liq-uid medium to determine particle size. Typical range: 50nm to 1µm
Morphological information limited to aspect ra-tio. No surface information.Imaging of individual particles impossible. Sample must be dispersed in liquid, which can alter particle characteristics. Range is comparable to AFM, but fails to span the gap to measure in the 1µm to 10µm range.
Sedimentation Powders Ensemble technique.Level of obscuration of visual light or X-ray sig-nal determines particle size distribution. Typical range: >0.1µm.
No morphological information. No surface information.Imaging of individual particles impossible. Range excludes particles <100nm. Sample must be dispersed in liquid.
Coulter Counting Powders Single particle technique. Established technique for particle counting. Provides measurement based on volume dis-placement. Typical range: >0.5µm.
No morphological information. No surface information. Imaging of individual particles impossible. Range excludes particles <0.5µm. Sample must be dispersed in electrolytic liquid.
DMA + CNC Aerosols Ensemble technique. DMA creates monodisperse stream of particles; relies on mass-based charge to isolate particles within a specified size range. CNC grows small particles to a size large enough to detect with other techniques, such as light scattering. Typical range: >10nm
No morphological information. No surface information. Imaging of individual particles impossible. CNC alters particles before they are measured.
Light Microscopy Powders and Aerosols Single particle technique. Typical range: >1µm.
Resolution limited by light wavelength; Range excludes particles <1µm.
SEM Powders and Aerosols Single particle technique. Compositional information can be obtained with EDS. Typical range: 50nm to 1cm.
Sample preparation can be complex Generally must be performed at vacuum. Costly equipment.
TEM Powders and Aerosols Single particle technique. Compositional and crystallographic information can also be obtained. Typical range: 5nm to 500µm.
Since e-beam is transmitted through sample, image is 2D projection of sample. Sample preparation can be very complex. Must be performed under vacuum. Costly equipment.
Table 4
Part I: Introduction to Nanoparticle Characterization with AFM 7
Revision.1/16/06.A
Comparison of AFM with SEM / TEM
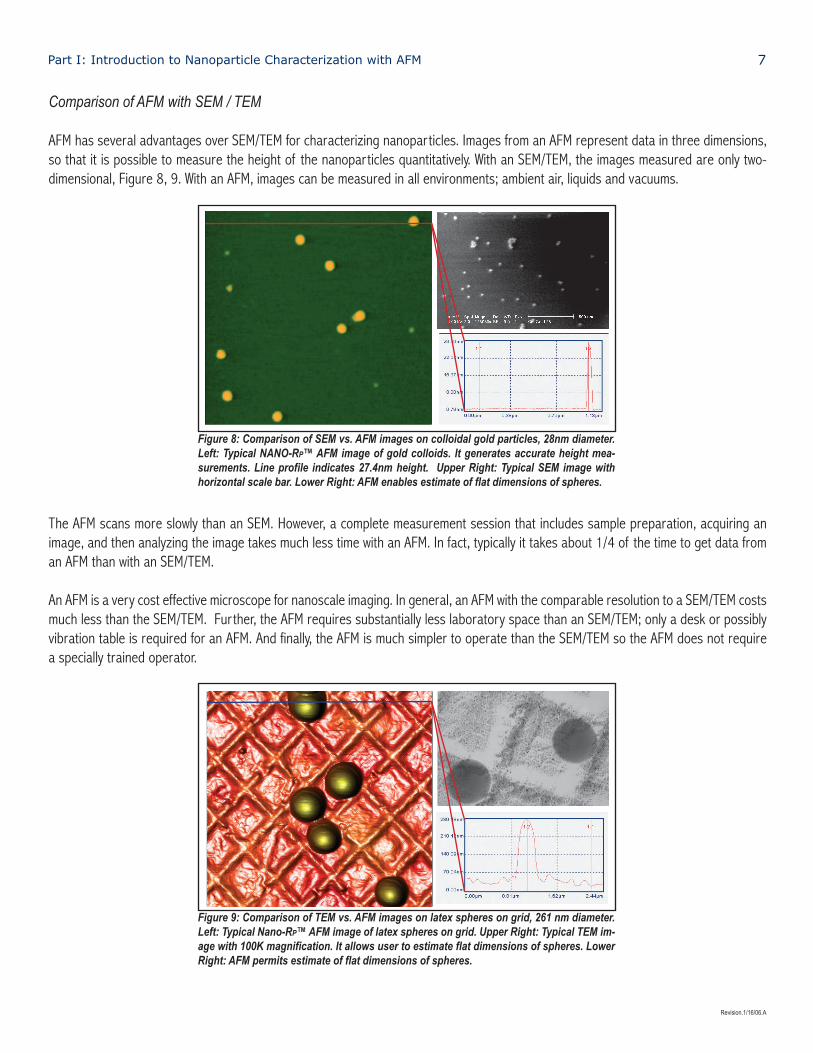
AFM has several advantages over SEM/TEM for characterizing nanoparticles. Images from an AFM represent data in three dimensions, so that it is possible to measure the height of the nanoparticles quantitatively. With an SEM/TEM, the images measured are only two- dimensional, Figure 8, 9. With an AFM, images can be measured in all environments; ambient air, liquids and vacuums.
The AFM scans more slowly than an SEM. However, a complete measurement session that includes sample preparation, acquiring an image, and then analyzing the image takes much less time with an AFM. In fact, typically it takes about 1/4 of the time to get data from an AFM than with an SEM/TEM.
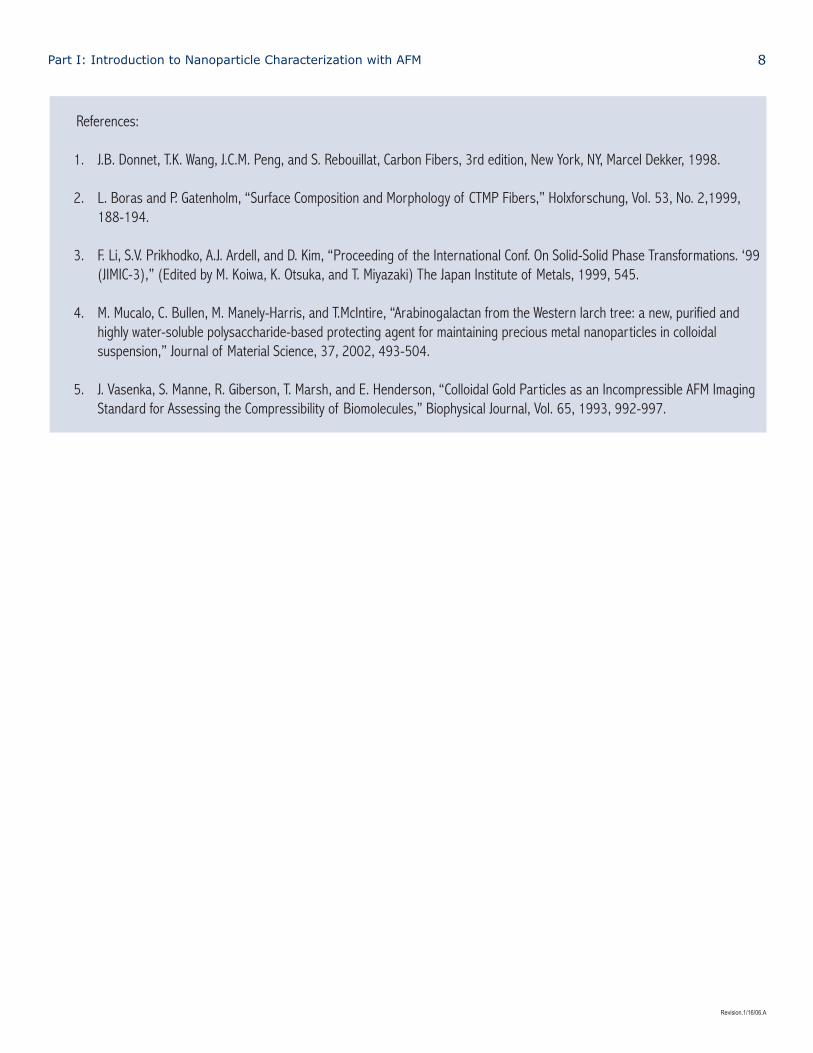
An AFM is a very cost effective microscope for nanoscale imaging. In general, an AFM with the comparable resolution to a SEM/TEM costs much less than the SEM/TEM. Further, the AFM requires substantially less laboratory space than an SEM/TEM; only a desk or possibly vibration table is required for an AFM. And finally, the AFM is much simpler to operate than the SEM/TEM so the AFM does not require a specially trained operator.
Figure 8: Comparison of SEM vs. AFM images on colloidal gold particles, 28nm diameter. Left: Typical NANO-RP™ AFM image of gold colloids. It generates accurate height mea-surements. Line profile indicates 27.4nm height. Upper Right: Typical SEM image with horizontal scale bar. Lower Right: AFM enables estimate of flat dimensions of spheres.
Figure 9: Comparison of TEM vs. AFM images on latex spheres on grid, 261 nm diameter. Left: Typical Nano-RP™ AFM image of latex spheres on grid. Upper Right: Typical TEM im-age with 100K magnification. It allows user to estimate flat dimensions of spheres. Lower Right: AFM permits estimate of flat dimensions of spheres.
Part I: Introduction to Nanoparticle Characterization with AFM 8
Revision.1/16/06.A
References: 1. J.B. Donnet, T.K. Wang, J.C.M. Peng, and S. Rebouillat, Carbon Fibers, 3rd edition, New York, NY, Marcel Dekker, 1998. 2. L. Boras and P. Gatenholm, “Surface Composition and Morphology of CTMP Fibers,” Holxforschung, Vol. 53, No. 2,1999, 188-194. 3. F. Li, S.V. Prikhodko, A.J. Ardell, and D. Kim, “Proceeding of the International Conf. On Solid-Solid Phase Transformations. ‘99 (JIMIC-3),” (Edited by M. Koiwa, K. Otsuka, and T. Miyazaki) The Japan Institute of Metals, 1999, 545. 4. M. Mucalo, C. Bullen, M. Manely-Harris, and T.McIntire, “Arabinogalactan from the Western larch tree: a new, purified and highly water-soluble polysaccharide-based protecting agent for maintaining precious metal nanoparticles in colloidal suspension,” Journal of Material Science, 37, 2002, 493-504. 5. J. Vasenka, S. Manne, R. Giberson, T. Marsh, and E. Henderson, “Colloidal Gold Particles as an Incompressible AFM Imaging Standard for Assessing the Compressibility of Biomolecules,” Biophysical Journal, Vol. 65, 1993, 992-997.