Embed Size (px)
Citation preview
Part III Appendixes | Appendix A: STAR Reporting Clusters
Appendix A: STAR Reporting Clusters The tables in this appendix present the reporting clusters, the number of items in each reporting cluster, and
the average percent correct for a sample of students statewide for all 2011 CSTs; CMA in grades three through nine for ELA, grades three through seven for grade-level mathematics, grades seven through eleven for EOC Algebra I, and grades five, eight, and ten for science; and grades two through eleven of the STS.
The last three columns of each table, labeled “All,” “Minimally Proficient,” and “Minimally Advanced,” provide the expected average percent-correct scores on each cluster for a representative sample of the state’s students as well as the average percent correct for a representative sample of the state’s students who scored at the lowest score for proficient and at the lowest score for advanced. For the CSTs, for example, a “minimally proficient” sample of students statewide who obtained a scale score of exactly 350 or the lowest reported scale score above 350 if 350 is not a reported scale score; and for advanced, a sample of students statewide who scored at the lowest score for advanced.
Because the goal for the state is for all students to score at the proficient level or above, a useful benchmark for interpreting cluster scores is the performance on the cluster for students who scored between minimally proficient and minimally advanced on the total test. These average percent-correct values provide information about the relative difficulty of different clusters, which is important to take into account when considering the performance of students in the school or district.
114 2011 STAR Post-Test Guide August 2011 © 2011 by the California Department of Education
Part III Appendixes | Appendix A: STAR Reporting Clusters
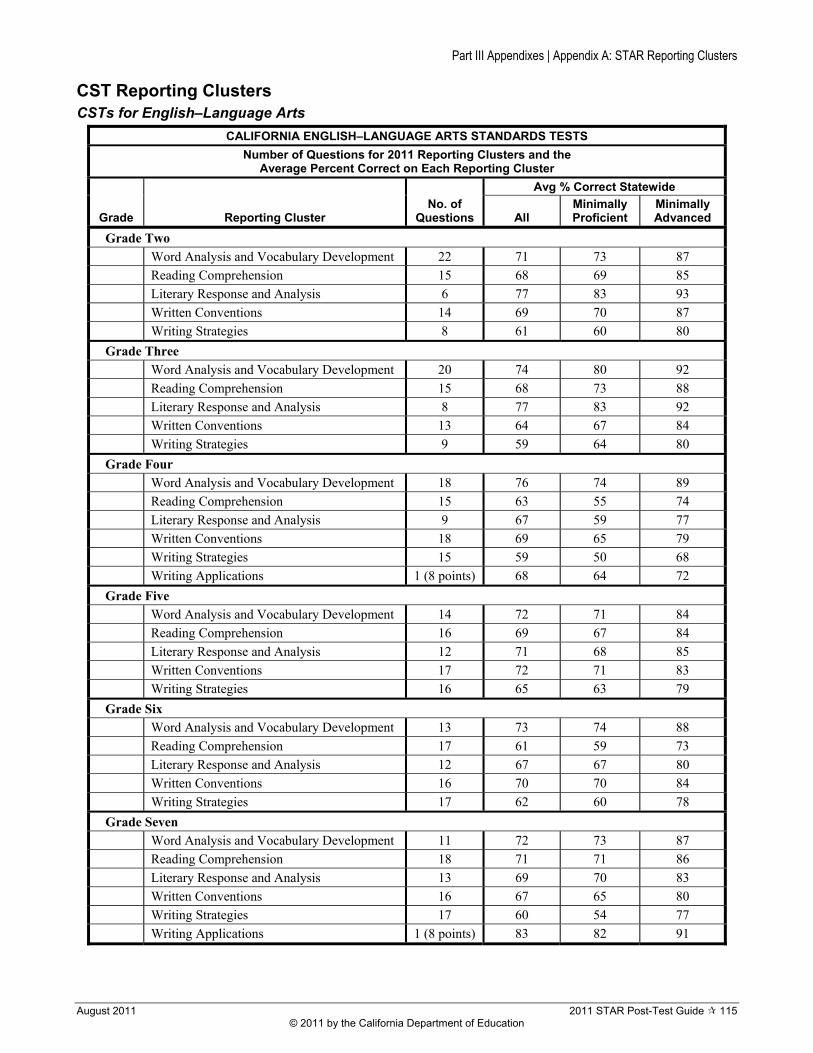
CST Reporting Clusters CSTs for English–Language Arts
CALIFORNIA ENGLISH–LANGUAGE ARTS STANDARDS TESTS
Number of Questions for 2011 Reporting Clusters and the Average Percent Correct on Each Reporting Cluster
Grade Reporting Cluster No. of
Questions
Avg % Correct Statewide
All Minimally Proficient
Minimally Advanced
Grade Two Word Analysis and Vocabulary Development 22 71 73 87
Reading Comprehension 15 68 69 85
Literary Response and Analysis 6 77 83 93
Written Conventions 14 69 70 87
Writing Strategies 8 61 60 80
Grade Three Word Analysis and Vocabulary Development 20 74 80 92
Reading Comprehension 15 68 73 88
Literary Response and Analysis 8 77 83 92
Written Conventions 13 64 67 84
Writing Strategies 9 59 64 80
Grade Four Word Analysis and Vocabulary Development 18 76 74 89
Reading Comprehension 15 63 55 74
Literary Response and Analysis 9 67 59 77
Written Conventions 18 69 65 79
Writing Strategies 15 59 50 68
Writing Applications 1 (8 points) 68 64 72
Grade Five Word Analysis and Vocabulary Development 14 72 71 84
Reading Comprehension 16 69 67 84
Literary Response and Analysis 12 71 68 85
Written Conventions 17 72 71 83
Writing Strategies 16 65 63 79
Grade Six Word Analysis and Vocabulary Development 13 73 74 88
Reading Comprehension 17 61 59 73
Literary Response and Analysis 12 67 67 80
Written Conventions 16 70 70 84
Writing Strategies 17 62 60 78
Grade Seven Word Analysis and Vocabulary Development 11 72 73 87
Reading Comprehension 18 71 71 86
Literary Response and Analysis 13 69 70 83
Written Conventions 16 67 65 80
Writing Strategies 17 60 54 77
Writing Applications 1 (8 points) 83 82 91
August 2011 2011 STAR Post-Test Guide 115 © 2011 by the California Department of Education
Part III Appendixes | Appendix A: STAR Reporting Clusters
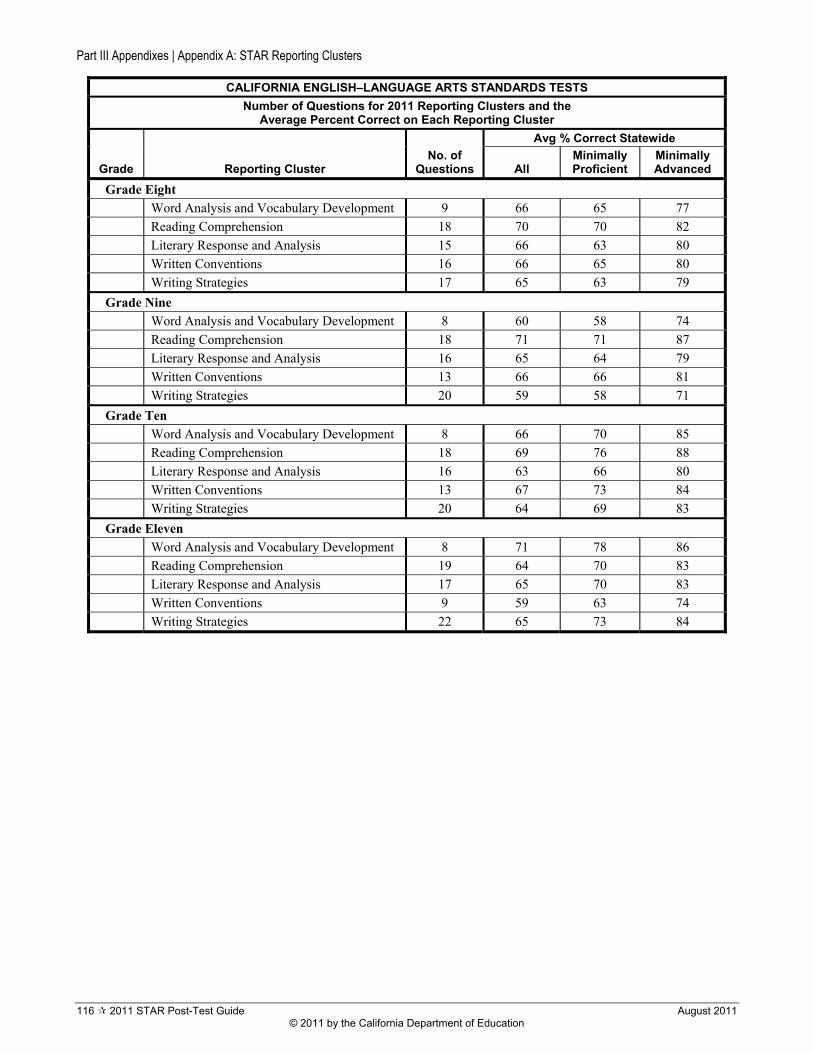
CALIFORNIA ENGLISH–LANGUAGE ARTS STANDARDS TESTS
Number of Questions for 2011 Reporting Clusters and the Average Percent Correct on Each Reporting Cluster
Grade Reporting Cluster No. of
Questions
Avg % Correct Statewide
All Minimally Proficient
Minimally Advanced
Grade Eight Word Analysis and Vocabulary Development 9 66 65 77
Reading Comprehension 18 70 70 82
Literary Response and Analysis 15 66 63 80
Written Conventions 16 66 65 80
Writing Strategies 17 65 63 79
Grade Nine Word Analysis and Vocabulary Development 8 60 58 74
Reading Comprehension 18 71 71 87
Literary Response and Analysis 16 65 64 79
Written Conventions 13 66 66 81
Writing Strategies 20 59 58 71
Grade Ten Word Analysis and Vocabulary Development 8 66 70 85
Reading Comprehension 18 69 76 88
Literary Response and Analysis 16 63 66 80
Written Conventions 13 67 73 84
Writing Strategies 20 64 69 83
Grade Eleven
Word Analysis and Vocabulary Development 8 71 78 86
Reading Comprehension 19 64 70 83
Literary Response and Analysis 17 65 70 83
Written Conventions 9 59 63 74
Writing Strategies 22 65 73 84
116 2011 STAR Post-Test Guide August 2011 © 2011 by the California Department of Education
Part III Appendixes | Appendix A: STAR Reporting Clusters
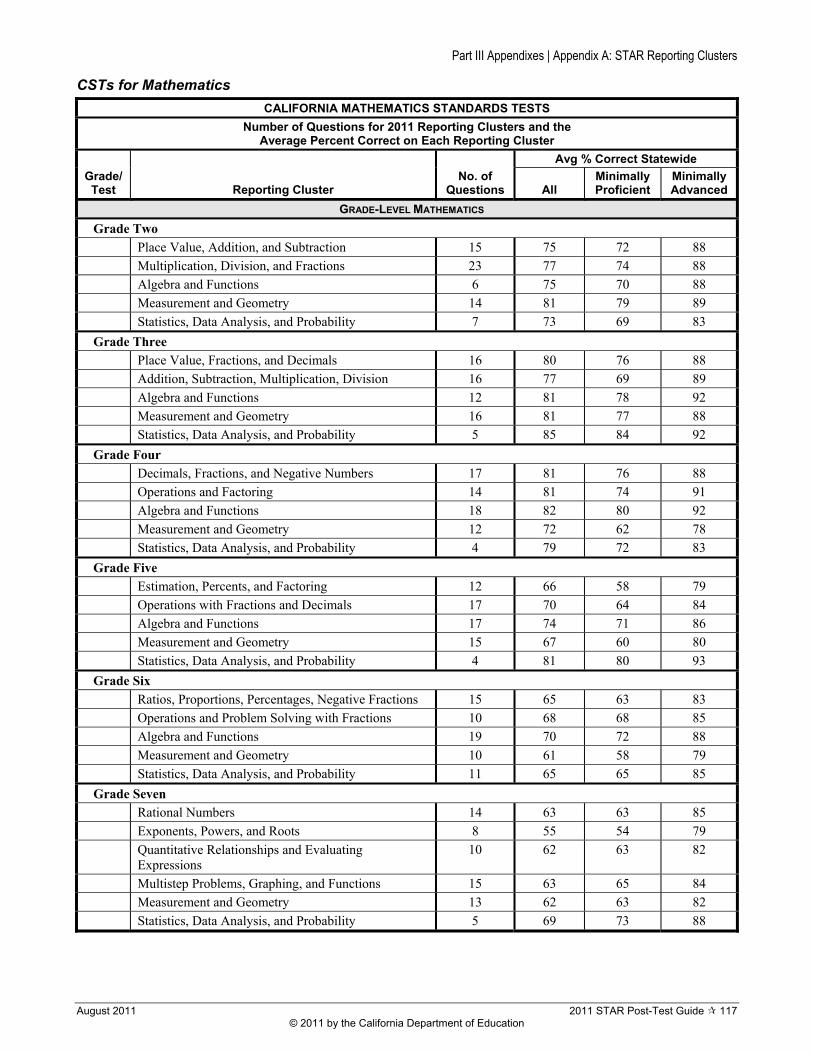
CSTs for Mathematics
CALIFORNIA MATHEMATICS STANDARDS TESTS
Number of Questions for 2011 Reporting Clusters and the Average Percent Correct on Each Reporting Cluster
Grade/ Test Reporting Cluster
No. of Questions
Avg % Correct Statewide
All Minimally Proficient
Minimally Advanced
GRADE-LEVEL MATHEMATICS
Grade Two
Place Value, Addition, and Subtraction 15 75 72 88
Multiplication, Division, and Fractions 23 77 74 88
Algebra and Functions 6 75 70 88
Measurement and Geometry 14 81 79 89
Statistics, Data Analysis, and Probability 7 73 69 83
Grade Three Place Value, Fractions, and Decimals 16 80 76 88
Addition, Subtraction, Multiplication, Division 16 77 69 89
Algebra and Functions 12 81 78 92
Measurement and Geometry 16 81 77 88
Statistics, Data Analysis, and Probability 5 85 84 92
Grade Four
Decimals, Fractions, and Negative Numbers 17 81 76 88
Operations and Factoring 14 81 74 91
Algebra and Functions 18 82 80 92
Measurement and Geometry 12 72 62 78
Statistics, Data Analysis, and Probability 4 79 72 83
Grade Five Estimation, Percents, and Factoring 12 66 58 79
Operations with Fractions and Decimals 17 70 64 84
Algebra and Functions 17 74 71 86
Measurement and Geometry 15 67 60 80
Statistics, Data Analysis, and Probability 4 81 80 93
Grade Six
Ratios, Proportions, Percentages, Negative Fractions 15 65 63 83
Operations and Problem Solving with Fractions 10 68 68 85
Algebra and Functions 19 70 72 88
Measurement and Geometry 10 61 58 79
Statistics, Data Analysis, and Probability 11 65 65 85
Grade Seven Rational Numbers 14 63 63 85
Exponents, Powers, and Roots 8 55 54 79
Quantitative Relationships and Evaluating Expressions
10 62 63 82
Multistep Problems, Graphing, and Functions 15 63 65 84
Measurement and Geometry 13 62 63 82
Statistics, Data Analysis, and Probability 5 69 73 88
August 2011 2011 STAR Post-Test Guide 117 © 2011 by the California Department of Education
Part III Appendixes | Appendix A: STAR Reporting Clusters
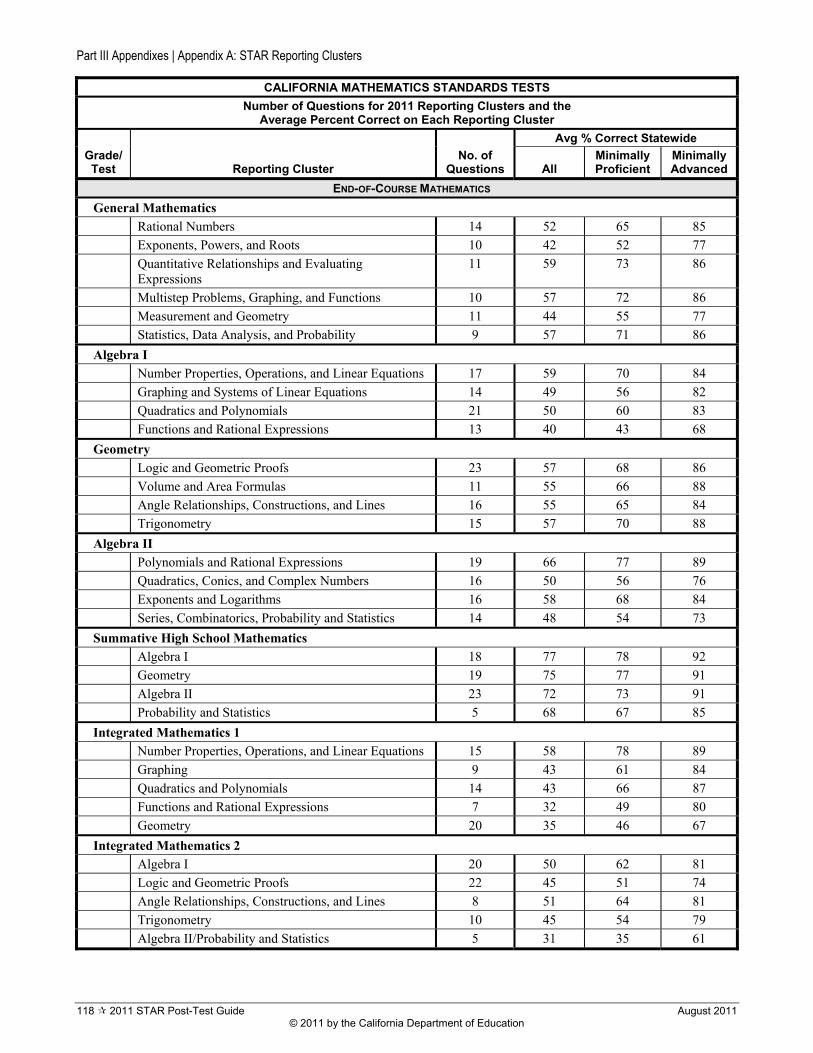
CALIFORNIA MATHEMATICS STANDARDS TESTS
Number of Questions for 2011 Reporting Clusters and the Average Percent Correct on Each Reporting Cluster
Grade/ Test Reporting Cluster
No. of Questions
Avg % Correct Statewide
All Minimally Proficient
Minimally Advanced
END-OF-COURSE MATHEMATICS
General Mathematics
Rational Numbers 14 52 65 85
Exponents, Powers, and Roots 10 42 52 77
Quantitative Relationships and Evaluating Expressions
11 59 73 86
Multistep Problems, Graphing, and Functions 10 57 72 86
Measurement and Geometry 11 44 55 77
Statistics, Data Analysis, and Probability 9 57 71 86
Algebra I Number Properties, Operations, and Linear Equations 17 59 70 84
Graphing and Systems of Linear Equations 14 49 56 82
Quadratics and Polynomials 21 50 60 83
Functions and Rational Expressions 13 40 43 68
Geometry
Logic and Geometric Proofs 23 57 68 86
Volume and Area Formulas 11 55 66 88
Angle Relationships, Constructions, and Lines 16 55 65 84
Trigonometry 15 57 70 88
Algebra II
Polynomials and Rational Expressions 19 66 77 89
Quadratics, Conics, and Complex Numbers 16 50 56 76
Exponents and Logarithms 16 58 68 84
Series, Combinatorics, Probability and Statistics 14 48 54 73
Summative High School Mathematics Algebra I 18 77 78 92
Geometry 19 75 77 91
Algebra II 23 72 73 91
Probability and Statistics 5 68 67 85
Integrated Mathematics 1 Number Properties, Operations, and Linear Equations 15 58 78 89
Graphing 9 43 61 84
Quadratics and Polynomials 14 43 66 87
Functions and Rational Expressions 7 32 49 80
Geometry 20 35 46 67
Integrated Mathematics 2 Algebra I 20 50 62 81
Logic and Geometric Proofs 22 45 51 74
Angle Relationships, Constructions, and Lines 8 51 64 81
Trigonometry 10 45 54 79
Algebra II/Probability and Statistics 5 31 35 61
118 2011 STAR Post-Test Guide August 2011 © 2011 by the California Department of Education
Part III Appendixes | Appendix A: STAR Reporting Clusters
CALIFORNIA MATHEMATICS STANDARDS TESTS
Number of Questions for 2011 Reporting Clusters and the Average Percent Correct on Each Reporting Cluster
Grade/ Test Reporting Cluster
No. of Questions
Avg % Correct Statewide
All Minimally Proficient
Minimally Advanced
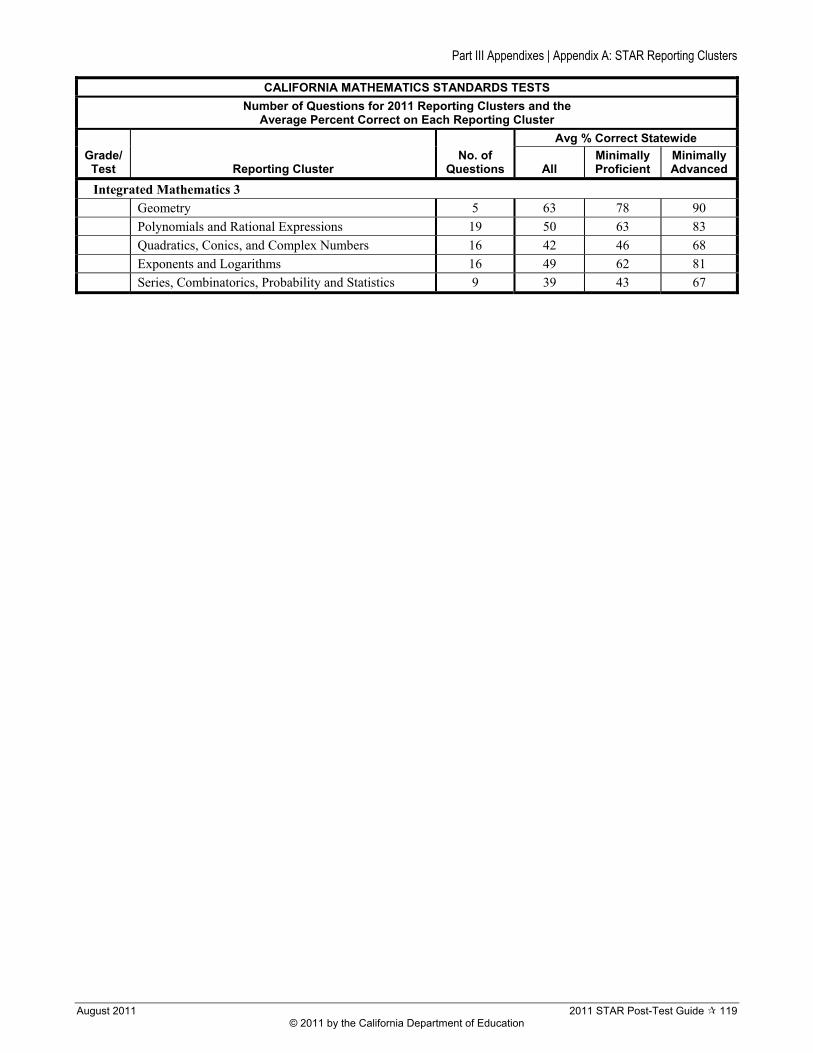
Integrated Mathematics 3 Geometry 5 63 78 90
Polynomials and Rational Expressions 19 50 63 83
Quadratics, Conics, and Complex Numbers 16 42 46 68
Exponents and Logarithms 16 49 62 81
Series, Combinatorics, Probability and Statistics 9 39 43 67
August 2011 2011 STAR Post-Test Guide 119 © 2011 by the California Department of Education
Part III Appendixes | Appendix A: STAR Reporting Clusters
CSTs for Science
CALIFORNIA SCIENCE STANDARDS TESTS
Number of Questions for 2011 Reporting Clusters and the Average Percent Correct on Each Reporting Cluster
Grade/ Test Reporting Cluster
No. of Questions
Avg % Correct Statewide
All Minimally Proficient
Minimally Advanced
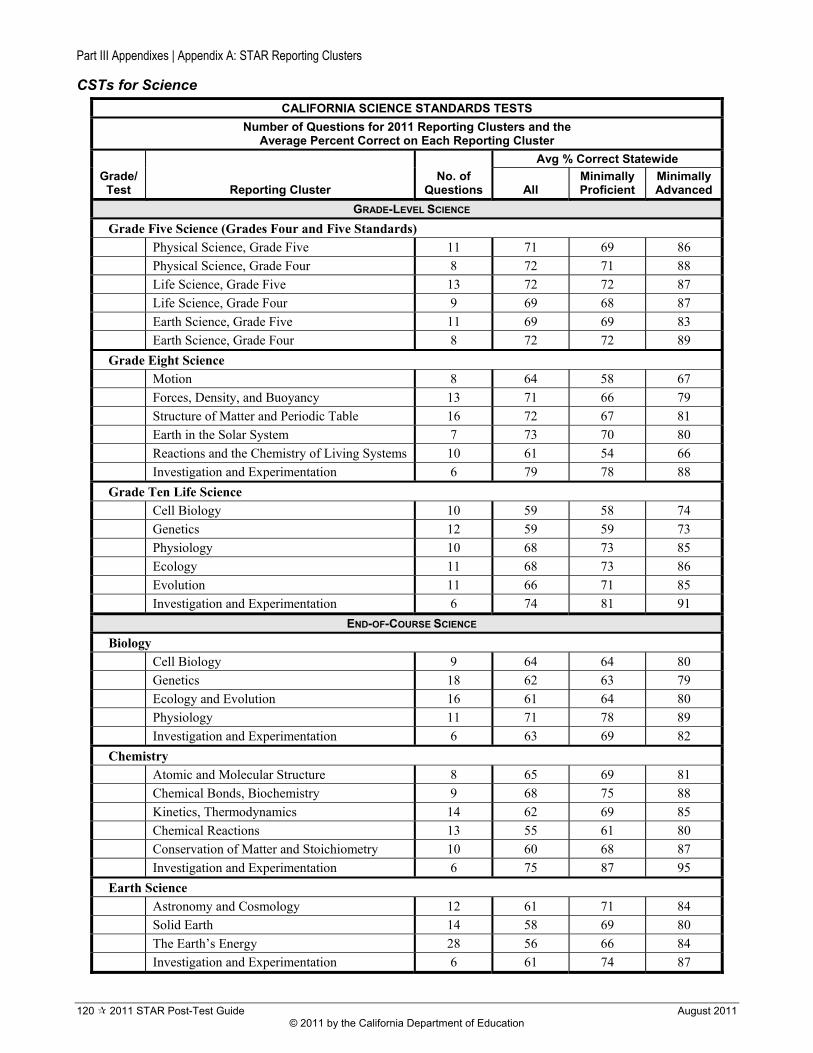
GRADE-LEVEL SCIENCE
Grade Five Science (Grades Four and Five Standards)
Physical Science, Grade Five 11 71 69 86
Physical Science, Grade Four 8 72 71 88
Life Science, Grade Five 13 72 72 87
Life Science, Grade Four 9 69 68 87
Earth Science, Grade Five 11 69 69 83
Earth Science, Grade Four 8 72 72 89
Grade Eight Science Motion 8 64 58 67
Forces, Density, and Buoyancy 13 71 66 79
Structure of Matter and Periodic Table 16 72 67 81
Earth in the Solar System 7 73 70 80
Reactions and the Chemistry of Living Systems 10 61 54 66
Investigation and Experimentation 6 79 78 88
Grade Ten Life Science Cell Biology 10 59 58 74
Genetics 12 59 59 73
Physiology 10 68 73 85
Ecology 11 68 73 86
Evolution 11 66 71 85
Investigation and Experimentation 6 74 81 91
END-OF-COURSE SCIENCE
Biology
Cell Biology 9 64 64 80
Genetics 18 62 63 79
Ecology and Evolution 16 61 64 80
Physiology 11 71 78 89
Investigation and Experimentation 6 63 69 82
Chemistry Atomic and Molecular Structure 8 65 69 81
Chemical Bonds, Biochemistry 9 68 75 88
Kinetics, Thermodynamics 14 62 69 85
Chemical Reactions 13 55 61 80
Conservation of Matter and Stoichiometry 10 60 68 87
Investigation and Experimentation 6 75 87 95
Earth Science Astronomy and Cosmology 12 61 71 84
Solid Earth 14 58 69 80
The Earth’s Energy 28 56 66 84
Investigation and Experimentation 6 61 74 87
120 2011 STAR Post-Test Guide August 2011 © 2011 by the California Department of Education
Part III Appendixes | Appendix A: STAR Reporting Clusters
CALIFORNIA SCIENCE STANDARDS TESTS
Number of Questions for 2011 Reporting Clusters and the Average Percent Correct on Each Reporting Cluster
Grade/ Test Reporting Cluster
No. of Questions
Avg % Correct Statewide
All Minimally Proficient
Minimally Advanced
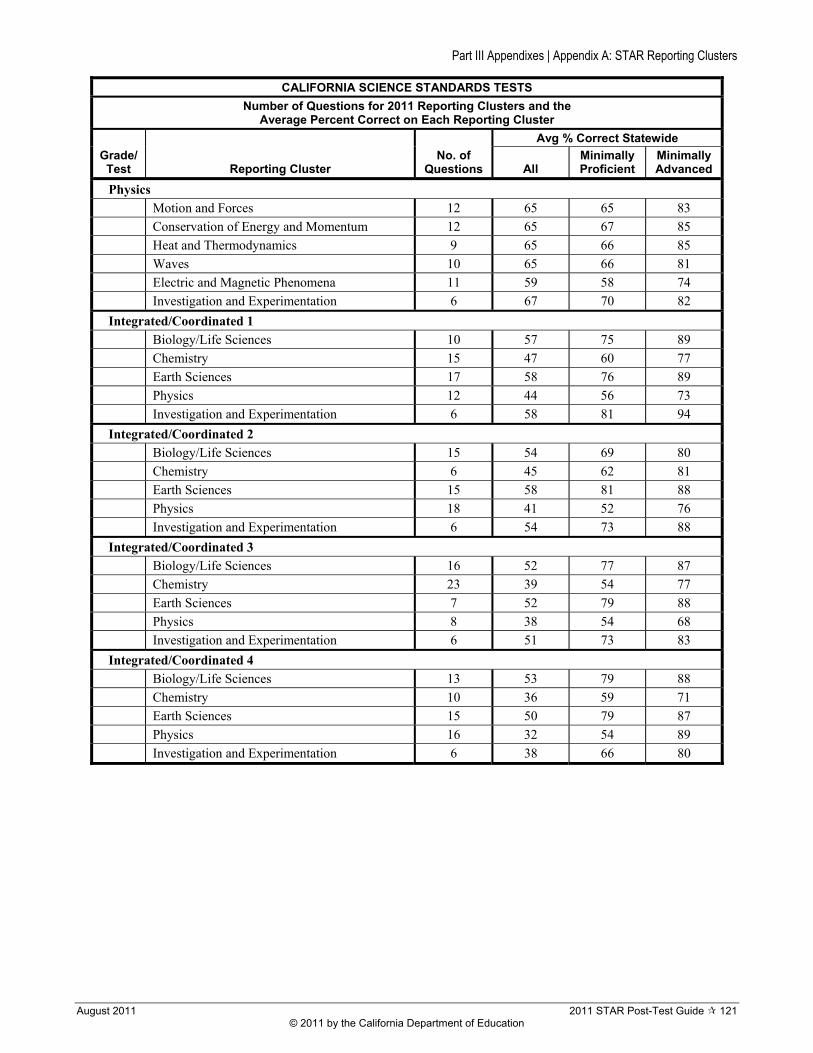
Physics Motion and Forces 12 65 65 83
Conservation of Energy and Momentum 12 65 67 85
Heat and Thermodynamics 9 65 66 85
Waves 10 65 66 81
Electric and Magnetic Phenomena 11 59 58 74
Investigation and Experimentation 6 67 70 82
Integrated/Coordinated 1
Biology/Life Sciences 10 57 75 89
Chemistry 15 47 60 77
Earth Sciences 17 58 76 89
Physics 12 44 56 73
Investigation and Experimentation 6 58 81 94
Integrated/Coordinated 2 Biology/Life Sciences 15 54 69 80
Chemistry 6 45 62 81
Earth Sciences 15 58 81 88
Physics 18 41 52 76
Investigation and Experimentation 6 54 73 88
Integrated/Coordinated 3 Biology/Life Sciences 16 52 77 87
Chemistry 23 39 54 77
Earth Sciences 7 52 79 88
Physics 8 38 54 68
Investigation and Experimentation 6 51 73 83
Integrated/Coordinated 4 Biology/Life Sciences 13 53 79 88
Chemistry 10 36 59 71
Earth Sciences 15 50 79 87
Physics 16 32 54 89
Investigation and Experimentation 6 38 66 80
August 2011 2011 STAR Post-Test Guide 121 © 2011 by the California Department of Education
Part III Appendixes | Appendix A: STAR Reporting Clusters
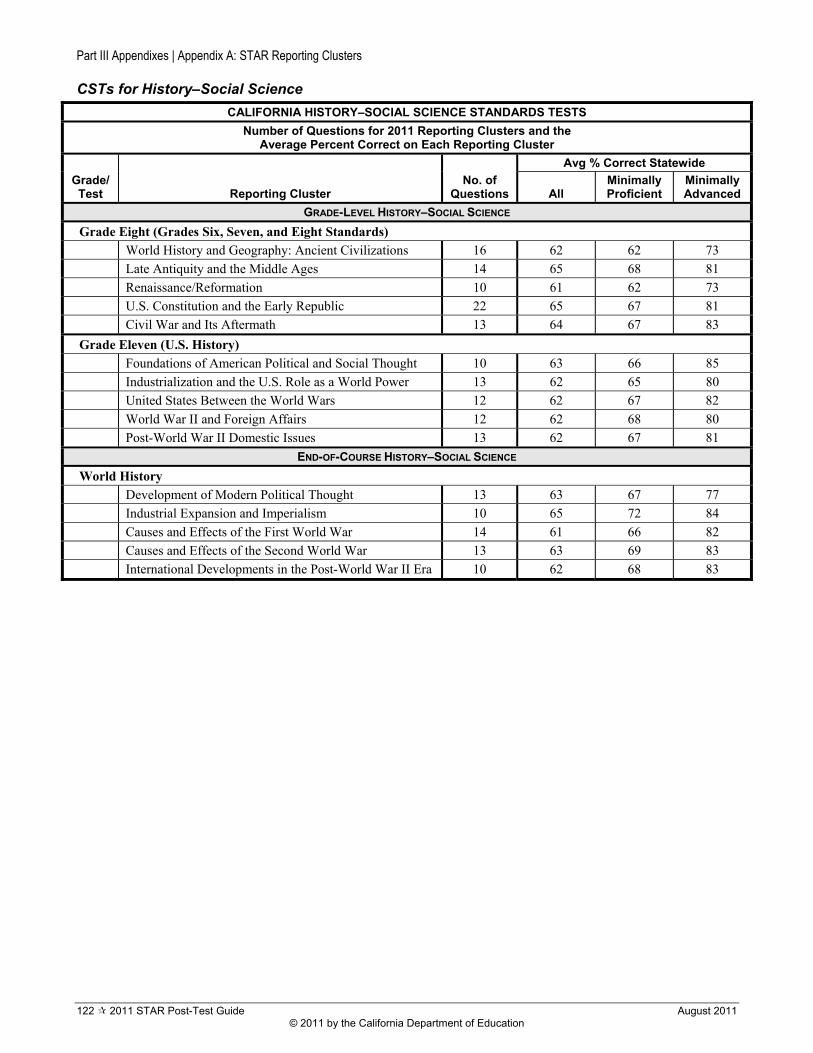
CSTs for History–Social Science
CALIFORNIA HISTORY–SOCIAL SCIENCE STANDARDS TESTS
Number of Questions for 2011 Reporting Clusters and the Average Percent Correct on Each Reporting Cluster
Grade/ Test Reporting Cluster
No. of Questions
Avg % Correct Statewide
All Minimally Proficient
Minimally Advanced
GRADE-LEVEL HISTORY–SOCIAL SCIENCE
Grade Eight (Grades Six, Seven, and Eight Standards) World History and Geography: Ancient Civilizations 16 62 62 73
Late Antiquity and the Middle Ages 14 65 68 81
Renaissance/Reformation 10 61 62 73
U.S. Constitution and the Early Republic 22 65 67 81
Civil War and Its Aftermath 13 64 67 83
Grade Eleven (U.S. History)
Foundations of American Political and Social Thought 10 63 66 85
Industrialization and the U.S. Role as a World Power 13 62 65 80
United States Between the World Wars 12 62 67 82
World War II and Foreign Affairs 12 62 68 80
Post-World War II Domestic Issues 13 62 67 81
END-OF-COURSE HISTORY–SOCIAL SCIENCE
World History Development of Modern Political Thought 13 63 67 77
Industrial Expansion and Imperialism 10 65 72 84
Causes and Effects of the First World War 14 61 66 82
Causes and Effects of the Second World War 13 63 69 83
International Developments in the Post-World War II Era 10 62 68 83
122 2011 STAR Post-Test Guide August 2011 © 2011 by the California Department of Education
Part III Appendixes | Appendix A: STAR Reporting Clusters
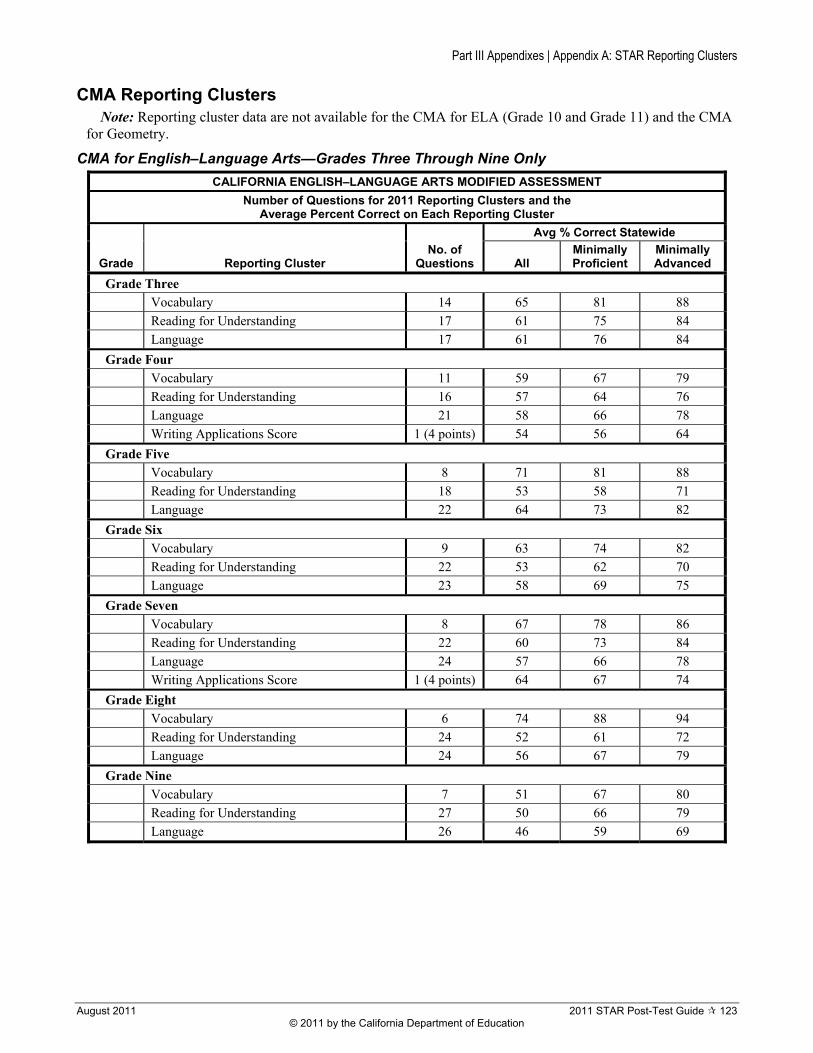
CMA Reporting Clusters Note: Reporting cluster data are not available for the CMA for ELA (Grade 10 and Grade 11) and the CMA
for Geometry.
CMA for English–Language Arts—Grades Three Through Nine Only
CALIFORNIA ENGLISH–LANGUAGE ARTS MODIFIED ASSESSMENT
Number of Questions for 2011 Reporting Clusters and the Average Percent Correct on Each Reporting Cluster
Grade Reporting Cluster No. of
Questions
Avg % Correct Statewide
All Minimally Proficient
Minimally Advanced
Grade Three Vocabulary 14 65 81 88
Reading for Understanding 17 61 75 84
Language 17 61 76 84
Grade Four Vocabulary 11 59 67 79
Reading for Understanding 16 57 64 76
Language 21 58 66 78
Writing Applications Score 1 (4 points) 54 56 64
Grade Five
Vocabulary 8 71 81 88
Reading for Understanding 18 53 58 71
Language 22 64 73 82
Grade Six
Vocabulary 9 63 74 82
Reading for Understanding 22 53 62 70
Language 23 58 69 75
Grade Seven
Vocabulary 8 67 78 86
Reading for Understanding 22 60 73 84
Language 24 57 66 78
Writing Applications Score 1 (4 points) 64 67 74
Grade Eight
Vocabulary 6 74 88 94
Reading for Understanding 24 52 61 72
Language 24 56 67 79
Grade Nine
Vocabulary 7 51 67 80
Reading for Understanding 27 50 66 79
Language 26 46 59 69
August 2011 2011 STAR Post-Test Guide 123 © 2011 by the California Department of Education
Part III Appendixes | Appendix A: STAR Reporting Clusters
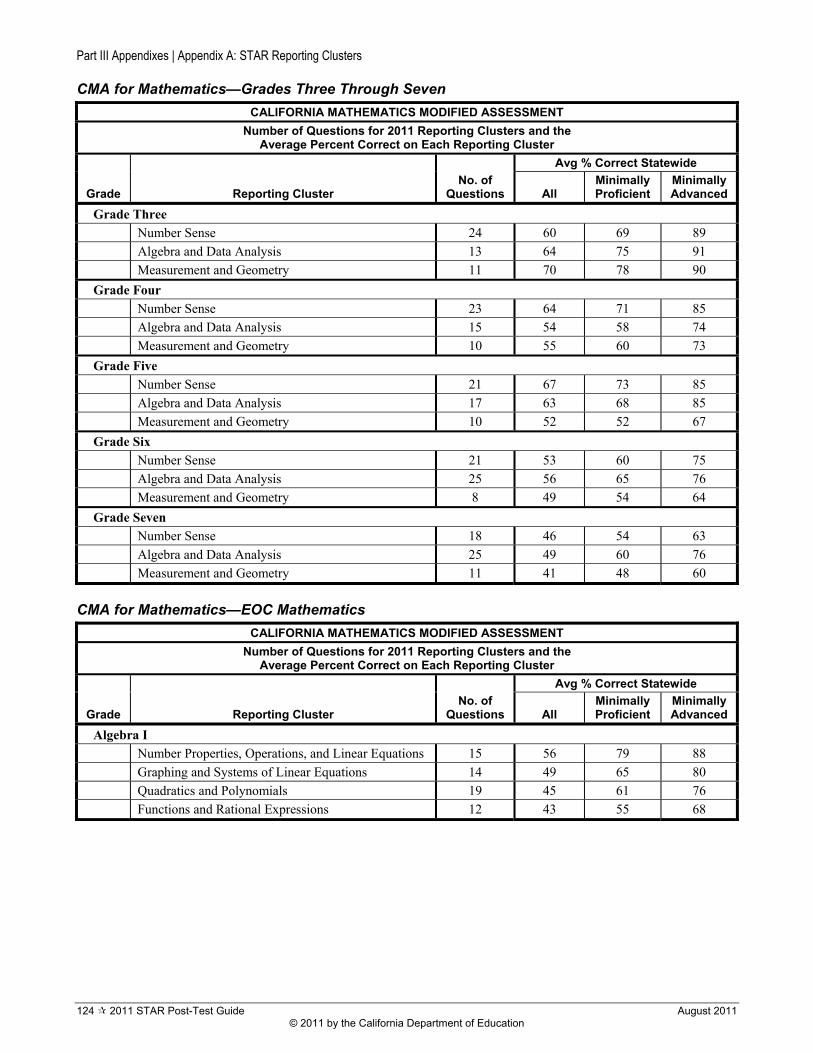
CMA for Mathematics—Grades Three Through Seven
CALIFORNIA MATHEMATICS MODIFIED ASSESSMENT
Number of Questions for 2011 Reporting Clusters and the Average Percent Correct on Each Reporting Cluster
Grade Reporting Cluster No. of
Questions
Avg % Correct Statewide
All Minimally Proficient
Minimally Advanced
Grade Three
Number Sense 24 60 69 89
Algebra and Data Analysis 13 64 75 91
Measurement and Geometry 11 70 78 90
Grade Four
Number Sense 23 64 71 85
Algebra and Data Analysis 15 54 58 74
Measurement and Geometry 10 55 60 73
Grade Five
Number Sense 21 67 73 85
Algebra and Data Analysis 17 63 68 85
Measurement and Geometry 10 52 52 67
Grade Six
Number Sense 21 53 60 75
Algebra and Data Analysis 25 56 65 76
Measurement and Geometry 8 49 54 64
Grade Seven Number Sense 18 46 54 63
Algebra and Data Analysis 25 49 60 76
Measurement and Geometry 11 41 48 60
CMA for Mathematics—EOC Mathematics
CALIFORNIA MATHEMATICS MODIFIED ASSESSMENT
Number of Questions for 2011 Reporting Clusters and the Average Percent Correct on Each Reporting Cluster
Grade Reporting Cluster No. of
Questions
Avg % Correct Statewide
All Minimally Proficient
Minimally Advanced
Algebra I Number Properties, Operations, and Linear Equations 15 56 79 88
Graphing and Systems of Linear Equations 14 49 65 80
Quadratics and Polynomials 19 45 61 76
Functions and Rational Expressions 12 43 55 68
124 2011 STAR Post-Test Guide August 2011 © 2011 by the California Department of Education
Part III Appendixes | Appendix A: STAR Reporting Clusters
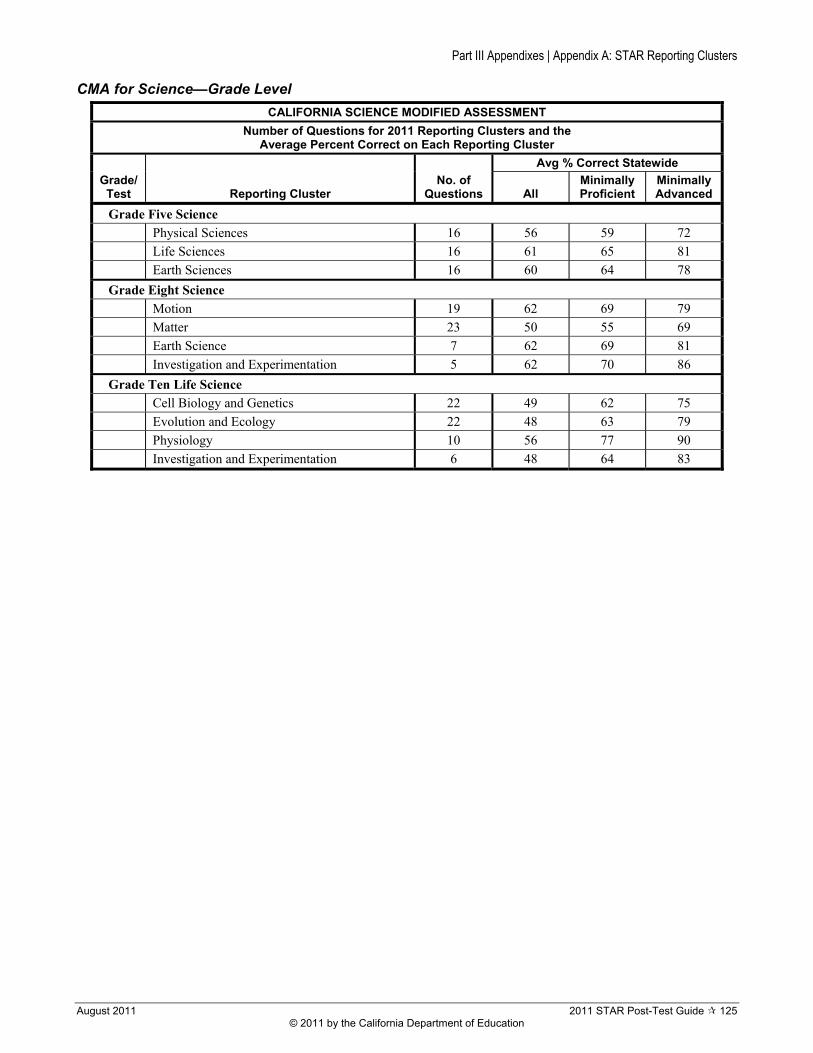
CMA for Science—Grade Level
CALIFORNIA SCIENCE MODIFIED ASSESSMENT
Number of Questions for 2011 Reporting Clusters and the Average Percent Correct on Each Reporting Cluster
Grade/ Test Reporting Cluster
No. of Questions
Avg % Correct Statewide
All Minimally Proficient
Minimally Advanced
Grade Five Science
Physical Sciences 16 56 59 72
Life Sciences 16 61 65 81
Earth Sciences 16 60 64 78
Grade Eight Science
Motion 19 62 69 79
Matter 23 50 55 69
Earth Science 7 62 69 81
Investigation and Experimentation 5 62 70 86
Grade Ten Life Science Cell Biology and Genetics 22 49 62 75
Evolution and Ecology 22 48 63 79
Physiology 10 56 77 90
Investigation and Experimentation 6 48 64 83
August 2011 2011 STAR Post-Test Guide 125 © 2011 by the California Department of Education
Part III Appendixes | Appendix A: STAR Reporting Clusters
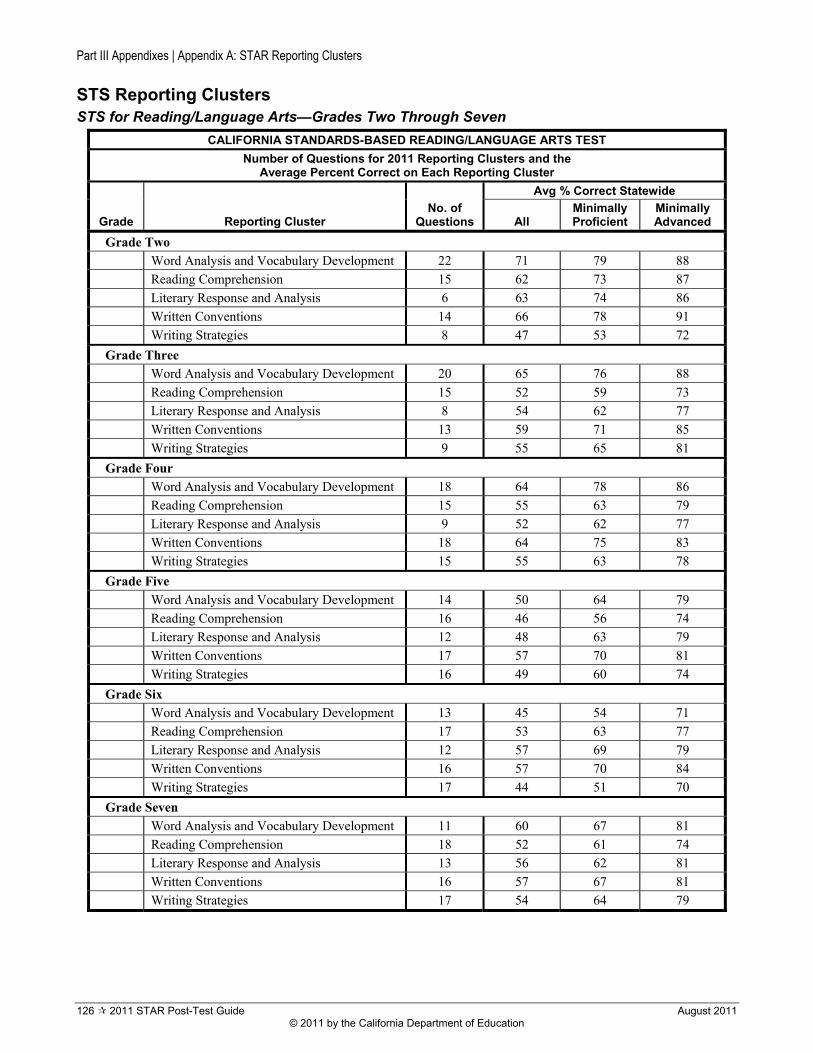
STS Reporting Clusters STS for Reading/Language Arts—Grades Two Through Seven
CALIFORNIA STANDARDS-BASED READING/LANGUAGE ARTS TEST
Number of Questions for 2011 Reporting Clusters and the Average Percent Correct on Each Reporting Cluster
Grade Reporting Cluster No. of
Questions
Avg % Correct Statewide
All Minimally Proficient
Minimally Advanced
Grade Two Word Analysis and Vocabulary Development 22 71 79 88
Reading Comprehension 15 62 73 87
Literary Response and Analysis 6 63 74 86
Written Conventions 14 66 78 91
Writing Strategies 8 47 53 72
Grade Three Word Analysis and Vocabulary Development 20 65 76 88
Reading Comprehension 15 52 59 73
Literary Response and Analysis 8 54 62 77
Written Conventions 13 59 71 85
Writing Strategies 9 55 65 81
Grade Four Word Analysis and Vocabulary Development 18 64 78 86
Reading Comprehension 15 55 63 79
Literary Response and Analysis 9 52 62 77
Written Conventions 18 64 75 83
Writing Strategies 15 55 63 78
Grade Five
Word Analysis and Vocabulary Development 14 50 64 79
Reading Comprehension 16 46 56 74
Literary Response and Analysis 12 48 63 79
Written Conventions 17 57 70 81
Writing Strategies 16 49 60 74
Grade Six Word Analysis and Vocabulary Development 13 45 54 71
Reading Comprehension 17 53 63 77
Literary Response and Analysis 12 57 69 79
Written Conventions 16 57 70 84
Writing Strategies 17 44 51 70
Grade Seven
Word Analysis and Vocabulary Development 11 60 67 81
Reading Comprehension 18 52 61 74
Literary Response and Analysis 13 56 62 81
Written Conventions 16 57 67 81
Writing Strategies 17 54 64 79
126 2011 STAR Post-Test Guide August 2011 © 2011 by the California Department of Education
Part III Appendixes | Appendix A: STAR Reporting Clusters
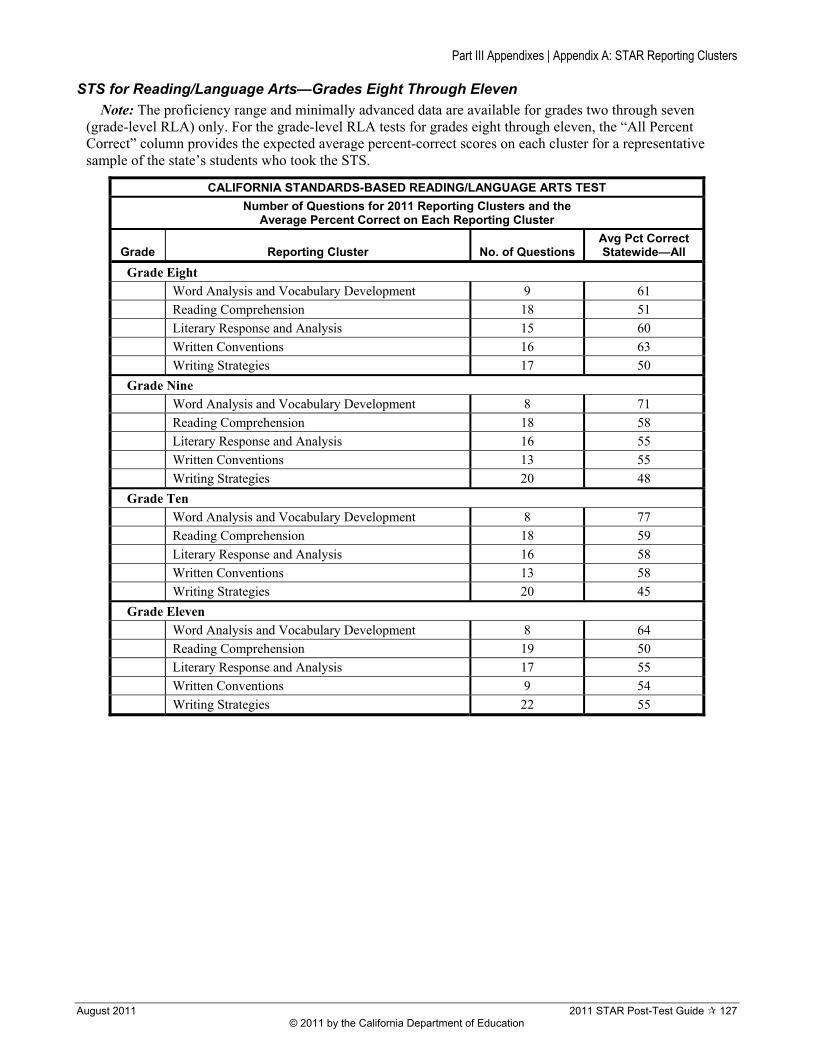
STS for Reading/Language Arts—Grades Eight Through Eleven
Note: The proficiency range and minimally advanced data are available for grades two through seven (grade-level RLA) only. For the grade-level RLA tests for grades eight through eleven, the “All Percent Correct” column provides the expected average percent-correct scores on each cluster for a representative sample of the state’s students who took the STS.
CALIFORNIA STANDARDS-BASED READING/LANGUAGE ARTS TEST
Number of Questions for 2011 Reporting Clusters and the Average Percent Correct on Each Reporting Cluster
Grade Reporting Cluster No. of Questions Avg Pct Correct Statewide—All
Grade Eight Word Analysis and Vocabulary Development 9 61
Reading Comprehension 18 51
Literary Response and Analysis 15 60
Written Conventions 16 63
Writing Strategies 17 50
Grade Nine Word Analysis and Vocabulary Development 8 71
Reading Comprehension 18 58
Literary Response and Analysis 16 55
Written Conventions 13 55
Writing Strategies 20 48
Grade Ten Word Analysis and Vocabulary Development 8 77
Reading Comprehension 18 59
Literary Response and Analysis 16 58
Written Conventions 13 58
Writing Strategies 20 45
Grade Eleven
Word Analysis and Vocabulary Development 8 64
Reading Comprehension 19 50
Literary Response and Analysis 17 55
Written Conventions 9 54
Writing Strategies 22 55
August 2011 2011 STAR Post-Test Guide 127 © 2011 by the California Department of Education
Part III Appendixes | Appendix A: STAR Reporting Clusters
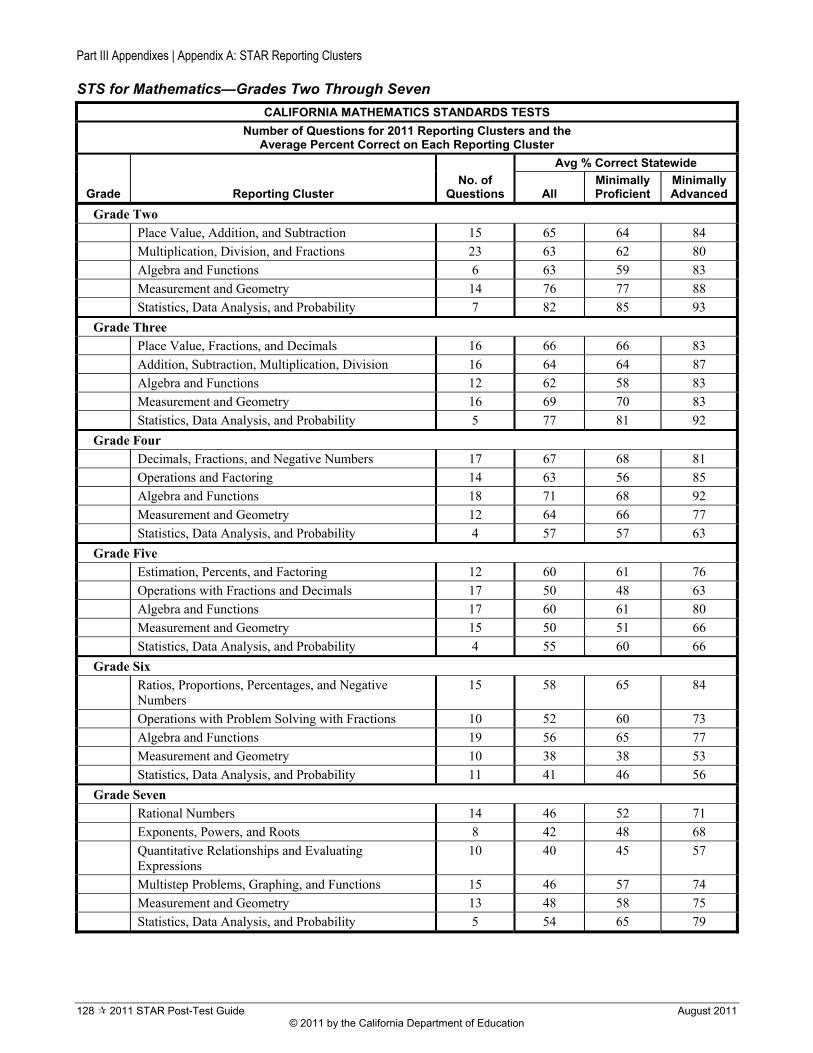
STS for Mathematics—Grades Two Through Seven
CALIFORNIA MATHEMATICS STANDARDS TESTS
Number of Questions for 2011 Reporting Clusters and the Average Percent Correct on Each Reporting Cluster
Grade Reporting Cluster No. of
Questions
Avg % Correct Statewide
All Minimally Proficient
Minimally Advanced
Grade Two
Place Value, Addition, and Subtraction 15 65 64 84
Multiplication, Division, and Fractions 23 63 62 80
Algebra and Functions 6 63 59 83
Measurement and Geometry 14 76 77 88
Statistics, Data Analysis, and Probability 7 82 85 93
Grade Three Place Value, Fractions, and Decimals 16 66 66 83
Addition, Subtraction, Multiplication, Division 16 64 64 87
Algebra and Functions 12 62 58 83
Measurement and Geometry 16 69 70 83
Statistics, Data Analysis, and Probability 5 77 81 92
Grade Four Decimals, Fractions, and Negative Numbers 17 67 68 81
Operations and Factoring 14 63 56 85
Algebra and Functions 18 71 68 92
Measurement and Geometry 12 64 66 77
Statistics, Data Analysis, and Probability 4 57 57 63
Grade Five Estimation, Percents, and Factoring 12 60 61 76
Operations with Fractions and Decimals 17 50 48 63
Algebra and Functions 17 60 61 80
Measurement and Geometry 15 50 51 66
Statistics, Data Analysis, and Probability 4 55 60 66
Grade Six
Ratios, Proportions, Percentages, and Negative Numbers
15 58 65 84
Operations with Problem Solving with Fractions 10 52 60 73
Algebra and Functions 19 56 65 77
Measurement and Geometry 10 38 38 53
Statistics, Data Analysis, and Probability 11 41 46 56
Grade Seven Rational Numbers 14 46 52 71
Exponents, Powers, and Roots 8 42 48 68
Quantitative Relationships and Evaluating Expressions
10 40 45 57
Multistep Problems, Graphing, and Functions 15 46 57 74
Measurement and Geometry 13 48 58 75
Statistics, Data Analysis, and Probability 5 54 65 79
128 2011 STAR Post-Test Guide August 2011 © 2011 by the California Department of Education
Part III Appendixes | Appendix A: STAR Reporting Clusters
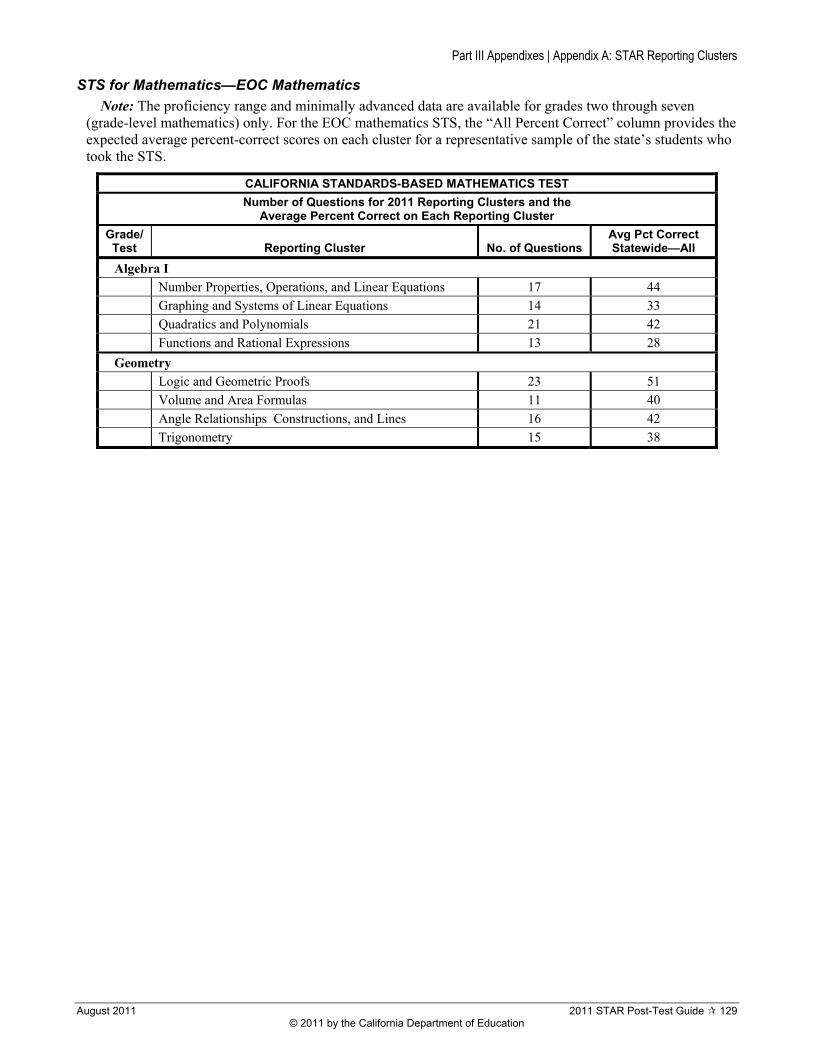
STS for Mathematics—EOC Mathematics
Note: The proficiency range and minimally advanced data are available for grades two through seven (grade-level mathematics) only. For the EOC mathematics STS, the “All Percent Correct” column provides the expected average percent-correct scores on each cluster for a representative sample of the state’s students who took the STS.
CALIFORNIA STANDARDS-BASED MATHEMATICS TEST
Number of Questions for 2011 Reporting Clusters and the Average Percent Correct on Each Reporting Cluster
Grade/ Test Reporting Cluster No. of Questions
Avg Pct Correct Statewide—All
Algebra I Number Properties, Operations, and Linear Equations 17 44
Graphing and Systems of Linear Equations 14 33
Quadratics and Polynomials 21 42
Functions and Rational Expressions 13 28
Geometry Logic and Geometric Proofs 23 51
Volume and Area Formulas 11 40
Angle Relationships Constructions, and Lines 16 42
Trigonometry 15 38
August 2011 2011 STAR Post-Test Guide 129 © 2011 by the California Department of Education
August 2011 2011 STAR Post-Test Guide 133 © 2011 by the California Department of Education
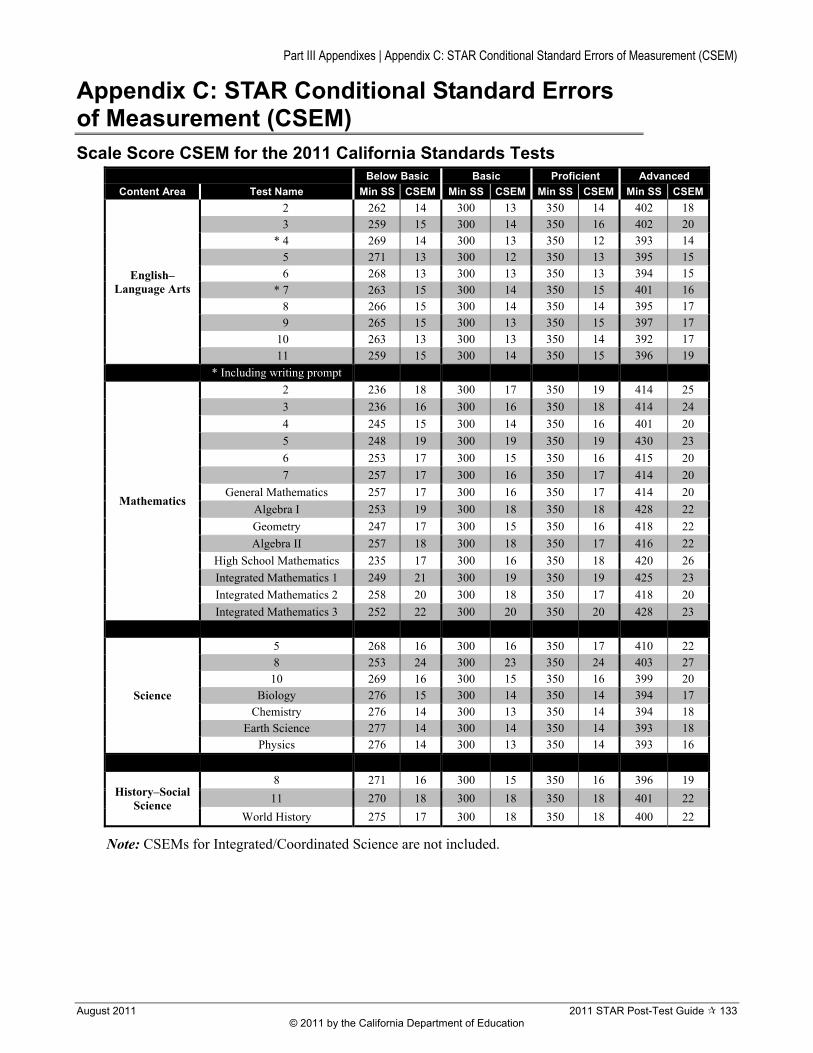
Part III Appendixes | Appendix C: STAR Conditional Standard Errors of Measurement (CSEM)
Appendix C: STAR Conditional Standard Errors of Measurement (CSEM) Scale Score CSEM for the 2011 California Standards Tests
Below Basic Basic Proficient Advanced
Content Area Test Name Min SS CSEM Min SS CSEM Min SS CSEM Min SS CSEM
2 262 14 300 13 350 14 402 18
3 259 15 300 14 350 16 402 20 * 4 269 14 300 13 350 12 393 14
5 271 13 300 12 350 13 395 15
English– Language Arts
6 * 7
268 263
13 15
300 300
13 14
350 350
13 15
394 401
15 16
8 266 15 300 14 350 14 395 17 9 265 15 300 13 350 15 397 17
10 263 13 300 13 350 14 392 17
11 259 15 300 14 350 15 396 19
* Including writing prompt
2 236 18 300 17 350 19 414 25
3 236 16 300 16 350 18 414 24
4 245 15 300 14 350 16 401 20
5 248 19 300 19 350 19 430 23
6 253 17 300 15 350 16 415 20
7 257 17 300 16 350 17 414 20
Mathematics General Mathematics 257 17 300 16 350 17 414 20
Algebra I 253 19 300 18 350 18 428 22
Geometry 247 17 300 15 350 16 418 22
Algebra II 257 18 300 18 350 17 416 22
High School Mathematics 235 17 300 16 350 18 420 26
Integrated Mathematics 1 249 21 300 19 350 19 425 23
Integrated Mathematics 2 258 20 300 18 350 17 418 20
Integrated Mathematics 3 252 22 300 20 350 20 428 23
5 268 16 300 16 350 17 410 22 8 253 24 300 23 350 24 403 27 10 269 16 300 15 350 16 399 20
Science Biology Chemistry
Earth Science
276 276 277
15 14 14
300 300 300
14 13 14
350 350 350
14 14 14
394 394 393
17 18 18
Physics 276 14 300 13 350 14 393 16
History–Social Science
8 271 16 300 15 350 16 396 19
11
World History
270
275
18
17
300
300
18
18
350
350
18
18
401
400
22
22
Note: CSEMs for Integrated/Coordinated Science are not included.
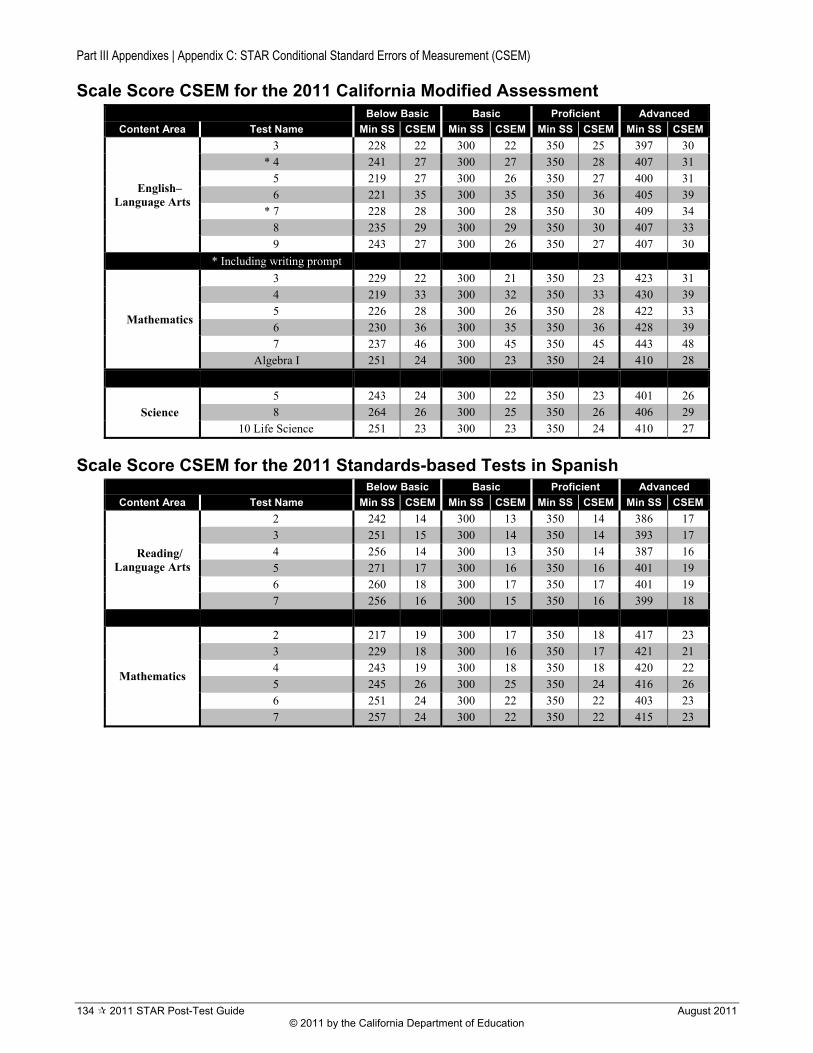
Part III Appendixes | Appendix C: STAR Conditional Standard Errors of Measurement (CSEM)
Scale Score CSEM for the 2011 California Modified Assessment Below Basic Basic Proficient Advanced
Content Area Test Name Min SS CSEM Min SS CSEM Min SS CSEM Min SS CSEM
3 228 22 300 22 350 25 397 30 * 4 241 27 300 27 350 28 407 31
5 219 27 300 26 350 27 400 31 English–
Language Arts 6
* 7 221 228
35 28
300 300
35 28
350 350
36 30
405 409
39 34
8 235 29 300 29 350 30 407 33 9 243 27 300 26 350 27 407 30
* Including writing prompt
Mathematics
3 4 5 6 7
Algebra I
229 219 226 230 237 251
22 33 28 36 46 24
300 300 300 300 300 300
21 32 26 35 45 23
350 350 350 350 350 350
23 33 28 36 45 24
423 430 422 428 443 410
31 39 33 39 48 28
Science
5 8
10 Life Science
243 264 251
24 26 23
300 300 300
22 25 23
350 350 350
23 26 24
401 406 410
26 29 27
Scale Score CSEM for the 2011 Standards-based Tests in Spanish
Content Area Test Name
Below Basic
Min SS CSEM
Basic
Min SS CSEM
Proficient
Min SS CSEM
Advanced
Min SS CSEM
Reading/ Language Arts
2 3 4 5 6 7
242 251 256 271 260 256
14 15 14 17 18 16
300 300 300 300 300 300
13 14 13 16 17 15
350 350 350 350 350 350
14 14 14 16 17 16
386 393 387 401 401 399
17 17 16 19 19 18
Mathematics
2 3 4 5 6 7
217 229 243 245 251 257
19 18 19 26 24 24
300 300 300 300 300 300
17 16 18 25 22 22
350 350 350 350 350 350
18 17 18 24 22 22
417 421 420 416 403 415
23 21 22 26 23 23
134 2011 STAR Post-Test Guide August 2011 © 2011 by the California Department of Education