Embed Size (px)
Citation preview

Crescent Steel &Allied Products Ltd.
A N N U A L R E P O R T 2 0 1 0
PART OF A CHANGING WORLD.

Somebody once said that change is the only
constant thing in the world. Cultures and
societies have evolved over the years
embracing this change.
Today, a common man can purchase a
medication from the chemist’s shop which
Henry IV would have given a fortune to buy.
Annual Report 2010 is dedicated to the spirit
of innovation and how it shapes the Company,
the society and even the world at large.
Partofa changing world.

“To grow and enhance company value.”
“To gain and maintain cost and quality leadership
in the international competitive environment.”
“To promote best use and development of
human talent in a safe environment; as an equal
opportunity employer.”
“To conduct business as a responsible corporate
citizen, and to seek and support promising programs
from non-profit entities especially in the fields of
education, health and environment.”
Mission,Vision and Values

ContentsCompany Strategy 2
Company Information 3
Board of Directors 4
Board of Directors and its Committees 7
Management Committees 8
Shareholders’ Information 11
Company Profile 13
Our Governing Principles 17
Year in Brief 23
Key Figures 23
Statement of Value Added 25
Vertical Analysis 27
Horizontal Analysis 29
Directors’ Report 31
Chief Executive’s Review 39
Management Structure 68
Financial Highlights 69
Attendance at Board and Audit Committee Meetings 71
Statement of Compliance with the
Code of Corporate Governance 72
Review Report to the Members on Statement
of Compliance with Best Practices of
Code of Corporate Governance 74
Auditors’ Report to the Members 75
Separate Financial Statements 76
Statement of Value Added - Consolidated 150
Vertical Analysis - Consolidated 151
Horizontal Analysis - Consolidated 152
Directors’ Report - Consolidated 153
Financial Highlights - Consolidated 155
Auditors’ Report to the Members - Consolidated 157
Consolidated Financial Statements 158
Pattern of Holding of Shares 228
Notice of Annual General Meeting 232
Form of Proxy

Crescent Steel & Allied Products Ltd.
The economy is going through a modest recovery phase and it remains to be seen how our Government
takes measures to further stabilize the economy so that the gains over the past two years are not lost.
In these times, our corporate strategy is to focus on achieving growth and stabilizing efforts to enhance our
Company’s value through increase in revenue growth and financial efficiency by optimizing utilization of
our assets and continuously lowering our cost base.
We continue to believe that the engine for growth in Pakistan is an expanded and efficient engineering
sector. Our strategic thrust will be to expand in this area vertically as well as horizontally. We have
strategic interest in the energy and food sectors. Our thrust is to expand and grow in these sectors as well.
For our investment in the textile sector, the focus will be on consolidating our position by reducing costs
and improving productivity and optimizing available capacity to increase product offering.
On the technology front, we plan to fully leverage our enterprise resource planning system in order to
make our information processing more accurate and timely and to assist in strategic decision making.
Our people are our most valued assets and we believe that developing and retaining our human capital is at
the heart of our Company’s success.
Our operational strategy is focused on:
� Customer-driven company that stays close to customers in each of its markets
� Strong capital and financial position
� Conservative, sound risk management
� Disciplined expense control
� Ethical behavior, observing the letter and the spirit of rules and regulations
Corporate Strategy
AN
NU
AL R
EP
OR
T
2010
2

Company Information
AN
NU
AL R
EP
OR
T
2010
3
BOARD OF DIRECTORS
Mazhar Karim Chairman, Non-Executive DirectorAhsan M. Saleem Chief Executive & Managing DirectorJaved Iqbal Non-Executive Director (Independent)Muhammad Abdul Aleem Non-Executive Director (Independent)Mohammad Anwar Non-Executive DirectorNasir Shafi Non-Executive DirectorS.M. Ehtishamullah Non-Executive DirectorZahid Bashir Non-Executive Director
M. Saad Thaniana Company Secretary
AUDIT COMMITTEE
Muhammad Abdul Aleem ChairmanJaved Iqbal
Nasir Shafi
Ernst & Young Ford Rhodes Sidat Hyder & Co. Head of Internal Audit(Sharjeel Jamil Ahmed - Engagement Partner)
HUMAN RESOURCE COMMITTEE
Ahsan M. Saleem ChairmanJaved Iqbal
Nasir Shafi
THE MANAGEMENT
Chief Executive &
Managing Director
Ahsan M. Saleem, 57
1983*
Chief Financial Officer
M. Saad Thaniana, 43
2007*
BU Head – Steel Division
Iqbal Zafar Siddiqui, 60
2008*
BU Head – Cotton Division
Abdul Rouf, 50
2000*
Human Resource Advisor
Ehsan Durrani, 62
2008*
Head of Marketing
Steel Division
Arif Raza, 48
1985*
* Year joined Company

Crescent Steel & Allied Products Ltd.
Board of Directors
AN
NU
AL R
EP
OR
T
2010
4 Mr. Ahsan M. SaleemChief Executive Officer
Joined Board
01 August 1983
Other Engagements
Chief Executive Officer� Shakarganj Mills Limited
Director� Pakistan Centre for Philanthropy
� The Citizens Foundation
Mr. Mazhar KarimChairman (Non-Executive)
Joined Board
01 August 1983
Other Engagements
Chairman� Crescent Jute Products Limited
� Crescent Sugar Mills & Distillery
Limited
� Shakarganj Mills Limited
Mr. Javed IqbalFCMA (UK), FCMA (PAK)
Director (Non-Executive, Independent)
Joined Board
23 October 2002
Other Engagements
Chief Executive Officer� THK Associates (Pvt) Limited
Director� AZFAM Technologies (Pvt) Limited
� SAMBA Bank Limited
� Wyeth Pakistan Limited

Board of Directors
AN
NU
AL R
EP
OR
T
2010
5Mr. Mohammad AnwarDirector (Non-Executive)
Joined Board
17 September 2001
Other Engagements
Director� Equity International Limited
Executive Vice President� Saudi Pak Industrial and Agriculture
Investment Company Limited
Mr. Muhammad Abdul AleemFCA, FCMA
Director (Non-Executive, Independent)
Joined Board
22 May 2009
Other Engagements
Chairman� Faysal Asset Management Limited
Director� Pakistan Institute of Corporate
Governance
� Dawood Hercules Chemicals Limited
Mr. Nasir ShafiDirector (Non-Executive)
Joined Board
01 August 1983
Other Engagements
Chief Executive Officer� Crescent Bahuman Limited
Director� The Crescent Textile Mills Limited

Crescent Steel & Allied Products Ltd.
Board of Directors
AN
NU
AL R
EP
OR
T
2010
6 Mr. Zahid BashirDirector (Non-Executive)
Joined Board
01 August 1983
Other Engagements
Chairman� Equity Textile Mills Limited
� Mohammad Amin Mohammad
Bashir Limited
� Premier Financial Services (Pvt)
Limited
� Premier Insurance Co. of Pakistan
Limited
Director� Crescent Powertec Limited
Mr. S.M. EhtishamullahFCA
Director (Non-Executive)
Joined Board
30 January 2000
Muhammad Saad ThanianaFCA, ACMA
Company Secretary & Chief Financial Officer
Joined Board
01 March 2008
Other Engagements
Director� Safeway Mutual Fund Limited
� Shakarganj Food Products Limited
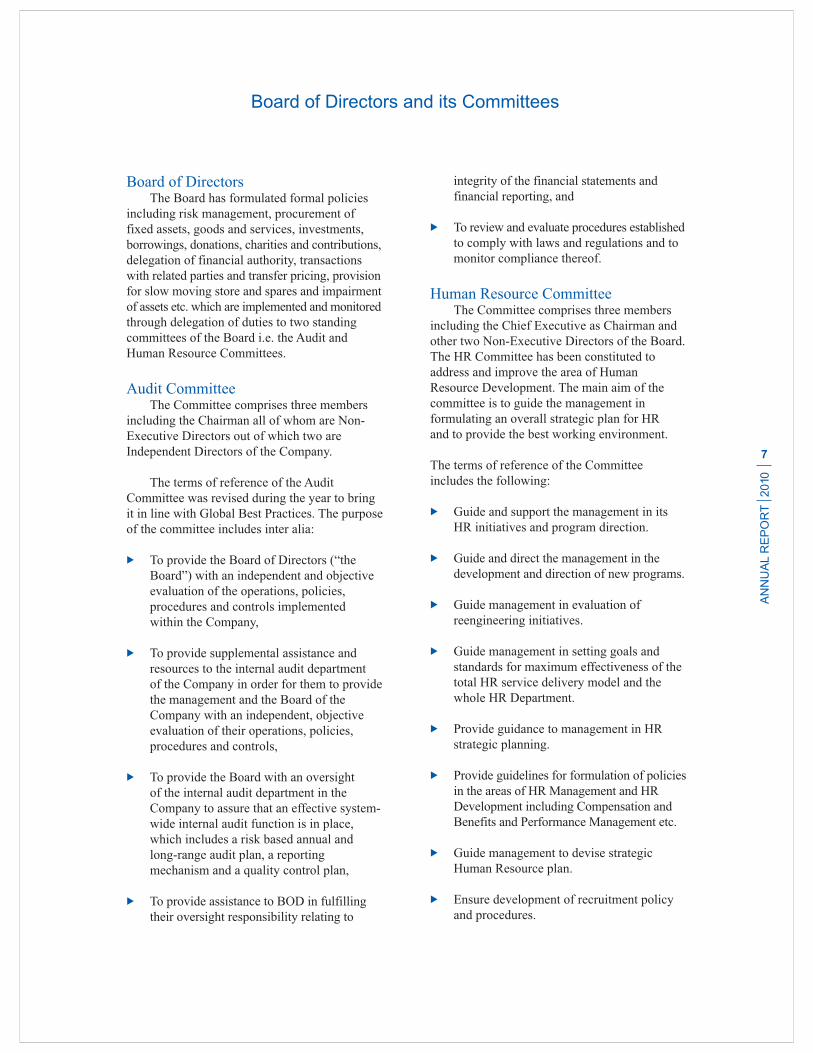
Board of DirectorsThe Board has formulated formal policies
including risk management, procurement of
fixed assets, goods and services, investments,
borrowings, donations, charities and contributions,
delegation of financial authority, transactions
with related parties and transfer pricing, provision
for slow moving store and spares and impairment
of assets etc. which are implemented and monitored
through delegation of duties to two standing
committees of the Board i.e. the Audit and
Human Resource Committees.
Audit CommitteeThe Committee comprises three members
including the Chairman all of whom are Non-
Executive Directors out of which two are
Independent Directors of the Company.
The terms of reference of the Audit
Committee was revised during the year to bring
it in line with Global Best Practices. The purpose
of the committee includes inter alia:
� To provide the Board of Directors (“the
Board”) with an independent and objective
evaluation of the operations, policies,
procedures and controls implemented
within the Company,
� To provide supplemental assistance and
resources to the internal audit department
of the Company in order for them to provide
the management and the Board of the
Company with an independent, objective
evaluation of their operations, policies,
procedures and controls,
� To provide the Board with an oversight
of the internal audit department in the
Company to assure that an effective system-
wide internal audit function is in place,
which includes a risk based annual and
long-range audit plan, a reporting
mechanism and a quality control plan,
� To provide assistance to BOD in fulfilling
their oversight responsibility relating to
integrity of the financial statements and
financial reporting, and
� To review and evaluate procedures established
to comply with laws and regulations and to
monitor compliance thereof.
Human Resource CommitteeThe Committee comprises three members
including the Chief Executive as Chairman and
other two Non-Executive Directors of the Board.
The HR Committee has been constituted to
address and improve the area of Human
Resource Development. The main aim of the
committee is to guide the management in
formulating an overall strategic plan for HR
and to provide the best working environment.
The terms of reference of the Committee
includes the following:
� Guide and support the management in its
HR initiatives and program direction.
� Guide and direct the management in the
development and direction of new programs.
� Guide management in evaluation of
reengineering initiatives.
� Guide management in setting goals and
standards for maximum effectiveness of the
total HR service delivery model and the
whole HR Department.
� Provide guidance to management in HR
strategic planning.
� Provide guidelines for formulation of policies
in the areas of HR Management and HR
Development including Compensation and
Benefits and Performance Management etc.
� Guide management to devise strategic
Human Resource plan.
� Ensure development of recruitment policy
and procedures.
Board of Directors and its Committees
AN
NU
AL R
EP
OR
T
2010
7
Crescent Steel & Allied Products Ltd.
Executive CommitteeChairman Ahsan M. Saleem
Muhammad Saad Thaniana
Iqbal Zafar Siddiqui
This Committee devises long term policies and visions for the Company with the sole objective for
providing the best returns to shareholders by optimum allocation of existing resources. The Committee is
also responsible for review of Company’s operation on ongoing basis, establishing and ensuring adequacy
of internal controls and monitoring compliance of key policies. Executive committee meets on quarterly
basis. Terms of reference of the committee include the following:
� Prepare, approve and keep an updated long term plan
� Provide guidelines to the Business Strategy Committee for medium and short term tactics.
� Discuss new ideas and new business lines, new product lines, new markets, and / or refer new
opportunities and feasible ideas to another committee for refinement.
� To analyze current market situation with a view to maintain sustainable competitive advantage.
� To discuss in detail the plans of the Group and accordingly adjust the policies of the company to avoid
any conflict.
� Analyze any group investment opportunities and refer to investment committee if required.
Business Strategy CommitteeChairman Ahsan M. Saleem
Muhammad Saad Thaniana
Abdul Rouf
Iqbal Zafar Siddiqui
Arif Raza
This Committee is responsible for formulation of business strategy, review of risks and their mitigation plan.
Further, the Committee is also responsible for staying abreast of developments and trends in the Industry to
assist the Board in planning for future capital intensive investments and growth of the Company. The committee
meets at least twice a year. The terms of reference include the following:
� Prepare, approve and recommend to the Board a framework of business strategy.
� To develop and approve medium term plan(s) to meet interim objectives and milestone for any long term
project approved by the Executive Committee.
� Review the progress of different new projects of the company.
� Approve short term goals which will be qualitative and quantitative for different segments of the company.
� Review periodically the targets achieved and revise the operational targets if required.
� Review allocation of resources to different segments such as investments, core business etc.
� Gather information of the competitors’ business and prepare an updated SWOT analysis of the company,
to be submitted to the Executive Committee.
Management Committees
AN
NU
AL R
EP
OR
T
2010
8

System and Technology CommitteeChairman Ahsan M. Saleem
Muhammad Saad Thaniana
Shahid H. Mir
The System and Technology Committee monitors the implementation of IT Strategy on a regular basis. It
ensures that CSAPL stays current with the evolving new technologies and Information System Processes. The
Committee prepares long term IT plan including fostering an IT culture at all levels. Terms of reference of the
committee include the following:
� Guide the IS Department and Management in preparing the IT Strategy of the Company in a cost effective
manner.
� Monitor the implementation of the IT Strategy on a regular basis.
� Ensure that CSAPL stays current with the evolving new technologies and the latest Information System
Processes as applicable to the business and growth of CSAPL.
� Provide the basis for preparing long term IT plans while not losing sight of the immediate goals and
objectives.
� Facilitate the promotion of IT Culture in the company at all levels. This has been done by traditional
training interventions including company wide workshops at all levels.
� Assist the Board to ensure that the IT vision provided by the Board is manifested in the IT Strategy and its
subsequent implementation
Investment CommitteeChairman Ahsan M. Saleem
Muhammad Saad Thaniana
Mohammad Yamin
This Committee helps to maintain a balanced portfolio of investments and maximize returns while keeping
risk at a desirable level. Terms of reference of the committee include the following:
� Determine the sector wise weightage of the portfolio based on market condition.
� Assess and monitor the risk associated to the portfolio.
� Review the performance of the investment and take decision relating to scrip wise entry and exit.
Social Investment CommitteeChairman Muhammad Saad Thaniana
Iqbal Zafar Siddiqui
Abdul Rouf
This Committee will review the distribution of charitable contribution in line with Company’s Policy for
donations, charities and contributions. Terms of reference of the committee include the following:
� Review and recommend any changes to Company’s policy relating to Corporate Social Responsibility
for the approval of BOD.
� Review and recommend the distribution of charitable contribution in line with the Corporate Social
Responsibility policy.
Management Committees
AN
NU
AL R
EP
OR
T
2010
9

At the rate of 45.45 (0.5%) baud - considered speedy at the time it
was invented - up to 25 telex channels could share a single long-
distance telephone channel by using voice frequency telegraphy
multiplexing, making telex the least expensive method of reliable
long-distance communication.
The world's first e-mail message
was sent in 1971 by Ray
Tomlinson. This changed the
face of communication forever.
According to the latest estimates
35 Billion e-mails are sent each
day throughout the world.
Designed to be folded to make its own
envelope, the aerogram was first introduced
during World War II as a convenient way
of writing to overseas military personnel.
From letter writing to
video conferencing,
all the locations and
departments of CSAPL
across Pakistan are
connected through
Audio and Video links.
Fax machines transmit images or text, using
regular phone lines. Part of the wonderful
world of digital technology,
they virtually replaced
mail by the Post Office.

Crescent Steel & Allied Products Ltd.
Stock Exchange ListingCrescent Steel and Allied Products Limited is a
listed Company and its shares are traded on all the
three stock exchanges of Pakistan.
The Company’s share is quoted in leading dailies
under the Industrial metals and Mining Sector.
Public InformationFinancial analysts, stock brokers, interested
investors and financial media desiring information
about ‘Crescent Steel’ should contact Mohammad
Yamin at the Company’s Principal Office, Karachi.
Telephone: 021-35674881-5
E.mail: [email protected]
Shareholders’ InformationEnquiries concerning lost share certificates,
dividend payments, change of address, verification
of transfer deeds and share transfers should be directed
to the M/s CorpTec Associates (Private) Limited, 7/3-G,
Mushtaq Ahmed Gurmani Road, Gulberg-II, Lahore.
Telephone: 042-35788097-98 Fax: 042-35755215
Email: [email protected]
ProductsSteel Division
Manufacturer of DSAW steel line pipes in
diameters ranging from 8” to 90” and applicator of
multi-layer polyolefin coating conforming to
international standards.
Cotton Division
Manufacturer of quality cotton yarn of various
counts of 10s to 80s.
Annual MeetingThe 26th Annual General Meeting of Crescent
Steel and Allied Products Limited will be held on
Tuesday, 31 August 2010 at 11:30 am at Qasr-e-Noor,
9 E-2, Main Boulevard, Gulberg-III, Lahore.
AuditorsKPMG Taseer Hadi & Co.
Legal AdvisorHassan & Hassan, Advocates, Lahore
BankersAllied Bank Limited
Barclays Bank PLC, Pakistan
Habib Metropolitan Bank Limited
HSBC Bank Middle East Limited
MCB Bank Limited
Standard Chartered Bank (Pakistan) Limited
Registered Office10th Floor, BOP Tower, 10-B, Block E-2, Main
Boulevard, Gulberg-III, Lahore.
Telephone: 042-35783801-2, 042-35783811
Liaison Office Lahore10th Floor, BOP Tower, 10-B, Block E-2, Main
Boulevard, Gulberg-III, Lahore.
Telephone: 042-35783801-4 Fax: 042-35870357
E.mail: [email protected]
Principal Office9th Floor, Sidco Avenue Centre,
264 R.A. Lines, Karachi-74200.
Telephone: 021-35674881-5 Fax: 021-35680476
E.mail: [email protected]
URL: www.crescent.com.pk
Steel DivisionPipe & Coating Plant
A/25, S.I.T.E., Nooriabad, District Jamshoro, Sindh.
Telephone: 025-4670020-2
E.mail: [email protected]
Engineering Unit
17 Km Summundri Road, Dalowal, District
Faisalabad, Punjab.
Telephone: 041-2569825 Fax: 041-2569826
Mills-Cotton DivisionCrescent Cotton Products (Spinning Unit)
1st Mile, Lahore Road, Jaranwala,
District Faisalabad, Punjab.
Telephone: 041-4313799, 4312899, 4311741
Fax: 041-4315475
E.mail: [email protected]
Shareholders’ Information
AN
NU
AL R
EP
OR
T
2010
11

The earliest wells are known from the submerged
Pre-Pottery Neolithic times in the Middle East, which
so far is the oldest known. These were community
wells where people went to get water from.
Reliable steel pipelines
extending several
kilometers has made
it possible for water to
travel to various locations
across Pakistan.
Hand pumps used human power and mechanical
advantage to move water from one place to
another. They were widely used in every country
in the world for a variety of industrial, marine and
irrigation activities.
Tubewells were born as an answer
to the farmers’ demand for properly
distributed irrigational water.
The ultimate goal of
Crescent Steel is to
provide the entire
population, including
the people below
poverty line, with
treated water through
pipelines, at their
door-step.
Crescent Steel & Allied Products Ltd.
Crescent Steel and Allied Products Limited
is a Public Limited Company listed on all the
Stock Exchanges of Pakistan. It started commercial
production in March 1987. The manufacturing
facilities consist of a Spiral Pipe Production line
and a multi-layer Polyolefin and stand-alone
Epoxy Coating line, both located side by side at
the Sindh Industrial Trading Estate, Nooriabad in
Jamshoro district of Sindh and a Cotton Spinning
Unit of 19,680 spindles CCP-I and 25,344 spindles
CCP-II at Jaranwala, Faisalabad.
Company’s Investment and Infrastructure
Development Division manages an investment
portfolio and real estate.
Crescent Steel and Allied Products Limited
is an equal opportunity employer with a sense
of social responsibility and strongly supports
education, healthcare and environmental causes.
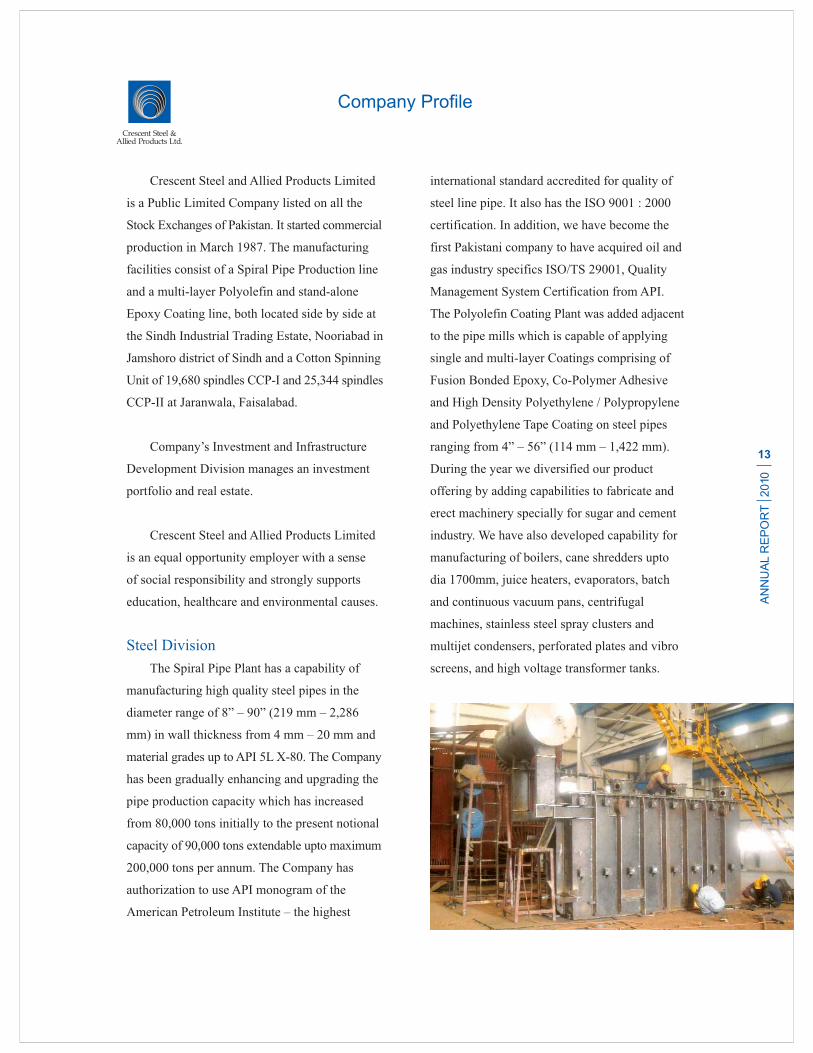
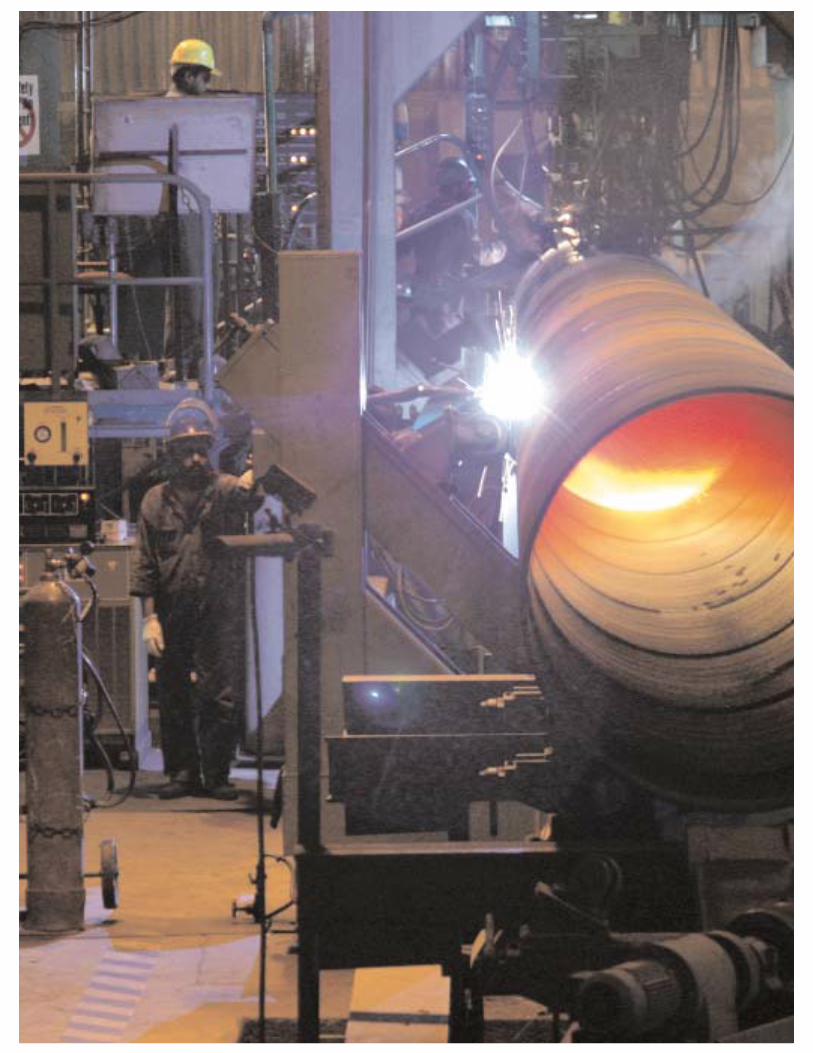
Steel Division
The Spiral Pipe Plant has a capability of
manufacturing high quality steel pipes in the
diameter range of 8” – 90” (219 mm – 2,286
mm) in wall thickness from 4 mm – 20 mm and
material grades up to API 5L X-80. The Company
has been gradually enhancing and upgrading the
pipe production capacity which has increased
from 80,000 tons initially to the present notional
capacity of 90,000 tons extendable upto maximum
200,000 tons per annum. The Company has
authorization to use API monogram of the
American Petroleum Institute – the highest
international standard accredited for quality of
steel line pipe. It also has the ISO 9001 : 2000
certification. In addition, we have become the
first Pakistani company to have acquired oil and
gas industry specifics ISO/TS 29001, Quality
Management System Certification from API.
The Polyolefin Coating Plant was added adjacent
to the pipe mills which is capable of applying
single and multi-layer Coatings comprising of
Fusion Bonded Epoxy, Co-Polymer Adhesive
and High Density Polyethylene / Polypropylene
and Polyethylene Tape Coating on steel pipes
ranging from 4” – 56” (114 mm – 1,422 mm).
During the year we diversified our product
offering by adding capabilities to fabricate and
erect machinery specially for sugar and cement
industry. We have also developed capability for
manufacturing of boilers, cane shredders upto
dia 1700mm, juice heaters, evaporators, batch
and continuous vacuum pans, centrifugal
machines, stainless steel spray clusters and
multijet condensers, perforated plates and vibro
screens, and high voltage transformer tanks.
Company Profile
AN
NU
AL R
EP
OR
T
2010
13

In oldern days people cooked
over an open fire usually
fuelled by wood.
Kerosene stoves were the next step when
kerosene oil replaced wood as the main
fuel. This was the beginning of the next
generation of cooking appliances.
Household stoves started to become
more sophisticated and advanced to
aid cooking at home without the hassle
of additional heat and smoke resulting
from burning wood.
Crescent Steel pipes
make natural gas
accessible to home
and factories
in Pakistan.
The first gas stoves were developed as early as
the 1820s, but these remained isolated experiments.
At the World Fair in London in 1851, a gas stove
was shown, but only in the 1880s did this technology
start to become a commercial success. The main
factor for this delay was the slow growth of the gas
pipe network.

Crescent Steel & Allied Products Ltd.
Crescent Steel maintains high quality norms in
all its products and has consistently exceeded the
requirements of international standards both in
steel line pipe and multi-layer coatings and will
continue to remain at the cutting edge in terms of
technology, quality control and quality assurance.
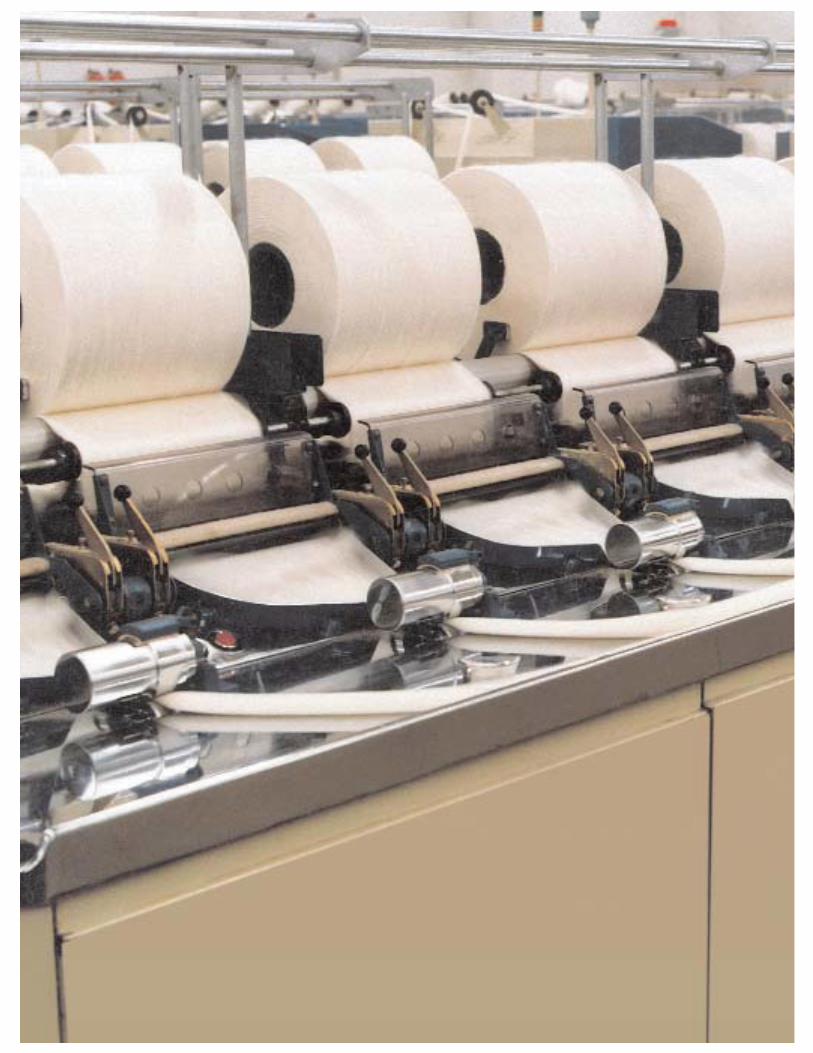
Cotton Division
In the year 2000, the Company acquired a
running cotton spinning mill located at Jaranwala
near Faisalabad, which is the hub of textile
industry and carries out this activity under the
name and title of “Crescent Cotton Products”
(CCP) a division of Crescent Steel and Allied
Products Limited. CCP is a division of the
Company but its operating results are shown
separately. CCP as a division holds ISO 9001 :
2000 Quality Management Credential. CCP
produces good quality cotton yarn of various
counts from 10s to 80s having a notional capacity
based on 20s of 6.5 and 9.3 million kgs per annum
in CCP-I and CCP-II respectively and its products
are consistently in demand and generally sold at
a premium.
Investment and Infrastructure
Development Division
The division manages an investment
portfolio in shares and other securities, across
diversified sectors and real estate. Our strategy
has been to focus on those sectors and projects
which have potential for growth and where real
investments are being made.
Company Profile
AN
NU
AL R
EP
OR
T
2010
15

Shipment of thousand of barrels of oil over land is carried
out by trains across various parts of the country.
Oil Trucks typically take on the final steps of distribution,
transporting products -- ranging from gasoline to jet fuel
to heating oil -- from refinery to the customers.
Since the first oil tanker began shipping oil
in 1878 in the Caspian Sea, the capacity of
the world's maritime tanker fleet has grown
substantially. As of 2005, about 2.4 billion
tons of petroleum were shipped by maritime
transportation, which is roughly 62% of all
the petroleum produced.
Today, oil is
transported to
refineries through
carefully laid pipelines,
where it is treated and
transported once again
to residential and
industrial consumers.
The first places that sold
gasoline / petrol were
pharmacies, as a side
business. The first gas /
petrol station was a city
pharmacy in Germany.

Crescent Steel & Allied Products Ltd.
CSAPL conducts its business in a responsible
manner and with honesty, and integrity. We also
have the same expectations from all those with
whom we have relationships. We insist on doing
what is right which sets the tone of our actions
and underpins the functioning of our employees.
We also insist that all transactions be open,
transparent and with in the legal framework
culminating in responsible financial reporting.
Integrity
CSAPL does not use bribe as an instrument
for any business or financial gain. Employees
are not authorized to give or receive any gift
or payment which may be construed as such.
Employees are also required to avoid
engaging in any personal activity or financial
interests which would conflict with their
responsibility to the Company.
Role of the Board of Directors
The Board has a fiduciary responsibility for
the proper direction and control of the activities
of the Company. This responsibility includes
such areas of stewardship as the identification
and control of the Company’s business risks, the
integrity of management information systems
and clear, transparent reporting to shareholders.
The Board accepts its primary responsibility
for the overall control architecture of the Company.
However, it recognizes that the internal control
system has to be cost effective and that no cost
effective system will preclude all errors or
irregularities. The system is based upon written
procedures, policies, guidelines, an organogram
that provides an appropriate division of
responsibility, a programme of internal audit,
manning of all key functions by qualified
personnel and constant training.
Code of Conduct
The Board has adopted a code of conduct
for its members, executives and staff, specifying
the business standards and ethical considerations
in conducting its business. The code includes:
� Corporate governance
� Relationship with employees, customers and regulators
� Confidentiality of information
� Trading in Company’s shares
� Environmental responsibilities
Board Committees
The Board has constituted an Audit
Committee and a Human Resource Committee
to review and improve the current human
resource architecture.
Audit Committee
The Audit Committee operates under a
charter approved by the Board. The governing
Our Governing Principles
AN
NU
AL R
EP
OR
T
2010
17

Financial records were initially maintained
on paper. Most of the calculations were
done manually.
The first calculating machine was invented in France in
1642 and could add and subtract figures automatically.
The introduction of hand-held calculator made everyday
math and accounting really simple and easy.
Just about everything in the world today has been
affected by technology. Particularly, accounting.
Accounting softwares has made it much easier to
deal with, by saving all the information one enters
into the system and distributing the data amongst
all the proper locations.
Crescent Steel has
state-of-the-art Oracle
E-Business suite which
makes full office auto -
mation possible. Online
details from purchase
to manufacturing and
marketing to finance
are updated regularly
to keep real time
record of business.

Crescent Steel & Allied Products Ltd.
charter of the Audit Committee addresses the
requirement of the code of corporate governance
issued by the SECP and includes the requirements
of best practices. The Committee is accountable
to the Board for the recommendation of appointment
of external auditors, directing and monitoring the
audit function and reviewing the adequacy and
quality of the audit process. CEO and the CFO are
responsible for the accuracy of financial information
for inclusion in the annual report; the Committee
provides the Board with additional assurance.
The Committee also ensures that the Company
has an effective internal control framework.
These controls include safe-guarding of assets,
maintaining of proper accounting records
complying with legislation and ensuring the
reliability of financial information.
HR Committee
The HR Committee has been constituted to
address and improve the crucial area of human
resource development. The Committee has framed
a terms of reference and its aim is to guide the
management in formulating an overall strategic
plan for HR, in developing new program initiatives
and formulation of policies. In short to ensure the
attainment of the maximum effectiveness from the
overall HR service delivery system.
Management Structure
The Company has three distinct business
units, a Steel Division, a Cotton Division and
an Investment and Infrastructure Development
Division. The accounting for these units is done
separately in an arms length manner to arrive at
the true profit before tax for each unit. Three
business unit heads and three corporate functional
heads as defined in the management structure
with clear responsibility and authority matrix
have direct reporting lines to the Chief Executive
Officer. Limits of authority at all levels are clearly
defined in our control manual. The Internal Audit
function is responsible to monitor compliance
with the manual.
Responsibility to Stakeholders
Our primary purpose is to run our business
efficiently and profitably to enhance shareholders’
value but we do it with responsibility to all
stakeholders. Profitability is essential to discharge
this responsibility and the corporate resources are
primarily deployed in the achievement of this end.
However the Company does not operate in
isolation with its environment and accordingly
feels responsible to all stakeholders which are:
� Our Shareholders
� Our Customers
� Our People
� Our Business Partners
� Our Society
Our Governing Principles
AN
NU
AL R
EP
OR
T
2010
19

In 1995, a group of concerned
citizens realized the need for making
education accessible to everyone.
The Citizens Foundation was born.
The vision of TCF is to remove
barriers of class and privilege
and to make the citizens of
Pakistan Agents of Positive
Change. We believe that
access to basic education
is the right of each child and
not a privilege.
All TCF schools are established in state-of-art purpose-
built premises to provide students with a stimulating
learning environment. As of 2010 TCF has established
660 purpose-built school units nationwide with an
enrollment of 92,000 students. Crescent Steel has
been associated with TCF since its inception.
Whereas Crescent Steel
is proud to be associated
with TCF on the one
hand, on the other it
also directly carries the
light of learning holding
regular Training and
Education sessions
for its factory staff.

Crescent Steel & Allied Products Ltd.
Service to Society
We are increasingly conscious of the role we
have to play as responsible corporate citizens in
fulfilling a wide variety of community needs.
We believe in “giving something back” by helping
address issues such as education, healthcare,
public safety, environmental health etc. This is
also arising from our basic belief that individual
entities when they work together can create powerful
synergies and help to improve the conditions of
the societies in which they are operating.
These principles are not just put forth on
paper but we have over the years actively strived
to promote issues of education, health and
environment. Major portion of our budget for
philanthropy and sponsorship is allocated to primary
and secondary schooling for less privileged children.
Health, Safety and Environment
Maintenance of health and safety standards
at our plants and offices is a serious issue at
CSAPL. We are committed to actively managing
health and safety risks associated with our business
and are actively working towards improving our
procedures to reduce, remove or control the risk
of fire, accidents or injuries to employees and
visitors. We also ensure that our products are
shipped in a safe manner complying with the
safety standards and legal requirements.
Role of Shareholders
The Board aims to ensure that shareholders
are informed of all major developments affecting
the Company’s state of affairs. Information is
communicated to the shareholders in the annual
report and the interim quarterly reports. The
Board encourages the shareholders’ participation
at the Annual General Meetings to ensure a high
level of accountability. The Company’s financial
statements are available on the Company’s
website and an officer is designated to answer
all shareholder enquiries.
Our Governing Principles
AN
NU
AL R
EP
OR
T
2010
21

Crescent Steel & Allied Products Ltd.
� The company acquired a 100% stake in
Shakarganj Energy (Private) Limited on 4
January 2010 to build, own, operate and
maintain a bagasse fired thermal generation
power plant
� During the year we diversified our product
offering by adding capabilities to fabricate and
erect machinery specially for sugar and cement
industry
� As part of our drive for vertical integration, we
installed a slitting line at our Pipe plant, Nooriabad
� During the year, we developed the capability
of internal epoxy coating of steel line pipe
� The capacity utilization of pipe plant was 63.6%
as compared to 41.6 % last year.
� The Company satisfactorily complied with the
requirements of ISO 14001:2004 & OHSAS
18001:2007 standards this year
� The annual report 2008 of our company
secured the 2nd runners up position in the
manufacturing sector category in the “Best
Presented Accounts Awards 2008” organized
by SAFA
� The company’s performance was
acknowledged by the premier stock exchange of
the country by including Crescent Steel in the
top 25 companies for the year 2008
KEY FIGURES2010 2009
Sales revenue Rs. in million 3,704 3,311
Profit / (loss) after tax Rs. in million 417 (399)
No. of Shares Outstanding No. in million 56.5 56.5
Earnings / (loss) per share - Basic and diluted Rs. 7.38 (7.06)
Dividend
- cash Rs./share 3.0 –––
- bonus (%) ––– –––
Return on average capital employed (%) 21.0 (1.5)
Current ratio 1.2:1 1.2:1
Shareholders’ equity Rs. in million 2,623 2,329
Total assets Rs. in million 4,436 3,893
Capital expenditure Rs. in million 35 169
Price earning ratio 3.4 –––
Break-up value per share Rs. 46.5 41.2
Employees 1,222 1,203
Year in Brief
AN
NU
AL R
EP
OR
T
2010
23


Crescent Steel & Allied Products Ltd.
2010 2009
Rupees in Rupees in
'000 % '000 %
WEALTH GENERATED
Total revenue 4,131,189 100% 3,307,598 100%
Bought-in-material and services (2,677,264) 65% (2,196,605) 66%
1,453,925 35% 1,110,993 34%
WEALTH DISTRIBUTED
To Employees
Salaries, benefits and other costs 242,295 17% 200,872 18%
To Government
Income tax, sales tax, custom duty,
WWF and WPPF 499,185 34% 520,373 47%
To Society
Donation towards education, health and environment 18,280 1% 6,667 1%
To Providers of Capital
Dividend to Shareholders 169,380 12% –––
Mark-up/interest expense on borrowed funds 121,908 8% 203,571 18%
Retained for reinvestment and future growth
Depreciation, amortization and retained profit 402,877 28% 179,510 16%
1,453,925 100% 1,110,993 100%
Statement of Value Added
For the year ended 30 June 2010
AN
NU
AL R
EP
OR
T
2010
25


Crescent Steel & Allied Products Ltd.
2010 % 2009 % 2008 % 2007 % 2006 %
Operating Results (Rupees in million)
Sales - Net 3,704 100.0 3,311 100.0 4,200 100.0 2,950 100.0 1,707 100.0
Cost of sales 2,887 77.9 2,597 78.4 3,304 78.7 2,440 82.7 1,567 91.8
Gross profit 817 22.1 714 21.6 896 21.3 510 17.3 140 8.2
Income from/(loss on) investments - net 172 4.6 (338) (10.2) 74 1.8 411 13.9 333 19.5
Distribution, selling and
administrative expenses 186 5.0 144 4.3 151 3.6 147 5.0 119 6.9
Other operating expenses 101 2.7 332 10.0 110 2.6 126 4.3 22 1.3
Other operating income 18 0.5 39 1.2 20 0.5 107 3.6 25 1.4
Operating profit/(loss) before finance costs 720 19.4 (61) (1.8) 729 17.4 757 25.6 357 20.9
Finance costs 122 3.3 204 6.1 153 3.6 128 4.4 83 4.9
Share of profit/(loss) in equity
accounted investees - net ––– ––– ––– ––– 51 1.2 99 3.4 (12) (0.7)
Profit/(loss) before taxation 598 16.1 (265) (8.0) 627 14.9 727 24.7 262 15.4
Taxation 181 4.9 135 4.1 211 5.0 64 2.2 3 0.2
Net income/(loss) 417 11.2 (400) (12.1) 416 9.9 663 22.5 260 15.2
Balance Sheet (Rupees in million)
Property, plant and equipment 1,061 23.9 1,225 31.5 1,233 25.4 1,307 27.8 1,381 37.2
Investments including investment property 1,711 38.6 1,639 42.1 2,737 56.5 2,300 49.0 1,313 35.3
Other non current assets 28 0.6 5 0.1 5 0.1 5 0.1 7 0.2
Current assets (excluding investments) 1,636 36.9 1,024 26.3 871 18.0 1,084 23.1 1,014 27.3
Total assets 4,436 100.0 3,893 100.0 4,847 100.0 4,696 100.0 3,715 100.0
Shareholders' equity 2,623 59.1 2,329 59.8 2,994 61.8 3,200 68.2 2,038 54.9
Long term debt (excluding current maturity) ––– ––– 56 1.4 168 3.5 354 7.5 548 14.8
Deferred liabilities 72 1.6 100 2.6 112 2.3 65 1.4 2 –––
Short term debt (including current
maturity of long term debt) 836 18.9 1,015 26.1 1,306 27.1 626 13.3 877 23.6
Other current liabilities 905 20.4 393 10.1 267 5.4 451 9.6 250 6.7
Total equity and liabilities 4,436 100.0 3,893 100.0 4,847 100.0 4,696 100.0 3,715 100.0
Cash Flows (Rupees in million)
Cash generated from operations 816 560.8 751 405.4 906 106.0 630 350.0 30 16.3
Net cash generated from/(used in)
operating activities 451 310.1 336 181.4 566 66.2 486 270.0 (88) (47.8)
Net cash inflows/(outflows)
from investing activities 3 2.3 71 38.6 (893) (104.5) (392) (217.8) (778) (422.8)
Net cash (outflows)/inflows
from financing activities (309) (212.4) (222) (120.0) (528) (61.8) 86 47.8 682 370.7
Net increase/(decrease) in cash
and cash equivalents 146 100.0 185 100.0 (855) (100.0) 180 100.0 (184) (100.0)
* Note: The figures presented in this analysis for the financial years ended 30 June 2010 and 2009 are those based on the Company's separate financial statements
(please refer to note 2.1 to the financial statements for further information). The figures presented for the years prior to 2009 are based on the Company's individual
financial statements as published in the annual reports in prior years.
Vertical Analysis
AN
NU
AL R
EP
OR
T
2010
27

Crescent Steel & Allied Products Ltd.
2010 Variance 2009 Variance 2008 Variance 2007 Variance 2006 Variance
vs Last vs Last vs Last vs Last vs Last
Year Year Year Year Year
Increase / Increase / Increase / Increase /
(Decrease) (Decrease) (Decrease) (Decrease)
% % % %
Operating Results (Rupees in million)
Sales - Net 3,704 11.9 3,311 (21.2) 4,200 42.4 2,950 72.8 1,707 (36.5)
Cost of sales 2,887 11.2 2,597 (21.4) 3,304 35.4 2,440 55.7 1,567 (32.3)
Gross profit 817 14.5 714 (20.4) 896 75.6 510 263.8 140 (62.3)
Income from/(loss on) investments - net 172 150.8 (338) (559.1) 74 (82.1) 411 23.6 333 88.7
Distribution, selling and
administrative expenses 186 29.5 144 (4.8) 151 2.9 147 23.6 119 9.5
Other operating expenses 101 (69.4) 332 202.1 110 (12.6) 126 474.1 22 (68.8)
Other operating income 18 (53.1) 39 99.1 20 (81.7) 107 335.7 25 (72.0)
Operating profit/(loss) before finance costs 720 1,289.4 (61) (108.3) 729 (3.7) 757 111.8 357 (21.9)
Finance costs 122 (40.1) 204 33.0 153 19.1 128 54.9 83 88.7
Share of profit/(loss) in equity
accounted investees - net ––– ––– ––– ––– 51 (48.8) 99 931.5 (12) (38.9)
Profit/(loss) before taxation 598 325.4 (265) (142.3) 627 (13.8) 727 177.2 262 (33.4)
Taxation 181 34.4 135 (36.2) 211 228.9 64 2,199.1 3 (96.6)
Net income/(loss) 417 204.2 (400) (196.2) 416 (37.3) 663 155.4 260 (16.9)
Balance Sheet (Rupees in million)
Property, plant and equipment 1,061 (13.3) 1,225 (0.7) 1,233 (5.6) 1,307 (5.4) 1,381 212.6
Investments including investment property 1,711 4.4 1,639 (40.1) 2,737 19.0 2,300 75.3 1,313 (12.6)
Other non current assets 28 505.4 5 (5.1) 5 (4.1) 5 (26.0) 7 (26.3)
Current assets (excluding investments) 1,636 59.7 1,024 17.5 871 (19.6) 1,084 6.9 1,014 64.6
Total assets 4,436 14.0 3,893 (19.7) 4,847 3.2 4,696 26.4 3,715 44.6
Shareholders' equity 2,623 12.6 2,329 (22.2) 2,994 (6.4) 3,200 57.1 2,038 9.5
Long term debt (excluding current maturity) - (100.0) 56 (66.8) 168 (52.5) 354 (35.4) 548 132.2
Deferred liabilities 72 (28.3) 100 (10.5) 112 72.7 65 3,850.1 2 (57.9)
Short term debt (including current
maturity of long term debt) 836 (17.6) 1,015 (22.3) 1,306 108.7 626 (28.6) 877 275.6
Other current liabilities 905 130.3 393 47.3 267 (40.9) 451 80.4 250 6.3
Total equity and liabilities 4,436 14.0 3,893 (19.7) 4,847 3.2 4,696 26.4 3,715 (44.6)
Cash Flows (Rupees in million)
Cash generated from operations 816 8.7 751 (17.1) 906 43.8 630 2,000.0 30 (88.8)
Net cash generated from/(used in)
operating activities 451 34.3 336 (40.6) 566 16.5 486 646.1 (89) (147.6)
Net cash inflows/(outflows) from
investing activities 3 (95.3) 71 108.0 (893) (127.9) (392) 49.6 (778) 1,241.4
Net cash (outflows)/inflows from
financing activities (309) (39.2) (222) 57.9 (528) (714.0) 86 (87.4) 682 (795.9)
Net increase/(decrease) in cash
and cash equivalents 146 (21.4) 185 121.7 (855) (575.0) 180 197.8 (184) (693.5)
* Note: The figures presented in this analysis for the financial years ended 30 June 2010 and 2009 are those based on the Company's separate financial statements
(please refer to note 2.1 to the financial statements for further information). The figures presented for the years prior to 2009 are based on the Company's individual
financial statements as published in the annual reports in prior years.
Horizontal Analysis
AN
NU
AL R
EP
OR
T
2010
29


Crescent Steel & Allied Products Ltd.
The directors of the Company have the pleasure in submitting their report together with audited
financial statements of the Company for the year ended 30 June 2010.
Operating Results
The financial results of the Company are summarized below:
2010 2009(Rupees in '000)
Profit / (loss) for the year 597,513 (264,143)
Taxation (180,966) (134,678)
Profit / (loss) after taxation 416,547 (398,821)
Unappropriated (loss) / profit brought forward (449,317) 831
(32,770) (397,990)
Appropriations:
- Bonus shares issued 2008 - @10% ––– (51,327)
- First interim dividend 2010 - @10% (56,460) –––
- Second interim dividend 2010 - @10% (56,460) –––
(112,920) (51,327)
Unappropriated (loss) carried forward (145,690) (449,317)
Basic and diluted earning / (loss) per share Rs.7.38 Rs.(7.06)
On 4 January 2010, the Company acquired wholly owned subsidiary, Shakarganj Energy (Private) Limited
thereby necessitating preparation of consolidated financial statements in accordance with the requirements
of the Companies Ordinance, 1984 and the International Accounting Standard (IAS) 27, ‘Consolidated and
Separate Financial Statements’. The Company has prepared its separate financial statements for the first
time for the year ended 30 June 2010. This has resulted in all equity accounted investments to be carried at
cost in accordance with the requirement of paragraph 35 of IAS 28, ‘Investments in Associates’. Previously,
the Company in its individual financial statements accounted for its investments in associates using the
equity method of accounting.
Accordingly, the corresponding figures for the year ended 30 June 2009 presented in the separate financial
statements of the Company have also been reworked to comply with the abovementioned requirements of
IAS 28, ‘Investments in Associates’.
Had the abovementioned changes not taken place, the Company’s loss after taxation and loss per share for
the year ended 30 June 2009 would have been Rs. 239.749 million and Rs. 4.25 per share, whereas un-
appropriated profit/(loss) brought forward as at 1 July 2008 and 2009 would have amounted to Rs. 267.651
million and Rs. (23.425) million respectively.
Directors’ Report
AN
NU
AL R
EP
OR
T
2010
31


Crescent Steel & Allied Products Ltd.
Statement on Corporate and financial
reporting framework
� These financial statements, prepared by
the management of the Company,
present fairly its state of affairs, the
result of its operations, cash flows and
changes in equity.
� Proper books of account of the Company
have been maintained.
� Appropriate accounting policies have
been consistently applied in the
preparation of financial statements
accept for the changes as described in
note 4.1 to the financial statements; and
accounting estimates are based on
reasonable and prudent judgment.
� International Accounting Standards, as
applicable in Pakistan, have been followed
in preparation of financial statements.
� The system of internal control is sound in
design. The system is being continuously
monitored by Internal Audit and through
other such monitoring procedures. The
process of monitoring internal controls
will continue as an ongoing process
with the objective to further strengthen
the controls and bring improvements in
the system.
� There are no significant doubts upon
the Company’s ability to continue as
a going concern.
� There has been no material departure
from the best practices of corporate
governance, as detailed in the listing
regulations.
� Details of significant changes in the
Company’s operations during the current
year as compared to last year and
significant plans and decisions for the
future prospects of profits are stated in the
Chief Executive’s Review as endorsed
by Board of Directors.
� Key operating and financial data for last
six years in summarized form is annexed.
� Information about taxes and levies is given
in the notes to the financial statements.
� The number of employees at the end of
year was 1,222 (2009:1,203).
� The following is the value of
investments of the following funds
based on the audited accounts for the
year ended 31 December 2008:
- Provident fund Rs. 70.954 million
- Gratuity fund Rs. 21.855 million
- Pension fund Rs. 70.905 million
� During the year six board meetings were
held and the attendance by each director
is attached separately.
Directors’ Report
AN
NU
AL R
EP
OR
T
2010
33

Crescent Steel & Allied Products Ltd.
Pattern of Shareholding and
Shares Traded
The pattern of shareholding and additional
information regarding pattern of shareholding is
attached separately.
No trades in the shares of the company
were carried out by Directors, CEO, CFO and
Company Secretary and their spouses and minor
children except the following:
Mr. S.M. Ehtishamullah, Director who has
purchased 10,000 shares during the year and
have been duly reported as per the law.
Directors
Election of Directors was held on 29
January 2009 and out of eight Directors, the seven
retiring Directors were elected unopposed whose
term of office will expire on 29 January 2012.
Financial statements
As required under listing regulations 37(xxiv)
of Karachi Stock Exchange the Chief Executive
Officer and Chief Financial Officer present the
financial statements, duly endorsed under their
respective signatures, for consideration and
approval of the board of directors and the board,
after consideration and approval, authorize the
signing of financial statements for issuance and
circulation.
The financial statements of the Company
have been duly audited and approved without
qualification by the auditors of the Company,
KPMG Taseer Hadi & Co., Chartered Accountants
and their report is attached with the financial
statements.
No material changes and commitments
affecting the financial position of your Company
have occurred between the end of the financial
year to which this Balance Sheet relates and the
date of the Directors’ Report.
Shakarganj Energy (Private) Limited
During the year, the Company acquired 100%
ownership of Shakarganj Energy (Private) Limited
to make it a wholly owned subsidiary. The
subsidiary is in the process of developing 18 MW
power generation project with an estimated
investment of Rs. 430 million. The Company has
so far made an equity investment of Rs. 330.1
million in the subsidiary. The project is being
installed at Bhone and on completion will produce
electricity for onward supply to the PEPCO /
DISCOS under agreements with the Government
or to other consumers as may be permitted by the
Government. The project is scheduled to
commence production by November 2010.
Future prospects
The Chief Executive's Review attached with
this report deals with the future prospects of profits
of the Company. The Directors have endorsed the
contents of the Chief Executive's Review.
Directors’ Report
AN
NU
AL R
EP
OR
T
2010
35


Crescent Steel & Allied Products Ltd.
Auditors
The auditors, KPMG Taseer Hadi & Co.
retire and offer themselves for re-appointment.
The Board Audit Committee and the Board of
Directors of the Company have endorsed their
appointment for shareholders consideration at
the forthcoming annual general meeting.
By order of the Board
Ahsan M. Saleem
Chief Executive Officer
29 July 2010
Directors’ Report
AN
NU
AL R
EP
OR
T
2010
37

Crescent Steel & Allied Products Ltd.
Dear Shareholders,
I have pleasure in presenting the Annual
Report of your company alongwith audited
Financial Statements (Separate and Consolidated)
for the year ended 30 June 2010.
Economy
A measure of macroeconomic stability
achieved over the past two years has kindled a
moderate recovery in the economy, despite one of
the most serious economic crises in the country’s
recent history. The economy grew by overall
4.1% in the outgoing year, after a modest growth
of 1.2% in 2008-09. The resilience came at the
back of growth @ 4.4% in the Large Scale
Manufacturing sector despite the energy and
power shortages while the services sector also
grew by 4.6% as compared to 1.6% in the last
year. This alongwith the returns on the economic
front remained plump and enduring. However,
the recovery is still fragile and the stabilization
needs to be consolidated so that the gains over
the past two difficult years are not lost.
A combination of limited fiscal space and
rising spending, debt, and inflationary pressures,
significantly reduce the government’s ability to
spend in order to stimulate the economy. The
macroeconomic context remains difficult in the
near term with continuing challenges.
Overview of operations
Despite the economic challenges, by the Grace
of Almighty Allah, the results of your company
for the year ended 30 June 2010 substantially
bounced back from the bottom line losses in last
year turning into profits for all the divisions.
Profit after tax of Rs. 416.6 million was
almost double compared with last year (revised
loss of Rs.398.8 million). Earnings per share at
Rs. 7.38 as compared to loss per share of
Rs. 7.06 (revised).
On January 4, 2010, the Company acquired
wholly owned subsidiary, Shakarganj Energy
(Private) Limited thereby necessitating preparation
of consolidated financial statements in accordance
with the requirements of the Companies Ordinance,
1984 and the International Accounting Standard
(IAS) 27, ‘Consolidated and Separate Financial
Statements’. The Company prepared its separate
financial statements for the first time for the year
ended 30 June 2010 and also presented revised
corresponding figures for the year ended
30 June 2009.
This has resulted in all equity accounted
investments to be carried at cost in the separate
financial statements as more fully explained in
note 5.4 of those financial statements. Had the
Company accounted for its investments using
the equity method of accounting in separate
financial statements, the carrying amount of
those investments as at 30 June 2010 would
have been higher by Rs. 464.3 million (2009:
Rs. 215.3 million). Profit / (loss) after taxation
for the year and earnings / (loss) per share would
have been higher / (lower) by Rs. 113.6 million
Chief Executive’s Review
AN
NU
AL R
EP
OR
T
2010
39


Crescent Steel & Allied Products Ltd.
(2009: Rs. 159.1 million) and Rs. 2.01 per share
(2009: Rs. 2.8 per share) respectively, whereas
capital reserves would have been lower by
Rs. 90.4 million (2009: Rs. 208.9 million).
Group profit after tax (including the results
of wholly owned subsidiary Shakarganj Energy
(Private) Limited) as consolidated Financial
statement amounts to Rs. 534.9 million and EPS
stood at Rs. 9.47. In the consolidated financial
statements, investment in associates has been
accounted for using equity method.
Financial and Operational Performance
based on Separate Financial Statements
All the divisions contributed positively to
the overall bottom line of the company specially
the Cotton division which has contributed
handsomely towards both top line and bottom
line. During the year ended 30 June 2010, the
Company’s PBT was at Rs. 597.5 million as
compared to loss of Rs. 264.1 million in the last
year. Steel Division contributed Rs. 258.6 million
to this profit. Cotton Division’s contribution to
the profit before tax amounted to Rs. 272.2 million
as compared to loss of Rs. 109.1 million in the
last year. IID Division has also made a strong
come-back posting profit before tax of Rs. 66.7
million as compared to loss of Rs. 668.3 million
in the last year.
Highlights of 2010 results are given below:
� Sales revenue increased by 11.9 percent
amounting to Rs. 393.5 million during the
year ended 30 June 2010 as compared to the
last year.
� Income from investment stood at Rs. 171.6
million as compared to a loss of Rs. 337.9
million in the last year.
� Financial charges amounted to Rs. 121.9
million for the year showing a decrease of
40 percent.
� EBITDA stood at Rs. 903.9 million for
the current year as compared to Rs. 120
million for the last year.
Chief Executive’s Review
AN
NU
AL R
EP
OR
T
2010
41

Crescent Steel & Allied Products Ltd.
� EPS stood at Rs. 7.38 as compared to LPS
of Rs. 7.06 for the last year.
� Return on average capital employed is 21
percent for the current year as compared to
loss on average capital employed of 1.5
percent for the year ended 30 June 2009.
� Return on average equity is 16.8 percent for
the current year as compared to loss of 15
percent last year.
Business Segments
Steel Division - Segment performance
The year under review proved very
challenging for the steel division due to domestic
and global weak economic situation, liquidity
crisis and circular debt issues faced by Energy
Sector companies. These factors contributed to
decreased order intake and profitability for the
division. As steel division performance is directly
linked with the developmental projects in the
economy, with the government facing acute
shortage of funds and rising fiscal deficit many
of the planned projects were not materialized.
Resultantly the sales revenue for steel division
stood at Rs. 1,432.2 million as compared to
Rs. 1,739.3 million last year showing a decrease
of 17.6 %. The gross profit for the year was
Rs. 421.3 million as compared to Rs. 692.5
million in the same period last year while the
profit from operations for the steel division
stood at Rs. 272 million as compared to
Rs. 560.1 million last year.
The actual mix dia bare pipe production
during the year was 17,410 tons as compared to
14,368 tons during the corresponding period last
year. The capacity utilization of pipe plant was
63.6% as compared to 41.6 % last year. During
the FY10 coating of mix dia stood at 461,043
square meters of pipe as compared to 382,909
square meters in FY09.
Initiatives and re-engineering
Engineering unitDuring the year we diversified our product
offering by adding capabilities to fabricate and
Chief Executive’s Review
AN
NU
AL R
EP
OR
T
2010
43


Crescent Steel & Allied Products Ltd.
erect machinery specially for sugar and cement
industry. We have also developed capability for
manufacturing of boilers, cane shredders upto dia
1700mm, juice heaters, evaporators, batch and
continuous vacuum pans, centrifugal machines,
stainless steel spray clusters and multijet condensers,
perforated plates and vibro screens, and high voltage
transformer tanks. Slowly but surely, we will increase
our footprint in supply of some of these items.
Slitting line plantAs part of our drive for vertical integration,
we installed a slitting line at our Pipe plant,
Nooriabad which will result in reduction in cost
and dependence for slitting of coils and also its
related logistics. A large part of the fabrication
was done in-house.
Internal epoxy coatingDuring the year, we developed the capability
of internal epoxy coating of steel line pipe to our
existing Product line of Steel Pipe manufacturing
and its external coatings. Internal epoxy coating
is used in water supply Pipe lines for internal
corrosion protection. The entire work was done
in-house.
Future prospects and outlook
Steel prices in the international market are
under pressure but are likely to remain stable;
supply position of HR Coils is expected to remain
stable during next fiscal. Our major customers
are facing crises of liquidity as they have been
sucked into problem of circular debts. Their ability
to make capital expenditure will be impaired. We
will continue to seek diversification to maximize
our utilization of assets but see challenges ahead.
During current financial year we do expect
increased activity in the gas sector due to some
recent gas finds which requires urgent induction
into the gas supply network, over and above new
power plants are also designed on gas as fuel.
We do have orders in hand going into the next
fiscal but the timely execution of some of them
depends on the availability of funds with the
respective agencies which hopefully will improve.
Iran Pakistan (IP) gas pipeline agreement
has been finalized in all respect and work on
construction of pipeline is expected to start on a
fast track basis which may create demand of pipe
for this project by the end of the next financial
year. Our focus is on upgrading our plant to be
in absolute readiness enabling us to bid for
supply to this project.
Cotton Division - Segment performance
Cotton Division outperformed all other
business segments despite an ordinary performance
in the first half. There was all round improvement
in top line as well as bottom line results. Revenues
were up by 46% and stood at Rs. 2,272.2 million.
Gross profit was Rs. 395.7 million as compared
to Rs. 21.1 million in the same period last year,
while the profit before tax stood at Rs. 272.2
million as compared to a loss before tax of
Rs. 109.1 million. Cotton prices which at the
beginning of the season were steady, reached the
record high levels. Yarn prices also followed the
trend. The Government imposed 15% regulatory
duty on exports, which affected the prices and
sentiment in the last quarter.
Unit-I and Unit II worked 3 shifts a day for
326 days and 352 days and produced 13.9
million and 7.9 million Lbs. yarn of mixed count
as compared to 12.1 million Lbs. and 6.7 million
Chief Executive’s Review
AN
NU
AL R
EP
OR
T
2010
45


Crescent Steel & Allied Products Ltd.
produced in corresponding period last year
respectively. Electricity and gas shutdown
continues to hamper the production. Due to
complete shutdown of gas for 39 days, we lost
39 days production in Unit-I and 12 days in
Unit-II.
Future prospects and outlook
Future outlook for spinning remains
positive. There are several positive factors which
will contribute to it. Pakistan Cotton crop is in
good shape and with more acreage and BT cotton
planted, estimates so far point to at 13.5 to 14.5
million bales crop size (although the impending
floods has affected the crop size). This is expected
to keep the price of local cotton well below the
cheapest imported variety. Therefore with increased
world consumption, China will need to source
yarn from Pakistan, especially in the coarse
counts. However re-imposition of regulatory
duty or other restrictions on yarn exports is a
major threat. Further severity of electricity and
gas shutdown may also affect the bottom line.
Investment and Infrastructure Development
Division - Segment performance
The equity market was again marred by
uncertainty for the second year running as the
index swayed around the troughs and peaks.
During the fiscal year the market showed some
optimism mainly at the back of foreign buying
interest, improvement in some of the major
macroeconomic indicators which restored the
local investors’ confidence in the market. But
towards the end of the fiscal year the market
suffered drawbacks mainly due to the much
debated issues of Capital Gains Tax (CGT) and
the issuance of the leverage product. The volumes
fell drastically and the market continued to remain
dull and even good corporate results were not
enough to revive the market activity. The market
closed the year on 9721 points with an average
daily turnover 160.5 million shares.
During the current year, IID segment earned
profit before taxation of Rs. 66.7 million as
compared to loss before taxation of Rs. 668.3
million. This turnaround resulted mainly due to
realized gain on sales of shares amounting to
Chief Executive’s Review
AN
NU
AL R
EP
OR
T
2010
47

Crescent Steel & Allied Products Ltd.
Rs. 134.0 million as compared to loss of
Rs. 197.6 million in the last year and dividend
income amounting to Rs. 38.5 million as
compared to Rs. 57.7 million in the last year, which
was partially offset by impairment in the value
of investment by Rs. 45 million and attributable
administration expenses and finance cost of
Rs. 25 million and Rs. 34 million respectively.
The value of investments in marketable
securities excluding strategic investment amounted
to Rs. 505.6 million (FY09: Rs. 712.2 million).
During the year, shares aggregating Rs. 946.8
million were purchased, while shares aggregating
Rs. 1,296.8 million were sold on account of
trading and switching positions. The closing
value of the portfolio as at 30 June 2010 was
Rs. 1,666.2 million (FY09: Rs. 1,592 million).
During the year the company has generated
rental income of Rs. 7.6 million on investment
property valuing Rs. 44.8 million as at
30 June 2010.
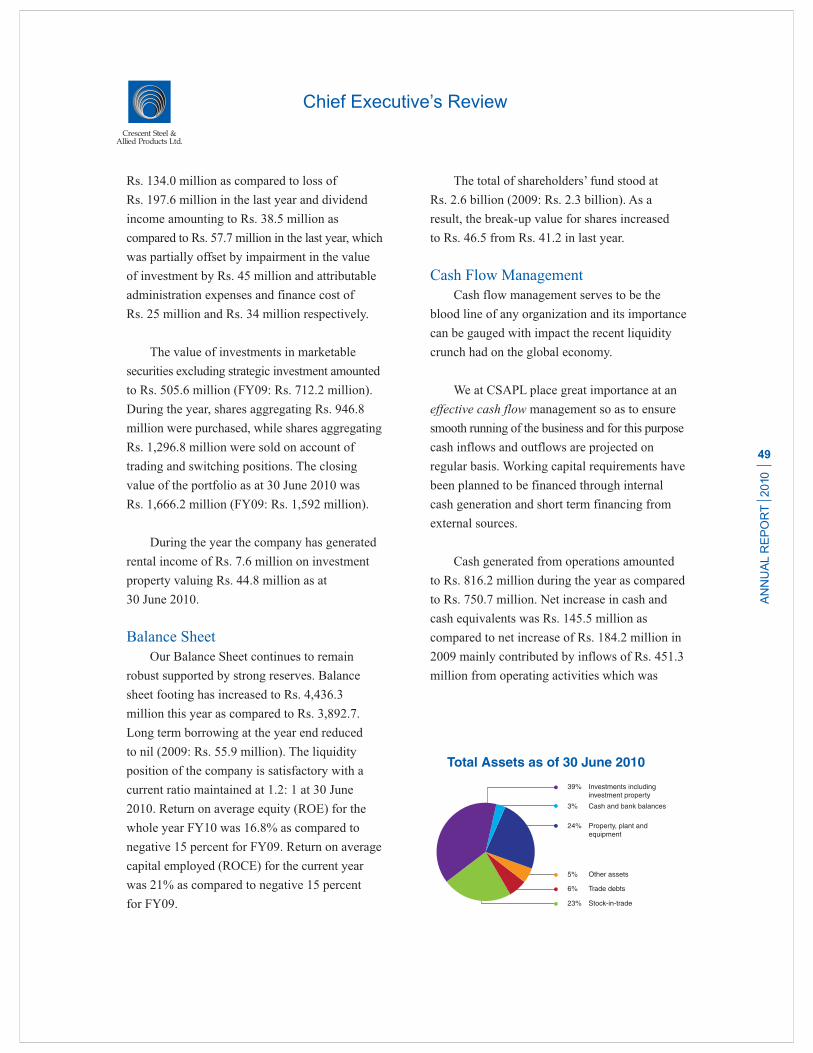
Balance Sheet
Our Balance Sheet continues to remain
robust supported by strong reserves. Balance
sheet footing has increased to Rs. 4,436.3
million this year as compared to Rs. 3,892.7.
Long term borrowing at the year end reduced
to nil (2009: Rs. 55.9 million). The liquidity
position of the company is satisfactory with a
current ratio maintained at 1.2: 1 at 30 June
2010. Return on average equity (ROE) for the
whole year FY10 was 16.8% as compared to
negative 15 percent for FY09. Return on average
capital employed (ROCE) for the current year
was 21% as compared to negative 15 percent
for FY09.
The total of shareholders’ fund stood at
Rs. 2.6 billion (2009: Rs. 2.3 billion). As a
result, the break-up value for shares increased
to Rs. 46.5 from Rs. 41.2 in last year.
Cash Flow Management
Cash flow management serves to be the
blood line of any organization and its importance
can be gauged with impact the recent liquidity
crunch had on the global economy.
We at CSAPL place great importance at an
effective cash flow management so as to ensure
smooth running of the business and for this purpose
cash inflows and outflows are projected on
regular basis. Working capital requirements have
been planned to be financed through internal
cash generation and short term financing from
external sources.
Cash generated from operations amounted
to Rs. 816.2 million during the year as compared
to Rs. 750.7 million. Net increase in cash and
cash equivalents was Rs. 145.5 million as
compared to net increase of Rs. 184.2 million in
2009 mainly contributed by inflows of Rs. 451.3
million from operating activities which was
Chief Executive’s Review
AN
NU
AL R
EP
OR
T
2010
49


Crescent Steel & Allied Products Ltd.
partially offset by outflows of Rs. 309.2 million
used in financing activities. Consequentially
financing cost decreased by 40 percent i.e.
Rs. 81.7 million.
Financial and Operational Performance
based on Consolidated Financial
Statements
Acquisition of Shakarganj Energy (Private)Limited as a fully owned subsidiary
The recent energy crisis in the country has
provided a lucrative investment opportunity in
the power sector as the government tries to meet
the shortage by engaging the independent power
producers (IPPs). Keeping in view our strategic
interest in the energy sector the company acquired
a 100% stake in Shakarganj Energy (Private)
Limited on 4 January 2010 to build, own, operate
and maintain a bagasse fired thermal generation
power plant. This company will generate,
accumulate, distribute, sell and supply electricity
to PEPCO and to other distribution companies
under agreement with the Government of
Pakistan or to any other company as permitted.
The power plant is scheduled to commence
generation by November 2010 and we are
hopeful that this investment will positively add
to the group’s bottom line in terms of profitability
and will provide us with the strategic thrust for
further expansion in this sector.
Consolidated profit after tax for the Group
for the FY10 amounts to Rs. 534.9 million and
EPS stood at Rs. 9.47. The increase in profit
after taxation in the consolidated financial
statements is due to the accounting treatment used
for equity accounted investees and consolidation
of the results of Shakarganj Energy (Private)
Limited (SEL). Contribution of IID division and
SEL in the bottom line amounted to Rs. 180.3
million and Rs. 4.7 million respectively.
Consolidated highlights of 2010 results
are given below:
Operating results of the Group for the year
ended 30 June 2010 are as follows:
� EBITDA stood at Rs. 1,022.3 million for the
current year as compared to Rs. 279.1 million
for the last year.
� EPS stood at Rs. 9.47 as compared to
negative Rs. 4.25 for the last year.
� Return on average capital employed is 22.2
percent for the current year as compared to
return on average capital employed of 2.4
percent for the year ended 30 June 2009.
� Return on average equity is 19.0 percent for
the current period as compared to loss on
average equity of 8.7 percent for the last year.
Consolidated Balance Sheet
Balance sheet footing has increased to
Rs. 4,894.8 million this year as compared to
Rs. 4,109.7. The liquidity position of the
company is satisfactory with a current ratio
Chief Executive’s Review
AN
NU
AL R
EP
OR
T
2010
51


Crescent Steel & Allied Products Ltd.
maintained at 1.2: 1 at 30 June 2010. The total of
shareholders’ fund stood at Rs. 3.1 billion (2009:
Rs. 2.5 billion). As a result, the break-up value
for shares increased to Rs. 54.5 from Rs. 45.1
in last year.
Consolidated Cash Flow Management
Cash generated from operations amounted
to Rs. 826.8 million during the year as compared
to Rs. 750.7 million. Net increase in cash and
cash equivalents was Rs. 174.5 million as
compared to net increase of Rs. 184.2 million in
2009 mainly contributed by inflows of Rs. 461.8
million from operating activities which was
partially offset by outflows of Rs. 309.2 million
used in financing activities. Consequentially
financing cost decreased by 40 percent i.e.
Rs. 81.7 million.
Contribution to National Exchequer and
Economy
The Company has contributed Rs. 499.2
million towards the national exchequer on
account of government levies and taxes as
compared to Rs. 520.4 million during last year.
During the year, the Company manufactured
17,410 tons of steel pipes and 21.8 million lbs.
of cotton yarn. Contribution to the economy
included Rs 121.9 million on account of payments
to providers of capital, Rs 169.4 million in the
shape of shareholders’ returns through cash
dividends, while employees’ remuneration and
benefits stood at Rs 242.3 million.
Quality
CSAPL is committed to provide products
and services conforming to highest international
standards in line with customer requirements.
We strive to apply cutting edge technology and
ensure that we meet customer needs while
maintaining cost and quality leadership. We believe
in doing right the first time. Every year, we make
incremental improvements in the way we do things
through Specific Quality Improvement Projects.
Effectiveness of our Quality Management System is
ensured through an independent quality function.
Health, Safety and Environment
The Company is committed to continually
improve its environment by providing training to
all its employees with regards to Health, Safety
and Environment and complying with current
legislation and maintain standards of Health,
Safety and Environment by adopting safe
working practices to protect people, property,
computing systems and facilities, protecting
human health within our boundaries, protecting
the environment by conserving resources and
preventing pollution in a cost effective way. These
integrated efforts of the entire organization have
brought fruitful results with no major accidents
occurring at the factory.
Chief Executive’s Review
AN
NU
AL R
EP
OR
T
2010
53

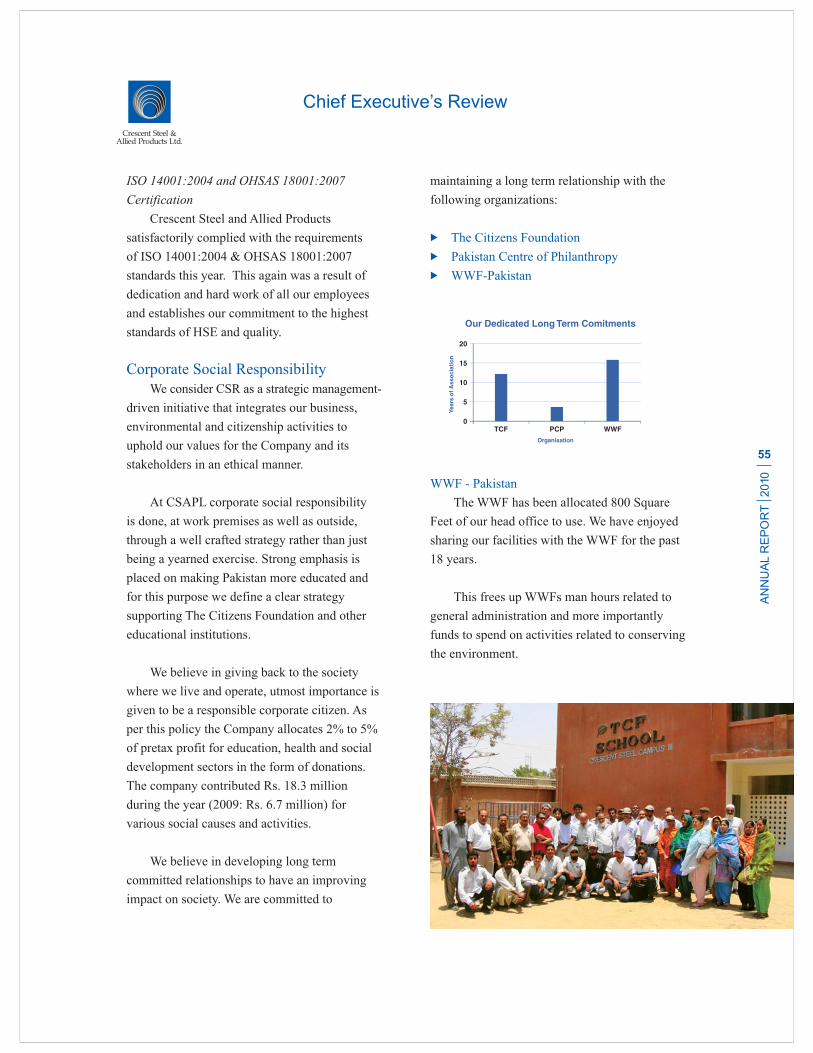
Crescent Steel & Allied Products Ltd.
ISO 14001:2004 and OHSAS 18001:2007Certification
Crescent Steel and Allied Products
satisfactorily complied with the requirements
of ISO 14001:2004 & OHSAS 18001:2007
standards this year. This again was a result of
dedication and hard work of all our employees
and establishes our commitment to the highest
standards of HSE and quality.
Corporate Social Responsibility
We consider CSR as a strategic management-
driven initiative that integrates our business,
environmental and citizenship activities to
uphold our values for the Company and its
stakeholders in an ethical manner.
At CSAPL corporate social responsibility
is done, at work premises as well as outside,
through a well crafted strategy rather than just
being a yearned exercise. Strong emphasis is
placed on making Pakistan more educated and
for this purpose we define a clear strategy
supporting The Citizens Foundation and other
educational institutions.
We believe in giving back to the society
where we live and operate, utmost importance is
given to be a responsible corporate citizen. As
per this policy the Company allocates 2% to 5%
of pretax profit for education, health and social
development sectors in the form of donations.
The company contributed Rs. 18.3 million
during the year (2009: Rs. 6.7 million) for
various social causes and activities.
We believe in developing long term
committed relationships to have an improving
impact on society. We are committed to
maintaining a long term relationship with the
following organizations:
� The Citizens Foundation
� Pakistan Centre of Philanthropy
� WWF-Pakistan
WWF - Pakistan
The WWF has been allocated 800 Square
Feet of our head office to use. We have enjoyed
sharing our facilities with the WWF for the past
18 years.
This frees up WWFs man hours related to
general administration and more importantly
funds to spend on activities related to conserving
the environment.
Chief Executive’s Review
AN
NU
AL R
EP
OR
T
2010
55


Crescent Steel & Allied Products Ltd.
Pakistan Centre for Philanthropy (PCP)
CSAPL has been a Corporate Member of
the PCP since 2006. PCP is an organization
dedicated to philanthropy. Its notable services
are certifying NGOs, which increases their
credibility thus increases their chances of
obtaining funds.
The Citizens Foundation (TCF)
Our relationship with TCF began in 1987.
Our commitment this year was for the operation
and maintenance of our TCF schools.
We also have an annual Paint a School
activity in which our employees take part in
painting the school.
So far we have helped built 14 school units
and also help support the operations of these units.
Combined enrolment in these schools is 2,637
students who come from the most impoverished
segment of the society, 44% of these are girls.
Commitment to the Environment:
Raising Awareness
At CSAPL our activities related to the
environment relate to raising awareness about
the need to conserve. This is done by the
following activities:
� Earth Hour:
On Saturday 28 March 2010, we took
part in “Earth Hour” by switching the lights
off in our factories and head office to a
minimum. Following this activity we made
a commitment to reduce our electricity use
at our Head Office by turning off our AC
units in the morning and evening for an
identified time period.
� Tree Plantation:
At our factories in Crescent Steel we
encourage our employees to plant trees and
maintain the plantations themselves. Special
effort has been made to green our Nooriabad
campus which is the middle of an Arid Zone.
Over the year our plantations have increased
to 1,450 trees over a dedicated 40 acres at
our Nooriabad campus. Substantial effort is
also carried out to green the other campuses.
� Reducing Resource Use
We make a conscious effort to conserve
energy which includes a voluntary two hours
curfew in using of air-conditions.
We are participating in energy
management system organized by APTMA,
SMEDA and the GTZ (German company).
Chief Executive’s Review
AN
NU
AL R
EP
OR
T
2010
57


Crescent Steel & Allied Products Ltd.
We will continue our support to society
in every aspect possible as it is an integral
part of the Company’s strategy.
HR Initiatives
The company has a clear vision that our people
and strong leadership practices are an important
enabler of high productivity and sustainable
competitive advantage of our company. With a
strength of over 1,100 we take pride in the fact
that our employees are the ones who shape the
future of our company. Our focus in HR is to
unleash the organization’s intellectual energy
through excellence in world class HR process
and practices.
We ensure that all our people have a say
in how things are done. Be it in the nature of
streamlining work processes or in the nature
of defining ideal working conditions. Each
employee has an opportunity to address work
place issues through ‘Town Hall’ meetings.
Training and Education
At CSAPL we are committed to training our
employees for career development. Our training
strategy involves conducting a ‘Training Needs
Analysis’ of each employee. We also encourage
our employees to further their formal education
for career development.
Our ‘Jugnoo Sabaq’ scheme caters to improve
the literacy levels of those employees that have
not had primary education. There are currently
30 employees from our factory at Nooriabad
who are learning to read and write. The Jugnoo
Sabaq Program began in 2003 and it is nearing
its completion as the literacy levels at our
factory are nearing 100%.
Employees taking primary classes in
FY2009/2010:
Primary Education Classes Employees
Class 6 14
Class 4 4
Class 3 6
Class 2 6
Total Students 30
Governance
The Board places paramount on good
governance and has, therefore, developed the
effective governance structures, processes and
frameworks including “Core values”, “Standard
of Conduct for Directors”, “Standard of Conduct
for Employees” a “Policy statement of ethics and
business practices" in conforming with the Code
of Corporate Governance in Pakistan and
International best practices.
Values and ethics encompass a trustworthy
relationship between organizations and their
business partners which paves the way towards a
mutually beneficial relationship. These are, therefore,
ingrained in CSAPL’s culture. These standards
are regularly reviewed and updated to ensure
Chief Executive’s Review
AN
NU
AL R
EP
OR
T
2010
59


Crescent Steel & Allied Products Ltd.
effectiveness and relevance for achievement of
long term objectives of the Company and are
applicable to everybody in the Company. The
Board acknowledges its responsibility for the
overall strategy, management, identification
and solution for risks and challenges, sustained
business prosperity and safeguarding the rights
of shareholders. It endorses the Best Practices
of the Code of Corporate Governance as an
effective tool in discharging these duties in
addition to enhancing the timeliness, accuracy,
comprehensiveness and transparency of
financial and non-financial information
through accountability and integrity.
During the year, six meetings of the Board
were held to review and approve all issues and
matters referred to it by audit and other committees
of the Board, including periodical and annual
financial statements, corporate and financial
reporting framework, Company strategy, budgets
and forecast including their analysis with actual,
cash flow projections, management letter issued
by the external auditors, compliance with relevant
laws and regulations including amendments
during the year, acquisition and disposal of fixed
assets, review of risks identified and their mitigation,
accounting and internal control system including
IS controls and such other matters considered to
be significant enough for the Board’s attention
by the Audit Committee or the management.
The appointment, remuneration and terms
and conditions of employment of the Chief
Executive Officer and the Chief Financial Officer
have been approved by the Board of Directors. The
Chief Executive Officer and the Chief Financial
Officer did not take part during discussion in the
Board on their respective employment contracts.
The Board has formulated and approved
long term strategies at the Corporate and Business
Unit levels and strong emphasis is placed on its
monitoring. Further, the Board has modified the
Company’s mission, vision and values statements
as recommended by management. The Board
continuously reviews and approves its existing
policies on rotation basis so that the said policies
are reviewed once at least in three years.
Achievements 2010
We place paramount importance to
transparency, reliability of information and its
accurate and timely reporting to our stakeholders
all being components of good corporate governance
clearly highlights the company’s focus on
corporate governance.
The annual report (2008) of our company
secured the 2nd runners up position in the
manufacturing sector category in the “Best
Presented Accounts Awards 2008” organized by
the South Asian Federation of Accountants
(SAFA). The award ceremony was organized at
Dhaka, Bangladesh.
Chief Executive’s Review
AN
NU
AL R
EP
OR
T
2010
61


Crescent Steel & Allied Products Ltd.
Top 25 Companies Award (KSE)
The company’s performance was
acknowledged by the premier stock exchange
of the country by including Crescent Steel in the
top 25 companies for the year 2008. The KSE
evaluates the listed companies on the basis of
dividend payout, return on equity, compliance
with the listing regulations and good corporate
governance. The top 25 companies are selected
based on highest scores obtained on the basis of
the aforementioned selection criteria. This is
another recognition highlighting our company’s
focus on its mission that is to continue to add
value to share holders and the economy by
giving the best returns and continue to operate
as a responsible corporate citizen meeting the
highest level of compliance.
Business Process Reengineering and
Management Information System
To enhance efficiencies and as a part of
business process reengineering for continuous
improvement, the Company, during the last year,
implemented Oracle application suite, an Enterprise
Resource Planning system for its financial,
supply chain, manufacturing, projects and assets
management to replace our legacy applications.
The ERP system is running smoothly and
continuously assisting to make our performance
timely, efficient and accurate. In the year ahead
our goal is to get the maximum leverage from
this system.
Business Risks and Challenges
Doing business inherently involves taking
risks, and by taking measured risks we strive to
be a sustainable Company. Risk management is
one of the essential elements of the Company’s
corporate governance. This calls for creating a
proper balance between entrepreneurial attitude
and risk levels associated with business
opportunities. The Company has a comprehensive
risk management system and framework which
supports early recognition of developments
likely to jeopardize the future performance of the
company or to its future well being and helps
pre-empting risks and capitalizing opportunities.
It provides reasonable assurance that our business
objectives can be achieved and our obligations to
customers, shareholders, employees, and society
are met with highest level of compliance and
integrity. Risk Management is primarily the
responsibility of the business managers. However,
top management takes responsibility for the
oversight of the key risks and compliance of legal
requirements. As a part of our policy to produce
forward looking statements we are outlining the
risks which may affect our business. This exercise
also helps management to focus on a strategy to
mitigate risk factors. With an explicit understanding
that this is not an exhaustive enumeration, our
major risk factors are listed below:
Raw Material Sourcing
Inability to access raw materials, growth in
cost and expenses for raw materials and natural
gas, may adversely influence the future results of
Chief Executive’s Review
AN
NU
AL R
EP
OR
T
2010
63


Crescent Steel & Allied Products Ltd.
the Company. The Company aims to use its
purchasing power and long term relationships
with suppliers to acquire raw materials and
safeguard their constant delivery at the best
conditions. Company is sensitive to price
movements that may lead to erosion of margins
and liquidated damages due to non-availability
of raw materials.
Investment Risk
Company has made significant investment in
marketable securities. Adverse stock market
developments may affect the profitability and
assets of the Company. The Company follows
diversified investment policy and actively
manages its investment portfolio to match the
required risk profiles.
Currency Risk
Since significant parts of the Company’s
operations are based on imported raw material,
exchange rate fluctuations can have an impact on
the Company’s financial results. As forward
cover facility is no more available and the falling
value of Pakistan Rupee, mitigation of adverse
currency fluctuation has become more challenging.
The Company follows various available means
to hedge against currency fluctuations to
minimize losses.
Cost and availability of Funds
Significant portion of the working capital
requirements of the Company is arranged through
short term borrowings. The Company’s financial
condition and results of operations could be
adversely affected if the Company does not
successfully mitigate risks associated with
availability of funds and interest rate changes.
Further, the overall liquidity position in the
economy may also adversely affect the business
of our customers which may have an impact on
the Company’s operations.
Employee Retention and Recruitment
The Company’s ambitious growth plans
may not be achieved when we fail to attract and
retain the right people. The Company puts emphasis
on attracting, retaining, motivating, and educating
staff, using Human Resources instruments.
Internal Controls
Without effective internal controls the
Company may be exposed to financial irregularities
and losses. This covers the areas ranging from
safeguarding the assets, compliance with laws
and regulations and accuracy and reliability of
its records and financial reporting.
Technological Advantages
Our competitors may be able to identify and
implement a major technological step change
resulting in product substitution, improve their
production efficiencies and lower costs. Our
inability to implement similar steps may make us
uncompetitive. Similarly we have to ensure that
we match or exceed the quality and service
performance of our competitors.
Chief Executive’s Review
AN
NU
AL R
EP
OR
T
2010
65


Crescent Steel & Allied Products Ltd.
Power and Gas Outage
Power and gas shortage may have a negative
impact particularly on cotton division as it runs on
gas generators. Similarly the customers operation
is also dependent on electricity and gas. Power
and gas outage may result in stoppage.
General
I would like to propose a warm vote of
thanks for the proactive role of the Board and the
Audit committee in guiding the management in
these difficult times. Our employees also deserve
a vote of thanks for their dedication and hard
work which has made it possible to rebound
from steep losses of last year.
Whilst placing on record our thanks to all
the stakeholders we look towards their continued
support.
By order of the Board
Ahsan M. Saleem
Chief Executive Officer
29 July 2010
Chief Executive’s Review
AN
NU
AL R
EP
OR
T
2010
67

Crescent Steel & Allied Products Ltd. Management Structure

2010 2009 2008 2007 2006 2005 2004A - Profit and loss account (Rupees in millions)Sales - Net 3,704.4 3,310.9 4,200.2 2,950.1 1,707.1 2,686.6 1,348.1 Cost of sales 2,887.3 2,597.2 3,303.8 2,439.7 1,566.8 2,314.7 1,173.9 Gross profit 817.1 713.7 896.4 510.5 140.3 371.9 174.3 Income from/(loss on) investments - net 171.6 (337.9) 73.6 411.4 332.9 176.4 221.2 Distribution, selling and administrative expenses 186.2 143.8 151.0 146.6 118.6 108.3 90.7 Other operating expenses 101.4 331.5 109.7 125.5 21.9 70.0 36.9 Other operating income 18.3 39.0 19.6 107.0 24.6 87.7 79.2 Operating profit/(loss) before finance costs 719.4 (60.5) 728.9 756.7 357.3 457.7 347.1 Finance costs 121.9 203.6 153.0 128.5 82.9 43.9 20.4 Share of profit/(loss) in equity accounted
investees - net ––– ––– 50.8 99.1 (11.9) (19.5) –––Profit/(loss) before taxation 597.5 (264.1) 626.6 727.3 262.4 394.2 326.7 Taxation 181.0 134.7 210.9 64.1 2.8 81.8 30.8 Net income/(loss) 416.5 (398.8) 415.7 663.2 259.6 312.4 295.9
B - Balance Sheet (Rupees in millions)Current assets 2,116.8 1,716.2 2,279.1 2,124.8 1,841.6 1,779.5 1,541.1 Stock-in-trade 1,026.6 616.4 606.1 633.5 468.5 194.3 240.5 Trade debts 276.9 83.9 118.7 181.4 75.1 132.4 36.0 Current liabilities 1,742.1 1,408.2 1,573.1 1,077.1 1,127.1 468.9 370.9 Trade and other payables 871.5 373.9 240.8 435.1 229.9 221.9 174.5 Property, plant and equipment 1,061.4 1,224.6 1,233.2 1,306.6 1,381.1 441.8 467.8 Total assets 4,436.3 3,892.7 4,846.7 4,696.1 3,714.7 2,569.8 2,228.2 Long term loan (excluding current maturity) ––– 55.9 168.1 354.0 548.3 236.1 326.5 Deferred liabilities 71.6 99.8 111.5 64.6 1.6 3.9 10.6 Short term loans (including current maturity
of long term debt) 836.4 1,015.3 1,306.4 625.8 876.9 233.5 156.2 Reserves 2,058.0 1,764.2 2,480.7 2,733.8 1,687.7 1,617.5 1,298.5 Shareholders' equity 2,622.6 2,328.8 2,994.0 3,200.4 2,037.7 1,860.5 1,519.4
C - Profitability ratiosEarnings before interest, taxation, depreciation
and amortization (EBITDA) (Rs. in millions) 903.9 120.0 954.7 1,029.3 444.8 522.7 431.4 Profit/(loss) before taxation and deprecation
(Rs. in millions) 771.5 (85.0) 801.3 900.0 359.8 476.8 326.7 Gross profit margin to net sales (%) 22.1 21.6 21.3 17.3 8.2 13.8 12.9 Operating profit/(loss) margin to net sales (%) 19.4 (1.8) 17.4 25.6 20.9 17.0 25.7 Net income/(loss) to net sales (%) 11.2 (12.0) 9.9 22.5 15.2 11.6 21.9
D - Return on assets/capitalReturn on average assets (%) 10.0 (9.1) 8.7 15.8 8.3 13.0 16.0 Return on capital employed (RoCE) (%) 20.8 (1.8) 17.4 20.5 10.0 18.8 17.3 Return on average capital employed (%) 21.0 (1.5) 18.0 22.4 11.9 20.2 21.0 Return on equity (%) 15.9 (17.1) 13.9 20.7 12.7 16.8 19.5 Return on average equity (%) 16.8 (15.0) 13.4 25.3 13.3 18.5 22.1
E - Per share results and returnEarnings/(loss) per share (Rs.) 7.38 (7.06) 7.36 12.10 6.10 7.30 6.90 Break-up value per share (Rs.) 46.5 41.2 58.3 68.6 58.2 76.6 68.8 Market value per share (Rs.) 25.1 18.0 61.7 71.0 43.5 77.0 78.9 Market value per share (high-low) (Rs.) 34 - 18 61 - 13 108 - 58 72 - 32 90 - 37 100 - 64 93 - 50 Price earnings ratio (times) 3.4 ––– 7.6 5.0 5.9 6.0 5.9 Cash dividend - including final
proposed (Rs. in millions) 169.4 ––– 154.0 140.0 ––– 72.9 77.3 Dividend per share - including final proposed (Rs.) 3.0 ––– 3.0 3.0 ––– 3.0 3.5 Dividend yield (%) - including final proposed 12.0 ––– 4.9 4.2 ––– 3.9 4.4 Dividend payout ratio (%) - including final proposed 40.7 ––– 37.0 21.1 ––– 23.3 26.1 Bonus shares (%) - including final proposed ––– ––– 10 10 20 20 10
F - Coverage ratiosInterest coverage (times) 5.9 (0.3) 5.1 6.7 4.2 10.0 17.0
G - Activity ratiosDebtors turnover (times) 20.5 32.7 28.0 23.0 16.5 31.9 43.5 Average collection period (days) 18 11 13 16 22 11 8 Inventory turnover (times) 3.5 4.2 5.3 4.4 4.7 10.6 5.3 Inventory turnover (days) 104 86 68 82 77 34 69 Creditors turnover (times) 14.1 24.6 19.7 11.5 11.3 17.8 13.3 Average payment days (days) 26 15 19 32 32 20 28 Property, plant and equipment turnover (times) 3.5 2.7 3.4 2.3 1.2 6.1 2.9 Total assets turnover (times) 0.8 0.9 0.9 0.6 0.5 1.0 0.6
H - Liquidity ratiosCurrent ratio 1.2 : 1 1.2 : 1 1.4 : 1 2 : 1 1.6 : 1 3.8 : 1 4.2 : 1 Quick/Acid-test ratio 0.6 : 1 0.8 : 1 1.1 : 1 1.4 : 1 1.2 : 1 3.4 : 1 3.5 : 1 Working capital (Net current assets) 374.7 308.0 706.1 1,047.7 714.5 1,310.6 1,170.2 Working capital turnover (times) 10.9 6.5 4.8 3.3 1.7 2.2 1.4 Operating cycle (days) 96 82 63 66 67 25 50
I - Leverage ratiosLong term debt to equity (%) ––– 2.4 5.6 11.1 26.9 12.7 21.5 Long term debt : Equity ratio 0 : 100 2 : 98 5 : 95 10 : 90 21 : 79 11 : 89 18 : 82 Total liabilities to total assets (%) 39.3 37.6 35.9 30.5 45.1 27.4 31.3 Gearing ratio (%) 20.7 31.4 32.9 22.8 40.9 18.3 24.1
J - Other data (Rupees in million)Depreciation/amortization 184.5 180.6 175.0 173.4 99.4 84.5 84.2 Capital expenditure (including leased assets) 34.5 169.1 153.5 126.9 996.5 66.3 163.2 No. of ordinary shares (no. of shares in millions) 56.5 56.5 51.3 46.7 35.0 24.3 22.1
* Note:The figures and ratios presented in these highlights for the financial years ended 30 June 2010 and 2009 are those based on the Company's separate financialstatements (please refer to note 2.1 to the financial statements for further information). The figures and ratios presented for the years prior to 2009 are basedon the Company's individual financial statements as published in the annual reports in prior years.
Financial Highlights (including ratio analysis)
AN
NU
AL R
EP
OR
T
2010
69

Crescent Steel & Allied Products Ltd.
Financial Highlights
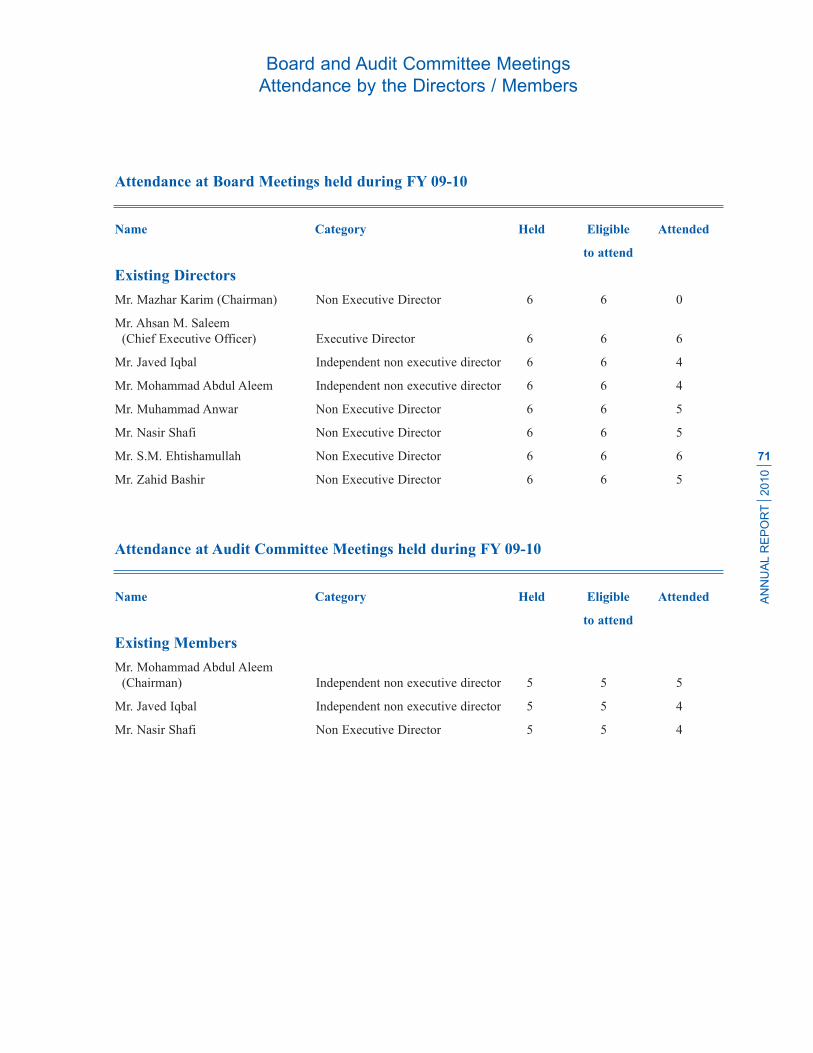
Attendance at Board Meetings held during FY 09-10
Name Category Held Eligible Attended
to attend
Existing Directors
Mr. Mazhar Karim (Chairman) Non Executive Director 6 6 0
Mr. Ahsan M. Saleem
(Chief Executive Officer) Executive Director 6 6 6
Mr. Javed Iqbal Independent non executive director 6 6 4
Mr. Mohammad Abdul Aleem Independent non executive director 6 6 4
Mr. Muhammad Anwar Non Executive Director 6 6 5
Mr. Nasir Shafi Non Executive Director 6 6 5
Mr. S.M. Ehtishamullah Non Executive Director 6 6 6
Mr. Zahid Bashir Non Executive Director 6 6 5
Attendance at Audit Committee Meetings held during FY 09-10
Name Category Held Eligible Attended
to attend
Existing Members
Mr. Mohammad Abdul Aleem
(Chairman) Independent non executive director 5 5 5
Mr. Javed Iqbal Independent non executive director 5 5 4
Mr. Nasir Shafi Non Executive Director 5 5 4
Board and Audit Committee Meetings
Attendance by the Directors / Members
AN
NU
AL R
EP
OR
T
2010
71

Crescent Steel & Allied Products Ltd.
This statement is being presented to comply with the
Code of Corporate Governance as contained in the
Listing Regulations of the Stock Exchanges of
Pakistan for the purpose of establishing a framework
of good governance, whereby a listed company is
managed in compliance with the best practices of
corporate governance.
The company has applied the principles contained
in the Code in the following manner:
1. The Board comprises eight directors including the
CEO. The company encourages representation of
independent non-executive Directors. At present
the Board has seven non-executive Directors out
of which two are independent
non-executive Directors.
2. The Directors have confirmed that none of them
is serving as a Director in more than ten listed
companies, including this company.
3. All the resident Directors of the company are
registered as taxpayers and none of them has
defaulted in payment of any loan to a Banking
Company, a DFI or an NBFI. None of them is a
member of a Stock Exchange.
4. No casual vacancy occurred during the year
ended 30 June 2010.
5. The company has prepared a 'Statement of Ethics
and Business Practices', which has been signed by
all the Directors and employees of the Company.
6. The Board has developed a vision, mission and
values statement, and significant policies of
the Company. A complete record of particulars
of significant policies alongwith the dates on
which they were approved or amended has been
maintained. The corporate strategy of the
Company is reviewed and approved by the
Board alongwith the annual plan.
7. All the powers of the Board have been duly
exercised and decisions on material transactions,
including appointment and determination of
remuneration and terms and conditions of
employment of the Chief Executive Officer
(CEO) and an Executive Director have been
taken by the Board.
8. All the meetings of the Board were presided
over by the Chairman and, in his absence, by a
Director elected by the Board for this purpose.
The Board met six times during the year ended
30 June 2010 including once in every quarter to
approve the financial statements of the Company.
Following the Best Practices of Corporate Gover-
nance, the Board met to discuss with the key
members of the management team with out the
Chief Executive to assess the adequacy of controls,
alignment of key managers with overall objectives
of the Company and to make an independent
assessment of adequacy of succession. A separate
meeting of the Board was held to approve the
Annual plan/Budget. Written notices of the Board
meetings, alongwith agenda and working papers,
were circulated at least seven days prior to the
meetings. The minutes of the meetings were
appropriately recorded and circulated in time.
9. In-house orientations for the Directors were made
to apprise them of their duties and responsibilities
and to brief them regarding amendments in the
Companies Ordinance / Corporate Laws.
10. The Board has approved appointment of Company
Secretary /CFO and the Head of Internal Audit,
including their remuneration and terms and
conditions of employment, as recommended by
the CEO.
11. The Directors' Report for the year ended 30 June
2010 has been prepared in compliance with the
requirements of the Code and it fully describes
the salient matters required to be disclosed.
Statement of Compliance with the
Code of Corporate Governance
AN
NU
AL R
EP
OR
T
2010
72

12. The financial statements of the company were
duly endorsed by the CEO and CFO before
approval by the Board.
13. The Directors, CEO and Executives do not
hold any interest in the shares of the Company,
other than that disclosed in the pattern of
shareholding.
14. The Company has complied with all the
corporate and financial reporting requirements of
the Code.
15. The related party transactions have been placed
before the audit committee and approved by the
board of directors with necessary justifications
for non arm's length transactions and pricing
methods for transactions only if such terms can
be substantiated.
16. The Board has formed an Audit Committee. It
comprises of three members, all of whom are
non-executive Directors including the Chairman
of the Committee. It requires that at least two
members of the Audit Committee must be
financially literate.
17. The meetings of the Audit Committee were held
at least once every quarter prior to approval of
interim and final results of the Company and as
required by the Code. The terms of reference of
the Committee have been framed and advised to
the Committee for compliance.
18. The Board has set-up an effective internal audit
function. This function has been outsourced to
Ernst & Young Ford Rhodes Sidat Hyder & Co.,
Chartered Accountants, who are considered
suitably qualified and experienced for the
purpose and are conversant with the policies and
procedures of the Company, and they (or their
representatives) are involved in the internal
audit function on a full time basis.
19. The statutory auditors of the Company have
confirmed that they have been given a satis-
factory rating under the quality control review
programme of the Institute of Chartered
Accountants of Pakistan, that they or any of the
partners of the firm, their spouses and minor
children do not hold shares of the Company and
that the firm and all its partners are in compliance
with International Federation of Accountants
(IFAC) guidelines on code of ethics as adopted
by the Institute of Chartered Accountants of
Pakistan.
20. The statutory Auditors or the persons associated
with them have not been appointed to provide
other services except in accordance with the
Listing Regulations and the Auditors have
confirmed that they have observed IFAC guide-
lines in this regard.
21. The Management of the Company is committed
to good corporate governance, and appropriate
steps are taken to comply with the best practices.
22. We confirm that all other material principles
contained in the Code have been complied with.
By order of the Board
Ahsan M. Saleem
Chief Executive Officer
29 July 2010
Statement of Compliance with the
Code of Corporate Governance
AN
NU
AL R
EP
OR
T
2010
73

We have reviewed the Statement of Compliance with the best practices contained in the Code of Corporate
Governance prepared by the Board of Directors of Crescent Steel and Allied Products Limited (“the Company”)
to comply with the Listing Regulations of Karachi, Lahore and Islamabad Stock Exchanges where the company is
listed.
The responsibility for compliance with the Code of Corporate Governance is that of the Board of Directors of the
Company. Our responsibility is to review, to the extent where such compliance can be objectively verified, whether
the Statement of Compliance reflects the status of the Company's compliance with the provisions of the Code of
Corporate Governance and report if it does not. A review is limited primarily to inquiries of the Company personnel
and review of various documents prepared by the Company to comply with the Code.
As part of our audit of financial statements we are required to obtain an understanding of the accounting and
internal control systems sufficient to plan the audit and develop an effective audit approach. We are not required to
consider whether the Board's statement on internal control covers all risks and controls, or to form an opinion on
the effectiveness of such internal controls, the Company's corporate governance procedures and risks.
Further, Listing Regulations of the Karachi, Lahore and Islamabad Stock Exchanges require the company to
place before the Board of Directors for their consideration and approval related party transactions distinguishing
between transactions carried out on terms equivalent to those that prevail in arm's length transactions and
transactions which are not executed at arm's length price recording proper justification for using such alternate
pricing mechanism. Further, all such transactions are also required to be separately placed before the audit
committee. We are only required and have ensured compliance of requirement to the extent of approval of related
party transactions by the Board of Directors and placement of such transactions before the audit committee. We
have not carried out any procedures to determine whether the related party transactions were under taken at arm's
length price or not.
Based on our review, nothing has come to our attention which causes us to believe that the Statement of Compliance
does not appropriately reflect the Company's compliance, in all material respects, with the best practices contained
in the Code of Corporate Governance as applicable to the Company for the year ended 30 June 2010.
KPMG Taseer Hadi & Co.
29 July 2010 Chartered Accountants.
Karachi Moneeza Usman Butt
KPMG Taseer Hadi & Co.
Chartered Accountants
First Floor
Sheikh Sultan Trust Building No. 2
Beaumont Road
Karachi 75530 Pakistan
Telephone +92 (21) 3568 5847
Fax +92 (21) 3568 5095
Internet www.kpmg.com.pk
KPMG Taseer Hadi & Co., a partnership firm registered in Pakistan
and a member firm of the KPMG network of independent member
firms affiliated with KPMG International, a Swiss cooperative
Review Report to the Members on Statement of Compliance
with Best Practices of Code of Corporate Governance
AN
NU
AL R
EP
OR
T
2009
74

KPMG Taseer Hadi & Co.
Chartered Accountants
First Floor
Sheikh Sultan Trust Building No. 2
Beaumont Road
Karachi 75530 Pakistan
Telephone +92 (21) 3568 5847
Fax +92 (21) 3568 5095
Internet www.kpmg.com.pk
KPMG Taseer Hadi & Co., a partnership firm registered in Pakistan
and a member firm of the KPMG network of independent member
firms affiliated with KPMG International, a Swiss cooperative
We have audited the annexed balance sheet of Crescent Steel and Allied Products Limited (“the Company”) as at 30 June 2010
and the related profit and loss account, statement of comprehensive income, cash flow statement and statement of changes in
equity together with the notes forming part thereof, for the year then ended and we state that we have obtained all the information
and explanations which, to the best of our knowledge and belief, were necessary for the purposes of our audit.
It is the responsibility of the Company's management to establish and maintain a system of internal control, and prepare and
present the above said statements in conformity with the approved accounting standards and the requirements of the Companies
Ordinance, 1984. Our responsibility is to express an opinion on these statements based on our audit.
We conducted our audit in accordance with the auditing standards as applicable in Pakistan. These standards require that we
plan and perform the audit to obtain reasonable assurance about whether the above said statements are free of any material
misstatement. An audit includes examining, on a test basis, evidence supporting the amounts and disclosures in the above said
statements. An audit also includes assessing the accounting policies and significant estimates made by management, as well
as, evaluating the overall presentation of the above said statements. We believe that our audit provides a reasonable basis for
our opinion and, after due verification, we report that:
a) in our opinion, proper books of account have been kept by the Company as required by the Companies
Ordinance, 1984;
b) in our opinion:
i) the balance sheet and profit and loss account together with the notes thereon have been drawn up
in conformity with the Companies Ordinance, 1984, and are in agreement with the books of
account and are further in accordance with accounting policies consistently applied except for the
changes as described in note 4.1 with which we concur;
ii) the expenditure incurred during the year was for the purpose of the Company's business; and
iii) the business conducted, investments made and the expenditure incurred during the year were in
accordance with the objects of the Company;
c) in our opinion and to the best of our information and according to the explanations given to us, the balance
sheet, profit and loss account, statement of comprehensive income, cash flow statement and statement of
changes in equity together with the notes forming part thereof conform with approved accounting standards
as applicable in Pakistan and give the information required by the Companies Ordinance, 1984, in the
manner so required and respectively give a true and fair view of the state of the Company's affairs as at 30
June 2010 and of the profits, total comprehensive income, its cash flows and changes in equity for the year
then ended; and
d) in our opinion, Zakat deductible at source under the Zakat and Ushr Ordinance, 1980, was deducted by the
Company and deposited in the Central Zakat Fund established under section 7 of that Ordinance.
KPMG Taseer Hadi & Co.29 July 2010 Chartered Accountants.Karachi Moneeza Usman Butt
Auditors’ Report to the Members
AN
NU
AL R
EP
OR
T
2010
75

Crescent Steel & Allied Products Ltd.
Note 2010 2009
(Rupees in '000)
EQUITY AND LIABILITIES
Share capital and reserves
Authorized capital
100,000,000 ordinary shares of Rs. 10 each 1,000,000 1,000,000
Issued, subscribed and paid-up capital 6 564,600 564,600
Capital reserves 361,702 371,513
Revenue reserves 1,696,310 1,392,683
2,622,612 2,328,796
Non-current liabilities
Long term loan 7 ––– 55,880
Deferred taxation 8 71,587 99,787
71,587 155,667
Current liabilities
Trade and other payables 9 871,469 373,887
Interest and mark-up accrued 10 34,198 19,009
Short term borrowings 11 780,288 902,815
Current portion of long term loan 7 56,143 112,500
1,742,098 1,408,211
Total equity and liabilities 4,436,297 3,892,674
Contingencies and commitments 12
Balance SheetAs at 30 June 2010
AN
NU
AL R
EP
OR
T
2010
76

Balance SheetAs at 30 June 2010
Note 2010 2009
(Rupees in '000)
ASSETS
Non-current assets
Property, plant and equipment 13 1,061,380 1,224,588
Intangible assets 14 24,457 811
Investment property 15 44,836 47,169
Long term investments 16 1,185,402 900,096
Long term loans and deposits 17 3,466 3,801
2,319,541 2,176,465
Current assets
Stores, spares and loose tools 18 72,919 83,763
Stock-in-trade 19 1,026,614 616,433
Trade debts 20 276,880 83,927
Advances 21 54,919 39,894
Trade deposits and short term prepayments 22 6,407 6,304
Investments 23 463,746 655,397
Current portion of long term investments 24 17,004 36,493
Mark-up accrued on term finance certificates 820 813
Other receivables 25 25,156 160,620
Taxation - net 26 18,612 28,421
Cash and bank balances 27 153,679 4,144
2,116,756 1,716,209
Total assets 4,436,297 3,892,674
The annexed notes 1 to 48 form an integral part of these financial statements.
DirectorChief Executive
AN
NU
AL R
EP
OR
T
2010
77

Crescent Steel & Allied Products Ltd.
Note 2010 2009
(Rupees in '000)
Sales 28 3,704,388 3,310,869
Cost of sales 29 2,887,295 2,597,190
Gross profit 817,093 713,679
Income from / (loss on) investments 30 171,621 (337,931)
988,714 375,748
Distribution and selling expenses 31 27,017 17,156
Administrative expenses 32 159,134 126,630
Other operating expenses 33 101,420 331,504
287,571 475,290
701,143 (99,542)
Other operating income 34 18,278 38,970
Operating profit before finance costs 719,421 (60,572)
Finance costs 35 121,908 203,571
Profit / (loss) before taxation 597,513 (264,143)
Taxation 36 180,966 134,678
Profit / (loss) after taxation for the year 416,547 (398,821)
(Rupees)
Basic and diluted earnings / (loss) per share 37 7.38 (7.06)
The annexed notes 1 to 48 form an integral part of these financial statements.
DirectorChief Executive
Profit and Loss AccountFor the year ended 30 June 2010
AN
NU
AL R
EP
OR
T
2010
78

2010 2009
(Rupees in '000)
Profit / (loss) after taxation for the year 416,547 (398,821)
Other comprehensive income
Unrealized diminution during the year on
remeasurement of investments classified as
'available for sale' (17,879) (76,655)
Reclassification adjustments relating to losses /
(gains) realized on disposal of 'available for sale'
investment securities 3,048 (18,599)
Impairment loss on 'available for sale' investment
securities 5,020 31,529
Other comprehensive loss for the year (9,811) (63,725)
Total comprehensive income / (loss) for the year 406,736 (462,546)
The annexed notes 1 to 48 form an integral part of these financial statements.
DirectorChief Executive
Statement of Comprehensive IncomeFor the year ended 30 June 2010
AN
NU
AL R
EP
OR
T
2010
79

Crescent Steel & Allied Products Ltd.
DirectorChief Executive
Cash Flow StatementFor the year ended 30 June 2010
AN
NU
AL R
EP
OR
T
2010
80
Note 2010 2009
(Rupees in '000)
Cash flows from operating activities
Cash generated from operations 38 816,217 750,680
Taxes paid (210,441) (189,265)
Financial charges paid (106,719) (204,327)
Contribution to pension and gratuity funds (19,403) (18,111)
Contribution to workers' profit participation fund (27,524) (2,403)
Compensated absences paid (88) (69)
Payment for 10-C bonus (717) (671)
Long term deposits and prepayments - net (20) 89
Net cash generated from operating activities 451,305 335,923
Cash flows from investing activities
Capital expenditure (34,498) (169,115)
Acquisition of intangible assets (7,933) (583)
Proceeds from sale of property, plant and equipment 3,004 1,740
Investments - net 103 162,265
Dividend income received 40,463 67,720
Interest income received 2,244 8,384
Net cash from investing activities 3,383 70,411
Cash flows from financing activities
Repayments against short term loans (126,522) (28,271)
Repayments against long term loan (112,500) (112,500)
Repayment of redeemable capital ––– (75,000)
Dividends paid (70,126) (6,373)
Net cash used in financing activities (309,148) (222,144)
Net increase in cash and cash equivalents 145,540 184,190
Cash and cash equivalents at beginning of the year (644,736) (828,926)
Cash and cash equivalents at end of the year 39 (499,196) (644,736)
The annexed notes 1 to 48 form an integral part of these financial statements.

Issued, Capital reserve Revenue reserves Total
subscribed Share Unrealized General Unappro-and Premium gain/(loss) on reserve priated
paid-up remeasurement profit/capital of available (loss)*
for saleinvestmentsecurities
(Rupees in '000)
Balance as at 1 July 2008 513,273 349,959 85,279 1,842,000 831 2,791,342
Total comprehensive loss for the year
ended 30 June 2009
Loss after taxation for the year ––– ––– ––– ––– (398,821) (398,821)
Other comprehensive income
Unrealized diminution during the year onremeasurement of investments classifiedas 'available for sale' ––– ––– (76,655) ––– ––– (76,655)
Reclassification adjustments relating to gain realized on disposal of 'available for sale' investments securities ––– ––– (18,599) ––– ––– (18,599)
Impairment loss on 'available for sale'investments securities ––– ––– 31,529 ––– ––– 31,529
Other comprehensive loss for the year ––– ––– (63,725) ––– ––– (63,725)––– ––– (63,725) ––– (398,821) (462,546)
Transactions with owners
Bonus shares issued @ 10% for the yearended 30 June 2008 51,327 ––– ––– ––– (51,327) –––
Balance as at 30 June 2009 564,600 349,959 21,554 1,842,000 (449,317) 2,328,796
Total comprehensive income for
the year ended 30 June 2010
Profit after taxation for the year ––– ––– ––– ––– 416,547 416,547
Other comprehensive income
Unrealized diminution during the yearon remeasurement of investments classified as 'available for sale' ––– ––– (17,879) ––– ––– (17,879)
Reclassification adjustments relating to loss realized on disposal of 'available for sale' investments securities ––– ––– 3,048 ––– ––– 3,048
Impairment loss on 'available for sale'investments securities ––– ––– 5,020 ––– ––– 5,020
Other comprehensive loss for the year ––– ––– (9,811) ––– ––– (9,811)––– ––– (9,811) ––– 416,547 406,736
Transactions with owners
Dividend :- First interim @ 10% (i.e. Re. 1 per
share) for the year ended 30 June 2010 ––– ––– ––– ––– (56,460) (56,460)
- Second interim @ 10% (i.e. Re. 1 pershare) for the year ended 30 June 2010 ––– ––– ––– ––– (56,460) (56,460)
––– ––– ––– ––– (112,920) (112,920)564,600 349,959 11,743 1,842,000 (145,690) 2,622,612
* Please refer to note 2.1 to these financial statements.
The annexed notes 1 to 48 form an integral part of these financial statements.
DirectorChief Executive
Statement of Changes in EquityFor the year ended 30 June 2010
AN
NU
AL R
EP
OR
T
2010
81

Crescent Steel & Allied Products Ltd.
1. THE COMPANY AND ITS OPERATIONS
1.1 Crescent Steel and Allied Products Limited ("the Company") was incorporated on 1 August 1983 as
a public limited company in Pakistan under Companies Act, 1913 (now Companies Ordinance, 1984)
and is quoted on all stock exchanges of Pakistan. The registered office of the Company is located at
10th floor, BOP Tower, 10-B, Block E-2, Main Boulevard, Gulberg-III, Lahore.
1.2 The Company's steel segment is one of the down stream industries of Pakistan Steel Mills,
manufacturing large diameter spiral arc welded steel line pipes at Nooriabad (District Dadu). The
Company has a coating facility capable of applying three layer high density polyethylene coating on
steel line pipes. The coating plant commenced commercial production from 16 November 1992.
1.3 The Company acquired a running spinning unit of 14,400 spindles (now 19,680 spindles) at Jaranwala
(District Faisalabad) on 30 June 2000 from Crescent Jute Products Limited. Another spinning unit
CCP-II was added with 25,344 spindles in 2006. The cotton spinning activity is carried out by the
Company under the name and title of "Crescent Cotton Products a division of Crescent Steel and
Allied Products Limited".
2. BASIS OF PREPARATION
2.1 Separate financial statements
These financial statements are the separate financial statements of the Company in which investments in
subsidiaries and associates are accounted for on the basis of direct equity interest rather than on the
basis of reported results and net assets of the investees. Consolidated financial statements of the Company
are prepared separately.
On 4 January 2010, the company has acquired wholly owned subsidiary, Shakarganj Energy (Private)
Limited thereby necessitating the preparation of consolidated financial statements in accordance with
the requirements of the Companies Ordinance, 1984 and the International Accounting Standard (IAS)
27, ‘Consolidated and Separate Financial Statements’. The Company has prepared its separate financial
statements for the first time for the year ended 30 June 2010 and also presented corresponding figures
for the year ended 30 June 2009. This has resulted in all equity accounted investments to be carried at
cost in accordance with the requirement of paragraph 35 of IAS 28, ‘Investments in Associates’.
Prior to the year ended 30 June 2010, the Company in its individual financial statements accounted
for its investments in associates using the equity method of accounting. Consequent to the preparation
of separate financial statements as mentioned above, the Company now accounts for those investments
at cost as more fully explained in note 5.4. Had the Company accounted for its investments using the
equity method of accounting in separate financial statements, the carrying amount of those investments
as at 30 June 2010 would have been higher by Rs. 464.327 million (2009: Rs. 215.248 million). Profit /
(loss) after taxation for the year and earnings / (loss) per share would have been higher / (lower) by Rs.
113.599 million (2009: Rs. 159.072 million) and Rs. 2.01 per share (2009: Rs. 2.81 per share) respectively,
whereas capital reserves would have been lower by Rs. 90.387 million (2009: Rs. 208.873 million).
Notes to the Financial StatementsFor the year ended 30 June 2010
AN
NU
AL R
EP
OR
T
2010
82

The results of the Company based on investments in associates accounted for under the equity method
are reflected in the consolidated financial statements of the Company.
2.2 Statement of compliance
These financial statements have been prepared in accordance with the approved accounting standards
as applicable in Pakistan. Approved accounting standards comprise of such International Financial
Reporting Standards (IFRS) issued by the International Accounting Standards Board as are notified
under the Companies Ordinance, 1984, provisions of and directives issued under the Companies
Ordinance, 1984. In case requirements differ, the provisions of and directives of the Companies
Ordinance, 1984 shall prevail.
2.3 Basis of measurement
These financial statements have been prepared under the historical cost convention except for invest-
ments classified as held for trading and available for sale which are stated at fair value and obligations
in respect of pension and gratuity schemes which are measured at present value.
2.4 Functional and presentation currency
These financial statements are presented in Pakistan Rupees which is also the Company's functional
currency. All financial information presented in Pakistan Rupees has been rounded to the nearest
thousand.
3. USE OF ESTIMATES AND JUDGEMENTS
The preparation of financial statements in conformity with approved accounting standards, as applicable
in Pakistan, requires management to make judgements, estimates and assumptions that affect the
application of policies and the reported amounts of assets, liabilities, income and expenses.
The estimates and associated assumptions are based on historical experience and various other factors
that are believed to be reasonable under the circumstances, the results of which form the basis of making
the judgements about the carrying values of assets and liabilities that are not readily apparent from other
sources. Actual results may differ from these estimates.
The estimates and underlying assumptions are reviewed on an ongoing basis. Revisions to accounting
estimates are recognized in the period in which the estimates are revised if the revision affects only that
period, or in the period of the revision and future periods if the revision affects both current and future
periods.
Judgements made by the management in the application of approved accounting standards, as applicable
in Pakistan, that have significant effect on the financial statements and estimates with a significant risk
of material adjustment in the next year are as follows:
Notes to the Financial StatementsFor the year ended 30 June 2010
AN
NU
AL R
EP
OR
T
2010
83

Income taxes
In making the estimates for income taxes currently payable by the Company, the management looks
at the current income tax laws and the decisions of appellate authorities on certain issues in the past.
Held to maturity investments
The Company has classified certain investments as held to maturity. In this regard, judgement is involved
in evaluating the intention and ability to hold these investments till their respective maturities.
Investment stated at fair value
Management has determined fair value of certain investments by using quotations from active market
conditions and information about the financial instruments. These estimates are subjective in nature
and involve some uncertainties and matters of judgment (e.g. valuation, interest rate, etc.) and therefore,
cannot be determined with precision.
Property, plant and equipment
The Company reviews the rate of depreciation, useful life, residual value and value of assets for possible
impairment on an annual basis. Any change in the estimates in future years might affect the carrying
amounts of the respective items of property, plant and equipment with a corresponding affect on the
depreciation charge and impairment.
Intangible assets
The Company reviews the rate of amortization and value of intangible assets for possible impairment
on an annual basis. Any change in the estimates in future years might affect the carrying amounts of
intangible assets with a corresponding affect on the amortization charge and impairment.
Stock-in-trade and stores and spares
The Company reviews the net realizable value of stock-in-trade and stores, spares and loose tools to
assess any diminution in their respective carrying values. Any change in the estimates in future years
might affect the carrying amounts of stock-in-trade and stores, spares and loose tools with a corresponding
effect on the amortization charge and impairment. Net realizable value is determined with respect to
estimated selling price less estimated expenditure to make the sale.
Staff retirement benefits
Certain actuarial assumptions have been adopted as disclosed in note 41 to the financial statements for
valuation of present value of defined benefit obligations and fair value of plan assets. Changes in these
assumptions in future years may affect the liability under these schemes in those years.
Crescent Steel & Allied Products Ltd.
Notes to the Financial StatementsFor the year ended 30 June 2010
AN
NU
AL R
EP
OR
T
2010
84

4 INITIAL APPLICATION OF NEW STANDARDS, INTERPRETATIONS OR
AMENDMENT TO EXISTING STANDARDS AND FORTHCOMING REQUIREMENTS
4.1 Initial Application
Starting 01 July 2009 the company has changed its accounting policies in the following areas.
• IAS 1 (Revised) - Presentation of financial statements (effective for annual periods beginning on
or after 1 January 2009). The revised standard prohibits the presentation of items of income and
expenses (that is, ‘non-owner changes in equity’) in the statement of changes in equity, requiring
‘non-owner changes in equity’ to be presented separately from owner changes in equity. All
non-owner changes in equity are required to be shown in a performance statement, but entities can
choose whether to present one performance statement (the statement of comprehensive income)
or two statements (the income statement and the statement of comprehensive income). Where
entities restate or reclassify comparative information, they are required to present a restated balance
sheet as at the beginning of comparative period in addition to the current requirement to present
balance sheets at the end of the current period and comparative period.
The company has opted to present two statements; a profit and loss account (income statement)
and a statement of other comprehensive income. Comparative information has also been
represented so that it is in conformity with the revised standard. As this change only impacts
presentation aspects, there is no impact on the earnings per share.
• IAS 23 (Amendment) 'Borrowing costs' (effective for annual periods beginning on or after 1
January 2009). It requires an entity to capitalize borrowing costs directly attributable to the
acquisition, construction or production of a qualifying asset (one that takes a substantial period
of time to get ready for use or sale) as part of the cost of that asset. The option of immediately
expensing those borrowing costs has been removed. The Company’s current accounting policy
for borrowing costs is in compliance with this amendment and therefore there is no effect on
the financial statements.
• IFRS 7 (Amendment), 'Financial Instruments: Disclosures' (effective for annual periods beginning
on or after 1 January 2009). The amendment requires enhanced disclosures regarding fair value
measurement and liquidity risk. As the change only results in additional disclosures, there is no
impact on earnings per share.
• IFRS 8 – Operating Segments (effective for annual periods beginning on or after 1 January 2009).
This IFRS replaces IAS 14, ‘Segment Reporting’. The new standard requires a ‘management
approach’, under which segment information is presented on the same basis as that used for internal
reporting purposes, and introduced detailed disclosures regarding the reportable segments and
products. Although, this standard does not require segment information to be presented in separate
financial statements, the Company has voluntarily opted to present segment information in these
financial statements. As the changes in this standard only result in additional disclosures, there is no
impact on earnings per share.
Notes to the Financial StatementsFor the year ended 30 June 2010
AN
NU
AL R
EP
OR
T
2010
85
• IFRS 5 - Non-current Assets Held for Sale and Discontinued Operations. The Company has made
initial application of this standard for the classification, measurement and presentation of non-
current assets held for sale. As the changes only resulted in presentation and additional disclosures,
there is no impact on earnings per share.
4.2 New accounting standards and IFRIC interpretations that are not yet effective
The following standards, amendments and interpretations of approved accounting standards are
effective from the dates specified below and are either not relevant to Company's operations or are
not expected to have significant impact on the Company's financial statements other than certain
increased disclosures:
IFRS 2 (amendment)-Share-based payments and withdrawal of IFRIC 8- Scope of IFRS 2 and IFRIC
11- Group and Treasury Share Transactions (effective for annual periods beginning on or after 1 January
2010). Amendment provides guidance on the accounting for share based payment transactions among
group entities.
International Accounting Standard (IAS) 24 (revised): Related Party Disclosures (effective for annual
period beginning on or after 1 January 2011). The amendments to IAS 24 simplify the disclosure require-
ments for entities that are controlled, jointly controlled or significantly influenced by a government
(referred to as government-related entities) and clarify the definition of a related party.
Amendments to IAS 32: Classification of Rights Issues (effective for period beginning on or after 1
February 2010). Under the amendment to IAS 32 rights, options and warrants – otherwise meeting the
definition of equity instruments in IAS 32.11 – issued to acquire a fixed number of an entity’s own non-
derivative equity instruments for a fixed amount in any currency are classified as equity instruments,
provided the offer is made pro-rata to all existing owners of the same class of the entity’s own non-
derivative equity instruments.
IFRIC 19 Extinguishing Financial Liabilities with Equity Instruments (effective for period beginning
on or after 1 July 2010). IFRIC 19 clarifies the accounting when an entity extinguish the liability by
issuing its own equity instruments to the creditor.
Amendments to IFRIC 14: Prepayment of a Minimum Funding Requirement (effective for period
beginning on or after 1 July 2011). IFRIC 14, IAS 19 –The Limit on a Defined Benefit Asset, Minimum
Funding Requirements and their Interaction has been amended to remedy an unintended consequence of
IFRIC 14 where entities are in some circumstances not permitted to recognise prepayments of minimum
funding contributions, as an asset.
The International Accounting Standards Board made certain amendments to existing standards as part of
its Second and third annual improvements project. The effective dates for these amendments vary by
standards.
Crescent Steel & Allied Products Ltd.
Notes to the Financial StatementsFor the year ended 30 June 2010
AN
NU
AL R
EP
OR
T
2010
86
5. SUMMARY OF SIGNIFICANT ACCOUNTING POLICIES
5.1 Property, plant and equipment and depreciation
Owned assets
Property, plant and equipment, except freehold land and capital work-in-progress are stated at cost less
accumulated depreciation and impairment losses, if any. Freehold land and capital work-in-progress are
stated at cost.
Subsequent cost
The cost of replacing part of an item of property, plant and equipment is recognized in the carrying amount
of the item if it is probable that the future economic benefits embodied within the part will flow to the
Company and its cost can be measured reliably. The carrying amount of the part so replaced is derecog-
nized. The costs of the day-to-day servicing of property, plant and equipment are recognized in profit
and loss account as incurred.
Depreciation
Depreciation is charged to income on straight line basis at the rates specified in note 13.1 to these
financial statements. Depreciation on additions to property, plant and equipment is charged from the
month in which an item is acquired or capitalized while no depreciation is charged for the month in
which the item is disposed off.
The assets' residual values and useful lives are reviewed at each financial year end and adjusted if
impact on depreciation is significant.
The gain or loss on disposal or retirement of an asset represented by the difference between the sale
proceeds and the carrying amount of the asset is recognized as an income or expense.
Impairment
The carrying amount of property, plant and equipment are reviewed at each balance sheet date to
determined whether there is any indication of impairment. If any such indication exists then the assets
recoverable amount is estimated. The recoverable amount is the greater of its value in use and fair value
less cost to sell. An impairment is recognised if the carrying amount exceed its estimated recoverable
amount.
Leased assets
Leases in terms of which the Company assumes substantially all the risks and rewards of ownership are
classified as finance lease. Asset acquired by way of finance lease is stated at an amount equal to the
lower of its fair value and the present value of minimum lease payments at the inception of the lease
less accumulated depreciation and impairment losses, if any.
Notes to the Financial StatementsFor the year ended 30 June 2010
AN
NU
AL R
EP
OR
T
2010
87

Depreciation is charged on the same basis as used for owned assets.
Financial charges are allocated to accounting period in a manner so as to provide a constant rate of
charge on outstanding liability.
5.2 Intangible assets
Intangible assets acquired by the Company are stated at cost less accumulated amortization and
impairment losses, if any.
Subsequent expenditure
Subsequent expenditure on capitalized intangible assets is capitalized only when it increases the future
economic benefits embodied in the specific assets to which it relates. All other expenditure is expensed
as incurred.
Amortization
Amortization is charged to the income statement on a straight line basis over the estimated useful lives
of intangible assets unless such lives are indefinite. All intangible assets with an indefinite useful life
are systematically tested for impairment at each balance sheet date. Amortization on additions to intan-
gible assets is charged from the month in which an item is acquired or capitalized while no amortization
is charged for the month in which the item is disposed off.
Impairment
Where the carrying amount of assets exceeds its estimated recoverable amount it is written down
immediately to its recoverable amount.
5.3 Investment property
Investment property, principally comprising of land and buildings, is held for long term rental yields /
capital appreciation. The investment properties of the Company comprise of land and buildings and is
valued using the cost method i.e. at cost less any accumulated depreciation and impairment losses, if any.
Depreciation is charged to profit on the straight line method so as to write off the depreciable amount
over its estimated useful life. Depreciation on additions to investment property is charged from the
month in which a property is acquired or capitalized while no depreciation is charged for the month in
which the property is disposed off.
Crescent Steel & Allied Products Ltd.
Notes to the Financial StatementsFor the year ended 30 June 2010
AN
NU
AL R
EP
OR
T
2010
88

The residual values and useful lives of investment property are reviewed at each financial year end
and adjusted if impact on depreciation is significant.
The Company assesses at each balance sheet date whether there is any indication that investment
property may be impaired. If such indication exists, the carrying amounts of such assets are reviewed
to assess whether they are recorded in excess of their recoverable amount. Where carrying values
exceed the respective recoverable amounts, assets are written down to their recoverable amounts and
the resulting impairment loss is recognized in income currently. The recoverable amount is the higher
of an asset's fair value less costs to sell and value in use. Where an impairment loss is recognized, the
depreciation charge is adjusted in the future period to allocate the asset's revised carrying amount over
its estimated useful life.
The gain or loss on disposal of investment property represented by the difference between the sale
proceeds and the carrying amount of the asset is recognized as income or expense.
5.4 Investments
Investments in subsidiaries
Investments in subsidiaries are initially recognized at cost. The carrying amount of investments is
reviewed at each reporting date to determine whether there is any indication of impairment. If any such
indication exist the investments recoverable amount is estimated which is higher of its value in use and
its fair value less cost to sell. An impairment loss is recognized if the carrying amount exceeds its reco-
verable amount. Impairment losses are recognized in profit or loss. An impairment loss is reversed if
there has been a change in estimates used to determine the recoverable amount but limited to the extent
of initial cost of investments. A reversal of impairment loss is recognized in the profit and loss account.
Investments in associates
Investments in associates are initially recognized at cost. The carrying amount of investments is
reviewed at each reporting date to determine whether there is any indication of impairment. If any such
indication exist the investments recoverable amount is estimated which is higher of its value in use and
its fair value less cost to sell. An impairment loss is recognized if the carrying amount exceeds its
recoverable amount. Impairment losses are recognized in profit or loss. An impairment loss is reversed
if there has been a change in estimates used to determine the recoverable amount but limited to the
extent of initial cost of investments. A reversal of impairment loss is recognized in the profit and loss
account.
Notes to the Financial StatementsFor the year ended 30 June 2010
AN
NU
AL R
EP
OR
T
2010
89

Investment at fair value through profit or loss
A non-derivative financial asset is classified as at fair value through profit or loss if it is held for trading
or is designated as such upon initial recognition. Investments are designated at fair value through profit
or loss if the Company manages such investments and makes purchase and sale decisions based on their
fair value. Upon initial recognition, attributable transaction cost are recognized in profit and loss
account when incurred. Investments at fair value through profit or loss are measured at fair value, and
changes therein are recognized in profit and loss account.
Held to maturity
Held to maturity investments are non-derivative financial assets with fixed or determinable payments
and fixed maturity that an entity has the positive intention and ability to hold to maturity.
Investments classified as held to maturity are recognized initially at fair value, plus attributable trans-
action costs. Subsequent to initial recognition, these are stated at amortized cost with any difference
between cost and redemption value being recognized in the profit and loss account over the period of
the investments on an effective yield method.
Loans and receivables
Loans and receivables are recognized initially at fair value, plus attributable transaction costs. Subse-
quent to initial recognition, loans and receivables are stated at amortized cost with any difference
between cost and redemption value being recognized in the profit and loss account over the period of
the investments on an effective yield method.
Available for sale
Other investments not covered in any of the above categories including investments in associates in
which the Company has no significant influence are classified as being available for sale and are
initially recognized at fair value plus attributable transactions costs. Subsequent to initial recognition
these are measured at fair value, with any resultant gain or loss being recognized in other comprehensive
income. Gains or losses on available-for-sale investments are recognized in other comprehensive income
until the investments are sold or disposed off, or until the investments are determined to be impaired, at
that time cumulative gain or loss previously reported in other comprehensive income is included in
current year's profit and loss account.
Fair value of listed securities are the quoted prices on stock exchange on the date it is valued.
Unquoted securities are valued at cost.
Crescent Steel & Allied Products Ltd.
Notes to the Financial StatementsFor the year ended 30 June 2010
AN
NU
AL R
EP
OR
T
2010
90

The Company follows trade date accounting for regular way of purchase and sales of securities, except
for sale and purchase of securities in future market, which are accounted for at settlement date.
Derivative financial instruments
The Company enters into derivative financial instruments, which include future contracts in stock market.
Derivatives are initially recorded at fair value and are remeasured to fair value on subsequent reporting
dates. The fair value of a derivative is equivalent to the unrealized gain or loss from marking to market
the derivative using prevailing market rates. Derivatives with positive market values (unrealized gains)
are included in other receivables and derivatives with negative market values (unrealized losses) are
included in other liabilities in the balance sheet. The resultant gains and losses from derivatives held for
trading purposes are included in income currently. No derivative is designated as hedging instrument by
the Company.
5.5 Non-current assets held for sale
Non-Current assets or disposal groups comprising assets or liabilities, that are expected to be recovered
primarily through sale rather than through continuing use, are classified as held for sale. Immediately
before classification as held for sale, the assets or components of a disposal group, are remeasured in
accordance with Company's accounting policies. Thereafter these are measured at lower of their
carrying amount and fair value less cost to sell.
5.6 Stores and spares
Stores and spares are valued at lower of weighted average cost and net realizable value, less provision
for impairment if any. Items in transit are valued at cost comprising invoice value plus other charges
incurred thereon.
Provision for obsolete and slow moving stores, spares and loose tools is determined based on management's
estimate regarding their future usability.
Net realizable value signifies the estimated selling price in the ordinary course of business less the
estimated costs necessary to be incurred to make the sale.
Spare parts of capital nature which can be used only in connection with an item of property, plant and
equipment are classified as tangible fixed assets under the ‘plant and machinery’ category and are
depreciated over a time period not exceeding the useful life of the related assets.
Notes to the Financial StatementsFor the year ended 30 June 2010
AN
NU
AL R
EP
OR
T
2010
91
5.7 Stock-in-trade
Stock-in-trade is stated at the lower of cost and net realizable value. Cost is arrived at on a weighted
average basis. Cost of work-in-process and finished goods include cost of materials and appropriate
portion of production overheads. Net realizable value is the estimated selling price in the ordinary
course of business less costs of completion and selling expenses. The cost of finished goods of steel
segment is measured on the specific identification method. Scrap stocks are valued at their estimated net
realizable value.
5.8 Trade debts and other receivables
These are initially stated at fair value and subsequently measured at amortized cost using effective
interest rate method less provisions for any uncollectible amounts. An estimate is made for doubtful
receivables when collection of the amount is no longer probable. Debts considered irrecoverable are
written off.
5.9 Cash and cash equivalents
Cash and cash equivalents comprise of cash balances and call deposits. Bank overdrafts that are
repayable on demand and form an integral part of the Company's cash management are included as a
component of cash and cash equivalents for the purpose of cash flow statement.
5.10 Trade and other payables
Trade and other amounts payable are recognized initially at fair value and subsequently carried at
amortized cost.
5.11 Employee benefits
5.11.1 Compensated absences
The Company accounts for all accumulated compensated absences when employees render services that
increase their entitlement to future compensated absences.
5.11.2 Post retirement benefits
5.11.2.1 Defined contribution plan - Provident fund
The Company operates a provident fund scheme for its permanent employees. Equal monthly contribu-
tions are made by the Company and its employees. Obligation for contributions to the fund are recognized
as an expense in the profit and loss account when they are due.
Crescent Steel & Allied Products Ltd.
Notes to the Financial StatementsFor the year ended 30 June 2010
AN
NU
AL R
EP
OR
T
2010
92
Cotton segment
Provision and collection from employees are made at the rate of 6.25 percent of basic pay plus Cost Of
Living Allowance (COLA) of cotton segment employees. A trust has been established and its approval
has been obtained from Commissioner of Income Tax.
All employees except cotton segment
Contributions to the fund are made at the rate of 8.33 percent of basic pay plus COLA for those
employees who have served the Company for a period of less than five years and after completion of
five years, contributions are made at the rate of 10 percent.
5.11.2.2 Defined benefit plans
Pension and gratuity fund schemes
The Company operates pension and gratuity fund schemes for its permanent management employees as
per the terms of employment.
The pension scheme provides life time pension to retired employees or to their spouses.
Contributions are paid to the pension and gratuity funds on the basis of actuarial recommendations.
The cost of providing benefits is determined using the projected unit credit method, with actuarial
valuations being carried out at each balance sheet date. Actuarial gains and losses which exceed 10
percent of the greater of the present value of the Company’s obligations and the fair value of plan assets
are amortized over the expected average remaining working lives of the eligible employees. Past service
cost is recognized immediately to the extent that the benefits are already vested. For non-vested benefits
past service cost is amortized on a straight line basis over the average period until the amended benefits
become vested.
Amounts recognized in the balance sheet represent the present value of the defined benefit obligation as
adjusted for unrecognized actuarial gains and losses and unrecognized past service cost and as reduced
by the fair value of plan assets. Any assets resulting from this calculation is limited to the unrecognized
actuarial losses and unrecognized past service cost plus the present value of available refunds and
reductios in future contributions to the plan.
Notes to the Financial StatementsFor the year ended 30 June 2010
AN
NU
AL R
EP
OR
T
2010
93

5.12 Mark-up bearing borrowings
Mark-up bearing borrowings are recognized initially at fair value, less attributable transaction costs.
Subsequent to initial recognition, mark-up bearing borrowings are stated at amortized cost with any
difference between cost and redemption value being recognized in the profit and loss account over the
period of the borrowings on an effective interest basis.
5.13 Taxation
Current
Provision for current taxation is based on taxable income at the current rates of taxation after taking into
account tax credits and tax rebates available, if any.
Deferred
Deferred tax is provided using the balance sheet liability method, providing for temporary differences
between the carrying amount of assets and liabilities for financial reporting purposes and the amounts
used for taxation purposes. The amount of deferred tax provided is based on the expected manner of
realization or settlement of the carrying amount of assets and liabilities, using the rates that are expected
to apply to the period when the differences reverse based on tax rates that have been enacted at the
balance sheet date.
Deferred tax liabilities are recognized for all taxable temporary differences. A deferred tax asset is
recognized only to the extent that it is probable that future taxable profits will be available against which
the asset can be utilized. Deferred tax asset is reduced to the extent that it is no longer probable that the
related tax benefits will be realized.
5.14 Borrowing costs
Borrowing costs incurred on long term finances directly attributable for the construction/acquisition of
qualifying assets are capitalized up to the date, the respective assets are available for the intended use.
All other mark-up, interest and other related charges are taken to the profit and loss account currently.
5.15 Revenue recognition
Revenue from sales is recognized when significant risks and rewards of ownership are transferred to the
buyer.
Crescent Steel & Allied Products Ltd.
Notes to the Financial StatementsFor the year ended 30 June 2010
AN
NU
AL R
EP
OR
T
2010
94

Interest income is recognized on accrual basis using effective interest method. Dividend income is
recognized when the right to receive the same is established i.e. the book closure date of the investee
company declaring the dividend.
Gains and losses on sale of investments are accounted for when the commitment (trade date) for sale of
security is made.
Unrealized gains / (losses) arising on revaluation of securities classified as 'held for trading' are included
in profit and loss account in the period in which they arise. Gains / (losses) arising on revaluation of
derivatives to the fair value are taken to profit and loss account.
Rental income (net of any incentives given to lessees) from investment property is recognized on a
straight line basis over the lease term.
Miscellaneous income is recognized on receipt basis.
5.16 Provisions
A provision is recognized in the balance sheet when the Company has a legal or constructive obligation
as a result of past events, it is probable that an outflow of economic benefits will be required to settle
the obligation and a reliable estimate can be made of the amount of the obligation. Provisions are
reviewed at each balance sheet date and adjusted to reflect the current best estimate.
5.17 Impairment
The carrying amount of the Company's assets is reviewed at each balance sheet date to determine
whether there is any objective evidence that an asset or group of assets may be impaired. If any such
evidence exists, the asset or group of assets' recoverable amount is estimated. An impairment loss is
recognized whenever the carrying amount of an asset exceeds its recoverable amount. Impairment losses
are recognized in profit and loss account.
5.18 Foreign currency translation
Foreign currency transactions are translated into Pak Rupees at exchange rates prevailing on the date of
transaction. Monetary assets and liabilities in foreign currencies are translated into Pak Rupees at the
rates of exchange prevailing at the balance sheet date. Exchange differences, if any, are taken to profit
and loss account.
Notes to the Financial StatementsFor the year ended 30 June 2010
AN
NU
AL R
EP
OR
T
2010
95

5.19 Offsetting of financial assets and financial liabilities
Financial assets and financial liabilities are set off and only the net amount is reported in the balance
sheet when there is a legally enforceable right to set off the recognized amount and the Company
intends to either settle on a net basis, or to realize the asset and settle the liability simultaneously.
5.20 Segment reporting
Operating segments are reported in a manner consistent with the internal reporting structure.
Management monitors the operating results of its business units separately for the purpose of
making decisions regarding resource allocation and performance assessment.
Segment results, assets and liabilities include items directly attributable to segment as well as those
that can be allocated on a reasonable basis. Segment assets consist primarily of property, plant and
equipment, intangibles, stores and spares, stock in trade and trade and other debts. Segment liabilities
comprise of operating liabilities and exclude items such as taxation and corporate.
Segment capital expenditure is the total cost incurred during the year to acquire property, plant and
equipment and intangible assets.
5.21 Proposed dividend and transfer between reserves
Dividend distributions to the Company's shareholders are recognized as a liability in the period in which
dividends are approved. Transfer between reserves made subsequent to the balance sheet date is
considered as non-adjusting event and is recognized in the financial statements in the period in which
such transfers are made.
6. ISSUED, SUBSCRIBED AND PAID-UP-CAPITAL
2010 2009 2010 2009
(Number of shares) (Rupees in '000)
22,230,188 22,230,188 Ordinary shares of Rs. 10 each
fully paid in cash 222,302 222,302
34,229,805 34,229,805 Ordinary shares of Rs. 10 each
fully issued as bonus shares 342,298 342,298
56,459,993 56,459,993 564,600 564,600
Crescent Steel & Allied Products Ltd.
Notes to the Financial StatementsFor the year ended 30 June 2010
AN
NU
AL R
EP
OR
T
2010
96

6.1 Ordinary shares of the Company held by associated undertakings as at year end are as follows:
2010 2009
Percentage (Number of Percentage (Number of
of holding shares) of holding shares)
Shakarganj Mills Limited 4.82% 2,720,062 4.99% 2,820,062
Crescent Sugar Mills &
Distillery Limited 1.31% 742,422 1.81% 1,019,968
Muhammad Amin Muhammad
Bashir Limited 0.00% 618 0.00% 618
The Crescent Textile Mills Limited 11% 6,209,676 11% 6,209,676
Premier Insurance Limited ––– ––– 0.06% 35,140
7. LONG TERM LOAN
2010 2009
(Rupees in '000)
Secured from a banking company
Allied Bank Limited 7.1 168,380 280,617
Amortization of initial transaction costs 263 263
Repayments (112,500) (112,500)
56,143 168,380
Current portion (56,143) (112,500)
––– 55,880
7.1 Mark-up rate on the above loan is 6 months KIBOR prevailing on the base rate setting date plus 1.9 percent
per annum. Mark-up is payable on a quarterly basis. The effective mark-up charged during the year ranges
from 14.25% to 14.95% (2009: 14.94% to 17.55%) per annum.
The tenor of the loan is five years. Principal is repayable on a quarterly basis with one year grace period.
The loan was disbursed on 17 December 2005.
This facility has been secured against first equitable mortgage pari passu charge on all present and future
fixed assets including land and building with 25% margin.
Notes to the Financial StatementsFor the year ended 30 June 2010
AN
NU
AL R
EP
OR
T
2010
97
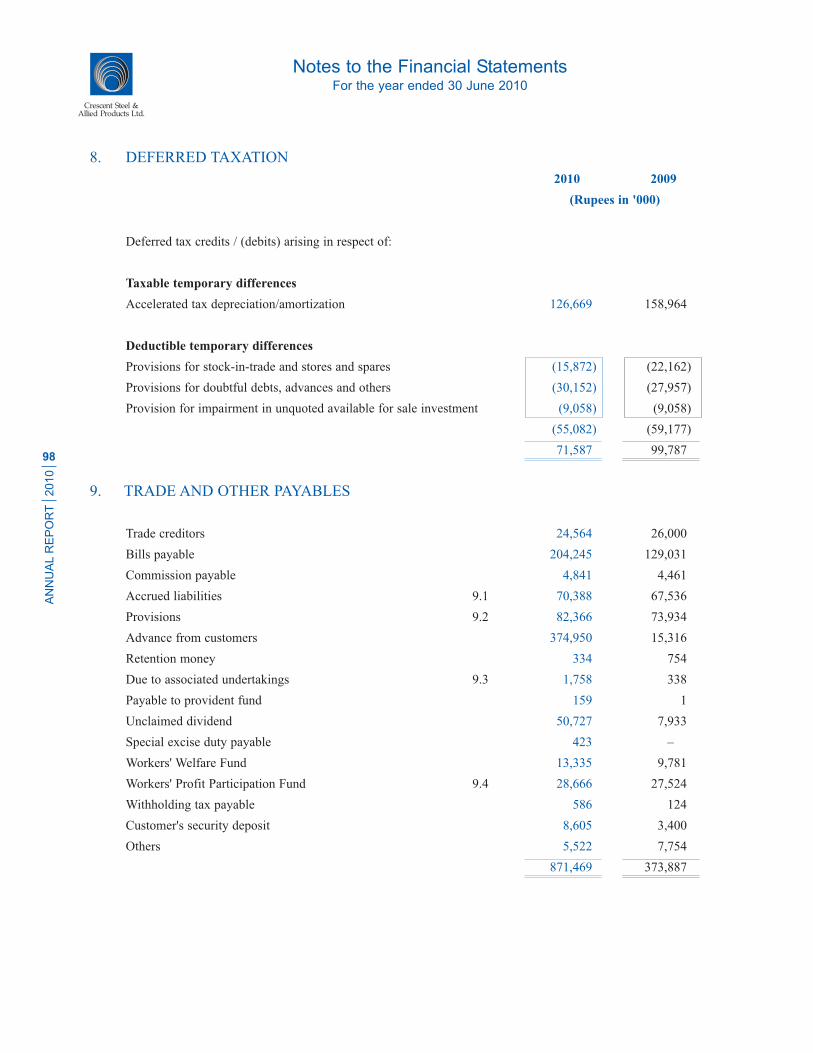
8. DEFERRED TAXATION
2010 2009
(Rupees in '000)
Deferred tax credits / (debits) arising in respect of:
Taxable temporary differences
Accelerated tax depreciation/amortization 126,669 158,964
Deductible temporary differences
Provisions for stock-in-trade and stores and spares (15,872) (22,162)
Provisions for doubtful debts, advances and others (30,152) (27,957)
Provision for impairment in unquoted available for sale investment (9,058) (9,058)
(55,082) (59,177)
71,587 99,787
9. TRADE AND OTHER PAYABLES
Trade creditors 24,564 26,000
Bills payable 204,245 129,031
Commission payable 4,841 4,461
Accrued liabilities 9.1 70,388 67,536
Provisions 9.2 82,366 73,934
Advance from customers 374,950 15,316
Retention money 334 754
Due to associated undertakings 9.3 1,758 338
Payable to provident fund 159 1
Unclaimed dividend 50,727 7,933
Special excise duty payable 423 –––
Workers' Welfare Fund 13,335 9,781
Workers' Profit Participation Fund 9.4 28,666 27,524
Withholding tax payable 586 124
Customer's security deposit 8,605 3,400
Others 5,522 7,754
871,469 373,887
Crescent Steel & Allied Products Ltd.
Notes to the Financial StatementsFor the year ended 30 June 2010
AN
NU
AL R
EP
OR
T
2010
98

9.1 Accrued liabilities
2010 2009
(Rupees in '000)
Salaries, wages and other benefits 15,703 8,211
Accrual for 10-C bonus 911 820
Compensated absences 8,480 6,687
Others 45,294 51,818
70,388 67,536
9.2 Movement of provisions
Infrastructure Sales Liquidated Total
fee Tax damages
(Rupees in '000)
(Note9.2.1) (Note9.2.2) (Note9.2.3)
Opening balance 1 July 2009 49,419 3,242 21,273 73,934
Provision for the year 9,097 ––– 2,823 11,920
Reversal of provision for the year (3,488) ––– ––– (3,488)
Closing balance 30 June 2010 55,028 3,242 24,096 82,366
9.2.1 This has been made against infrastructure fee levied by Government of Sindh through Sindh Finance
(Amendment) Ordinance, 2001. The Company has provided bank guarantees amounting to Rs. 70 million
(2009: Rs. 55 million) in favour of Excise and Taxation Department. The Company has contested this
issue in High Court. Current year charge has been calculated on the value of imports during the year and
forms a component of cost of such imported raw materials. During the year ended 30 June 2009, the
Company filed an appeal in Supreme Court against the judgement of the High Court dated 15 September
2008 partly accepting the appeal by declaring that the levy and collection of infrastructure fee prior to
28 December 2006 was illegal and ultra vires and after that it was legal. Additionally Sindh government
also filed appeal against the part of judgement decided against them.
9.2.2 These have been made against sales tax claims long outstanding with the sales tax department.
9.2.3 The provision has been made on account of liquidated damages claimed by a customer on delayed
supply of goods. The Company is in process of negotiating this matter and expects that this may be
resolved. However, on a prudent basis full provision has been made.
9.3 This represents expenses incurred by associated undertakings on behalf of the Company and insurance
premium payable to associated undertakings.
Notes to the Financial StatementsFor the year ended 30 June 2010
AN
NU
AL R
EP
OR
T
2010
99

9.4 Workers' Profit Participation Fund
2010 2009
(Rupees in '000)
Balance at beginning of the year 27,524 2,403
Mark-up on funds utilized in the Company's business 35 3,141 89
Allocation for the year 33 28,666 27,524
59,331 30,016
Amount paid to the trustees of the fund (30,665) (2,492)
Balance at end of the year 28,666 27,524
10. INTEREST AND MARK-UP ACCRUED
- Long Term Loan 329 1,037
- Running Finance and Short term loans 33,869 17,972
34,198 19,009
11. SHORT TERM BORROWINGS
Secured from banking companies
Running finances under mark-up arrangements 652,875 648,880
Short term loans/Murabaha 127,413 253,935
780,288 902,815
11.1 Short term running finance available from various commercial banks under mark-up arrangements
amounted to Rs. 911 million (30 June 2009: Rs. 1,450 million) out of which Rs. 600 million (30 June
2009: Rs. 1,150) is interchangeable with Term Finance/Demand Finance and letters of credit. The rate
of mark-up ranged between 13.49% to 15.79% (2009: 12.52% to 18.50%) per annum.
11.2 Short term loan/murabaha financing available from various commercial banks under mark-up arrange-
ments amounted to Rs. 700 million (30 June 2009: Rs. 1,400 million). During the year, the mark-up on
such arrangement ranged between 12.74% to 15.34% (2009: 13.22% to 18.09%) per annum.
11.3 The facilities for opening letters of credit amounted to Rs. 1,750 million (30 June 2009: Rs. 2,600 million)
out of which Rs. 600 million (30 June 2009: Nil) is interchangeable with short term running finance as
mentioned in note 11.1 above. The facility for letter of guarantees as at 30 June 2010 amounted to Rs. 717
million (30 June 2009: 800 million). Amounts unutilized for letters of credit and guarantees as at 30 June
2010 were Rs. 1,520.844 million and Rs. 54.131 million respectively (30 June 2009: Rs. 2,443 million
and Rs. 546 million).
Crescent Steel & Allied Products Ltd.
Notes to the Financial StatementsFor the year ended 30 June 2010
AN
NU
AL R
EP
OR
T
2010
100

11.4 The above facilities are secured by way of hypothecation of plant and machinery, stock-in-trade, trade
debts and other current assets, pledge of shares and cotton/cotton yarn; and lien over import/export
document.
12. CONTINGENCIES AND COMMITMENTS
12.1 The Company has filed a suit in the Sindh High Court against Federation of Pakistan and others, for
levy of import license fee at 6% against import of coating plant in 1992. The Company contested that as
per SRO 1317(I)/94 dated 22 December 1990, the coating plant being located in rural area, is only
liable to pay 2% of import license fee. The Company has provided bank guarantee of Rs. 3.42 million as
directed by the Honourable Court. The petition was dismissed by High Court as having been
incompetently filed. The Company has filed the appeal with Honourable Supreme Court and no hearing
has taken place since then. No provision has been made in the financial statements as management
considers that the case would be decided in Company's favour.
12.2 Sindh Industrial Trade Estate (SITE) has cancelled allotment of plot A-26 and A-27 and charged non-
utilization fees of Rs. 0.285 million and Rs. 0.621 million respectively. The Company has challenged the
cancellation and filed a suit in Sindh High Court. The High Court has restrained SITE from taking any
adverse action against the Company. Therefore, management considers that the case would be decided
in Company's favour and no provision is required.
12.3 Aggregate amount of guarantees issued by the banks on behalf of the Company against various
contracts aggregated Rs. 662.869 million (30 June 2009: Rs. 253.79 million).
12.4 Commitments in respect of capital expenditure contracted for as at 30 June 2010 amounted to Rs.
19.164 million (30 June 2009: Rs. 24.56 million), payable over the period of three years in 15 quarterly
installments for office premises located in Islamabad.
12.5 Commitments under letters of credit as at 30 June 2010 amounted to Rs. 24.911 million (30 June 2009:
Rs. Nil).
13. PROPERTY, PLANT AND EQUIPMENT
2010 2009
(Rupees in '000)
Operating fixed assets 13.1 956,113 1,092,889
Capital work-in-progress 13.5 105,267 131,699
1,061,380 1,224,588
Notes to the Financial StatementsFor the year ended 30 June 2010
AN
NU
AL R
EP
OR
T
2010
101

13.1 Operating fixed assets
Description Land Buildings
Freehold Leasehold On On
including freehold Lease hold
improvement Land
(Rupees in '000)
Net carrying value as at 1 July 2009
Opening net book value (NBV) 13.1.1 122,575 4,183 225,274 10,346
Additions/transfers ––– ––– ––– –––
Disposals (at NBV) 13.6 ––– ––– ––– –––
Depreciation charge 13.2 ––– (53) (28,784) (1,674)
Balance as at 30 June 2010 (NBV) 122,575 4,130 196,490 8,672
Gross carrying value as at
30 June 2010
Cost 13.3 122,575 5,646 310,758 70,027
Accumulated depreciation ––– (1,516) (114,268) (61,355)
Net book value 122,575 4,130 196,490 8,672
Net carrying value as at
1 July 2008
Opening net book value (NBV) 69,242 4,236 209,612 12,020
Additions 53,333 ––– 42,913 –––
Disposals (at NBV) ––– ––– ––– –––
Depreciation charge ––– (53) (27,251) (1,674)
Balance as at 30 June 2009 (NBV) 122,575 4,183 225,274 10,346
Gross carrying value as at
30 June 2009
Cost 122,575 5,646 310,758 70,027
Accumulated depreciation ––– (1,463) (85,484) (59,681)
Net book value 122,575 4,183 225,274 10,346
Depreciation rate (% per annum) ––– 1 ––– 5
* Net book value of plant and machinery includes book value of Rs. 1.544 million (2009: Rs. 1.73 million) of capitalized spares.
Crescent Steel & Allied Products Ltd.
Notes to the Financial StatementsFor the year ended 30 June 2009
AN
NU
AL R
EP
OR
T
2010
102

Office Plant and Electrical / Furniture Computers Motor TOTAL
premises Machinery Office and vehicles
* equipment and fittings
Installation
(Rupees in '000)
10,493 681,378 10,325 2,668 6,844 18,803 1,092,889
––– 28,041 1,433 148 977 2,580 33,179
––– (6) (147) ––– (95) (168) (416)
(2,620) (123,473) (2,775) (432) (3,993) (5,735) (169,539)
7,873 585,940 8,836 2,384 3,733 15,480 956,113
40,493 1,649,252 33,179 16,251 46,903 54,988 2,350,072
(32,620) (1,063,312) (24,343) (13,867) (43,170) (39,508) (1,393,959)
7,873 585,940 8,836 2,384 3,733 15,480 956,113
13,113 762,716 11,847 2,864 16,674 24,124 1,126,448
––– 40,080 1,155 237 1,886 3,203 142,807
––– ––– ––– ––– ––– (1,474) (1,474)
(2,620) (121,418) (2,677) (433) (11,716) (7,050) (174,892)
10,493 681,378 10,325 2,668 6,844 18,803 1,092,889
40,493 1,621,217 32,023 16,103 51,517 60,470 2,330,829
(30,000) (939,839) (21,698) (13,435) (44,673) (41,667) (1,237,940)
10,493 681,378 10,325 2,668 6,844 18,803 1,092,889
10 5 - 20 5 & 20 10 33.33 20
Notes to the Financial StatementsFor the year ended 30 June 2009
AN
NU
AL R
EP
OR
T
2010
103

13.1.1 This includes freehold land measuring 1.976 acres (71,150 square feet) provisionally allotted to the
Company in Woven Garment Zone Value Addition City by Faisalabad Industrial Estate Development
Management Company (FIEDMC), which is owned by the Government of Punjab. Final sale deed
execution in Company's name is subject to certain conditions which include installation of industrial
unit and obtaining completion certificate from FIEDMC.
13.2 The depreciation charge for the year has been allocated as follows:
2010 2009
(Rupees in '000)
Cost of sales 29 159,604 155,915
Distribution and selling expenses 31 224 260
Administrative expenses 32 9,711 18,717
169,539 174,892
13.3 Property, plant and equipment as at 30 June 2010 include items having an aggregate cost of Rs. 674.899
million that have been fully depreciated and are still in use by the Company.
13.4 The fair value of operating fixed assets as at 30 June 2010 approximated to Rs. 2,252.631 million.
13.5 Capital Work-in-Progress
2010 2009
(Rupees in '000)
Plant and machinery 3,307 4,580
Civil work 13.5.1 101,960 100,662
Software 13.5.2 ––– 26,457
105,267 131,699
13.5.1 This includes advance against purchase of land amounting to Rs. 40 million (30 June 2009: Rs. 40 million).
13.5.2 As at 30 June 2009, software includes expenditure incurred on acquiring license and implementing
Enterprise Resource Planning (ERP) software (Oracle) which has been transferred to intangible assets
during the year.
Crescent Steel & Allied Products Ltd.
Notes to the Financial StatementsFor the year ended 30 June 2010
AN
NU
AL R
EP
OR
T
2010
104

13.6 The following assets were disposed off during the year:
Description Cost Accumulated Book Sale Mode of Particular
depreciation value proceeds disposal of buyers
(Rupees in '000)
Motor vehicles 504 504 –– 175 Company Scheme Mr. Sikandar Soomro
(employee)
63 –– 63 63 Insurance Claim EFU Insurance
Electrical
equipment 259 108 151 151 Negotiation Desert Sound, Karachi
Others 13,104 12,902 202 2,615 Various Various
2010 13,930 13,514 416 3,004
2009 4,838 3,364 1,474 1,740
14. INTANGIBLE ASSETS
2010 2009
(Rupees in '000)
Net carrying value as at 1 July
Net book value as at 1 July 811 620
Additions / transfers (at cost) 33,589 583
Amortization 14.1 (9,943) (392)
Net book value as at 30 June 14.2 & 14.3 24,457 811
Gross carrying value as at 30 June
Cost 45,734 12,145
Accumulated amortization (18,637) (8,694)
Accumulated impairment (2,640) (2,640)
Net book value 24,457 811
Amortization rate (% per annum) 33.33 33.33
14.1 The amortization charge for the year has been allocated as follows:
Cost of sales 29 24 119
Administrative expenses 32 9,919 273
9,943 392
Notes to the Financial StatementsFor the year ended 30 June 2010
AN
NU
AL R
EP
OR
T
2010
105

14.2 Intangible assets as at 30 June 2010 includes ERP software (Oracle) implemented and used by the Company
having carrying amount of Rs. 21.658 million (30 June 2009: Nil) and remaining unamortized period of 25
months (30 June 2009: Nil).
14.3 Intangible assets as at 30 June 2010 include items having an aggregate cost of Rs. 8.466 million that have
been fully amortized and are still in use of the Company.
15. INVESTMENT PROPERTY
Leasehold Building Office Total
Land and on Lease- Premises
Improv- hold
ment Land
(Rupees in '000)
Net carrying value as at 1 July 2009
Opening net book value (NBV) 2,456 20,176 24,537 47,169
Additions 2,095 ––– ––– 2,095
Depreciation charge 15.1 (64) (1,080) (3,284) (4,428)
Balance as at 30 June 2010 (NBV) 15.2 4,487 19,096 21,253 44,836
Gross carrying value as at 30 June 2010
Cost 4,609 21,608 29,655 55,872
Accumulated depreciation (122) (2,512) (8,402) (11,036)
Net book value 4,487 19,096 21,253 44,836
Balance as at 1 July 2008 2,485 21,256 26,262 50,003
Additions ––– ––– 1,392 1,392
Depreciation charge (29) (1,080) (3,117) (4,226)
Balance as at 30 June 2009 (NBV) 2,456 20,176 24,537 47,169
Depreciation rate (% per annum) 1 & 10 5 5 to 20
15.1 Depreciation charged for the year has been allocated to administrative expenses.
15.2 Fair value of the investment property based on recent valuation is Rs. 124.400 million (30 June 2009:
Rs. 93 million).
Crescent Steel & Allied Products Ltd.
Notes to the Financial StatementsFor the year ended 30 June 2010
AN
NU
AL R
EP
OR
T
2010
106

16. LONG TERM INVESTMENT
2010 2009
(Rupees in '000)
Subsidiary companies - at cost 16.1 330,100 –––
Associated companies - at cost 16.2 651,418 816,205
Other long term investments 16.3 203,884 83,891
1,185,402 900,096
16.1 Subsidiary companies - at cost
2010 2009 2010 2009
(Number of shares) (Rupees in '000)
Unquoted
33,010,000 ––– Shakarganj Energy
(Private) Limited 16.1.1 330,100 –––
(Chief Executive Officer -
Mr. Muhammad Saad Thaniana)
2 2 Crescent Continental
Gas Pipelines Limited
(US $ 1 each) 16.1.2 ––– –––
33,010,002 2 330,100 –––
16.1.1 This represents the Company's investment in 100% equity shares of Shakarganj Energy (Private) Limited
(SEL). The Company acquired 10,000 ordinary shares of Rs. 10 each in SEL on 4 January 2010 for a total
consideration of Rs. 0.100 million. Further the Company has also fully subscribed to right issues made by
SEL aggregating 33 million ordinary shares for Rs. 330 million.
16.1.2 This represents investment in subsidiary of Rs. 90 only. The subsidiary company has not commenced
operation and accordingly no financial statements have been prepared.
16.2 Associated companies - at cost
2010 2009 2010 2009
(Number of shares) (Rupees in '000)
Quoted
60,475,416 60,475,416 Altern Energy Limited 16.2.1 593,488 593,488
(Chief Executive Officer -
Mr. Sheikh Muhammad Iqbal)
15,244,665 15,244,665 Shakarganj Mills Limited 388,562 388,562
(Chief Executive Officer -
Mr. Ahsan M. Salem)
982,050 982,050
Notes to the Financial StatementsFor the year ended 30 June 2010
AN
NU
AL R
EP
OR
T
2010
107

2010 2009 2010 2009
(Number of shares) (Rupees in '000)
Unquoted
––– 12,000,000 Shakarganj Food
Products Limited 16.2.2 ––– 120,000
(Chief Executive Officer -
Mr. Anjum M. Saleem)
––– 2,185,096 Safeway Fund Limited 16.2.3 ––– 81,250
(Chief Executive Officer -
Mr. Nihal Cassim)
982,050 1,183,300
Less: Provision for impairment 330,632 367,095
651,418 816,205
16.2.1 The Company holds 17.65% shareholding in Altern Energy Limited and has no common directorship. In the
consolidated financial statements, the investee has been treated as an associate due to the Group companies’
effective holding of over 20%. Consequently, as per the requirements of IAS 28 ‘Investment in Associates’,
the investee company has also been treated as an associate in these financial statements.
16.2.2 The investment in Shakarganj Food Products Limited has been transferred to investment in available for sale
securities as the company considers that it no longer has significant influence over the investee company.
16.2.3 The investment in Safeway Fund Limited has been disposed off during the year.
16.2.4 Market value/break-up of investments in associates are as follows:
2010 2009
(Rupees in '000)
Quoted
Altern Energy Limited 624,711 483,803
Shakarganj Mills Limited 57,930 77,748
682,641 561,551
Unquoted*
Shakarganj Food Products Limited ––– 39,814
Safeway Fund Limited ––– 24,969
––– 64,783
682,641 626,334
*Break-up value of shares is based on latest available unaudited condensed interim financial information as
at 31 March 2010.
Crescent Steel & Allied Products Ltd.
Notes to the Financial StatementsFor the year ended 30 June 2010
AN
NU
AL R
EP
OR
T
2010
108

16.2.5 Percentage holding of equity investments in associates are as follows:
2010 2009
%
Quoted
Altern Energy Limited 17.65 17.65
Shakarganj Mills Limited 21.93 21.93
Unquoted
Shakarganj Food Products Limited ––– 9.33
Safeway Fund Limited ––– 25.00
16.3 Other long term investments
2010 2009
(Rupees in '000)
Related parties
Held to maturity 24.1 ––– 29,994
Available for sale 16.3.1 ––– –––
Others
Available for sale 16.3.4 178,946 58,946
Held to maturity 16.3.5 24,938 26,781
203,884 115,721
Less: Current maturity of Maple Leaf Cement Limited
(Preference Shares) and Shakarganj Mills Limited
(Preference Shares) 24 & 16.3.5 ––– 31,830
203,884 83,891
16.3.1 Available-for-sale
2010 2009 2010 2009
(Number of shares) (Rupees in '000)
Unquoted
2,403,725 2,403,725 Crescent Bahuman Limited 16.3.2 24,037 24,037
1,047,000 1,047,000 Crescent Industrial Chemicals
Limited 16.3.3 10,470 10,470
34,507 34,507
Less: Provision for impairment 34,507 34,507
––– –––
16.3.2 The chief executive of Crescent Bahuman Limited is Mr. Nasir Shafi. The company's break up value of shares
could not be ascertained as the latest financial statements of the company are not available.
16.3.3 The chief executive of Crescent Industrial Chemicals Limited is Mr. Tariq Shafi. The company's break up
value of shares could not be ascertained as the financial statements of the company are not available.
Notes to the Financial StatementsFor the year ended 30 June 2010
AN
NU
AL R
EP
OR
T
2010
109

16.3.4 Available-for-sale
2010 2009 2010 2009
(Number of shares) (Rupees in '000)
Unquoted
1,425,000 1,425,000 Central Depository Company of
Pakistan Limited 58,946 58,946
12,000,000 ––– Shakarganj Food Products Limited 120,000 –––
178,946 58,946
16.3.5 Held to maturity
Term Finance Certificates 16.3.6 24,938 24,945
Maple Leaf Cement Limited (Preference Shares) 24.2 ––– 1,836
24,938 26,781
Less: Current maturity of Maple Leaf Cement Limited
(Preference Shares) ––– 1,836
24,938 24,945
16.3.6 Term Finance Certificates (TFCs)
United Bank Limited (5,000 TFCs of Rs. 5,000 each) 24,948 24,955
Current maturity shown under current assets (10) (10)
24,938 24,945
This represents investments in TFCs issued on 10 February 2004 by United Bank Limited. The tenor of the
TFCs are eight years with semi-annual installments comprising of principal and profit. The rate of profit is
8.45 percent per annum. Fair value of the TFCs as at 30 June 2010 amounted to Rs. 22.718 million (2009:
Rs. 21.618 million).
17. LONG TERM LOANS AND DEPOSITS
2010 2009
(Rupees in '000)
Security deposits 3,193 3,174
Long term loans - considered good 17.1 273 627
3,466 3,801
17.1 This represents interest free house loans provided to employees for a period of 5 years.
Crescent Steel & Allied Products Ltd.
Notes to the Financial StatementsFor the year ended 30 June 2010
AN
NU
AL R
EP
OR
T
2010
110

18. STORES, SPARES AND LOOSE TOOLS2010 2009
(Rupees in '000)
Stores - steel segment 10,463 8,474
Spare parts - steel segment 18.1 38,352 38,873
Loose tools - steel segment 890 954
Stores and spares - cotton segment 18.2 44,482 49,267
94,187 97,568
Provision for slow moving items 18.3 (21,268) (13,805)
72,919 83,763
18.1 This includes items in-transit as at 30 June 2010 of Rs. 0.830 million (2009: Rs. Nil).
18.2 This includes items in-transit as at 30 June 2010 of Rs. 6.638 million (2009: Rs. 9.09 million).
18.3 Movement of provision for slow moving items
2010 2009
(Rupees in '000)
Opening balance 13,805 17,244
Provision/(reversal of provision) made during the year 7,463 (3,439)
Closing balance 21,268 13,805
19. STOCK-IN-TRADE
Raw materials
Hot rolled steel coils (HR Coil) 379,555 34,122
Coating materials 50,585 54,694
Others 25,610 25,021
Raw cotton 19.1 95,989 172,608
Stock-in-transit 19.2 318,812 199,699
870,551 486,144
Provision for obsolescence and slow-moving raw materials
HR Coil 19.5 ––– (10,310)
Coating materials 19.5 ––– (84)
Others 19.5 ––– (187)
––– (10,581)
870,551 475,563
Work-in-process 29.1 30,156 15,401
Finished goods 19.3 & 29.1 114,925 129,620
Scrap/cotton waste 10,982 10,702
Provision for obsolescence and slow-moving
finished goods 19.6 ––– (14,853)
156,063 140,870
1,026,614 616,433
Notes to the Financial StatementsFor the year ended 30 June 2010
AN
NU
AL R
EP
OR
T
2010
111
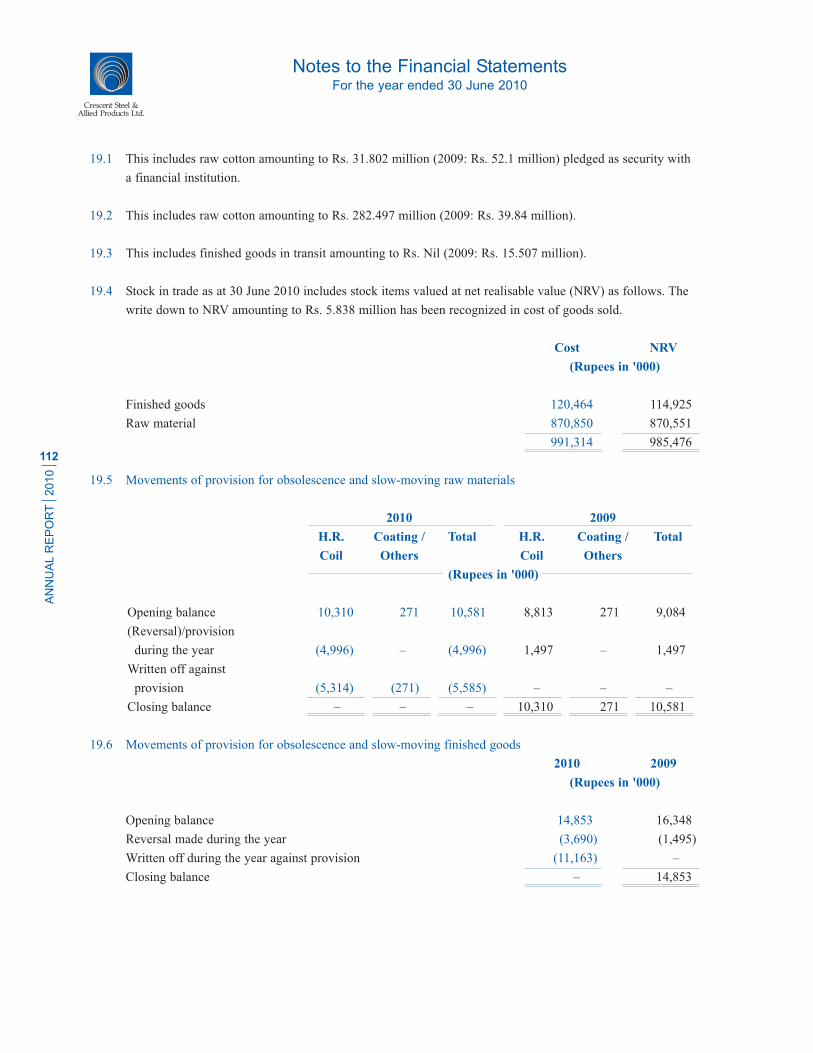
19.1 This includes raw cotton amounting to Rs. 31.802 million (2009: Rs. 52.1 million) pledged as security with
a financial institution.
19.2 This includes raw cotton amounting to Rs. 282.497 million (2009: Rs. 39.84 million).
19.3 This includes finished goods in transit amounting to Rs. Nil (2009: Rs. 15.507 million).
19.4 Stock in trade as at 30 June 2010 includes stock items valued at net realisable value (NRV) as follows. The
write down to NRV amounting to Rs. 5.838 million has been recognized in cost of goods sold.
Cost NRV
(Rupees in '000)
Finished goods 120,464 114,925
Raw material 870,850 870,551
991,314 985,476
19.5 Movements of provision for obsolescence and slow-moving raw materials
2010 2009
H.R. Coating / Total H.R. Coating / Total
Coil Others Coil Others
(Rupees in '000)
Opening balance 10,310 271 10,581 8,813 271 9,084
(Reversal)/provision
during the year (4,996) ––– (4,996) 1,497 ––– 1,497
Written off against
provision (5,314) (271) (5,585) ––– ––– –––
Closing balance ––– ––– ––– 10,310 271 10,581
19.6 Movements of provision for obsolescence and slow-moving finished goods
2010 2009
(Rupees in '000)
Opening balance 14,853 16,348
Reversal made during the year (3,690) (1,495)
Written off during the year against provision (11,163) –––
Closing balance ––– 14,853
Crescent Steel & Allied Products Ltd.
Notes to the Financial StatementsFor the year ended 30 June 2010
AN
NU
AL R
EP
OR
T
2010
112
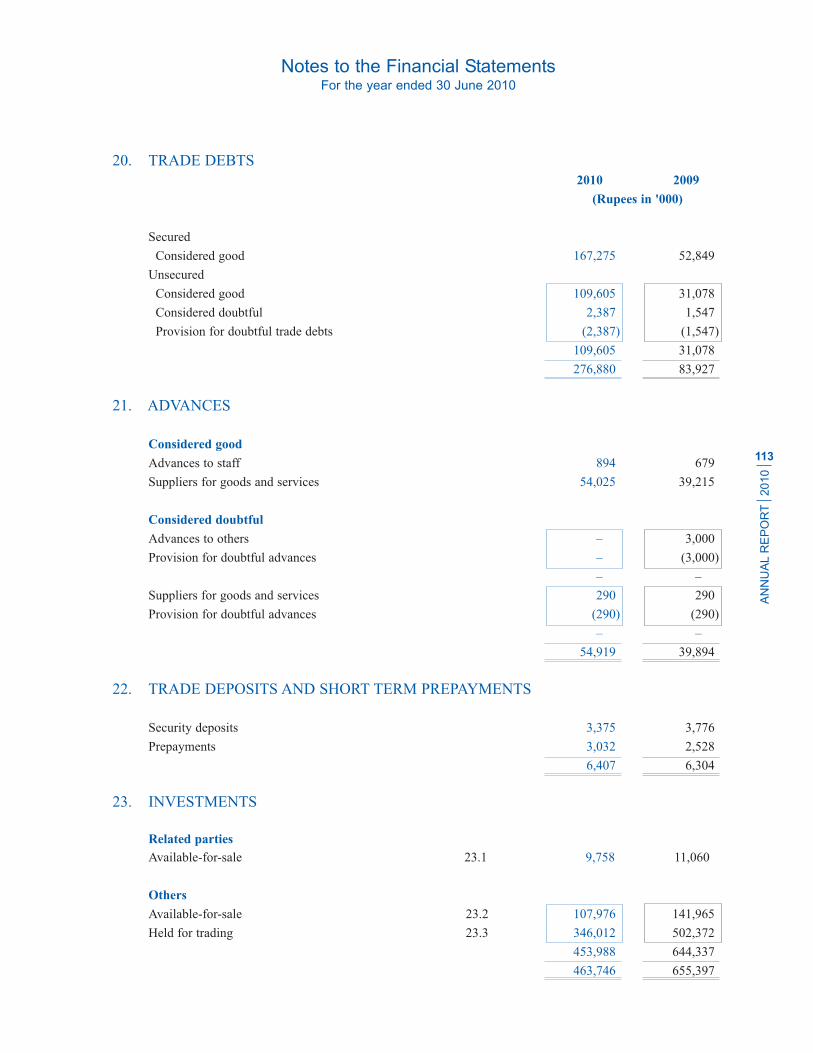
20. TRADE DEBTS
2010 2009
(Rupees in '000)
Secured
Considered good 167,275 52,849
Unsecured
Considered good 109,605 31,078
Considered doubtful 2,387 1,547
Provision for doubtful trade debts (2,387) (1,547)
109,605 31,078
276,880 83,927
21. ADVANCES
Considered good
Advances to staff 894 679
Suppliers for goods and services 54,025 39,215
Considered doubtful
Advances to others ––– 3,000
Provision for doubtful advances ––– (3,000)
––– –––
Suppliers for goods and services 290 290
Provision for doubtful advances (290) (290)
––– –––
54,919 39,894
22. TRADE DEPOSITS AND SHORT TERM PREPAYMENTS
Security deposits 3,375 3,776
Prepayments 3,032 2,528
6,407 6,304
23. INVESTMENTS
Related parties
Available-for-sale 23.1 9,758 11,060
Others
Available-for-sale 23.2 107,976 141,965
Held for trading 23.3 346,012 502,372
453,988 644,337
463,746 655,397
Notes to the Financial StatementsFor the year ended 30 June 2010
AN
NU
AL R
EP
OR
T
2010
113
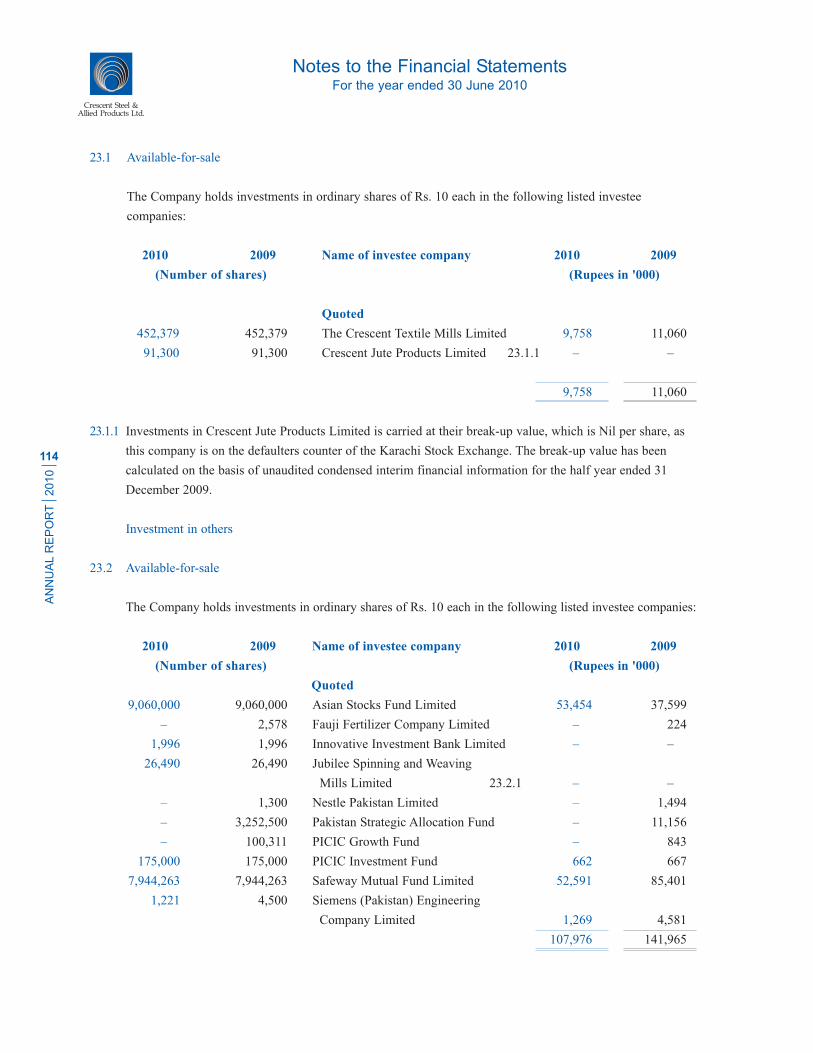
23.1 Available-for-sale
The Company holds investments in ordinary shares of Rs. 10 each in the following listed investee
companies:
2010 2009 Name of investee company 2010 2009
(Number of shares) (Rupees in '000)
Quoted
452,379 452,379 The Crescent Textile Mills Limited 9,758 11,060
91,300 91,300 Crescent Jute Products Limited 23.1.1 ––– –––
9,758 11,060
23.1.1 Investments in Crescent Jute Products Limited is carried at their break-up value, which is Nil per share, as
this company is on the defaulters counter of the Karachi Stock Exchange. The break-up value has been
calculated on the basis of unaudited condensed interim financial information for the half year ended 31
December 2009.
Investment in others
23.2 Available-for-sale
The Company holds investments in ordinary shares of Rs. 10 each in the following listed investee companies:
2010 2009 Name of investee company 2010 2009
(Number of shares) (Rupees in '000)
Quoted
9,060,000 9,060,000 Asian Stocks Fund Limited 53,454 37,599
––– 2,578 Fauji Fertilizer Company Limited ––– 224
1,996 1,996 Innovative Investment Bank Limited ––– –––
26,490 26,490 Jubilee Spinning and Weaving
Mills Limited 23.2.1 ––– –––
––– 1,300 Nestle Pakistan Limited ––– 1,494
––– 3,252,500 Pakistan Strategic Allocation Fund ––– 11,156
––– 100,311 PICIC Growth Fund ––– 843
175,000 175,000 PICIC Investment Fund 662 667
7,944,263 7,944,263 Safeway Mutual Fund Limited 52,591 85,401
1,221 4,500 Siemens (Pakistan) Engineering
Company Limited 1,269 4,581
107,976 141,965
Crescent Steel & Allied Products Ltd.
Notes to the Financial StatementsFor the year ended 30 June 2010
AN
NU
AL R
EP
OR
T
2010
114

23.2.1 Investments in Jubilee Spinning and Weaving Mills Limited is carried at Rs. Nil (2009: Rs. Nil). The break-up
value of shares of the investee company is Rs. 5.53 per share, calculated on the basis of the unaudited
condensed interim financial information for the nine months ended 31 March 2010.
23.2.2 Investments having an aggregate market value of Rs. 474.493 million (30 June 2009: Rs. 952.0 million)
have been pledged with financial institutions as security against financing facilities (see note 11.4) out
of which Rs. 306.698 million (30 June 2009: Rs. 561.551 million) relates to long term investments.
23.3 Held for trading
The Company holds investments in ordinary shares of Rs. 10 each, unless stated otherwise, in the
following listed investee companies:
2010 2009 Name of investee company 2010 2009
(Number of shares / units) (Rupees in '000)
67,500 70,000 Al Ghazi Tractors Limited * 13,655 11,340
190,859 215,960 Agriautos Industries Limited * 13,169 7,049
––– 71,956 Arif Habib Securities Limited ––– 1,989
30,000 39,700 Attock Cement Pakistan Limited 1,965 2,788
17,560 20,060 Attock Petroleum Limited 5,088 6,389
––– 20,060 Attock Refinery Limited ––– 2,503
30,000 ––– Azgard Nine Limited 335 –––
6,000 ––– Bank AL Habib Limited 189 –––
258,384 183,375 Bank Alfalah Limited 2,444 1,935
210,000 470,788 D.G. Khan Cement Company Limited 4,960 13,959
––– 41,700 Engro Chemicals Pakistan Limited ––– 5,356
20,500 ––– Engro Corporation Limited 3,558 –––
11,163 ––– Fatima Fertilizer Company Limited 140 –––
14,000 100,000 Fauji Fertilizer Bin Qasim Limited 365 1,769
20,000 20,000 First Habib Bank Modaraba 101 78
68,250 217,422 Fauji Fertilizer Company Limited 7,035 18,905
247,500 247,500 Golden Arrow Selected Stocks Fund
Limited * 681 559
––– 3,000 Habib Bank Limited ––– 258
––– 500 Hinopak Motors Limited ––– 77
431,400 805,000 The Hub Power Company Limited 13,788 21,807
33,500 ––– ICI Pakistan Limited 3,972 –––
1,350 1,350 Innovative Investment Bank Limited ––– –––
––– 300,409 Jahangir Siddiqui and Company Limited ––– 6,966
Notes to the Financial StatementsFor the year ended 30 June 2010
AN
NU
AL R
EP
OR
T
2010
115

2010 2009 Name of investee company 2010 2009
(Number of shares / units) (Rupees in '000)
––– 100,000 JS Growth Fund ––– 382
––– 100,000 JS Value Fund ––– 445
––– 99,750 Kohat Cement Company Limited ––– 726
465,425 622,500 Kohinoor Energy Limited 12,329 18,053
341,400 341,400 Kot Addu Power Company Limited 14,250 14,428
10,000 ––– Lotte Pakistan PTA Limited 80 –––
––– 426,000 Meezan Balanced Fund ––– 2,462
25,000 410,869 National Bank of Pakistan 1,603 27,541
40,000 46,074 National Investment Trust 1,121 1,237
235,000 ––– Nishat (Chunian) Limited 3,708 –––
137,000 ––– Nishat Mills Limited 5,907 –––
––– 599,800 Oil & Gas Development
Company Limited ––– 47,168
27,374 27,374 Packages Limited 3,243 4,299
685,640 1,006,140 Pakistan Oilfields Limited 148,029 146,796
302,500 ––– Pakistan Telecommunication
Company Limited 5,385 –––
200,000 246,500 Pakistan National Shipping
Corporation 7,978 11,378
––– 217,365 Pakistan Petroleum Limited ––– 41,199
––– 171,708 Pakistan Premier Fund Limited ––– 704
128,200 97,500 Pakistan State Oil Company Limited 33,358 20,831
––– 161,875 Pak Suzuki Motor Company Limited ––– 10,991
105,000 5,000 PICIC Energy Fund 541 23
457,311 711,000 PICIC Growth Fund 4,235 5,972
––– 569,634 PICIC Insurance Limited ––– 3,412
481,173 ––– PICIC Investment Fund 1,819 –––
4,884,734 6,056,456 Samba Bank Limited
(Formerly Crescent Commercial
Bank Ltd.) 11,088 18,048
2,500 ––– Shell Pakistan Limited 573 –––
203,500 280,280 Thal Limited * 19,320 21,708
––– 22,000 United Bank Limited ––– 842
346,012 502,372
* It has face value of Rs. 5 per share.
Crescent Steel & Allied Products Ltd.
Notes to the Financial StatementsFor the year ended 30 June 2010
AN
NU
AL R
EP
OR
T
2010
116

23.4 The following investments are deposited as security with commercial banks.
Name of investee company 2010 2009
(Rupees in '000)
Altern Energy Limited 281,751 483,803
Agriauto Industries Limited 13,110 6,430
Al Ghazi Tractors Limited 13,655 10,530
Azgard Nine Limited 223 –––
Arif Habib Securities Limited ––– 138
Attock Cement Pakistan Limited 1,965 2,317
Attock Petroleum Limited 4,346 6,389
Attock Refinery Limited ––– 2,503
Bank Alfalah Limited 2,441 –––
Bank Al Habib Limited 189 –––
ICI Pakistan Limited 3,557 –––
D.G. Khan Cement Limited 4,960 11,374
Engro Corporation Limited 3,558 –––
Fauji Fertilizer Bin Qasim Limited 365 1,521
Fauji Fertilizer Company Limited 7,008 5,027
The Hub Power Company Limited 13,788 16,985
Jahangir Siddiqui & Company Limited ––– 3,349
Kohinoor Energy Limited 11,483 18,053
Kot Addu Power Company Limited 14,025 14,242
Kohat Cement Company Limited ––– 673
Meezan Balanced Fund ––– 2,312
National Bank of Pakistan 1,603 16,188
Nishat Mills Limited 5,907 –––
Oil and Gas Development Company Limited ––– 25,318
Pak Suzuki Motor Company Limited ––– 10,991
Packages Limited 3,199 2,356
Pakistan Oilfields Limited ––– 137,037
Pakistan Petroleum Limited ––– 41,197
Pakistan State Oil Company Limited 33,358 –––
Pakistan Strategic Allocation Fund ––– 11,149
Pakistan Telecommunication Company Limited 5,340 –––
PICIC Growth Fund 4,167 55
PICIC Investment Fund 2,457 –––
Samba Bank Limited (Formerly Crescent Commercial Bank Ltd.) ––– 18,023
Shakarganj Mills Limited ––– 77,748
Siemens (Pakistan) Engineering Company Limited ––– 4,581
Thal Limited 19,320 21,708
United Bank Limited - TFCs 22,718 –––
474,493 951,997
Notes to the Financial StatementsFor the year ended 30 June 2010
AN
NU
AL R
EP
OR
T
2010
117

24. CURRENT PORTION OF LONG TERM INVESTMENT
2010 2009
(Rupees in '000)
Preference shares of Shakarganj Mills Limited 24.1 29,994 29,994
Preference shares of Maple Leaf Cement
Factory Limited 24.2 1,836 1,836
Term finance certificates of United Bank Limited 10 10
Dividend receivable on preference shares of Shakarganj
Mills Limited and Maple Leaf Cement Factory Limited 5,198 4,653
37,038 36,493
Less: Provision for impairment 24.1 & 24.2 20,034 –––
17,004 36,493
24.1 This represents 2,999,396 preference shares of Rs. 10 each of Shakarganj Mills Limited, an associated
undertaking, issued in October 2004. These shares carry dividend rate of 8.5% per annum payable
annually and were due for redemption in October 2009. The preference shares are convertible into
ordinary shares of Rs. 10 each. The conversion option is exercisable at the end of every financial year
of the investee company.
As at 30 June 2010, the amount remains outstanding and the Company does not intend to exercise the
conversion option to convert the preference shares into ordinary shares as mentioned above. Management
has made a provision of Rs. 18.106 million against the exposure as it considers that the balance amount
shall be recovered in due course of time.
Fair value of the preference shares as at 30 June 2010 amounted to Rs. 9.028 million (2009: Rs. 29.694
million).
24.2 This represents 183,600 preference shares of Rs. 10 each of Maple Leaf Cement Factory Limited which
were due for redemption on 13 December 2009. As at 30 June 2010, the amount remains outstanding and
considered doubtful. Accordingly the balance outstanding has been fully provided for as at 30 June 2010.
Crescent Steel & Allied Products Ltd.
Notes to the Financial StatementsFor the year ended 30 June 2010
AN
NU
AL R
EP
OR
T
2010
118

25. OTHER RECEIVABLES2010 2009
(Rupees in '000)
Dividend receivable 529 2,444
Receivable against sale of shares ––– 5,993
Claim receivable 238 3,428
Due from associated undertakings 25.1 450 5,448
Sales tax / special excise duty refundable 21,428 33,397
Provision there against (4,346) (4,346)
17,082 29,051
Margin on letter of credit ––– 109,045
Receivable from staff retirement funds 41 2,975 5,107
Others 3,882 104
25,156 160,620
25.1 Due from associated undertakings
Crescent Textile Mills Limited 7 9
Shakarganj Mills Limited 13 3,016
Shakarganj Foods Products Limited ––– 2,031
Crescent Jute Products Limited 430 347
Safeway Fund Limited ––– 45
450 5,448
26. TAXATION - NET
Advance tax 868,473 669,117
Provision for taxation (849,861) (640,696)
18,612 28,421
26.1 The income tax assessments of the Company have been finalized up to and including the assessment year
2002-2003. Tax returns of subsequent tax years are deemed to be assessed under section 120 of the Income
Tax Ordinance, 2001 unless selected for an audit by the taxation authorities. The Appelate Tribunal Inland
Revenue (ATIR) and Taxation officer has issued the order in respect of assessment year 2001-2002, 2002-
2003 and Tax years 2003, 2004, 2006 and 2007. The Company has filed appeals against such order which are
pending for adjudication. Full provision has been recognized in these financial statements upto Tax year
2003 except for short credit of taxes paid, deduction of taxed at source and adjustment of refund for the said
assessment / Tax years. However, no provision has been made in these financial statements in respect of Tax
years 2004, 2006 and 2007 as the management is confident for favourable outcome of these appeals.
Additional tax liability of Rs. 128.887 million may arise against the above mentioned assessments in case
decisions are made against the Company.
Notes to the Financial StatementsFor the year ended 30 June 2010
AN
NU
AL R
EP
OR
T
2010
119

Further, the department has also filed appeals against orders of Commissioner of Income Tax (Appeals) in
respect of assessment years 1997-1998, 2000-2001 and Tax year 2004. In case of adverse decisions, additional
tax liability of Rs. 8.569 million may arise. However, no provision has been made in these financial statements
as the management is confident for favourable outcome of these appeals.
27. CASH AND BANK BALANCES
2010 2009
(Rupees in '000)
With banks in deposit accounts:
- local currency 88,830 334
- foreign currency 2 2
88,832 336
in current accounts 63,189 3,205
Cash in hand 1,658 603
153,679 4,144
28. SALES
Local sales
Bare pipes (own product excluding coating revenue) 928,038 1,259,483
Revenue from conversion 105,071 91,189
Coating of pipes 591,552 651,208
Cotton yarn/raw cotton 2,196,287 1,497,812
Others (including pipes laboratory testing) 24,042 21,198
Scrap/waste 107,798 87,125
Sales returns (22,535) (15,225)
Export sales
Export of cotton yarn 11,037 13,769
3,941,290 3,606,559
Sales tax and special excise duty (236,902) (295,690)
3,704,388 3,310,869
29. COST OF SALES
Steel segment 29.1 1,010,885 1,046,861
Cotton segment 29.1 1,876,410 1,550,329
2,887,295 2,597,190
Crescent Steel & Allied Products Ltd.
Notes to the Financial StatementsFor the year ended 30 June 2010
AN
NU
AL R
EP
OR
T
2010
120

29.1 Cost of sales
Steel Segment Cotton Segment Total
2010 2009 2010 2009 2010 2009
(Rupees in '000)
Raw materials consumed 799,389 921,676 1,315,115 1,056,791 2,114,504 1,978,467
Cost of raw cotton sold ––– ––– 70,962 14,847 70,962 14,847
Packing materials consumed ––– ––– 26,261 20,717 26,261 20,717
Store and spares consumed 30,639 28,058 57,617 34,240 88,256 62,298
Fuel, power and electricity 43,763 27,297 161,232 140,188 204,995 167,485
Salaries, wages and other benefits 29.2 69,512 57,317 83,656 76,662 153,168 133,979
Insurance 1,308 1,524 3,626 3,574 4,934 5,098
Repairs and maintenance 4,450 3,608 4,083 3,212 8,533 6,820
Depreciation 13.2 20,632 16,522 138,972 139,393 159,604 155,915
Amortization of intangible assets 14.1 ––– ––– 24 119 24 119
Stock in trade written down to NRV 5,838 ––– ––– ––– 5,838 –––
Other expenses 44,595 14,942 5,681 7,386 50,276 22,328
1,020,126 1,070,944 1,867,229 1,497,129 2,887,355 2,568,073
Opening stock of work-in-process 2,776 3,548 12,625 11,526 15,401 15,074
Closing stock of work-in-process (13,716) (2,776) (16,440) (12,625) (30,156) (15,401)
(10,940) 772 (3,815) (1,099) (14,755) (327)
Cost of goods manufactured 1,009,186 1,071,716 1,863,414 1,496,030 2,872,600 2,567,746
Opening stock of finished goods 70,359 45,504 59,261 113,560 129,620 159,064
Closing stock of finished goods (68,660) (70,359) (46,265) (59,261) (114,925) (129,620)
1,699 (24,855) 12,996 54,299 14,695 29,444
1,010,885 1,046,861 1,876,410 1,550,329 2,887,295 2,597,190
29.2 Detail of salaries, wages and other benefits
Salaries, wages and other benefits 61,010 51,503 80,839 73,503 141,849 125,006
Provident fund contributions 1,729 1,503 1,453 1,608 3,182 3,111
Pension fund 29.3 5,431 3,484 1,335 1,410 6,766 4,894
Gratuity fund 29.3 1,342 827 29 141 1,371 968
69,512 57,317 83,656 76,662 153,168 133,979
Notes to the Financial StatementsFor the year ended 30 June 2010
AN
NU
AL R
EP
OR
T
2010
121
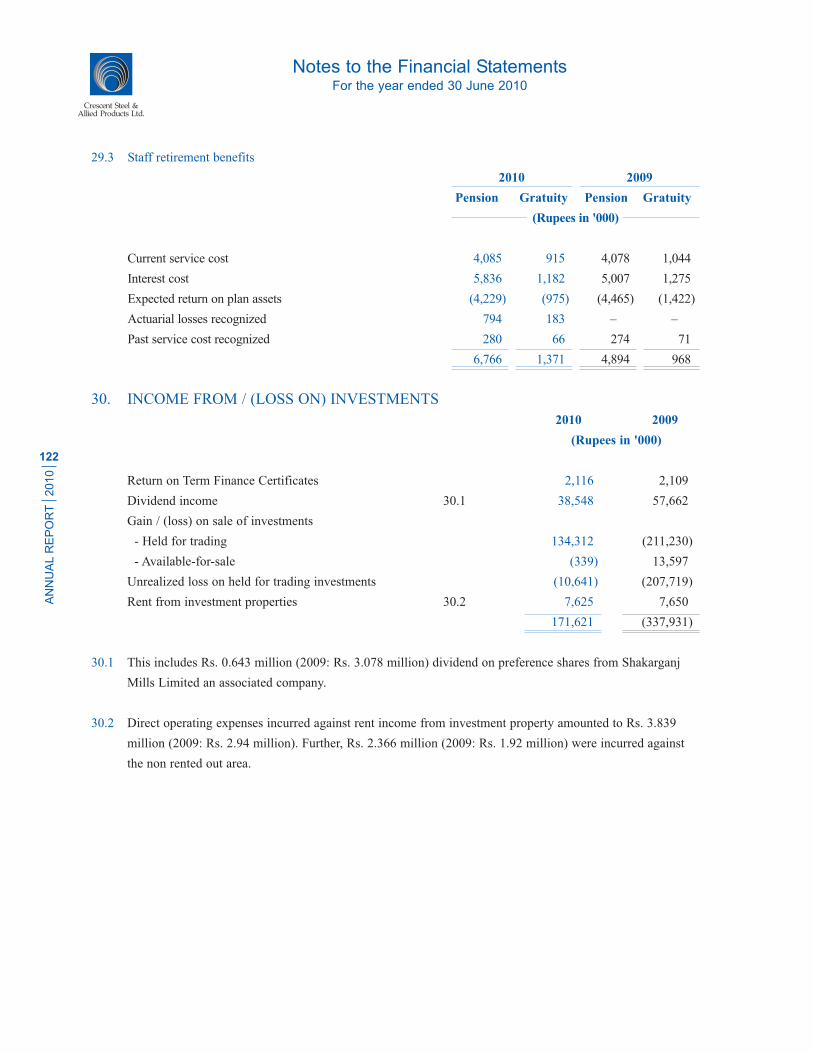
29.3 Staff retirement benefits
2010 2009
Pension Gratuity Pension Gratuity
(Rupees in '000)
Current service cost 4,085 915 4,078 1,044
Interest cost 5,836 1,182 5,007 1,275
Expected return on plan assets (4,229) (975) (4,465) (1,422)
Actuarial losses recognized 794 183 ––– –––
Past service cost recognized 280 66 274 71
6,766 1,371 4,894 968
30. INCOME FROM / (LOSS ON) INVESTMENTS
2010 2009
(Rupees in '000)
Return on Term Finance Certificates 2,116 2,109
Dividend income 30.1 38,548 57,662
Gain / (loss) on sale of investments
- Held for trading 134,312 (211,230)
- Available-for-sale (339) 13,597
Unrealized loss on held for trading investments (10,641) (207,719)
Rent from investment properties 30.2 7,625 7,650
171,621 (337,931)
30.1 This includes Rs. 0.643 million (2009: Rs. 3.078 million) dividend on preference shares from Shakarganj
Mills Limited an associated company.
30.2 Direct operating expenses incurred against rent income from investment property amounted to Rs. 3.839
million (2009: Rs. 2.94 million). Further, Rs. 2.366 million (2009: Rs. 1.92 million) were incurred against
the non rented out area.
Crescent Steel & Allied Products Ltd.
Notes to the Financial StatementsFor the year ended 30 June 2010
AN
NU
AL R
EP
OR
T
2010
122

31. DISTRIBUTION AND SELLING EXPENSES
Steel Segment Cotton Segment Total
2010 2009 2010 2009 2010 2009
(Rupees in '000)
Salaries, wages and other
benefits 31.1 5,868 5,084 1,684 1,834 7,552 6,918
Commission ––– ––– 12,677 6,019 12,677 6,019
Travelling, conveyance
and entertainment 714 645 190 42 904 687
Depreciation 13.2 217 258 7 2 224 260
Insurance 89 102 ––– ––– 89 102
Postage, telephone and
telegram 117 91 109 35 226 126
Advertisement 672 386 100 ––– 772 386
Bid bond expenses 291 259 ––– ––– 291 259
Legal and professional
charges 1,960 595 ––– ––– 1,960 595
Others 1,664 397 658 1,407 2,322 1,804
11,592 7,817 15,425 9,339 27,017 17,156
31.1 Detail of salaries, wages and other benefits
Salaries, wages and other
benefits 4,434 4,098 1,684 1,834 6,118 5,932
Provident fund contributions 187 169 ––– ––– 187 169
Pension fund 31.2 1,005 668 ––– ––– 1,005 668
Gratuity fund 31.2 242 149 ––– ––– 242 149
5,868 5,084 1,684 1,834 7,552 6,918
31.2 Staff retirement benefits
2010 2009
Pension Gratuity Pension Gratuity
(Rupees in '000)
Current service cost 607 162 555 160
Interest cost 867 209 683 195
Expected return on plan assets (628) (172) (608) (217)
Actuarial losses recognized 118 32 ––– –––
Past service cost recognized 41 11 38 11
1,005 242 668 149
Notes to the Financial StatementsFor the year ended 30 June 2010
AN
NU
AL R
EP
OR
T
2010
123

32. ADMINISTRATIVE EXPENSES
Steel Segment Cotton Segment IID Segment Total
2010 2009 2010 2009 2010 2009 2010 2009
(Rupees in '000)
Salaries, wages and other
benefits 32.1 49,677 43,118 5,888 5,569 6,054 5,429 61,619 54,116
Rents, rates and taxes 163 318 104 101 750 314 1,017 733
Travelling, conveyance
and entertainment 5,215 4,668 884 704 598 536 6,697 5,908
Fuel and power 5,508 4,987 256 256 612 567 6,376 5,810
Postage, telephone and
telegram 1,495 1,700 322 243 166 189 1,983 2,132
Insurance 680 713 60 75 126 147 866 935
Repairs and maintenance 3,269 2,496 309 193 1,085 351 4,663 3,040
Auditors' remuneration 32.3 1,109 1,005 123 158 123 109 1,355 1,272
Legal and professional and
corporate service charges 16,763 11,030 1,364 1,330 6,846 4,102 24,973 16,462
Advertisement 45 332 ––– ––– 5 37 50 369
Donations 32.4 16,452 4,241 ––– 1,955 1,828 471 18,280 6,667
Depreciation 13.2 & 15 8,386 16,498 393 385 5,360 6,060 14,139 22,943
Amortization of intangible
assets 14.1 8,914 175 15 79 990 19 9,919 273
Printing, stationery and
office supplies 1,714 1,660 237 226 190 184 2,141 2,070
Newspapers, subscriptions
and periodicals 563 406 833 296 63 46 1,459 748
Others 2,841 2,194 235 685 521 273 3,597 3,152
122,794 95,541 11,023 12,255 25,317 18,834 159,134 126,630
32.1 Salaries, wages and other benefits
Salaries, wages and other
benefits 38,247 33,653 4,775 5,398 4,664 4,247 47,686 43,298
Provident fund contributions 1,445 1,528 157 171 180 192 1,782 1,891
Pension fund 32.2 8,090 6,628 777 ––– 975 825 9,842 7,453
Gratuity fund 32.2 1,895 1,309 179 ––– 235 165 2,309 1,474
49,677 43,118 5,888 5,569 6,054 5,429 61,619 54,116
32.2 Staff retirement benefits
2010 2009
Pension Gratuity Pension Gratuity
(Rupees in '000)
Current service cost 5,941 1,541 6,209 1,590
Interest cost 8,490 1,990 7,624 1,939
Expected return on plan assets (6,152) (1,643) (6,797) (2,163)
Actuarial losses recognized 1,155 308 ––– –––
Past service cost recognized 408 113 417 108
9,842 2,309 7,453 1,474
Crescent Steel & Allied Products Ltd.
Notes to the Financial StatementsFor the year ended 30 June 2010
AN
NU
AL R
EP
OR
T
2010
124

32.3 Auditors' remuneration
2010 2009
(Rupees in '000)
Audit fee 32.3.1 1,000 875
Fee for audit of funds' financial statements
and other reports 168 209
Out of pocket expenses 187 188
1,355 1,272
32.3.1 Audit fee includes services for audit of annual separate and consolidated financial statements, limited review
of separate and consolidated condensed interim financial statements for the six months period, review report
on Statement of Compliance with best Practices of the Code of Corporate Governance and audit of reconcili-
ation statement of Nominee Shareholding of Central Depository Company of Pakistan Limited (CDC).
32.4 Donations
Donations include the following in which a director is interested:
Name of the director Interest in Name and address of Amount donated
donee the donee
2010 2009
(Rupees in '000)
Mr. Ahsan M. Saleem Director The Citizens Foundation
9th Floor, NIC Building,
Karachi. 16,720 5,073
Director Pakistan Centre for
Philanthropy
1-A, Street 14, F-8/3,
Islamabad. 830 600
Member Lyallpur Golf Club
Race Course Club,
Faisalabad. ––– 714
17,550 6,387
32.4.1 Donations other than those mentioned above were not made to any donee in which a director or his
spouse had any interest at any time during the year.
Notes to the Financial StatementsFor the year ended 30 June 2010
AN
NU
AL R
EP
OR
T
2010
125

33. OTHER OPERATING EXPENSES
2010 2009
(Rupees in '000)
Provision for slow moving stores, spares and loose tools 7,463 –––
Provision for stock-in-trade ––– 8,233
Provision for doubtful trade debts 840 1,399
Provision for Workers Welfare Fund 14,638 9,780
Provision for Workers Profit Participation Fund 28,666 27,524
Provision for infrastructure fee ––– 5,826
Provision for impairment in the value of investments 45,229 259,148
Provision for liquidated damages 2,823 11,594
Exchange loss 1,761 8,000
101,420 331,504
34. OTHER OPERATING INCOME
Income from financial assets
Return on deposits 136 1,340
Income from non financial assets
Liabilities written-back ––– 4,270
Provision written back for stock-in-trade/stores, spares and loose tools 8,686 11,670
Provision written back - Workers Welfare Fund ––– 19,613
Provision written back - infrastructure fees 3,488 –––
Gain on disposal of fixed assets 2,588 266
Insurance commission 887 775
Others 2,493 1,036
18,142 37,630
18,278 38,970
35. FINANCE COSTS
Mark-up on:
- Running finances 75,953 82,131
- Short term loans 25,842 86,495
- Long term loans 12,593 28,893
- Redeemable capital ––– 1,837
- Workers Profit Participation Fund 3,141 89
Bank charges 4,379 4,126
121,908 203,571
Crescent Steel & Allied Products Ltd.
Notes to the Financial StatementsFor the year ended 30 June 2010
AN
NU
AL R
EP
OR
T
2010
126

36. TAXATION
2010 2009
(Rupees in '000)
Current
- for the year 207,910 172,791
- for prior years 1,256 (26,396)
209,166 146,395
Deferred (28,200) (11,717)
180,966 134,678
36.1 Relationship between tax expense and accounting profit / (loss)
Profit / (loss) before taxation 597,513 (264,143)
Tax at the applicable rate of 35% 209,130 (92,450)
Tax effect of inadmissible expenses / gains / losses (14,599) 250,393
Tax effect of income taxed at lower rate (11,800) (16,209)
Prior year tax effect (1,765) (7,056)
180,966 134,678
37. BASIC AND DILUTED EARNINGS / (LOSS) PER SHARE
Profit / (loss) for the year 416,547 (398,821)
(Number of shares)
Average number of ordinary shares in issue during the year 56,459,993 56,459,993
(Rupees)
Basic and diluted earnings / (loss) per share 7.38 (7.06)
Notes to the Financial StatementsFor the year ended 30 June 2010
AN
NU
AL R
EP
OR
T
2010
127

38. CASH GENERATED FROM OPERATIONS
2010 2009
(Rupees in '000)
Profit/(loss) before taxation 597,513 (264,143)
Adjustments for non cash charges and other items:
Depreciation on operating fixed assets and investment
property 173,967 179,118
Amortization of intangible assets 9,943 392
Amortization of advances to staff 355 351
Unrealized loss on held-for-trading investments 10,641 207,719
Provision against stock-in-trade and stores, spares and
loose tools 7,463 8,233
Reversal of provision against stock-in-trade and stores,
spares and loose tools (8,686) (11,670)
Liabilities written back ––– (4,270)
Provision for Workers Profit Participation Fund 28,666 27,524
Provision for Workers Welfare Fund 14,638 9,780
Provision written back against workers welfare fund ––– (19,613)
Impairment in the value of investment 45,229 259,148
(Reversal of provision)/provision for infrastructure fee (3,488) 9,920
Provision for doubtful debts 840 1,399
Provision for 10-C bonus 808 741
Provision against liquidated damages 2,823 11,594
(Gain)/loss on sale of investments - net (133,973) 197,633
Pension and gratuity expense 21,535 15,606
Charge for compensated absences 1,882 514
Finance costs 121,908 203,571
Gain on disposal of fixed assets (2,588) (266)
Dividend income (38,548) (57,662)
Return on deposits and investments (2,252) (3,449)
Amortization of initial transaction costs 263 712
Working capital changes 38.1 (32,722) (22,202)
816,217 750,680
Crescent Steel & Allied Products Ltd.
Notes to the Financial StatementsFor the year ended 30 June 2010
AN
NU
AL R
EP
OR
T
2010
128

38.1 Working capital changes
2010 2009
(Rupees in '000)
(Increase)/decrease in current assets
Stores, spares and loose tools 3,381 (2,939)
Stock-in-trade (392,398) (10,376)
Trade debts (193,793) 33,370
Short term advances (15,025) (15,295)
Short term deposits and prepayments (103) (3,891)
Other receivables (net) 125,424 (133,529)
(472,514) (132,660)
Increase in current liabilities
Trade and other payables 439,792 110,458
(32,722) (22,202)
39. CASH AND CASH EQUIVALENTS
Running finances under mark-up arrangements 11 (652,875) (648,880)
Cash and bank balances 27 153,679 4,144
(499,196) (644,736)
40. SEGMENT REPORTING
40.1 Reportable segments
The Company's reportable segments are as follows:
- Steel segment - It comprises manufacturing and coating of steel pipes (note 1.2).
- Cotton segment - It comprises manufacturing of yarn (note 1.3).
- Investment and Infrastructure Development (IID) segment - To effectively manage the investment portfolio
in shares and other securities (strategic as well as short term) and property investments (held for rentals as
well as long term appreciation).
Notes to the Financial StatementsFor the year ended 30 June 2010
AN
NU
AL R
EP
OR
T
2010
129

Information regarding the Company’s reportable segment is presented below:
40.2 Segment revenues and results
Following is an analysis of the Company's revenue and results by reportable segment
Steel Cotton IID
Segment Segment Segment Total
(Rupees in '000)
For the year ended 30 June 2010
Sales 1,432,214 2,272,174 ––– 3,704,388
Cost of sales 1,010,885 1,876,410 ––– 2,887,295
Gross profit 421,329 395,764 ––– 817,093
Income from investments ––– ––– 171,621 171,621
421,329 395,764 171,621 988,714
Distribution and selling expenses 11,592 15,425 ––– 27,017
Administrative expenses 122,794 11,023 25,317 159,134
Other operating expenses 29,389 25,983 46,048 101,420
163,775 52,431 71,365 287,571
257,554 343,333 100,256 701,143
Other operating income 14,474 3,804 ––– 18,278
Operating profit before finance costs 272,028 347,137 100,256 719,421
Finance costs 13,415 74,929 33,564 121,908
Profit before taxation 258,613 272,208 66,692 597,513
Taxation 180,966
Profit after taxation for the year 416,547
For the year ended 30 June 2009
Sales 1,739,350 1,571,519 ––– 3,310,869
Cost of sales 1,046,861 1,550,329 ––– 2,597,190
Gross profit 692,489 21,190 ––– 713,679
Loss from investments ––– ––– (337,931) (337,931)
692,489 21,190 (337,931) 375,748
Distribution and selling expenses 7,817 9,339 ––– 17,156
Administrative expenses 95,541 12,255 18,834 126,630
Other operating expenses 66,212 6,144 259,148 331,504
169,570 27,738 277,982 475,290
522,919 (6,548) (615,913) (99,542)
Other operating income 37,185 1,785 ––– 38,970
Operating profit/(loss) before finance costs 560,104 (4,763) (615,913) (60,572)
Finance costs 46,930 104,291 52,350 203,571
Profit/(loss) before taxation 513,174 (109,054) (668,263) (264,143)
Taxation 134,678
Loss after taxation for the year (398,821)
Crescent Steel & Allied Products Ltd.
Notes to the Financial StatementsFor the year ended 30 June 2010
AN
NU
AL R
EP
OR
T
2010
130

40.2.1 Revenue reported above represents revenue generated from external customers. There were no inter-
segment sales during the year (2009: Nil).
40.2.2 The accounting policies of the reportable segments are the same as the Company's accounting policies
described in note 5 to the financial statements. The steel segment allocates certain percentage of the
common administrative expenditure to the cotton segment and IID segment. In addition, financial
charges between steel and cotton segments are allocated at average mark-up rate on the basis of funds
utilized. This is the measure reported to management for the purposes of resource allocation and
assessment of segment performance.
40.3 Revenue from major products and services
The analysis of the Company's revenue from external customers for major products and services is
given in note 28 to the financial statements.
40.4 Information about major customers
Revenue from major customers of Company's steel segment represent approximately Rs. 754.696
million (30 June 2009: Rs. 1,261.257 million) of total steel segment revenue of Rs. 1,432.241 million
(30 June 2009: Rs. 1,739.350 million). Revenue from cotton segments of the Company does not include
any single major customer.
40.5 Geographical information
40.5.1 The Company's revenue from external customers by geographical location is detailed below:
2010 2009
(Rupees in '000)
Pakistan 3,693,351 3,297,100
Far East 11,037 13,769
3,704,388 3,310,869
40.5.2 All non-current assets of the Company as at 30 June 2010 and 2009 were located and operating in
Pakistan.
Notes to the Financial StatementsFor the year ended 30 June 2010
AN
NU
AL R
EP
OR
T
2010
131

40.6 Segment assets and liabilities
Reportable segments' assets and liabilities are reconciled to total assets and liabilities as follows:
Steel Cotton IID
Segment Segment Segment Total
(Rupees in '000)
As at 30 June 2010
Segment assets for reportable segments 1,094,906 1,373,999 1,804,001 4,272,906
Unallocated corporate assets 163,391
Total assets as per balance sheet 4,436,297
Segment liabilities for reportable segments 524,468 320,828 2,707 848,003
Unallocated corporate liabilities 965,682
Total liabilities as per balance sheet 1,813,685
As at 30 June 2009
Segment assets for reportable segments 614,231 1,333,311 1,733,258 3,680,800
Unallocated corporate assets 211,874
Total assets as per balance sheet 3,892,674
Segment liabilities for reportable segments 241,473 267,672 1,598 510,743
Unallocated corporate liabilities 1,053,135
Total liabilities as per balance sheet 1,563,878
40.6.1 For the purposes of monitoring segment performance and allocating resources between segments
- all assets are allocated to reportable segments other than those directly relating to corporate and tax assets; and
- all liabilities are allocated to reportable segments other than ‘trade and other payables’ directly relating to corporate, 'short term
borrowings', 'interest and mark-up accrued' and current and deferred tax liabilities.
Cash and bank balances, borrowings and related interest and mark-up payable and receivable thereon/therefrom are not allocated to
reporting segments as these are managed by the Company's central treasury function.
40.7 Other segment information
Steel Cotton IID
Segment Segment Segment Total
(Rupees in '000)
For the year ended 30 June 2010
Capital expenditure 13,707 18,083 2,095 33,885
Depreciation and amortization 38,149 139,411 6,350 183,910
Non-cash items other than depreciation
and amortization - net 51,370 99,149 (83,003) 67,516
For the year ended 30 June 2009
Capital expenditure 136,340 14,538 18,237 169,115
Depreciation and amortization 33,453 139,978 6,079 179,510
Non-cash items other than depreciation
and amortization 94,786 250,106 502,340 847,232
Crescent Steel & Allied Products Ltd.
Notes to the Financial StatementsFor the year ended 30 June 2010
AN
NU
AL R
EP
OR
T
2010
132

41. STAFF RETIREMENT BENEFITS
41.1 Defined benefit plans
41.1.1 The actuarial valuation of both pension and gratuity schemes has been conducted in accordance with IAS 19
"Employee benefits" as at 30 June 2010. The projected unit credit method, using the following significant
assumptions, has been used for the actuarial valuation:
2010 2009
- Discount rate 12% 12%
- Expected rate of increase in salaries 11% to 12% 12% to 15%
- Expected rate of return on plan assets 12% 12%
- Average expected remaining working life of employees 10 years 10 years
- Expected mortality for active members As per EFU (61-66) mortality table
41.1.2 Reconciliation of payable to/(receivable from) defined benefit plans
2010 2009
Pension Gratuity Total Pension Gratuity Total
(Rupees in '000)
Present value of defined
benefit obligations 41.1.4 141,712 34,115 175,827 126,611 28,177 154,788
Fair value of plan assets 41.1.5 (128,646) (29,906) (158,552) (91,742) (23,254) (114,996)
Unrecognized net
actuarial losses 41.1.8 (11,498) (6,151) (17,649) (33,332) (8,047) (41,379)
Unrecognized past service cost (1,458) (1,143) (2,601) (2,187) (1,333) (3,520)
Liability/(asset) in balances 110 (3,085) (2,975) (650) (4,457) (5,107)
41.1.3 Movement in payable to/(receivable from) defined benefit plans
Opening balance (650) (4,457) (5,107) 2,155 (4,758) (2,603)
Charge for the year 41.1.9 17,613 3,922 21,535 13,016 2,591 15,607
Contributions by the Company 41.1.5 (16,853) (2,550) (19,403) (15,821) (2,290) (18,111)
Closing balance 110 (3,085) (2,975) (650) (4,457) (5,107)
41.1.4 Reconciliation of present value of defined benefit obligations
Present value of defined
benefit obligations - 1 July 126,611 28,177 154,788 110,954 28,404 139,358
Current service cost 10,633 2,618 13,251 10,842 2,794 13,636
Interest cost 15,193 3,381 18,574 13,315 3,409 16,724
Benefits paid during the year (4,457) (1,062) (5,519) (2,647) (3,174) (5,821)
Actuarial (gain)/loss on obligations (6,268) 1,001 (5,267) (5,853) (3,256) (9,109)
Present value of defined
benefit obligations - 30 June 141,712 34,115 175,827 126,611 28,177 154,788
Notes to the Financial StatementsFor the year ended 30 June 2010
AN
NU
AL R
EP
OR
T
2010
133

41.1.5 Changes in the fair value of plan assets are as follows:
2010 2009
Pension Gratuity Total Pension Gratuity Total
(Rupees in '000)
Fair value of plan assets - 1 July 91,742 23,254 114,996 98,914 31,684 130,598
Expected return on plan assets 11,009 2,790 13,799 11,870 3,802 15,672
Contributions by the Company 16,853 2,550 19,403 15,821 2,290 18,111
Benefits paid during the year (4,457) (1,062) (5,519) (2,647) (3,174) (5,821)
Actuarial gain/(loss) on plan assets 13,499 2,374 15,873 (32,216) (11,348) (43,564)
Fair value of plan assets - 30 June 128,646 29,906 158,552 91,742 23,254 114,996
41.1.6 Actual return on plan assets 24,508 5,164 29,672 (20,346) (7,546) (27,892)
41.1.7 Actuarial (losses)/gains to be recognized
2010 2009
Pension Gratuity Pension Gratuity
(Rupees in '000)
Corridor limit
The limits of corridor as at 1 July
a) 10% of present value of obligations 12,661 2,818 11,095 2,840
b) 10% of fair value of plan assets 9,174 2,325 9,891 3,168
Higher of (a) and (b) above 12,661 2,818 11,095 3,168
Unrecognized net actuarial (losses)/gains as at 1 July (33,332) (8,047) (6,969) 45
Excess (20,671) (5,229) ––– –––
Average expected remaining working lives in years 10 10 10 10
Actuarial (losses) recognized (2,067) (523) ––– –––
Crescent Steel & Allied Products Ltd.
Notes to the Financial StatementsFor the year ended 30 June 2010
AN
NU
AL R
EP
OR
T
2010
134

41.1.8 Unrecognized net actuarial (losses)/gains
2010 2009
Pension Gratuity Total Pension Gratuity Total
(Rupees in '000)
Unrecognized net actuarial
(losses)/gains as at 1 July (33,332) (8,047) (41,379) (6,969) 45 (6,924)
Actuarial gain/(loss) on obligations 41.1.4 6,268 (1,001) 5,267 5,853 3,256 9,109
Actuarial gain/(loss) on plan assets 41.1.5 13,499 2,374 15,873 (32,216) (11,348) (43,564)
(13,565) (6,674) (20,239) (33,332) (8,047) (41,379)
Less: Actuarial losses recognized 41.1.7 (2,067) (523) (2,590) ––– ––– –––
Unrecognized net actuarial
losses as at 30 June (11,498) (6,151) (17,649) (33,332) (8,047) (41,379)
41.1.9 Following amounts have been charged in the
profit and loss account in respect of these benefits:
Current service cost 10,633 2,618 13,251 10,842 2,794 13,636
Interest cost 15,193 3,381 18,574 13,315 3,409 16,724
Expected return on plan assets (11,009) (2,790) (13,799) (11,870) (3,802) (15,672)
Actuarial losses recognized 2,067 523 2,590 ––– ––– –––
Past service cost recognized 729 190 919 729 190 919
Expense recognized in profit and
loss account 17,613 3,922 21,535 13,016 2,591 15,607
41.1.10 Amounts for the current year and previous four years of the present value of defined benefit obligations, fair value of plan assets,
surplus/(deficit) and experience adjustments arising thereon are as follows:
2010 2009 2008 2007 2006
(Rupees in '000)
Pension
As at 30 June
Present value of defined benefit obligation 141,712 126,611 110,954 99,224 71,422
Fair value of plan assets 128,646 91,742 98,915 93,474 68,194
Deficit (13,066) (34,869) (12,039) (5,750) (3,228)
Experience adjustments
Actuarial gain on obligation (6,268) (5,853) (6,440) (8,383) (2,502)
Actuarial gain/(loss) on plan assets 13,499 (32,216) (11,355) 14,157 (1,512)
Gratuity
As at 30 June
Present value of defined benefit obligation 34,115 28,177 28,404 27,945 19,776
Fair value of plan assets 29,906 23,254 31,684 32,878 24,023
(Deficit)/surplus (4,209) (4,923) 3,280 4,933 4,247
Experience adjustments
Actuarial loss/(gain) on obligation 1,001 (3,256) (3,774) 708 1,113
Actuarial gain/(loss) on plan assets 2,374 (11,348) (6,091) 4,298 17
Notes to the Financial StatementsFor the year ended 30 June 2010
AN
NU
AL R
EP
OR
T
2010
135
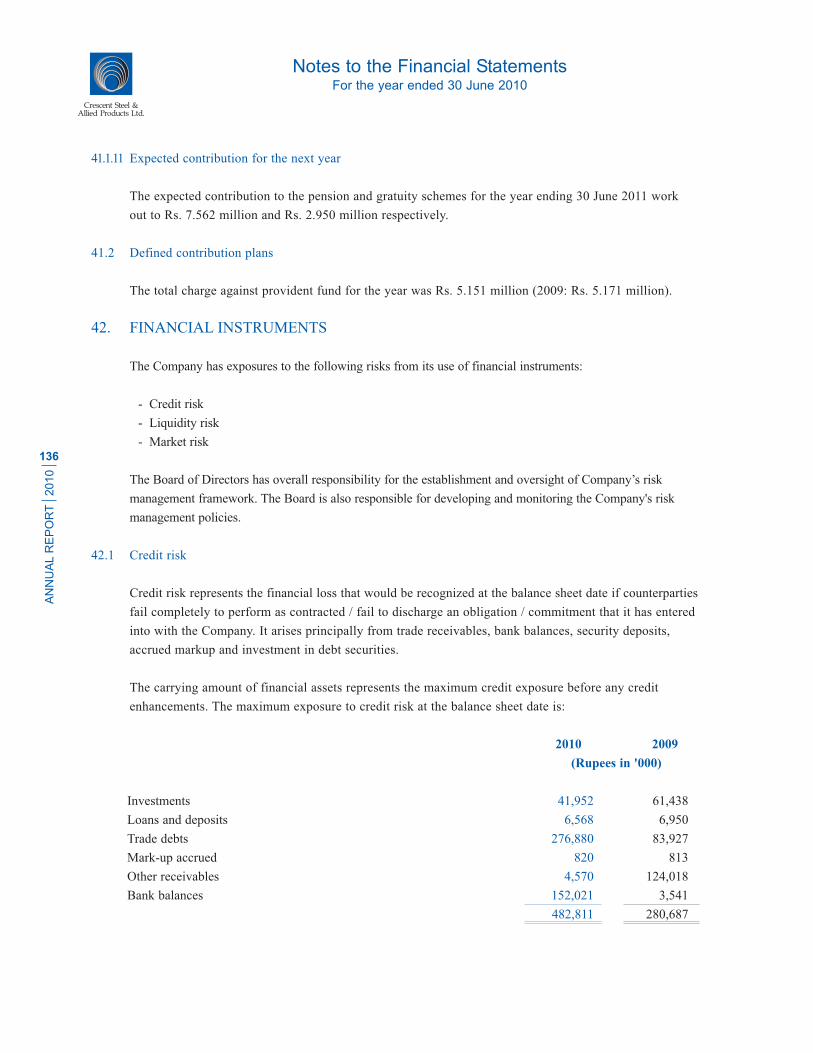
41.1.11 Expected contribution for the next year
The expected contribution to the pension and gratuity schemes for the year ending 30 June 2011 work
out to Rs. 7.562 million and Rs. 2.950 million respectively.
41.2 Defined contribution plans
The total charge against provident fund for the year was Rs. 5.151 million (2009: Rs. 5.171 million).
42. FINANCIAL INSTRUMENTS
The Company has exposures to the following risks from its use of financial instruments:
- Credit risk
- Liquidity risk
- Market risk
The Board of Directors has overall responsibility for the establishment and oversight of Company’s risk
management framework. The Board is also responsible for developing and monitoring the Company's risk
management policies.
42.1 Credit risk
Credit risk represents the financial loss that would be recognized at the balance sheet date if counterparties
fail completely to perform as contracted / fail to discharge an obligation / commitment that it has entered
into with the Company. It arises principally from trade receivables, bank balances, security deposits,
accrued markup and investment in debt securities.
The carrying amount of financial assets represents the maximum credit exposure before any credit
enhancements. The maximum exposure to credit risk at the balance sheet date is:
2010 2009
(Rupees in '000)
Investments 41,952 61,438
Loans and deposits 6,568 6,950
Trade debts 276,880 83,927
Mark-up accrued 820 813
Other receivables 4,570 124,018
Bank balances 152,021 3,541
482,811 280,687
Crescent Steel & Allied Products Ltd.
Notes to the Financial StatementsFor the year ended 30 June 2010
AN
NU
AL R
EP
OR
T
2010
136

Trade receivable
To manage exposure to credit risk in respect of trade receivables, management performs credit reviews
taking into account the customer's financial position, past experience and other factors. Sales tenders and
credit terms are approved by the tender approval committee. Where considered necessary, advance
payments are obtained from certain parties. Sales made to major customers are secured through letters of
credit. The management has set a maximum credit period of 15 days in respect of cotton division's sales to
reduce the credit risk.
All the trade debtors at the balance sheet date represent domestic parties.
The maximum exposure to credit risk before any credit enhancements for trade receivables at the reporting
date by type of customer was:
2010 2009
(Rupees in '000)
Cotton segment 93,894 33,411
Steel segment 182,986 50,516
276,880 83,927
The aging of trade receivable at the reporting date is:
Not past due 219,477 68,171
Past due 1-30 days 1,580 4,049
Past due 30-150 days 51,152 3,080
Past due 150 days 7,058 10,174
279,267 85,474
Less: impaired (2,387) (1,547)
276,880 83,927
One of the major customer accounts for Rs. 155.392 million of the trade receivables carrying amount at
30 June 2009 (2009: Rs. 35.16 million) that has a good track record with the Company.
The movement in the allowance for impairment in respect of trade receivables is as follows:
2010 2009
(Rupees in '000)
Opening balance 1,547 148
Provision during the year 840 1,399
Closing balance 2,387 1,547
Notes to the Financial StatementsFor the year ended 30 June 2010
AN
NU
AL R
EP
OR
T
2010
137

Based on past experience the management believes that no impairment allowance is necessary in respect of
trade receivables past due as some receivables have been recovered subsequent to the year end and for other
receivables there are reasonable grounds to believe that the amounts will be recovered in short course of time.
Non past due amounts of Rs. 46.819 million (2009: Rs. 43.233 million) and past due amounts of Rs. Nil
(2009: Rs. 9.616 million) are secured through inland letters of credit.
Settlement risk
All investing transactions are settled/paid for upon delivery as per the advice of investment committee. The
Company's policy is to enter into financial instrument contract by following internal guidelines such as
approving counterparties and approving credits.
Bank balances
The Company kept its surplus funds with banks having good credit rating. Currently the surplus funds are kept
with banks having rating from AAA to A.
Investment in debt securities
Credit risk arising on debt securities is mitigated by investing principally in investment grade rated
instruments. Where the investment is considered doubtful a provision is created there against. As at 30 June
2010, the Company has recognized a provision of Rs. 20.034 million against its exposure to preference shares
of investee companies.
The analysis below summarizes the credit quality of the Company's investments in debt securities of investee
companies.
2010 2009
Term Finance Certificates AA AA
Preference Shares
- Maple Leaf Cement Factory Limited D A2
- Shakarganj Mills Limited D A2
Concentration of credit risk
Concentration of credit risk arises when a number of counter parties are engaged in similar business activities
or have similar economic features that would cause their abilities to meet contractual obligation to be similarly
effected by the changes in economic, political or other conditions. The Company believes that it is not
exposed to major concentration of credit risk.
Crescent Steel & Allied Products Ltd.
Notes to the Financial StatementsFor the year ended 30 June 2010
AN
NU
AL R
EP
OR
T
2010
138
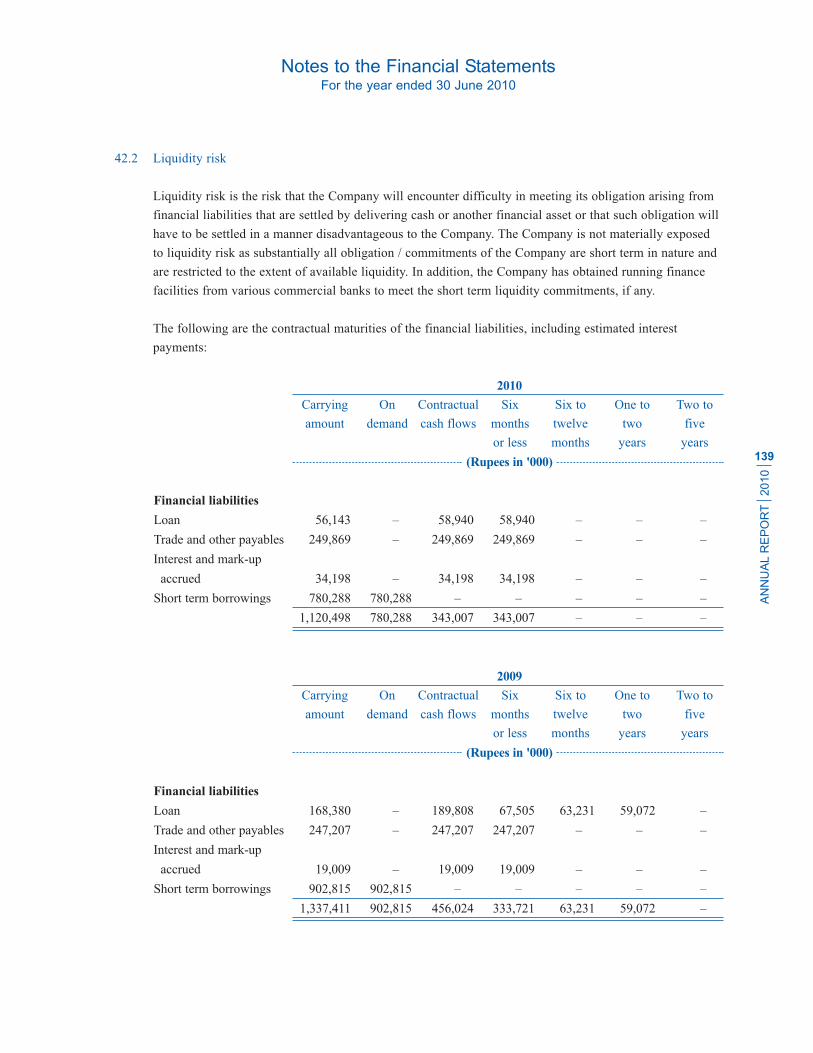
42.2 Liquidity risk
Liquidity risk is the risk that the Company will encounter difficulty in meeting its obligation arising from
financial liabilities that are settled by delivering cash or another financial asset or that such obligation will
have to be settled in a manner disadvantageous to the Company. The Company is not materially exposed
to liquidity risk as substantially all obligation / commitments of the Company are short term in nature and
are restricted to the extent of available liquidity. In addition, the Company has obtained running finance
facilities from various commercial banks to meet the short term liquidity commitments, if any.
The following are the contractual maturities of the financial liabilities, including estimated interest
payments:
2010
Carrying On Contractual Six Six to One to Two to
amount demand cash flows months twelve two five
or less months years years
(Rupees in '000)
Financial liabilities
Loan 56,143 ––– 58,940 58,940 ––– ––– –––
Trade and other payables 249,869 ––– 249,869 249,869 ––– ––– –––
Interest and mark-up
accrued 34,198 ––– 34,198 34,198 ––– ––– –––
Short term borrowings 780,288 780,288 ––– ––– ––– ––– –––
1,120,498 780,288 343,007 343,007 ––– ––– –––
2009
Carrying On Contractual Six Six to One to Two to
amount demand cash flows months twelve two five
or less months years years
(Rupees in '000)
Financial liabilities
Loan 168,380 ––– 189,808 67,505 63,231 59,072 –––
Trade and other payables 247,207 ––– 247,207 247,207 ––– ––– –––
Interest and mark-up
accrued 19,009 ––– 19,009 19,009 ––– ––– –––
Short term borrowings 902,815 902,815 ––– ––– ––– ––– –––
1,337,411 902,815 456,024 333,721 63,231 59,072 –––
Notes to the Financial StatementsFor the year ended 30 June 2010
AN
NU
AL R
EP
OR
T
2010
139
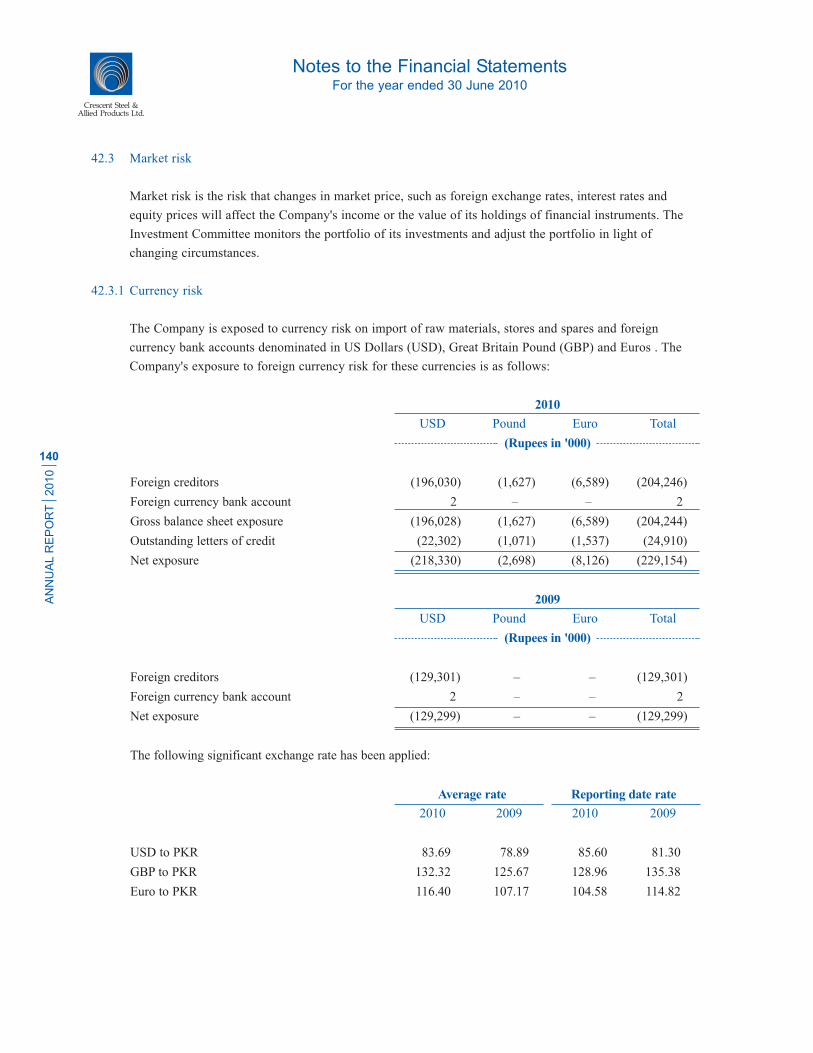
42.3 Market risk
Market risk is the risk that changes in market price, such as foreign exchange rates, interest rates and
equity prices will affect the Company's income or the value of its holdings of financial instruments. The
Investment Committee monitors the portfolio of its investments and adjust the portfolio in light of
changing circumstances.
42.3.1 Currency risk
The Company is exposed to currency risk on import of raw materials, stores and spares and foreign
currency bank accounts denominated in US Dollars (USD), Great Britain Pound (GBP) and Euros . The
Company's exposure to foreign currency risk for these currencies is as follows:
2010
USD Pound Euro Total
(Rupees in '000)
Foreign creditors (196,030) (1,627) (6,589) (204,246)
Foreign currency bank account 2 ––– ––– 2
Gross balance sheet exposure (196,028) (1,627) (6,589) (204,244)
Outstanding letters of credit (22,302) (1,071) (1,537) (24,910)
Net exposure (218,330) (2,698) (8,126) (229,154)
2009
USD Pound Euro Total
(Rupees in '000)
Foreign creditors (129,301) ––– ––– (129,301)
Foreign currency bank account 2 ––– ––– 2
Net exposure (129,299) ––– ––– (129,299)
The following significant exchange rate has been applied:
Average rate Reporting date rate
2010 2009 2010 2009
USD to PKR 83.69 78.89 85.60 81.30
GBP to PKR 132.32 125.67 128.96 135.38
Euro to PKR 116.40 107.17 104.58 114.82
Crescent Steel & Allied Products Ltd.
Notes to the Financial StatementsFor the year ended 30 June 2010
AN
NU
AL R
EP
OR
T
2010
140
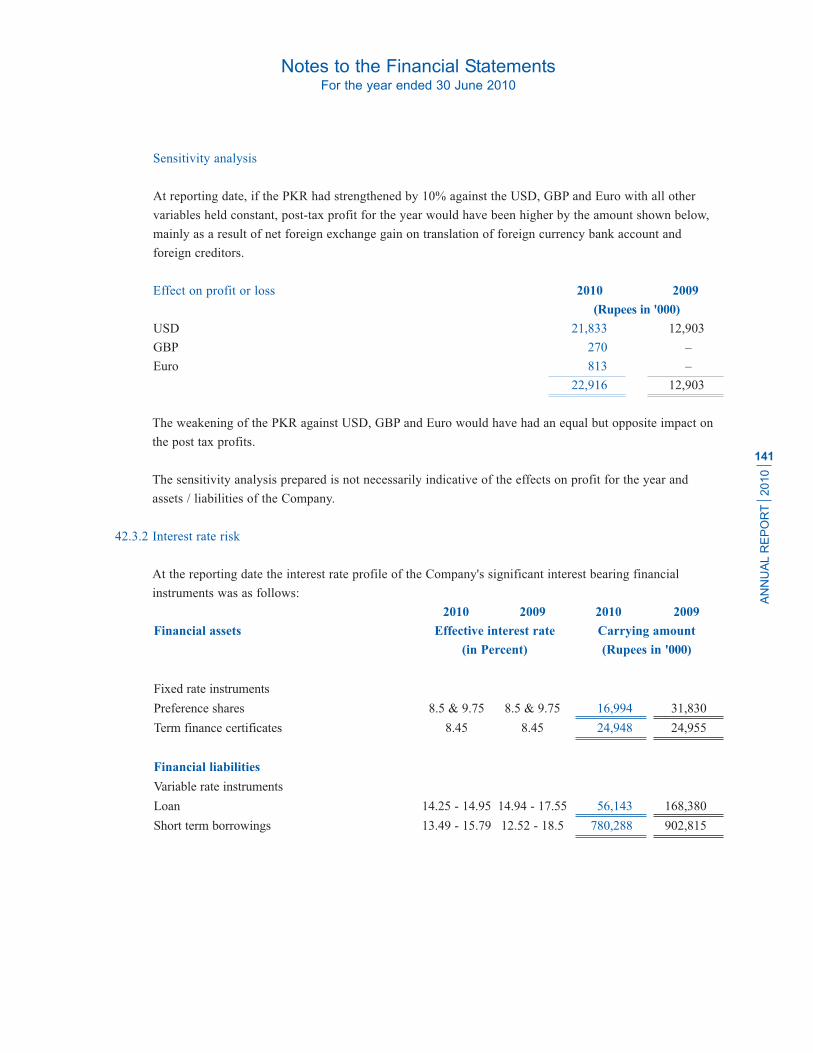
Sensitivity analysis
At reporting date, if the PKR had strengthened by 10% against the USD, GBP and Euro with all other
variables held constant, post-tax profit for the year would have been higher by the amount shown below,
mainly as a result of net foreign exchange gain on translation of foreign currency bank account and
foreign creditors.
Effect on profit or loss 2010 2009
(Rupees in '000)
USD 21,833 12,903
GBP 270 –––
Euro 813 –––
22,916 12,903
The weakening of the PKR against USD, GBP and Euro would have had an equal but opposite impact on
the post tax profits.
The sensitivity analysis prepared is not necessarily indicative of the effects on profit for the year and
assets / liabilities of the Company.
42.3.2 Interest rate risk
At the reporting date the interest rate profile of the Company's significant interest bearing financial
instruments was as follows:
2010 2009 2010 2009
Financial assets Effective interest rate Carrying amount
(in Percent) (Rupees in '000)
Fixed rate instruments
Preference shares 8.5 & 9.75 8.5 & 9.75 16,994 31,830
Term finance certificates 8.45 8.45 24,948 24,955
Financial liabilities
Variable rate instruments
Loan 14.25 - 14.95 14.94 - 17.55 56,143 168,380
Short term borrowings 13.49 - 15.79 12.52 - 18.5 780,288 902,815
Notes to the Financial StatementsFor the year ended 30 June 2010
AN
NU
AL R
EP
OR
T
2010
141

Fair value sensitivity analysis for fixed rate instruments
The Company does not account for any fixed rate financial assets and liabilities at fair value through profit
and loss. Therefore a change in interest rates at the reporting date would not affect profit and loss account.
Cash flow sensitivity analysis for variable rate instruments
A change of 100 basis points in interest rates at the reporting date would have decreased/(increased)
profit for the year by the amounts shown below. This analysis assumes that all other variables, in
particular foreign currency rates, remain constant. The analysis is performed on the same basis for 2009.
Profit and loss 100 bp
2010 2009
(Rupees in '000)
As at 30 June 2010
Cash flow sensitivity-Variable rate financial liabilities (3,901) 3,901
As at 30 June 2009
Cash flow sensitivity-Variable rate financial liabilities (3,734) 3,734
The sensitivity analysis prepared is not necessarily indicative of the effects on profit for the year and assets /
liabilities of the Company.
42.3.3 Other price risk
Other price risk is the risk that the fair value or future cash flows of a financial instrument will fluctuate
because of changes in market prices (other than those arising from interest rate risk or currency risk). Other
price risk arises from the Company's investment in ordinary shares of listed companies. To manage its price
risk arising from aforesaid investments, the Company diversifies its portfolio and continuously monitors
developments in equity markets. In addition the Investment Committee actively monitors the key factors that
affect stock price movement.
A 10% increase/decrease in share prices at year end would have decreased/increased the Company's profit in
case of held for trading investments and increase/decrease surplus on re-measurement of investments in case
of 'available for sale' investments as follows:
2010 2009
(Rupees in '000)
Effect on profit / (loss) 34,601 50,237
Effect on equity 17,668 21,374
Effect on investments 52,269 71,611
The sensitivity analysis prepared is not necessarily indicative of the effects on profit/equity and assets of the
Company.
Crescent Steel & Allied Products Ltd.
Notes to the Financial StatementsFor the year ended 30 June 2010
AN
NU
AL R
EP
OR
T
2010
142

42.4 Fair value of financial instruments
The carrying values of other financial assets and financial liabilities reported in balance sheet approximate
their fair values.
The Company measures fair values using the following fair value hierarchy that reflects the significance
of the inputs used in making the measurements:
- Level 1: Quoted market price (unadjusted) in an active market for an identical instrument
- Level 2: Valuation techniques based on observable inputs, either directly (i.e. as prices) or indirectly
(i.e. derived from prices).
- Level 3: Valuation techniques using significant unobservable inputs.
Investment in ordinary shares of listed companies is valued using quoted prices in active market, hence,
fair value of such investments fall within Level 1 in fair value hierarchy as mentioned above.
43. REMUNERATION TO THE CHIEF EXECUTIVE, DIRECTOR AND EXECUTIVES
Chief Executive Director Executives Total
2010 2009 2010 2009 2010 2009 2010 2009
(Rupees in '000)
Managerial
remuneration 6,750 6,000 ––– 2,910 17,434 18,467 24,184 27,377
House rent 3,038 2,700 ––– 1,309 7,339 6,422 10,377 10,431
Utilities 675 600 ––– 291 1,678 1,475 2,353 2,366
Travelling expenses 994 1,152 ––– 317 ––– 309 994 1,778
Others 932 709 1,166 ––– ––– 44 2,098 753
Medical 211 60 ––– 109 994 1,029 1,205 1,198
Contribution to:
- Provident fund 675 600 ––– 291 1,065 922 1,740 1,813
- Gratuity fund 472 460 ––– 223 719 657 1,191 1,340
- Pension fund 1,350 1,200 ––– 582 2,331 2,008 3,681 3,790
Club subscription
and expenses 649 447 ––– 10 44 46 693 503
Entertainment ––– ––– ––– 33 42 121 42 154
Conveyance ––– ––– ––– ––– 1,001 971 1,001 971
Telephone ––– ––– ––– 11 6 28 6 39
15,746 13,928 1,166 6,086 32,653 32,499 49,565 52,513
Number of
persons 1 1 1 1 14 14 16 16
Notes to the Financial StatementsFor the year ended 30 June 2010
AN
NU
AL R
EP
OR
T
2010
143
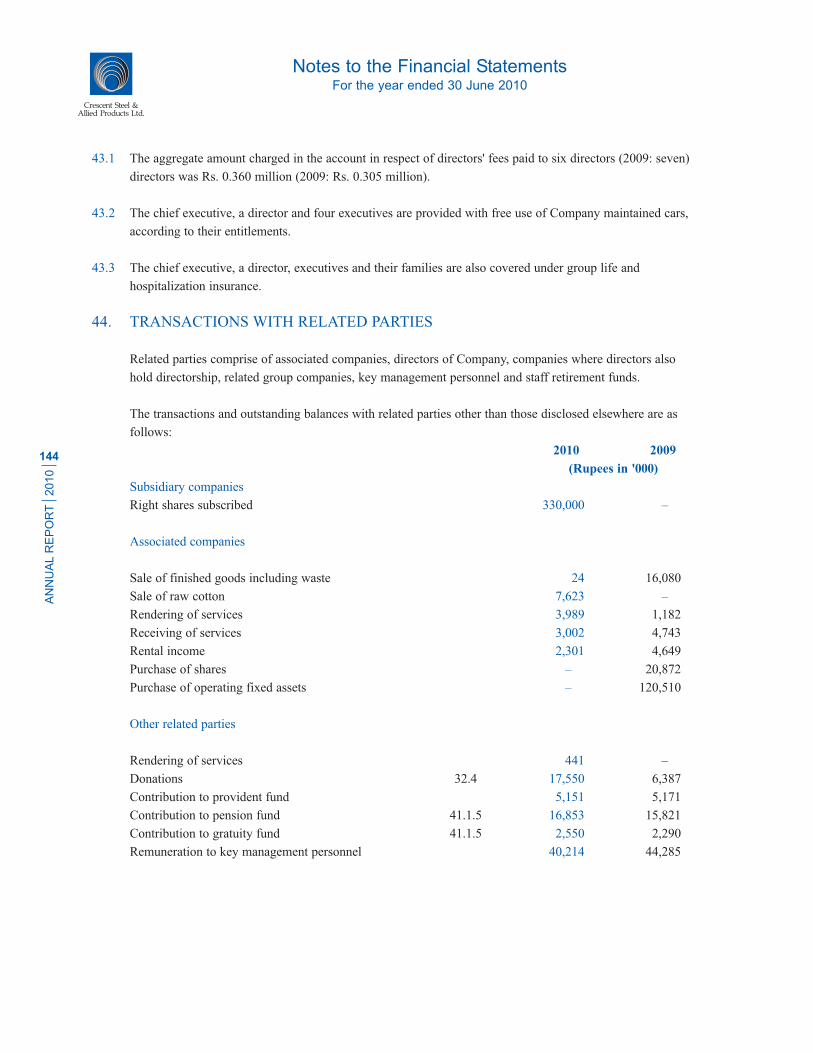
43.1 The aggregate amount charged in the account in respect of directors' fees paid to six directors (2009: seven)
directors was Rs. 0.360 million (2009: Rs. 0.305 million).
43.2 The chief executive, a director and four executives are provided with free use of Company maintained cars,
according to their entitlements.
43.3 The chief executive, a director, executives and their families are also covered under group life and
hospitalization insurance.
44. TRANSACTIONS WITH RELATED PARTIES
Related parties comprise of associated companies, directors of Company, companies where directors also
hold directorship, related group companies, key management personnel and staff retirement funds.
The transactions and outstanding balances with related parties other than those disclosed elsewhere are as
follows:
2010 2009
(Rupees in '000)
Subsidiary companies
Right shares subscribed 330,000 –––
Associated companies
Sale of finished goods including waste 24 16,080
Sale of raw cotton 7,623 –––
Rendering of services 3,989 1,182
Receiving of services 3,002 4,743
Rental income 2,301 4,649
Purchase of shares ––– 20,872
Purchase of operating fixed assets ––– 120,510
Other related parties
Rendering of services 441 –––
Donations 32.4 17,550 6,387
Contribution to provident fund 5,151 5,171
Contribution to pension fund 41.1.5 16,853 15,821
Contribution to gratuity fund 41.1.5 2,550 2,290
Remuneration to key management personnel 40,214 44,285
Crescent Steel & Allied Products Ltd.
Notes to the Financial StatementsFor the year ended 30 June 2010
AN
NU
AL R
EP
OR
T
2010
144

44.1 Sale of goods, rendering of services and rental income are based on commercial terms and at market
prices which are approved by the Board of Directors.
44.2 Contributions to the employee retirement benefits are made in accordance with the terms of employee
retirement benefits schemes and actuarial advice.
44.3 Key management personnel are those person having authority and responsibility for planning, directing
and controlling the activities of the company, including directors of the company. There are no
transactions with the key management personnel other than their terms of employment / entitlements.
45. CAPITAL RISK MANAGMENT
The Company's prime objective when managing capital is to safeguard its ability to continue as a going
concern in order to provide adequate returns for shareholders and benefits for other stakeholders and to
maintain an optimal capital structure to reduce the cost of capital. The Company's overall strategy remains
unchanged from year 2009.
The Company manages its capital structure and makes adjustments to it in the light of changes in
economic conditions. To maintain or adjust the capital structure, the Company may adjust the dividend
payments to share holders or issue new shares. The management seeks to maintain a balance between
higher returns that might be possible with higher levels of borrowings and the advantages and security
afforded by a sound capital position.
The Company finances its operations through equity, borrowings and management of working capital
with a view to maintaining an appropriate mix between various sources of finance to minimize risk.
The Company is not subject to any externally imposed capital requirements.
The Company monitors capital on the basis of the gearing ratio. This ratio is calculated as net debt
divided by total capital. Net debt is calculated as total debt less cash and bank balances. Total capital is
calculated as equity as shown in the balance sheet plus net debt.
45.1 Gearing ratio
2010 2009
(Rupees in '000)
The gearing ratio at end of the year was as follows:
Total debt 45.1.1 836,431 1,071,195
Less: Cash and bank balances 153,679 4,144
Net debt 682,752 1,067,051
Total equity 45.1.2 2,622,612 2,328,796
Total capital 3,305,364 3,395,847
Gearing ratio 21% 31%
Notes to the Financial StatementsFor the year ended 30 June 2010
AN
NU
AL R
EP
OR
T
2010
145

45.1.1 Total debt is defined as long and short term borrowings (excluding derivatives), as described in notes 7 and
11 to the financial statements.
45.1.2 Total equity includes all capital and reserves of the Company that are managed as capital.
46. PLANT CAPACITY AND PRODUCTION
46.1 Steel segment
Pipe plant
The plant’s installed / rated capacity for production based on single shift is 30,000 tons (2009: 30,000 tons)
annually on the basis of notional pipe size of 30" dia x ?" thickness. The actual production achieved during
the year was 17,410 tons (2009: 14,368 tons) line pipes of varied sizes and thickness, which is equivalent to
57,249 tons (2009: 37,470 tons) if actual production is translated to the notional pipe size of 30" diameter.
Coating plant
The coating plant has a capacity of externally shot blasting and coating of line pipes with 3 layer high /
medium density polyethylene coating at a rate of 250 square meters of surface area per hour on pipe sizes
ranging from 219 to 1067 mm outside dia and thickness ranging from 3 to 16 mm.
The annual capacity of the plant works out to 600,000 square meters outside surface of pipes based on
notional size of 30" dia on single shift working. Coating of 788,393 meters (2009: 585,651 meters) of
different dia pipes (461,043 square meters surface area) was achieved during the year (2009:382,902 square
meters surface area).
46.2 Cotton segment
Spinning unit 1
The plant capacity converted to 20s count based on three shifts per day for 1,080 shifts is 6,452,874
kilograms. Actual production converted into 20s count was 5,016,846 kilograms (2009: 5,306,859
kilograms).
Spinning unit 2
The plant capacity converted to 20s count based on three shifts per day for 1,080 shifts is 9,284,825
kilograms. Actual production converted into 20s count was 9,638,111 kilograms (2009: 9,894,119
kilograms).
Crescent Steel & Allied Products Ltd.
Notes to the Financial StatementsFor the year ended 30 June 2010
AN
NU
AL R
EP
OR
T
2010
146

46.3 The capacities of the plant were utilized to the extent of orders received.
47. NON ADJUSTING EVENT AFTER BALANCE SHEET DATE
The Board of Directors in their meeting held on 29 July 2010 has proposed a final cash dividend for
the year ended 30 June 2010 of Re. 1 per share (i.e. 10%), amounting to Rs. 56.460 million (2009:
Rs. Nil per share) for approval of the members of the Company at the Annual General Meeting to be
held on 31 August 2010. This is in addition to the first and second interim cash dividends of Re. 1 per
share each already distributed and recorded in these financial statements. These financial statements
do not include the effect of this proposed final cash dividend and will be accounted for subsequent to
year end.
48. DATE OF AUTHORIZATION FOR ISSUE
These financial statements were authorized for issue in the Board of Directors meeting held on
29 July 2010.
Notes to the Financial StatementsFor the year ended 30 June 2010
AN
NU
AL R
EP
OR
T
2010
147
DirectorChief Executive

Consolidated Financial StatementsFor the year ended 30 June 2010
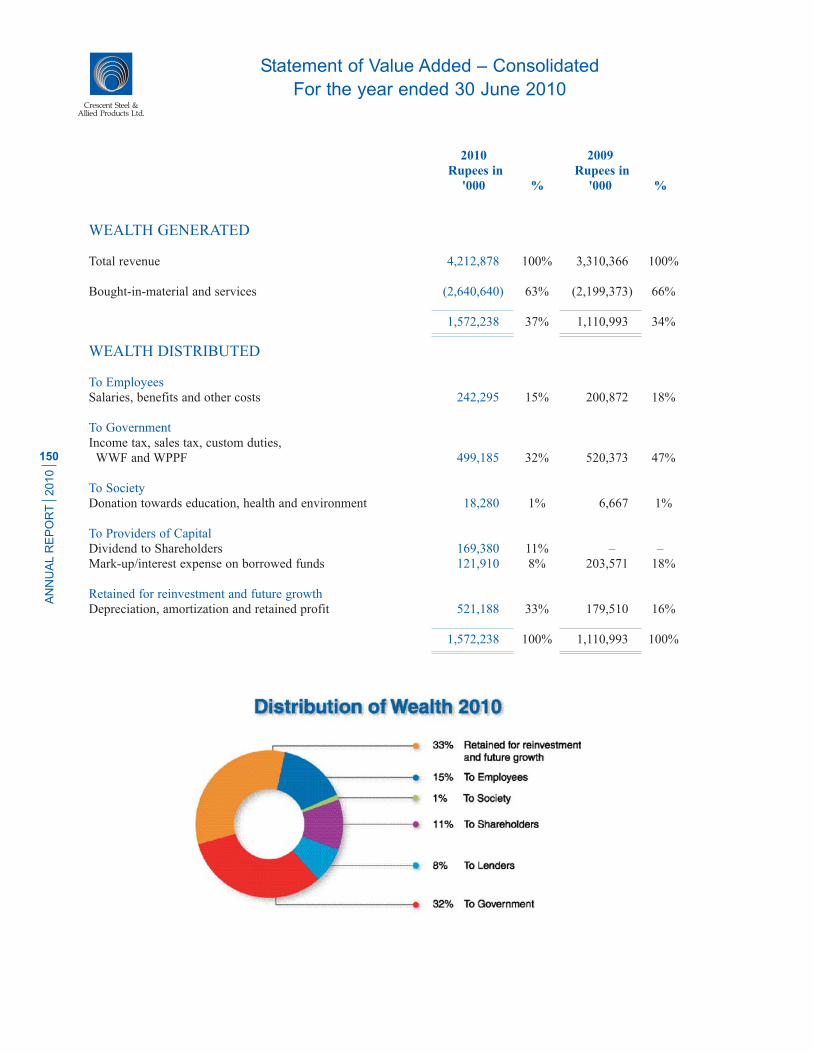
Crescent Steel & Allied Products Ltd.
Statement of Value Added – Consolidated
For the year ended 30 June 2010
AN
NU
AL R
EP
OR
T
2010
150
2010 2009
Rupees in Rupees in
'000 % '000 %
WEALTH GENERATED
Total revenue 4,212,878 100% 3,310,366 100%
Bought-in-material and services (2,640,640) 63% (2,199,373) 66%
1,572,238 37% 1,110,993 34%
WEALTH DISTRIBUTED
To Employees
Salaries, benefits and other costs 242,295 15% 200,872 18%
To Government
Income tax, sales tax, custom duties,
WWF and WPPF 499,185 32% 520,373 47%
To Society
Donation towards education, health and environment 18,280 1% 6,667 1%
To Providers of Capital
Dividend to Shareholders 169,380 11% ––– ––
Mark-up/interest expense on borrowed funds 121,910 8% 203,571 18%
Retained for reinvestment and future growth
Depreciation, amortization and retained profit 521,188 33% 179,510 16%
1,572,238 100% 1,110,993 100%

Vertical Analysis – Consolidated
AN
NU
AL R
EP
OR
T
2010
151
2010 % 2009 % 2008 % 2007 % 2006 %
Operating results (Rupees in million)
Sales - Net 3,704 100.0 3,311 100.0 4,200 100.0 2,950 100.0 1,707 100.0
Cost of sales 2,887 77.9 2,597 78.4 3,304 78.7 2,440 82.7 1,567 91.8
Gross profit 817 22.1 714 21.6 896 21.3 510 17.3 140 8.2
Income from/(loss on) investments - net 223 6.0 (339) (10.2) 74 1.8 411 13.9 333 19.5
Distribution, selling and administrative
expenses 188 5.1 144 4.3 151 3.6 147 5.0 119 6.9
Other operating expenses 63 1.7 175 5.3 110 2.6 126 4.3 22 1.3
Other operating income 38 1.0 39 1.2 20 0.5 107 3.6 25 1.4
Operating profit before finance costs 827 22.3 95 2.9 729 17.4 757 25.6 357 20.9
Finance costs 122 3.3 204 6.1 153 3.6 128 4.4 83 4.9
Share of profit/(loss) in equity accounted
investees - net 11 0.3 4 0.1 51 1.2 99 3.4 (12) (0.7)
Profit/(loss) before taxation 716 19.3 (105) (3.2) 627 14.9 727 24.7 262 15.4
Taxation 181 4.9 135 4.1 211 5.0 64 2.2 3 0.2
Net income/(loss) 535 14.4 (240) (7.2) 416 9.9 663 22.5 260 15.2
Balance sheet (Rupees in million)
Property, plant and equipment 1,257 25.7 1,225 29.8 1,233 25.4 1,307 27.8 1,381 37.2
Investments including investment property 1,945 39.7 1,856 45.2 2,737 56.5 2,300 49.0 1,313 35.3
Other non current assets 28 0.6 5 0.1 5 0.1 5 0.1 7 0.2
Current assets (excluding investments) 1,665 34.0 1,024 24.9 871 18.0 1,084 23.1 1,014 27.3
Total assets 4,895 100.0 4,110 100.0 4,847 100.0 4,696 100.0 3,715 100.0
Shareholders' equity 3,079 62.9 2,546 61.9 2,994 61.8 3,200 68.2 2,038 54.9
Long term debt (excluding current
maturity) ––– ––– 56 1.4 168 3.5 354 7.5 548 14.8
Deferred liabilities 72 1.5 100 2.4 112 2.3 65 1.4 2 –––
Short term debt (including current maturity
of long term debt) 836 17.1 1,015 24.7 1,306 27.1 626 13.3 877 23.6
Other current liabilities 908 18.5 393 9.6 267 5.4 451 9.6 250 6.7
Total equity and liabilities 4,895 100.0 4,110 100.0 4,847 100.0 4,696 100.0 3,715 100.0
Cash flows (Rupees in million)
Cash generated from operations 827 473.8 751 405.4 906 106.0 630 350.0 30 16.3
Net cash generated from/(used in) operating
activities 462 264.6 336 181.4 566 66.2 486 270.0 (88) (47.8)
Net cash inflows/(outflows) from investing
activities 22 12.5 71 38.6 (893) (104.5) (392) (217.8) (778) (422.8)
Net cash (outflows)/inflows from financing
activities (309) (177.1) (222) (120.0) (528) (61.8) 86 47.8 682 370.7
Net increase/(decrease) in cash and cash
equivalents 175 100.0 185 100.0 (855) (100.0) 180 100.0 (184) (100.0)
* Note: The figures presented in this analysis for the financial years ended 30 June 2010 and 2009 are those based on the Group's consolidated financial statements. The figures
presented for the years prior to 2009 are based on the Holding Company's individual financial statements as published in the annual reports in prior years.

Crescent Steel & Allied Products Ltd.
2010 Variance 2009 Variance 2008 Variance 2007 Variance 2006 Variance
vs Last vs Last vs Last vs Last vs Last
Year Year Year Year Year
Increase/ Increase/ Increase/ Increase/ Increase/
(Decrease) ( Decrease) ( Decrease) ( Decrease) (Decrease)
% % % % %
Operating results (Rupees in million)
Sales - Net 3,704 11.9 3,311 (21.2) 4,200 42.4 2,950 72.8 1,707 (36.5)
Cost of sales 2,887 11.2 2,597 (21.4) 3,304 35.4 2,440 55.7 1,567 (32.3)
Gross profit 817 14.5 714 (20.4) 896 75.6 510 263.8 140 (62.3)
Income from/(loss on) investments - net 223 165.7 (339) (560.3) 74 (82.1) 411 23.6 333 88.7
Distribution, selling and administrative
expenses 188 31.0 144 (4.7) 151 2.9 147 23.6 119 9.5
Other operating expenses 63 (63.8) 175 59.6 110 (12.6) 126 474.1 22 (68.8)
Other operating income 38 (3.3) 39 99.1 20 (81.7) 107 335.7 25 (72.0)
Operating profit before finance costs 827 772.7 95 (87.0) 729 (3.7) 757 111.8 357 (21.9)
Finance costs 122 (40.1) 204 33.0 153 19.1 128 54.9 83 88.7
Share of profit in equity accounted
investees - net 11 203.5 4 (92.7) 51 (48.8) 99 931.5 (12) (38.9)
Profit/(loss) before taxation 716 780.6 (105) (116.8) 627 (13.8) 727 177.2 262 (33.4)
Taxation 181 34.3 135 (36.2) 211 228.9 64 2,199.1 3 (96.6)
Net income/(loss) 535 323.0 (240) (157.7) 416 (37.3) 663 155.4 260 (16.9)
Balance sheet (Rupees in million)
Property, plant and equipment 1,257 2.6 1,225 (0.7) 1,233 (5.6) 1,307 (5.4) 1,381 212.6
Investments including investment
property 1,945 4.8 1,856 (32.2) 2,737 19.0 2,300 75.3 1,313 (12.6)
Other non current assets 28 505.4 5 (5.1) 5 (4.1) 5 (26.0) 7 (26.3)
Current assets (excluding investments) 1,665 62.6 1,024 17.5 871 (19.6) 1,084 6.9 1,014 64.6
Total assets 4,895 19.1 4,110 (15.2) 4,847 3.2 4,696 26.4 3,715 44.6
Shareholders' equity 3,079 21.0 2,546 (15.0) 2,994 (6.4) 3,200 57.1 2,038 9.5
Long term debt (excluding current
maturity) ––– (100.0) 56 (66.8) 168 (52.5) 354 (35.4) 548 132.2
Deferred liabilities 72 (28.3) 100 (10.5) 112 72.7 65 3,850.1 2 (57.9)
Short term debt (including current
maturity of long term debt) 836 (17.6) 1,015 (22.3) 1,306 108.7 626 (28.6) 877 275.6
Other current liabilities 908 131.0 393 47.3 267 (40.9) 451 80.4 250 6.3
Total equity and liabilities 4,895 19.1 4,110 (15.2) 4,847 3.2 4,696 26.4 3,715 (44.6)
Cash flows (Rupees in million)
Cash generated from operations 827 10.1 751 (17.1) 906 43.8 630 2,000.0 30 (88.8)
Net cash generated from operating
activities 462 37.5 336 (40.6) 566 16.5 486 646.1 (89) (147.6)
Net cash inflows/(outflows) from
investing activities 22 (69.4) 71 108.0 (893) (127.9) (392) 49.6 (778) 1,241.4
Net cash (outflows)/inflows from financing
activities (309) (39.2) (222) 57.9 (528) (714.0) 86 (87.4) 682 (795.9)
Net increase/(decrease) in cash and cash
equivalents 175 (5.8) 185 121.7 (855) (575.0) 180 197.8 (184) (693.5)
* Note: The figures presented in this analysis for the financial years ended 30 June 2010 and 2009 are those based on the Group's consolidated financial statements. The figures
presented for the years prior to 2009 are based on the Holding Company's individual financial statements as published in the annual reports in prior years.
Horizontal Analysis – Consolidated
AN
NU
AL R
EP
OR
T
2010
152

The Directors of Crescent Steel and Allied Products Limited (CSAPL) have pleasure in presenting their report
together with the audited consolidated financial statements of the Group for the year ended 30 June 2010. The
Group comprises of CSAPL and its wholly owned subsidiaries Shakarganj Energy (Private) Limited and Crescent
Continental Gas Pipelines Limited (CCGPL). CCGPL is not carrying on any business operations and accordingly
no financial statements are being prepared.
The Directors' Report, giving commentary on the performance of CSAPL for the year ended 30 June 2010 has been
presented separately.
Group Results
The consolidated financial results of the Group are summarized below:
2010 2009
(Rupees in '000)
Profit/(loss) for the year 715,824 (105,071)
Taxation (180,966) (134,678)
Profit/(loss) after taxation 534,858 (239,749)
Unappropriated (loss)/profit brought forward (23,425) 267,651
Profit available for appropriation 511,433 27,902
Appropriations:
- Bonus shares issued 2008 - @10% ––– (51,327)
- First interim dividend 2010 - @10% (56,460) –––
- Second interim dividend 2010 - @10% (56,460) –––
(112,920) (51,327)
Unappropriated profit/(loss) carried forward 398,513 (23,425)
Basic and diluted earnings/(loss) per share Rs. 9.47 Rs. (4.25)
Shakarganj Energy (Private) Limited
During the year, CSAPL acquired 100% ownership of Shakarganj Energy (Private) Limited to make it a wholly
owned subsidiary. The subsidiary is in the process of developing 18 MW power generation project with an
estimated investment of Rs. 430 million. CSAPL has so far made an equity investment of Rs. 330.1 million in the
subsidiary. The project is being installed at Bhone and on completion will produce electricity for onward supply to
the PEPCO/DISCOS under agreements with the Government or to other consumers as may be permitted by the
Government. The project is scheduled to commence production by November 2010.
Directors’ Report – Consolidated
AN
NU
AL R
EP
OR
T
2010
153

Crescent Steel & Allied Products Ltd.
Consequently, CSAPL has prepared consolidated financial statements of the Group for the first time with
corresponding figures of CSAPL's individual financial statements been presented for the year ended 30 June
2009.
Pattern of Shareholding
The pattern of shareholding and additional information regarding pattern of shareholding is attached separately.
Material Changes and Commitments
No material changes and commitments affecting the financial position of your Company have occurred between the
end of the financial year to which this Balance Sheet relates and the date of the Directors' Report.
By order of the Board
Ahsan M. Saleem
Chief Executive Officer
29 July 2010
Directors’ Report – Consolidated
AN
NU
AL R
EP
OR
T
2010
154

2010 2009 2008 2007 2006 2005 2004A - Profit and loss account (Rupees in millions)Sales - Net 3,704.4 3,310.9 4,200.2 2,950.1 1,707.1 2,686.6 1,348.1 Cost of sales 2,887.3 2,597.2 3,303.8 2,439.7 1,566.8 2,314.7 1,173.9 Gross profit 817.1 713.7 896.4 510.5 140.3 371.9 174.3 Income from/(loss on) investments - net 222.7 (338.8) 73.6 411.4 332.9 176.4 221.2 Distribution, selling and administrative expenses 187.5 143.9 151.0 146.6 118.6 108.3 90.7 Other operating expenses 63.5 175.2 109.7 125.5 21.9 70.0 36.9 Other operating income 37.7 39.0 19.6 107.0 24.6 87.7 79.2 Operating profit before finance costs 826.5 94.8 728.9 756.7 357.3 457.7 347.1 Finance costs 121.9 203.6 153.0 128.5 82.9 43.9 20.4 Share of profit/(loss) in equity accounted
investees - net 11.2 3.7 50.8 99.1 (11.9) (19.5) –––Profit/(loss) before taxation 715.8 (105.1) 626.6 727.3 262.4 394.2 326.7 Taxation 180.9 134.7 210.9 64.1 2.8 81.8 30.8 Net income/(loss) 534.9 (239.8) 415.7 663.2 259.6 312.4 295.9
B - Balance Sheet (Rupees in millions)Current assets 2,128.8 1,716.2 2,279.1 2,124.8 1,841.6 1,779.5 1,541.1 Stock-in-trade 1,026.6 616.4 606.1 633.5 468.5 194.3 240.5 Trade debts 276.9 83.9 118.7 181.4 75.1 132.4 36.0 Current liabilities 1,744.1 1,408.2 1,573.1 1,077.1 1,127.1 468.9 370.9 Trade and other payables 873.4 373.9 240.8 435.1 229.9 221.9 174.5 Property, plant and equipment 1,256.9 1,224.6 1,233.2 1,306.6 1,381.1 441.8 467.8 Total assets 4,894.8 4,109.7 4,846.7 4,696.1 3,714.7 2,569.8 2,228.2 Long term loan (excluding current maturity) ––– 55.9 168.1 354.0 548.3 236.1 326.5 Deferred liabilities 71.6 99.8 111.5 64.6 1.6 3.9 10.6 Short term loans (including current maturity
of long term debt) 836.4 1,015.3 1,306.4 625.8 876.9 233.5 156.2 Reserves 2,514.6 1,981.2 2,480.7 2,733.8 1,687.7 1,617.5 1,298.5 Shareholders' equity 3,079.2 2,545.8 2,994.0 3,200.4 2,037.7 1,860.5 1,519.4
C - Profitability ratiosEarnings before interest, taxation, depreciation
and amortization (EBITDA) (Rs. in millions) 1,022.3 279.1 954.7 1,029.3 444.8 522.7 431.4 Profit before taxation and deprecation
(Rs. in millions) 889.8 74.0 801.3 900.0 359.8 476.8 326.7 Gross profit margin to net sales (%) 22.1 21.6 21.3 17.3 8.2 13.8 12.9 Operating profit margin to net sales (%) 22.3 2.9 17.4 25.6 20.9 17.0 25.7 Net income/(loss) to net sales (%) 14.4 (7.2) 9.9 22.5 15.2 11.6 21.9
D - Return on assets/capitalReturn on average assets (%) 11.9 (5.4) 8.7 15.8 8.3 13.0 16.0 Return on capital employed (RoCE) (%) 21.4 2.7 17.4 20.5 10.0 18.8 17.3 Return on average capital employed (%) 22.2 2.4 18.0 22.4 11.9 20.2 21.0 Return on equity (%) 17.4 (9.4) 13.9 20.7 12.7 16.8 19.5 Return on average equity (%) 19.0 (8.7) 13.4 25.3 13.3 18.5 22.1
E - Per share results and returnEarnings/(loss) per share (Rs.) 9.47 (4.25) 7.36 12.10 6.10 7.30 6.90 Break-up value per share (Rs.) 54.5 45.1 58.3 68.6 58.2 76.6 68.8 Market value per share (Rs.) 25.1 18.0 61.7 71.0 43.5 77.0 78.9 Market value per share (high-low) (Rs.) 34 - 18 61 - 13 108 - 58 72 - 32 90 - 37 100 - 64 93 - 50 Price earnings ratio (times) 2.6 ––– 7.6 5.0 5.9 6.0 5.9 Cash dividend - including final proposed
(Rs. in millions) 169.4 ––– 154.0 140.0 ––– 72.9 77.3 Dividend per share - including final proposed (Rs.) 3.0 ––– 3.0 3.0 ––– 3.0 3.5 Dividend yield (%) - including final proposed 12.0 ––– 4.9 4.2 ––– 3.9 4.4 Dividend payout ratio (%) - including final proposed 31.7 ––– 37.0 21.1 ––– 23.3 26.1 Bonus shares (%) - including final proposed ––– ––– 10 10 20 20 10
F - Coverage ratiosInterest coverage (times) 6.9 0.5 5.1 6.7 4.2 10.0 17.0
G - Activity ratiosDebtors turnover (times) 20.5 32.7 28.0 23.0 16.5 31.9 43.5 Average collection period (days) 18 11 13 16 22 11 8 Inventory turnover (times) 3.5 4.2 5.3 4.4 4.7 10.6 5.3 Inventory turnover (days) 104 86 68 82 77 34 69 Creditors turnover (times) 14.0 24.6 19.7 11.5 11.3 17.8 13.3 Average payment days (days) 26 15 19 32 32 20 28 Property, plant and equipment turnover (times) 2.9 2.7 3.4 2.3 1.2 6.1 2.9 Total assets turnover (times) 0.8 0.8 0.9 0.6 0.5 1.0 0.6
H - Liquidity ratiosCurrent ratio 1.2 : 1 1.2 : 1 1.4 : 1 2 : 1 1.6 : 1 3.8 : 1 4.2 : 1 Quick/Acid-test ratio 0.6 : 1 0.8 : 1 1.1 : 1 1.4 : 1 1.2 : 1 3.4 : 1 3.5 : 1 Working capital (Net current assets) 384.8 308.0 706.1 1,047.7 714.5 1,310.6 1,170.2 Working capital turnover (times) 10.7 6.5 4.8 3.3 1.7 2.2 1.4 Operating cycle (days) 96 82 63 66 67 25 50
I - Leverage ratiosLong term debt to equity (%) ––– 2.2 5.6 11.1 26.9 12.7 21.5 Long term debt : Equity ratio 0 : 100 2 : 98 5 : 95 10 : 90 21 : 79 11 : 89 18 : 82 Total liabilities to total assets (%) 35.6 35.6 35.9 30.5 45.1 27.4 31.3 Gearing ratio (%) 17.5 29.5 32.9 22.8 40.9 18.3 24.1
J - Other data (Rupees in million)Depreciation/amortization 184.5 180.6 175.0 173.4 99.4 84.5 84.2 Capital expenditure (including leased assets) 228.9 169.1 153.5 126.9 996.5 66.3 163.2 No. of ordinary shares (no. of shares in millions) 56.5 56.5 51.3 46.7 35.0 24.3 22.1
* Note: The figures and ratios presented in this analysis for the financial years ended 30 June 2010 and 2009 are those based on the Group's consolidatedfinancial statements. The figures and ratios presented for the years prior to 2009 are based on the Holding Company's individual financial statements aspublished in the annual reports in prior years.
Financial Highlights (including ratio analysis) – Consolidated
AN
NU
AL R
EP
OR
T
2010
155

Crescent Steel & Allied Products Ltd.
Financial Highlights

AN
NU
AL R
EP
OR
T
2010
157
KPMG Taseer Hadi & Co.
Chartered Accountants
First Floor
Sheikh Sultan Trust Building No. 2
Beaumont Road
Karachi 75530 Pakistan
Telephone +92 (21) 3568 5847
Fax +92 (21) 3568 5095
Internet www.kpmg.com.pk
KPMG Taseer Hadi & Co., a partnership firm registered in Pakistan
and a member firm of the KPMG network of independent member
firms affiliated with KPMG International, a Swiss cooperative
We have audited the annexed consolidated financial statements of Crescent Steel and Allied Products Limited (the
holding company) and its subsidiary company Shakarganj Energy (Private) Limited comprising consolidated
balance sheet as at 30 June 2010 and the related consolidated profit and loss account, consolidated statement of
comprehensive income, consolidated cash flow statement and consolidated statement of changes in equity together
with the notes forming part thereof, for the year then ended. We have also expressed separate opinion on the
financial statements of Crescent Steel and Allied Products Limited. The financial statements of subsidiary company
Shakarganj Energy (Private) Limited was audited by another firm of chartered accountants, whose audit report has
been furnished to us and our opinion in so far as it relates to the amounts included for such company, is based
solely on the report of other auditor.
These consolidated financial statements are the responsibility of the Holding Company's management. Our
responsibility is to express our opinion on these consolidated financial statements based on our audit.
We conducted our audit in accordance with the auditing standards as applicable in Pakistan. These standards
require that we plan and perform the audit to obtain reasonable assurance about whether the above said statements
are free of any material misstatement. An audit includes examining, on a test basis, evidence supporting the
amounts and disclosures in the above said statements. An audit also includes assessing the accounting policies and
significant estimates made by management, as well as, evaluating the overall presentation of the above said
statements. We believe that our audit provides a reasonable basis for our opinion.
In our opinion the consolidated financial statements present fairly the consolidated financial position of Crescent
Steel and Allied Products Limited and its subsidiary company, Shakarganj Energy (Private) Limited, as at 30 June
2010 and the consolidated results of its operations, its consolidated statement of comprehensive income, its
consolidated cash flows statement and consolidated statement of changes in equity for the year then ended in
accordance with the approved accounting standards as applicable in Pakistan.
As stated in note 4.1 to the financial statements, the Company has changed its accounting policies on initial
application of standards, amendments or interpretations to existing standards, with which we concur.
KPMG Taseer Hadi & Co.29 July 2010 Chartered Accountants.Karachi Moneeza Usman Butt
Auditors’ Report to the Members

Crescent Steel & Allied Products Ltd.
Note 2010 2009
(Rupees in '000)
EQUITY AND LIABILITIES
Share capital and reserves
Authorized capital
100,000,000 ordinary shares of Rs. 10 each 1,000,000 1,000,000
Issued, subscribed and paid-up capital 6 564,600 564,600
Capital reserves 274,066 162,640
Revenue reserves 2,240,513 1,818,575
3,079,179 2,545,815
Non-current liabilities
Long term loan 7 ––– 55,880
Deferred taxation 8 71,587 99,787
71,587 155,667
Current liabilities
Trade and other payables 9 873,438 373,887
Interest and mark-up accrued 10 34,198 19,009
Short term borrowings 11 780,288 902,815
Current portion of long term loan 7 56,143 112,500
1,744,067 1,408,211
Total equity and liabilities 4,894,833 4,109,693
Contingencies and commitments 12
Consolidated Balance SheetAs at 30 June 2010
AN
NU
AL R
EP
OR
T
2010
158

Consolidated Balance SheetAs at 30 June 2010
Note 2010 2009
(Rupees in '000)
ASSETS
Non-current assets
Property, plant and equipment 13 1,256,891 1,224,588
Intangible assets 14 24,457 811
Investment property 15 44,836 47,169
Investments in equity accounted investee 16 1,230,702 1,031,453
Other long term investments 17 205,655 85,662
Long term loans and deposits 18 3,466 3,801
2,766,007 2,393,484
Current assets
Stores, spares and loose tools 19 72,919 83,763
Stock-in-trade 20 1,026,614 616,433
Trade debts 21 276,880 83,927
Advances 22 54,919 39,894
Trade deposits and short term prepayments 23 6,407 6,304
Investments 24 463,746 655,397
Current portion of long term investments 25 10 36,493
Mark-up accrued on term finance certificates 820 813
Other receivables 26 25,156 160,620
Taxation - net 27 18,698 28,421
Cash and bank balances 28 182,657 4,144
2,128,826 1,716,209
Total assets 4,894,833 4,109,693
The annexed notes 1 to 50 form an integral part of these consolidated financial statements.
DirectorChief Executive
AN
NU
AL R
EP
OR
T
2010
159
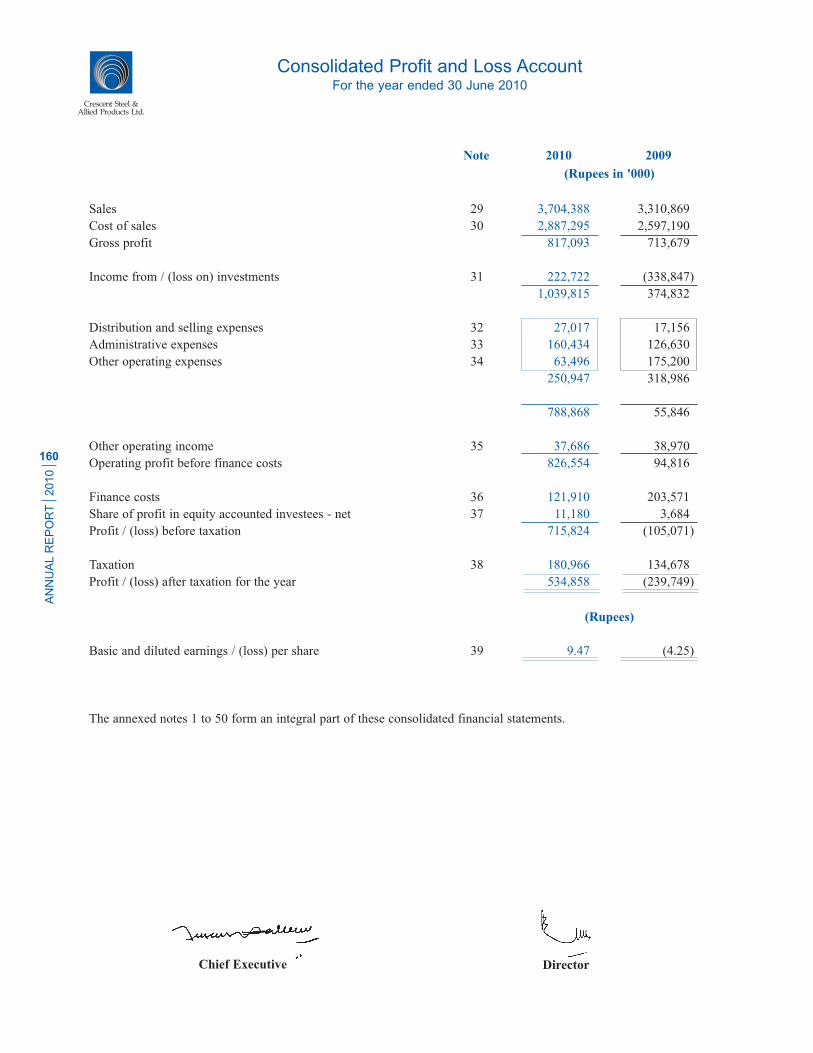
Crescent Steel & Allied Products Ltd.
Note 2010 2009
(Rupees in '000)
Sales 29 3,704,388 3,310,869
Cost of sales 30 2,887,295 2,597,190
Gross profit 817,093 713,679
Income from / (loss on) investments 31 222,722 (338,847)
1,039,815 374,832
Distribution and selling expenses 32 27,017 17,156
Administrative expenses 33 160,434 126,630
Other operating expenses 34 63,496 175,200
250,947 318,986
788,868 55,846
Other operating income 35 37,686 38,970
Operating profit before finance costs 826,554 94,816
Finance costs 36 121,910 203,571
Share of profit in equity accounted investees - net 37 11,180 3,684
Profit / (loss) before taxation 715,824 (105,071)
Taxation 38 180,966 134,678
Profit / (loss) after taxation for the year 534,858 (239,749)
(Rupees)
Basic and diluted earnings / (loss) per share 39 9.47 (4.25)
The annexed notes 1 to 50 form an integral part of these consolidated financial statements.
DirectorChief Executive
Consolidated Profit and Loss AccountFor the year ended 30 June 2010
AN
NU
AL R
EP
OR
T
2010
160

2010 2009
(Rupees in '000)
Profit / (loss) after taxation for the year 534,858 (239,749)
Other comprehensive income
Unrealized diminution during the year on remeasurement of
investments classified as 'available for sale' (17,879) (76,655)
Reclassification adjustments relating to losses / (gains) realized on
disposal of 'available for sale' investment securities 3,048 (18,599)
Proportionate share of other comprehensive income / (loss)
of equity accounted investees 134,366 (145,631)
Proportionate share of other comprehensive income of equity
accounted investee transferred to profit and loss account ––– 916
Proportionate share of other comprehensive income transferred to
profit and loss account on disposal of equity accounted investee (13,129) –––
Impairment loss on 'available for sale' investment securities 5,020 31,529
Other comprehensive income / (loss) for the year 111,426 (208,440)
Total comprehensive income / (loss) for the year 646,284 (448,189)
The annexed notes 1 to 50 form an integral part of these consolidated financial statements.
DirectorChief Executive
Consolidated Statement of Comprehensive IncomeFor the year ended 30 June 2010
AN
NU
AL R
EP
OR
T
2010
161

Crescent Steel & Allied Products Ltd.
DirectorChief Executive
Consolidated Cash Flow StatementFor the year ended 30 June 2010
AN
NU
AL R
EP
OR
T
2010
162
Note 2010 2009
(Rupees in '000)
Cash flows from operating activities
Cash generated from operations 40 826,805 750,680
Taxes paid (210,527) (189,265)
Financial charges paid (106,721) (204,327)
Contribution to pension and gratuity funds (19,403) (18,111)
Contribution to workers' profit participation fund (27,524) (2,403)
Compensated absences paid (88) (69)
Payment for 10-C bonus (717) (671)
Long term deposits and prepayments - net (20) 89
Net cash generated from operating activities 461,805 335,923
Cash flows from investing activities
Capital expenditure (228,883) (169,115)
Acquisition of intangible assets (7,933) (583)
Proceeds from sale of property, plant and equipment 3,004 1,740
Investments - net 212,103 162,265
Dividend income received 40,463 67,720
Interest income received 3,107 8,384
Net cash from investing activities 21,861 70,411
Cash flows from financing activities
Repayments against short term loans (126,522) (28,271)
Repayments against long term loan (112,500) (112,500)
Repayment of redeemable capital ––– (75,000)
Dividends paid (70,126) (6,373)
Net cash used in financing activities (309,148) (222,144)
Net increase in cash and cash equivalents 174,518 184,190
Cash and cash equivalents at beginning of the year (644,736) (828,926)
Cash and cash equivalents at end of the year 41 (470,218) (644,736)
The annexed notes 1 to 50 form an integral part of these consolidated financial statements.

Issued, Capital reserve Revenue reserves Total
subscribed Share Unrealized Others* General Unappro-and Premium gain/(loss) on reserve priated
paid-up remeasurement profit/capital of available (loss)
for saleinvestmentsecurities
(Rupees in '000)
Balance as at 1 July 2008 513,273 349,959 85,279 (64,158) 1,842,000 267,651 2,994,004
Total comprehensive loss for the year ended 30 June 2009
Loss after taxation for the year ––– ––– ––– ––– ––– (239,749) (239,749)
Other comprehensive incomeUnrealized diminution during the year on
remeasurement of investments classified as 'available for sale' ––– ––– (76,655) ––– ––– ––– (76,655)
Reclassification adjustments relating to gain realized on disposal of 'available for sale' investments securities ––– ––– (18,599) ––– ––– ––– (18,599)
Proportionate share of various reserves of associated undertakings ––– ––– ––– (145,631) ––– ––– (145,631)
Proportionate share of associatetransferred to profit and loss account ––– ––– ––– 916 ––– ––– 916
Impairment loss on 'available for sale'investments securities ––– ––– 31,529 ––– ––– ––– 31,529
Other comprehensive loss for the year ––– ––– (63,725) (144,715) ––– ––– (208,440)
Transactions with owners ––– ––– (63,725) (144,715) ––– (239,749) (448,189)Bonus shares issued @ 10% for
the year ended 30 June 2008 51,327 ––– ––– ––– ––– (51,327) –––
Balance as at 30 June 2009 564,600 349,959 21,554 (208,873) 1,842,000 (23,425) 2,545,815
Total comprehensive income for the year ended 30 June 2010
Profit after taxation for the year ––– ––– ––– ––– ––– 534,858 534,858
Other comprehensive incomeUnrealized diminution during the year
on remeasurement of investments classified as 'available for sale' ––– ––– (17,879) ––– ––– ––– (17,879)
Reclassification adjustments relating to gain realized on disposal of 'available for sale' investments securities ––– ––– 3,048 ––– ––– ––– 3,048
Proportionate share of various reserves of associated undertakings ––– ––– ––– 134,366 ––– ––– 134,366
Proportionate share of other comprehensive income transferred to profit and loss account on disposal of equity accounted investee ––– ––– ––– (13,129) ––– ––– (13,129)
Impairment loss on 'available for sale' investments securities ––– ––– 5,020 ––– ––– ––– 5,020
Other comprehensive income for the year ––– ––– (9,811) 121,237 ––– ––– 111,426––– ––– (9,811) 121,237 ––– 534,858 646,284
Transactions with ownersDividend:
- First interim @ 10% (i.e. Re. 1 pershare) for the year ended 30 June 2010 ––– ––– ––– ––– ––– (56,460) (56,460)
- Second interim @ 10% (i.e. Re. 1 pershare) for the year ended 30 June 2010 ––– ––– ––– ––– ––– (56,460) (56,460)
––– ––– ––– ––– ––– (112,920) (112,920)564,600 349,959 11,743 (87,636) 1,842,000 398,513 3,079,179
* This represents various reserves maintained by the associated undertakings.
The annexed notes 1 to 50 form an integral part of these consolidated financial statements.
DirectorChief Executive
Consolidated Statement of Changes in EquityFor the year ended 30 June 2010
AN
NU
AL R
EP
OR
T
2010
163
Crescent Steel & Allied Products Ltd.
1. THE GROUP AND ITS OPERATIONS
1.1 The Group consists of Crescent Steel and Allied Products Limited ('the Holding Company') and, it's
wholly owned subsidiary companies Shakarganj Energy (Private) Limited ('the Subsidiary Company') and
Crescent Continental Gas Pipelines Limited.
1.2 The Holding Company was incorporated on 1 August 1983 as a public limited company in Pakistan under
the Companies Act, 1913 (now Companies Ordinance, 1984) and is quoted on all stock exchanges of
Pakistan. The registered office of the Holding Company is located at 10th floor, BOP Tower, 10-B, Block
E-2, Main Boulevard, Gulberg-III, Lahore.
The Holding Company's steel segment is one of the down stream industries of Pakistan Steel Mills,
manufacturing large diameter spiral arc welded steel line pipes at Nooriabad (District Dadu). The Holding
Company has a coating facility capable of applying three layer high density polyethylene coating on steel
line pipes. The coating plant commenced commercial production from 16 November 1992.
The Holding Company acquired a running spinning unit of 14,400 spindles (now 19,680 spindles) at
Jaranwala (District Faisalabad) on 30 June 2000 from Crescent Jute Products Limited. Another spinning
unit CCP-II was added with 25,344 spindles in 2006. The cotton spinning activity is carried out by the
Holding Company under the name and title of 'Crescent Cotton Products a division of Crescent Steel and
Allied Products Limited'.
1.3 The Subsidiary Company was incorporated on 2 April 2008 as a private limited company in Pakistan
under the Companies Ordinance, 1984. The Holding Company acquired this subsidiary on 4 January 2010.
The principal activity of the Subsidiary Company will be to build, own, operate and maintain a power
plant and to generate, accumulate, distribute, sell and supply electricity/power to the Pakistan Electric
Power Company (Private) Limited (PEPCO)/power distribution companies under agreement(s) with the
Government of Pakistan or to any other consumer as permitted.
1.4 Crescent Continental Gas Pipelines Limited is not carrying on any business operations.
1.5 Details regarding the Group's associates are given in note 16 to these consolidated financial statements.
2. BASIS OF PREPARATION
2.1 Consequent to acquisition of the Subsidiary Company during the year, the Holding Company has prepared
consolidated financial statements of the Group for the first time with corresponding figures of Holding
Company’s individual financial statements been presented for the year ended 30 June 2009.
These consolidated financial statements have been prepared from the information available in the audited
separate financial statements of the Holding Company for the year ended 30 June 2010 and the audited
financial statements of the Subsidiary Company for the year ended 30 June 2010. Crescent Continental
Gas Pipelines Limited is not carrying on any business operations and accordingly no financial statements
are being prepared. Details regarding the financial information of associates used in the preparation of
these consolidated financial statements are given in note 16 to these consolidated financial statements.
Notes to the Consolidated Financial StatementsFor the year ended 30 June 2010
AN
NU
AL R
EP
OR
T
2010
164

The accounting policies used by the Subsidiary Company in preparation of its financial statements are
consistent with that of the Holding Company. The accounting policies used by the Group's associates in
preparation of their respective financial statements are also consistent with that of the Holding Company
except for a certain policy for which necessary adjustments are made to the financial statements of that
associate to bring its accounting policies into line with those used by the Group.
2.1 Statement of compliance
These consolidated financial statements have been prepared in accordance with the approved accounting
standards as applicable in Pakistan. Approved accounting standards comprise of such International
Financial Reporting Standards (IFRS) issued by the International Accounting Standards Board as are
notified under the Companies Ordinance, 1984, provisions of and directives issued under the Companies
Ordinance, 1984. In case requirements differ, the provisions of and directives of the Companies
Ordinance, 1984 shall prevail.
2.3 Basis of measurement
These consolidated financial statements have been prepared under the historical cost convention except for
investments classified as held for trading and available for sale which are stated at fair value and obligations
in respect of pension and gratuity schemes which are measured at present value.
2.4 Functional and presentation currency
These consolidated financial statements are presented in Pakistan Rupees which is also the Group's
functional currency. All financial information presented in Pakistan Rupees has been rounded to the
nearest thousand.
3. USE OF ESTIMATES AND JUDGEMENTS
The preparation of financial statements in conformity with approved accounting standards, as applicable in
Pakistan, requires management to make judgements, estimates and assumptions that affect the application
of policies and the reported amounts of assets, liabilities, income and expenses. The estimates and
associated assumptions are based on historical experience and various other factors that are believed to be
reasonable under the circumstances, the results of which form the basis of making the judgements about
the carrying values of assets and liabilities that are not readily apparent from other sources. Actual results
may differ from these estimates.
The estimates and underlying assumptions are reviewed on an ongoing basis. Revisions to accounting
estimates are recognized in the period in which the estimates are revised if the revision affects only that
period, or in the period of the revision and future periods if the revision affects both current and future
periods.
Judgements made by the management in the application of approved accounting standards, as applicable
in Pakistan, that have significant effect on the financial statements and estimates with a significant risk of
material adjustment in the next year are as follows:
Notes to the Consolidated Financial StatementsFor the year ended 30 June 2010
AN
NU
AL R
EP
OR
T
2010
165

Crescent Steel & Allied Products Ltd.
Income taxes
In making the estimates for income taxes currently payable by the Holding Company, the management
looks at the current income tax laws and the decisions of appellate authorities on certain issues in the past.
Held to maturity investments
The Group has classified certain investments as held to maturity. In this regard, judgement is involved in
evaluating the intention and ability to hold these investments till their respective maturities.
Investment stated at fair value
Management has determined fair value of certain investments by using quotations from active market
conditions and information about the financial instruments. These estimates are subjective in nature and
involve some uncertainties and matters of judgment (e.g. valuation, interest rate, etc.) and therefore,
cannot be determined with precision.
Property, plant and equipment
The Group reviews the rate of depreciation, useful life, residual value and value of assets for possible
impairment on an annual basis. Any change in the estimates in future years might affect the carrying
amounts of the respective items of property, plant and equipment with a corresponding affect on the
depreciation charge and impairment.
Intangible assets
The Group reviews the rate of amortization and value of intangible assets for possible impairment on an
annual basis. Any change in the estimates in future years might affect the carrying amounts of intangible
assets with a corresponding affect on the amortization charge and impairment.
Stock-in-trade and stores and spares
The Group reviews the net realizable value of stock-in-trade and stores, spares and loose tools to assess
any diminution in their respective carrying values. Any change in the estimates in future years might affect
the carrying amounts of stock-in-trade and stores, spares and loose tools with a corresponding effect on
the amortization charge and impairment. Net realizable value is determined with respect to estimated
selling price less estimated expenditure to make the sale.
Staff retirement benefits
Certain actuarial assumptions have been adopted as disclosed in note 43 to the financial statements for
valuation of present value of defined benefit obligations and fair value of plan assets. Changes in these
assumptions in future years may affect the liability under these schemes in those years.
4. INITIAL APPLICATION OF NEW STANDARDS, INTERPRETATIONS
OR AMENDMENT TO EXISTING STANDARDS AND FORTHCOMING
REQUIREMENTS
4.1 Initial application
Starting 01 July 2009 the Group has changed its accounting policies in the following areas.
Notes to the Consolidated Financial StatementsFor the year ended 30 June 2010
AN
NU
AL R
EP
OR
T
2010
166

– IAS 1 (Revised) - Presentation of financial statements (effective for annual periods beginning on or
after 1 January 2009). The revised standard prohibits the presentation of items of income and expenses
(that is, ‘non-owner changes in equity’) in the statement of changes in equity, requiring ‘non-owner
changes in equity’ to be presented separately from owner changes in equity. All non-owner changes in
equity are required to be shown in a performance statement, but entities can choose whether to present
one performance statement (the statement of comprehensive income) or two statements (the income
statement and the statement of comprehensive income). Where entities restate or reclassify comparative
information, they are required to present a restated balance sheet as at the beginning of comparative
period in addition to the current requirement to present balance sheets at the end of the current period
and comparative period.
The Group has opted to present two statements; a profit and loss account (income statement) and a
statement of other comprehensive income. Comparative information has also been represented so that it
is in conformity with the revised standard. As this change only impacts presentation aspects, there is no
impact on the earnings per share.
– IAS 23 (Amendment) 'Borrowing costs' (effective for annual periods beginning on or after 1 January
2009). It requires an entity to capitalize borrowing costs directly attributable to the acquisition,
construction or production of a qualifying asset (one that takes a substantial period of time to get ready
for use or sale) as part of the cost of that asset. The option of immediately expensing those borrowing
costs has been removed. The Group’s current accounting policy for borrowing costs is in compliance
with this amendment and therefore there is no effect on these consolidated financial statements.
– IFRS 7 (Amendment), 'Financial Instruments: Disclosures' (effective for annual periods beginning on or
after 1 January 2009). The amendment requires enhanced disclosures regarding fair value measurement
and liquidity risk. As the change only results in additional disclosures, there is no impact on earnings
per share.
– IFRS 8 - Operating Segments (effective for annual periods beginning on or after 1 January 2009). This
IFRS 8 replaces IAS 14, ‘Segment Reporting’. The new standard requires a ‘management approach’,
under which segment information is presented on the same basis as that used for internal reporting
purposes, and introduced detailed disclosures regarding the reportable segments and products. As the
changes in this standard only result in additional disclosures, there is no impact on earnings per share.
– IFRS 5 - Non-current Assets Held for Sale and Discontinued Operations. The Group has made initial
application of this standard for the classification, measurement and presentation of non-current assets
held for sale. As the changes only resulted in presentation and additional disclosures, there is no impact
on earnings per share.
4.2 New accounting standards and IFRIC interpretations that are not yet effective
The following standards, amendments and interpretations of approved accounting standards are
effective from the dates specified below and are either not relevant to Group’s operations or are not
expected to have significant impact on the Group’s financial statements other than certain increased
disclosures:
Notes to the Consolidated Financial StatementsFor the year ended 30 June 2010
AN
NU
AL R
EP
OR
T
2010
167

Crescent Steel & Allied Products Ltd.
IFRS 2 (amendment)-Share-based payments and withdrawal of IFRIC 8- Scope of IFRS 2 and IFRIC 11-Group and Treasury Share Transactions (effective for annual periods beginning on or after 1 January2010). Amendment provides guidance on the accounting for share based payment transactions among
group entities.
International Accounting Standard (IAS) 24 (revised): Related Party Disclosures (effective for annualperiod beginning on or after 1 January 2011). The amendments to IAS 24 simplify the disclosure
requirements for entities that are controlled, jointly controlled or significantly influenced by a government
(referred to as government-related entities) and clarify the definition of a related party.
Amendments to IAS 32: Classification of Rights Issues (effective for period beginning on or after 1February 2010). Under the amendment to IAS 32 rights, options and warrants – otherwise meeting the
definition of equity instruments in IAS 32.11 – issued to acquire a fixed number of an entity’s own non-
derivative equity instruments for a fixed amount in any currency are classified as equity instruments,
provided the offer is made pro-rata to all existing owners of the same class of the entity’s own non-
derivative equity instruments.
IFRIC 19 Extinguishing Financial Liabilities with Equity Instruments (effective for period beginning on orafter 1 July 2010).IFRIC 19 clarifies the accounting when an entity extinguish the liability by issuing its
own equity instruments to the creditor.
Amendments to IFRIC 14: Prepayment of a Minimum Funding Requirement (effective for periodbeginning on or after 1 July 2011). IFRIC 14 IAS 19 –The Limit on a Defined Benefit Asset, Minimum
Funding Requirements and their Interaction has been amended to remedy an unintended consequence of
IFRIC 14 where entities are in some circumstances not permitted to recognise prepayments of minimum
funding contributions, as an asset.
The International Accounting Standards Board made certain amendments to existing standards as part of
its second and third annual improvements project. The effective dates for these amendments vary by
standards.
5. SUMMARY OF SIGNIFICANT ACCOUNTING POLICIES
5.1 Basis of consolidation
Subsidiaries
The consolidated financial statements include the financial statements of the Holding Company and its
subsidiary companies.
Subsidiaries are those enterprises in which the Holding Company directly or indirectly controls,
beneficially owns or holds more than 50 percent of its voting securities or otherwise has power to elect
and appoint more than 50 percent of its directors. The financial statements of subsidiaries are included in
the consolidated financial statements from the date control commences. The financial statements of the
subsidiaries are consolidated on a line-by-line basis and the carrying value of investment held by the
Notes to the Consolidated Financial StatementsFor the year ended 30 June 2010
AN
NU
AL R
EP
OR
T
2010
168

Holding Company is eliminated against the Holding Company's share in paid up capital of the
subsidiaries. The Group applies uniform accounting policies for like transactions and events in similar
circumstances except where specified otherwise.
All material inter-Group balances, transactions and resulting unrealized profits/losses have been
eliminated.
Investments in associates
Entities in which the Group has significant influence but not control and which are neither subsidiaries nor
joint ventures of the members of the Group are associates and are accounted for under the equity method
of accounting (equity accounted investees).
These investments are initially recognized at cost. The consolidated financial statements include the
associates' share of profit or loss and movements in other comprehensive income, after adjustments to
align the accounting policies with those of the Group, from the date that significant influence commences
until the date it ceases. Share of post acquisition profit and loss of associates is recognized in the profit
and loss account. Distributions received from associates reduce the carrying amount of investment. When
the Group's share of losses exceeds its interest in an equity accounted investee, the carrying amount of that
investment (including any long-term interests that, in substance, form part of the Group's net investment in
the associate) is reduced to nil and the recognition of further losses is discontinued.
The carrying amount of investments is reviewed at each reporting date to determine whether there is any
indication of impairment. If any such indication exist the investments recoverable amount is estimated
which is higher of its value in use and its fair value less cost to sell. An impairment loss is recognized if
the carrying amount exceeds its recoverable amount. Impairment losses are recognized in profit or loss.
An impairment loss is reversed if there has been a change in estimates used to determine the recoverable
amount but limited to the extent of initial cost of investments. A reversal of impairment loss is recognized
in the profit and loss account.
5.2 Property, plant and equipment and depreciation
Owned assets
Property, plant and equipment, except freehold land and capital work-in-progress are stated at cost less
accumulated depreciation and impairment losses, if any. Freehold land and capital work-in-progress are
stated at cost.
Subsequent cost
The cost of replacing part of an item of property, plant and equipment is recognized in the carrying amount
of the item if it is probable that the future economic benefits embodied within the part will flow to the
Group and its cost can be measured reliably. The carrying amount of the part so replaced is derecognized.
The costs of the day-to-day servicing of property, plant and equipment are recognized in profit and loss
account as incurred.
Notes to the Consolidated Financial StatementsFor the year ended 30 June 2010
AN
NU
AL R
EP
OR
T
2010
169
Crescent Steel & Allied Products Ltd.
Depreciation
Depreciation is charged to income on straight line basis at the rates specified in note 13.1 to these
financial statements. Depreciation on additions to property, plant and equipment is charged from the
month in which an item is acquired or capitalized while no depreciation is charged for the month in which
the item is disposed off.
The assets' residual values and useful lives are reviewed at each financial year end and adjusted if impact
on depreciation is significant.
The gain or loss on disposal or retirement of an asset represented by the difference between the sale
proceeds and the carrying amount of the asset is recognized as an income or expense.
Impairment
The carrying amount of property, plant and equipment are reviwed at each balance sheet date to determine
whether there is any indication of impairment. If any such indication exists then the assets recoverable
amount is estimated. The recoverable amount is the greater of its value in use and fair value less cost to
sell. An impairment is recognised if the carrying amount exceed its estimated recoverable amount.
Leased assets
Leases in terms of which the Group assumes substantially all the risks and rewards of ownership are
classified as finance lease. Asset acquired by way of finance lease is stated at an amount equal to the
lower of its fair value and the present value of minimum lease payments at the inception of the lease less
accumulated depreciation and impairment losses, if any.
Depreciation is charged on the same basis as used for owned assets.
Financial charges are allocated to accounting period in a manner so as to provide a constant rate of charge
on outstanding liability.
5.3 Intangible assets
Intangible assets acquired by the Group are stated at cost less accumulated amortization and impairment
losses, if any.
Subsequent expenditure
Subsequent expenditure on capitalized intangible assets is capitalized only when it increases the future
economic benefits embodied in the specific assets to which it relates. All other expenditure is expensed as
incurred.
Amortization
Amortization is charged to the income statement on a straight line basis over the estimated useful lives
of intangible assets unless such lives are indefinite. All intangible assets with an indefinite useful life are
systematically tested for impairment at each balance sheet date. Amortization on additions to intangible
assets is charged from the month in which an item is acquired or capitalized while no amortization is
charged for the month in which the item is disposed off.
Notes to the Consolidated Financial StatementsFor the year ended 30 June 2010
AN
NU
AL R
EP
OR
T
2010
170

Impairment
Where the carrying amount of assets exceeds its estimated recoverable amount it is written down
immediately to its recoverable amount.
5.4 Investment property
Investment property, principally comprising of land and buildings, is held for long term rental yields /
capital appreciation. The investment properties of the Group comprise of land and buildings and are
valued using the cost method i.e. at cost less any accumulated depreciation and impairment losses, if any.
Depreciation is charged to profit on the straight line method so as to write off the depreciable amount over
its estimated useful life. Depreciation on additions to investment property is charged from the month in
which a property is acquired or capitalized while no depreciation is charged for the month in which the
property is disposed off.
The residual values and useful lives of investment property are reviewed at each financial year end and
adjusted if impact on depreciation is significant.
The Group assesses at each balance sheet date whether there is any indication that investment property
may be impaired. If such indication exists, the carrying amounts of such assets are reviewed to assess
whether they are recorded in excess of their recoverable amount. Where carrying values exceed the
respective recoverable amounts, assets are written down to their recoverable amounts and the resulting
impairment loss is recognized in income currently. The recoverable amount is the higher of an asset's fair
value less costs to sell and value in use. Where an impairment loss is recognized, the depreciation charge
is adjusted in the future period to allocate the asset's revised carrying amount over its estimated useful life.
The gain or loss on disposal of investment property represented by the difference between the sale
proceeds and the carrying amount of the asset is recognized as income or expense.
5.5 Investments
Investments are being categorized as follows:
Investment at fair value through profit or lossA non-derivative financial asset is classified as at fair value through profit or loss if it is held for trading or
is designated as such upon initial recognition. Investments are designated at fair value through profit or
loss if the Group manages such investments and makes purchase and sale decisions based on their fair
value. Upon initial recognition, attributable transaction cost are recognized in profit and loss account when
incurred. Investments at fair value through profit or loss are measured at fair value, and changes therein
are recognized in profit and loss account.
Held to maturityHeld to maturity investments are non-derivative financial assets with fixed or determinable payments and
fixed maturity that an entity has the positive intention and ability to hold to maturity.
Notes to the Consolidated Financial StatementsFor the year ended 30 June 2010
AN
NU
AL R
EP
OR
T
2010
171

Crescent Steel & Allied Products Ltd.
Investments classified as held to maturity are recognized initially at fair value, plus attributable transaction
costs. Subsequent to initial recognition, these are stated at amortized cost with any difference between cost
and redemption value being recognized in the profit and loss account over the period of the investments
on an effective yield method.
Loans and receivables
Loans and receivables are recognized initially at fair value, plus attributable transaction costs. Subsequent
to initial recognition, loans and receivables are stated at amortized cost with any difference between cost
and redemption value being recognized in the profit and loss account over the period of the investments
on an effective yield method.
Available for saleOther investments not covered in any of the above categories including investments in associates in which
the Company has no significant influence are classified as being available for sale and are initially recognized
at fair value plus attributable transactions costs. Subsequent to initial recognition these are measured at fair
value, with any resultant gain or loss being recognized in other comprehensive income. Gains or losses on
available-for-sale investments are recognized in other comprehensive income until the investments are
sold or disposed off, or until the investments are determined to be impaired, at that time cumulative gain or
loss previously reported in other comprehensive income is included in current year's profit and loss account.
Fair value of listed securities are the quoted prices on stock exchange on the date it is valued. Unquoted
securities are valued at cost.
The Group follows trade date accounting for regular way of purchase and sales of securities, except for
sale and purchase of securities in future market, which are accounted for at settlement date.
Derivative financial instrumentsThe Group enters into derivative financial instruments, which include future contracts in stock market.
Derivatives are initially recorded at fair value and are remeasured to fair value on subsequent reporting
dates. The fair value of a derivative is equivalent to the unrealized gain or loss from marking to market the
derivative using prevailing market rates. Derivatives with positive market values (unrealized gains) are
included in other receivables and derivatives with negative market values (unrealized losses) are included
in other liabilities in the balance sheet. The resultant gains and losses from derivatives held for trading
purposes are included in income currently. No derivative is designated as hedging instrument by the Group.
5.6 Non-current assets held for sale
Non-current assets or disposal groups comprising assets or liabilities, that are expected to be recovered
primarily through sale rather than through continuing use, are classified as held for sale. Immediately
before classification as held for sale, the assets or components of a disposal group, are remeasured in
accordance with Group's accounting policies. Thereafter these are measured at lower of their carrying
amount and fair value less cost to sell.
Notes to the Consolidated Financial StatementsFor the year ended 30 June 2010
AN
NU
AL R
EP
OR
T
2010
172

5.7 Stores and spares
Stores and spares are valued at lower of weighted average cost and net realizable value, less provision for
impairment if any. Items in transit are valued at cost comprising invoice value plus other charges incurred
thereon.
Provision for obsolete and slow moving stores, spares and loose tools is determined based on
management's estimate regarding their future usability.
Net realizable value signifies the estimated selling price in the ordinary course of business less the
estimated costs necessary to be incurred to make the sale.
Spare parts of capital nature which can be used only in connection with an item of property, plant and
equipment are classified as tangible fixed assets under the ‘plant and machinery’ category and are
depreciated over a time period not exceeding the useful life of the related assets.
5.8 Stock-in-trade
Stock-in-trade is stated at the lower of cost and net realizable value. Cost is arrived at on a weighted
average basis. Cost of work-in-process and finished goods include cost of materials and appropriate portion
of production overheads. Net realizable value is the estimated selling price in the ordinary course of business
less costs of completion and selling expenses. The cost of finished goods of steel segment is measured on
the specific identification method. Scrap stocks are valued at their estimated net realizable value.
5.9 Trade debts and other receivables
These are initially stated at fair value and subsequently measured at amortized cost using effective interest
rate method less provisions for any uncollectible amounts. An estimate is made for doubtful receivables
when collection of the amount is no longer probable. Debts considered irrecoverable are written off.
5.10 Cash and cash equivalents
Cash and cash equivalents comprise of cash balances and call deposits. Bank overdrafts that are repayable
on demand and form an integral part of the Group's cash management are included as a component of cash
and cash equivalents for the purpose of cash flow statement.
5.11 Trade and other payables
Trade and other amounts payable are recognized initially at fair value and subsequently carried at
amortized cost.
Notes to the Consolidated Financial StatementsFor the year ended 30 June 2010
AN
NU
AL R
EP
OR
T
2010
173

Crescent Steel & Allied Products Ltd.
5.12 Employee benefits
5.12.1 Compensated absences
The Holding Company accounts for all accumulated compensated absences when employees render
services that increase their entitlement to future compensated absences.
5.12.2 Post retirement benefits
5.12.2.1 Defined contribution plan - Provident fund
The Holding Company operates a provident fund scheme for its permanent employees. Equal monthly
contributions are made by the Holding Company and its employees. Obligation for contributions to the
fund are recognized as an expense in the profit and loss account when they are due.
Cotton segmentProvision and collection from employees are made at the rate of 6.25 percent of basic pay plus Cost Of
Living Allowance (COLA) of cotton segment employees. A trust has been established and its approval has
been obtained from Commissioner of Income Tax.
All employees except cotton segmentContributions to the fund are made at the rate of 8.33 percent of basic pay plus COLA for those employees
who have served the Holding Company for a period of less than five years and after completion of five
years, contributions are made at the rate of 10 percent.
5.12.2.2 Defined benefit plans
Pension and gratuity fund schemesThe Holding Company operates pension and gratuity fund schemes for its permanent management
employees as per the terms of employment.
The pension scheme provides life time pension to retired employees or to their spouses.
Contributions are paid to the pension and gratuity funds on the basis of actuarial recommendations. The
cost of providing benefits is determined using the projected unit credit method, with actuarial valuations
being carried out at each balance sheet date. Actuarial gains and losses which exceed 10 percent of the
greater of the present value of the Holding Company’s obligations and the fair value of plan assets are
amortized over the expected average remaining working lives of the eligible employees. Past service cost
is recognized immediately to the extent that the benefits are already vested. For non-vested benefits past
service cost is amortized on a straight line basis over the average period until the amended benefits
become vested.
Amounts recognized in the balance sheet represent the present value of the defined benefit obligation as
adjusted for unrecognized actuarial gains and losses and unrecognized past service cost and as reduced by
the fair value of plan assets. Any assets resulting from this calculation is limited to the unrecognized
actuarial losses and unrecognized past service cost plus the present value of available refunds and
reductions in future contributions to the plan.
Notes to the Consolidated Financial StatementsFor the year ended 30 June 2010
AN
NU
AL R
EP
OR
T
2010
174
5.13 Mark-up bearing borrowings
Mark-up bearing borrowings are recognized initially at fair value, less attributable transaction costs.
Subsequent to initial recognition, mark-up bearing borrowings are stated at amortized cost with any
difference between cost and redemption value being recognized in the profit and loss account over the
period of the borrowings on an effective interest basis.
5.14 Taxation
Current Provision for current taxation is based on taxable income at the current rates of taxation after taking into
account tax credits and tax rebates available, if any.
DeferredDeferred tax is provided using the balance sheet liability method, providing for temporary differences
between the carrying amount of assets and liabilities for financial reporting purposes and the amounts used
for taxation purposes. The amount of deferred tax provided is based on the expected manner of realization
or settlement of the carrying amount of assets and liabilities, using the rates that are expected to apply to
the period when the differences reverse based on tax rates that have been enacted at the balance sheet date.
Deferred tax liabilities are recognized for all taxable temporary differences. A deferred tax asset is
recognized only to the extent that it is probable that future taxable profits will be available against which
the asset can be utilized. Deferred tax asset is reduced to the extent that it is no longer probable that the
related tax benefits will be realized.
5.15 Borrowing costs
Borrowing costs incurred on long term finances directly attributable for the construction/acquisition of
qualifying assets are capitalized up to the date, the respective assets are available for the intended use. All
other mark-up, interest and other related charges are taken to the profit and loss account currently.
5.16 Revenue recognition
Revenue from sales is recognized when significant risks and rewards of ownership are transferred to the
buyer.
Interest income is recognized on accrual basis using effective interest method.
Dividend income is recognized when the right to receive the same is established i.e. the book closure date
of the investee company declaring the dividend.
Gains and losses on sale of investments are accounted for when the commitment (trade date) for sale of
security is made.
Notes to the Consolidated Financial StatementsFor the year ended 30 June 2010
AN
NU
AL R
EP
OR
T
2010
175

Crescent Steel & Allied Products Ltd.
Unrealized gains/(losses) arising on revaluation of securities classified as 'held for trading' are included in
profit and loss account in the period in which they arise. Gains/(losses) arising on revaluation of
derivatives to the fair value are taken to profit and loss account. Rental income (net of any incentives
given to lessees) from investment property is recognized on a straight line basis over the lease term.
Miscellaneous income is recognized on receipt basis.
5.17 Provisions
A provision is recognized in the balance sheet when the Company has a legal or constructive obligation as
a result of past events, it is probable that an outflow of economic benefits will be required to settle the
obligation and a reliable estimate can be made of the amount of the obligation. Provisions are reviewed at
each balance sheet date and adjusted to reflect the current best estimate.
5.18 Impairment
The carrying amount of the Group's assets is reviewed at each balance sheet date to determine whether
there is any objective evidence that an asset or group of assets may be impaired. If any such evidence
exists, the asset or group of assets' recoverable amount is estimated. An impairment loss is recognized
whenever the carrying amount of an asset exceeds its recoverable amount. Impairment losses are
recognized in profit and loss account.
5.19 Foreign currency translation
Foreign currency transactions are translated into Pak Rupees at exchange rates prevailing on the date of
transaction. Monetary assets and liabilities in foreign currencies are translated into Pak Rupees at the rates of
exchange prevailing at the balance sheet date. Exchange differences, if any, are taken to profit and loss account.
5.20 Offsetting of financial assets and financial liabilities
Financial assets and financial liabilities are set off and only the net amount is reported in the balance sheet
when there is a legally enforceable right to set off the recognized amount and the Group intends to either
settle on a net basis, or to realize the asset and settle the liability simultaneously.
5.21 Segment reporting
Operating segments are reported in a manner consistent with the internal reporting structure. Management
monitors the operating results of its business units separately for the purpose of making decisions
regarding resource allocation and performance assessment.
Segment results, assets and liabilities include items directly attributable to segment as well as those that
can be allocated on a reasonable basis. Segment assets consist primarily of property, plant and equipment,
intangibles, stores and spares, stock in trade and trade and other debts. Segment liabilities comprise of
operating liabilities and exclude items such as taxation and corporate.
Segment capital expenditure is the total cost incurred during the year to acquire property, plant and
equipment and intangible assets.
Notes to the Consolidated Financial StatementsFor the year ended 30 June 2010
AN
NU
AL R
EP
OR
T
2010
176

5.22 Proposed dividend and transfer between reserves
Dividend distributions to the Holding Company's shareholders are recognized as a liability in the period in
which dividends are approved. Transfer between reserves made subsequent to the balance sheet date is
considered as non-adjusting event and is recognized in the financial statements in the period in which such
transfers are made.
6. ISSUED, SUBSCRIBED AND PAID-UP CAPITAL
2010 2009 2010 2009
(Number of shares) (Rupees in '000)
22,230,188 22,230,188 Ordinary shares of Rs. 10 each
fully paid in cash 222,302 222,302
34,229,805 34,229,805 Ordinary shares of Rs. 10 each
fully issued as bonus shares 342,298 342,298
56,459,993 56,459,993 564,600 564,600
6.1 Ordinary shares of the Holding Company held by associated undertakings as at year end are as follows:
2010 2009
Percentage (Number of Percentage (Number of
of holding shares) of holding shares)
Shakarganj Mills Limited 4.82% 2,720,062 4.99% 2,820,062
Crescent Sugar Mills & Distillery Limited 1.31% 742,422 1.81% 1,019,968
Muhammad Amin Muhammad Bashir Limited 0.00% 618 0.00% 618
The Crescent Textile Mills Limited 11.00% 6,209,676 11.00% 6,209,676
Premier Insurance Limited ––– ––– 0.06% 35,140
7. LONG TERM LOAN
2010 2009
(Rupees in '000)
Secured from a banking company
Allied Bank Limited 7.1 168,380 280,617
Amortization of initial transaction costs 263 263
Repayments (112,500) (112,500)
56,143 168,380
Current portion (56,143) (112,500)
––– 55,880
Notes to the Consolidated Financial StatementsFor the year ended 30 June 2010
AN
NU
AL R
EP
OR
T
2010
177

Crescent Steel & Allied Products Ltd.
7.1 Mark-up rate on the above loan is 6 months KIBOR prevailing on the base rate setting date plus 1.9
percent per annum. Mark-up is payable on a quarterly basis. The effective mark-up charged during the
year ranges from 14.25% to 14.95% (2009: 14.94% to 17.55%) per annum.
The tenor of the loan is five years. Principal is repayable on a quarterly basis with one year grace period.
The loan was disbursed on 17 December 2005.
This facility has been secured against first equitable mortgage pari passu charge on all present and future
fixed assets including land and building with 25% margin.
8. DEFERRED TAXATION
2010 2009
(Rupees in '000)
Deferred tax credits/(debits) arising in respect of:
Taxable temporary differences
Accelerated tax depreciation/amortization 126,669 158,964
Deductible temporary differences
Provisions for stock-in-trade and stores and spares (15,872) (22,162)
Provisions for doubtful debts, advances and others (30,152) (27,957)
Provision for impairment in unquoted available for sale investment (9,058) (9,058)
(55,082) (59,177)
71,587 99,787
9. TRADE AND OTHER PAYABLES
Trade creditors 25,690 26,000
Bills payable 204,245 129,031
Commission payable 4,841 4,461
Accrued liabilities 9.1 70,418 67,536
Provisions 9.2 82,366 73,934
Advance from customers 374,949 15,316
Retention money 334 754
Due to associated undertakings 9.3 1,758 338
Payable to provident fund 159 1
Unclaimed dividend 50,727 7,933
Special Excise Duty payable 423 –––
Workers' Welfare Fund 13,335 9,781
Workers' Profit Participation Fund 9.4 28,666 27,524
Withholding tax payable 586 124
Customer's security deposit 8,605 3,400
Others 6,336 7,754
873,438 373,887
Notes to the Consolidated Financial StatementsFor the year ended 30 June 2010
AN
NU
AL R
EP
OR
T
2010
178
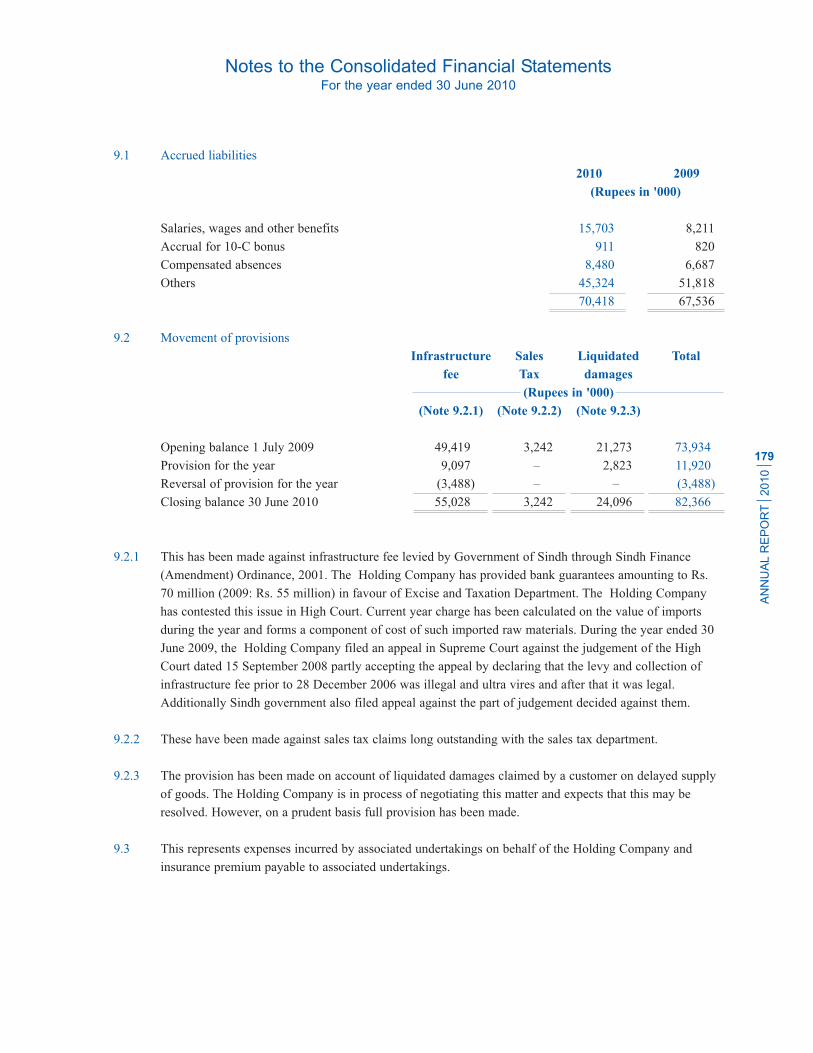
9.1 Accrued liabilities
2010 2009
(Rupees in '000)
Salaries, wages and other benefits 15,703 8,211
Accrual for 10-C bonus 911 820
Compensated absences 8,480 6,687
Others 45,324 51,818
70,418 67,536
9.2 Movement of provisions
Infrastructure Sales Liquidated Total
fee Tax damages
(Rupees in '000)
(Note 9.2.1) (Note 9.2.2) (Note 9.2.3)
Opening balance 1 July 2009 49,419 3,242 21,273 73,934
Provision for the year 9,097 ––– 2,823 11,920
Reversal of provision for the year (3,488) ––– ––– (3,488)
Closing balance 30 June 2010 55,028 3,242 24,096 82,366
9.2.1 This has been made against infrastructure fee levied by Government of Sindh through Sindh Finance
(Amendment) Ordinance, 2001. The Holding Company has provided bank guarantees amounting to Rs.
70 million (2009: Rs. 55 million) in favour of Excise and Taxation Department. The Holding Company
has contested this issue in High Court. Current year charge has been calculated on the value of imports
during the year and forms a component of cost of such imported raw materials. During the year ended 30
June 2009, the Holding Company filed an appeal in Supreme Court against the judgement of the High
Court dated 15 September 2008 partly accepting the appeal by declaring that the levy and collection of
infrastructure fee prior to 28 December 2006 was illegal and ultra vires and after that it was legal.
Additionally Sindh government also filed appeal against the part of judgement decided against them.
9.2.2 These have been made against sales tax claims long outstanding with the sales tax department.
9.2.3 The provision has been made on account of liquidated damages claimed by a customer on delayed supply
of goods. The Holding Company is in process of negotiating this matter and expects that this may be
resolved. However, on a prudent basis full provision has been made.
9.3 This represents expenses incurred by associated undertakings on behalf of the Holding Company and
insurance premium payable to associated undertakings.
Notes to the Consolidated Financial StatementsFor the year ended 30 June 2010
AN
NU
AL R
EP
OR
T
2010
179

Crescent Steel & Allied Products Ltd.
9.4 Workers' Profit Participation Fund
2010 2009
(Rupees in '000)
Balance at beginning of the year 27,524 2,403
Mark-up on funds utilized in the Holding
Company's business 36 3,141 89
Allocation for the year 34 28,666 27,524
59,331 30,016
Amount paid to the trustees of the fund (30,665) (2,492)
Balance at end of the year 28,666 27,524
10. INTEREST AND MARK-UP ACCRUED
- Long Term Loan 329 1,037
- Running Finance and Short term loans 33,869 17,972
34,198 19,009
11. SHORT TERM BORROWINGS
Secured from banking companies
Running finances under mark-up arrangements 652,875 648,880
Short term loans / Murabaha 127,413 253,935
780,288 902,815
11.1 Short term running finance available to the Holding Company from various commercial banks under
mark-up arrangements amounted to Rs. 911 million (30 June 2009: Rs. 1,450 million) out of which
Rs. 600 million (30 June 2009: Rs. 1,150) is interchangeable with Term Finance/Demand Finance and
letters of credit. The rate of mark-up ranged between 13.49% to 15.79% (2009: 12.52% to 18.50%)
per annum.
11.2 Short term loan/murabaha financing available to the Holding Company from various commercial banks
under mark-up arrangements amounted to Rs. 700 million (30 June 2009: Rs. 1,400 million). During the
year, the mark-up on such arrangement ranged between 12.74% to 15.34% (2009: 12.52% to 18.50%) per
annum.
11.3 The facilities for opening letters of credit available to the Holding Company amounted to Rs. 1,750
million (30 June 2009: Rs. 2,600 million) out of which Rs. 600 million (30 June 2009: Nil) is
interchangeable with short term running finance as mentioned in note 11.1 above. The facility for letter of
guarantees as at 30 June 2010 available to the Holding Company amounted to Rs. 717 million (30 June
2009: 800 million). Amounts unutilized for letters of credit and guarantees as at 30 June 2010 were Rs.
1,520.844 million and Rs. 54.131 million respectively (30 June 2009: Rs. 2,443 million and Rs. 546
million).
Notes to the Consolidated Financial StatementsFor the year ended 30 June 2010
AN
NU
AL R
EP
OR
T
2010
180

11.4 The above facilities are secured by way of hypothecation of plant and machinery, stock-in-trade, trade
debts and other current assets of the Holding Company including pledge of shares and cotton/cotton yarn;
and lien over import/export document.
12. CONTINGENCIES AND COMMITMENTS
12.1 The Holding Company has filed a suit in the Sindh High Court against Federation of Pakistan and others,
for levy of import license fee at 6% against import of coating plant in 1992. The Holding Company
contested that as per SRO 1317(I)/94 dated 22 December 1990, the coating plant being located in rural
area, is only liable to pay 2% of import license fee. The Holding Company has provided bank guarantee of
Rs. 3.42 million as directed by the Honourable Court. The petition was dismissed by High Court as having
been incompetently filed. The Holding Company has filed the appeal with Honourable Supreme Court and
no hearing has taken place since then. No provision has been made in the financial statements as
management considers that the case would be decided in Holding Company's favour.
12.2 Sindh Industrial Trade Estate (SITE) has cancelled allotment of plot A-26 and A-27 and charged non-
utilization fees of Rs. 0.285 million and Rs. 0.621 million respectively. The Holding Company has
challenged the cancellation and filed a suit in Sindh High Court. The High Court has restrained the SITE
from taking any adverse action against the Holding Company. Therefore, management considers that the
case would be decided in Holding Company's favour and no provision is required.
12.3 Aggregate amount of guarantees issued by the banks on behalf of the Holding Company against various
contracts aggregated Rs. 662.869 million (30 June 2009: Rs. 253.79 million).
12.4 Commitments in respect of capital expenditure contracted for by the Group as at 30 June 2010 amounted
to Rs. 218.432 million (30 June 2009: Rs. 24.56 million). This represents/includes an amount of Rs. 19.164
million (30 June 2009: Rs. 18.83 million) payable by the Holding Company over the period of three years
in 15 quarterly installments representing office premises in Islamabad. This also includes commitments
contracted by the Subsidiary Company aggregating Rs. 199.268 million (30 June 2009: Rs. Nil) in respect
of capital expenditure to acquire plant and machinery.
12.5 Commitments by the Holding Company under letters of credit as at 30 June 2010 amounted to Rs. 24.911
million (30 June 2009: Rs. Nil).
13. PROPERTY, PLANT AND EQUIPMENT
2010 2009
(Rupees in '000)
Operating fixed assets 13.1 956,113 1,092,889
Capital work-in-progress 13.5 300,778 131,699
1,256,891 1,224,588
Notes to the Consolidated Financial StatementsFor the year ended 30 June 2010
AN
NU
AL R
EP
OR
T
2010
181

Crescent Steel & Allied Products Ltd.
Notes to the Consolidated Financial StatementsFor the year ended 30 June 2010
AN
NU
AL R
EP
OR
T
2010
182
13.1 Operating fixed assets
Description Land Buildings
Freehold Leasehold On On
including freehold Lease hold
improvement Land Land
(Rupees in '000)
Net carrying value as at 1 July 2009
Opening net book value (NBV) 13.1.1 122,575 4,183 225,274 10,346
Additions/transfers ––– ––– ––– –––
Disposals (at NBV) 13.6 ––– ––– ––– –––
Depreciation charge ––– (53) (28,784) (1,674)
Balance as at 30 June 2010 (NBV) 122,575 4,130 196,490 8,672
Gross carrying value as at 30 June 2010
Cost 13.3 122,575 5,646 310,758 70,027
Accumulated depreciation ––– (1,516) (114,268) (61,355)
Net book value 122,575 4,130 196,490 8,672
Net carrying value as at 1 July 2008
Opening net book value (NBV) 69,242 4,236 209,612 12,020
Additions 53,333 ––– 42,913 –––
Disposals (at NBV) ––– ––– ––– –––
Depreciation charge ––– (53) (27,251) (1,674)
Balance as at 30 June 2009 (NBV) 122,575 4,183 225,274 10,346
Gross carrying value as at 30 June 2009
Cost 122,575 5,646 310,758 70,027
Accumulated depreciation ––– (1,463) (85,484) (59,681)
Net book value 122,575 4,183 225,274 10,346
Depreciation rate (% per annum) ––– 1 ––– 5
* Net book value of plant and machinery includes book value of Rs. 1.544 million (2009: Rs. 1.73 million) of capitalized spares.
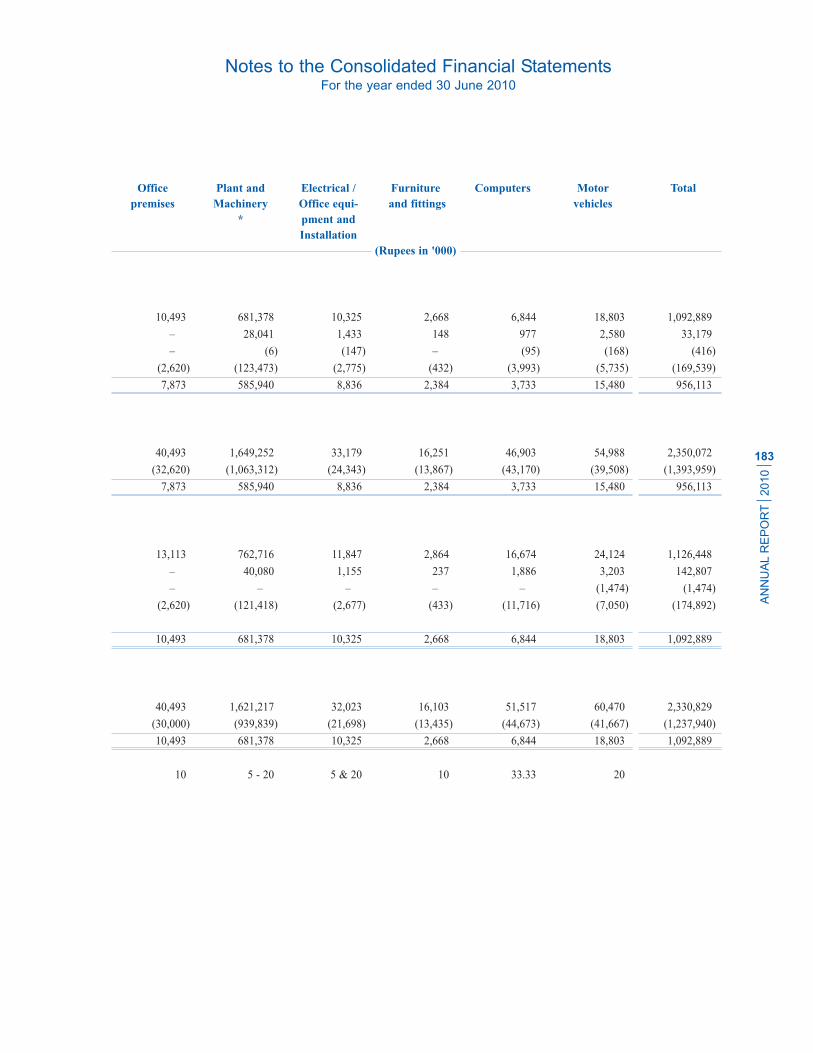
Notes to the Consolidated Financial StatementsFor the year ended 30 June 2010
AN
NU
AL R
EP
OR
T
2010
183
Office Plant and Electrical / Furniture Computers Motor Total
premises Machinery Office equi- and fittings vehicles
* pment and
Installation
(Rupees in '000)
10,493 681,378 10,325 2,668 6,844 18,803 1,092,889
––– 28,041 1,433 148 977 2,580 33,179
––– (6) (147) ––– (95) (168) (416)
(2,620) (123,473) (2,775) (432) (3,993) (5,735) (169,539)
7,873 585,940 8,836 2,384 3,733 15,480 956,113
40,493 1,649,252 33,179 16,251 46,903 54,988 2,350,072
(32,620) (1,063,312) (24,343) (13,867) (43,170) (39,508) (1,393,959)
7,873 585,940 8,836 2,384 3,733 15,480 956,113
13,113 762,716 11,847 2,864 16,674 24,124 1,126,448
––– 40,080 1,155 237 1,886 3,203 142,807
––– ––– ––– ––– ––– (1,474) (1,474)
(2,620) (121,418) (2,677) (433) (11,716) (7,050) (174,892)
10,493 681,378 10,325 2,668 6,844 18,803 1,092,889
40,493 1,621,217 32,023 16,103 51,517 60,470 2,330,829
(30,000) (939,839) (21,698) (13,435) (44,673) (41,667) (1,237,940)
10,493 681,378 10,325 2,668 6,844 18,803 1,092,889
10 5 - 20 5 & 20 10 33.33 20
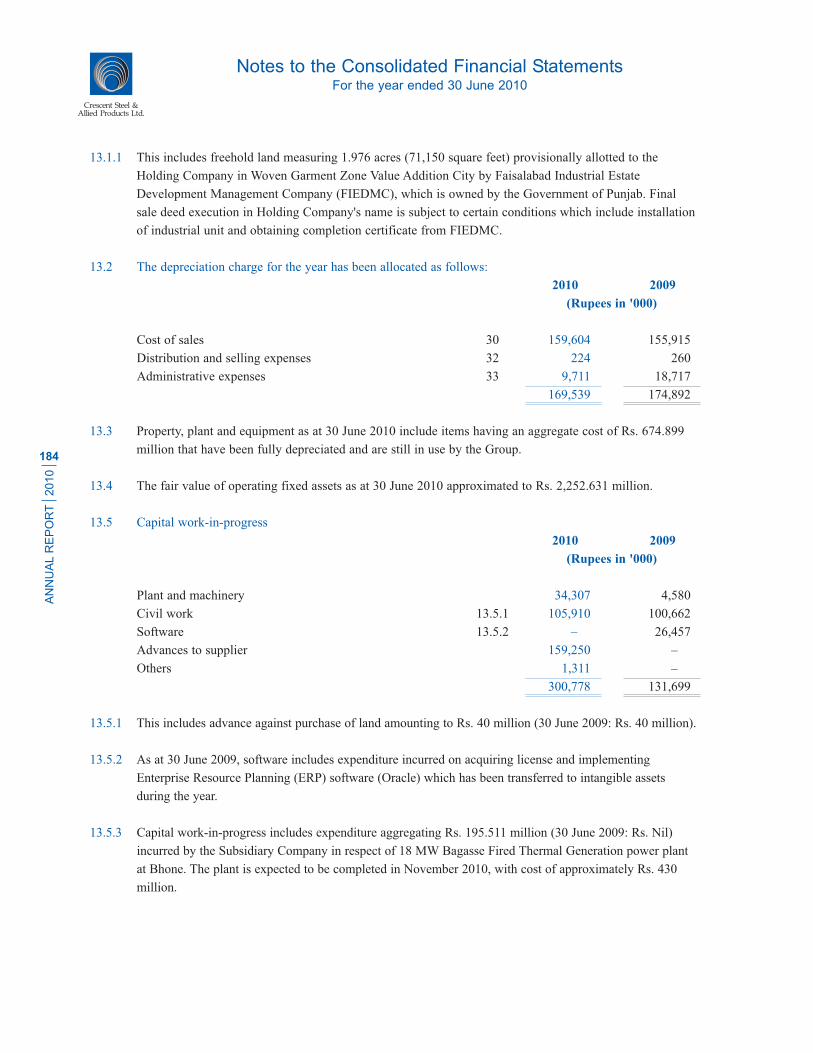
Crescent Steel & Allied Products Ltd.
13.1.1 This includes freehold land measuring 1.976 acres (71,150 square feet) provisionally allotted to the
Holding Company in Woven Garment Zone Value Addition City by Faisalabad Industrial Estate
Development Management Company (FIEDMC), which is owned by the Government of Punjab. Final
sale deed execution in Holding Company's name is subject to certain conditions which include installation
of industrial unit and obtaining completion certificate from FIEDMC.
13.2 The depreciation charge for the year has been allocated as follows:
2010 2009
(Rupees in '000)
Cost of sales 30 159,604 155,915
Distribution and selling expenses 32 224 260
Administrative expenses 33 9,711 18,717
169,539 174,892
13.3 Property, plant and equipment as at 30 June 2010 include items having an aggregate cost of Rs. 674.899
million that have been fully depreciated and are still in use by the Group.
13.4 The fair value of operating fixed assets as at 30 June 2010 approximated to Rs. 2,252.631 million.
13.5 Capital work-in-progress
2010 2009
(Rupees in '000)
Plant and machinery 34,307 4,580
Civil work 13.5.1 105,910 100,662
Software 13.5.2 ––– 26,457
Advances to supplier 159,250 –––
Others 1,311 –––
300,778 131,699
13.5.1 This includes advance against purchase of land amounting to Rs. 40 million (30 June 2009: Rs. 40 million).
13.5.2 As at 30 June 2009, software includes expenditure incurred on acquiring license and implementing
Enterprise Resource Planning (ERP) software (Oracle) which has been transferred to intangible assets
during the year.
13.5.3 Capital work-in-progress includes expenditure aggregating Rs. 195.511 million (30 June 2009: Rs. Nil)
incurred by the Subsidiary Company in respect of 18 MW Bagasse Fired Thermal Generation power plant
at Bhone. The plant is expected to be completed in November 2010, with cost of approximately Rs. 430
million.
Notes to the Consolidated Financial StatementsFor the year ended 30 June 2010
AN
NU
AL R
EP
OR
T
2010
184

13.6 The following assets were disposed off during the year:
Description Cost Accumulated Book Sale Mode of Particular
depreciation value proceeds disposal of buyers
(Rupees in '000)
Motor vehicles 504 504 –– 175 Company Scheme Mr. Sikandar Soomro
(employee)
63 –– 63 63 Insurance Claim EFU Insurance Limited
Electrical
equipment 259 108 151 151 Negotiation Desert Sound, Karachi
Others 13,104 12,902 202 2,615 Various Various
2010 13,930 13,514 416 3,004
2009 4,838 3,364 1,474 1,740
14. INTANGIBLE ASSETS
2010 2009
(Rupees in '000)
Net carrying value as at 1 July
Net book value as at 1 July 811 620
Additions / transfers (at cost) 33,589 583
Amortization 14.1 (9,943) (392)
Net book value as at 30 June 14.2 & 14.3 24,457 811
Gross carrying value as at 30 June
Cost 45,734 12,145
Accumulated amortization (18,637) (8,694)
Accumulated impairment (2,640) (2,640)
Net book value 24,457 811
Amortization rate (% per annum) 33.33 33.33
14.1 The amortization charge for the year has been allocated as follows:
Cost of sales 30 24 119
Administrative expenses 33 9,919 273
9,943 392
Notes to the Consolidated Financial StatementsFor the year ended 30 June 2010
AN
NU
AL R
EP
OR
T
2010
185
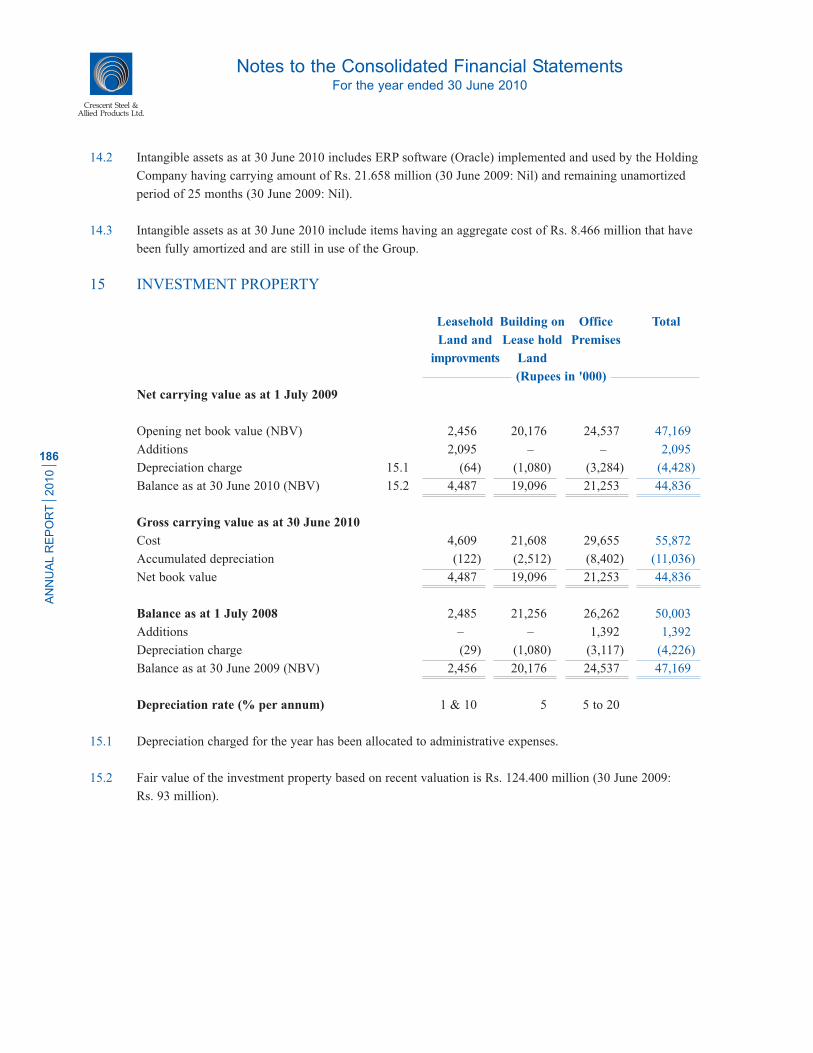
Crescent Steel & Allied Products Ltd.
14.2 Intangible assets as at 30 June 2010 includes ERP software (Oracle) implemented and used by the Holding
Company having carrying amount of Rs. 21.658 million (30 June 2009: Nil) and remaining unamortized
period of 25 months (30 June 2009: Nil).
14.3 Intangible assets as at 30 June 2010 include items having an aggregate cost of Rs. 8.466 million that have
been fully amortized and are still in use of the Group.
15 INVESTMENT PROPERTY
Leasehold Building on Office Total
Land and Lease hold Premises
improvments Land
(Rupees in '000)
Net carrying value as at 1 July 2009
Opening net book value (NBV) 2,456 20,176 24,537 47,169
Additions 2,095 ––– ––– 2,095
Depreciation charge 15.1 (64) (1,080) (3,284) (4,428)
Balance as at 30 June 2010 (NBV) 15.2 4,487 19,096 21,253 44,836
Gross carrying value as at 30 June 2010
Cost 4,609 21,608 29,655 55,872
Accumulated depreciation (122) (2,512) (8,402) (11,036)
Net book value 4,487 19,096 21,253 44,836
Balance as at 1 July 2008 2,485 21,256 26,262 50,003
Additions ––– ––– 1,392 1,392
Depreciation charge (29) (1,080) (3,117) (4,226)
Balance as at 30 June 2009 (NBV) 2,456 20,176 24,537 47,169
Depreciation rate (% per annum) 1 & 10 5 5 to 20
15.1 Depreciation charged for the year has been allocated to administrative expenses.
15.2 Fair value of the investment property based on recent valuation is Rs. 124.400 million (30 June 2009:
Rs. 93 million).
Notes to the Consolidated Financial StatementsFor the year ended 30 June 2010
AN
NU
AL R
EP
OR
T
2010
186

16. INVESTMENT IN EQUITY ACCOUNTED INVESTEES
The following associates, over which the Group has significant influence either due to representation on
investee company's board or percentage of holding of voting power or both, are accounted for using equity
method of accounting as defined in IAS 28 'Investments in associates'.
2010 2009 2010 2009
(Number of shares) (Rupees in '000)
Quoted
69,175,416 60,475,416 Altern Energy Limited 16.1.1 1,230,702 842,461
(Cheif Executive Officer -
Mr. Sheikh Muhammad Iqbal)
15,244,665 15,244,665 Shakarganj Mills Limited ––– 96,291
(Cheif Executive Officer -
Mr. Ahsan M. Saleem)
1,230,702 938,752
Unquoted
––– 12,000,000 Shakarganj Food Products Ltd. 16.1.3 ––– 86,277
(Cheif Executive Officer -
Mr. Anjum M. Saleem)
––– 2,185,096 Safeway Fund Limited 16.1.4 ––– 77,739
(Cheif Executive Officer -
Mr. Nihal Cassim)
1,230,702 1,102,768
Less: Provision for impairment ––– 71,315
1,230,702 1,031,453
16.1.1 The Holding Company and the Subsidiary Company hold 17.65% and 2.54% shareholding in Altern
Energy Limited respectively and have no common directorship. The Group has an effective holding of
20.19% in the investee company and accordingly has been treated as an associate and accounted for under
the equity method.
16.1.2 The above figures are based on unaudited condensed interim financial information of these companies as
at 31 March 2010. The latest financial statements of these companies as at 30 June 2010 are not presently
available.
16.1.3 The investment in Shakarganj Food Products Limited has been transferred to investment in available for
sale securities as the Group considers that it no longer has significant influence over the investee company.
16.1.4 The investment in Safeway Fund Limited has been disposed off during the year.
Notes to the Consolidated Financial StatementsFor the year ended 30 June 2010
AN
NU
AL R
EP
OR
T
2010
187

Crescent Steel & Allied Products Ltd.
16.1.5 Market value/break-up of investments in associates are as follows:
2010 2009
(Rupees in '000)
Quoted
Altern Energy Limited 714,582 483,803
Shakarganj Mills Limited 57,930 77,748
772,512 561,551
Unquoted*
Shakarganj Food Products Limited ––– 39,814
Safeway Fund Limited ––– 24,969
––– 64,783
772,512 626,334
* Break-up value of shares is based on latest available unaudited condensed interim financial information
as at 31 March 2010.
16.1.6 Percentage holding of equity investments in associates are as follows:
2010 2009
(%)
Quoted
Altern Energy Limited 20.19 17.65
Shakarganj Mills Limited 21.93 21.93
Unquoted
Shakarganj Food Products Limited ––– 9.33
Safeway Fund Limited ––– 25.00
16.1.7 Summarized financial information of associated companies as at 31 March 2010 is as follows:
Name of investee company Total Total Revenues Profit /
assets liabilities (loss)
(Rupees in '000)
2010
Altern Energy Limited 16.1.8 32,726,568 21,901,200 11,842,086 1,572,059
Shakarganj Mills Limited 16.1.9 11,564,311 10,259,160 4,524,509 (495,915)
2009
Altern Energy Limited 33,169,741 25,006,232 11,358,307 1,506,153
Shakarganj Mills Limited 12,271,591 9,566,463 3,237,692 (508,905)
Shakarganj Food Products Limited 1,406,477 919,959 1,232,023 (74,098)
Safeway Fund Limited 142,904 678 1,972 (10,791)
16.1.8 These figures are based on the latest available summarized consolidated condensed interim financial
statements as at 31 March 2010 including its subsidiary company (Rousch (Pakistan) Power Limited).
Notes to the Consolidated Financial StatementsFor the year ended 30 June 2010
AN
NU
AL R
EP
OR
T
2010
188

16.1.9 These figures are based on the latest available consolidated condensed interim financial information as at
31 March 2010.
17. OTHER LONG TERM INVESTMENTS
2010 2009
(Rupees in '000)
Related parties
Held to maturity 25.1 ––– 29,994
Available for sale 17.1 ––– –––
Others
Available for sale 17.2 180,717 60,717
Held to maturity 17.3 24,938 26,781
205,655 117,492
Less: Current maturity of Maple Leaf Cement Limited
(Preference Shares) and Shakarganj Mills Limited
(Preference Shares) 25 ––– 31,830
205,655 85,662
Related parties
17.1 Available for sale
2010 2009 2010 2009
(Number of shares) (Rupees in '000)
Unquoted
2,403,725 2,403,725 Crescent Bahuman Limited 17.1.1 24,037 24,037
1,047,000 1,047,000 Crescent Industrial Chemicals
Limited 17.1.2 10,470 10,470
34,507 34,507
Less: Provision for impairment 34,507 34,507
––– –––
17.1.1 The chief executive of Crescent Bahuman Limited is Mr. Nasir Shafi. The company's break up value of
shares could not be ascertained as the latest financial statements of the company are not available.
17.1.2 The chief executive of Crescent Industrial Chemicals Limited is Mr. Tariq Shafi. The company's break up
value of shares could not be ascertained as the financial statements of the company are not available.
Notes to the Consolidated Financial StatementsFor the year ended 30 June 2010
AN
NU
AL R
EP
OR
T
2010
189

Crescent Steel & Allied Products Ltd.
Others
17.2 Available for sale
2010 2009 2010 2009
(Number of shares) (Rupees in '000)
Unquoted
1,425,000 1,425,000 Central Depository Company
of Pakistan Limited 60,717 60,717
12,000,000 ––– Shakarganj Food Products Limited 120,000 –––
180,717 60,717
17.3 Held to maturity
Term Finance Certificates 17.3.1 24,938 24,945
Maple Leaf Cement Limited (Preference Shares) 25.2 ––– 1,836
24,938 26,781
Less: Current maturity of Maple Leaf Cement Limited
(Preference Shares) ––– 1,836
24,938 24,945
17.3.1 Term Finance Certificates (TFCs)
United Bank Limited (5,000 TFCs of Rs. 5,000 each) 24,948 24,955
Current maturity shown under current assets (10) (10)
24,938 24,945
This represents the investments in TFCs issued on 10 February 2004 by United Bank Limited. The tenor
of the TFCs are eight years with semi-annual installments comprising of principal and profit. The rate of
profit is 8.45 percent per annum. Fair value of the TFCs as at 30 June 2010 amounted to Rs. 22.718
million (2009: Rs. 21.618 million).
18. LONG TERM LOANS AND DEPOSITS
2010 2009
(Rupees in '000)
Security deposits 3,193 3,174
Long term loans - considered good 18.1 273 627
3,466 3,801
18.1 This represents interest free house loans provided to employees of the Holding Company for a period of 5
years.
Notes to the Consolidated Financial StatementsFor the year ended 30 June 2010
AN
NU
AL R
EP
OR
T
2010
190
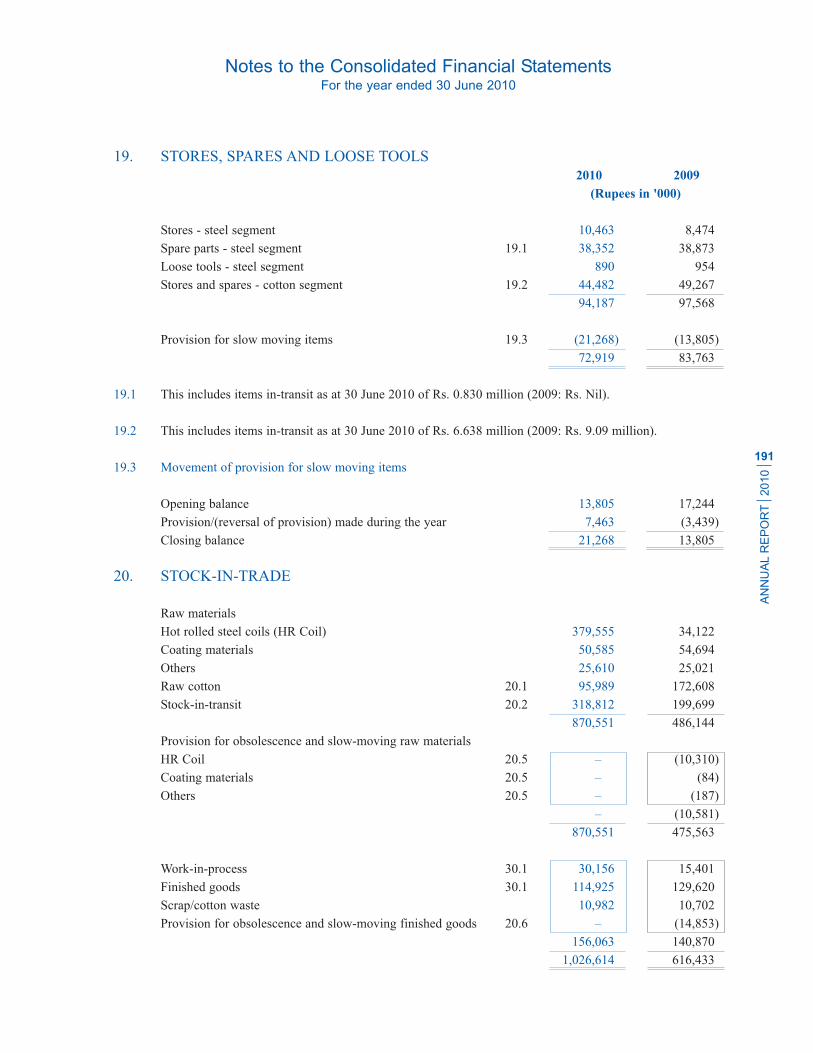
19. STORES, SPARES AND LOOSE TOOLS
2010 2009
(Rupees in '000)
Stores - steel segment 10,463 8,474
Spare parts - steel segment 19.1 38,352 38,873
Loose tools - steel segment 890 954
Stores and spares - cotton segment 19.2 44,482 49,267
94,187 97,568
Provision for slow moving items 19.3 (21,268) (13,805)
72,919 83,763
19.1 This includes items in-transit as at 30 June 2010 of Rs. 0.830 million (2009: Rs. Nil).
19.2 This includes items in-transit as at 30 June 2010 of Rs. 6.638 million (2009: Rs. 9.09 million).
19.3 Movement of provision for slow moving items
Opening balance 13,805 17,244
Provision/(reversal of provision) made during the year 7,463 (3,439)
Closing balance 21,268 13,805
20. STOCK-IN-TRADE
Raw materials
Hot rolled steel coils (HR Coil) 379,555 34,122
Coating materials 50,585 54,694
Others 25,610 25,021
Raw cotton 20.1 95,989 172,608
Stock-in-transit 20.2 318,812 199,699
870,551 486,144
Provision for obsolescence and slow-moving raw materials
HR Coil 20.5 ––– (10,310)
Coating materials 20.5 ––– (84)
Others 20.5 ––– (187)
––– (10,581)
870,551 475,563
Work-in-process 30.1 30,156 15,401
Finished goods 30.1 114,925 129,620
Scrap/cotton waste 10,982 10,702
Provision for obsolescence and slow-moving finished goods 20.6 ––– (14,853)
156,063 140,870
1,026,614 616,433
Notes to the Consolidated Financial StatementsFor the year ended 30 June 2010
AN
NU
AL R
EP
OR
T
2010
191

Crescent Steel & Allied Products Ltd.
20.1 This includes raw cotton amounting to Rs. 31.802 million (2009: Rs. 52.1 million) pledged as security
with a financial institution.
20.2 This includes raw cotton amounting to Rs. 282.497 million (2009: Rs. 39.84 million).
20.3 This includes finished goods in transit amounting to Rs. Nil (2009: Rs. 15.507 million).
20.4 Stock in trade as at 30 June 2010 includes stock items valued at net realisable value (NRV) as follows.
The write down to NRV amounting to Rs. 5.838 million has been recognized in cost of goods sold.
Cost NRV
(Rupees in '000)
Finished goods 120,464 114,925
Raw material 870,850 870,551
991,314 985,476
20.5 Movements of provision for obsolescence and slow-moving raw materials
2010 2009
H.R. Coating / Total H.R. Coating/ Total
Coil Others Coil Others
(Rupees in '000)
Opening balance 10,310 271 10,581 8,813 271 9,084
(Reversal)/provision
during the year (4,996) ––– (4,996) 1,497 ––– 1,497
Written off against
provision (5,314) (271) (5,585) ––– ––– –––
Closing balance ––– ––– ––– 10,310 271 10,581
20.6 Movements of provision for obsolescence and slow-moving finished goods
2010 2009
(Rupees in '000)
Opening balance 14,853 16,348
Reversal made during the year (3,690) (1,495)
Written off during the year against provision (11,163) –––
Closing balance ––– 14,853
Notes to the Consolidated Financial StatementsFor the year ended 30 June 2010
AN
NU
AL R
EP
OR
T
2010
192

21. TRADE DEBTS
2010 2009
(Rupees in '000)
Secured
Considered good 167,275 52,849
Unsecured
Considered good 109,605 31,078
Considered doubtful 2,387 1,547
Provision for doubtful trade debts (2,387) (1,547)
109,605 31,078
276,880 83,927
22. ADVANCES
Considered good
Advances to staff 894 679
Suppliers for goods and services 54,025 39,215
Considered doubtful
Advances to others ––– 3,000
Provision for doubtful advances ––– (3,000)
––– –––
Suppliers for goods and services 290 290
Provision for doubtful advances (290) (290)
––– –––
54,919 39,894
23. TRADE DEPOSITS AND SHORT TERM PREPAYMENTS
Security deposits 3,375 3,776
Prepayments 3,032 2,528
6,407 6,304
24. INVESTMENTS
Related parties
Available-for-sale 24.1 9,758 11,060
Others
Available-for-sale 24.2 107,976 141,965
Held for trading 24.3 346,012 502,372
453,988 644,337
463,746 655,397
Notes to the Consolidated Financial StatementsFor the year ended 30 June 2010
AN
NU
AL R
EP
OR
T
2010
193

Crescent Steel & Allied Products Ltd.
Investment in related parties
24.1 Available-for-sale
The Group holds investments in ordinary shares of Rs. 10 each in the following listed investee companies:
2010 2009 Name of investee company 2010 2009
(Number of shares) (Rupees in '000)
Quoted
452,379 452,379 The Crescent Textile Mills Ltd. 9,758 11,060
91,300 91,300 Crescent Jute Products Ltd. 24.1.1 ––– –––
9,758 11,060
24.1.1 Investments in Crescent Jute Products Limited is carried at their break-up value, which is Nil per share,
as this company is on the defaulters counter of the Karachi Stock Exchange. The break-up value has been
calculated on the basis of unaudited condensed interim financial information for the half year ended 31
December 2009.
Investment in others
24.2 Available-for-sale
The Group holds investments in ordinary shares of Rs. 10 each in the following listed investee companies:
2010 2009 Name of investee company 2010 2009
(Number of shares) (Rupees in '000)
Quoted
9,060,000 9,060,000 Asian Stock Fund Limited 53,454 37,599
––– 2,578 Fauji Fertilizer Company Limited ––– 224
1,996 1,996 Innovative Investment Bank Limited ––– –––
26,490 26,490 Jubilee Spinning and Weaving
Mills Limited 24.2.1 ––– –––
––– 1,300 Nestle Pakistan Limited ––– 1,494
––– 3,252,500 Pakistan Strategic Allocation Fund ––– 11,156
––– 100,311 PICIC Growth Fund ––– 843
175,000 175,000 PICIC Investment Fund 662 667
7,944,263 7,944,263 Safeway Mutual Fund Limited 52,591 85,401
1,221 4,500 Siemens (Pakistan) Engineering
Company Limited 1,269 4,581
107,976 141,965
24.2.1 Investments in Jubilee Spinning and Weaving Mills Limited is carried at Rs. Nil (2009: Rs. Nil). The
break-up value of shares of the investee company is Rs. 5.53 per share, calculated on the basis of the
unaudited condensed interim financial information for the nine months ended 31 March 2010.
Notes to the Consolidated Financial StatementsFor the year ended 30 June 2010
AN
NU
AL R
EP
OR
T
2010
194
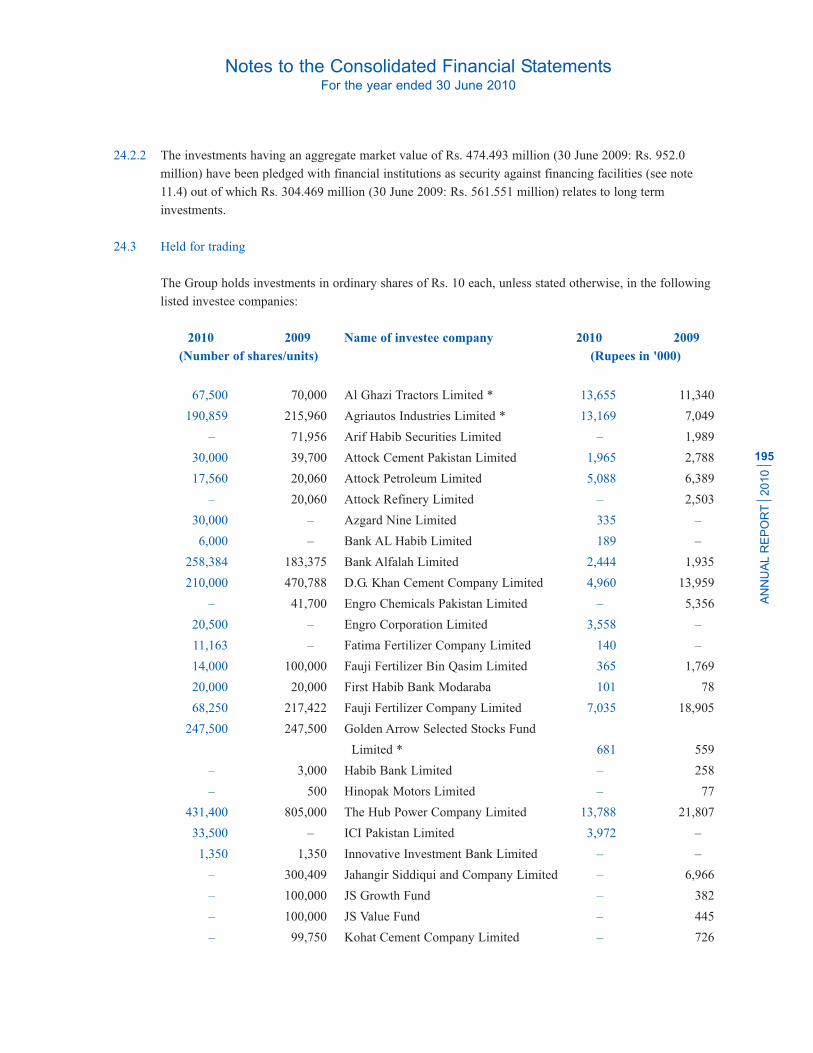
24.2.2 The investments having an aggregate market value of Rs. 474.493 million (30 June 2009: Rs. 952.0
million) have been pledged with financial institutions as security against financing facilities (see note
11.4) out of which Rs. 304.469 million (30 June 2009: Rs. 561.551 million) relates to long term
investments.
24.3 Held for trading
The Group holds investments in ordinary shares of Rs. 10 each, unless stated otherwise, in the following
listed investee companies:
2010 2009 Name of investee company 2010 2009
(Number of shares/units) (Rupees in '000)
67,500 70,000 Al Ghazi Tractors Limited * 13,655 11,340
190,859 215,960 Agriautos Industries Limited * 13,169 7,049
––– 71,956 Arif Habib Securities Limited ––– 1,989
30,000 39,700 Attock Cement Pakistan Limited 1,965 2,788
17,560 20,060 Attock Petroleum Limited 5,088 6,389
––– 20,060 Attock Refinery Limited ––– 2,503
30,000 ––– Azgard Nine Limited 335 –––
6,000 ––– Bank AL Habib Limited 189 –––
258,384 183,375 Bank Alfalah Limited 2,444 1,935
210,000 470,788 D.G. Khan Cement Company Limited 4,960 13,959
––– 41,700 Engro Chemicals Pakistan Limited ––– 5,356
20,500 ––– Engro Corporation Limited 3,558 –––
11,163 ––– Fatima Fertilizer Company Limited 140 –––
14,000 100,000 Fauji Fertilizer Bin Qasim Limited 365 1,769
20,000 20,000 First Habib Bank Modaraba 101 78
68,250 217,422 Fauji Fertilizer Company Limited 7,035 18,905
247,500 247,500 Golden Arrow Selected Stocks Fund
Limited * 681 559
––– 3,000 Habib Bank Limited ––– 258
––– 500 Hinopak Motors Limited ––– 77
431,400 805,000 The Hub Power Company Limited 13,788 21,807
33,500 ––– ICI Pakistan Limited 3,972 –––
1,350 1,350 Innovative Investment Bank Limited ––– –––
––– 300,409 Jahangir Siddiqui and Company Limited ––– 6,966
––– 100,000 JS Growth Fund ––– 382
––– 100,000 JS Value Fund ––– 445
––– 99,750 Kohat Cement Company Limited ––– 726
Notes to the Consolidated Financial StatementsFor the year ended 30 June 2010
AN
NU
AL R
EP
OR
T
2010
195

Crescent Steel & Allied Products Ltd.
2010 2009 Name of investee company 2010 2009
(Number of shares/units) (Rupees in '000)
465,425 622,500 Kohinoor Energy Limited 12,329 18,053
341,400 341,400 Kot Addu Power Company Limited 14,250 14,428
10,000 ––– Lotte Pakistan PTA Limited 80 –––
––– 426,000 Meezan Balanced Fund ––– 2,462
25,000 410,869 National Bank of Pakistan 1,603 27,541
40,000 46,074 National Investment Trust 1,121 1,237
235,000 ––– Nishat (Chunian) Limited 3,708 –––
137,000 ––– Nishat Mills Limited 5,907 –––
––– 599,800 Oil & Gas Development
Company Limited ––– 47,168
27,374 27,374 Packages Limited 3,243 4,299
685,640 1,006,140 Pakistan Oilfields Limited 148,029 146,796
302,500 ––– Pakistan Telecommunication
Company Limited 5,385 –––
200,000 246,500 Pakistan National Shipping Corporation 7,978 11,378
––– 217,365 Pakistan Petroleum Limited ––– 41,199
––– 171,708 Pakistan Premier Fund Limited ––– 704
128,200 97,500 Pakistan State Oil Company Limited 33,358 20,831
––– 161,875 Pak Suzuki Motor Company Limited ––– 10,991
105,000 5,000 PICIC Energy Fund 541 23
457,311 711,000 PICIC Growth Fund 4,235 5,972
––– 569,634 PICIC Insurance Limited ––– 3,412
481,173 ––– PICIC Investment Fund 1,819 –––
4,884,734 6,056,456 Samba Bank Limited 11,088 18,048
(Formerly Crescent Commercial
Bank Ltd.)
2,500 ––– Shell Pakistan Limited 573 –––
203,500 280,280 Thal Limited * 19,32021,708
––– 22,000 United Bank Limited ––– 842
346,012 502,372
* It has face value of Rs. 5 per share.
Notes to the Consolidated Financial StatementsFor the year ended 30 June 2010
AN
NU
AL R
EP
OR
T
2010
196

24.4 'The following investments are deposited as security with commercial banks.
2010 2009
(Rupees in '000)
Name of investee companies
Altern Energy Limited 281,751 483,803
Agriauto Industries Limited 13,110 6,430
Al Ghazi Tractors Limited 13,655 10,530
Azgard Nine Limited 223 –––
Arif Habib Securities Limited ––– 138
Attock Cement Pakistan Limited 1,965 2,317
Attock Petroleum Limited 4,346 6,389
Attock Refinery Limited ––– 2,503
Bank Alfalah Limited 2,441 –––
Bank Al Habib Limited 189 –––
ICI Pakistan Limited 3,557 –––
D.G. Khan Cement Limited 4,960 11,374
Engro Corporation Limited 3,558 –––
Fauji Fertilizer Bin Qasim Limited 365 1,521
Fauji Fertilizer Company Limited 7,008 5,027
The Hub Power Company Limited 13,788 16,985
Jahangir Siddiqui & Company Limited ––– 3,349
Kohinoor Energy Limited 11,483 18,053
Kot Addu Power Company Limited 14,025 14,242
Kohat Cement Company Limited ––– 673
Meezan Balanced Fund ––– 2,312
National Bank of Pakistan 1,603 16,188
Nishat Mills Limited 5,907 –––
Oil and Gas Development Company Limited ––– 25,318
Pak Suzuki Motor Company Limited ––– 10,991
Packages Limited 3,199 2,356
Pakistan Oilfields Limited ––– 137,037
Pakistan Petroleum Limited ––– 41,197
Pakistan State Oil Company Limited 33,358 -
Pakistan Strategic Allocation Fund ––– 11,149
Pakistan Telecommunication Company Limited 5,340 –––
PICIC Growth Fund 4,167 55
PICIC Investment Fund 2,457 –––
Samba Bank Limited (Formerly Crescent Commercial Bank Ltd.) ––– 18,023
Shakarganj Mills Limited ––– 77,748
Siemens (Pakistan) Engineering Company Limited ––– 4,581
Thal Limited 19,320 21,708
United Bank Limited - TFCs 22,718 –––
474,493 951,997
Notes to the Consolidated Financial StatementsFor the year ended 30 June 2010
AN
NU
AL R
EP
OR
T
2010
197
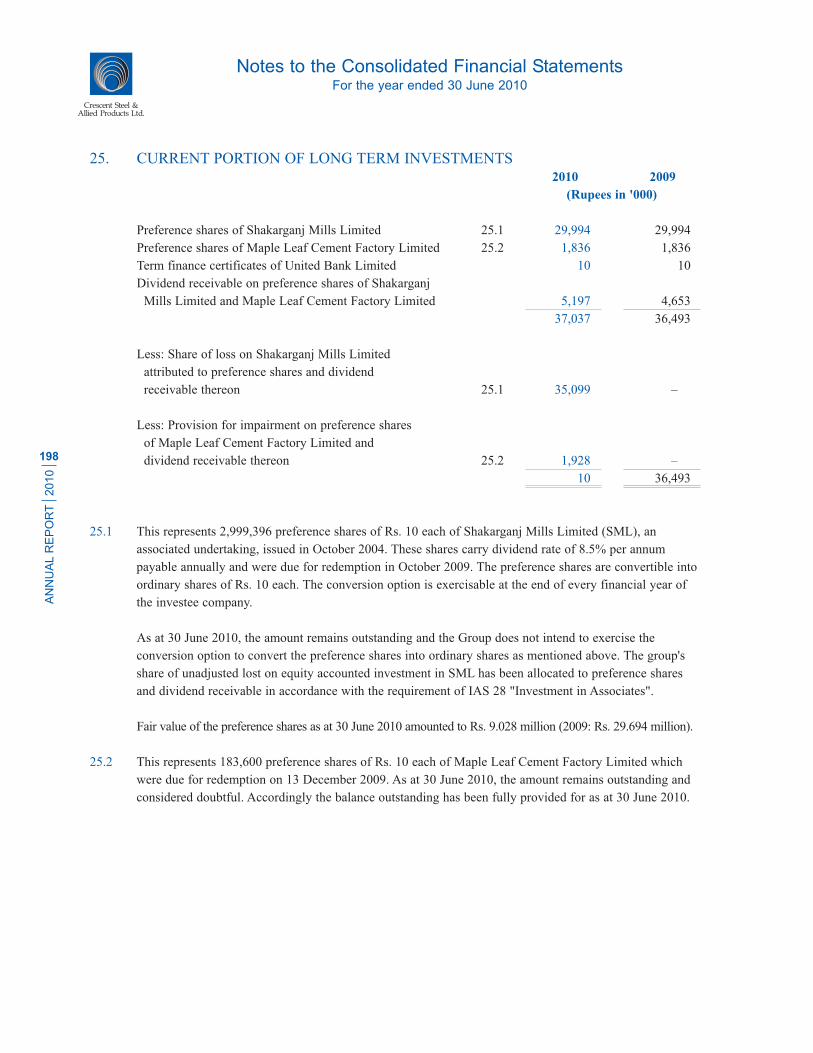
Crescent Steel & Allied Products Ltd.
25. CURRENT PORTION OF LONG TERM INVESTMENTS2010 2009
(Rupees in '000)
Preference shares of Shakarganj Mills Limited 25.1 29,994 29,994
Preference shares of Maple Leaf Cement Factory Limited 25.2 1,836 1,836
Term finance certificates of United Bank Limited 10 10
Dividend receivable on preference shares of Shakarganj
Mills Limited and Maple Leaf Cement Factory Limited 5,197 4,653
37,037 36,493
Less: Share of loss on Shakarganj Mills Limited
attributed to preference shares and dividend
receivable thereon 25.1 35,099 –––
Less: Provision for impairment on preference shares
of Maple Leaf Cement Factory Limited and
dividend receivable thereon 25.2 1,928 –––
10 36,493
25.1 This represents 2,999,396 preference shares of Rs. 10 each of Shakarganj Mills Limited (SML), an
associated undertaking, issued in October 2004. These shares carry dividend rate of 8.5% per annum
payable annually and were due for redemption in October 2009. The preference shares are convertible into
ordinary shares of Rs. 10 each. The conversion option is exercisable at the end of every financial year of
the investee company.
As at 30 June 2010, the amount remains outstanding and the Group does not intend to exercise the
conversion option to convert the preference shares into ordinary shares as mentioned above. The group's
share of unadjusted lost on equity accounted investment in SML has been allocated to preference shares
and dividend receivable in accordance with the requirement of IAS 28 "Investment in Associates".
Fair value of the preference shares as at 30 June 2010 amounted to Rs. 9.028 million (2009: Rs. 29.694 million).
25.2 This represents 183,600 preference shares of Rs. 10 each of Maple Leaf Cement Factory Limited which
were due for redemption on 13 December 2009. As at 30 June 2010, the amount remains outstanding and
considered doubtful. Accordingly the balance outstanding has been fully provided for as at 30 June 2010.
Notes to the Consolidated Financial StatementsFor the year ended 30 June 2010
AN
NU
AL R
EP
OR
T
2010
198

26. OTHER RECEIVABLES2010 2009
(Rupees in '000)
Dividend receivable 529 2,444
Receivable against sale of shares ––– 5,993
Claim receivable 238 3,428
Due from associated undertakings 26.1 450 5,448
Sales tax/special excise duty refundable 21,428 33,397
Provision there against (4,346) (4,346)
17,082 29,051
Margin on letter of credit ––– 109,045
Receivable from staff retirement funds 43 2,975 5,107
Others 3,882 104
25,156 160,620
26.1 Due from associated undertakings
Crescent Textile Mills Limited 7 9
Shakarganj Mills Limited 13 3,016
Shakarganj Foods Products Limited ––– 2,031
Crescent Jute Products Limited 430 347
Safeway Fund Limited ––– 45
450 5,448
27. TAXATION - NET
Advance tax 868,559 669,117
Provision for tax (849,861) (640,696)
18,698 28,421
27.1 The income tax assessments of the Holding Company have been finalized up to and including the
assessment year 2002-2003. Tax returns of subsequent tax years are deemed to be assessed under section
120 of the Income Tax Ordinance, 2001 unless selected for an audit by the taxation authorities. The
Appelate Tribunal Inland Revenue (ATIR) and Taxation officer has issued the order in respect of
assessment year 2001-2002, 2002-2003 and Tax year 2003, 2004, 2006 and 2007. The company has filed
appeals against such order which are pending for adjudication. Full provision has been recognised in these
financial statements upto Tax year 2003 except for short credit of taxes paid, deduction of taxed at source
and adjustment of refund for the said assessment / Tax years. However, no provision has been made in
these financial statements in respect of Tax years 2004, 2006 and 2007 as the management is confident for
favourable outcome of these appeals. Additional tax liability of Rs. 128.887 million may arise against the
above mentioned assessments in case decisions are made against the Holding Company.
Notes to the Consolidated Financial StatementsFor the year ended 30 June 2010
AN
NU
AL R
EP
OR
T
2010
199

Crescent Steel & Allied Products Ltd.
Further, the department has also filed appeals against orders of Commissioner of Income Tax (Appeals)
in respect of assessment years 1997-1998, 2000-2001 and Tax year 2004. In case of adverse decisions,
additional tax liability of Rs. 8.569 million may arise. However, no provision has been made in these
financial statements as the management is confident for favourable outcome of these appeals.
28. CASH AND BANK BALANCES
2010 2009
(Rupees in '000)
With banks in deposit accounts:
- local currency 88,830 334
- foregin currency 2 2
88,832 336
in current accounts 92,163 3,205
Cash in hand 1,662 603
182,657 4,144
29. SALES
2010 2009
(Rupees in '000)
Local sales
Bare pipes (own product excluding coating revenue) 928,038 1,259,483
Revenue from conversion 105,071 91,189
Coating of pipes 591,552 651,208
Cotton yarn/raw cotton 2,196,287 1,497,812
Others (including pipes laboratory testing) 24,042 21,198
Scrap/waste 107,798 87,125
Sales returns (22,535) (15,225)
Export Sales
Export of cotton yarn 11,037 13,769
3,941,290 3,606,559
Sales tax and special excise duty (236,902) (295,690)
3,704,388 3,310,869
30. COST OF SALES
Steel segment 30.1 1,010,885 1,046,861
Cotton segment 30.1 1,876,410 1,550,329
2,887,295 2,597,190
Notes to the Consolidated Financial StatementsFor the year ended 30 June 2010
AN
NU
AL R
EP
OR
T
2010
200

30.1 Cost of sales
Steel Segment Cotton Segment Total
2010 2009 2010 2009 2010 2009
(Rupees in '000)
Raw materials consumed 799,389 921,676 1,315,115 1,056,791 2,114,504 1,978,467
Cost of raw cotton sold ––– ––– 70,962 14,847 70,962 14,847
Packing materials consumed ––– ––– 26,261 20,717 26,261 20,717
Store and spares consumed 30,639 28,058 57,617 34,240 88,256 62,298
Fuel, power and electricity 43,763 27,297 161,232 140,188 204,995 167,485
Salaries, wages and other benefits 30.2 69,512 57,317 83,656 76,662 153,168 133,979
Insurance 1,308 1,524 3,626 3,574 4,934 5,098
Repairs and maintenance 4,450 3,608 4,083 3,212 8,533 6,820
Depreciation 13.2 20,632 16,522 138,972 139,393 159,604 155,915
Amortization of intangible assets 14.1 ––– ––– 24 119 24 119
Stock in trade written down to NRV 5,838 ––– ––– ––– 5,838 –––
Other expenses 44,595 14,942 5,681 7,386 50,276 22,328
1,020,126 1,070,944 1,867,229 1,497,129 2,887,355 2,568,073
Opening stock of work-in-process 2,776 3,548 12,625 11,526 15,401 15,074
Closing stock of work-in-process (13,716) (2,776) (16,440) (12,625) (30,156) (15,401)
(10,940) 772 (3,815) (1,099) (14,755) (327)
Cost of goods manufactured 1,009,186 1,071,716 1,863,414 1,496,030 2,872,600 2,567,746
Opening stock of finished goods 70,359 45,504 59,261 113,560 129,620 159,064
Closing stock of finished goods (68,660) (70,359) (46,265) (59,261) (114,925) (129,620)
1,699 (24,855) 12,996 54,299 14,695 29,444
1,010,885 1,046,861 1,876,410 1,550,329 2,887,295 2,597,190
30.2 Detail of salaries, wages and other benefits
Salaries, wages and other benefits 61,010 51,503 80,839 73,503 141,849 125,006
Provident fund contributions 1,729 1,503 1,453 1,608 3,182 3,111
Pension fund 30.3 5,431 3,484 1,335 1,410 6,766 4,894
Gratuity 30.3 1,342 827 29 141 1,371 968
69,512 57,317 83,656 76,662 153,168 133,979
Notes to the Consolidated Financial StatementsFor the year ended 30 June 2010
AN
NU
AL R
EP
OR
T
2010
201
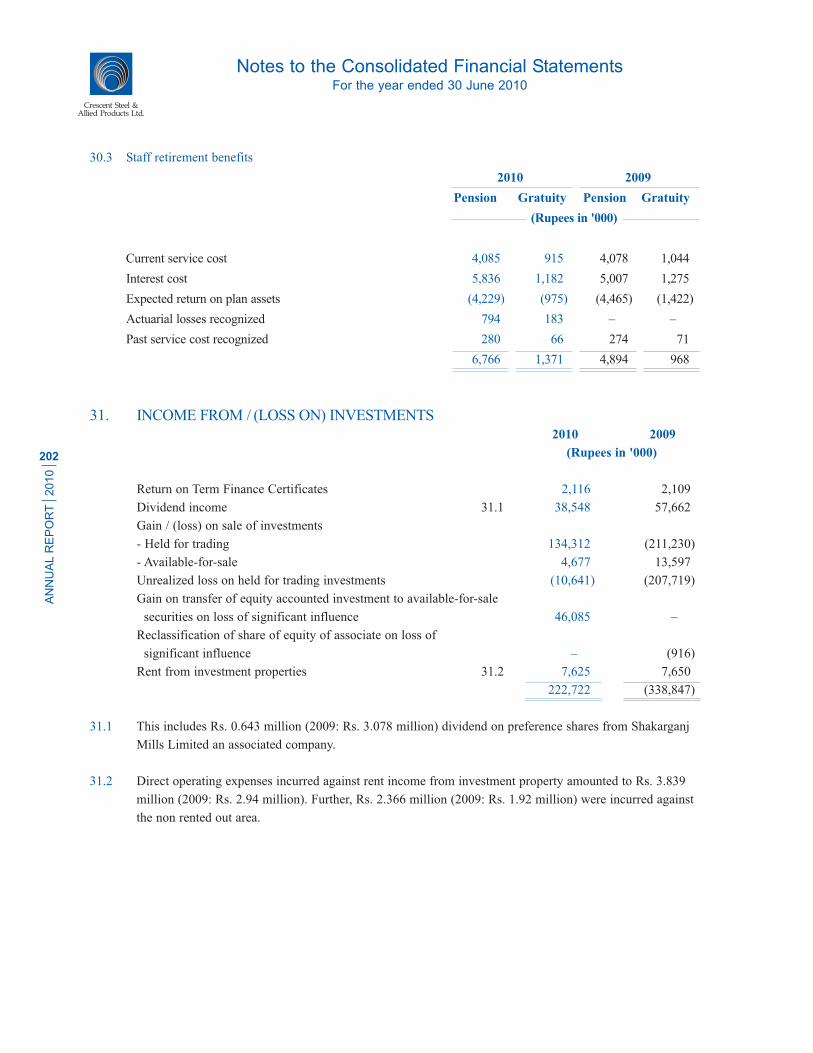
Crescent Steel & Allied Products Ltd.
30.3 Staff retirement benefits
2010 2009
Pension Gratuity Pension Gratuity
(Rupees in '000)
Current service cost 4,085 915 4,078 1,044
Interest cost 5,836 1,182 5,007 1,275
Expected return on plan assets (4,229) (975) (4,465) (1,422)
Actuarial losses recognized 794 183 ––– –––
Past service cost recognized 280 66 274 71
6,766 1,371 4,894 968
31. INCOME FROM / (LOSS ON) INVESTMENTS
2010 2009
(Rupees in '000)
Return on Term Finance Certificates 2,116 2,109
Dividend income 31.1 38,548 57,662
Gain / (loss) on sale of investments
- Held for trading 134,312 (211,230)
- Available-for-sale 4,677 13,597
Unrealized loss on held for trading investments (10,641) (207,719)
Gain on transfer of equity accounted investment to available-for-sale
securities on loss of significant influence 46,085 –––
Reclassification of share of equity of associate on loss of
significant influence ––– (916)
Rent from investment properties 31.2 7,625 7,650
222,722 (338,847)
31.1 This includes Rs. 0.643 million (2009: Rs. 3.078 million) dividend on preference shares from Shakarganj
Mills Limited an associated company.
31.2 Direct operating expenses incurred against rent income from investment property amounted to Rs. 3.839
million (2009: Rs. 2.94 million). Further, Rs. 2.366 million (2009: Rs. 1.92 million) were incurred against
the non rented out area.
Notes to the Consolidated Financial StatementsFor the year ended 30 June 2010
AN
NU
AL R
EP
OR
T
2010
202

32. DISTRIBUTION AND SELLING EXPENSES
Steel Segment Cotton Segment Total
2010 2009 2010 2009 2010 2009
(Rupees in '000)
Salaries, wages and other
benefits 32.1 5,868 5,084 1,684 1,834 7,552 6,918
Commission ––– ––– 12,677 6,019 12,677 6,019
Travelling, conveyance
and entertainment 714 645 190 42 904 687
Depreciation 13.2 217 258 7 2 224 260
Insurance 89 102 ––– ––– 89 102
Postage, telephone and
telegram 117 91 109 35 226 126
Advertisement 672 386 100 ––– 772 386
Bid bond expenses 291 259 ––– ––– 291 259
Legal and professional
charges 1,960 595 ––– ––– 1,960 595
Others 1,664 397 658 1,407 2,322 1,804
11,592 7,817 15,425 9,339 27,017 17,156
32.1 Detail of salaries, wages and other benefits
Salaries, wages and other
benefits 4,434 4,085 1,684 1,834 6,118 5,932
Provident fund contributions 187 182 ––– ––– 187 169
Pension fund 32.2 1,005 668 ––– ––– 1,005 668
Gratuity 32.2 242 149 ––– ––– 242 149
5,868 5,084 1,684 1,834 7,552 6,918
32.2 Staff retirement benefits
2010 2009
Pension Gratuity Pension Gratuity
(Rupees in '000)
Current service cost 607 162 555 160
Interest cost 867 209 683 195
Expected return on plan assets (628) (172) (608) (217)
Actuarial losses recognized 118 32 ––– –––
Past service cost recognized 41 11 38 11
1,005 242 668 149
Notes to the Consolidated Financial StatementsFor the year ended 30 June 2010
AN
NU
AL R
EP
OR
T
2010
203

Crescent Steel & Allied Products Ltd.
33. ADMINISTRATIVE EXPENSES
Steel Segment Cotton Segment IID Segment Energy segment Total
2010 2009 2010 2009 2010 2009 2010 2009 2010 2009
(Rupees in '000)
Salaries, wages and other
benefits 33.1 49,677 43,118 5,888 5,569 6,054 5,429 ––– ––– 61,619 54,116
Rents, rates and taxes 163 318 104 101 750 314 ––– ––– 1,017 733
Travelling, conveyance
and entertainment 5,215 4,668 884 704 598 536 ––– ––– 6,697 5,908
Fuel and power 5,508 4,987 256 256 612 567 ––– ––– 6,376 5,810
Postage, telephone and
telegram 1,495 1,700 322 243 166 189 ––– ––– 1,983 2,132
Insurance 680 713 60 75 126 147 ––– ––– 866 935
Repairs and maintenance 3,269 2,496 309 193 1,085 351 ––– ––– 4,663 3,040
Auditors' remuneration 33.2 1,109 1,005 123 158 123 109 30 ––– 1,385 1,272
Legal and professional and
corporate service charges 16,763 11,030 1,364 1,330 6,846 4,102 1,270 ––– 26,243 16,462
Advertisement 45 332 ––– ––– 5 37 ––– ––– 50 369
Donations 32.4 16,452 4,241 ––– 1,955 1,828 471 ––– ––– 18,280 6,667
Depreciation 13.2 & 15 8,386 16,498 393 385 5,360 6,060 ––– ––– 14,139 22,943
Amortization of intangible
assets 14.1 8,914 175 15 79 990 19 ––– ––– 9,919 273
Printing, stationery and
office supplies 1,714 1,660 237 226 190 184 ––– ––– 2,141 2,070
Newspapers, subscriptions
and periodicals 2,851 1,788 833 466 317 199 ––– ––– 4,001 2,453
Others 553 812 235 515 267 120 ––– ––– 1,055 1,447
122,794 95,541 11,023 12,255 25,317 18,834 1,300 ––– 160,434 126,630
33.1 Salaries, wages and other benefits
Salaries, wages and other
benefits 38,247 33,653 4,775 5,398 4,664 4,247 ––– ––– 47,686 43,298
Provident fund contributions 1,445 1,528 157 171 180 192 ––– ––– 1,782 1,891
Pension fund 33.2 8,090 6,628 777 ––– 975 825 ––– ––– 9,842 7,453
Gratuity 33.2 1,895 1,309 179 ––– 235 165 ––– ––– 2,309 1,474
49,677 43,118 5,888 5,569 6,054 5,429 ––– ––– 61,619 54,116
33.2 Staff retirement benefits
2010 2009
Pension Gratuity Pension Gratuity
(Rupees in '000)
Current service cost 5,941 1,541 6,209 1,590
Interest cost 8,490 1,990 7,624 1,939
Expected return on plan assets (6,152) (1,643) (6,797) (2,163)
Actuarial losses recognized 1,155 308 ––– –––
Past service cost recognized 408 113 417 108
9,842 2,309 7,453 1,474
Notes to the Consolidated Financial StatementsFor the year ended 30 June 2010
AN
NU
AL R
EP
OR
T
2010
204

33.3 Auditors’ remuneration
2010 2009
(Rupees in '000)
Audit fee 33.3.1 1,030 875
Fee for audit of funds’ finalcial statements and other reports 168 209
Out of pocket expenses 187 188
1,385 1,272
33.3.1 Audit fee includes services for audit of annual separate and consolidated financial statements of the
Holding Company and the individual financial statements of the Subsidiary Company, limited review of
separate and consolidated condensed interim financial statements for the six months period, review report
on Statement of Compliance with best Practices of the Code of Corporate Governance and audit of
reconciliation statement of Nominee Shareholding of Central Depository Company of Pakistan Limited
(CDC).
33.4 Donations
Donations include the following in which a director is interested:
Name of director Interest Name and address of the donee Amount donated
in donee 2010 2009
(Rupees in '000)
Mr. Ahsan M. Saleem Director The Citizens Foundation
9th Floor, NIC Building, Karachi. 16,720 5,073
Director Pakistan Center for Philanthropy
1-A, Street 14, F-8/3, Islamabad. 830 600
Member Lyallpur Golf Club
Race Course Club, Faisalabad. ––– 714
17,550 6,387
33.4.1 Donations other than those mentioned above were not made to any donee in which a director or his spouse
had any interest at any time during the year.
Notes to the Consolidated Financial StatementsFor the year ended 30 June 2010
AN
NU
AL R
EP
OR
T
2010
205

Crescent Steel & Allied Products Ltd.
34. OTHERS OPERATING EXPENSES
2010 2009
(Rupees in '000)
Provision for slow moving stores, spares and loose tools 7,463 –––
Provision for stock-in-trade ––– 8,233
Provision for doubtful trade debts 840 1,399
Provision for Workers Welfare Fund 14,638 9,780
Provision for Workers Profit Participation Fund (steel segment) 28,666 27,524
Provision for infrastructure fee ––– 5,826
Provision for impairment in the value of investments 7,305 102,844
Provision for liquidated damages 2,823 11,594
Exchange loss 1,761 8,000
63,496 175,200
35. OTHER OPERATING INCOME
Income from financial assets
Return on deposits 999 1,340
Income from non financial assets
Liabilities written-back ––– 4,270
Provision written back for stock-in-trade/stores, spares and loose tools 8,686 11,670
Provision written back - Workers Welfare Fund ––– 19,613
Provision written back - infrastructure fees 3,488 –––
Provision written back - investments 18,545 –––
Gain on disposal of fixed assets 2,588 266
Insurance commission 887 775
Others 2,493 1,036
36,687 37,630
37,686 38,970
36. FINANCE COST
Mark-up on:
- Running finances 75,953 82,131
- Short term loans 25,842 86,495
- Long term loans 12,593 28,893
- Redeemable capital ––– 1,837
- Workers Profit Participation Fund 3,141 89
Bank charges 4,381 4,126
121,910 203,571
Notes to the Consolidated Financial StatementsFor the year ended 30 June 2010
AN
NU
AL R
EP
OR
T
2010
206
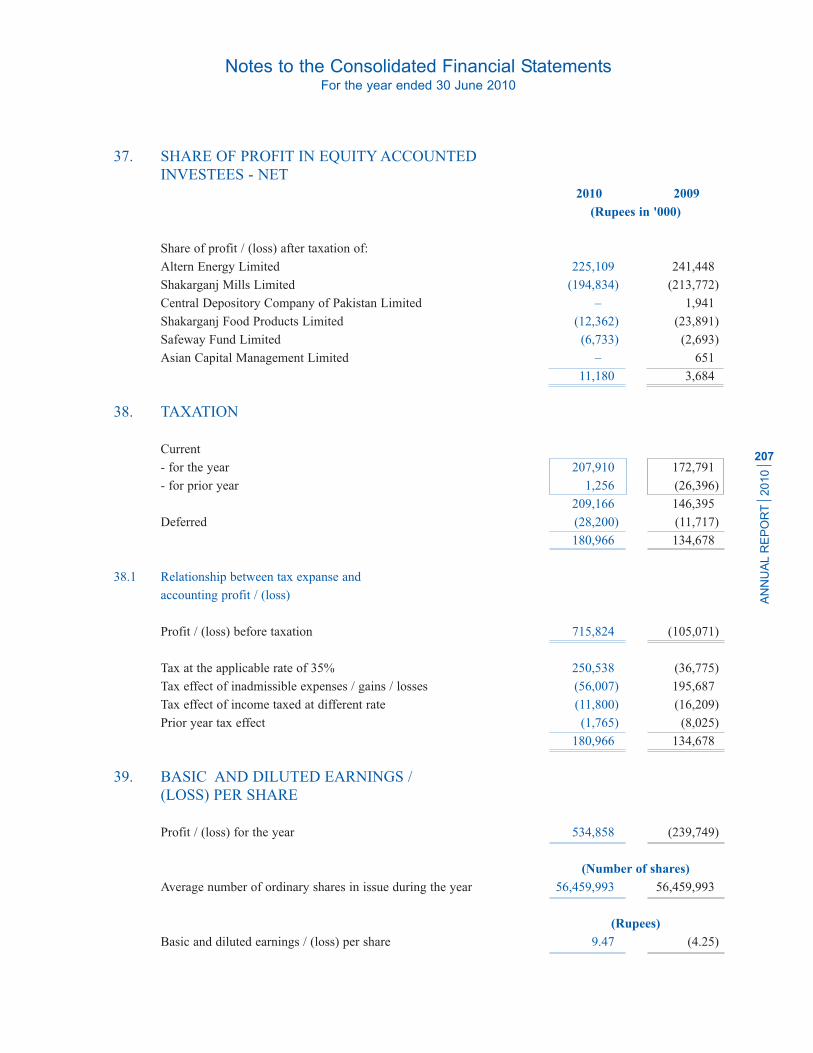
37. SHARE OF PROFIT IN EQUITY ACCOUNTED
INVESTEES - NET
2010 2009
(Rupees in '000)
Share of profit / (loss) after taxation of:
Altern Energy Limited 225,109 241,448
Shakarganj Mills Limited (194,834) (213,772)
Central Depository Company of Pakistan Limited ––– 1,941
Shakarganj Food Products Limited (12,362) (23,891)
Safeway Fund Limited (6,733) (2,693)
Asian Capital Management Limited ––– 651
11,180 3,684
38. TAXATION
Current
- for the year 207,910 172,791
- for prior year 1,256 (26,396)
209,166 146,395
Deferred (28,200) (11,717)
180,966 134,678
38.1 Relationship between tax expanse and
accounting profit / (loss)
Profit / (loss) before taxation 715,824 (105,071)
Tax at the applicable rate of 35% 250,538 (36,775)
Tax effect of inadmissible expenses / gains / losses (56,007) 195,687
Tax effect of income taxed at different rate (11,800) (16,209)
Prior year tax effect (1,765) (8,025)
180,966 134,678
39. BASIC AND DILUTED EARNINGS /
(LOSS) PER SHARE
Profit / (loss) for the year 534,858 (239,749)
(Number of shares)
Average number of ordinary shares in issue during the year 56,459,993 56,459,993
(Rupees)
Basic and diluted earnings / (loss) per share 9.47 (4.25)
Notes to the Consolidated Financial StatementsFor the year ended 30 June 2010
AN
NU
AL R
EP
OR
T
2010
207

Crescent Steel & Allied Products Ltd.
40. CASH GENERATED FROM OPERATIONS
2010 2009
(Rupees in '000)
Profit / (loss) before taxation 715,824 (105,071)
Adjustments for non cash charges and other items:
Depreciation on operating fixed assets and investment property 173,967 179,118
Reclassification of share of equity of associate on loss of
significant influence ––– 916
Amortization of intangible assets 9,943 392
Amortization of advances to staff 355 351
Unrealized loss on held-for-trading investments 10,641 207,719
Provision written back - investments (18,545) –––
Provision against stock-in-trade and stores, spares and loose tools 7,463 8,233
Reversal of provision against stock-in-trade and stores, spares
and loose tools (8,686) (11,670)
Liabilities written back ––– (4,270)
Provision for workers profit participation fund 28,666 27,524
Provision for workers welfare fund 14,638 9,780
Provision written back against workers welfare fund ––– (19,613)
Impairment in the value of investment 7,305 102,844
(Reversal of provision) / provision for infrastructure fee (3,488) 9,919
Provision for doubtful debts 840 1,399
Provision for 10-C bonus 808 741
Provision against liquidated damages 2,823 11,594
(Gain) / loss on sale of investments - net (133,973) 197,633
Gain on transfer of equity accounted investment to available-for-sale
securities on loss of significant influence (46,085) –––
Pension and gratuity expense 21,535 15,607
Charge for compensated absences 1,882 514
Finance costs 121,910 203,571
Gain on disposal of fixed assets (2,588) (266)
Dividend income (38,548) (57,662)
Return on deposits and investments (3,115) (3,449)
Share of profit in equity accounted investees (5,151) (3,684)
Amortization of initial transaction costs 263 712
Working capital changes 40.1 (31,879) (22,202)
826,805 750,680
Notes to the Consolidated Financial StatementsFor the year ended 30 June 2010
AN
NU
AL R
EP
OR
T
2010
208

40.1 Working capital changes
2010 2009
(Rupees in '000)
(Increase) / decrease in current assets
Stores, spares and loose tools 3,381 (2,939)
Stock-in-trade (392,398) (10,376)
Trade debts (193,793) 33,370
Short term advances (15,025) (15,295)
Short term deposits and prepayments (103) (3,891)
Other receivables (net) 125,424 (133,529)
(472,514) (132,660)
Increase in current liabilities
Trade and other payables 440,635 110,458
(31,879) (22,202)
41. CASH AND CASH EQUIVALENTS
Running finances under mark-up arrangements 11 (652,875) (648,880)
Cash and bank balances 28 182,657 4,144
(470,218) (644,736)
42. SEGMENT REPORTING
42.1 Reportable segments
The Group's reportable segments are as follows:
- Steel segment - It comprises manufacturing and coating of steel pipes (note 1.2).
- Cotton segment - It comprises manufacturing of yarn (note 1.3).
- Investment and Infrastructure Development (IID) segment - To effectively manage the investment
portfolio in shares and other securities (strategic as well as short term) and property investments (held
for rentals as well as long term appreciation).
- Energy segment - It comprises operations of Shakarganj Energy (Private) Limited (note 2).
Information regarding the Group’s reportable segments is presented below.
Notes to the Consolidated Financial StatementsFor the year ended 30 June 2010
AN
NU
AL R
EP
OR
T
2010
209
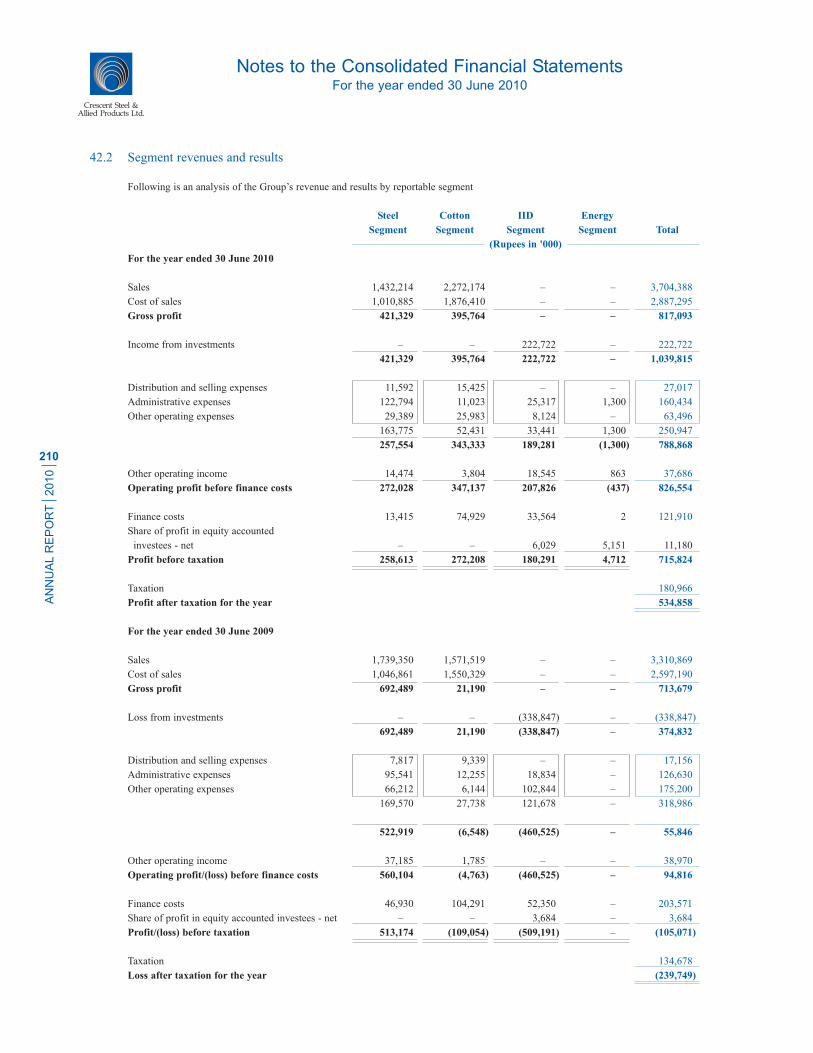
Crescent Steel & Allied Products Ltd.
42.2 Segment revenues and results
Following is an analysis of the Group’s revenue and results by reportable segment
Steel Cotton IID Energy
Segment Segment Segment Segment Total
(Rupees in '000)
For the year ended 30 June 2010
Sales 1,432,214 2,272,174 ––– ––– 3,704,388
Cost of sales 1,010,885 1,876,410 ––– ––– 2,887,295
Gross profit 421,329 395,764 ––– ––– 817,093
Income from investments ––– ––– 222,722 ––– 222,722
421,329 395,764 222,722 ––– 1,039,815
Distribution and selling expenses 11,592 15,425 ––– ––– 27,017
Administrative expenses 122,794 11,023 25,317 1,300 160,434
Other operating expenses 29,389 25,983 8,124 ––– 63,496
163,775 52,431 33,441 1,300 250,947
257,554 343,333 189,281 (1,300) 788,868
Other operating income 14,474 3,804 18,545 863 37,686
Operating profit before finance costs 272,028 347,137 207,826 (437) 826,554
Finance costs 13,415 74,929 33,564 2 121,910
Share of profit in equity accounted
investees - net ––– ––– 6,029 5,151 11,180
Profit before taxation 258,613 272,208 180,291 4,712 715,824
Taxation 180,966
Profit after taxation for the year 534,858
For the year ended 30 June 2009
Sales 1,739,350 1,571,519 ––– ––– 3,310,869
Cost of sales 1,046,861 1,550,329 ––– ––– 2,597,190
Gross profit 692,489 21,190 ––– ––– 713,679
Loss from investments ––– ––– (338,847) ––– (338,847)
692,489 21,190 (338,847) ––– 374,832
Distribution and selling expenses 7,817 9,339 ––– ––– 17,156
Administrative expenses 95,541 12,255 18,834 ––– 126,630
Other operating expenses 66,212 6,144 102,844 ––– 175,200
169,570 27,738 121,678 ––– 318,986
522,919 (6,548) (460,525) ––– 55,846
Other operating income 37,185 1,785 ––– ––– 38,970
Operating profit/(loss) before finance costs 560,104 (4,763) (460,525) ––– 94,816
Finance costs 46,930 104,291 52,350 ––– 203,571
Share of profit in equity accounted investees - net ––– ––– 3,684 ––– 3,684
Profit/(loss) before taxation 513,174 (109,054) (509,191) ––– (105,071)
Taxation 134,678
Loss after taxation for the year (239,749)
Notes to the Consolidated Financial StatementsFor the year ended 30 June 2010
AN
NU
AL R
EP
OR
T
2010
210

42.2.1 Revenue reported above represents revenue generated from external customers. There were no inter-
segment sales during the year (2009: Nil).
42.2.2 The accounting policies of the reportable segments are the same as the Group's accounting policies
described in note 5 to these consolidated financial statements. The steel segment allocates certain
percentage of the common administrative expenditure to the cotton segment and IID segment. In addition,
financial charges between steel and cotton segments are allocated at average mark-up rate on the basis of
funds utilized. This is the measure reported to management for the purposes of resource allocation and
assessment of segment performance.
42.3 Revenue from major products and services
The analysis of the Group's revenue from external customers for major products and services is given in
note 29 to these consolidated financial statements.
42.4 Information about major customers
Revenue from major customers of Company's steel segment represent approximately Rs. 754.696 million
(30 June 2009: Rs. 1,261.257 million) of total steel segment revenue of Rs. 1,432.241 million (30 June
2009: Rs. 1,739.350 million). Revenue from cotton segments of the Group does not include any single
major customer.
42.5 Geographical information
42.5.1 The Group's revenue from external customers by geographical location is detailed below:
2010 2009
(Rupees in '000)
Pakistan 3,693,351 3,297,100
Far East 11,037 13,769
3,704,388 3,310,869
42.5.2 All non-current assets of the Group as at 30 June 2010 and 2009 were located and operating in Pakistan.
Notes to the Consolidated Financial StatementsFor the year ended 30 June 2010
AN
NU
AL R
EP
OR
T
2010
211
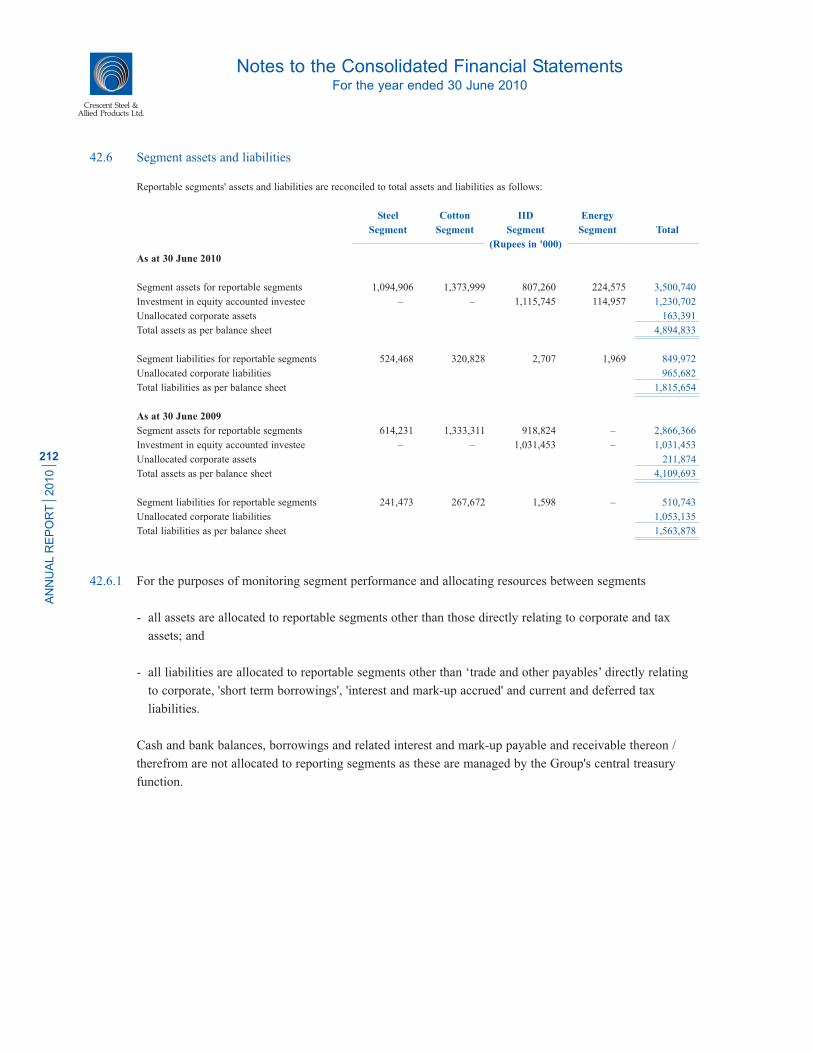
Crescent Steel & Allied Products Ltd.
42.6 Segment assets and liabilities
Reportable segments' assets and liabilities are reconciled to total assets and liabilities as follows:
Steel Cotton IID Energy
Segment Segment Segment Segment Total
(Rupees in '000)
As at 30 June 2010
Segment assets for reportable segments 1,094,906 1,373,999 807,260 224,575 3,500,740
Investment in equity accounted investee ––– ––– 1,115,745 114,957 1,230,702
Unallocated corporate assets 163,391
Total assets as per balance sheet 4,894,833
Segment liabilities for reportable segments 524,468 320,828 2,707 1,969 849,972
Unallocated corporate liabilities 965,682
Total liabilities as per balance sheet 1,815,654
As at 30 June 2009
Segment assets for reportable segments 614,231 1,333,311 918,824 ––– 2,866,366
Investment in equity accounted investee ––– ––– 1,031,453 ––– 1,031,453
Unallocated corporate assets 211,874
Total assets as per balance sheet 4,109,693
Segment liabilities for reportable segments 241,473 267,672 1,598 ––– 510,743
Unallocated corporate liabilities 1,053,135
Total liabilities as per balance sheet 1,563,878
42.6.1 For the purposes of monitoring segment performance and allocating resources between segments
- all assets are allocated to reportable segments other than those directly relating to corporate and tax
assets; and
- all liabilities are allocated to reportable segments other than ‘trade and other payables’ directly relating
to corporate, 'short term borrowings', 'interest and mark-up accrued' and current and deferred tax
liabilities.
Cash and bank balances, borrowings and related interest and mark-up payable and receivable thereon /
therefrom are not allocated to reporting segments as these are managed by the Group's central treasury
function.
Notes to the Consolidated Financial StatementsFor the year ended 30 June 2010
AN
NU
AL R
EP
OR
T
2010
212

42.7 Other segment information
Steel Cotton IID Energy
Segment Segment Segment Segment Total
(Rupees in '000)
For the year ended 30 June 2010
Capital expenditure 13,707 18,083 2,095 194,385 228,270
Depreciation and amortization 38,149 139,411 6,350 ––– 183,910
Non-cash items other than depreciation
and amortization - net 51,370 99,149 (167,012) (6,012) (22,505)
For the year ended 30 June 2009
Capital expenditure 136,340 14,538 18,237 ––– 169,115
Depreciation and amortization 33,453 139,978 6,079 ––– 179,510
Non-cash items other than depreciation
and amortization 94,786 250,106 502,340 ––– 847,232
43. STAFF RETIREMENT BENEFITS
43.1 Defined benefit plans
43.1.1 The actuarial valuation of both pension and gratuity schemes has been conducted in accordance with IAS
19, 'Employee benefits' as at 30 June 2010. The projected unit credit method, using the following
significant assumptions, has been used for the actuarial valuation:
2010 2009
- Discount rate 12% 12%
- Expected rate of increase in salaries 11% to 12% 12% to 15%
- Expected rate of return on plan assets 12% 12%
- Average expected remaining working life of employees 10 years 10 years
- Expected mortality for active members As per EFU (61-66) mortality table
Notes to the Consolidated Financial StatementsFor the year ended 30 June 2010
AN
NU
AL R
EP
OR
T
2010
213
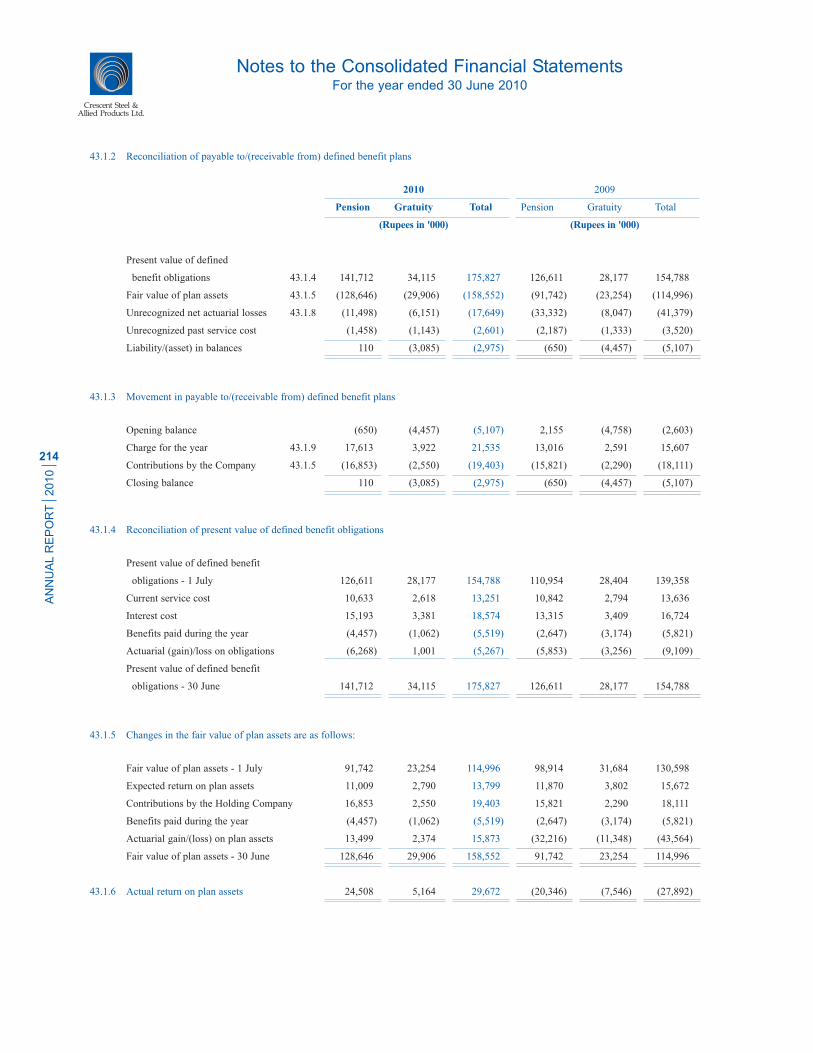
Crescent Steel & Allied Products Ltd.
43.1.2 Reconciliation of payable to/(receivable from) defined benefit plans
2010 2009
Pension Gratuity Total Pension Gratuity Total
(Rupees in '000) (Rupees in '000)
Present value of defined
benefit obligations 43.1.4 141,712 34,115 175,827 126,611 28,177 154,788
Fair value of plan assets 43.1.5 (128,646) (29,906) (158,552) (91,742) (23,254) (114,996)
Unrecognized net actuarial losses 43.1.8 (11,498) (6,151) (17,649) (33,332) (8,047) (41,379)
Unrecognized past service cost (1,458) (1,143) (2,601) (2,187) (1,333) (3,520)
Liability/(asset) in balances 110 (3,085) (2,975) (650) (4,457) (5,107)
43.1.3 Movement in payable to/(receivable from) defined benefit plans
Opening balance (650) (4,457) (5,107) 2,155 (4,758) (2,603)
Charge for the year 43.1.9 17,613 3,922 21,535 13,016 2,591 15,607
Contributions by the Company 43.1.5 (16,853) (2,550) (19,403) (15,821) (2,290) (18,111)
Closing balance 110 (3,085) (2,975) (650) (4,457) (5,107)
43.1.4 Reconciliation of present value of defined benefit obligations
Present value of defined benefit
obligations - 1 July 126,611 28,177 154,788 110,954 28,404 139,358
Current service cost 10,633 2,618 13,251 10,842 2,794 13,636
Interest cost 15,193 3,381 18,574 13,315 3,409 16,724
Benefits paid during the year (4,457) (1,062) (5,519) (2,647) (3,174) (5,821)
Actuarial (gain)/loss on obligations (6,268) 1,001 (5,267) (5,853) (3,256) (9,109)
Present value of defined benefit
obligations - 30 June 141,712 34,115 175,827 126,611 28,177 154,788
43.1.5 Changes in the fair value of plan assets are as follows:
Fair value of plan assets - 1 July 91,742 23,254 114,996 98,914 31,684 130,598
Expected return on plan assets 11,009 2,790 13,799 11,870 3,802 15,672
Contributions by the Holding Company 16,853 2,550 19,403 15,821 2,290 18,111
Benefits paid during the year (4,457) (1,062) (5,519) (2,647) (3,174) (5,821)
Actuarial gain/(loss) on plan assets 13,499 2,374 15,873 (32,216) (11,348) (43,564)
Fair value of plan assets - 30 June 128,646 29,906 158,552 91,742 23,254 114,996
43.1.6 Actual return on plan assets 24,508 5,164 29,672 (20,346) (7,546) (27,892)
Notes to the Consolidated Financial StatementsFor the year ended 30 June 2010
AN
NU
AL R
EP
OR
T
2010
214

43.1.7 Actuarial (losses)/gains to be recognized
2010 2009
Pension Gratuity Pension Gratuity
(Rupees in '000)
Corridor limit
The limits of corridor as at 1 July
- 10% of present value of obligations 12,661 2,818 11,095 2,840
- 10% of fair value of plan assets 9,174 2,325 9,891 3,168
Which works out to 12,661 2,818 11,095 3,168
Unrecognized net actuarial (losses)/gains as at 1 July (33,332) (8,047) (6,969) 45
Excess (20,671) (5,229) ––– –––
Average expected remaining working lives in years 10 10 10 10
Actuarial (losses) recognized (2,067) (523) ––– –––
43.1.8 Unrecognized net actuarial (losses)/gains
2010 2009
Pension Gratuity Total Pension Gratuity Total
(Rupees in '000)
Unrecognized net actuarial
(losses)/gains as at 1 July (33,332) (8,047) (41,379) (6,969) 45 (6,924)
Actuarial gain/(loss) on obligations 43.1.4 6,268 (1,001) 5,267 5,853 3,256 9,109
Actuarial gain/(loss) on plan assets 43.1.5 13,499 2,374 15,873 (32,216) (11,348) (43,564)
(13,565) (6,674) (20,239) (33,332) (8,047) (41,379)
Less: Actuarial (losses) recognized 43.1.7 (2,067) (523) (2,590) ––– ––– –––
Unrecognized net actuarial
losses as at 30 June (11,498) (6,151) (17,649) (33,332) (8,047) (41,379)
43.1.9 Following amounts have been charged in the
profit and loss account in respect of these benefits:
Current service cost 10,633 2,618 13,251 10,842 2,794 13,636
Interest cost 15,193 3,381 18,574 13,315 3,409 16,724
Expected return on plan assets (11,009) (2,790) (13,799) (11,870) (3,802) (15,672)
Actuarial losses recognized 2,067 523 2,590 ––– ––– –––
Past service cost recognized 729 190 919 729 190 919
Expense recognized in profit and
loss account 17,613 3,922 21,535 13,016 2,591 15,607
Notes to the Consolidated Financial StatementsFor the year ended 30 June 2010
AN
NU
AL R
EP
OR
T
2010
215
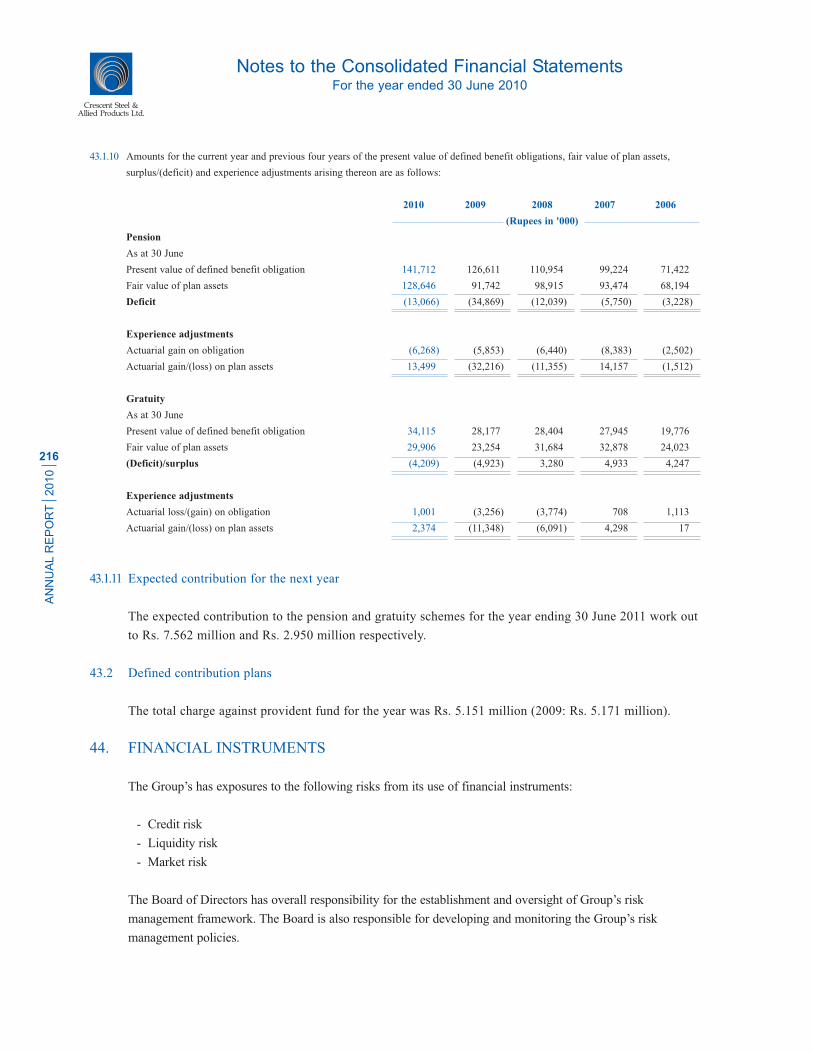
Crescent Steel & Allied Products Ltd.
43.1.10 Amounts for the current year and previous four years of the present value of defined benefit obligations, fair value of plan assets,
surplus/(deficit) and experience adjustments arising thereon are as follows:
2010 2009 2008 2007 2006
(Rupees in '000)
Pension
As at 30 June
Present value of defined benefit obligation 141,712 126,611 110,954 99,224 71,422
Fair value of plan assets 128,646 91,742 98,915 93,474 68,194
Deficit (13,066) (34,869) (12,039) (5,750) (3,228)
Experience adjustments
Actuarial gain on obligation (6,268) (5,853) (6,440) (8,383) (2,502)
Actuarial gain/(loss) on plan assets 13,499 (32,216) (11,355) 14,157 (1,512)
Gratuity
As at 30 June
Present value of defined benefit obligation 34,115 28,177 28,404 27,945 19,776
Fair value of plan assets 29,906 23,254 31,684 32,878 24,023
(Deficit)/surplus (4,209) (4,923) 3,280 4,933 4,247
Experience adjustments
Actuarial loss/(gain) on obligation 1,001 (3,256) (3,774) 708 1,113
Actuarial gain/(loss) on plan assets 2,374 (11,348) (6,091) 4,298 17
43.1.11 Expected contribution for the next year
The expected contribution to the pension and gratuity schemes for the year ending 30 June 2011 work out
to Rs. 7.562 million and Rs. 2.950 million respectively.
43.2 Defined contribution plans
The total charge against provident fund for the year was Rs. 5.151 million (2009: Rs. 5.171 million).
44. FINANCIAL INSTRUMENTS
The Group’s has exposures to the following risks from its use of financial instruments:
- Credit risk
- Liquidity risk
- Market risk
The Board of Directors has overall responsibility for the establishment and oversight of Group’s risk
management framework. The Board is also responsible for developing and monitoring the Group’s risk
management policies.
Notes to the Consolidated Financial StatementsFor the year ended 30 June 2010
AN
NU
AL R
EP
OR
T
2010
216

44.1 Credit risk
Credit risk represents the financial loss that would be recognized at the balance sheet date if counterparties
fail completely to perform as contracted / fail to discharge an obligation / commitment that it has entered
into with the Company. It arises principally from trade receivables, bank balances, security deposits,
accrued markup and investment in debt securities.
The carrying amount of financial assets represents the maximum credit exposure before any credit
enhancements. The maximum exposure to credit risk at the balance sheet date is:
2010 2009
(Rupees in '000)
Investments 41,952 61,438
Loans and deposits 6,568 6,950
Trade debts 276,880 83,927
Mark-up accrued 820 813
Other receivables 4,120 124,018
Bank balances 180,995 3,541
511,335 280,687
Trade receivable
To manage exposure to credit risk in respect of trade receivables, management performs credit reviews
taking into account the customer's financial position, past experience and other factors. Sales tenders and
credit terms are approved by the tender approval committee. Where considered necessary, advance
payments are obtained from certain parties. Sales made to major customers are secured through letters of
credit. The management has set a maximum credit period of 15 days in respect of cotton division's sales to
reduce the credit risk.
All the trade debtors at the balance sheet date represent domestic parties.
The maximum exposure to credit risk before any credit enhancements for trade receivables at the reporting
date by type of customer was:
2010 2009
(Rupees in '000)
Cotton segment 93,894 33,411
Steel segment 182,986 50,516
276,880 83,927
Notes to the Consolidated Financial StatementsFor the year ended 30 June 2010
AN
NU
AL R
EP
OR
T
2010
217

Crescent Steel & Allied Products Ltd.
2010 2009
(Rupees in '000)
The aging of trade receivable at the reporting date is:
Not past due 219,477 68,171
Past due 1-30 days 1,580 4,049
Past due 30-150 days 51,152 3,080
Past due 150 days 7,058 10,174
279,267 85,474
Less: impaired (2,387) (1,547)
276,880 83,927
One of the major customer accounts for Rs. 155.392 million of the trade receivables carrying amount at
30 June 2009 (2009: Rs. 35.16 million) that has a good track record with the Group.
The movement in the allowance for impairment in respect of trade receivables is as follows:
2010 2009
(Rupees in '000)
Opening balance 1,547 148
Provision during the year 840 1,399
Closing balance 2,387 1,547
Based on past experience the management believes that no impairment allowance is necessary in respect of
trade receivables past due as some receivables have been recovered subsequent to the year end and for other
receivables there are reasonable grounds to believe that the amounts will be recovered in short course of
time. Non past due amounts of Rs. 46.819 million (2009: Rs. 43.233 million) and past due amounts of Rs.
Nil (2009: Rs. 9.616 million) are secured through inland letters of credit.
Settlement risk
All investing transactions are settled/paid for upon delivery as per the advice of investment committee. The
Group’s policy is to enter into financial instrument contract by following internal guidelines such as
approving counterparties and approving credits.
Bank balances
The holding Company kept its surplus funds with banks having good credit rating. Currently the surplus
funds are kept with banks having rating from AAA to A.
Notes to the Consolidated Financial StatementsFor the year ended 30 June 2010
AN
NU
AL R
EP
OR
T
2010
218

Investment in debt securities
Credit risk arising on debt securities is mitigated by investing principally in investment grade rated
instruments. Where the investment is considered doubtful a provision is created there against. As at 30 June
2010, the Group has recognized a provision of Rs. 20.034 million against its exposure to preference shares
of investee companies.
The analysis below summarizes the credit quality of the Group’s investments in debt securities of investee
companies.
2010 2009
Term Finance Certificates AA AA
Preference Shares
- Maple Leaf Cement Factory Limited D A2
- Shakarganj Mills Limited D A2
Concentration of credit risk
Concentration of credit risk arises when a number of counter parties are engaged in similar business activities
or have similar economic features that would cause their abilities to meet contractual obligation to be similarly
effected by the changes in economic, political or other conditions. The Group believes that it is not exposed to
major concentration of credit risk.
44.2 Liquidity risk
Liquidity risk is the risk that the Group will encounter difficulty in meeting its obligation arising from
financial liabilities that are settled by delivering cash or another financial asset or that such obligation will
have to be settled in a manner disadvantageous to the Group. The Group is not materially exposed to
liquidity risk as substantially all obligation / commitments of the holding Company are short term in
nature and are restricted to the extent of available liquidity. In addition, the holding Company has obtained
running finance facilities from various commercial banks to meet the short term liquidity commitments,
if any.
Notes to the Consolidated Financial StatementsFor the year ended 30 June 2010
AN
NU
AL R
EP
OR
T
2010
219

Crescent Steel & Allied Products Ltd.
The following are the contractual maturities of the financial liabilities, including estimated interest
payments:
2010
Carrying On Contractual Six Six to One to Two to
amount demand cash flows months twelve two five
or less months years years
(Rupees in '000)
Financial liabilities
Loan 56,143 ––– 58,940 58,940 ––– ––– –––
Trade and other payables 249,869 ––– 249,869 249,869 ––– ––– –––
Interest and mark-up
accrued 34,198 ––– 34,198 34,198 ––– ––– –––
Short term borrowings 780,288 780,288 ––– ––– ––– ––– –––
1,120,498 780,288 343,007 343,007 ––– ––– –––
2009
Carrying On Contractual Six Six to One to Two to
amount demand cash flows months twelve two five
or less months years years
(Rupees in '000)
Financial liabilities
Loan 168,380 ––– 189,808 67,505 63,231 59,072 –––
Trade and other payables 247,207 ––– 247,207 247,207 ––– ––– –––
Interest and mark-up
accrued 19,009 ––– 19,009 19,009 ––– ––– –––
Short term borrowings 902,815 902,815 ––– ––– ––– ––– –––
1,337,411 902,815 456,024 333,721 63,231 59,072 –––
44.3 Market risk
Market risk is the risk that changes in market price, such as foreign exchange rates, interest rates and
equity prices will affect the holding Company's income or the value of its holdings of financial
instruments. The Investment Committee monitors the portfolio of its investments and adjust the portfolio
in light of changing circumstances.
Notes to the Consolidated Financial StatementsFor the year ended 30 June 2010
AN
NU
AL R
EP
OR
T
2010
220

44.3.1 Currency risk
The holding Company is exposed to currency risk on import of raw materials, stores and spares, export of
goods and foreign currency bank accounts denominated in US Dollars (USD), Great Britain Pound (GBP)
and Euros . The holding Company's exposure to foreign currency risk for these currencies is as follows:
2010
USD Pound Euro Total
(Rupees in '000)
Foreign creditors (196,030) (1,627) (6,589) (204,246)
Foreign currency bank account 2 ––– ––– 2
Gross balance sheet exposure (196,028) (1,627) (6,589) (204,244)
Outstanding letters of credit (22,302) (1,071) (1,537) (24,910)
Net exposure (218,330) (2,698) (8,126) (229,154)
2009
USD Pound Euro Total
(Rupees in '000)
Foreign creditors (129,301) ––– ––– (129,301)
Foreign currency bank account 2 ––– ––– 2
Net exposure (129,299) ––– ––– (129,299)
The following significant exchange rate has been applied:
Average rate Reporting date rate
2010 2009 2010 2009
USD to PKR 83.69 78.89 85.60 81.30
GBP to PKR 132.32 125.67 128.96 135.38
Euro to PKR 116.40 107.17 104.58 114.82
Sensitivity analysis
At reporting date, if the PKR had strengthened by 10% against the USD, GBP and Euro with all other
variables held constant, post-tax profit for the year would have been higher by the amount shown below,
mainly as a result of net foreign exchange gain on translation of foreign currency bank account and foreign
creditors.
Notes to the Consolidated Financial StatementsFor the year ended 30 June 2010
AN
NU
AL R
EP
OR
T
2010
221

Crescent Steel & Allied Products Ltd.
Effect on profit or loss 2010 2009
(Rupees in '000)
USD 21,833 12,903
GBP 270 –––
Euro 813 –––
22,916 12,903
The weakening of the PKR against USD, GBP and Euro would have had an equal but opposite impact on
the post tax profits.
The sensitivity analysis prepared is not necessarily indicative of the effects on profit for the year and
assets/liabilities of the Group.
44.3.2 Interest rate risk
At the reporting date the interest rate profile of the Group's significant interest bearing financial
instruments was as follows:
2010 2009 2010 2009
Effective interest rate Carrying amount
(in Percent) (Rupees in '000)
Financial assets
Fixed rate instruments
Preference shares 8.5 & 9.75 8.5 & 9.75 ––– 31,830
Term finance certificates 8.45 8.45 24,948 24,955
Financial liabilities
Variable rate instruments
Loan 14.25 - 14.95 14.94 - 17.55 56,143 168,380
Short term borrowings 13.49 - 15.79 12.52 - 18.5 780,288 902,815
Fair value sensitivity analysis for fixed rate instruments
The Group does not account for any fixed rate financial assets and liabilities at fair value through profit and
loss. Therefore a change in interest rates at the reporting date would not affect profit and loss account.
Cash flow sensitivity analysis for variable rate instruments
A change of 100 basis points in interest rates at the reporting date would have decreased/(increased)
profit for the year by the amounts shown below. This analysis assumes that all other variables, in
particular foreign currency rates, remain constant. The analysis is performed on the same basis for 2009.
Notes to the Consolidated Financial StatementsFor the year ended 30 June 2010
AN
NU
AL R
EP
OR
T
2010
222

Profit and loss 100 bp
2010 2009
(Rupees in '000)
As at 30 June 2010
Cash flow sensitivity-Variable rate financial liabilities (3,901) 3,901
As at 30 June 2009
Cash flow sensitivity-Variable rate financial liabilities (3,734) 3,734
The sensitivity analysis prepared is not necessarily indicative of the effects on profit for the year and assets /
liabilities of the Group.
44.3.3 Other price risk
Other price risk is the risk that the fair value or future cash flows of a financial instrument will fluctuate
because of changes in market prices (other than those arising from interest rate risk or currency risk). Other
price risk arises from the holding Company's investment in ordinary shares of listed companies. To manage
its price risk arising from aforesaid investments, the holding Company diversifies its portfolio and
continuously monitors developments in equity markets. In addition the Investment Committee actively
monitors the key factors that affect stock price movement.
A 10% increase/decrease in share prices at year end would have decreased/increased the Group 's profit in
case of held for trading investments and increase/decrease surplus on re-measurement of investments in case
of 'available for sale' investments as follows:
2010 2009
(Rupees in '000)
Effect on profit / (loss) 34,601 50,237
Effect on equity 17,668 21,374
Effect on investments 52,269 71,611
The sensitivity analysis prepared is not necessarily indicative of the effects on profit/equity and assets of
the Group.
44.4 Fair value of financial instruments
The carrying values of other financial assets and financial liabilities reported in balance sheet approximate
their fair values.
The Group measures fair values using the following fair value hierarchy that reflects the significance of the
inputs used in making the measurements:
- Level 1: Quoted market price (unadjusted) in an active market for an identical instrument
Notes to the Consolidated Financial StatementsFor the year ended 30 June 2010
AN
NU
AL R
EP
OR
T
2010
223

Crescent Steel & Allied Products Ltd.
- Level 2: Valuation techniques based on observable inputs, either directly (i.e. as prices) or indirectly (i.e.
derived from prices).
- Level 3: Valuation techniques using significant unobservable inputs.
Investment in ordinary shares of listed companies is valued using quoted prices in active market, hence, fair
value of such investments fall within Level 1 in fair value hierarchy as mentioned above.
45. REMUNERATION TO THE CHIEF EXECUTIVE, DIRECTOR AND EXECUTIVES
Chief Executive Director Executives Total
2010 2009 2010 2009 2010 2009 2010 2009
(Rupees in '000)
Managerial
remuneration 6,750 6,000 ––– 2,910 17,434 18,467 24,184 27,377
House rent 3,038 2,700 ––– 1,309 7,339 6,422 10,377 10,431
Utilities 675 600 ––– 291 1,678 1,475 2,353 2,366
Travelling expenses 994 1,152 ––– 317 ––– 309 994 1,778
Others 932 709 1,166 ––– ––– 44 2,098 753
Medical 211 60 ––– 109 994 1,029 1,205 1,198
Contribution to:
- Provident fund 675 600 ––– 291 1,065 922 1,740 1,813
- Gratuity fund 472 460 ––– 223 719 657 1,191 1,340
- Pension fund 1,350 1,200 ––– 582 2,331 2,008 3,681 3,790
Club subscription
and expenses 649 447 ––– 10 44 46 693 503
Entertainment ––– ––– ––– 33 42 121 42 154
Conveyance ––– ––– ––– ––– 1,001 971 1,001 971
Telephone ––– ––– ––– 11 6 28 6 39
15,746 13,928 1,166 6,086 32,653 32,499 49,565 52,513
Number of
persons 1 1 1 1 14 14 16 16
45.1 The aggregate amount charged in the account in respect of directors' fees paid to six directors (2009: seven)
directors was Rs. 0.360 million (2009: Rs. 0.305 million).
45.2 The chief executive, a director and four executives are provided with free use of Company maintained cars,
according to their entitlements.
45.3 The chief executive, a director, executives and their families are also covered under group life and
hospitalization insurance.
Notes to the Consolidated Financial StatementsFor the year ended 30 June 2010
AN
NU
AL R
EP
OR
T
2010
224

46. TRANSACTIONS WITH RELATED PARTIES
Related parties comprise of associated companies, directors, companies where directors also hold
directorship, related group companies, key management personnel and staff retirement funds.
The transactions and outstanding balances with related parties other than those disclosed elsewhere are as
follows:
2010 2009
(Rupees in '000)
Associated companies
Sale of finished goods including waste 24 16,080
Sale of raw cotton 7,623 –––
Rendering of services 3,989 1,182
Receiving of services 3,002 4,743
Rental income 2,301 4,649
Purchase of shares ––– 20,872
Purchase of operating fixed assets ––– 120,510
Other related parties
Rendering of services 441 –––
Donations 33.4 17,550 6,387
Contribution to provident fund 5,151 5,171
Contribution to pension fund 43.1.5 16,853 15,821
Contribution to gratuity fund 43.1.5 2,550 2,290
Remuneration to key management personnel 40,214 44,285
46.1 Sale of goods, rendering of services and rental income are based on commercial terms and at market prices
which are approved by the Board of Directors.
46.2 Contributions to the employee retirement benefits are made in accordance with the terms of employee
retirement benefits schemes and actuarial advice.
46.3 Key management personnel are those person having authority and responsibility for planning, directing and
controlling the activities of the company, including directors of the company. There are no transactions with
the key management personnel other than their terms of employment / entitlements.
47. CAPITAL RISK MANAGEMENT
The Group's prime objective when managing capital is to safeguard its ability to continue as a going concern
in order to provide adequate returns for shareholders and benefits for other stakeholders and to maintain an
optimal capital structure to reduce the cost of capital. The Group's overall strategy remains unchanged from
year 2009.
Notes to the Consolidated Financial StatementsFor the year ended 30 June 2010
AN
NU
AL R
EP
OR
T
2010
225

Crescent Steel & Allied Products Ltd.
The Group manages its capital structure and makes adjustments to it in the light of changes in economic
conditions. To maintain or adjust the capital structure, the Group may adjust the dividend payments to share
holders or issue new shares. The management seeks to maintain a balance between higher returns that might
be possible with higher levels of borrowings and the advantages and security afforded by a sound capital
position.
The Group finances its operations through equity, borrowings and management of working capital with a
view to maintaining an appropriate mix between various sources of finance to minimize risk.
The Group is not subject to any externally imposed capital requirements.
The Group monitors capital on the basis of the gearing ratio. This ratio is calculated as net debt divided by
total capital. Net debt is calculated as total debt less cash and bank balances. Total capital is calculated as
equity as shown in the balance sheet plus net debt.
47.1 Gearing ratio
2010 2009
(Rupees in '000)
The gearing ratio at end of the year was as follows:
Total debt 47.1.1 836,431 1,071,195
Less: Cash and bank balances 182,657 4,144
Net debt 653,774 1,067,051
Total equity 47.1.2 3,079,179 2,545,815
Total capital 3,732,953 3,612,866
Gearing ratio 18% 30%
47.1.1 Total debt is defined as long and short-term borrowings (excluding derivatives), as described in notes 7 and
11 to these consolidated financial statements.
47.1.2 Total equity includes all capital and reserves of the Group that are managed as capital.
48. PLANT CAPACITY AND PRODUCTION
46.1 Steel segment
Pipe plant
The plant’s installed/rated capacity for production based on single shift is 30,000 tons (2009: 30,000 tons)
annually on the basis of notional pipe size of 30" dia x ?" thickness. The actual production achieved during
the year was 17,410 tons (2009: 14,368 tons) line pipes of varied sizes and thickness, which is equivalent to
57,249 tons (2009: 37,470 tons) if actual production is translated to the notional pipe size of 30" diameter.
Notes to the Consolidated Financial StatementsFor the year ended 30 June 2010
AN
NU
AL R
EP
OR
T
2010
226

Coating plant
The coating plant has a capacity of externally shot blasting and coating of line pipes with 3 layer high/
medium density polyethylene coating at a rate of 250 square meters of surface area per hour on pipe sizes
ranging from 219 to 1067 mm outside dia and thickness ranging from 3 to 16 mm.
The annual capacity of the plant works out to 600,000 square meters outside surface of pipes based on
notional size of 30" dia on single shift working. Coating of 788,393 meters (2009: 585,651 meters) of
different dia pipes (461,043 square meters surface area) was achieved during the year (2009: 382,902 square
meters surface area).
48.2 Cotton segment
Spinning unit 1
The plant capacity converted to 20s count based on three shifts per day for 1,080 shifts is 6,452,874
kilograms. Actual production converted into 20s count was 5,016,846 kilograms (2009: 5,306,859
kilograms).
Spinning unit 2
The plant capacity converted to 20s count based on three shifts per day for 1,080 shifts is 9,284,825
kilograms. Actual production converted into 20s count was 9,638,111 kilograms (2009: 9,894,119 kilograms).
48.3 The capacities of the plant were utilized to the extent of orders received.
49. NON ADJUSTING EVENT AFTER BALANCE SHEET DATE
The Board of Directors of the Holding Company in their meeting held on 29 July 2010 has proposed a final
cash dividend for the year ended 30 June 2010 of Re. 1 per share (i.e. 10%), amounting to Rs. 56.460 million
(2009: Rs. Nil per share) for approval of the members of the Holding Company at the Annual General
Meeting to be held on 31 August 2010. This is in addition to the first and second interim cash dividends of
Re. 1 per share each already distributed and recorded in these consolidated financial statements. These
consolidated financial statements do not include the effect of this proposed final cash dividend and will be
accounted for subsequent to year end.
50. DATE OF AUTHORIZATION FOR ISSUE
These consolidated financial statements were authorized for issue in the Board of Directors meeting held on
29 July 2010.
Notes to the Consolidated Financial StatementsFor the year ended 30 June 2010
AN
NU
AL R
EP
OR
T
2010
227
DirectorChief Executive

Held by Shareholders as at 30 June 2010
No. of Shareholders Shareholding Total Shares held
From To
411 1 100 17,190
668 101 500 193,423
500 501 1,000 360,506
689 1,001 5,000 1,610,642
174 5,001 10,000 1,265,266
65 10,001 15,000 800,269
56 15,001 20,000 992,004
31 20,001 25,000 694,332
25 25,001 30,000 689,944
15 30,001 35,000 490,183
11 35,001 40,000 418,209
10 40,001 45,000 425,422
12 45,001 50,000 583,817
8 50,001 55,000 421,719
4 55,001 60,000 233,453
4 60,001 65,000 246,889
7 65,001 70,000 477,198
4 70,001 75,000 291,523
4 75,001 80,000 306,973
1 80,001 85,000 80,008
3 85,001 90,000 264,097
5 95,001 100,000 495,800
3 100,001 105,000 308,316
2 105,001 110,000 220,000
2 115,001 120,000 231,175
2 120,001 125,000 242,293
3 125,001 130,000 382,349
3 130,001 135,000 401,774
1 135,001 140,000 135,249
3 145,001 150,000 442,525
2 150,001 155,000 301,297
4 160,001 165,000 656,900
3 165,001 170,000 501,071
1 180,001 185,000 180,005
1 190,001 195,000 194,845
1 195,001 200,000 195,066
3 220,001 225,000 667,554
1 225,001 230,000 227,480
1 240,001 245,000 243,975
Crescent Steel & Allied Products Ltd.
Form “34” Pattern of Holding of Shares
AN
NU
AL R
EP
OR
T
2010
228

No. of Shareholders Shareholding Total Shares held
From To
2 255,001 260,000 518,490
1 265,001 270,000 267,500
1 300,001 305,000 302,153
1 305,001 310,000 305,410
1 320,001 325,000 323,418
2 325,001 330,000 652,529
2 330,001 335,000 667,979
1 335,001 340,000 337,580
1 340,001 345,000 341,024
1 345,001 350,000 345,198
1 350,001 355,000 354,561
1 390,001 395,000 393,000
1 395,001 400,000 400,000
1 400,001 405,000 405,000
1 405,001 410,000 408,200
1 485,001 490,000 490,000
1 530,001 535,000 530,712
1 550,001 555,000 553,781
1 600,001 605,000 604,916
1 605,001 610,000 605,484
1 620,001 625,000 621,816
1 630,001 635,000 633,583
1 655,001 660,000 655,500
1 740,001 745,000 742,422
1 745,001 750,000 747,683
1 830,001 835,000 831,192
1 860,001 865,000 864,724
1 960,001 965,000 962,059
1 1,085,001 1,090,000 1,090,000
1 1,130,001 1,135,000 1,133,300
1 1,230,001 1,235,000 1,233,739
1 1,590,001 1,595,000 1,591,061
1 1,825,001 1,830,000 1,825,062
1 1,910,001 1,915,000 1,913,233
1 2,345,001 2,350,000 2,349,276
1 3,450,001 3,455,000 3,450,150
1 3,905,001 3,910,000 3,907,841
1 6,205,001 6,210,000 6,209,676
2,784 56,459,993
Pattern of Holding of Shares
AN
NU
AL R
EP
OR
T
2010
229
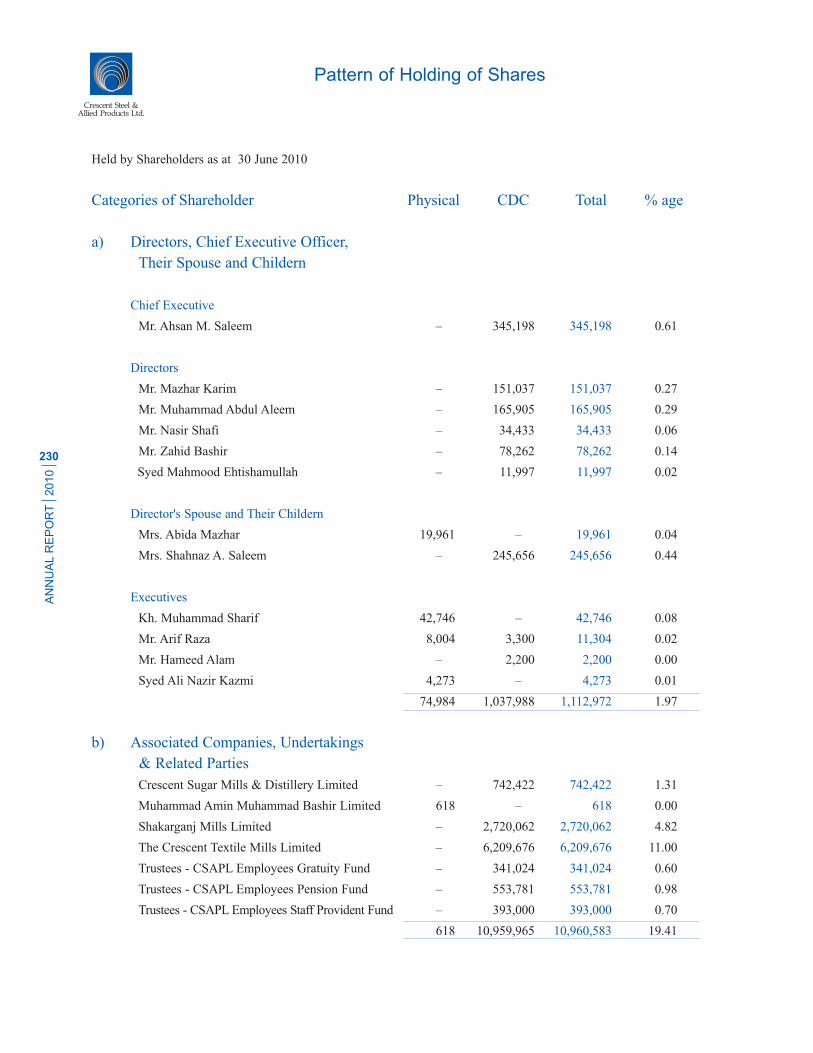
Held by Shareholders as at 30 June 2010
Categories of Shareholder Physical CDC Total % age
a) Directors, Chief Executive Officer,
Their Spouse and Childern
Chief Executive
Mr. Ahsan M. Saleem ––– 345,198 345,198 0.61
Directors
Mr. Mazhar Karim ––– 151,037 151,037 0.27
Mr. Muhammad Abdul Aleem ––– 165,905 165,905 0.29
Mr. Nasir Shafi ––– 34,433 34,433 0.06
Mr. Zahid Bashir ––– 78,262 78,262 0.14
Syed Mahmood Ehtishamullah ––– 11,997 11,997 0.02
Director's Spouse and Their Childern
Mrs. Abida Mazhar 19,961 ––– 19,961 0.04
Mrs. Shahnaz A. Saleem ––– 245,656 245,656 0.44
Executives
Kh. Muhammad Sharif 42,746 ––– 42,746 0.08
Mr. Arif Raza 8,004 3,300 11,304 0.02
Mr. Hameed Alam ––– 2,200 2,200 0.00
Syed Ali Nazir Kazmi 4,273 ––– 4,273 0.01
74,984 1,037,988 1,112,972 1.97
b) Associated Companies, Undertakings
& Related Parties
Crescent Sugar Mills & Distillery Limited ––– 742,422 742,422 1.31
Muhammad Amin Muhammad Bashir Limited 618 ––– 618 0.00
Shakarganj Mills Limited ––– 2,720,062 2,720,062 4.82
The Crescent Textile Mills Limited ––– 6,209,676 6,209,676 11.00
Trustees - CSAPL Employees Gratuity Fund ––– 341,024 341,024 0.60
Trustees - CSAPL Employees Pension Fund ––– 553,781 553,781 0.98
Trustees - CSAPL Employees Staff Provident Fund ––– 393,000 393,000 0.70
618 10,959,965 10,960,583 19.41
Crescent Steel & Allied Products Ltd.
Pattern of Holding of Shares
AN
NU
AL R
EP
OR
T
2010
230

Categories of Shareholder Physical CDC Total % age
c) NIT & ICP (Name Wise Detail)
National Invetment Trust Limited ––– 100,033 100,033 0.18
NBP - Trustee Department NI(U)T Fund ––– 3,907,841 3,907,841 6.92
––– 4,007,874 4,007,874 7.10
d) Banks, DFI's, NBFI's 2,445 8,240,391 8,242,836 14.60
e) Insurance Companies ––– 2,218,493 2,218,493 3.93
f) Modarabas & Mutual Funds 173 2,542,693 2,542,866 4.50
g) Other Companies 36,795 2,278,183 2,314,978 4.10
h) Non Residents
Islamic Development Bank 3,450,150 ––– 3,450,150 6.11
3,450,150 ––– 3,450,150 6.11
i) General Public
A. Local 687,021 20,922,220 21,609,241 38.27
B. Foreign ––– ––– ––– –
687,021 20,922,220 21,609,241 38.27
4,252,186 52,207,807 56,459,993 100.00
Shareholders More Than 10.00%
The Crescent Textile Mills Limited 6,209,676 11.00
Pattern of Holding of Shares
AN
NU
AL R
EP
OR
T
2010
231

Notice is hereby given that the 26th Annual General
Meeting of shareholders of Crescent Steel and Allied
Products Limited (the “Company”) will be held on
Tuesday, 31 August 2010 at 11:30 a.m. at Qasr-e-Noor,
9 E-2 Main Boulevard, Gulberg-III, Lahore to transact
the following business:
Ordinary Business
1. To receive, consider and adopt the Directors' and
Auditors' reports and Separate & Consolidated
Audited Financial Statements for the year ended
30 June 2010.
2. To approve and declare dividend. The Directors
have recommended final cash dividend @ Re.1.00
per share (10%). Together with the two interim
cash dividends @ Re.1.00 each per share already
paid, the total cash dividend for the year ended
30 June 2010 will thus amount to Rs.3.00 per
share (30%).
3. To appoint Company's auditors and fix their
remuneration.
BY ORDER OF THE BOARD
Muhammad Saad Thaniana
Company Secretary
Lahore: 29 July 2010
Notes
1. The Share Transfer Books of the Company will
remain closed from 25 August 2010 to 31 August
2010 (both days inclusive). Transfers received in
order at Share Registrar Office of the Company,
CorpTec Associates (Pvt) Limited, 7/3-G,
Mushtaq Ahmed Gurmani Road, Gulberg-II,
Lahore by the close of business on 24 August
2010, will be treated in time for the entitlement of
dividend to the transferees and to attend the
meeting.
2. A member entitled to attend and vote at this
meeting may appoint any other member as his/her
proxy to attend and vote instead of him/her.
3. The instrument appointing a proxy and the power
of attorney or other authority under which it is
signed or a notarially attested copy of the power
of attorney must be deposited at the Registered
Office of the Company at least 48 hours before the
time of the meeting.
4. Members who have deposited their shares into
Central Depository Company of Pakistan Limited
(“CDC”) will further have to follow the under
mentioned guidelines as laid down by the
Securities and Exchange Commission of Pakistan.
A. For Attending the Meeting
a. In case of Individuals, the account holder
and/or sub-account holder and their regis-
tration details are uploaded as per the CDC
Regulations, shall authenticate his/her
identity by showing his/her original CNIC
or, original Passport at the time of attending
the Meeting.
b. In case of corporate entity, the Board's
resolution / power of attorney with specimen
signature of the nominee shall be produced
(unless it has been provided earlier) at the
time of the Meeting.
B. For Appointing Proxies
a. In case of individuals, the account holder
and/or sub-account holder and their
registration details are uploaded as per the
CDC Regulations, shall submit the proxy
form as per above requirements.
b. The proxy form shall be witnessed by two
persons, whose names, addresses and CNIC
numbers shall be mentioned on the form.
Crescent Steel & Allied Products Ltd.
Notice of Annual General Meeting
AN
NU
AL R
EP
OR
T
2010
232

c. Attested copies of the CNIC or the passport
of beneficial owners and the proxy shall be
furnished with the proxy form.
d. The proxy shall produce his original CNIC
or original passport at the time of the
Meeting.
e. In case of corporate entity, the Board's
resolution / power of attorney with specimen
signature shall be furnished (unless it has
been provided earlier) along with proxy form
to the Company.
Statement under paragraph 3 of SRO 865(I)/
2000 dated 6 December 2000.
In EOGM dated 27 December 2006, shareholders
approved an additional investment of Rs.15.1
million in Crescent Textile Mills Limited. However,
to date no investment has been made against the
approval.
i. Reasons for not having investment made
The Company remained focused on its own
Textile Division rather than making investments
in Textile Sector.
ii. Major change in financial position of investee
company since the date of last resolution
There has been no major change in financial
position of the Crescent Textile Mills Limited.
Notice of Annual General Meeting
AN
NU
AL R
EP
OR
T
2010
233


I/We __________________________________________________________________________ , being member(s) of
Crescent Steel And Allied Products Limited and holder of _________________ Shares as per Folio No._________
CDC Participation ID # ______________________ and Sub Account # ______________________ do hereby appoint
_____________________________________ of _____________________________________ or failing him/her
_____________________________________ of _____________________________ as my/ our proxy to attend, speak
and vote for me/us and on my/our behalf at the Annual General Meeting of Crescent Steel And Allied Products Limited
scheduled to be held on Tuesday, 31 August 2010 at 11.30 a.m., at Qasr-e-Noor, 9-E-2, Main Boulevard, Gulberg-III,
Lahore. and at any adjournment thereof.
As witness my / our hand this _________________________ day of __________________________ 2010.
Notes:
1. A member entitled to attend and vote at a General Meeting is entitled to appoint a proxy.
2. The instrument appointing a Proxy, together with the Power of Attorney, if any, under which it is signed or a
notarially certified copy thereof, should be deposited at our Share Registrar Office of the Company, CorpTec
Associates (Pvt) Limited, 7/3-G, Mushtaq Ahmed Gurmani Road, Gulberg-II, Lahore, not less than 48 hours before
the time of holding the Meeting.
3. CDC account holders will further have to follow the under mentioned guidelines as laid down in circular # 1 dated
January 26, 2000 of the Securities & Exchange Commission of Pakistan for appointing Proxies:
i) In case of individuals, the account holder or sub-account holder and/or the person whose securities are in
group account and their registration details are uploaded as per the Regulations, shall submit the Proxy form
as per the above requirement.
ii) The proxy form shall be witnessed by two persons whose names, addresses and NIC numbers shall be
mentioned on the form.
iii) Attested copies of NIC or the passport of the beneficial owners and the proxy shall be furnished with the
proxy form.
iv) The proxy shall produce his original NIC or original passport at the time of the meeting.
v) In case of a corporate entity, the Board of Directors' resolution/Power of attorney with specimen signatures of
the proxy holder shall be submitted (unless it has been provided earlier) alongwith proxy form to the
Company.
Form of Proxy
Crescent Steel & Allied Products Ltd.
Please affix here
Revenue Stamp
of Rs. 5/-
________________Members’ Signature

www.crescent.com.pk