Embed Size (px)
Citation preview
PART-PEASANTS: INCOMPLETE RURAL–URBANLABOUR MIGRATION IN CHINA
YINYIN CAI* Southeast UniversityYEW-KWANG NG Nanyang Technological University
Abstract. The institutional settings in China, including the land allocation system and the householdregistration system, lead to a rural–urban labour migration pattern that differs from that in othercountries. Individual peasants’ labour is often split (typically over different times of the year) intotwo or more parts as a result of institutional factors. Individuals work both as peasants on the landand as temporary migrant workers in urban areas (or in rural non-agricultural sectors). We examinethis issue using province-level panel data. The present study provides a new interpretation of thephenomenon of labour shortages in coastal cities and rising rural migrant wages in China in recentyears, and discusses whether the Lewisian turning point has been reached. Under part migration, therural labour supply to urban areas is smaller than would be the case with full migration of workersto urban areas, so that the Lewisian turning point occurs earlier. This finding has important policyimplications for China’s future development.
1. INTRODUCTION
China’s ongoing economic growth has attracted much attention worldwide.Over the past decade China’s emergence as the factory of the world and as thelargest receiver of foreign direct investment has profoundly influenced globaltrade patterns and the competitive landscape. These successes stem partly fromChina’s comparatively low wage rates for workers. However, this advantagemay eventually be eroded, with wage rates increasing steadily in China (Yanget al., 2010) and the ‘labour shortage’ that has arisen in coastal cities since 2005(Zhang et al., 2011). Many argue that China has reached the ‘Lewis turningpoint’ (Lewis, 1954), where rural surplus labour is depleted to such a level thatcontinuing industrialization cannot be supported by cheap labour supply(Huang, 2010; Yao and Zhang, 2010; Li et al., 2012).
Empirical studies on this topic tend to follow two approaches: (i) the estima-tion of total labour supply and demand; and (ii) the estimation of rural migrantwage rates. For instance, Cai and Wang (2008) use an official estimate of ‘labourrequirements’ to argue that the pool of surplus labour in the Chinese country-side is now small. Zhang et al. (2011) find a clear rising trend in real wage ratesand predicate that the era of surplus labour is over. Knight et al. (2011) produceevidence of simultaneous surplus labour in rural areas and rising rural migrantwage rates in urban areas.
It is difficult to define and quantify rural surplus labour (Cao and Tisdell,1992). With an additional assumption of negligible transfer costs, the existence
*Address for Correspondence: School of Economics and Management, Southeast University,Jiulonghu Campus, Nanjing 211189, China. Email: [email protected]. We wish to thank two anony-mous referees for useful and constructive comments.
bs_bs_banner
Pacific Economic Review, 19: 4 (2014) pp. 401–422doi: 10.1111/1468-0106.12046
© 2014 Wiley Publishing Asia Pty Ltd
of rural surplus labour implies that non-agricultural sectors will have an unlim-ited supply of labour at a constant wage rate. In contrast, labour shortages incoastal cities and rising wage rates in non-agricultural sectors suggest the dis-appearance of surplus labour in agriculture (Cai and Wang, 2010). Normally, afully market-oriented economic system provides financial incentives for peas-ants to transfer from farming to non-farming activities and from rural to urbanareas. The transfer of surplus agricultural labour implies a relative decrease inthe agricultural population. Typically, when a peasant transfers from the agri-cultural sector he or she will be committed to another occupation, and no longerengage in agricultural production. This transfer is ‘complete’ for the individual.
Unfortunately, off-farm opportunities are inhibited by policy and institu-tional barriers in China, in contrast to a typical developed country. Without afree and open market, peasants do not have complete freedom to choose theiroccupations and places of residence (Cao and Tisdell, 1992). Given the difficul-ties encountered by rural residents in China in attaining permanent residencestatus in urban areas, a substantial portion of the labour flow is temporaryrather than permanent (Zhao, 1999). China’s land allocation policy and house-hold registration system effectively discourage rural households from movingcompletely out of agricultural production and away from their area of legalresidence (Hare, 2002). The household registration system still discriminatesagainst migrant workers, who normally receive only half of the wages of theirurban counterparts. The differences in social welfare benefits are even greater(Huang, 2010).
Labour migration is a strategy used by rural households in economicallyimpoverished areas to both increase and diversify their income (Hare, 2002).Although many peasants in China are (or are now more) likely to transfer fromagricultural jobs to non-agricultural jobs, many of them have not really left theland. Due to institutional factors, peasants have an incentive to continue toengage in farming part time (Brosig et al., 2009). Individuals work on the land andas temporary migrant workers in urban areas over different periods of the year.
If China’s rural–urban labour migration is, indeed, different from what istypical in other countries, the findings of many studies (based on the conventionalwisdom that the labour transfer is considered ‘complete’) may be weak. In thepresent paper we attempt to clarify an essential aspect of China’s rural–urbanlabour migration: Instead of complete migration, the labour of an individualpeasant is split (perhaps over different times of the year) into two or more parts.1
This may provide a new element in interpreting the phenomenon of China’slabour shortages in coastal cities and rising rural migrant wages in recent years,and in determining whether the Lewisian turning point has been reached. Inparticular, we argue that, under part migration, rural labour supply to urbanareas is smaller than would be the case with complete migration, meaning thatthe Lewisian turning point occurs earlier. The rest of the paper is organized asfollows. In Section 2 we briefly describe some institutional reasons for incompleterural–urban labour migration. Section 3 presents a simple theoretical model.
1 This topic is partly discussed in the literature (see Ortiz, 2002; Knight et al., 2011).
Y. CAI AND Y.-K. NG402
© 2014 Wiley Publishing Asia Pty Ltd
Section 4 provides a descriptive analysis and a multivariate regression analysis tofurther test incomplete rural–urban labour migration. Section 5 concludes. Datasources and adjustment procedures are described in the Appendix.
2. INSTITUTIONAL REASONS FOR INCOMPLETE RURAL–URBANLABOUR MIGRATION
There are some institutional factors that have hampered the full transfer ofpeasants to full-time urban work; instead they have led to peasants taking onmultiple occupations (i.e. working both on the land and as temporary migrantworkers in urban areas). The undertaking of multiple occupations (and theconsequent failure to transfer fully) is peasants’ response to institutional factors(including land policy, the hukou/household registration system and agriculturalsubsidies) and market conditions.
2.1. The household responsibility system
The household responsibility system (HRS) was introduced in rural China in1979 and by the end of 1983 it incorporated most of the country’s farminghouseholds (Lin, 1992); that year the change from the collective system to theindividual household-based farming system was largely complete. This markeda radical change in property rights and organization in agriculture, and, as abasic institutional arrangement for land ownership and an organizational formof agricultural production, the HRS has been retained until now. However, theHRS has not led to fully decentralized decisions for peasants: land ownershipremains vested in the village. The literature on the HRS and Chinese agriculturalgrowth is extensive (e.g. McMillan et al., 1989; Fan, 1991; Lin, 1992). Fewresearchers, however, have attempted to link these topics to the failure ofpeasants to transfer fully from agricultural jobs to non-agricultural jobs. Underthe HRS, land is divided into small plots and the production unit is the house-hold, which has a low level of specialization. Given the typically small plot sizes,agricultural machinery often cannot be used, leading to considerable labourdemand and tying peasants to the land. As a result, although peasants in Chinaare now more likely to transfer from agricultural jobs to non-agricultural jobs,many have not completely left the land.
2.2. The hukou system
The hukou (household registration) system is another important policy for peas-ants in China, which was established in 1955 and is still in place today. On itsestablishment, households were registered in the locale where they resided andwere categorized as either agricultural or non-agricultural households. With asharp differentiation of rights and privileges and extremely stringent conditionsfor converting from rural to urban status (Wu and Treima, 2004), the hukousystem has created a pronounced distinction in socioeconomic entitlementsamong Chinese citizens (Chan and Zhang, 1999).
INCOMPLETE RURAL–URBAN LABOUR MIGRATION 403
© 2014 Wiley Publishing Asia Pty Ltd
Today, the location of an individual’s household registration still makes asignificant difference. Urban residents are entitled to social welfare benefits,such as medical insurance, pensions, unemployment support and free (compul-sory) education, although most of these systems are still underdeveloped.Migrant workers cannot access these benefits, even if they have been working incities for years. Existing registration arrangements explain why rural Chinese donot transfer to urban work alone. On the one hand, it is difficult for peasants tochange their agricultural status and to access the same services as urban resi-dents, even if they have full-time jobs in cities. On the other hand, peasantscannot or will not completely give up the land, because of the HRS and thehukou system. Hence, an optimal choice may often be working part time in a cityand continuing agricultural production in a rural area.
2.3. Agricultural taxes (fees) and subsidies
Agriculture taxes have been levied since the establishment of the People’sRepublic of China and an agricultural tax law was formally put into force in1958. This tax was typically levied as a percentage of the production value of agiven land area, based on historical prices and yields. The average tax rate(including agricultural tax surcharges) as a share of actual agricultural produc-tion value fluctuated between 2 and 15% from year to year. In 1950, revenuesfrom agriculture tax made up almost 40% of China’s total tax revenue. Thisshare has been declining continuously, falling to approximately 5.5% in 1979and to less than 1% by 2004 (Lei, 2012). The central government enacted thetax-for-fee reform in 2002 that abolished local fees levied on individuals andrural households in favour of a single agricultural tax. In addition, the centralgovernment removed the agricultural tax in 2006.
For Chinese farmers who have for centuries been paying taxes based on theirnumber of family members and their crop-land acreage, the new policy is awelcome relief.2 Besides the tax exemption, the Chinese Government has alsoimplemented a series of agriculture-friendly policies to boost the rural economyand increase farmers’ income, including direct subsidies for grain growers andmore subsidies for farmers to buy improved crop strains, agricultural machineryand tools (Xing, 2005). The aim of these subsidies is to reduce the input costs tofarmers and to prevent farmers from reducing the use of industrial materials asintermediate inputs of agricultural production when their prices are high.3 The
2 We regard the absence of any tax/rent on the use of land as a distortion, although it could offsetother distortions; it is still better to remove other distortions such as the control of agricultural pricesand limits on land use.3 Normally, the government thinks that farmers will reduce the use of intermediate inputs (consist-ing mainly of industrial products like fertilizers) of agricultural production when their prices arehigh, and agricultural production will be reduced. To stabilize agricultural production, the govern-ment will provide some subsidies to peasants when the prices of these inputs rise. These kinds ofsubsidies are usually temporary. In fact, they are related to the government’s price control ofagricultural products, with no price control of industrial materials used as intermediate inputs foragricultural production.
Y. CAI AND Y.-K. NG404
© 2014 Wiley Publishing Asia Pty Ltd

major instrument of subsidy is linked to purchased farm inputs such as fuelsand fertilizers. This subsidy is officially referred to as the ‘comprehensive directsubsidy to agriculture production materials’ by the Chinese Government.
With the abolishment of agricultural taxes and the introduction of agricul-tural subsidies, farmers have been more reluctant to leave their land.
2.4. Market conditions in the presence of government intervention
During the reform period, the government focused on the reform of productmarkets, including abandoning policy interventions in domestic markets andliberalizing trade in goods and services. Today, prices of more than 95% ofproducts are determined in free markets. In contrast, factor markets, includingmarkets for labour, capital, land, energy and the environment, remain highlydistorted. For instance, many urban jobs are available only to those with localurban residency; discrimination against migrant workers is common, with bigdifferences existing in remuneration and working conditions. Outside the prop-erty sector, land prices are artificially determined by the government. For thosewho can get easy access to factors of production, these distortions generallypush factor prices and, therefore, production costs below levels that otherwisewould be present in a free market. However, the effective prices for other peopleare made higher by these distortions.4
China is known for its abundant cheap labour, a key factor behind its successin labour-intensive manufacturing exports. However, labour costs in Chinamay be distorted, for two interrelated reasons: the segmentation of rural andurban labour markets, and the underdevelopment of social welfare systems. Thelabour costs of migrant (rural) workers are cheaper than those of local (urban)workers.
It may be supposed that because many price controls for agricultural productsare in the form of price ceilings (such as tobacco and grains) rather than pricesupports, they should encourage or at least not discourage peasants frombecoming full-time urban workers. The situation is more complicated. Thelower prices for agricultural products discourage peasants from becoming large-scale producers through the use of land merging and large tractors. This, in fact,locks more peasants into farming, at least part time. If product prices werehigher, some peasants would be able to buy land from others (or even just theusage rights), releasing the sellers to migrate fully to urban areas.
According to the above, the undertaking of multiple occupations is theresponse of peasants to institutional factors and market conditions. Instead ofcomplete migration, the labour of an individual peasant is often split (perhapsover different times of the year) into two or more parts.
4 Therefore, in our view, it makes more sense to liberalize agricultural prices rather than cancelagricultural taxes.
INCOMPLETE RURAL–URBAN LABOUR MIGRATION 405
© 2014 Wiley Publishing Asia Pty Ltd

3. A SIMPLE MODEL
The above discussion can be formalized by a simple model of a representativepeasant household. For simplicity, we assume that all members of the repre-sentative peasant household are regarded as a person whose name is Zhang San.
First, we consider the farm production of the representative peasant house-hold. Output, y, is produced with land, R, labour, L, and other inputs, xi,according to a production function:
y f R L x x xn= ( ), , , , , .1 2 � (1)
The prices of land, labour and other inputs are denoted as pR, pL and pi,respectively. The total cost for this representative production unit by Zhang Sanis given by:
c p R p L p xR L i ii
n
= + +=∑
1
. (2)
Denoting the price of y as py and the profit of his farm production as π, wehave the profit function:
π = −p y cy . (3)
Second, we consider Zhang San’s labour (time) allocation. We assume thatZhang San’s utility function depends on his total income (from his own farmand from working outside) and leisure only. He does not care whether he worksfor himself or for others.5
Thus, denoting m = (money) income and λ = leisure, he maximizes
U m, ,λ( ) (4)
where
m p y c wLy m= − + (5)
λ = − −1 L Lm, (6)
where w is the prevailing market wage rate which Zhang San takes as given, andLm is the amount of time he works in non-agricultural sectors. L is the amountof time he works for his own farm; λ is his leisure time. This is thus formulatedas a simple maximization problem and he chooses xi for all i, L and Lm tomaximize U, giving the following first-order conditions:
5 This simplifying assumption is not really needed as utility maximization by an owner–managerimplies profit maximization for his or her firm/farm with the appropriate definitions of wages andprofits (see Ng, 1974).
Y. CAI AND Y.-K. NG406
© 2014 Wiley Publishing Asia Pty Ltd
pyx
pyi
i∂∂
⎛⎝⎜
⎞⎠⎟ = (7)
for all i, the condition for profit-maximization usage of all intermediate inputs.
pyL
Um
Uy
∂∂( ) ∂
∂( ) = ∂∂λ
, (8)
the optimal income/leisure condition for working in one’s own farm.The peasant allocates his total available amount of time (normalized to one
unit) between leisure, λ, time working on his farm, L, and time working foroutside wage income, Lm. The optimal balance between L and Lm requires the
first-order condition p pyL
L y= ∂∂( ); the optimal balance between L and λ requires
equation 8. Thus, pyL
y∂∂( ), the value of marginal product of labour, in equation
8 may also be replaced by pL(= w):
wUm
U∂∂
⎛⎝
⎞⎠ = ∂
∂λ, (9)
the optimal income/leisure condition for working outside.
From equations 8 and 9, we may also derive: pyL
wy∂∂
⎛⎝
⎞⎠ = , the max-profit
self-employment condition. Assume that the amount of land, R, is predeter-mined for Zhang San (such as by the village leaders (see Benjamin and Brandt,2002)). For any given amounts of other inputs used, we can adopt a geometricdescription for the determination of labour or time allocation.
In Figure 1, the fixed amount of time (e.g. 1 year) is measured along thehorizontal axis. This total amount of time, normalized to one unit, could beused for working in his own farm, working in the market, or for leisure:
1 = L + Lm + λ. pyL
y∂∂
⎛⎝
⎞⎠ represents the value of marginal product of labour;
and∂∂
∂∂
U Umλ represents the marginal value of leisure (with the amount of
leisure measured from right to left). From the viewpoint of a single household,the market price of labour, pL, is given in a competitive market, with w as theprevailing wage rate. pL can be found by making the dotted horizontal price linein Figure 1 passing through w. The corresponding value of the vertical axis willbe pL.
Because we are analysing the situation of multi-occupational choices, we mayassume that the value of the marginal product of Zhang San’s labour if hespends all non-leisure time working in his farm is lower than the prevailing wagerate, w. This is also likely to prevail in most cases in China given the small plotsof land. Then, Zhang San can choose how much time to spend working (either
INCOMPLETE RURAL–URBAN LABOUR MIGRATION 407
© 2014 Wiley Publishing Asia Pty Ltd

on his own farm or outside) and how much leisure time he should have. Giventhis leisure–income choice, the amount of time available for work is given atL + Lm.
Let υ denote the wage income of Zhang San outside his own farm. We have:
υ = wLm. (10)
Simultaneously, Zhang San receives an income (consisting of both hisnotional farm wages and profits) that depends on farm production given by
η = ( ) − ( )p y R L x x x e R x x xy n n, , , , , , , , , ,1 2 1 2� � (11)
where wL (the amount of wages Zhang San notionally pays himself) is notincluded in the expenditure function, e (the expenditure for farm production ofZhang San); it is included in η. To quantify the amounts of these two types oflabour, we introduce a concept to analyse the problems associated with multipleoccupations: the degree of multiple occupations (DMO). Suppose θ denotes
DMO for any peasant, then we have θ =+L
L Lm
m
, 0 ≤ θ ≤ 1, where L denotes the
labour devoted to agricultural production (the quantity of farm labour), Lm
denotes the peasant’s quantity of labour in non-agricultural sectors (the out-side labour market). A θ closer to 1 implies that more labour is allocated tonon-agricultural production, and a θ closer to 0 implies that more labour is
∂y ∂U∂l
∂U
∂m
l
∂Lpy
w
LTotal time (labor)
Lm
Figure 1. Leisure–income choice and labour allocation
Y. CAI AND Y.-K. NG408
© 2014 Wiley Publishing Asia Pty Ltd

allocated to agricultural production. θ = 1 means that the peasant no longerengages in agricultural production, and θ = 0 means the peasant is a purepeasant. However, data for the relevant amounts of θ are not available so we usea proxy for θ:
θ υυ η
=+
≈+
LL L
m
m
. (12)
The approximate equality above needs not hold exactly unless the hourlyincome from working on the land is the same as that for working outside.However, we are mainly concerned with the proportionate allocation of labourbetween these two main categories and the changes in this proportion. Hence,approximation should be acceptable. The last expression in equation 12 is animportant expression for our empirical study, because the data for υ (outsidelabour income) and η (agriculture income) are easily obtained.
Since pyx
pyi
i∂∂
⎛⎝⎜
⎞⎠⎟ = , p
yL
wy∂∂
⎛⎝
⎞⎠ = , we have an equation for L,
L g p w p Ly i= ( ), , , . (13)
Equation (13) implies that the effect of a change in prices or a change in wagerates is to change the quantity of farm labour (L, which is allocated for agricul-tural production). This can, therefore, be used to provide a measure of DMOattributable to the change in prices of input and output vectors and the increasesin the prevailing wage rates.
Obviously, equation 13 has a price component. py is the output prices vector,which is determined by the agricultural product market. The price indices forfood may be appropriate for measuring py. pi is the other input prices vector,except land and labour, and the price indices of agricultural means of produc-tion may be appropriate for measuring pi. Under the HRS, agricultural taxes(fees) might be an important influence on L. In regards to agricultural taxes, ageometric presentation is useful:6 see Figure 2, where r represents the agricul-tural tax rate.
In the presence of agricultural taxes, the net-of-tax value of marginal labour
product by Zhang San, pyL
ry∂∂
−( )1 , will shift downward at every point. There-
fore, the agricultural tax will increase the degree of peasants’ multiple occu-pations, because ΔLm > 0. The tax makes a peasant less willing to work inagriculture and more willing to supply labour to the city (non-agriculturalsectors). The removal of taxes and the subsidies, the hukou system and the landpolicy have the reverse effect of encouraging the peasants to keep working onthe land.
6 In our opinion, the household responsibility system (HRS) in contemporary China is similar toshare tenancy (sharecropping). The peasants are the tenant and the state is the land owner. A portionof every output unit produced is taken away as the agricultural taxes (fees) by the land owner(government). This is no longer the case as the agricultural tax was abolished in 2006.
INCOMPLETE RURAL–URBAN LABOUR MIGRATION 409
© 2014 Wiley Publishing Asia Pty Ltd

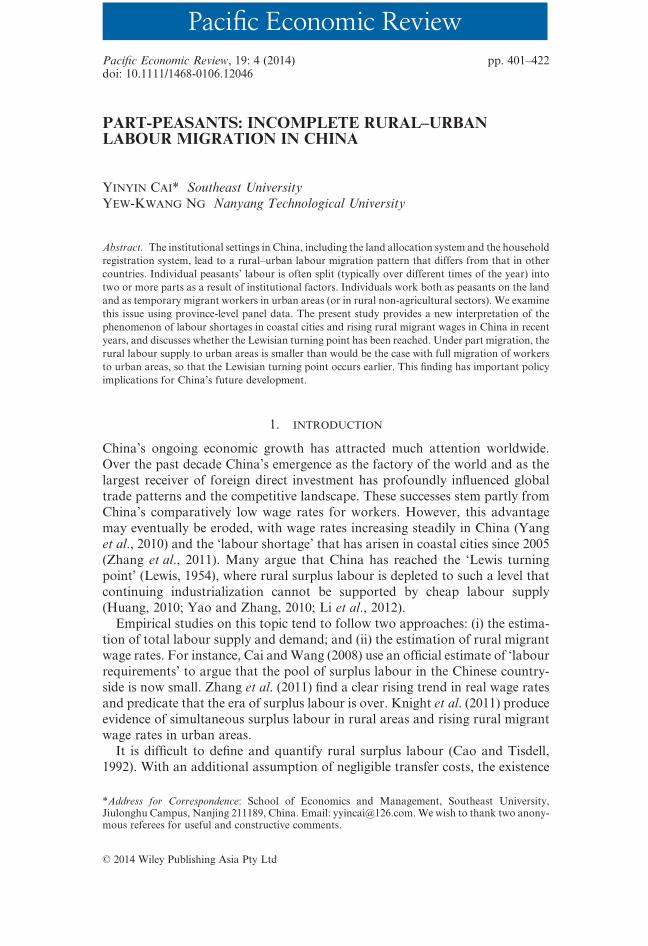
The undertaking of multiple occupations by peasants may lead to an earlyand distorted Lewisian turning point. Let us assume that the total populationworking in agriculture is N, and everyone has a given amount of labour L + Lm
at the wage rate w (here, we assume, consistent with the Lewisian analysis, thatthe prevailing market wage rate, w, equals the minimum subsistence level ofwages, w). The market labour supply in the rural sector (to both agricultural andnon-agricultural production) is N(L + Lm). However, according to traditionalanalysis assuming full migration, if N*, the number of peasants working full-time in agricultural production, just satisfies the demand for labour in theagriculture sector, the amount of labour supplied in the rural sector to non-agricultural production is (N − N*)(L + Lm).7 Accordingly, the Lewisian turningpoint will emerge at a point when market demand for non-agricultural labour atw equals NLm < (N − N*)(L + Lm), as shown in Figure 3. This figure shows the
7 In fact, it seems more appropriate that N represent rural labour, rather than the ‘total populationworking in agriculture’. To compare two types of rural–urban labour migration, we denote N as thetotal population working in agriculture. If rural–urban labour migration is complete, it implies thatN − N* people transfer to the non-agricultural sector. In this mode, the main body of transfer ispopulation rather than labour. In contrast, if rural–urban labour migration is incomplete, it impliesthat the main body of transfer is labour rather than population. It would be N persons transfer a partof labour (Lm) to the non-agricultural sector. If we denote N as the rural labour, it will be inappro-priate in that the implication is incomplete. Moreover, Lm here refers to non-agricultural labour; itcontains rural labour supply to the urban sectors and those working in rural non-agriculturalproduction.
∂y∂L
py
∂y∂L
py
∂y∂L
py
w
(1−r)
∂U∂l
∂U
∂m
L ΔLm
Lm
lTotal time (labor)
Figure 2. Agricultural taxes and labour allocation
Y. CAI AND Y.-K. NG410
© 2014 Wiley Publishing Asia Pty Ltd

market supply of rural labour outside agricultural production (mainly to theurban areas) and the market demand for such labour.8 In Figure 3 we assume,consistent with the Lewisian analysis, that a minimum subsistence level ofwages, w, is needed to induce the potential excess amount of labour (Lm inFig. 1) to be effectively supplied to the urban sector. Thus, the market supplycurve S has a horizontal section at w.
A remarkable difference between multiple occupations and labour transferfrom one sector to another is this: The former implies that an individual peasantis divided into two or more parts and inputted in both the rural and urbansectors;9 the latter means that some peasants transfer to the urban sector andengage in a new job, and an individual person is not divided between two ormore jobs.
With incomplete rural–urban labour migration, the amount of labour surplusin the agricultural sector may be different. At L, Zhang San’s farm productioncan achieve profit maximization, and surplus labour for him is Lm at the wagerate w. If N is composed of people like Zhang San, the labour supply from therural sector to the urban area is NLm. Because of lower specialization andinefficiency, NLm will be less than (N − N*)(L + Lm). In what follows we discussthe concept of an effective labour supply. Having multiple occupationsmay reduce the effective labour supply in two ways. First, when switchingfrom one occupation to another one may incur costs of job conversion. Second,gains from specialization are not exploited. Because workers with multipleoccupations need to participate in different production activities, they hardly
8 More accurately, the market demand shown in Figure 3 is the total market demand in urban areasfor labour from the rural areas, and the total market supply of rural labour to the urban areas(ignoring the minor non-agricultural production in the rural areas).9 Although the rural areas also provide some non-agricultural jobs, most peasants seeking such jobsover the past one or two decades have migrated (either fully or partly over certain periods of theyear) to urban areas. Thus, for simplicity, we ignore the minor non-agricultural employment in therural areas.
Wage rate
(N−N*)(L+Lm) Quantity of labor
D1
w3
w
D2 D3 S
Figure 3. Lewisian turning point in the absence of institutional factors
INCOMPLETE RURAL–URBAN LABOUR MIGRATION 411
© 2014 Wiley Publishing Asia Pty Ltd

concentrate on any particular job. Hence, the view of NLm < (N − N*)(L + Lm)may be reasonable. There are a number of reasons accounting for this.
First, the degree of specialization (inclusive of learning-by-doing effects) islower under multiple occupations, reducing the productivity of labour in therural sector, leading to the use of more labour for any given level of output.Second, because the mobility of temporary workers is very high, employershave low incentives to invest in the training of these workers, leading to lowlabour productivity and a reduction (in comparison to what would have been)in effective labour supply. Third, the costs of transporting workers betweenrural and urban areas are not only high in money terms, but also high interms of time, reducing the availability of the amount of labour time for actualworking.
In addition, the value of N* will be lower in the absence of institutional factors(including the land policy, the hukou system and agricultural subsidies). First,the small plot of land allocated to each peasant household and the absenceof full ownership (hence, the difficulties in buying and selling of land) makesefficient large-scale production with large tractors difficult. This lowers produc-tivity per worker and locks a great deal of labour into the land. Second, thehukou system discourages peasants from migrating fully to cities and the enti-tlement to land under HRS encourages them to remain, at least partly, aspeasants. Third, agricultural subsidies and the cancellation of the agriculturaltax in 2006 further encourage peasants to remain on the land. Consequently, theLewisian turning point will emerge early, at point NLm, as shown in Figure 4.However, the point NLm is not the Lewisian turning point that would occur inthe absence of certain institutional factors (including land policy, the hukousystem and agricultural subsidies).
Under part migration (incomplete labour migration of individuals, withpeasants working both in agricultural and non-agricultural sectors concur-rently), rural labour supply to urban areas is smaller than that under complete
Wage rate
w3'
w3
w
Quantity of laborNLm
D1 'D2
D2 D3'S
S
Figure 4. Lewisian turning point with incomplete rural-urban labour migration
Y. CAI AND Y.-K. NG412
© 2014 Wiley Publishing Asia Pty Ltd

migration.10 Therefore, the institutional factors that discourage peasants frommigrating fully to urban areas will inhibit economic development in China in thefuture.
4. EMPIRICAL ANALYSIS
The main purpose of the theoretic model in Section 3 is to explain the mecha-nism of peasants’ undertaking of multiple occupations. Under the given condi-tions (including HRS and hukou system), peasants tend to choose part-timefarming. They work both as a peasant on the land and as a temporary migrantworker in urban areas (or in rural non-agricultural sectors). If the theoreticmodel is is consistent with the practical situation, we may observe (or capture)some empirical macroeconomic phenomena as described (or predicted) in themicro-model.
This section focuses on illustrating two issues:
1 The part-peasant scenario is widespread in China. Individuals divide theirtime working on the land and as temporary migrant workers in urban areas.
2 We demonstrate that China is already at or past the turning point NLm inFigure 4. This is still a Lewisian turning point, except that it is reached earlierdue to the absence of full migration.
Data on peasants’ income is sourced from the Organization of Rural Socio-Economic Survey; these data are reported in the China Rural Statistics Year-book. The use of this data to calculate DMO is appropriate for the followingreasons:
1 In each province, rural households were randomly chosen.2 The subjects of the survey are members of the rural resident population who
normally live in the rural home for the whole year or at least more than6 months in a year and are integrated with people in the locality. However, thedefinition of ‘resident population’ is not followed very strictly by the statisticalbureau as those who return to work on the farm only during busy times maybe included even if they work away for more than 6 months. Governmentemployees and retired persons living in the local households are included, butthose living elsewhere are not.
3 The incomes of the subjects surveyed are classified into four types: wageincomes, household business incomes, transfer incomes and asset incomes.Wage incomes denote incomes from selling labour by rural residentsemployed by units or individuals (both in urban areas and in rural areas).Household business incomes denote incomes of rural residents from working,planning and managing household business units, mainly in agricultural pro-duction. Thus, the survey data for provincial peasant incomes provided in the
10 However, we are not concerned with other possible reasons for reductions in the labour supplysuch as population aging (as analysed by, for example, Peng, 2008).
INCOMPLETE RURAL–URBAN LABOUR MIGRATION 413
© 2014 Wiley Publishing Asia Pty Ltd

China Rural Statistics Yearbook may be used to reflect the peasant incomesof the representative peasant household of that province, consistent with themodel here.
Consequently, according to equation 12, we calculate the θ of peasants for31 provinces in mainland China during 2001–2010, as shown in Figure 5,where θ = Wages Income/(Wages Income + HPCNI)11 and HPCNI = House-hold per Capita Net Income from Agricultural Production and Other Correla-tive Sources.
From Figure 5, we can see that the DMO of many provinces are higher than0.2 in most of the past decade (2001–2010), with the average around 0.4 (0.3917to be exact). For many provinces, a significant proportion of peasants’ incomeis wages from outside work. In other words, at the provincial level, the under-taking of multiple occupations is widespread. This implies that the labour of anindividual peasant is split into at least two parts, and the share of labour forwork outside the farm is significant.
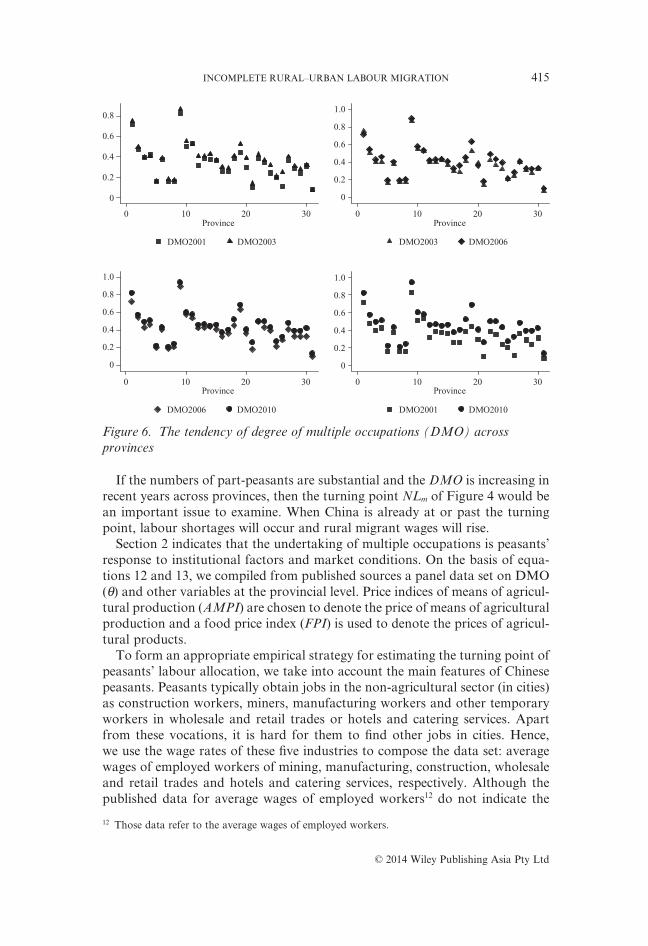
In addition, the growth tendency of DMO across provinces is obvious, asshown in Figure 6. Over the past 10 years, the DMO of 31 provinces is abso-lutely increasing. This suggests that the proportion of peasants’ wage incomeis increasing over these 10 years. Certainly, in shorter intervals, the DMO stilltend to increase (see Figure 6, DOM2001–2003, 2003–2006 and 2006–2010,respectively).
11 Corresponding to equation 12, υ = wages income and η = household per capita net income fromagricultural production and other correlative sources.
0
0.2
0.4
0.6
0.8
1.0D
egre
e of
mul
tipl
e oc
cupa
tion
s
0 10 20 30
Province
Figure 5. Degree of multiple occupations (DMO) across the provinces
Y. CAI AND Y.-K. NG414
© 2014 Wiley Publishing Asia Pty Ltd
If the numbers of part-peasants are substantial and the DMO is increasing inrecent years across provinces, then the turning point NLm of Figure 4 would bean important issue to examine. When China is already at or past the turningpoint, labour shortages will occur and rural migrant wages will rise.
Section 2 indicates that the undertaking of multiple occupations is peasants’response to institutional factors and market conditions. On the basis of equa-tions 12 and 13, we compiled from published sources a panel data set on DMO(θ) and other variables at the provincial level. Price indices of means of agricul-tural production (AMPI) are chosen to denote the price of means of agriculturalproduction and a food price index (FPI) is used to denote the prices of agricul-tural products.
To form an appropriate empirical strategy for estimating the turning point ofpeasants’ labour allocation, we take into account the main features of Chinesepeasants. Peasants typically obtain jobs in the non-agricultural sector (in cities)as construction workers, miners, manufacturing workers and other temporaryworkers in wholesale and retail trades or hotels and catering services. Apartfrom these vocations, it is hard for them to find other jobs in cities. Hence,we use the wage rates of these five industries to compose the data set: averagewages of employed workers of mining, manufacturing, construction, wholesaleand retail trades and hotels and catering services, respectively. Although thepublished data for average wages of employed workers12 do not indicate the
12 Those data refer to the average wages of employed workers.
0
0.2
0.4
0.6
0.8
0 10 20 30Province
DMO2001 DMO2003
0 10 20 30Province
DMO2003 DMO2006
0
0.2
0.4
0.6
0.8
1.0
0
0.2
0.4
0.6
0.8
1.0
0
0.2
0.4
0.6
0.8
1.0
0 10 20 30Province
DMO2006 DMO2010
0 10 20 30Province
DMO2001 DMO2010
Figure 6. The tendency of degree of multiple occupations (DMO) acrossprovinces
INCOMPLETE RURAL–URBAN LABOUR MIGRATION 415
© 2014 Wiley Publishing Asia Pty Ltd

wages of part-peasants directly, employers usually set temporary wages withreference to the average wages of employed workers so the use of this data isappropriate.13
Thus, we consider estimating
% % %
%
, , ,
,
Δ Δ Δ
Δ
θ β γ
δ κ μi t i t i t
i t AT i
p w
D
= +
+ ( ) + + +∑∑
∑ unearned-income ΔΔei t, ,(14)
where β, δ, γ and κ are parameters to be estimated, μi is an unobservedhousehold component that is fixed over time, and Δei,t is the error term. %Δx
meansΔxx
×100%, the percentage change of each variable. pi denotes the price
factors, including AMPI and FPI. wi denotes the wage rate that peasants canobtain in the non-agricultural sector, including mining (MW), manufactur-ing (MFW), construction (CW), wholesale and retail trades (WRTW), andhotels and catering services (HCSW). Unearned income includes governmentpayments (transfer payments), rents and interest from assets.
DAT is a dummy variable of agriculture tax,
Dt
tAT =
≤≥
⎧⎨⎩
1 2005
0 2006
,
,
where t represents the year.Some unearned income may influence the allocation of labour between agri-
cultural production and non-agricultural production, such as transfer payments(agricultural subsidies, AS) and property income (PI),14 although this incomehas nothing to do with farm production. Therefore, as a vector of controlvariables we put unearned income in the estimation equation. Unearned incomeincludes transfer payments and property income, data on which are provided bythe State Statistical Bureau, and can be taken directly from the China RuralStatistical Yearbook.
The full sample regression results from three different specifications of equa-tion 14 are shown in Table 1. Column (1) shows results from the pooled cross-section regression. Columns (3) and (5) present results from random-effects andfixed-effects estimation, respectively. Columns (2), (4) and (6) list results fromthree types of regression that eliminate the insignificant variables.
13 In fact, using migrant workers’ wages in equation 14 could be more precise than using urbanwages. Unfortunately, China does not report the data of migrant workers’ wages separately.In official statistics, the terms ‘urban wages’ and ‘migrant workers’ wage’ are often used inter-changeably and they show up in equal proportion. Here, we use ‘urban wages’ uniformly to replace‘migrant workers’ wage’. This strategy can help us to approximate the wages of part-peasants.14 In China, transfer payments are usually in the form of agricultural subsidies issued by the centralgovernment and depend on the amount of farm production. For a peasant household, propertyincomes mainly include rent and interest from assets (usually agricultural production materials).Hence, this kind of income may relate to an individual’s farm production profits.
Y. CAI AND Y.-K. NG416
© 2014 Wiley Publishing Asia Pty Ltd

The choice among these specifications depends on the nature of the unob-served province heterogeneity. Pooled cross-section yields unbiased resultsin the absence of province unobservables, random effects if the provinceunobservables are uncorrelated with the regressors and fixed effects if the prov-ince unobservables are correlated with the regressors. Considering unobservableprovince characteristics are likely to affect the estimation of DMO, random-effects or fixed-effects methods of estimation are most appropriate. Comparisonof the results of the random-effects and fixed-effects specifications leads us tofavour the fixed-effects specification (according to the Hausman test). Regard-less, all specifications in Table 1 provide similar results regarding the turningpoint of labour allocation.
There are significant coefficients for price components AMPI and FPI,wage components MFW and CW, control variable PI, the dummy variable of
Table 1. Degree of multiple occupations response to the price indices, wages,agriculture tax and other income
Explanatoryvariable
Dependent variable: %Δθ
Pooled cross-section Random effects Fixed effects
(1) (2) (3) (4) (5) (6)
%ΔAMPI 0.188**(0.074)
0.175**(0.067)
0.194**(0.075)
0.178***(0.068)
0.238**(0.088)
0.224***(0.078)
%ΔFPI −0.640***(0.107)
−0.640***(0.107)
−0.645***(0.107)
−0.642***(0.107)
−0.684***0.108
−0.682***(0.108)
%ΔMW −0.017(0.021)
−0.017(0.021)
−0.021(0.022)
%ΔFW 0.164**(0.066)
0.141**(0.054)
0.167**(0.065)
0.142***(0.054)
0.193***(0.070)
0.174**(0.063)
%ΔCW 0.116***(0.019)
0.113***(0.015)
0.114***(0.019)
0.112***(0.015)
0.099***(0.019)
0.097***(0.015)
%ΔWRTW −0.077(0.129)
−0.075(0.129)
−0.062(0.122)
%ΔHSCW 0.023(0.049)
0.023(0.049)
0.025(0.046)
%ΔPI −0.001***(0.000)
−0.001***(0.000)
−0.001***(0.000)
−0.001***(0.000)
−0.001***(0.000)
−0.001***(0.000)
%ΔAS −0.000(0.000)
−0.000(0.000)
−0.000(0.000)
Agricultural tax −2.065*(1.060)
−2.104*(1.013)
−2.072*(1.061)
−2.107**(1.014)
−2.124*(1.075)
−2.165**(1.036)
Constant 5.166***(2.793)
4.371***(0.937)
5.138***(1.779)
4.363***(0.929)
4.851***(1.521)
4.166***(0.937)
Province dummy No no No No Yes YesHausman test 18.44 (P = 0.048)Observations 279 279 279 279 279 279R2 0.189 0.184 0.182 0.177 0.185 0.180
Note: *Significant at 10% level. **Significant at 5% level. ***Significant at 1% level. The method of pooledcross-section estimation is ordinary least squares (OLS). The method of random-effects estimation isgeneralized least squares. The method of fixed-effects estimation is OLS. The province dummy variablesare included in fixed-effects estimations but not reported. Standard errors are in parentheses. Standarderrors for the pooled cross-section estimates are calculated using the Huber–White estimator of variance.Source: See the Appendix.
INCOMPLETE RURAL–URBAN LABOUR MIGRATION 417
© 2014 Wiley Publishing Asia Pty Ltd

agricultural tax and the constant. According to Figures 1 and 4, if the quantityof labour demanded (such as indicated by D1 in Fig. 4) in cities (non-agriculturalsectors) is smaller than NLm at w (for Zhang San, this implies that the realamount of time he works in the outside labour market is smaller than Lm), citiesreceive unlimited labour supply at an unchanged wage rate, and the coefficientsof wage components will be insignificant. Conversely, if the quantity demandedof labour in cities equals (or is bigger than) NLm (for Zhang San, it implies thatthe real amount of time he works in the outside labour market equals (or isbigger than) Lm), the coefficients of price and wage components will be signifi-cant. Hence, we determine that China is already at or past the turning point NLm
in Figure 4. This explains the rising wages and labour shortages in coastal citiesin China in recent years (Yang et al., 2010; Zhang et al., 2011). Peasants adjustthe ratio of agricultural labour according to the relevant wage rates and prices.For example, a 1% increase in the average wages of manufacturing (MFW)causes a 0.17% increase in DMO. A 1% increase in FPI causes a 0.68% reductionin DMO. An inverse relationship between DMO and FPI is expected. WhenFPI rises, peasants receive more rewards for their output and they will beincentivized to add more agricultural inputs. They achieve this addition throughsubstituting more man-hours from other occupations into agriculture. There-fore, the degree of multiple occupation, DMO, decreases.
The coefficients of PI are significant in three specifications, but the magnitudeis negligible. Unexpectedly, none of the coefficients of AS is significant, and themagnitude is negligible. This result may be surprising. Agricultural subsidiesmean lower costs or higher net revenue in agricultural production, so why dothey have no influence on DMO? We speculate that agricultural subsidies arebetter able to lock peasants into staying on the land, and dissuade peasantsfrom increasing investment in agricultural production. Agricultural subsidiesare unearned income for peasants, which do not change the real relation-ship between inputs and outputs in the agricultural production function.Agricultural subsidies mean higher incomes with an unchanged agriculturalproduction function. Hence, labour allocation between the agricultural andnon-agricultural sectors is consistent with the previous agricultural productionand is not influenced by agricultural subsidies.
Focusing on the dummy variable of agricultural tax, we note that all thecoefficients on it are negative. This is another unexpected result. As is evident inFigure 2, the existence of agricultural taxes may increase DMO and the sign shouldbe positive. However, the observed result is opposite. In fact, agricultural taxes aresimilar to agricultural subsidies. They are both of fixed amounts irrespective ofwhether you are farming or not. Agricultural taxes mean higher costs or lowernet revenue in agricultural production, and peasants seemingly prefer to allocatemore labour to agricultural jobs while maintaining revenue maximization in agri-cultural production. Consequently, the existence of agricultural taxes reducedDMO and the abolition of agricultural taxes eliminated this influence.
To examine the turning point of labour allocation in earlier years, we dividethe sample into two groups based on the key year 2006. Two findings are worthmentioning. First, the turning point of labour allocation was also reached
Y. CAI AND Y.-K. NG418
© 2014 Wiley Publishing Asia Pty Ltd

during 2002–2005,15 because the coefficients of FPI and CW are significantsimultaneously. This implies that we may observe the phenomena of risingwages and labour shortages in these 4 years. Zhang et al. (2011) find a clearrising trend in real wage rates from 2003 that supports this viewpoint. Second,the influence of FPI on DMO is bigger in 2002–2005 than in 2006–2010.This suggests that the importance of agricultural production for peasants isdecreasing (Table 2).
5. CONCLUSION
The institutional settings in China, including the land allocation system andthe household registration system, have led to a rural–urban labour migration
15 In our opinion, if the coefficients of any urban wages are significant, we consider that the turningpoint of labour allocation has been reached. At least, it can indicate that the turning point of labourallocation appears in this industry.
Table 2. Degree of multiple occupations response to the price indices, wages,agriculture tax and other income (two phases: 2002–2005, 2006–2010)
Explanatoryvariable
Dependent variable: %Δθ
2002–2005 2006–2010
Random effects(1)
Fixed effects(2)
Random effects(3)
Fixed effects(4)
%ΔAMPI 0.094(0.193)
0.098(0.203)
0.091(0.073)
0.146**(0.067)
%ΔFPI −1.102***(0.241)
−1.074***(0.226)
−0.324**(0.131)
−0.423***(0.119)
%ΔMW 0.027(0.053)
0.025(0.071)
−0.041(0.040)
−0.070**(0.032)
%ΔAMFW 0.033(0.154)
0.248(0.220)
0.237**(0.104)
0.242**(0.118)
%ΔCW 0.126***(0.013)
0.054***(0.014)
0.038(0.067)
0.031(0.061)
%ΔWRTW −0.162(0.211)
0.035(0.124)
−0.021(0.082)
0.000(0.077)
%ΔHCSW 0.102(0.081)
0.103(0.075)
−0.033(0.056)
−0.049(0.057)
%ΔPI −0.000***(0.000)
−0.000***(0.000)
−0.002(0.005)
−0.001(0.005)
%ΔAS −0.000*(0.000)
−0.000(0.000)
0.013(0.017)
0.012(0.016)
Constant 7.180*(3.781)
1.418(3.091)
3.231**(1.563)
3.959**(1.917)
Province dummy No Yes no YesHausman test 36.81 (p = 0.000) 114.43 (P = 0.000)Observations 124 124 155 155R2 0.265 0.327 0.122 0.131
Note: *Significant at 10% level. **Significant at 5% level. ***Significant at 1% level. The method ofrandom-effects estimation is generalized least squares. The method of fixed-effects estimation is ordinaryleast squares. The province dummy variables are included in fixed-effects estimations but not reported.Standard errors are in parentheses.Source: See the Appendix.
INCOMPLETE RURAL–URBAN LABOUR MIGRATION 419
© 2014 Wiley Publishing Asia Pty Ltd

pattern quite different from those experienced in other countries. Instead ofcomplete migration, the labour of an individual peasant is often split (typicallyover different times of the year) into two or more parts because of institutionalfactors. Individuals work both as a peasant in the land and as a temporarymigrant worker in urban areas. This failure of full transfer to urban full-timework may reduce the amount of rural surplus labour; in addition, it leads toa lower degree of specialization and an early (or distorted) Lewisian turningpoint.16 We examine this issue using province-level panel data, and find that theturning point of peasants’ labour allocation between agricultural jobs and non-agricultural jobs was reached after 2002–2005. This provides a new perspectivein interpreting the phenomena of China’s labour shortages in coastal cities andrising rural migrant wages in recent years, and in determining when the Lewisianturning point is reached.
In addition, the results of the present study have important policy implicationsfor China’s future development. First, China’s agriculture has not been convertedto large-scale production as a result of the split land ownership system.17 Theprocess of agricultural specialization is progressing slowly and production effi-ciency is low. The agricultural sector is struggling to release large amounts ofredundant labour. Second, although China has a lot of cheap labour, the level oflabour productivity is very low and workers can only engage in low-end indus-tries. Due to the incomplete rural–urban migration, it is difficult to achieveefficiency in investment of human capital. Consequently, China is struggling toaccumulate human capital effectively for part-peasants (large numbers of peas-ants as migrant workers). The advantage of low wages will not last long if Chinadoes not solve the problems relating to the current institutional factors, theseproblems may become a big obstacle to China’s future development.
NOTES
(1) The data are from average wages of employed persons in urban units by sector and region.(2) In 2001 and 2002, the China Statistical Yearbook reported the data of Average wages of employed
persons of Wholesale and retail trades and Average wages of employed persons of Hotels andcatering services together, so the data of two industries were consistent.
(3) Before 1994, price indices of means of agricultural production was a sub-category in the in theretail price indices of commodities, and it has been compiled separately since 1994.
REFERENCES
Benjamin, D. and L. Brandt (2002) ‘Property Rights, Labour Markets, and Efficiency in A Tran-sition Economy: The Case of Rural China’, The Canadian Journal of Economics 35, 689–716.
Brosig, S., T. Glauben, T. Herzfeld and X. Wang (2009) ‘Persistence of Full- and Part-Time Farmingin Southern China’, China Economic Review 20, 360–71.
16 Certain policies make peasants less willing to go to work in the cities exclusively, so that theturning point occurs earlier. Therefore, we may say the Lewisian turning point occurs earlier and isdistorted. For related literature supporting this view, see Knight et al. (2011).17 On the likely effects of the legalization of trade in land use rights in China, see Khantachavanaet al. (in press).
Y. CAI AND Y.-K. NG420
© 2014 Wiley Publishing Asia Pty Ltd

Cai, F. and M. Wang (2008) ‘A Counterfactual of Unlimited Surplus Labour in Rural China’, China& World Economy 16, 51–65.
Cai, F. and M. Wang (2010) ‘Growth and Structural Changes in Employment in Transition China’,Journal of Comparative Economics 38, 71–81.
Cao, Y. and C. A. Tisdell (1992) ‘China’s Surplus Agricultural Labour Force: It’s Size, Transfer,Prospects for Absorption and Effects of the Double-Track Economic System’, Asian EconomicJournal 7, 149–82.
Chan, K. W. and L. Zhang (1999) ‘The Hukou System and Rural–Urban Migration in China:Processes and Changes’, The China Quarterly 160, 818–55.
Fan, S. (1991) ‘Effects of Technological Change and Institutional Reform on Production Growth inChinese Agriculture’, American Journal of Agricultural Economics 73, 266–75.
Hare, D. (2002) ‘The Determinants of Job Location and Its Effect on Migrants’ Wages: Evidencefrom Rural China’, Economic Development and Cultural Change 50, 557–79.
Huang, Y. (2010) ‘China’s Great Ascendancy and Structural Risks: Consequences of AsymmetricMarket Liberalisation’, Asian-Pacific Economic Literature 24, 65–85.
Khantachavana, S. V., C. G. Turvey, R. Kong and X. Xia (in press) ‘On the Transaction Values ofLand Use Rights in Rural China’, Journal of Comparative Economics.
Knight, J., Q. Deng and S. Li (2011) ‘The Puzzle of Migrant Labour Shortage and Rural LabourSurplus in China’, China Economic Review 22, 585–600.
Lei, M. (2012) ‘Can Grain Subsidies Impede Rural–Urban Migration in Hinterland China? Evi-dence from Field Surveys’, China Economic Review 23, 729–41.
Lewis, W. A. (1954) ‘Economic Development with Unlimited Supplies of Labor’, Manchester Schoolof Economic and Social Studies 22, 139–91.
Li, H., L. Li, B. Wu and Y. Xiong (2012) ‘The End of Cheap Chinese Labor’, The Journal ofEconomic Perspectives 26, 57–74.
Lin, J. Y. (1992) ‘Rural Reforms and Agricultural Growth in China’, American Economic Review 82,34–51.
McMillan, J., J. Whalley and L. Zhu (1989) ‘The Impact of China’s Economic Reforms on Agri-cultural Productivity Growth’, Journal of Political Economy 97, 781–807.
Ng, Y.-K. (1974) ‘Utility and Profit Maximization by An Owner-Manager: Towards A GeneralAnalysis’, Journal of Industrial Economics 23, 97–108.
Ortiz, S. (2002) ‘Laboring in the Factories and in the Fields’, Annual Review of Anthropology 31,395–417.
Peng, X. (2008) ‘Demographic Shift, Population Ageing and Economic Growth in China: AComputable General Equilibrium Analysis’, Pacific Economic Review 13, 680–97.
Xing, Q. (2005) ‘Agricultural Tax to be Scrapped From 2006’, China Daily. 6 March, p. 3.Wu, X. and D. J. Treima (2004) ‘The Household Registration System and Social Stratification in
China: 1955-1996’, Demography 41, 363–84.Yang, D. T., V. W. Chen and R. Monarch (2010) ‘Rising Wages: Has China Lost Its Global Labor
Advantage’, Pacific Economic Review 15, 482–504.Yao, Y. and K. Zhang (2010) ‘Has China Passed the Lewisian Is Turning Point? A Structural
Estimation Based on Provincial Data’, China Economic Journal 3, 155–62.Zhang, X., J. Yang and S. Wang (2011) ‘China Has Reached the Lewis Turning Point’, China
Economic Review 22, 542–54.Zhao, Y. (1999) ‘Leaving the Countryside: Rural-to-Urban Migration Decisions in China’,
American Economic Review 89, 281–6.
APPENDIX
This appendix documents the data sources and describes the various variables(indices), calculations and adjustments.
Wages Income: Labour income of peasants earned from non-agriculturalproduction activities. These data were taken from the China Rural StatisticalYearbook (2002–2011).
Household Per Capita Net Income from Agricultural Production and OtherCorrelative Sources (HPCNI): These data were taken from the China RuralStatistical Yearbook (2002–2011).
INCOMPLETE RURAL–URBAN LABOUR MIGRATION 421
© 2014 Wiley Publishing Asia Pty Ltd

Property Income (PI): These data were taken from the China Rural StatisticalYearbook (2002–2011).
Transfer Income (AS): Transfer payments (agricultural subsidies or financialsubsidy for agriculture). These data were taken from China Rural StatisticalYearbook (2002–2011).
Food Price Index (FPI): Food contains grain, oil or fat, meat, poultry andprocessed products, eggs, aquatic products, vegetables (fresh vegetable), driedand fresh melons and fruits (fresh fruits), and dining out. The food price indexwas calculated by integrating a variety of food prices. These data were takenfrom the China Statistical Yearbook (2002–2011).
Price Indices of Means of Agricultural Production (AMPI): Reflect the trend anddegree of changes in the prices of material inputs (‘means of production’ in theMarxist terminology) used in agricultural production during a given period.The official description is ‘Price Indices of Means of Agricultural Production’.These data were taken from the China Statistical Yearbook (2002–2011).
Average Wages of Employed Persons in Mining (MW): These data were takenfrom the China Statistical Yearbook (2002–2011).
Average Wages of Employed Persons in Manufacturing (MFW): These data weretaken from the China Statistical Yearbook (2002–2011).
Average Wages of Employed Persons in Construction (CW): These data weretaken from the China Statistical Yearbook (2002–2011).
Average Wages of Employed Persons in Wholesale and Retail Trades (WRTW):These data were taken from China Statistical Yearbook (2002–2011).
Average Wages of Employed Persons in Hotels and Catering Services (HCSW):These data were taken from China Statistical Yearbook (2002–2011).
Y. CAI AND Y.-K. NG422
© 2014 Wiley Publishing Asia Pty Ltd