Embed Size (px)
Citation preview
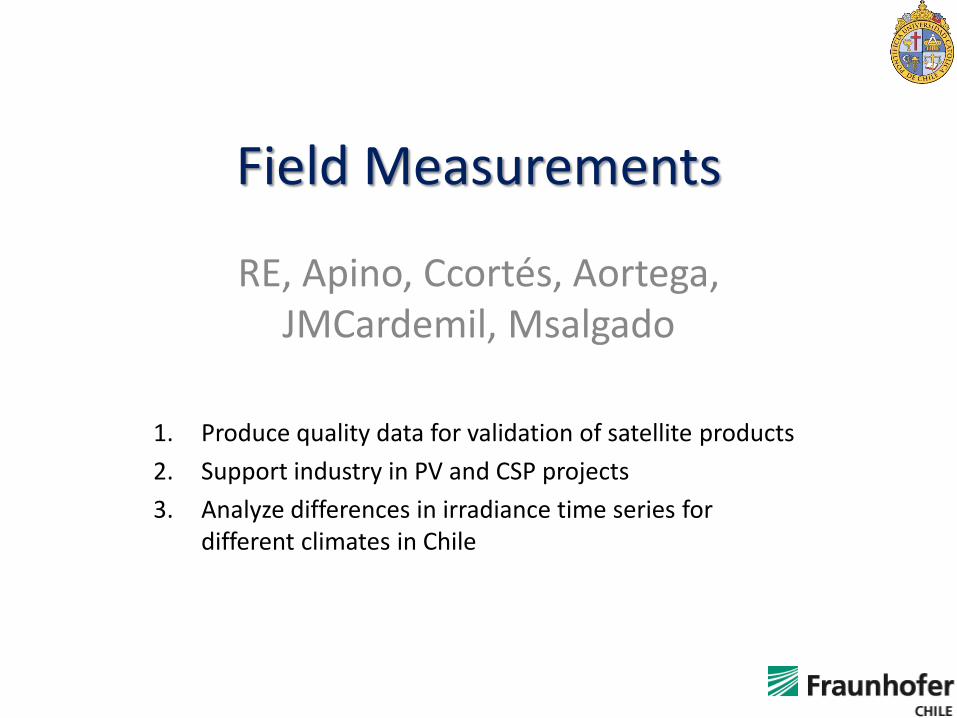
Field Measurements
RE, Apino, Ccortés, Aortega, JMCardemil, Msalgado
1. Produce quality data for validation of satellite products
2. Support industry in PV and CSP projects
3. Analyze differences in irradiance time series for different climates in Chile

La Tirana, Tarapacá.
DICTUC / Latin America Power

Alto Patache, Tarapacá.
Centro UC Desierto de Atacama
Alta corrosión: humedad y salinidad.
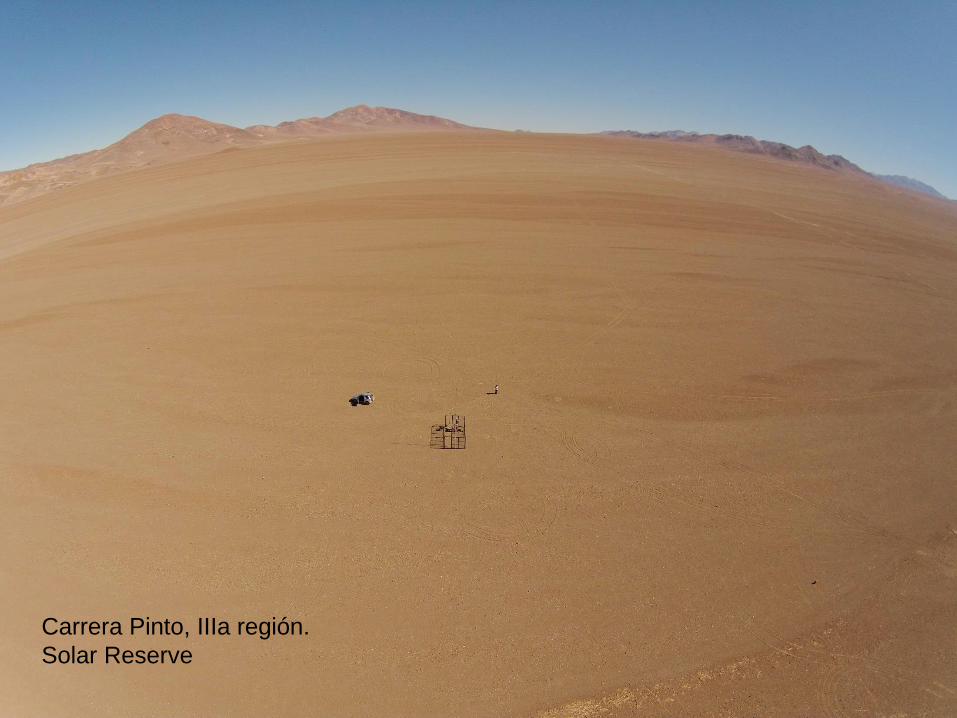
Carrera Pinto, IIIa región.
Solar Reserve

Measurement network
Not shown: Carrera Pinto (RSR), Jucosol (Solys 2) Santiago: RSR, Solys 2 (UC); Solys 2 (UChile).
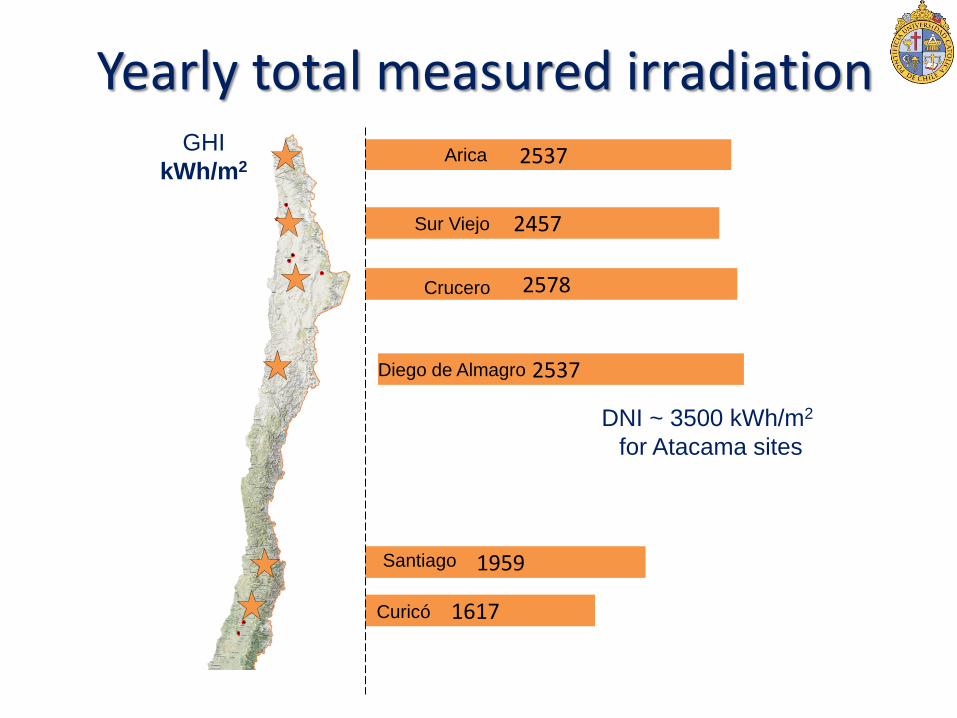
Yearly total measured irradiation GHI
kWh/m2 2537
2457
2501
2460
2578
2570
2654
2537
1959
1617
0 500 1000 1500 2000 2500 3000
Arica (Lat.: -18.48°)
Pozo Almonte (Lat.: -20.26°)
Sur Viejo (Lat.: -20.94°)
San Pedro de Atacama (Lat.: -22.91°)
Crucero (Lat.: -22.24°)
Coya Sur (Lat.: -22.4°)
El Tesoro (Lat.: -22.93°)
Diego de Almagro (Lat.: -26.4°)
Santiago (Lat.: -33.5°)
Curicó (Lat.: -35.0°)
Energía total anual,kWh/m2
Arica
2537
2457
2501
2460
2578
2570
2654
2537
1959
1617
0 500 1000 1500 2000 2500 3000
Arica (Lat.: -18.48°)
Pozo Almonte (Lat.: -20.26°)
Sur Viejo (Lat.: -20.94°)
San Pedro de Atacama (Lat.: -22.91°)
Crucero (Lat.: -22.24°)
Coya Sur (Lat.: -22.4°)
El Tesoro (Lat.: -22.93°)
Diego de Almagro (Lat.: -26.4°)
Santiago (Lat.: -33.5°)
Curicó (Lat.: -35.0°)
Energía total anual,kWh/m2
Sur Viejo
2537
2457
2501
2460
2578
2570
2654
2537
1959
1617
0 500 1000 1500 2000 2500 3000
Arica (Lat.: -18.48°)
Pozo Almonte (Lat.: -20.26°)
Sur Viejo (Lat.: -20.94°)
San Pedro de Atacama (Lat.: -22.91°)
Crucero (Lat.: -22.24°)
Coya Sur (Lat.: -22.4°)
El Tesoro (Lat.: -22.93°)
Diego de Almagro (Lat.: -26.4°)
Santiago (Lat.: -33.5°)
Curicó (Lat.: -35.0°)
Energía total anual,kWh/m2
Diego de Almagro
2537
2457
2501
2460
2578
2570
2654
2537
1959
1617
0 500 1000 1500 2000 2500 3000
Arica (Lat.: -18.48°)
Pozo Almonte (Lat.: -20.26°)
Sur Viejo (Lat.: -20.94°)
San Pedro de Atacama (Lat.: -22.91°)
Crucero (Lat.: -22.24°)
Coya Sur (Lat.: -22.4°)
El Tesoro (Lat.: -22.93°)
Diego de Almagro (Lat.: -26.4°)
Santiago (Lat.: -33.5°)
Curicó (Lat.: -35.0°)
Energía total anual,kWh/m2
Santiago
2537
2457
2501
2460
2578
2570
2654
2537
1959
1617
0 500 1000 1500 2000 2500 3000
Arica (Lat.: -18.48°)
Pozo Almonte (Lat.: -20.26°)
Sur Viejo (Lat.: -20.94°)
San Pedro de Atacama (Lat.: -22.91°)
Crucero (Lat.: -22.24°)
Coya Sur (Lat.: -22.4°)
El Tesoro (Lat.: -22.93°)
Diego de Almagro (Lat.: -26.4°)
Santiago (Lat.: -33.5°)
Curicó (Lat.: -35.0°)
Energía total anual,kWh/m2
Curicó
2537
2457
2501
2460
2578
2570
2654
2537
1959
1617
0 500 1000 1500 2000 2500 3000
Arica (Lat.: -18.48°)
Pozo Almonte (Lat.: -20.26°)
Sur Viejo (Lat.: -20.94°)
San Pedro de Atacama (Lat.: -22.91°)
Crucero (Lat.: -22.24°)
Coya Sur (Lat.: -22.4°)
El Tesoro (Lat.: -22.93°)
Diego de Almagro (Lat.: -26.4°)
Santiago (Lat.: -33.5°)
Curicó (Lat.: -35.0°)
Energía total anual,kWh/m2
Crucero
DNI ~ 3500 kWh/m2
for Atacama sites
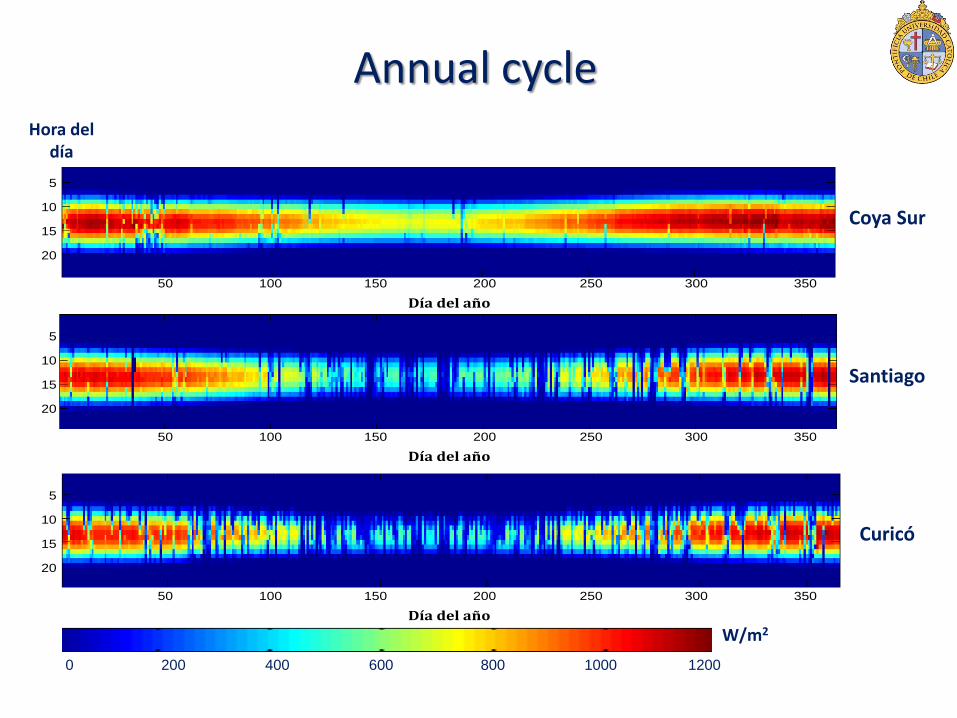
Annual cycle
Día del año
Hora del día
5
10
15
20
50 100 150 200 250 300 350
Día del año
Hora del día
5
10
15
20
50 100 150 200 250 300 350
Día del año
Hora del día
5
10
15
20
50 100 150 200 250 300 350
Coya Sur
Curicó
Santiago
W/m2
0 200 400 600 800 1000 1200
Hora del día
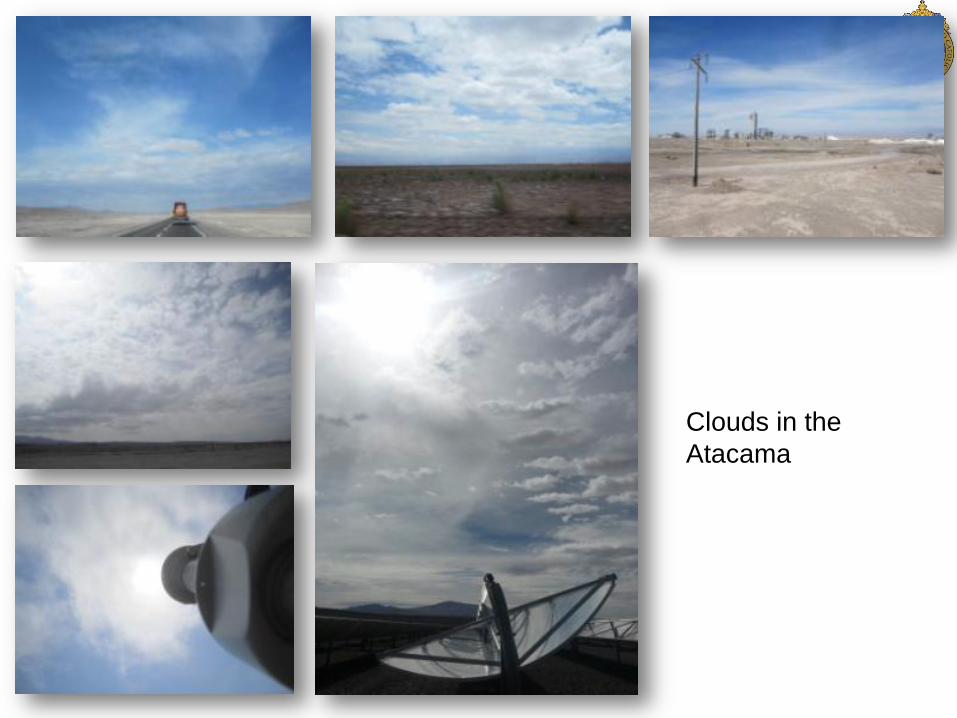
Clouds in the
Atacama

Satellite Estimation
RE, Apino, Ccortés, Aortega
1. Fill a knowledge gap for irradiance data in Chile (2008-
2013)
2. Establish (detect) needs for local adaptation of existing methodologies to particular conditions in Chile
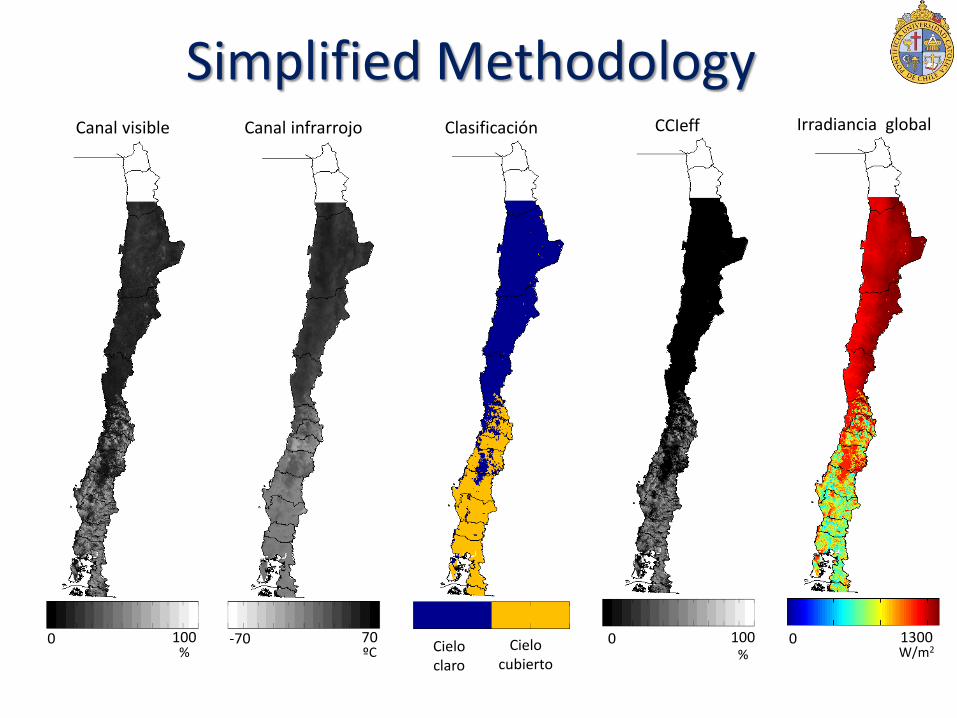
Simplified Methodology Canal visible
0 100
Canal infrarrojo
-70 70
Clasificación
Cielo claro
Cielo cubierto
CCIeff
0 100 0 1300
Irradiancia global
% ºC % W/m2

Results: Yearly Average Irradiación
global Irradiación
difusa Irradiación
DNI
kWh/m2 kWh/m2 kWh/m2
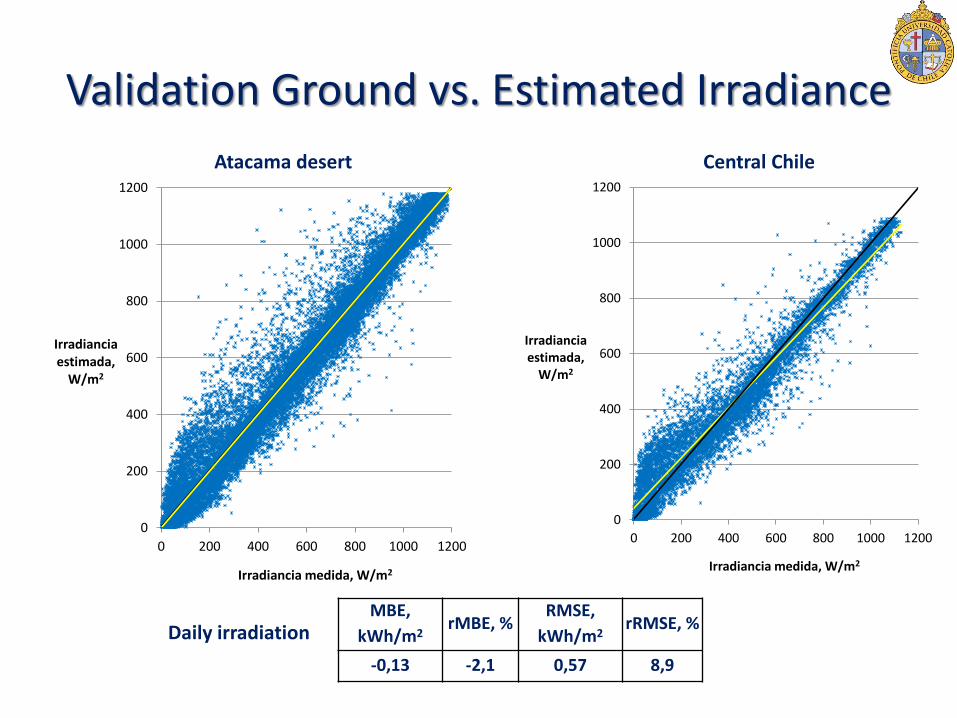
Validation Ground vs. Estimated Irradiance
Atacama desert Central Chile
0
200
400
600
800
1000
1200
0 200 400 600 800 1000 1200
Irradiancia estimada,
W/m2
Irradiancia medida, W/m2
0
200
400
600
800
1000
1200
0 200 400 600 800 1000 1200
Irradiancia estimada,
W/m2
Irradiancia medida, W/m2
MBE,
kWh/m2 rMBE, %
RMSE,
kWh/m2 rRMSE, %
-0,13 -2,1 0,57 8,9
Daily irradiation

Diffuse Fraction and Artificial DNI Series
Rgarcía, RE
1. Generate acceptable DNI data for several stations that
only measure GHI
2. Adapt diffuse fraction models to several climate systems in Chile (13)
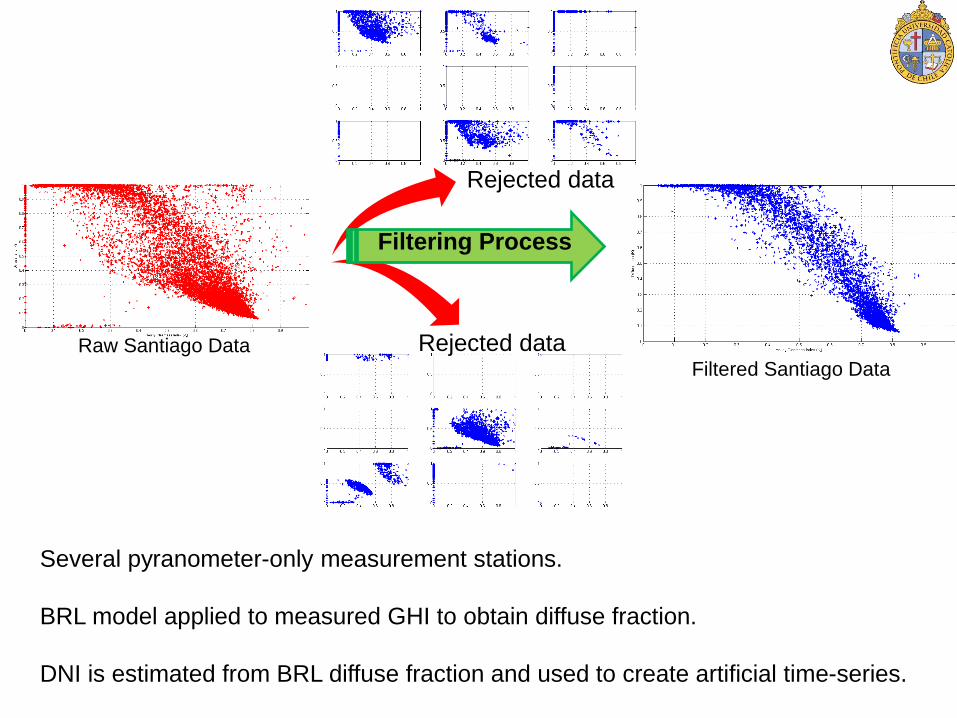
Raw Santiago Data
Filtered Santiago Data
Rejected data
Rejected data
Filtering Process
Several pyranometer-only measurement stations.
BRL model applied to measured GHI to obtain diffuse fraction.
DNI is estimated from BRL diffuse fraction and used to create artificial time-series.
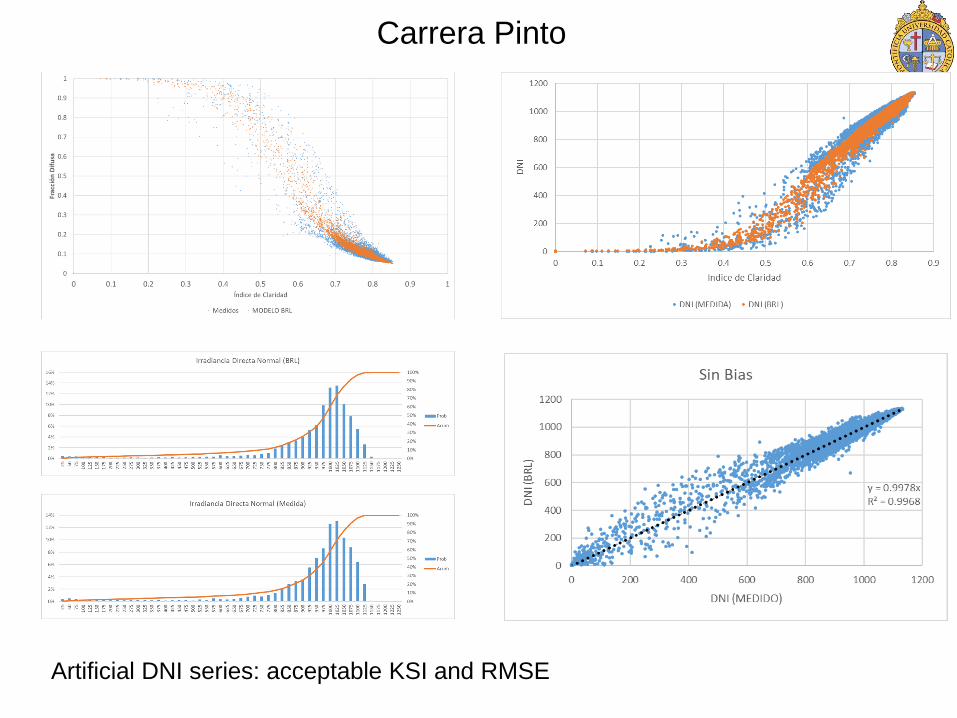
Carrera Pinto
Artificial DNI series: acceptable KSI and RMSE
Economic value of Forecasting
IPérez, Acastillejo, RE
1. Determine economic value of forecasting in Chile
correlate avoided curtailment losses with forecasting accuracy
2. Analyze and characterize irradiance variability in the Atacama higher that anticipated
3. Support large-scale penetration of PV to Chilean Grid next step DNI for CSP


Curtailment Estimation
• aaa
SolarTambo
Real
SolarSDGx0
1
SolarEspera
nza
SolarLlano
deLlamp
os
SolarSan
Andrés
SolarSantaCecilia
SolarTechos
deAltami
ra
SolarDiego
deAlmag
ro
SolarPSF
Pama
SolarPSF
LomasColora
das
SolarLas
Terrazas
SolarPV
Salvador
SolarChañar
es
SolarLalackama
SolarJaviera
SolarLomaLos
Colorados
SolarLuz delNorte
SolarLuna
SolarLalackama 2
SolarEl Pilar- Los
Amarillos
SolarSol
SolarLagunil
la
SolarCarrera Pinto
Producido 0,9144 0,6364 1,2138 74,803 22,656 1,5716 0,0568 13,252 1,2419 1,2639 1,8992 45,923 15,24 34,963 40,856 0,2944 69,162 1,828 10,97 1,3727 1,845 1,3182 11,766
Recortado 0 0,0019 0,0032 0,1096 0,3049 0,0012 2E-05 0,0858 0 0 0 2,2133 0,4066 1,633 1,5696 0,005 3,8791 0,0006 0,7153 0 0,0006 0,0058 0,3144
0
10
20
30
40
50
60
70
80
Ener
gía
(GW
h)
Producción solar PV y recorte en plantas SIC
Low curtailment plant High curtailment plant
Assuming a PPA
100 USD/MWh
Total monthly loss:
1.125 MMUSD
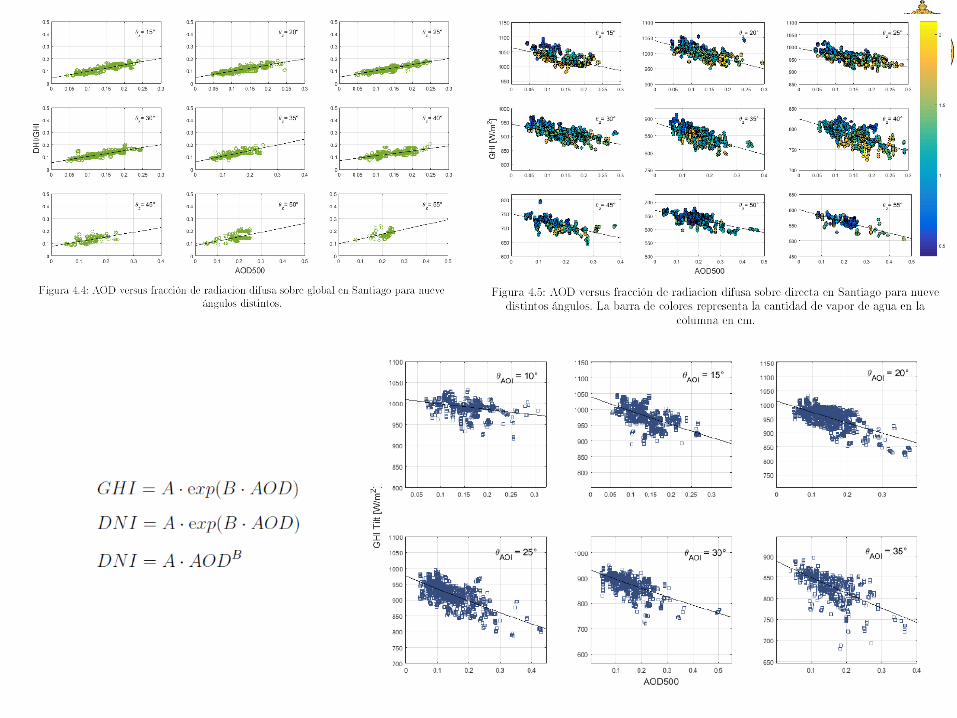
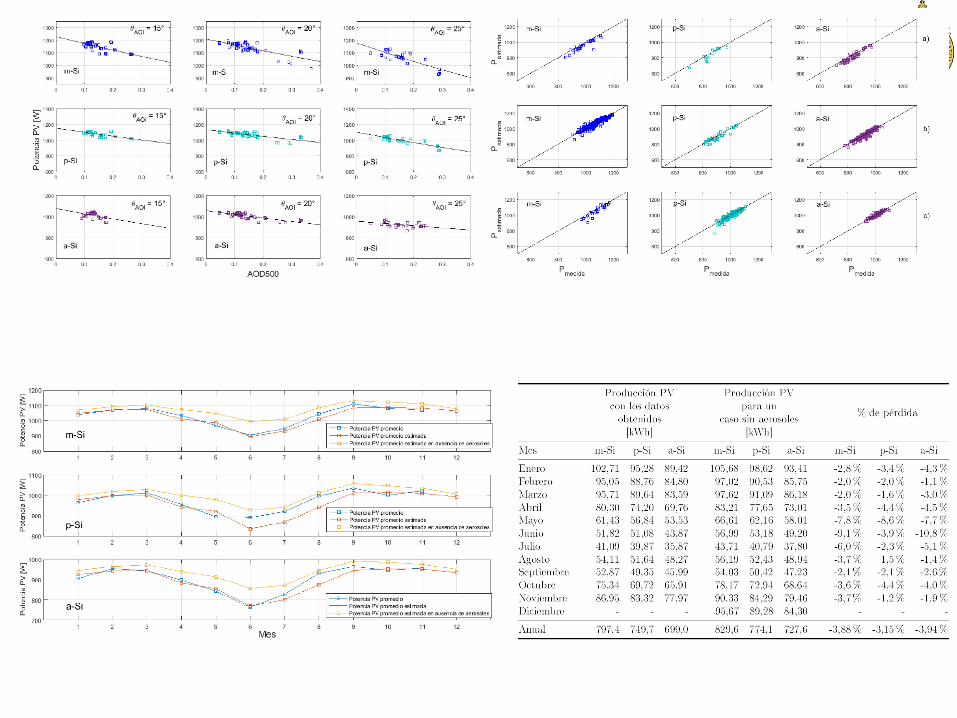
AOD effects on Irradiance and PV production
MDelHoyo*, Rrondanelli*, RE
*: Universidad de Chile, FCFM, Geofísica
1. Understand effect of local aerosols
(pollution/natural): irradiance and PV production
2. Develop a predictive tool for CPV simulations
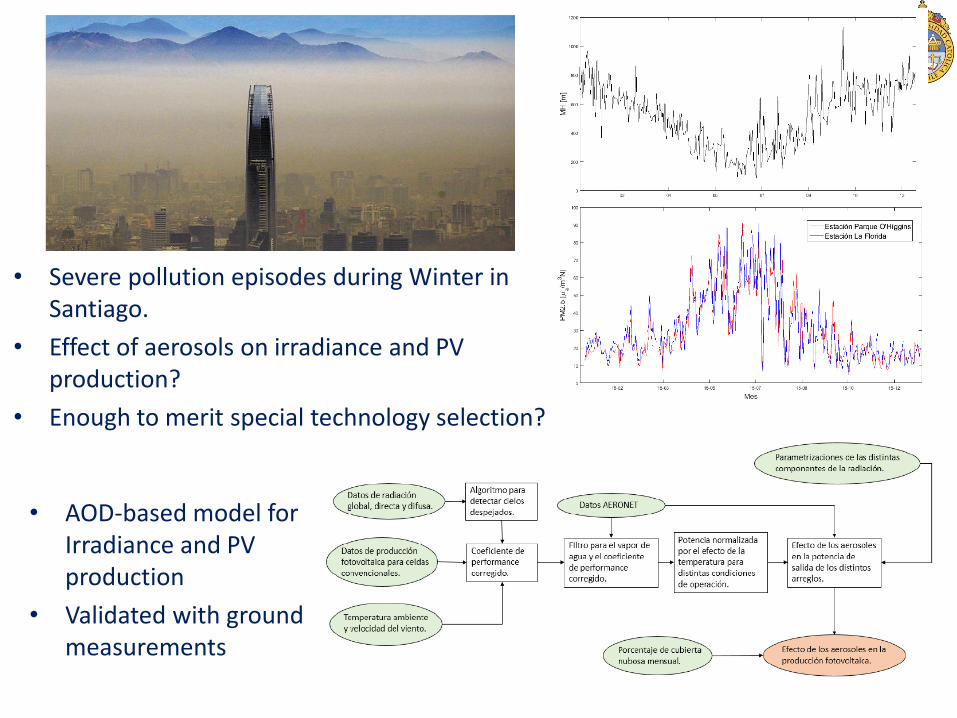
• Severe pollution episodes during Winter in Santiago.
• Effect of aerosols on irradiance and PV production?
• Enough to merit special technology selection?
• AOD-based model for Irradiance and PV production
• Validated with ground measurements
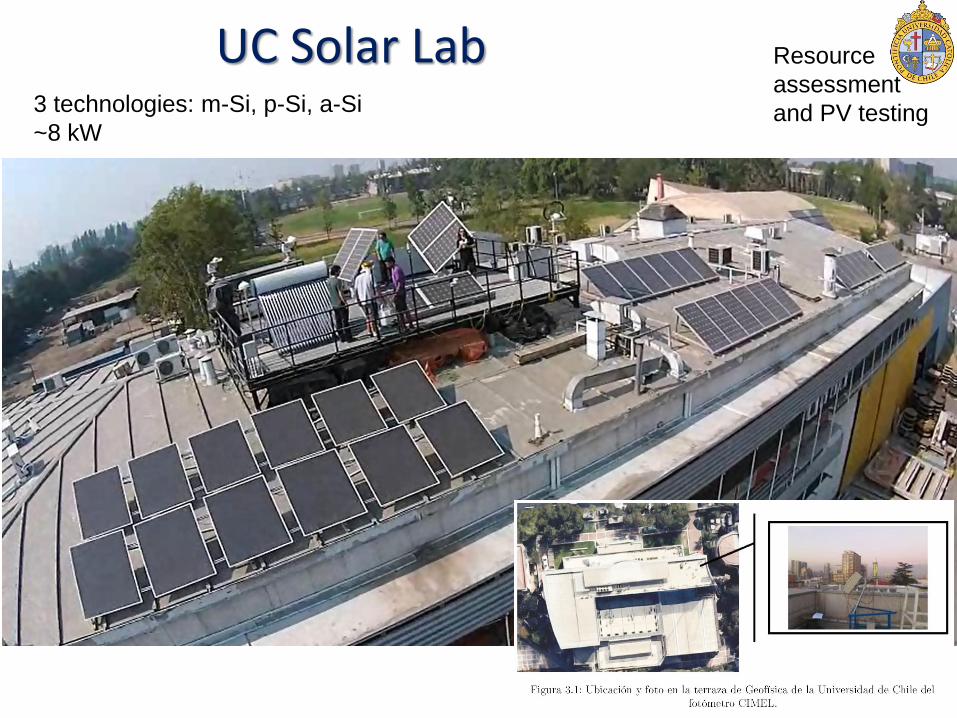
UC Solar Lab Resource
assessment
and PV testing 3 technologies: m-Si, p-Si, a-Si
~8 kW