Embed Size (px)
Citation preview

Journal of Physics Conference Series
OPEN ACCESS
Partial Discharge Location using UnsynchronizedRadiometer Network for Condition Monitoring inHV Substations - A Proposed ApproachTo cite this article J M R de Souza Neto IEEE member et al 2012 J Phys Conf Ser 364 012053
View the article online for updates and enhancements
You may also likeSigma-Delta ADC TopologyImplementation Based on PartialDischarge Detection using Rogowski CoilSensorM N K H Rohani M Isa M Syahril et al
-
On-line Monitoring Device for High-voltageSwitch Cabinet Partial Discharge Basedon Pulse Current MethodS Y Tao X Z Zhang H W Cai et al
-
A Review Partial Discharge Detectionusing UHF sensor on High VoltageEquipmentN D Roslizan M N K H Rohani C L Wooiet al
-
This content was downloaded from IP address 121140155198 on 28012022 at 1639
Partial Discharge Location using Unsynchronized Radiometer
Network for Condition Monitoring in HV Substations ndash A
Proposed Approach
J M R de Souza Neto1 (IEEE member) E C T de Macedo
1 J S da Rocha Neto
1
(IEEE senior member) E G da Costa1 S A Bhattisup2 and I A Gloversup3
1Departamento de Engenharia Eleacutetrica Federal University of Campina Grande
Campina Grande - PB Brazil 2Department of Electronic amp Electrical Engineering University of Strathclyde
Scotland UK
sup3Department of Electronic amp Electrical Engineering University of Strathclyde
Scotland UK and CAPES Visiting Professor Federal University of Campina Grande
Campina Grande - PB Brazil
E-mail josenetoeeufcgedubr zesergiodeeufcgedubr and
ianglovereeestrathacuk Abstract A location estimation system for online Partial Discharge (PD) detection is
proposed as a low-cost approach to real-time condition monitoring asset management
and operation optimization in future smart grid Some early progress in the
development of subsystems (specifically the antenna radiometer device PD emulator
and PD generator) for a proof-of-principle prototype system is described The
proposed PD Wireless Sensor Network (WSN) uses a novel approach to PD location
which obviates the need for synchronization between sensors thereby improving
scalability
1 Introduction
Partial discharge refers to a discharge that does not completely bridge the space between the
conductors causing it It occurs in power systems insulation that is inhomogeneous in dielectric
constant due for example to air voids in solid insulation or gas bubbles in oil insulation It also occurs
in gaseous insulation as corona due to damaged or otherwise modified conductors having regions
with small radius of curvature In these respects the emission of radio frequency (RF) energy via the
mechanism of PD is known to be characteristic of insulation imperfection in high voltage (HV)
equipment
Many PD sensors for monitoring the insulation integrity of HV electrical equipment are now
available commercially Sensors which require contact with HV conductors bridge the insulation of
the power system and require plant to be taken out of service for installation maintenance or
reconfiguration Sensors such as HFCTs and TEVs rely on near-field inductive or surface-wave
coupling and therefore require (at least) one sensor for each item of plant to be monitored
PD is already used as a tool in condition monitoring of HV plant In the UK for example HV
substations are typically surveyed for PD radiation biennially Such surveys are conducted by trained
25th International Congress on Condition Monitoring and Diagnostic Engineering IOP PublishingJournal of Physics Conference Series 364 (2012) 012053 doi1010881742-65963641012053
Published under licence by IOP Publishing Ltd 1
engineers using a wideband (typically ~ 10 - 900 MHz) radio receiver designed to detect RF
interference (RFI) of substation origin The engineer detects the presence of insulation defects by
interpreting signal intensity visually using a received signal strength indicator (RSSI) or aurally using
headphones as the receiver antenna position and receiver frequency band are varied
Recently a free-standing technology has been developed which allows PD to be detected and
located at a distance [1] The wireless detection of PD using a radio receiver has the advantage that no
physical connection need be made to HV (or any other) equipment Primary insulation remains un-
bridged This not only obviates the need to take HV plant out of service for installation and
reconfiguration but can provide wide area coverage from a single sensor
The location method used in this technology is based on time-difference-of-arrival measurements
of the PD signal at three or more spatially separated points requiring sophisticated receivers An
alternative technology for detection of PD in substations using a simple (and therefore cheap)
unsynchronized (and therefore scalable) network of radiometers is proposed by the authors In this
paper we report progress in the development of this novel approach to PD detection and location using
a WSN
2 Vision
The vision is of a network of low-cost PD radiometers distributed throughout the power system
measuring PD intensity In each substation a primary node radiometer would be co-located with each
significant item of plant Significant here means an item of plant whose expense or strategic
function warrants particular protection from insulation failure Auxiliary node radiometers would be
deployed to ensure an approximately uniform sensor density facilitating the interpretation of
radiometer data and location of plant defects The deployment strategy would be such that no item of
electrical plant with the possible exception of some segments of overhead transmission line would be
further than (say) 30 m from a radiometer (A substation with an area 40000 m2 is unlikely to require
more than around 30 radiometers therefore allowing for significant non-uniform overall distribution
due to clustering of significant plant)
Such a radiometer network takes advantage of two well-established properties of PD ie
PD intensity is incontrovertibly linked to insulation defects
PD is a fundamentally local phenomenon
The noise temperatures measured by the radiometers would be communicated wirelessly to a data-
collection station which itself would be connected to the Internet The wireless links would use a
frequency (almost certainly in the 24 GHz ISM band) well above the PD measurement band (~ 10-
1000 MHz) If necessary a low-pass RF filter would be incorporated into the front-end of each
radiometer to ensure such interference from the wireless links do not inflate the radiometer
measurements Data analysis software would continuously monitor the effective noise temperatures
reported by the radiometers and form a space-time map of noise activity Absolute values and rates-
of-change of radiometer noise temperatures in both spatial and temporal domains will be used to flag
events requiring action or further investigation As experience with the system is gained and
confidence in it grows it will become a primary indicator of plant health Experienced operators (and
eventually automated expert systems) will be able to use the information provided by the network to
operate aging plant to its maximum potential without the risk of catastrophic failure
3 Operating Principles
Each radiometer will make a measurement of total power within its receiver bandwidth using an
integration time of around 300 s This is short enough to capture changes in PD activity due to changes
in physical insulation state but long enough to make the measurement a reliable estimate of PD
intensity A 300 s integration time would also mitigate against high-power but short-lived transients
produced by switching events for example from falsifying the PD intensity estimate Each radiometer
25th International Congress on Condition Monitoring and Diagnostic Engineering IOP PublishingJournal of Physics Conference Series 364 (2012) 012053 doi1010881742-65963641012053
2
will report its measurement to an on-site data-collection station using a WSN technology such as
ZigBee or WirelessHart ZigBee has a maximum bit-rate of 250 kbits and a nominal maximum range
of 100 m Technologies exist however which can extend this range [2]
The problem of contamination by external noise and signals of non-PD origin including coherent
interference represented by communications navigation and radar transmissions is addressed in two
ways Firstly the large radiometer bandwidth mitigates against undue influence of signals with high
spectral density provided they are narrowband Secondly the radiometer network takes advantage of
the local character of PD signals A communications or other signal originating far from the
substation will affect all radiometers (approximately) equally A PD signal occurring close to one
radiometer will have decayed to (relatively) low levels at the locations of other radiometers
Radiometer hot-spots superimposed on a map of the substation will therefore reflect signals of
substation origin only The approximately uniform density of radiometer nodes gives the network an
inherent localization capacity (PD sources will be local to those radiometers with elevated
temperatures) The localization of PD sources will be refined however by inverting the transmission-
loss law of the PD signal modeled by
nRr
kP (1)
where PR is received power r is range from the source of radiation k is a constant that depends on
systemrsquos parameters (radiated power antenna gains radiometer bandwidth etc) and n is a path-loss
index If the value of n is independent of range equation (1) is referred to as a single-slope law The
path-loss index for propagation in free space for example is 2 corresponding to a single-slope
transmission loss law of 6 dBoctave [3] For ranges beyond those producing interference fringes due
to direct and ground reflected paths the propagation index over a perfect ground-plane is 4
corresponding to a transmission loss of 12 dBoctave The transmission-loss law can be inverted (as in
[4]) to give an estimate of the ratio of distances from a PD source to any two radiometers A location
for a PD source can therefore made if the source is detected by three or more radiometers In practice
this location estimate will be subject to error determined principally by the spatial and path-
orientation variability of the transmission-loss index If the spatial- and orientation-variation in
transmission-loss index were known however an initial location based on an assumed transmission-
loss law (eg one independent of location and path-orientation) could be refined by using path-loss
laws particular to the initial location estimate This refinement could be applied iteratively to further
improve the location estimate as necessary
To facilitate the iterative location algorithm outlined above it is proposed to incorporate a PD
emulator (ie a transmitter that radiates a PD-like signal) in each radiometer node Each node will then
briefly (eg for 100 ms) but periodically (eg once per hour) radiate a PD-like signal of known
power via an omnidirectional antenna of known gain in a pre-arranged time-slot All other nodes will
receive this lsquocalibrationrsquo signal and will thus be able to measure the path-loss index for the path
between itself and the radiating node The resulting values of transmission-loss index as a function of
source location path-length and path-orientation can then be interpolated to provide appropriate inputs
to the location algorithm
The use of a realistic emulation of a PD signal and an operational radiometer as transmitter and
receiver respectively will improve the estimate of the transmission-loss index measurements over
those that would be found using an unmodulated carrier for example This is because transmission
loss is a function of frequency and the broadband nature of PD will make the resulting effective law a
weighted average (over the measurement bandwidth) of many simpler narrow-band laws Using a PD-
like transmitted signal and an operational radiometer as receiver will ensure the weighting employed
in establishing the effective law is precisely correct for accurate PD location
The location algorithm outlined above will be subject to residual errors due to (i) deviation from an
omnidirectional pattern of the PD radiation (ii) SNR variations of the transmission-loss measurements
25th International Congress on Condition Monitoring and Diagnostic Engineering IOP PublishingJournal of Physics Conference Series 364 (2012) 012053 doi1010881742-65963641012053
3
and (iii) transmission-loss index interpolation errors A best estimate of PD location will therefore
minimize an appropriate confidence weighted error metric
PD sensing device simplicity is central to the strategic vision both to ensure low deployment costs
and (perhaps more importantly) to ensure robust and reliable operation Figure 1 shows a proposed
radiometer architecture
The radiometer will employ automatic gain control (AGC) andor logarithmic detection to ensure it
has sufficient dynamic range to operate successfully in both low and high signal level environments
It will be self-calibrating periodically connecting a matched (reference) load via an RF switch in place
of its antenna (This calibration relates to the measured noise temperature and is not to be confused
with the transmission-loss calibration for the location algorithm described previously)
RF Switch
Diskcone
Antenna
RF Filtering and
Electronics
Microcontroller
ADC
Sampling
Memory
IOEmulador de PDCalibration Signal
Matched Load
Switch Control Signal
Transciever
Figure 1 Proposed radiometer architecture
During the calibration cycle the radiometer will measure the thermal noise from the reference load
This load constitutes a black body radiator and will therefore have a noise temperature Tref equal to
its physical temperature The radiometer calibration temperature Tcal will be the sum of the reference
temperature and the radiometers internal equivalent noise temperature Te Tcal can be effectively
subtracted from the radiometer noise temperature reported during the PD measurement phase The
calibrated measurement will therefore represent the excess noise temperature (principally representing
PD) over and above the background noise temperature expected due to normal thermal processes The
proof-of principle prototype units will be battery powered
4 Some Early Progress
The radiometer WSN concept described above is fairly well-advanced but progress towards realization
is at an early stage A proof-of-principle elementary radiometer and a PD generator for system
validation have been developed however
41 Radiometer
The diskcone antenna [5] has been selected for the proof-of-principle system (In a production version
the antenna is more likely be a microstrip patch design ndash possible of a bow-tie antenna ndash and will thus
be much smaller and lighter than that described here) The diskcone antenna is a monopole variation
of the biconical antenna It is low-gain omnidirectional linearly-polarised and has wide bandwidth It
is also an unbalanced structure and therefore does not require a balun for a coaxial feed Figure 2
shows a schematic diagram of the diskcone antenna
25th International Congress on Condition Monitoring and Diagnostic Engineering IOP PublishingJournal of Physics Conference Series 364 (2012) 012053 doi1010881742-65963641012053
4
Side ViewView into bottom of cone
Figure 2 Diskcone antenna geometry
The geometry of the antenna can be related to the lowest (cut-off) frequency fc of its design band
[6] by
c
df
D52500
(2)
cfH
75000 (3)
24
1cDS (4)
with Dd (disc diameter) and H (cone length) in mm and fc in MHz The half-angle of the cone apex
controls the impedance of the antenna
For a cut-off frequency of 200 MHz Dd = 262 mm H = 375 mm and S = 3 mm For an input
impedance of 50 Ω Θh = 30deg (The non-critical dimensions R Dc1 and Dc2 were chosen to be 08 mm
381 mm and 12 mm the latter two being related by Θh) This antenna was simulated using design
software and predicts a good (better than 10 dB) return-loss between 260 MHz and 800 MHz The
apex angle was varied to minimize the lower frequency of the 10 dB return-loss window and
improvement was obtained with a cone flare angle of 20 degrees The lower frequency edge of the 10
dB window was thereby reduced to 227 MHz (The high frequency edge of the window was increased
to 1050 MHz) The prototype antenna was constructed from aluminium sheet (thickness 082 mm)
The measured return-loss and input impedance of the antenna are shown in Figure 3 (The measured
results are somewhat surprisingly better than the simulated results)
(a) Return loss
Dc1 Dc2
H
Dd
S 2R
Θh
25th International Congress on Condition Monitoring and Diagnostic Engineering IOP PublishingJournal of Physics Conference Series 364 (2012) 012053 doi1010881742-65963641012053
5
(b) Input impedance
Figure 3 Measured antenna characteristics
A demonstration of the antennarsquos PD detection capability has been undertaken using a test cell PD
generator The PD generator is described in Subsection 42 The antenna was located 12 m from the
generator and a spectrum analyzer was used to observe the power spectrum of the received signal The
spectrum analyzer IF band used in the measurement was 10 - 500 MHz and the sweep speed was
13724 GHzs An example of the noise spectrum is shown in Figure 4
Figure 4 Noise spectrum of PD generated by test cell (measured using a diskcone antenna)
Further and more rigorous characterization of the antenna is required but these early result are
encouraging The noise floor in this simple test is at least 24 dB below the maximum signal level in
the spectrum Assuming the signal decays with distance at 6 dBoctave (corresponding to free-space
propagation) this implies a range of 12times2(246)
= 192 m before the signal reaches the noise floor A
practical system probably requires a range closer to 30 m if the density of radiometer sensors required
to cover an entire substation is not to be prohibitively high These early (and elementary) results are
nevertheless encouraging
The antenna described above has been interfaced to an RF power detector (Linear Technology -
LT5538) and microcontroller (Analog Devices ndash AduC841) Figure 5 shows the schematic diagram of
25th International Congress on Condition Monitoring and Diagnostic Engineering IOP PublishingJournal of Physics Conference Series 364 (2012) 012053 doi1010881742-65963641012053
6
the RF Filtering and Electronics block the output of this circuit is connected to the microcontroller
analog to digital converter which manage the power information and transmit it using a ZigBee
transceiver
Figure 5 Prototype radiometer circuit
The prototype radiometer is shown in Figure 6 A discharge generator has been used to
demonstrate the plausibility of a radiometer based on these components
Figure 6 Simplified radiometer prototype
Consideration has been given to the realization of the PD emulator that would be used for
transmission-loss calibration in the iterative location algorithm The core of the emulator is a low-cost
short-duration pulse generator The pulse duration realized is comparable with those pulses that occur
in PD
The emulator uses the power system waveform to synchronize emulated PD pulses and the power
system cycle (This is not necessary for the calibration of path loss but is a facility incorporated to
allow the laboratory emulation of PD for other purposes) It comprises two subsystems a monostable
to generate pulses and a high-pass filter to shorten the pulse ndash the degree of shortening determined by
the monostable pulse rise time Using this approach emulated PD pulses with variable amplitude and
rate (from 390 kHz to 242 MHz) can be generated The system is managed by the same
microcontroller used for data acquisition Figure 7 which drives a set of analog switches to set up the
25th International Congress on Condition Monitoring and Diagnostic Engineering IOP PublishingJournal of Physics Conference Series 364 (2012) 012053 doi1010881742-65963641012053
7
pulse parameters The emulated PD is increased in power using a 12 dB RF amplifier and then
radiated via a whip antenna
Figure 7 PD emulation
Figure 8 shows an emulated PD pulse
Figure 8 Emulated PD pulse
42 PD cell
An artificial PD cell has been developed to assess the detection sensitivity and location accuracy
available from the prototype PD WSN during development It will also be used to validate the
effectiveness of the PD WSN after deployment and assess its location accuracy
Artificial PD cells contain electrodes connected to a high potential Electrodes of different shapes
can be used to reproduce different kind of PD including corona surface discharge and discharge in
internal insulation voids The space between the electrodes is occupied by the particular insulation of
interest eg oil SF6 or solid dielectric [7 8 9 10 11 12 13]
25th International Congress on Condition Monitoring and Diagnostic Engineering IOP PublishingJournal of Physics Conference Series 364 (2012) 012053 doi1010881742-65963641012053
8
The cell is of a conventional design and therefore requires a high voltage (HV) supply For the
work reported here the HV transformer in Federal University of Campina Grande (UFCG) High
Voltage Laboratory was used The final version of the PD generator is required to be portable and to
operate from low-voltage batteries It will therefore incorporate voltage step-up circuitry
The PD generator applies an electric field to an insulator containing a well-specified imperfection
Comsol Multiphysics was used to simulate the field intensity inside a cylindrical insulation void as
part of the cell design process An acrylic cylinder with an external diameter of 45 mm and an internal
diameter of 32 mm was adopted as the basic cell housing and a 60 Hz sinusoidal voltage of 10 kV rms
was applied between a pair of parallel circular electrodes The radius of the electrodes is 20 mm The
simulation results predicted an electric field-strength inside the insulation void of 120 kVcm
sufficient to cause PD
The prototype PD cell was constructed from an acrylic tube incorporating plane (ie flat) HV
electrodes Figure 9 The electrodes are parallel and circular with a radius of 20 mm and a thickness of
2 mm The edges of the electrodes are rounded to avoid the enhanced electric field strength that would
occur close to a sharp edge Two nylon screws are used to set the electrode separation
Nylon screw to manage electrodes separation
Acrylic tube
Insulator with fail
Figure 9 PD cell (dimensions in mm)
The test piece emulating a region of defective insulation is placed in the gap between the
electrodes The results reported here are for a single cylindrical cavity in a block of insulation with
plane parallel boundaries The orientation of the cavity is such that its axis of symmetry is
perpendicular both to the plane surfaces of the insulation and to the plane surfaces of the electrodes
The test piece was constructed by compressing three to five insulating plates in a layered sandwich
between the two electrodes The insulation defect is realized by pre-drilling a hole through one layer in
the middle of the sandwich The space around the test object and electrodes was filled with
transformer oil to avoid surface discharges and minimize corona Several different types of insulation
defects have been emulated each test piece being subjected to a 60 Hz voltage between 10 and 20 kV
rms Test results using two emulated defects are presented here Defect 1 is a cavity with diameter of 2
mm and length 16 mm Defect 2 is a cavity with diameter 1 mm and length 16 mm The test results
comprising apparent charge (Q) plotted against power system phase (φ) obtained using the LDS-6
commercial PD monitoring and diagnosis system manufactured by the Doble Lemke Groupreg are
shown in Figure 10
25th International Congress on Condition Monitoring and Diagnostic Engineering IOP PublishingJournal of Physics Conference Series 364 (2012) 012053 doi1010881742-65963641012053
9
(a) PD Q - φ diagram resulting from defect 1
(b) PD Q - φ diagram resulting from defect 2
Figure 10 Example PD generated by cell
5 Conclusions
The principles of a proposed low-cost self-calibrating radiometric PD WSN using a network of free-
standing radiometers for real-time power system condition monitoring asset management and
operational optimization have been described Such a WSN would be a significant component in the
future smart grid Early progress in the development of components for the system has been presented
The core components of the WSN (antenna radiometer sensor and pulse emulator) have been
prototyped in a simplified form and their basic functionality has been demonstrated A PD cell for
validation of the PD WSN has also been described It seems likely from this preliminary work that a
PD radiometer network of the type proposed could be implemented at a sufficiently low cost to allow
widespread deployment in the power system with a sensor density sufficient to localize sources of PD
Funding is currently being sought to develop a practical prototype network for deployment in a real
scenario
References
[1] Moore P J Portugues I and Glover I A Radiometric location of partial discharge sources on
energised high-voltage plant IEEE Trans in Power Delivery vol 20 no 3 pp 2264-2272
July 2005
[2] Farahani S ZigBee Wireless Network and Transceivers 1 ed 30 corporate drive suite 400
burlington MA 01803 USA Newnes 2008 ISBN 978-0-7506-8393-7
[3] Glover I A Grant P M Digital Communications 3rd ed Pearson 2009
25th International Congress on Condition Monitoring and Diagnostic Engineering IOP PublishingJournal of Physics Conference Series 364 (2012) 012053 doi1010881742-65963641012053
10
[4] Souza Neto JMR Silva J J C Cavalcanti T C M Rodrigues D P da Rocha Neto J S Glover
IA Propagation measurements and modeling for monitoring and tracking in animal
husbandry applications Instrumentation and Measurement Technology Conference
(I2MTC) 2010 IEEE vol no pp1181-1185 3-6 May 2010 doi 101109IMTC2010548
[5] Stutzman WL amp Thiele GA ldquoAntenna Theory and Designrdquo 1st Ed 1981 pp 274
[6] PoPtronix ldquoDiscone VHF - UHF Antennardquo Eletronix Handbook 1997Biographies
[7] Jian Li Caixin Sun Grzybowski S Partial Discharge Image Recognition Influenced by
Fractal Image Compression Dielectrics and Electrical Insulation IEEE Transactions on
vol15 no2 pp496-504 April 2008 doi 101109TDEI20084483470 URL
httpieeexploreieeeorgstampstampjsptp=amparnumber=4483470ampisnumber=4483444
[8] Hampton BF Meats RJ Diagnostic measurements at UHF in gaacutes insulated substations
Generation Transmission and Distribution IEE Proceedings C vol135 no2 pp137-145
Mar 1988 URL
httpieeexploreieeeorgstampstampjsptp=amparnumber=6354ampisnumber=316
[9] Raja K Devaux F Lelaidier S Recognition of discharge sources using UHF PD
signatures Electrical Insulation Magazine IEEE vol18 no5 pp8-14 Sept-Oct 2002
doi 101109MEI20021044316 URL
httpieeexploreieeeorgstampstampjsptp=amparnumber=1044316ampisnumber=22381
[10] Elborki MA Crossley PA Wang ZD Darwin A Edwards G Detection and
characterisation of partial discharges in transformer defect models Power Engineering
Society Summer Meeting 2002 IEEE vol1 no pp405-410 vol1 25-25 July 2002 doi
101109PESS20021043266 URL
httpieeexploreieeeorgstampstampjsptp=amparnumber=1043266ampisnumber=22348
[11] Rengarajan S Parmar RN Bhoomaiah A Kuntia JS Development of an UHF
detection system for partial discharge measurement in transformer insulation Electrical
Insulation 2008 ISEI 2008 Conference Record of the 2008 IEEE International Symposium
on vol no pp100-103 9-12 June 2008 doi 101109ELINSL20084570288 URL
httpieeexploreieeeorgstampstampjsptp=amparnumber=4570288ampisnumber=4570258
[12] Cavallini A Ciani F Mazzanti G Montanari GC First electron availability and partial
discharge generation in insulation cavities effect of light irradiation Dielectrics and
Electrical Insulation IEEE Transactions on vol12 no2 pp 387- 394 April 2005 doi
101109TDEI20051430406 URL
httpieeexploreieeeorgstampstampjsptp=amparnumber=1430406ampisnumber=30847
[13] Kwang-Hwa Kim Sang-Hwa Yi Jong-Ho Sun Study on frequency spectra of partial
discharge according to defects and couplers Power Engineering Conference 2007 IPEC
2007 International vol no pp1268-1272 3-6 Dec 2007 URL
httpieeexploreieeeorgstampstampjsptp=amparnumber=4510220ampisnumber=4509990
25th International Congress on Condition Monitoring and Diagnostic Engineering IOP PublishingJournal of Physics Conference Series 364 (2012) 012053 doi1010881742-65963641012053
11
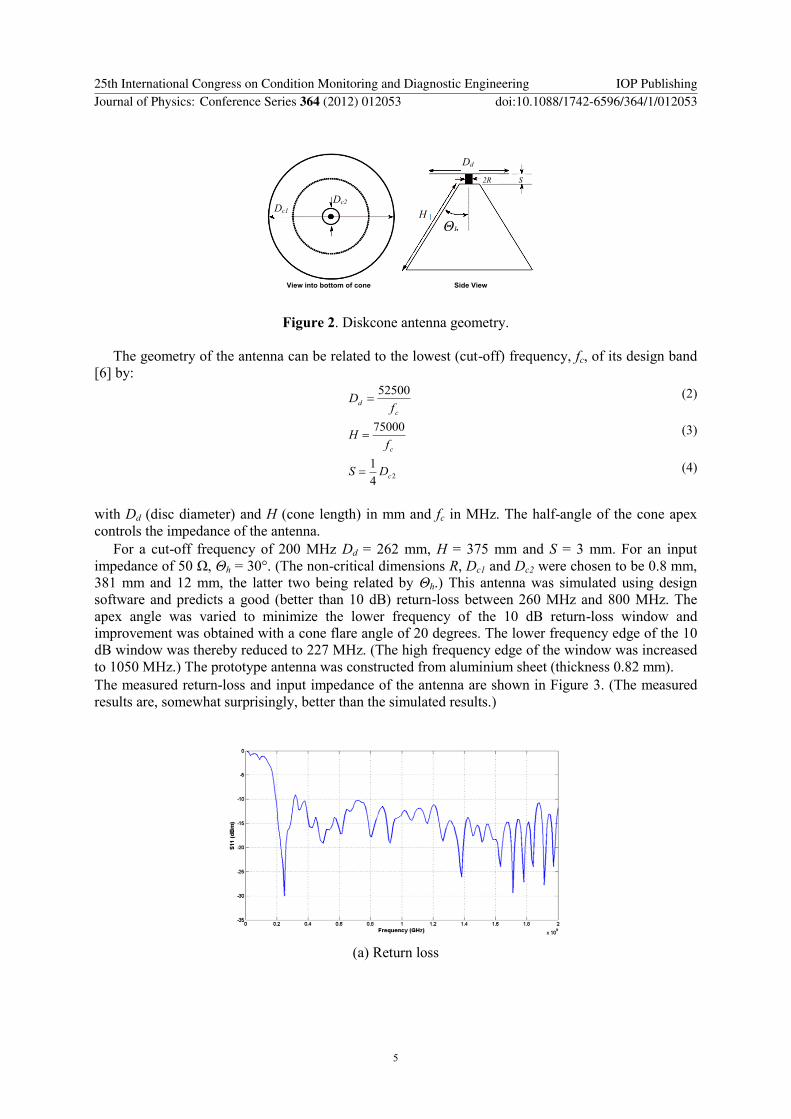
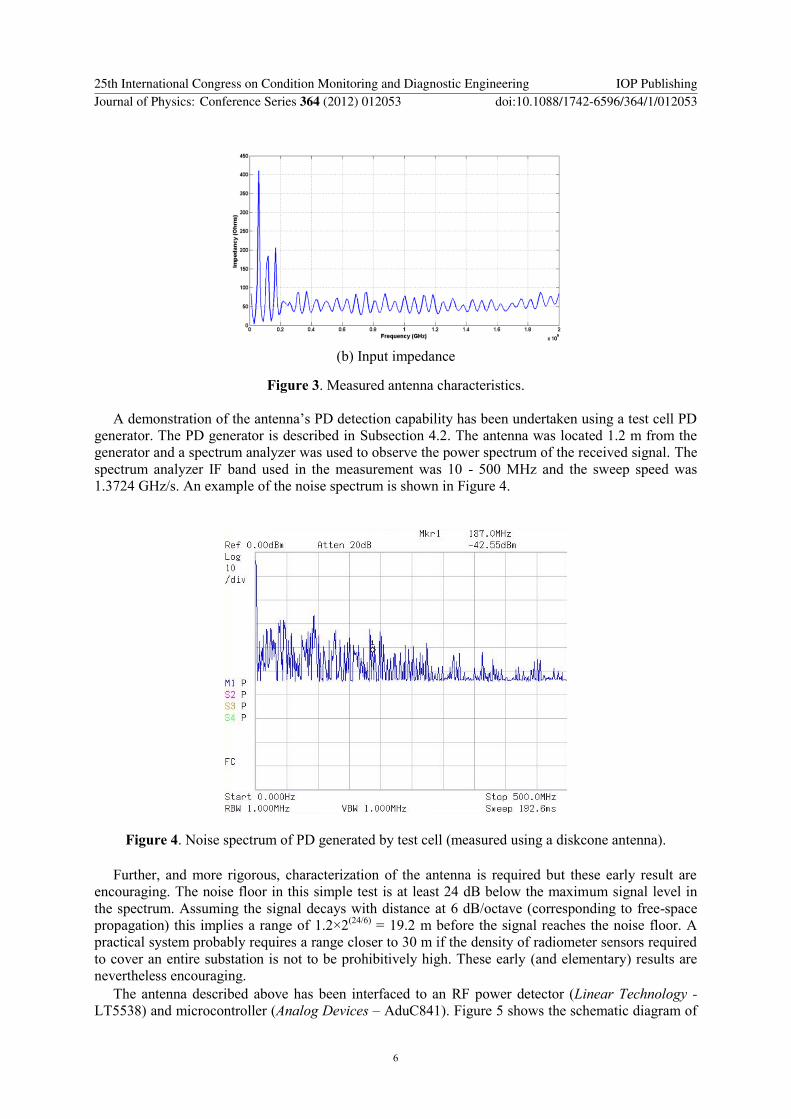
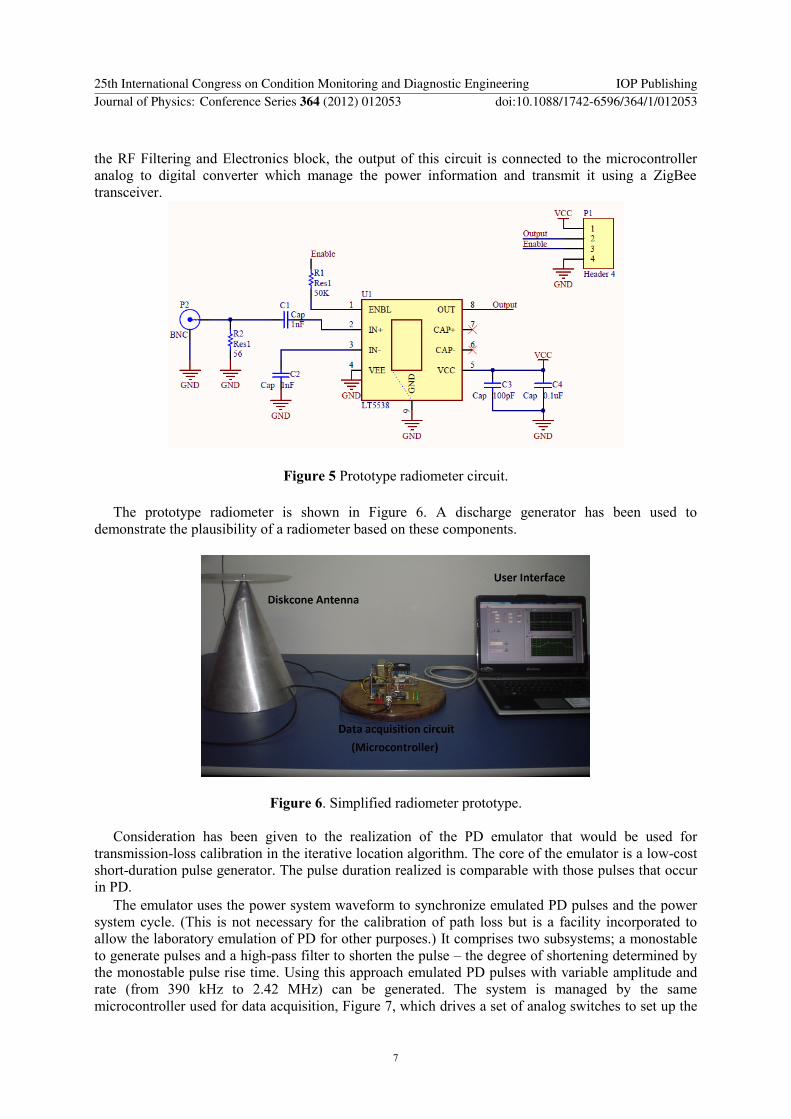
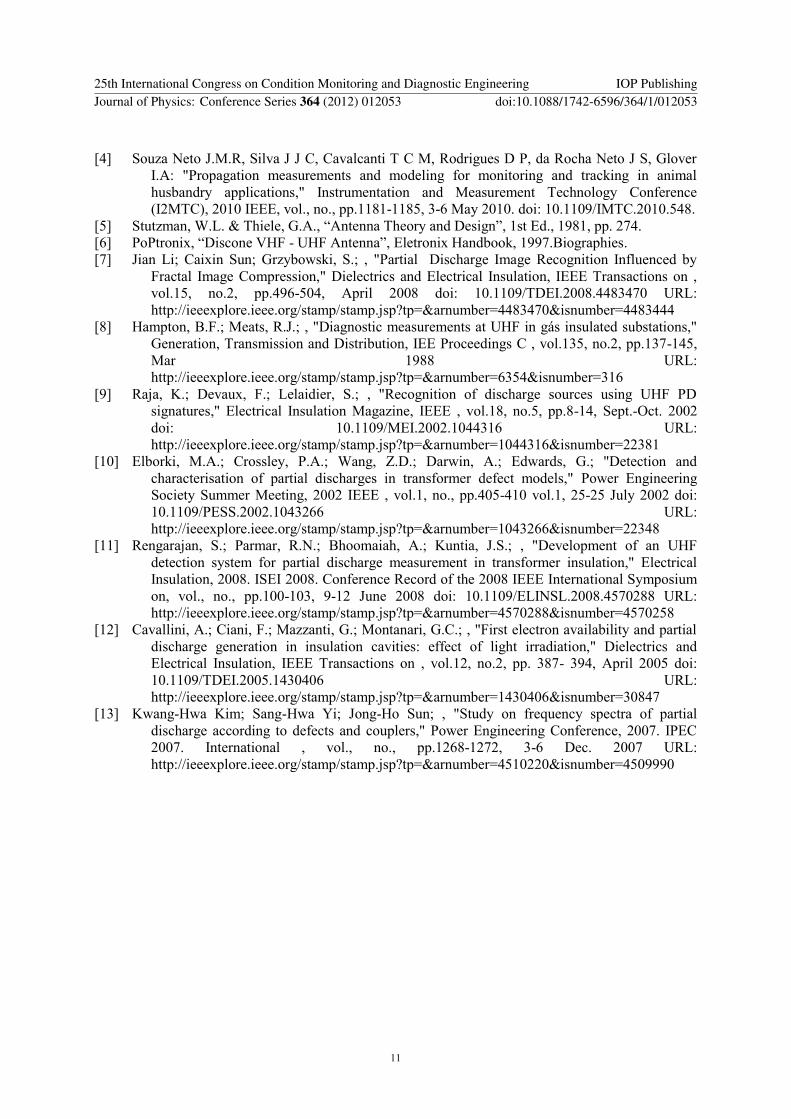


![The Advanced Microwave Radiometer – Climate Quality (AMR-C) … · 2018-03-08 · Microwave Radiometer (HRMR) [6] and a Supplemental Calibration System (SCS). The radiometer channels](https://img.pdfslide.net/doc/110x75/5f35db4eb6ba30245530385e/the-advanced-microwave-radiometer-a-climate-quality-amr-c-2018-03-08-microwave.jpg)