Embed Size (px)
Citation preview
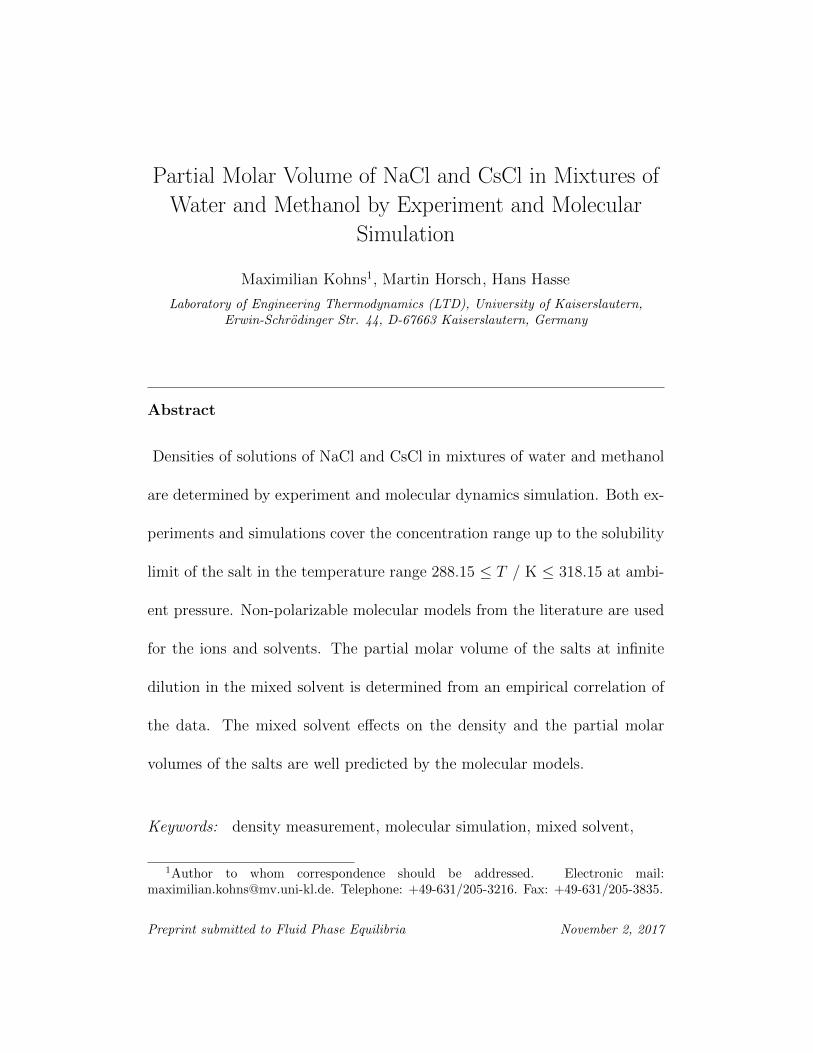
Partial Molar Volume of NaCl and CsCl in Mixtures of
Water and Methanol by Experiment and Molecular
Simulation
Maximilian Kohns1, Martin Horsch, Hans Hasse
Laboratory of Engineering Thermodynamics (LTD), University of Kaiserslautern,Erwin-Schrodinger Str. 44, D-67663 Kaiserslautern, Germany
Abstract
Densities of solutions of NaCl and CsCl in mixtures of water and methanol
are determined by experiment and molecular dynamics simulation. Both ex-
periments and simulations cover the concentration range up to the solubility
limit of the salt in the temperature range 288.15 ≤ T / K ≤ 318.15 at ambi-
ent pressure. Non-polarizable molecular models from the literature are used
for the ions and solvents. The partial molar volume of the salts at infinite
dilution in the mixed solvent is determined from an empirical correlation of
the data. The mixed solvent effects on the density and the partial molar
volumes of the salts are well predicted by the molecular models.
Keywords: density measurement, molecular simulation, mixed solvent,
1Author to whom correspondence should be addressed. Electronic mail:[email protected]. Telephone: +49-631/205-3216. Fax: +49-631/205-3835.
Preprint submitted to Fluid Phase Equilibria November 2, 2017

electrolyte solution
1. Introduction1
A sound knowledge of thermophysical properties of electrolyte solutions is2
important for the understanding of natural processes and the design of a3
wide variety of industrial processes. Aqueous electrolyte solutions have been4
studied extensively, and more recently, also non-aqueous electrolyte solutions5
have drawn significant attention, because of their importance e.g. in energy6
storage. However, solutions of salts in mixed solvents have been studied only7
rarely up to now. In the present work, we therefore investigate the den-8
sity and related volumetric properties in mixed solvent electrolyte solutions,9
where the electrolytes are either NaCl or CsCl and the solvent is a mixture10
of water and methanol.11
Several experimental studies on densities of solutions of alkali halide salts in12
mixtures of water and methanol have been reported in the literature. Take-13
naka et al. [1–3] report densities of such solutions for seven of the 17 alkali14
halide salts that are soluble both in water and in methanol, namely LiCl,15
NaCl, KCl, NaBr, KBr, NaI, and KI. For solutions of NaCl, there are three16
additional investigations [4–6], and Ivanov and Abrosimov [7] study solutions17
of KBr. Furthermore, there is a detailed investigation by Raatschen [8] on18
2

solutions of LiBr in mixtures of water and methanol. Werblan [5] reports19
data on the cesium halides, however, inspection of these data shows consid-20
erable scatter, cf. Section 4.3.21
Interestingly, densities of solutions of electrolytes in mixtures of water and22
methanol have hardly been studied with thermodynamic models. There are23
several modeling studies dealing with phase equilibria in such systems [9–24
19], however, most of the these works employ models for the excess Gibbs25
energy, so that solution densities cannot be obtained. Equations of state26
(EOS), which enable density calculations, have only very recently been ex-27
tended towards the modeling of mixed solvent electrolyte solutions. This28
is e.g. the case for the ePC-SAFT EOS [17], the SAFT-VRE EOS [18] and29
the electrolyte CPA EOS [19]. Molecular simulations are particularly attrac-30
tive for modeling mixed solvent electrolyte solutions due to the low number31
of adjustable parameters and a strong physical background. However, we32
are aware only of the work of Strauch and Cummings [12], who investigate33
the vapor-liquid equilibrium of solutions of NaCl in mixtures of water and34
methanol and also report the densities of the coexisting phases.35
In contrast, solutions of a salt - in most cases NaCl - in pure water have been36
studied extensively with molecular simulations in the recent literature. In37
3

these studies, mainly the differences between polarizable and non-polarizable38
models were investigated. Models including polarizability, such as the alkali39
halide models developed around the polarizable water models SWM4-DP40
[20] and BK3 [21], were found to perform better than non-polarizable ones in41
some aspects, e.g. concerning the description of activity coefficients [22, 23].42
Interestingly, this does not necessarily result in an improved prediction of the43
salt solubility [23]. When considering other properties such as the density,44
simple non-polarizable models are found to be of almost the same quality45
as the polarizable ones [23]. Furthermore, non-polarizable models can in46
principle describe a variety of properties of electrolyte solutions fairly well.47
However, the systematic assessment of Orozco et al. [24] shows that none of48
the existing model parameterizations is able to quantitatively describe sev-49
eral properties at once. This suggests that better model parameterizations50
can be found [25]. For a more detailed discussion of the recent advances in51
the field, see the comprehensive review by Nezbeda et al. [26].52
In the present work, we first report new experimental density data for the53
systems water-methanol-NaCl and water-methanol-CsCl. Our experiments54
cover the entire concentration range up to the solubility limit of the salt,55
and we report data for the temperatures 288.15, 293.15, 298.15, 308.15, and56
4

318.15 K. Second, we address the question whether simple non-polarizable57
molecular models based on Lennard-Jones (LJ) sites and partial charges can58
predict volumetric properties of the studied electrolyte solutions. In our dis-59
cussion, the partial molar volume of the salt at infinite dilution is of particu-60
lar interest, because it is a very sensitive property and provides a descriptive61
view of the salt-solvent interactions.62
Throughout this work, the composition of a ternary solution of a salt CA,63
which completely dissociates into the ions C+ and A−, in a mixture of wa-64
ter and methanol is described by the methanol mole fraction of the salt-free65
solvent mixture χMeOH66
χMeOH = nMeOH/(nMeOH + nW) (1)
and the true mole fraction of the cation xC+67
xC+ = nC+/(nC+ + nA− + nMeOH + nW), (2)
where ni are the mole numbers.68
5

2. Experiments69
Ultradry methanol (≤ 50 ppm water) with a purity of ≥ 99.9 % was pur-70
chased from Roth. Deionized water was produced by an Elix Essential 5UV71
of Merck Millipore and degassed by boiling before use. NaCl was purchased72
from Merck with a purity of ≥ 99.5 % and CsCl was purchased from Roth73
with a purity of ≥ 99.999 %. The salts were dried in a vacuum oven at 353 K74
for 24 h.75
The electrolyte solutions were prepared gravimetrically (AE240, Mettler-76
Toledo) in a glovebox (GS Glovebox Technik). In case of mixed solvents,77
about 200 ml of a stock solution of water + methanol of the desired com-78
position χMeOH was prepared first. All reported experimental data for one79
salt at one salt-free solvent composition χMeOH were obtained using one sin-80
gle stock solution. The solvent (pure or mixed) was then added to a known81
amount of salt to yield samples of about 20 ml. Uncertainties in the compo-82
sition variables χMeOH and xC+ were estimated from error propagation of the83
uncertainty of the balance. Thereby, the uncertainty of the salt-free solvent84
composition χMeOH is found to be better than ±0.00002 mol mol−1. The85
uncertainty of the mole fraction of the cation xC+ is found to be better than86
±0.0002 mol mol−1 in most cases, except for the highly concentrated CsCl87
6

solutions, for which it is up to ±0.0009 mol mol−1.88
As a guide to the accessible concentration range in case of solutions of NaCl,89
the solubility data of Pinho and Macedo [14] were used. They proved to be90
reliable during the present experiments. In case of CsCl, the solubility is only91
known for the pure solvents water [27] and methanol [28], but not for mixed92
solvents. As an estimate, we assumed the same qualitative dependence of93
the solubility on the composition of the solvent mixture as for NaCl.94
The densities of the samples were measured with a vibrating tube densimeter95
(DMA 4500 M, Anton Paar), which was calibrated with air and deionized96
water. Based on the repetition of several experiments and the resolution97
provided by the densimeter, the uncertainty of the reported densities is es-98
timated to be better than ±0.0001 g cm−3. The temperature was measured99
with the densimeter’s built-in thermometer, for which the supplier claims an100
uncertainty of ±0.1 K.101
To obtain the partial molar volume of the salt at infinite dilution v∞salt in the102
solvent from the measured densities, a simple empirical correlation is devel-103
oped in the present work, cf. Sections 4.1 and 4.2. The uncertainty in the104
numbers for v∞salt obtained from that correlation was estimated by randomly105
disturbing the measured densities with their uncertainty and using these val-106
7
ues for the fits. Thereby, the uncertainty in v∞salt is estimated to be better107
than ±0.5 cm3 mol−1 and thus of similar magnitude as the uncertainties108
reported by Takenaka et al. [1].109
3. Molecular Simulation110
In the present work, rigid, non-polarizable molecular models for the solvents111
and ions are employed. The water model SPC/E is taken from the literature112
[29], the ion models and the methanol model are taken from previous work113
of our group. For methanol, we employ the molecular model of Schnabel et114
al. [30], which was optimized with respect to the vapor-liquid equilibrium of115
pure methanol. For the ions, molecular models of the Lennard-Jones (LJ)116
+ point charge type from the ion model set of Reiser et al. [31] are used.117
The models of that set were trained together with the SPC/E water model118
mainly using density data of dilute aqueous solutions of all alkali halide salts119
[32]. Thus, the models used here for NaCl and CsCl were not optimized120
for describing the individual salts, but taken from an ion model set which121
includes all alkali and halide ions. Therefore, the Cl− model is the same for122
both salts studied here.123
Molecular dynamics (MD) simulations of methanol-water mixtures, employ-124
8

ing the Schnabel et al. [30] model for methanol and several popular water125
models (including SPC/E) were previously conducted by Guevara-Carrion126
et al. [33, 34] and Parez et al. [35], but with a focus on transport proper-127
ties. In another previous study [36], the predictions obtained from combining128
the ion models of the set of Reiser et al. [31] with the methanol model of129
Schnabel et al. [30] using the Lorentz-Berthelot combining rules were already130
studied. Good agreement with experimental data for solutions of all alkali131
halide salts in methanol was found even though the ion models had only132
been trained with data on aqueous solutions. Altogether, these results from133
previous studies suggest that the employed models are suited as a starting134
point for modeling ternary solutions.135
All models employ LJ sites and point or partial charges, so that the potential136
writes [37]137
U = ULJ + UC
=N−1∑i=1
N∑j=i+1
{ nLJi∑
a=1
nLJj∑b=1
4εijab
[(σijabrijab
)12
−(σijabrijab
)6]
+
nei∑
c=1
nej∑
d=1
1
4πε0
qicqjdrijcd
}, (3)
9

where the indices a, b, c, and d refer to model interaction sites and i and j138
refer to molecules (including ions), ε0 is the vacuum permittivity, εijab and139
σijab are the Lennard-Jones energy and size parameters, rijab and rijcd are140
site-site distances, and qic and qjd are the magnitudes of the point charges.141
The interaction between unlike LJ sites is described by the modified Lorentz-142
Berthelot combining rules [38, 39]143
σijab = ηijσiiaa + σjjbb
2, (4)
εijab =√εiiaaεjjbb. (5)
A binary interaction parameter ηij different from 1 is only employed in the144
unlike interaction water-methanol and adjusted to experimental data of the145
molar excess volume at 298.15 K, cf. Section 4.1. This correction is in-146
troduced into the Lorentz rule here as the unlike size parameter obviously147
shows a much larger influence on densities than the unlike energy parameter,148
which is in line with a general theoretical analysis by Fischer et al. [40]. The149
adjustment was carried out to ensure a good description of the volumetric150
properties of the salt-free solvent mixture. It has only a minor impact on the151
10

results obtained for the properties of the electrolytes in the mixed solvent on152
which we focus here.153
Densities were obtained by standard MD simulations in the NpT ensemble154
for the temperatures 288.15, 298.15 and 318.15 K. Simulation details are155
given in Appendix A. For each studied salt-free solvent composition, the156
simulations were carried up to the experimental solubility limit of the salt.157
To obtain the partial molar volume of the salt at infinite dilution in the sol-158
vent from the densities obtained in these simulations, the same correlation159
as for the measured densities was employed, cf. Sections 4.1 and 4.2.160
4. Results and Discussion161
The solution densities obtained from the experiments and the molecular sim-162
ulations are reported in Tables 1 - 4. The densities of the studied salt-free163
solvents are reported together with the data for NaCl. To improve the read-164
ability of the plots, in most figures we only display the experimental results165
for 288.15, 298.15 and 318.15 K, and omit those for 293.15 and 308.15 K.166
11

Table 1: Experimental data for the density of solutions of NaCl in mixtures ofwater and methanol at 1 bar. The uncertainties are: u(χMeOH) = ±0.00002mol mol−1, u(ρ) = ±0.0001 g cm−3, u(T ) = ±0.1 K. For xNa+ , the uncer-tainty of the last digit is given in parentheses, or omitted where it is below±0.0001 mol mol−1.
ρ / g cm−3
χMeOH / xNa+ / T / K
mol mol−1 mol mol−1 288.15 293.15 298.15 308.15 318.15
0 0 0.9991 0.9982 0.9970 0.9940 0.9902
0.0099(1) 1.0222 1.0210 1.0196 1.0162 1.0121
0.0196(2) 1.0447 1.0432 1.0416 1.0378 1.0335
0.0291(2) 1.0658 1.0641 1.0623 1.0582 1.0536
0.0385(3) 1.0867 1.0848 1.0828 1.0785 1.0737
0.0476(3) 1.1074 1.1054 1.1033 1.0987 1.0938
0.0566(4) 1.1272 1.1250 1.1227 1.1180 1.1129
0.0654(4) 1.1471 1.1448 1.1424 1.1374 1.1322
0.25 0 0.9421 0.9393 0.9364 0.9301 0.9234
0.0040 0.9503 0.9475 0.9445 0.9382 0.9315
0.0098(1) 0.9603 0.9574 0.9544 0.9480 0.9413
0.0229(2) 0.9845 0.9815 0.9784 0.9719 0.9651
0.0336(2) 1.0043 1.0012 0.998 0.9914 0.9845
0.5 0 0.8892 0.8854 0.8815 0.8736 0.8653
0.0020 0.8921 0.8883 0.8844 0.8765 0.8682
0.0049 0.8968 0.8930 0.8891 0.8811 0.8729
0.0079(1) 0.9014 0.8975 0.8937 0.8857 0.8775
0.0117(1) 0.9074 0.9036 0.8997 0.8917 0.8835
0.0146(1) 0.9125 0.9087 0.9048 0.8968 0.8886
0.0192(1) 0.9189 0.9150 0.9111 0.9031 0.8949
12

Table 1 continued.
ρ / g cm−3
χMeOH / xNa+ / T / K
mol mol−1 mol mol−1 288.15 293.15 298.15 308.15 318.15
0.75 0 0.8398 0.8355 0.8312 0.8224 0.8134
0.0013 0.8418 0.8375 0.8332 0.8245 0.8155
0.0027 0.8437 0.8395 0.8352 0.8264 0.8175
0.0053 0.8471 0.8428 0.8385 0.8298 0.8209
0.0079 0.8509 0.8467 0.8424 0.8337 0.8248
0.0104(1) 0.8558 0.8516 0.8473 0.8387 0.8298
0.0130(1) 0.8584 0.8541 0.8498 0.8412 0.8323
1 0 0.7959 0.7913 0.7866 0.7771 0.7675
0.0010 0.7974 0.7927 0.7880 0.7786 0.7690
0.0020 0.7989 0.7943 0.7896 0.7802 0.7707
0.0030 0.8001 0.7955 0.7908 0.7814 0.7719
0.0040 0.8014 0.7968 0.7921 0.7827 0.7733
0.0050 0.8029 0.7983 0.7937 0.7843 0.7748
0.0060 0.8041 0.7995 0.7949 0.7855 0.7761
0.0070 0.8057 0.8011 0.7964 0.7871 0.7777
13

Table 2: Experimental data for the density of solutions of CsCl in mixtures ofwater and methanol at 1 bar. The uncertainties are: u(χMeOH) = ±0.00002mol mol−1, u(ρ) = ±0.0001 g cm−3, u(T ) = ±0.1 K. For xCs+ , the uncertaintyof the last digit is given in parentheses, or omitted where it is below ±0.0001mol mol−1.
ρ / g cm−3
χMeOH / xCs+ / T / K
mol mol−1 mol mol−1 288.15 293.15 298.15 308.15 318.15
0 0.0099(1) 1.0697 1.0684 1.0670 1.0635 1.0592
0.0196(2) 1.1373 1.1358 1.1341 1.1301 1.1255
0.0292(2) 1.2033 1.2016 1.1996 1.1952 1.1902
0.0385(3) 1.2662 1.2642 1.2620 1.2573 1.252
0.0536(7) 1.3670 1.3646 1.3621 1.3567 1.3509
0.0690(9) 1.4669 1.4641 1.4613 1.4553 1.4486
0.25 0.0192(3) 1.0661 1.0650 1.0623 1.0564 1.0501
0.0370(5) 1.1664 1.1635 1.1604 1.1540 1.1471
0.0536(7) 1.2534 1.2501 1.2466 1.2395 1.2311
0.5 0.0074 0.9248 0.9208 0.9169 0.9088 0.9004
0.0146(1) 0.9597 0.9557 0.9517 0.9435 0.9350
0.0215(1) 0.9916 0.9876 0.9835 0.9751 0.9665
0.0283(2) 1.0241 1.0200 1.0158 1.0073 0.9986
0.0349(2) 1.0564 1.0522 1.0480 1.0394 1.0305
0.75 0.0025 0.8511 0.8468 0.8424 0.8336 0.8246
0.0050 0.8611 0.8568 0.8524 0.8436 0.8346
0.0074 0.8712 0.8669 0.8625 0.8536 0.8445
0.0098(1) 0.8808 0.8764 0.8720 0.8631 0.8540
0.0122(1) 0.8901 0.8857 0.8813 0.8723 0.8632
1 0.0012 0.8008 0.7961 0.7913 0.7818 0.7723
0.0025 0.8055 0.8008 0.7960 0.7865 0.7769
0.0037 0.8099 0.8052 0.8005 0.7910 0.7814
0.0049 0.8145 0.8098 0.8051 0.7955 0.7859
14

Table 3: Molecular simulation data for the density of solutions of NaCl inmixtures of water and methanol at 1 bar. For the density, the uncertainty ofthe last digit is given in parentheses.
ρ / g cm−3
χMeOH / xNa+ / T / K
mol mol−1 mol mol−1 288.15 298.15 318.15
0 0 1.0042(2) 0.9996(2) 0.9879(2)
0.02 1.0407(2) 1.0357(2) 1.0232(2)
0.04 1.0762(2) 1.0708(2) 1.0577(2)
0.06 1.1107(2) 1.1045(2) 1.0907(2)
0.25 0 0.9493(2) 0.9407(2) 0.9237(2)
0.01 0.9646(2) 0.9559(2) 0.9385(2)
0.02 0.9789(2) 0.9710(2) 0.9531(2)
0.03 0.9945(2) 0.9867(2) 0.9679(2)
0.5 0 0.8931(2) 0.8838(2) 0.8644(2)
0.005 0.8995(2) 0.8904(2) 0.8710(2)
0.01 0.9061(2) 0.8966(2) 0.8778(2)
0.015 0.9127(2) 0.9036(2) 0.8838(2)
0.75 0 0.8427(2) 0.8337(2) 0.8141(2)
0.004 0.8484(2) 0.8391(2) 0.8196(2)
0.008 0.8533(2) 0.8436(2) 0.8246(2)
0.12 0.8584(2) 0.8489(2) 0.8299(2)
1 0 0.7974(2) 0.7880(1) 0.7687(1)
0.002 0.8002(2) 0.7910(2) 0.7717(1)
0.004 0.8029(1) 0.7938(1) 0.7743(1)
0.006 0.8056(2) 0.7963(2) 0.7770(1)
15

Table 4: Molecular simulation data for the density of solutions of CsCl inmixtures of water and methanol at 1 bar. For the density, the uncertainty ofthe last digit is given in parentheses.
ρ / g cm−3
χMeOH / xCs+ / T / K
mol mol−1 mol mol−1 288.15 298.15 318.15
0 0.02 1.1262(2) 1.1212(2) 1.1086(2)
0.04 1.2437(2) 1.2379(2) 1.2245(2)
0.06 1.3549(2) 1.3487(2) 1.3353(2)
0.25 0.02 1.0493(2) 1.0404(2) 1.0226(2)
0.04 1.1470(2) 1.1378(3) 1.1194(2)
0.06 1.2420(2) 1.2331(3) 1.2143(2)
0.5 0.01 0.9358(2) 0.9256(2) 0.9061(2)
0.02 0.9772(2) 0.9678(2) 0.9479(2)
0.03 1.0182(3) 1.0100(2) 0.9900(2)
0.75 0.004 0.8576(2) 0.8486(2) 0.8287(2)
0.008 0.8720(2) 0.8627(2) 0.8432(2)
0.012 0.8869(2) 0.8775(2) 0.8578(2)
1 0.002 0.8041(2) 0.7943(1) 0.7751(1)
0.004 0.8105(1) 0.8012(1) 0.7818(1)
0.006 0.8175(1) 0.8079(1) 0.7886(1)
16

4.1. Salt-free Solvent Mixture167
Studying a ternary electrolyte solution first requires an adequate description168
of the salt-free solvent mixture. The volumetric behavior of the salt-free169
solvent mixture water-methanol is discussed here based on the molar excess170
volume vE171
vE(T, χMeOH) = v(T, χMeOH)− χMeOHvpureMeOH(T )− (1− χMeOH)vpureW (T ), (6)
where v is the molar volume of the mixture, vpurei are the pure component172
molar volumes, and the methanol mole fraction is χMeOH in our notation.173
Results for the molar excess volume of the mixture water + methanol at174
298.15 K are shown in Fig. 1.175
The experimental results from the present work are compared to a correlation176
of experimental data of Coquelet et al. [41]. Excellent agreement is observed.177
The deviations are below about ±0.01 cm3 mol−1. Furthermore, molecular178
simulation results from the present work are shown. They were obtained179
using ηW−MeOH = 0.993. That parameter was fit to reproduce the minimum180
of vE, which is found for equimolar composition both experimentally and181
17

0 0.2 0.4 0.6 0.8 1
−1
−0.8
−0.6
−0.4
−0.2
0
χMeOH / mol mol−1
vE/cm
3mol
−1
Figure 1: Molar excess volume of mixtures of water and methanol at298.15 K. (�) experimental data, this work, (◦) molecular simulation data,this work, (−) correlation of experimental data by Coquelet et al. [41], (−−)correlation of the present molecular simulation data.
in the simulations. The deviation of ηW−MeOH from 1 is only small. Using182
ηW−MeOH = 1, the minimum of vE is about 15% above the experimental183
result. Using the adjusted value of ηW−MeOH, the dependence of vE on χMeOH184
is predicted well by the simulation.185
The density of the salt-free solvent mixture is the basis for the correlation186
used here for describing the density of the ternary electrolyte solutions. As187
Coquelet et al. [41], we employ a Redlich-Kister type correlation, which in188
our notation writes as189
18

vE(T, χMeOH) = (1− χMeOH)χMeOH
∑k
Ak(T )(1− 2χMeOH)k, k = 0, 1, ... ,
(7)
where the Ak are fit parameters. We also use Eq. (7) here for correlating190
the molecular simulation data. The Redlich-Kister coefficients Ak for de-191
scribing the molar excess volume of mixtures of water and methanol for all192
temperatures studied here are presented in Appendix B, cf. Table B.1. Two193
parameter sets are reported. The first one describes the experimental data.194
It is adopted from Coquelet et al. [41], but also describes the present exper-195
imental results within their uncertainty. The second one is obtained from196
a fit to the present simulation data for the system water + methanol. The197
densities of pure water and pure methanol, which are needed in addition to198
the Redlich-Kister fit to calculate the density of the mixture, are taken from199
Tables 1 and 3.200
4.2. Electrolyte Solutions201
Fig. 2 shows the measured and simulated densities of solutions of NaCl and202
of CsCl in mixtures of water and methanol at 298.15 K.203
19

0 0.02 0.04 0.06
0.8
0.9
1
1.1
xNa+ / mol mol−1
ρ/gcm
−3
χMeOH = 0.00
0 0.01 0.02 0.03
0.8
0.9
1
1.1
xNa+ / mol mol−1
ρ/gcm
−3
χMeOH = 0.25
0 0.006 0.012 0.018
0.8
0.9
1
1.1
xNa+ / mol mol−1
ρ/gcm
−3
χMeOH = 0.50
0 0.004 0.008 0.012
0.8
0.9
1
1.1
xNa+ / mol mol−1
ρ/gcm
−3
χMeOH = 0.75
0 0.002 0.004 0.006
0.8
0.9
1
1.1
xNa+ / mol mol−1
ρ/gcm
−3
χMeOH = 1.00
0 0.02 0.04 0.06
0.8
1
1.2
1.4
xCs+ / mol mol−1
ρ/gcm
−3
χMeOH = 0.00
0 0.02 0.04 0.06
0.8
1
1.2
1.4
xCs+ / mol mol−1ρ/gcm
−3
χMeOH = 0.25
0 0.01 0.02 0.03
0.8
1
1.2
1.4
xCs+ / mol mol−1
ρ/gcm
−3
χMeOH = 0.50
0 0.004 0.008 0.012
0.8
1
1.2
1.4
xCs+ / mol mol−1
ρ/gcm
−3
χMeOH = 0.75
0 0.002 0.004 0.006
0.8
1
1.2
1.4
xCs+ / mol mol−1
ρ/gcm
−3
χMeOH = 1.00
Figure 2: Densities of solutions of NaCl (left column) and CsCl (right col-umn) in mixtures of water and methanol over the cation mole fraction at298.15 K. Results from the present work: (�) experiment, (◦) molecularsimulation, (−) correlation of experimental data, (−−) correlation of molec-ular simulation data.
20

For both salts in pure water (χMeOH = 0), the increase in the density upon204
addition of the salt is slightly underpredicted by the models. The salt models205
used here are not individual models but taken from an ion model set for206
all alkali halides, so that compromises regarding the performance for some207
salts had to be made [32]. However, the higher the methanol content in208
the mixture, the better the agreement between experiment and simulation.209
This is a remarkable finding since in the development of the ion models, only210
data on aqueous solutions were used. The influence of adding methanol is211
predicted surprisingly well by the models.212
In previous work of our group [36, 42], it was found that both for aqueous213
and methanolic solutions of alkali halide salts, the density of the solution is214
an almost perfectly linear function of the ion mole fraction. That finding was215
based on results for xC+ ≤ 0.05 mol mol−1. The present results, both from216
experiment and from molecular simulation, show that the linearity holds also217
up to the solubility limit for the studied salts. Additionally, the linear relation218
is also found to hold for mixed solvents. Thus, for the ternary electrolyte219
solutions, we employ the correlation220
21

ρ(T, χMeOH, xC+) = ρsolv(T, χMeOH) + bsalt(T, χMeOH) xC+ (8)
with bsalt =
(∂ρ
∂xC+
)T,χMeOH
, (9)
where ρsolv is the density of the salt-free solvent mixture, which is obtained221
as described in the previous section. The slope of the density bsalt was fit to222
the data for each individual solvent composition.223
In Fig. 3, the slope of the density bsalt determined from experimental and224
molecular simulation data is shown for 288.15, 298.15 and 318.15 K.225
0 0.2 0.4 0.6 0.8 1
1.2
1.4
1.6
1.8
2
2.2
χMeOH / mol mol−1
b NaC
l/gcm
−3
0 0.2 0.4 0.6 0.8 1
4
5
6
7
χMeOH / mol mol−1
b CsC
l/gcm
−3
Figure 3: Slope of the density bsalt, cf. Eq. (9), of NaCl solutions (left) andCsCl solutions (right) over the composition of the salt-free solvent mixturewater + methanol. Colors indicate the isotherms 288.15 K (blue), 298.15 K(gray) and 318.15 K (red). As the temperature influence is small, the resultsoverlap. Results from the present work: (�) experiment, (◦) molecular sim-ulation, (−) correlation of experimental data, (−−) correlation of molecularsimulation data.
22

The experimental data of the NaCl solutions reveal a surprising behavior:226
For aqueous solutions, the slope of the density decreases with increasing227
temperature. This trend is reversed for methanolic solutions. Furthermore,228
at approximately equimolar composition of the salt-free solvent mixture, the229
slope of the density is independent of the temperature. This behavior is also230
predicted by the molecular simulations. The experimental results show that231
bNaCl does not decline linearly with increasing χMeOH. The trend is predicted232
well by the molecular simulations. In the simulations, a shallow minimum is233
found for all temperatures, which is present in the experimental data only234
for the higher temperatures.235
The experimental data of the CsCl solutions show a more steady decline of the236
slope of the density when adding methanol to the solution. Comparing NaCl237
and CsCl in pure methanol, the temperature dependence is reversed: bNaCl238
decreases with increasing temperature, while bCsCl increases with increasing239
temperature. Consequently, for CsCl solutions the isotherms of the slope of240
the density do not intersect. In general, the temperature dependence of bCsCl241
is weaker than the temperature dependence of bNaCl. All this is predicted242
well by the molecular models.243
To establish a correlation, bsalt is described by a polynomial of second degree:244
23

bsalt(T, χMeOH) = b2,salt(T )χ2MeOH + b1,salt(T )χMeOH + b0,salt(T ) (10)
The fit parameters bk,salt were determined individually for each isotherm for245
both the experimental and the simulation data and are given in Appendix246
B, cf. Table B.2.247
Together with the pure component molar volumes of water and methanol,248
Eqs. (7), (8) and (10) fully determine the density in the ternary system249
water-methanol-salt. From that correlation, it is possible to deduce any250
volumetric property of interest. In the following, we focus on the partial251
molar volume of the salt at infinite dilution v∞salt in the mixed solvent with252
composition χMeOH. It can be shown that, from the correlation developed253
here, this quantity can be obtained as254
v∞salt(T, χMeOH) =−bsalt(T, χMeOH) Msolv +Msalt ρsolv(T, χMeOH)
ρsolv(T, χMeOH)2(11)
Msolv = χMeOHMMeOH + (1− χMeOH)MW, (12)
where Mi is the molar mass of component i.255
The results for the partial molar volume of both salts at infinite dilution as256
24

determined from experiments and predicted by the simulations are shown in257
Fig. 4.258
0 0.2 0.4 0.6 0.8 1−10
0
10
20
χMeOH / mol mol−1
v∞ NaC
l/cm
3mol−1
0 0.2 0.4 0.6 0.8 1
20
30
40
50
60
χMeOH / mol mol−1v∞ CsC
l/cm
3mol−1
Figure 4: Partial molar volume of the salt at infinite dilution v∞salt, cf. Eq. (11),of NaCl solutions (left) and CsCl solutions (right) over the composition of thesalt-free solvent mixture water + methanol. Colors indicate the isotherms288.15 K (blue), 298.15 K (gray) and 318.15 K (red). Results from the presentwork: (−) correlation of experimental data, (−−) correlation of molecularsimulation data.
Both for NaCl and CsCl, the partial molar volume of the salt is distinctly259
lower in methanol than in water. This indicates that the ions have a strong260
ordering effect especially on methanol. For NaCl solutions, v∞NaCl depends261
only weakly on χMeOH for χMeOH below about 0.5 mol mol−1, while for larger262
χMeOH an important decrease of v∞NaCl is observed. For CsCl solutions, the263
decrease of v∞CsCl is more steady.264
The temperature dependence of v∞salt is weak both for NaCl and CsCl. While265
v∞NaCl increases slightly with increasing temperature in water, it decreases266
25

with increasing temperature in methanol. The same is true for v∞CsCl. For267
both salts, there is a solvent composition for which the temperature depen-268
dence vanishes. For high temperatures, the partial molar volume of NaCl269
in methanol is negative. This is remarkable since despite addition of salt,270
the volume of the solution decreases. In contrast, the partial molar volume271
of CsCl in methanol is positive. Comparing both salts and considering that272
they comprise the same anion shows that especially Na+ ions have a strong273
influence on the structure of methanol.274
The experimental findings discussed above are correctly predicted by the275
molecular simulations. However, there are some quantitative differences276
which are of the order of 10 cm3 mol−1 for both salts. Fig. 4 clearly shows277
that they are induced by the models of the systems salt + pure solvent, while278
the effects of the mixed solvents are well predicted. Taking into account that279
the salt models were taken from an ion model set and not adjusted individ-280
ually and the fact that adjustments of the ion models were only made using281
experimental data for the solvent water, the predictions are of remarkable282
quality.283
To point out the different behavior of the salts in the two pure solvents water284
and methanol more clearly, the temperature dependence of v∞salt in both pure285
26

solvents is shown in Fig. 5.286
290 300 310 320−10
0
10
20χMeOH = 0
χMeOH = 1
T / K
v∞ NaCl/cm
3mol−1
290 300 310 320
20
40
60 χMeOH = 0
χMeOH = 1
T / K
v∞ CsC
l/cm
3mol−1
Figure 5: Partial molar volume of the salt at infinite dilution v∞salt, cf. Eq. (11),of NaCl solutions (left) and CsCl solutions (right) over the temperature.The two sets of data in each plot correspond to pure water as the solvent(χMeOH = 0, top) and pure methanol as the solvent (χMeOH = 1, bottom).Results from the present work: (�) experiment, (◦) molecular simulation.Dotted lines are guides to the eye.
As already known from Fig. 4, for both salts v∞salt increases with increasing287
temperature in an aqueous solution, while it decreases with increasing tem-288
perature in a methanolic solution. This feature and also the quantitative289
incline / decline is predicted well by the molecular simulations. It is instruc-290
tive to interpret this behavior in the light of Kirkwood-Buff theory [43–45].291
The present results indicate that for both salts in water, the total correlation292
of the ions with the solvent molecules is lowered with increasing temperature.293
In contrast, for both salts in methanol the total correlation of the ions with294
the solvent molecules is enhanced with increasing temperature. A rigorous295
27

assessment of this relation might be carried out using additional simulations.296
However, that study is beyond the scope of the present work as large system297
sizes are needed to avoid finite size effects [46] and Kirkwood-Buff integrals298
usually show poor convergence [47], which is especially cumbersome for the299
infinite dilution case studied here.300
4.3. Comparison of Experimental Data from the Literature and the Present301
Work302
For both systems studied in the present work, density data have been re-303
ported before.304
There are four sets of data for NaCl in solutions of water and methanol:305
Takenaka et al. [1] studied the system in great detail, covering the same con-306
centration and temperature ranges as the present work. Khimenko [4] and307
Werblan [5] studied only the isotherms 293.15 K and 298.15 K, respectively,308
and their works also cover only parts of the concentration range. For these309
two sets of data, the numbers were taken here from the Dortmund Data Bank310
[48] because the original sources could not be retrieved. The fourth data set311
on NaCl solutions is that of Guetachew et al. [6], who report densities at312
298.15 K. Unfortunately, it is difficult to compare their data to any of the313
other sets because their measurements were not carried out at constant com-314
28

positions of the salt-free solvent mixture. That data set is therefore omitted315
in the following discussion.316
For solutions of CsCl in mixtures of water and methanol, densities have so317
far only been reported by Werblan [5]. Also that data set was taken from318
the Dortmund Data Bank because the original source could not be retrieved.319
In Fig. 6, the experimental data from the literature are compared to the cor-320
relation of experimental data developed in the present work. Since different321
salt-free solvent compositions were studied in the literature, this comparison322
is carried out based on the slope of the density bsalt(χMeOH) at 298.15 K. To323
this end, the literature data were correlated using the same linear relation-324
ship as for the data of the present work, cf. Eq. (8). The linear trend was325
confirmed from inspection of the data of Takenaka et al. [1] and of Khimenko326
[4], while the data of Werblan [5] showed considerable scatter.327
For the pure solvents water and methanol, the results from experiments from328
previous work of our group [36, 42] are also included in Fig. 6. They are329
in very good agreement with the correlation developed in the present work.330
For solutions of NaCl in mixtures of water and methanol, the agreement331
between the data of Takenaka et al. [1] and the correlation to experimental332
data obtained in the present work is excellent. The data of Khimenko [4],333
29

0 0.2 0.4 0.6 0.8 1
1.5
2
2.5
χMeOH / mol mol−1
b NaCl/gcm
−3
0 0.2 0.4 0.6 0.8 1
4
5
6
7
χMeOH / mol mol−1
b CsC
l/gcm
−3
Figure 6: Slope of the density bsalt, cf. Eq. (9), of NaCl solutions (left) andCsCl solutions (right) over the composition of the salt-free solvent mixturewater + methanol. All displayed data are at 298.15 K except for the resultsof Khimenko [4], which are at 293.15 K. The lines represent the correlation ofexperimental data from the present work. Symbols denote experimental datafrom the literature: (�) Takenaka et al. [1], (×) Khimenko [4], (?) Werblan[5], (4) Reiser et al. [36, 42]. For solutions of NaCl and CsCl in pure water,the results of Reiser et al. [42] were interpolated between 293.15 and 303.15 K.
which were reported only for high water concentrations, deviate considerably334
from both our data and those of Takenaka et al. [1]. The same holds for most335
of the data of Werblan [5], which scatter very strongly.336
5. Conclusions337
Densities of solutions of NaCl and CsCl in mixtures of water and methanol338
were studied by experiment and molecular simulation. For the NaCl solu-339
tions, the experimental data from the present work are found to be in very340
good agreement to those reported by Takenaka et al. [1]. For the CsCl solu-341
30

tions, up to now only the unreliable data of Werblan [5] were available.342
The employed molecular models for the ions were taken from a set of models343
for all alkali and halide ions, for which the parameters were obtained by a344
fit to density data of dilute aqueous solutions only. The ion models are com-345
bined with established solvent models using the Lorentz-Berthelot combining346
rules. The models show excellent predictions for the dependence of the elec-347
trolyte solution density on the composition of the salt-free solvent mixture.348
Also the temperature dependence is predicted correctly. Some quantitative349
differences are found, which stem, however, from deviations in the models350
of the electrolytes in the pure solvents, for which no individual adjustments351
were carried out. Altogether, taking into account that the employed molec-352
ular models are very simple, the results are very encouraging.353
Both salts are found to behave differently in the two pure solvents water and354
methanol. The present results indicate that the effect of ions on methanol355
is even more pronounced than their effect on water. This is especially true356
for the Na+ ion. The good agreement between simulations and experiments357
shows that the employed models give a realistic picture of the solution be-358
havior. Therefore, subsequent molecular simulations should be carried out in359
future work, as they can provide additional insight into the solution behavior360
31

on the molecular level.361
Acknowledgments362
The authors gratefully acknowledge financial support by the Reinhart Kosel-363
leck Program (HA1993/15-1) of the German Research Foundation (DFG).364
The present work was conducted under the auspices of the Boltzmann-Zuse365
Society of Computational Molecular Engineering (BZS) and the simulations366
were carried out on the Regional University Computing Center Kaisers-367
lautern (RHRK) under the grant TUKL-TLMV, the High Performance Com-368
puting Center Stuttgart (HLRS) under the grant MMHBF as well as the Leib-369
niz Supercomputing Centre (LRZ) under the grant SPARLAMPE (pr48te).370
Funding371
This work was supported by the Reinhart Koselleck Program (HA1993/15-1)372
of the German Research Foundation (DFG).373
Appendix A. Simulation Details374
In the present work, MD simulations were carried out with the molecular375
simulation program ms2 [49]. Equilibration and production took 100,000376
and 2,000,000 time steps of length 1.2 fs, respectively. The equations of377
32

motion were integrated with a gear predictor-corrector scheme of fifth or-378
der. The simulations were run with a total of 1000 particles in the NpT379
ensemble, employing the velocity scaling thermostat and Andersen’s baro-380
stat. All interactions were evaluated explicitly up to the cutoff radius of 15381
A. The usual LJ long-range corrections to the virial and the energy were382
included. Electrostatic long-range interactions were calculated using Ewald383
summation, where the real and reciprocal space cutoff were 15 A. Statistical384
simulation uncertainties were estimated with the block average method by385
Flyvbjerg and Petersen [50].386
Appendix B. Correlation Parameters387
Tables B.1 and B.2 contain the parameters of the empirical density correla-388
tion developed in the present work.389
33

Table B.1: Parameters of the Redlich-Kister fits for the molar excess volumeof mixtures of water and methanol, cf. Eq. (7).
Experimenta Simulationb
T / K A0 A1 A2 A3 A4 A5 A0 A1 A2
288.15 −4.024 −0.319 0.113 0.382 0.621 0.291 −4.147 0.359 −0.387
293.15 −4.047 −0.314 0.125 0.462 0.475 −0.073 − − −298.15 −4.069 −0.299 0.121 0.492 0.388 −0.283 −4.094 0.152 −0.492
308.15 −4.111 −0.219 0.082 0.378 0.328 −0.254 − − −318.15 −4.146 −0.090 0.001 0.105 0.437 0.235 −4.020 0.139 −0.697
aTaken from Coquelet et al. [41]bNo simulations were carried out for 293.15 K and 308.15 K
34

Table B.2: Parameters of the polynomial fits to the slope of the density, cf.Eq. (10).
NaCl
Experiment Simulationa
T / K b2,NaCl b1,NaCl b0,NaCl b2,NaCl b1,NaCl b0,NaCl
288.15 1.0506 −1.9072 2.2658 0.9993 −1.3956 1.7788
293.15 1.0167 −1.8504 2.2444 − − −298.15 0.9843 −1.7991 2.2255 0.9330 −1.3336 1.7662
308.15 0.9880 −1.7470 2.1975 − − −318.15 0.9829 −1.6953 2.1778 0.9654 −1.2788 1.7172
CsCl
Experiment Simulationa
T / K b2,CsCl b1,CsCl b0,CsCl b2,CsCl b1,CsCl b0,CsCl
288.15 1.9178 −5.0312 6.8499 1.6940 −4.1679 5.8345
293.15 1.8580 −4.9636 6.8225 − − −298.15 1.8465 −4.9312 6.8002 1.5320 −4.0245 5.8094
308.15 1.7835 −4.8498 6.7596 − − −318.15 1.7780 −4.8008 6.7170 1.5604 −4.0167 5.7797
aNo simulations were carried out for 293.15 K and 308.15 K
35

Nomenclature390
Abbreviations391
EOS Equation of state
LJ Lennard-Jones
MeOH Methanol
MD Molecular dynamics
W Water
Symbols392
bsalt Slope of the density versus ion mole fraction
ε LJ energy parameter
ε0 Vacuum permittivity
ni Number of moles of component i
nji Number of sites of type j on molecule i
N Number of molecules
ηij Binary interaction parameter
Mi Molar mass of component i
q Point charge
ρ Mass density
r Distance
36

σ LJ size parameter
T Temperature
u(z) Uncertainty of the property z
U Potential
v Molar volume
vE Molar excess volume
vi Partial molar volume of component i
vpurei Molar volume of pure component i
xi Mole fraction of component i
χMeOH Methanol mole fraction in the salt-free solvent mixture
Subscripts and Superscripts393
a, b, c, d Site index
e Electrostatic
i, j Component / molecule index
k Index for fit parameters
salt Either NaCl or CsCl
solv Solvent
∞ At infinite dilution
37

References394
[1] N. Takenaka, T. Takemura, M. Sakurai, Partial Molar Volumes of Uni-395
Univalent Electrolytes in Methanol plus Water 1: Lithium Chloride,396
Sodium Chloride, and Potassium Chloride, J. Chem. Eng. Data 39397
(1994) 207–213. doi:10.1021/je00014a004.398
[2] N. Takenaka, T. Takemura, M. Sakurai, Partial Molar Volumes of399
Uni-Univalent Electrolytes in Methanol plus Water 2: Sodium Bro-400
mide and Potassium Bromide, J. Chem. Eng. Data 39 (1994) 796–801.401
doi:10.1021/je00016a036.402
[3] N. Takenaka, T. Takemura, M. Sakurai, Partial Molal Volumes of403
Uni-Univalent Electrolytes in Methanol plus Water 3. Sodium Io-404
dide and Potassium Iodide, J. Chem. Eng. Data 39 (1994) 802–807.405
doi:10.1021/je00016a037.406
[4] M. Khimenko, Russ. J. Phys. Chem. 43 (1969) 1043–1046.407
[5] L. Werblan, Bull. Acad. Pol. Sci. Ser. Sci. Chim. 27 (1979) 873–890.408
[6] T. Guetachew, S. Ye, I. Mokbel, J. Jose, P. Xans, Study of NaCl solu-409
tions in a mixed solvent H2O-CH3OH: Experimental densities and com-410
38

parison with calculated values obtained with a modified Pitzer’s model,411
J. Solution Chem. 25 (1996) 895–903. doi:10.1007/BF00972580.412
[7] E. Ivanov, V. Abrosimov, Volumetric properties of a stoichiometric mix-413
ture of K+ and Br− ions in H/D isotope-substituted aqueous methanol414
at 278.15-318.15 K: I. The H2O-CH3OH-KBr system, Russ. J. Inorg.415
Chem. 51 (2006) 662–669. doi:10.1134/S0036023606040279.416
[8] W. Raatschen, Thermophysikalische Eigenschaften von Methanol /417
Wasser - Lithiumbromid Losungen, Deutscher Kalte und Klimatechnis-418
cher Verein e.V., Stuttgart, 1985.419
[9] A. Gupta, Thermodynamics of Electrolytes in Mixed Solvents - Appli-420
cation of Pitzer’s Thermodynamic Equations to Activity Coefficients of421
1-1 Electrolytes in Methanol-Water Mixtures, J. Phys. Chem. 83 (1979)422
2986–2990. doi:10.1021/j100486a010.423
[10] B. Mock, L. Evans, C. Chen, Thermodynamic Representation of Phase424
Equilibria of Mixed-Solvent Electrolyte Systems, AIChE J. 32 (1986)425
1655–1664. doi:10.1002/aic.690321009.426
[11] I. Kikic, M. Fermeglia, P. Rasmussen, UNIFAC Prediction of Vapor-427
39

Liquid-Equilibria in Mixed-Solvent Salt Systems, Chem. Eng. Sci. 46428
(1991) 2775–2780. doi:10.1016/0009-2509(91)85146-O.429
[12] H. J. Strauch, P. T. Cummings, Gibbs Ensemble Simulation of Mixed-430
Solvent Electrolyte Solutions, Fluid Phase Equilib. 86 (1993) 147–172.431
doi:10.1016/0378-3812(93)87173-X.432
[13] C. Achard, C. Dussap, J. Gros, Representation of Vapor-Liquid-433
Equilibria in Water-Alcohol Electrolyte Mixtures with a Modified UNI-434
FAC Group-Contribution Method, Fluid Phase Equilib. 98 (1994) 71–89.435
doi:10.1016/0378-3812(94)80109-6.436
[14] S. Pinho, E. Macedo, Representation of salt solubility in mixed sol-437
vents: A comparison of thermodynamic models, Fluid Phase Equilib.438
116 (1996) 209–216. doi:10.1016/0378-3812(95)02889-7.439
[15] M. Iliuta, K. Thomsen, P. Rasmussen, Extended UNIQUAC model for440
correlation and prediction of vapour-liquid-solid equilibria in aqueous441
salt systems containing non-electrolytes. Part A. Methanol-water-salt442
systems, Chem. Eng. Sci. 55 (2000) 2673–2686. doi:10.1016/S0009-443
2509(99)00534-5.444
[16] F. Deyhimi, Z. Karimzadeh, M. Abedi, Pitzer and Pitzer-Simonson-445
40

Clegg ion-interaction modeling approaches: Ternary HCl plus methanol446
plus water electrolyte system, J. Mol. Liq. 150 (2009) 62–67.447
doi:10.1016/j.molliq.2009.09.014.448
[17] C. Held, A. Prinz, V. Wallmeyer, G. Sadowski, Measuring and449
modeling alcohol/salt systems, Chem. Eng. Sci. 68 (2012) 328–339.450
doi:10.1016/j.ces.2011.09.040.451
[18] J. Schreckenberg, S. Dufal, A. Haslam, C. Adjiman, G. Jackson,452
A. Galindo, Modelling of the thermodynamic and solvation proper-453
ties of electrolyte solutions with the statistical associating fluid the-454
ory for potentials of variable range, Mol. Phys. 112 (2014) 2339–2364.455
doi:10.1080/00268976.2014.910316.456
[19] B. Maribo-Mogensen, K. Thomsen, G. Kontogeorgis, An electrolyte457
CPA equation of state for mixed solvent electrolytes, AIChE J. 61 (2015)458
2933–2950. doi:10.1002/aic.14829.459
[20] G. Lamoureux, B. Roux, Absolute hydration free energy scale for alkali460
and halide ions established from simulations with a polarizable force461
field, J. Phys. Chem. B 110 (2006) 3308–3322. doi:10.1021/jp056043p.462
41

[21] P. Kiss, A. Baranyai, A new polarizable force field for alkali and halide463
ions, J. Chem. Phys. 141 (2014) 114501. doi:10.1063/1.4895129.464
[22] H. Jiang, Z. Mester, O. Moultos, I. Economou, A. Panagiotopoulos,465
Thermodynamic and Transport Properties of H2O + NaCl from Po-466
larizable Force Fields, J. Chem. Theory Comput. 11 (2015) 3802–3810.467
doi:10.1021/acs.jctc.5b00421.468
[23] F. Moucka, I. Nezbeda, W. Smith, Chemical Potentials, Activity Coef-469
ficients, and Solubility in Aqueous NaCl Solutions: Prediction by Po-470
larizable Force Fields, J. Chem. Theory Comput. 11 (2015) 1756–1764.471
doi:10.1021/acs.jctc.5b00018.472
[24] G. Orozco, O. Moultos, H. Jiang, I. Economou, A. Panagiotopou-473
los, Molecular simulation of thermodynamic and transport proper-474
ties for the H2O+NaCl system, J. Chem. Phys. 141 (2014) 234507.475
doi:10.1063/1.4903928.476
[25] M. Kohns, M. Schappals, M. Horsch, H. Hasse, Activities in Aqueous477
Solutions of the Alkali Halide Salts from Molecular Simulation, J. Chem.478
Eng. Data 61 (12) (2016) 4068–4076. doi:10.1021/acs.jced.6b00544.479
[26] I. Nezbeda, F. Moucka, W. Smith, Recent progress in molec-480
42

ular simulation of aqueous electrolytes: force fields, chemi-481
cal potentials and solubility, Mol. Phys. 114 (2016) 1665–1690.482
doi:10.1080/00268976.2016.1165296.483
[27] D. Lide (Ed.), CRC Handbook of Chemistry and Physics, Internet Ver-484
sion 2005, CRC Press, Boca Raton, 2005.485
[28] V. Stenger, Solubilities of various alkali metal and alkaline earth metal486
compounds in methanol, J. Chem. Eng. Data 41 (1996) 1111–1113.487
doi:10.1021/je960124k.488
[29] H. Berendsen, J. Grigera, T. Straatsma, The Missing Term in489
Effective Pair Potentials, J. Phys. Chem. 91 (1987) 6269–6271.490
doi:10.1021/j100308a038.491
[30] T. Schnabel, A. Srivastava, J. Vrabec, H. Hasse, Hydrogen bonding of492
methanol in supercritical CO2: Comparison between H-1 NMR spec-493
troscopic data and molecular simulation results, J. Phys. Chem. B 111494
(2007) 9871–9878. doi:10.1021/jp0720338.495
[31] S. Reiser, S. Deublein, J. Vrabec, H. Hasse, Molecular dispersion energy496
parameters for alkali and halide ions in aqueous solution, J. Chem. Phys.497
140 (2014) 044504. doi:10.1063/1.4858392.498
43

[32] S. Deublein, J. Vrabec, H. Hasse, A set of molecular models for alkali499
and halide ions in aqueous solution, J. Chem. Phys. 136 (2012) 084501.500
doi:10.1063/1.3687238.501
[33] G. Guevara-Carrion, J. Vrabec, H. Hasse, Prediction of self-diffusion502
coefficient and shear viscosity of water and its binary mixtures with503
methanol and ethanol by molecular simulation, J. Chem. Phys. 134504
(2011) 074508. doi:10.1063/1.3515262.505
[34] G. Guevara-Carrion, Y. Gaponenko, T. Janzen, J. Vrabec,506
V. Shevtsova, Diffusion in Multicomponent Liquids: From Microscopic507
to Macroscopic Scales, J. Phys. Chem. B 120 (2016) 12193–12210.508
doi:10.1021/acs.jpcb.6b09810.509
[35] S. Parez, G. Guevara-Carrion, H. Hasse, J. Vrabec, Mutual diffusion510
in the ternary mixture of water plus methanol plus ethanol and its511
binary subsystems, Phys. Chem. Chem. Phys. 15 (2013) 3985–4001.512
doi:10.1039/c3cp43785j.513
[36] S. Reiser, M. Horsch, H. Hasse, Density of Methanolic Alkali Halide Salt514
Solutions by Experiment and Molecular Simulation, J. Chem. Eng. Data515
60 (2015) 1614–1628. doi:10.1021/je5009944.516
44

[37] C. G. Gray, K. E. Gubbins, Theory of Molecular Fluids, Vol. 1: Funda-517
mentals, Clarendon Press, Oxford, 1984.518
[38] H. Lorentz, Ueber die Anwendung des Satzes vom Virial in der kinetis-519
chen Theorie der Gase, Ann. Phys. 248 (1881) 127–136.520
[39] D. Berthelot, Sur le melange des gaz, Comptes Rendus de l’Academie521
des Sciences Paris 126 (1898) 1703–1706, 1857–1858.522
[40] J. Fischer, D. Moller, A. Chialvo, J. Haile, The Influence of Un-523
like Molecule Interaction Parameters on Liquid-Mixture Excess Prop-524
erties, Fluid Phase Equilib. 48 (1989) 161–176. doi:10.1016/0378-525
3812(89)80199-2.526
[41] C. Coquelet, A. Valtz, D. Richon, Volumetric properties of water527
plus monoethanolamine plus methanol mixtures at atmospheric pres-528
sure from 283.15 to 353.15 K, J. Chem. Eng. Data 50 (2005) 412–418.529
doi:10.1021/je049691v.530
[42] S. Reiser, M. Horsch, H. Hasse, Temperature Dependence of the531
Density of Aqueous Alkali Halide Salt Solutions by Experiment and532
Molecular Simulation, J. Chem. Eng. Data 59 (2014) 3434–3448.533
doi:10.1021/je5004209.534
45

[43] J. Kirkwood, F. Buff, The Statistical Mechanical Theory of Solutions.535
1., J. Chem. Phys. 19 (1951) 774–777. doi:10.1063/1.1748352.536
[44] P. Kusalik, G. Patey, The Thermodynamic Properties of Electrolyte537
Solutions - Some Formal Results, J. Chem. Phys. 86 (1987) 5110–5116.538
doi:10.1063/1.452629.539
[45] A. Chialvo, P. Cummings, J. Simonson, R. Mesmer, Solvation in high-540
temperature electrolyte solutions. II. Some formal results, J. Chem.541
Phys. 110 (1999) 1075–1086. doi:10.1063/1.478151.542
[46] P. Kruger, S. Schnell, D. Bedeaux, S. Kjelstrup, T. Vlugt, J.-M. Simon,543
Kirkwood-Buff Integrals for Finite Volumes, J. Phys. Chem. Lett. 4544
(2013) 235–238. doi:10.1021/jz301992u.545
[47] S. Schnell, P. Englebienne, J.-M. Simon, P. Kruger, S. Balaji, S. Kjel-546
strup, D. Bedeaux, A. Bardow, T. Vlugt, How to apply the Kirkwood-547
Buff theory to individual species in salt solutions, Chem. Phys. Lett.548
582 (2013) 154–157. doi:10.1016/j.cplett.2013.07.043.549
[48] DDBST GmbH, Dortmund Data Bank, Version 2016, DDBST GmbH,550
Oldenburg, 2016.551
46

[49] C. W. Glass, S. Reiser, G. Rutkai, S. Deublein, A. Koster, G. Guevara-552
Carrion, A. Wafai, M. Horsch, M. Bernreuther, T. Windmann, H. Hasse,553
J. Vrabec, ms2: A Molecular Simulation Tool for Thermodynamic Prop-554
erties, New Version Release, Comput. Phys. Commun. 185 (2014) 3302–555
3306. doi:10.1016/j.cpc.2014.07.012.556
[50] H. Flyvbjerg, H. Petersen, Error-estimates on Averages of Correlated557
Data, J. Chem. Phys. 91 (1989) 461–466. doi:10.1063/1.457480.558
47