Embed Size (px)
Citation preview

POKER AGENTS
LD Miller & Adam Eck April 14 & 19, 2011

Motivation
2
Classic environment properties of MAS
Stochastic behavior (agents and environment)
Incomplete information
Uncertainty
Application Examples
Robotics
Intelligent user interfaces
Decision support systems

Motivation
3
Popular environment: Texas Hold’em poker
Enjoyed by users
Interaction with agents
Many solutions
Annual Computer Poker Challenge (ACPC)
Held with AAAI conference
Existing game framework
Competition!
Overview
4
Background
Methodology
Results
Conclusions

Background| Texas Hold’em Poker
5
Variant of poker developed in Robstown, Texas in
early 1900s
Played with 52 card deck
Background Methodology Results Conclusions
lowest highest

Background| Texas Hold’em Poker
6
Ranking of poker hands
Background Methodology Results Conclusions
Source: http://www.learn-texas-holdem.com/

Background| Texas Hold’em Poker
7
Uses both 2 private and 5 community cards
Construct the best possible poker hand out of 5
cards (use 3-5 community)
Background Methodology Results Conclusions
community cards private cards
(best poker hand)

Background| Texas Hold’em Poker
8
Games consist of 4 different steps
Actions: bet (check, raise, call) and fold
Bets can be limited or unlimited
Background Methodology Results Conclusions
community cards private cards
(1) pre-flop (2) flop (3) turn (4) river
Background| Texas Hold’em Poker
9
Significant worldwide popularity and revenue
World Series of Poker (WSOP) attracted 63,706 players in
2010 (WSOP, 2010)
Online sites generated estimated $20 billion in 2007
(Economist, 2007)
Has fortuitous mix of strategy and luck
Community cards allow for more accurate modeling
Still many “outs” or remaining community cards which defeat
strong hands
Background Methodology Results Conclusions

Background| Texas Hold’em Poker
10
Strategy depends on hand strength which changes
from step to step!
Hands which were strong early in the game may get
weaker (and vice-versa) as cards are dealt
Background Methodology Results Conclusions
community cards private cards
raise! raise! check? fold?

Background| Texas Hold’em Poker
11
Strategy also depends on betting behavior
Three different types (Smith, 2009):
Aggressive players who often bet/raise to force folds
Optimistic players who often call to stay in hands
Conservative or “tight” players who often fold unless
they have really strong hands
Background Methodology Results Conclusions

Methodology| Strategies
12
Problem: provide basic strategies that simulate
betting behavior types
Must include hand strength
Must incorporate stochastic variance or “gut feelings”
Action: fold/call with high/low hand strength
Background Methodology Results Conclusions
Methodology| Strategies
13
Solution 1: use separate mixture models for each
type
All three models use the same set of three tactics for
weak, medium, and strong hands
Each tactic uses a different probability distribution for
actions (raise, check, fold)
However, each model has a different idea what hand
strength constitutes a weak, medium, and strong hand!
Background Methodology Results Conclusions

Methodology| Strategies
14
Solution 2: Probability distributions
Hand strength measured using Poker Prophesier
(http://www.javaflair.com/pp/)
Background Methodology Results Conclusions
Tactic Fold Call Raise
Weak [0…0.7) [0.7…0.95) [0.95…1)
Medium [0…0.3) [0.3…0.7) [0.7…1)
Strong [0…0.05) [0.05…0.3) [0.3…1)
Behavior Weak Medium Strong
Aggressive [0…0.2) [0.2…0.6) [0.6…1)
Optimistic [0…0.5) [0.5…0.9) [0.9…1)
Conservative [0…0.3) [0.3…0.8) [0.8…1)
(1) Check hand
strength for
tactic
(2) “Roll” on
tactic for action
Methodology| Meta-strategies
15
Problem: basic strategies are very simplistic
Little emphasis on deception
Don’t adapt to opponent
Consider four meta-strategies
Two as baselines
Two as active AI research
Background Methodology Results Conclusions

Methodology| Deceptive Agent
16
Problem 1: Agents don’t explicitly deceive
Reveal strategy every action
Easy to model
Solution: alternate strategies periodically
Conservative to aggressive and vice-versa
Break opponent modeling (concept shift)
Background Methodology Results Conclusions

Methodology| Explore/Exploit
17
Problem 2: Basic agents don’t adapt
Ignore opponent behavior
Static strategies
Solution: use reinforcement learning (RL)
Implicitly model opponents
Revise action probabilities
Explore space of strategies, then exploit success
Background Methodology Results Conclusions

Methodology| Explore/Exploit
18
RL formulation of poker problem
State s: hand strength
Discretized into 10 values
Action a: betting behavior
Fold, Call, Raise
Reward R(s,a): change in bankroll
Updated after each hand
Assigns same reward to all actions in a hand
Background Methodology Results Conclusions

Methodology| Explore/Exploit
19
Q-Learning algorithm
Discounted learning
Single-step only
Explore/Exploit balance
Choose actions based on expected reward
Softmax
Probabilistic matching strategy
Used by humans (Daw et. al, 2006)
Roulette selection
Background Methodology Results Conclusions

Methodology| Active Sensing
20
Opponent modeling
Another approach to adaptation
Want to understand and predict opponent’s actions
Explicit rather than implicit (RL)
Primary focus of previous work on AI poker
Not proposing a new modeling technique
Adapt existing techniques to basic agent design
Vehicle for fundamental agent research
Background Methodology Results Conclusions

Methodology| Active Sensing
21
Opponent model = knowledge
Refined through observations
Betting history, opponent’s cards
Actions produce observations
Information is not free
Tradeoff in action selection
Current vs. future hand winnings/losses
Sacrifice vs. gain
Background Methodology Results Conclusions

Methodology| Active Sensing
22
Knowledge representation
Set of Dirichlet probability distributions
Frequency counting approach
Opponent state so = their estimated hand strength
Observed opponent action ao
Opponent state
Calculated at end of hand (if cards revealed)
Otherwise 1 – s
Considers all possible opponent hands
Background Methodology Results Conclusions
Methodology| Active Sensing
23
Challenge: how to choose actions?
Goal 1: Win current hand
Goal 2: Win future hands (good modeling)
Goals can be conflicting
Another exploration/exploitation problem!
Explore: learn opponent model
Exploit: use model in current hand
Background Methodology Results Conclusions

Methodology| Active Sensing
24
Exploitation
Use opponent actions to revise hand strength model
Have P(ao|so)
Estimate P(so|ao)
Use Bayes rule
P(so|ao) = P(so|ao) P(ao) / P(so)
Action selection
Raise if our hand strength >> E[P(so|ao)]
Call if our hand strengh ≈ E[P(so|ao)]
Fold if our hand strength << E[P(so|ao)]
Background Methodology Results Conclusions
Methodology| Active Sensing
25
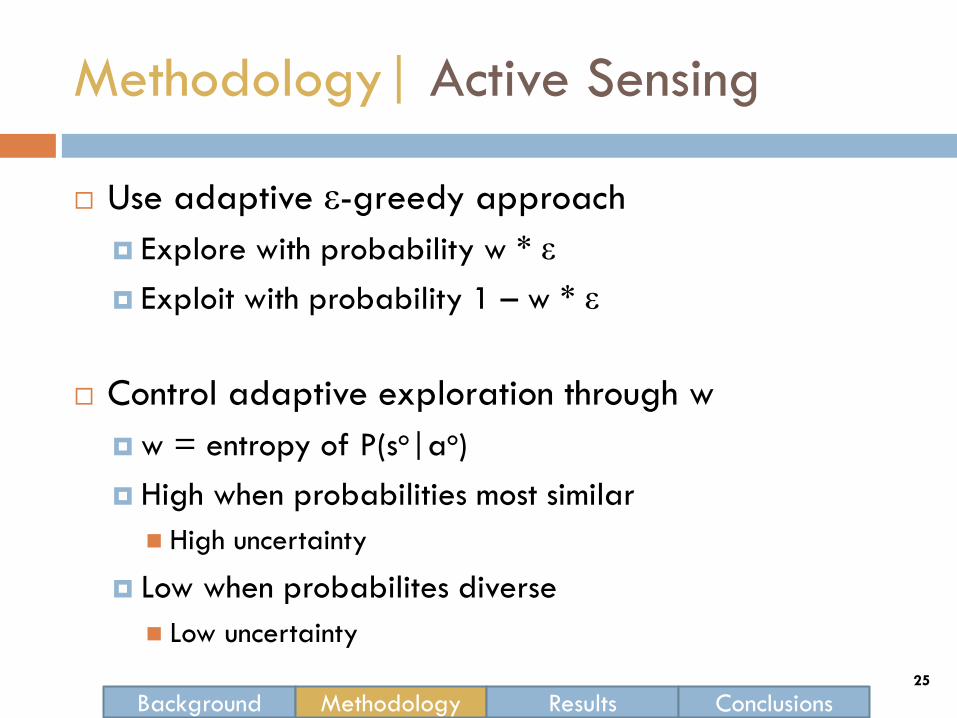
Use adaptive ε-greedy approach
Explore with probability w * ε
Exploit with probability 1 – w * ε
Control adaptive exploration through w
w = entropy of P(so|ao)
High when probabilities most similar
High uncertainty
Low when probabilites diverse
Low uncertainty
Background Methodology Results Conclusions

Methodology| Active Sensing
26
Background Methodology Results Conclusions
Analyze
Opponent Model
Choose Exploit
Action
Compute Entropy
Choose Explore
Action Revise Model
Opponent
Model Explore
Exploit
Agent
Actions
Observations
w
Exploit Action P(so|ao)
P(ao|so)
c(so,ao)
Explore
Action

Methodology| BoU
27
Problem 1: Current strategies (basic and EE) focus only on hand strength
No thought given to other “features” such as betting sequence, pot odds, etc.
No thought given to previous hands against same opponent
Such a myopic approach limits the reasoning capability for such agents
Solution 1: Strategy should consider entire “session” including all the above features
Background Methodology Results Conclusions

Methodology| BoU
28
Problem 2: Different strategies may only be
effective against certain opponents
Example: Doyle Brunson has won 2 WSOP with 7-2 off
suit―worst possible starting hand
Example: An aggressive strategy is detrimental when
opponent knows you are aggressive
Solution 2: Choose the “correct” strategy based on
the previous sessions
Background Methodology Results Conclusions

Methodology| BoU
29
Approach 2: Find the Boundary of Use (BoU) for the strategies based on previously collected sessions
BoU partitions sessions into three types of regions (successful, unsuccessful, mixed) based on the session outcome
Session outcome―complex and independent of strategy
Choose the correct strategy for new hands based on region membership
Background Methodology Results Conclusions

Methodology| BoU
30
BoU Example
Ideal: All sessions inside the BoU
Background Methodology Results Conclusions
Strategy
Incorrect
Strategy
Correct Strategy
?????

Methodology| BoU
31
Approach 2. Improve the BoU using focused
refinement (on mixed regions)
Repair session data to make it more beneficial for
choosing the strategy
Active learning
Feature selection
Update the strategies chosen (based on the “repaired”
sessions) which may change outcome
Background Methodology Results Conclusions

Methodology| BoU
32
BoU Framework
Background Methodology Results Conclusions
Based on previous
poker sessions
Using query
synthesis and
feature selection
For the basic
strategies

Methodology| BoU
33
Challenges (to be addressed)
How do we determine numeric outcomes?
Amount won/lost per hand
Correct action taken for each step
How do we assign region types to numeric outcomes?
Should a session with +120 outcome and a session with +10 both be in successful region?
How do we update outcomes using the strategies?
Say we switch from conservative to aggressive so the agent would not have folded
How do we simulate the rest of the hand to get the session outcome?
Background Methodology Results Conclusions

Methodology| BoU
34
BoU Implementation
k-Means clustering
Similarity metric needs to be modified to incorporate action sequences AND missing values
Number of clusters used must balance cluster purity and coverage
Session repair
Genetic search for subsets of features contributing the most to session outcome
Query synthesis for additional hands in mixed regions
Background Methodology Results Conclusions

Results| Overview
35
Validation
Basic agent vs. other basic (DONE)
EE agent vs. basic agents (DONE)
Deceptive agent vs. EE agent
Investigation
AS agent vs. EE/deceptive agents
BoU agent vs. EE/deceptive agents
AS agent vs. BoU agent
Ultimate showdown
Background Methodology Results Conclusions

Results| Simple Agent Validation
36
Simple Agent Hypotheses
SA-H1: None of these strategies will “dominate” all the others
SA-H2: Stochastic variance will allow an agent to win overall against another with the same strategy
Parameters
Hands = 500
Seeds = 30
Background Methodology Results Conclusions

Results| Simple Agent Validation
37
Matchups
Conservative vs. Aggressive (DONE)
Aggressive vs. Optimistic (DONE)
Optimistic vs. Conservative (DONE)
Aggressive vs. Aggressive (DONE)
Optimistic vs. Optimistic (DONE)
Conservative vs. Conservative (DONE)
Background Methodology Results Conclusions

Results| Simple Agent Validation
38
Matchup 1: Conservative vs. Aggressive
Background Methodology Results Conclusions
-1800
-1600
-1400
-1200
-1000
-800
-600
-400
-200
0
200
1
16
31
46
61
76
91
10
6
12
1
13
6
15
1
16
6
18
1
19
6
21
1
22
6
24
1
25
6
27
1
28
6
30
1
31
6
33
1
34
6
36
1
37
6
39
1
40
6
42
1
43
6
45
1
46
6
48
1
49
6
Conse
rvative W
innin
gs
Round Number
Conservative vs. Aggressive
Won/Lost

Results| Simple Agent Validation
39
Matchup 2: Aggressive vs. Optimistic
Background Methodology Results Conclusions
-200
0
200
400
600
800
1000
1200
1
17
33
49
65
81
97
11
3
12
9
14
5
16
1
17
7
19
3
20
9
22
5
24
1
25
7
27
3
28
9
30
5
32
1
33
7
35
3
36
9
38
5
40
1
41
7
43
3
44
9
46
5
48
1
49
7
Aggre
ssiv
e W
innin
gs
Round Number
Aggressive vs. Optimistic
Won/Lost

Results| Simple Agent Validation
40
Matchup 3: Optimistic vs. Conservative
Background Methodology Results Conclusions
0
200
400
600
800
1000
1
15
29
43
57
71
85
99
11
3
12
7
14
1
15
5
16
9
18
3
19
7
21
1
22
5
23
9
25
3
26
7
28
1
29
5
30
9
32
3
33
7
35
1
36
5
37
9
39
3
40
7
42
1
43
5
44
9
46
3
47
7
49
1
Optim
istic
Win
nin
gs
Round Number
Optimistic vs. Conservative
Won/Lost

Results| EE Validation
41
Background Methodology Results Conclusions
EE Hypotheses
EE-H1: Explore/exploit will lose money early while it is exploring
EE-H2: Explore/exploit will eventually adapt and choose actions which exploit simple agents to improve its overall winnings
Parameters
Hands = 500
Seeds = 30
Learning Rate = Discounted

Results| EE Validation
42
Background Methodology Results Conclusions
Matchup 1: EE vs. Aggressive
-200
-100
0
100
200
300
400
500
600
1
15
29
43
57
71
85
99
11
3
12
7
14
1
15
5
16
9
18
3
19
7
21
1
22
5
23
9
25
3
26
7
28
1
29
5
30
9
32
3
33
7
35
1
36
5
37
9
39
3
40
7
42
1
43
5
44
9
46
3
47
7
49
1
EE W
innin
gs
Round Number
EE vs. Aggressive
Won/Lost

Results| EE Validation
43
Background Methodology Results Conclusions
Matchup 2: EE vs. Optimistic
-200
0
200
400
600
800
1000
1200
1400
1600
1800
1
17
33
49
65
81
97
11
3
12
9
14
5
16
1
17
7
19
3
20
9
22
5
24
1
25
7
27
3
28
9
30
5
32
1
33
7
35
3
36
9
38
5
40
1
41
7
43
3
44
9
46
5
48
1
49
7
EE W
innin
gs
Round Number
EE vs. Optimistic
Won/Lost

Results| EE Validation
44
Background Methodology Results Conclusions
Matchup 3: EE vs. Conservative
-200
0
200
400
600
800
1000
1200
1400
1600
1800
2000
2200
2400
2600
2800
1
17
33
49
65
81
97
11
3
12
9
14
5
16
1
17
7
19
3
20
9
22
5
24
1
25
7
27
3
28
9
30
5
32
1
33
7
35
3
36
9
38
5
40
1
41
7
43
3
44
9
46
5
48
1
49
7
EE W
innin
gs
Round Number
EE vs. Conservative
Won/Lost

Results| EE Validation
45
Background Methodology Results Conclusions
Matchup 4: EE vs. Deceptive
-500
0
500
1000
1500
2000
2500
1
17
33
49
65
81
97
11
3
12
9
14
5
16
1
17
7
19
3
20
9
22
5
24
1
25
7
27
3
28
9
30
5
32
1
33
7
35
3
36
9
38
5
40
1
41
7
43
3
44
9
46
5
48
1
49
7
EE W
innin
gs
Round Number
EE vs. Deceptive
Aggressive
Conservative
Deceptive

Results| Active Sensing Setup
46
Active Sensing Hypotheses
AS-H1: Including opponent modeling will improve agent winnings
AS-H2: Using AS to boost opponent modeling will improve agent winnings over non-AS opponent modeling
Open questions:
How is agent performance affected by:
ε values?
Other opponent performs modeling?
Background Methodology Results Conclusions

Results| AS Setup
47
Parameters
ε = 0.0, 0.1, 0.2
Opponents
EE: implicit vs. explicit modeling, dynamic opponent
Deceptive: shifting opponent
Non-AS: effect of opponent’s modeling
BOU: Offline learning/modeling
Background Methodology Results Conclusions

Results| BoU Setup
48
Background Methodology Results Conclusions
BoU Hypotheses
BoU-H1: Including additional session information should improve agent reasoning
BoU-H2: Using the BoU to choose the correct strategy should improve winnings over agents which only use hand strength
BoU Data Collection
Simple agent validation
Crowdsourcing agents vs. humans

Conclusion| Remaining Work
49
Finish implementing AS
Finish implementing BOU
Run AS/BOU Experiments
POJI results
Background Methodology Results Conclusions

Conclusion| Summary
50
Introduced poker as an AI problem
Described various agent strategies
Basic
Need for meta-strategies
AS/BOU
Introduced experimental setup
Early validation results
Background Methodology Results Conclusions

Questions?
51

Demonstration
52

References
53
(Daw et al., 2006) N.D. Daw et. al, 2006. Cortical substrates for exploratory decisions in humans, Nature, 441:876-879.
(Economist, 2007) Poker: A big deal, Economist, Retrieved January 11, 2011, from http://www.economist.com/node/10281315?story_id=10281315, 2007.
(Smith, 2009) Smith, G., Levere, M., and Kurtzman, R. Poker player behavior after big wins and big losses, Management Science, pp. 1547-1555, 2009.
(WSOP, 2010) 2010 World series of poker shatters attendance records, Retrieved January 11, 2011, from http://www.wsop.com/news/2010/Jul/2962/2010-WORLD-SERIES-OF-POKER-SHATTERS-ATTENDANCE-RECORD.html

Acknowledgements
54
Playing card images from David Bellot:
http://www.eludication.org/playingcards.html#