Embed Size (px)
Citation preview
Participation in
Tertiary Education
2012
Tertiary Education Commission, Mauritius August, 2013
I
ACKNOWLEDGEMENT
This publication has been possible with the support and collaboration of institutions and organizations engaged in tertiary education as well as Embassies/High Commissions based locally. The Tertiary Education Commission would like to express its appreciation to all the organizations and Embassies/High Commissions involved and to their staff for their invaluable assistance in providing the requested information
While every care has been taken in the preparation of this publication, by its nature, it may contain errors which are unintentional.
II
Contents Page
List of Tables III
List of Figures VII
List of Acronyms VIII
1.0 Introduction 1
2.0 Methodology 1
3.0 Tertiary Enrolment in 2012 2
3.1 The University of Mauritius 6
3.2 The University of Technology, Mauritius 6
3.3 The Mauritius Institute of Education 7
3.4 The Mahatma Gandhi Institute 7
3.5 The Open University of Mauritius 7
3.6 Université des Mascareignes 8
3.7 The Mauritius Institute of Training and Development 8
3.8 The Fashion and Design Institute 9
3.9 The Rabindranath Tagore Institute 9
3.10 The Mauritius Institute of Health 9
3.11 Private Providers 9
3.12 Total Enrolment through the Distance Education Mode 10
3.13 International Students Studying in Mauritius 10
3.14 Mauritian Students Studying Abroad 11
Tables 12
Annex: Computation of Tertiary Education Enrolment Rate 74
III
List of Tables
Table 1 Enrolment at Tertiary Education Level, both Locally & Overseas, by Source and Field of Study, as at December 2012
Table 2 New Admissions at Tertiary Education Level, both Locally & Overseas, by Source and Field of Study, as at December 2012
Table 3 Total Enrolment and New Admissions on Tertiary Education Level Programmes by Source in 2000–2012
Table 4 Enrolment in Publicly-Funded Institutions by Institution, Field of Study and Gender, 2012/2013
Table 5 Enrolment in the Publicly-Funded Institutions by Level and Mode of Study, 2012/2013
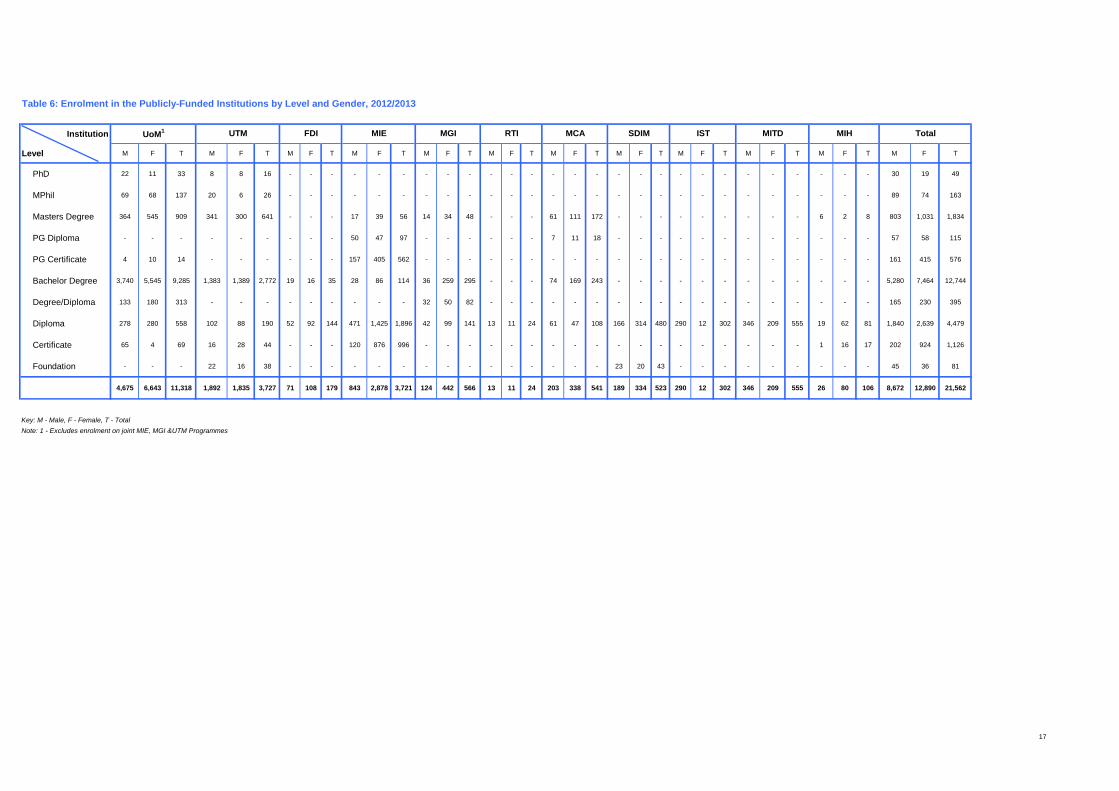
Table 6 Enrolment in the Publicly-Funded Institutions by Level and Gender, 2012/2013
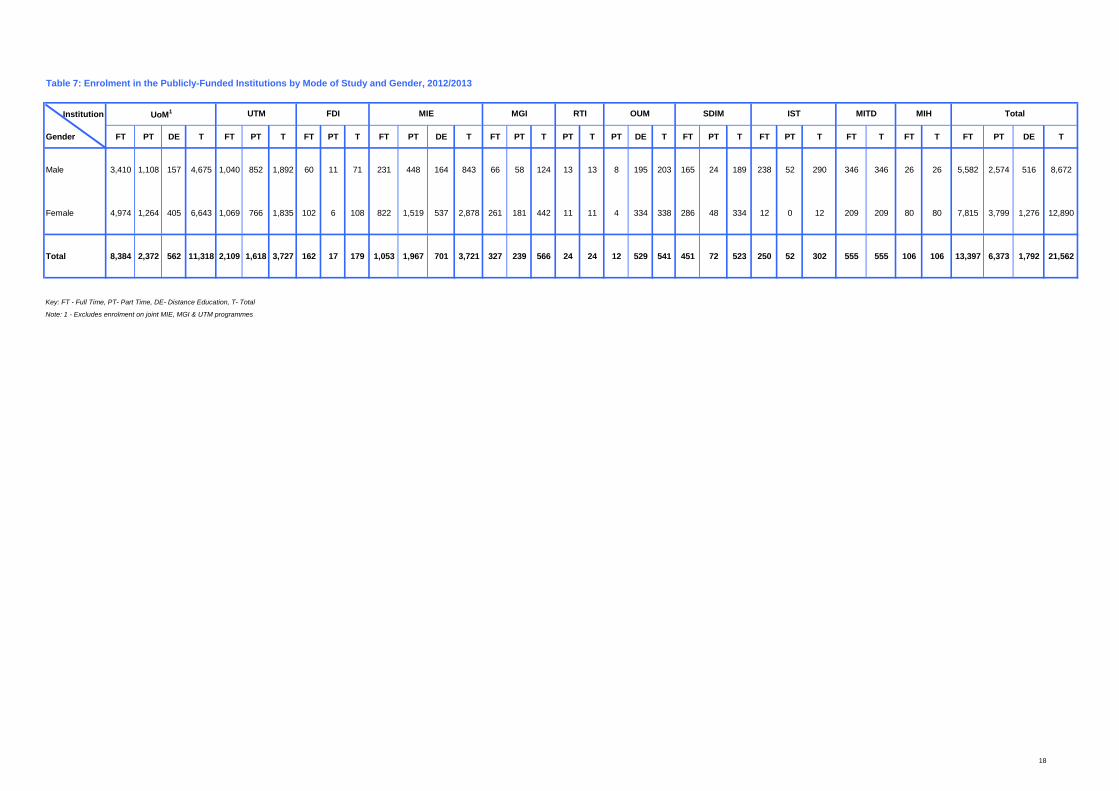
Table7 Enrolment in the Publicly-Funded Institutions by Mode of Study and Gender, 2012/2013
Table 8 New Admissions on Taught Programmes in the Publicly-Funded Institutions by Level and Mode of Study, 2012/2013
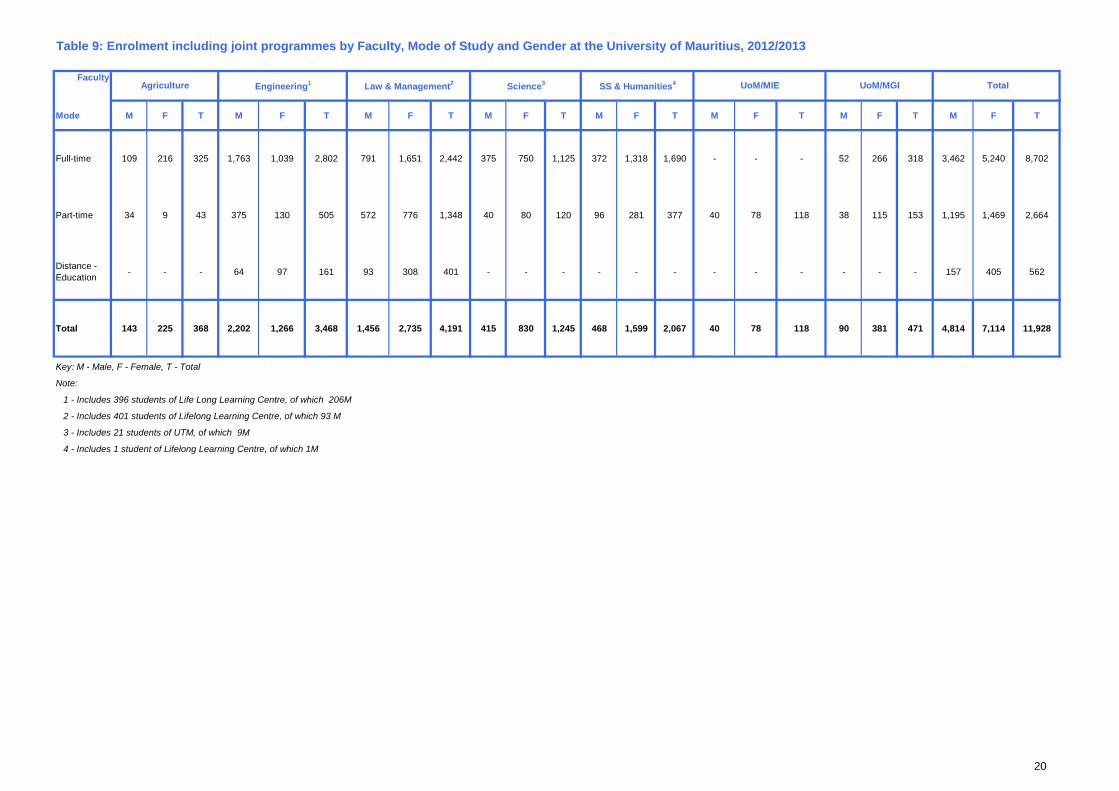
Table 9 Enrolment including joint programmes by Faculty, Mode of Study and Gender at the University of Mauritius, 2012/2013
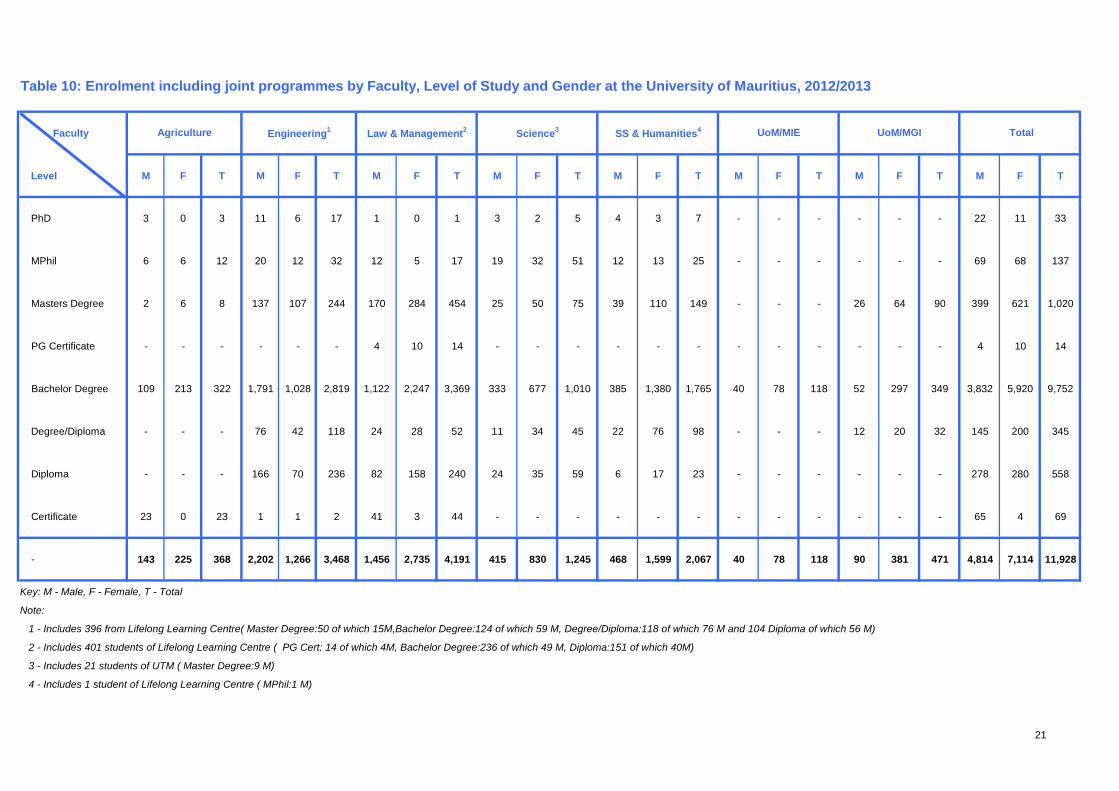
Table 10 Enrolment including joint programmes by Faculty, Level of Study and Gender at the University of Mauritius, 2012/2013
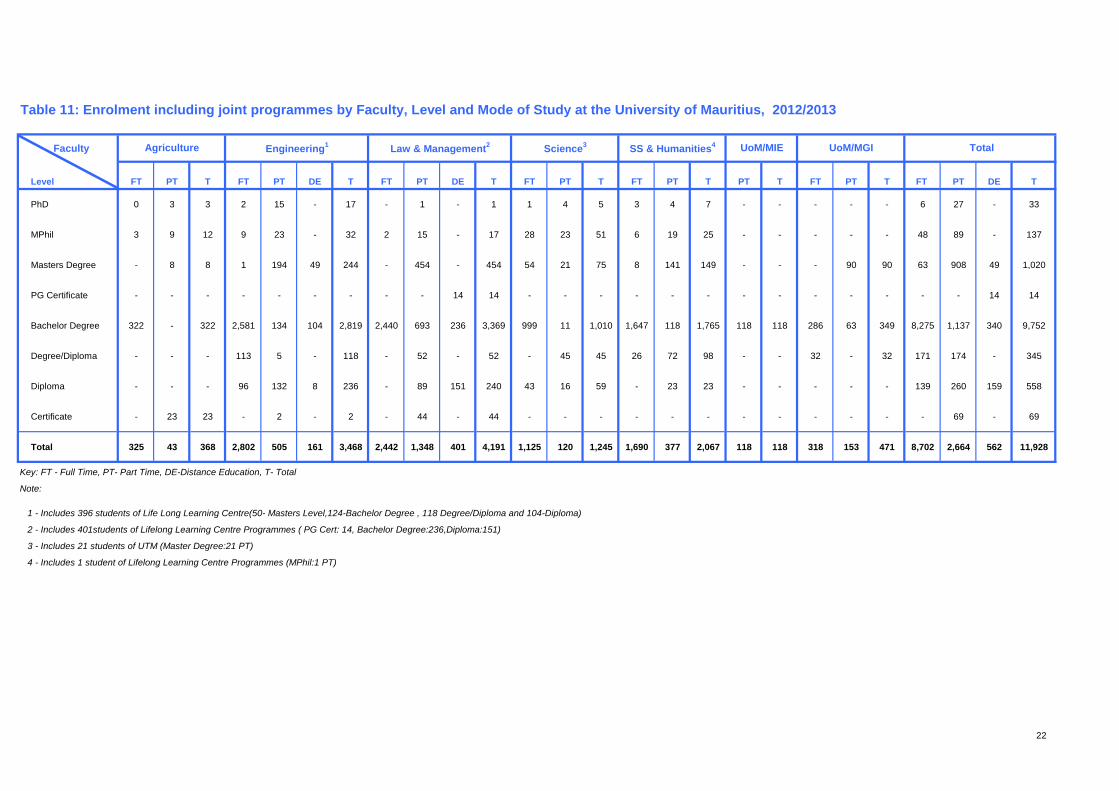
Table 11 Enrolment including joint programmes by Faculty, Level and Mode of Study at the University of Mauritius, 2012/2013
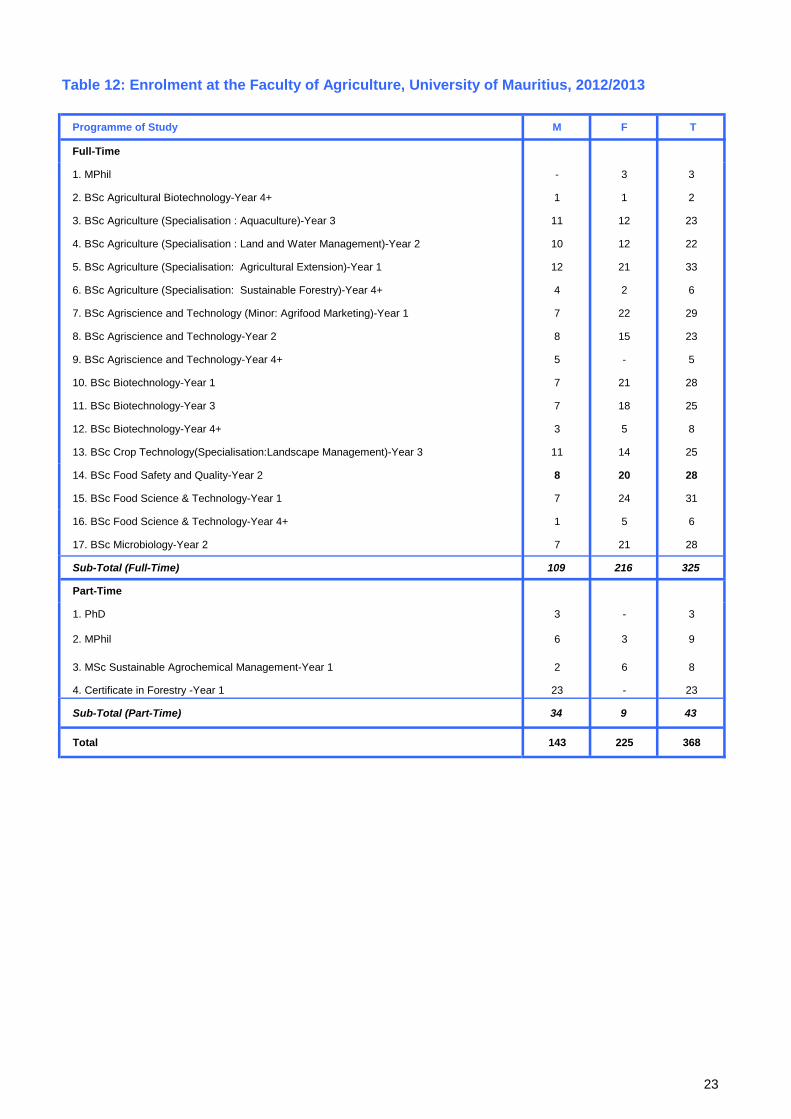
Table 12 Enrolment at the Faculty of Agriculture, University of Mauritius, 2012/2013
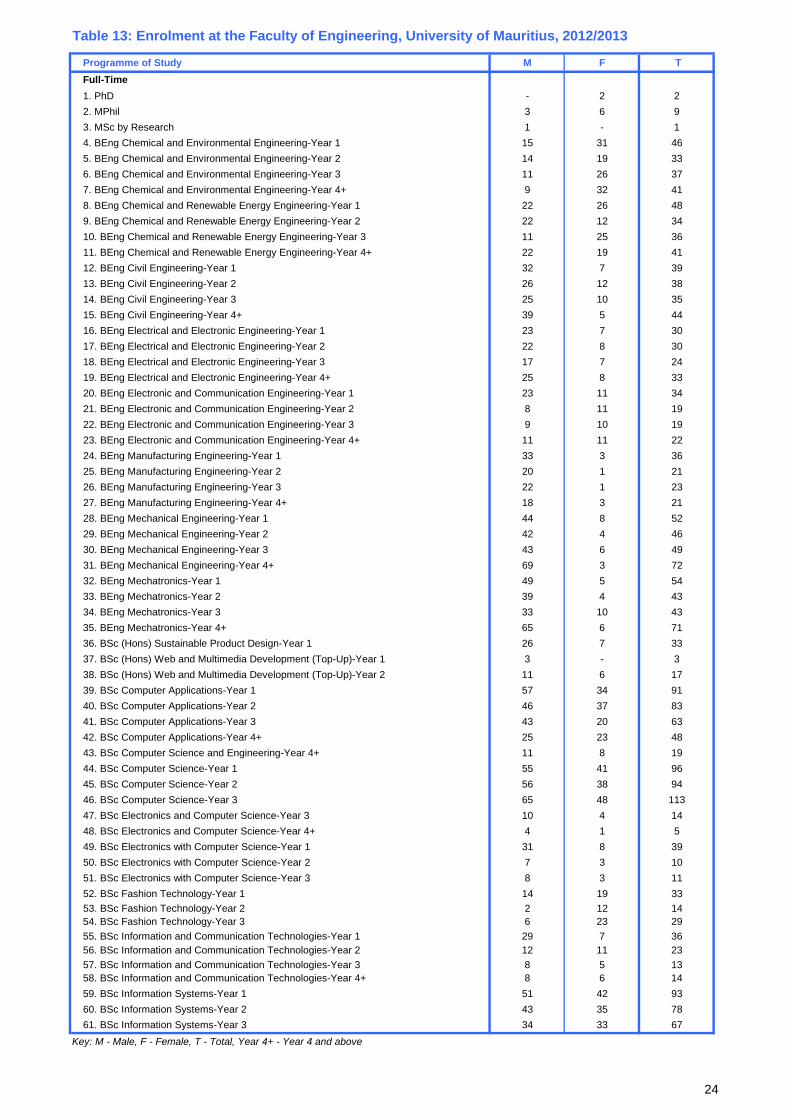
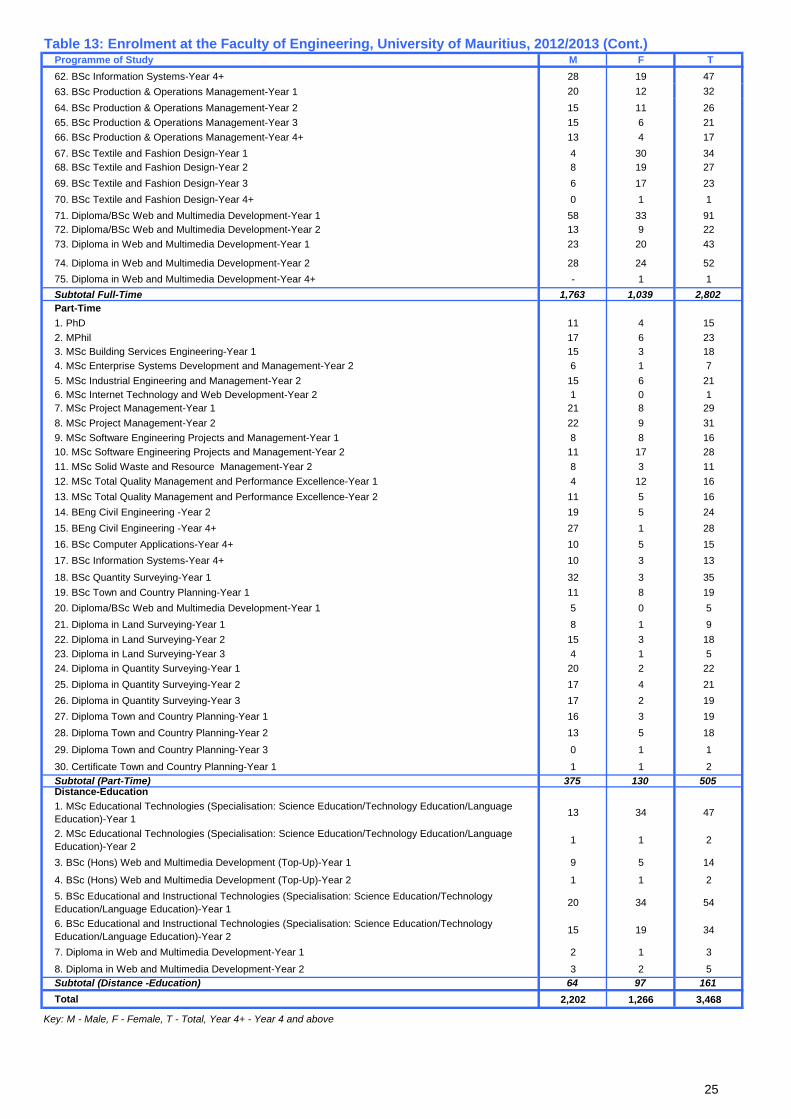
Table 13 Enrolment at the Faculty of Engineering, University of Mauritius, 2012/2013
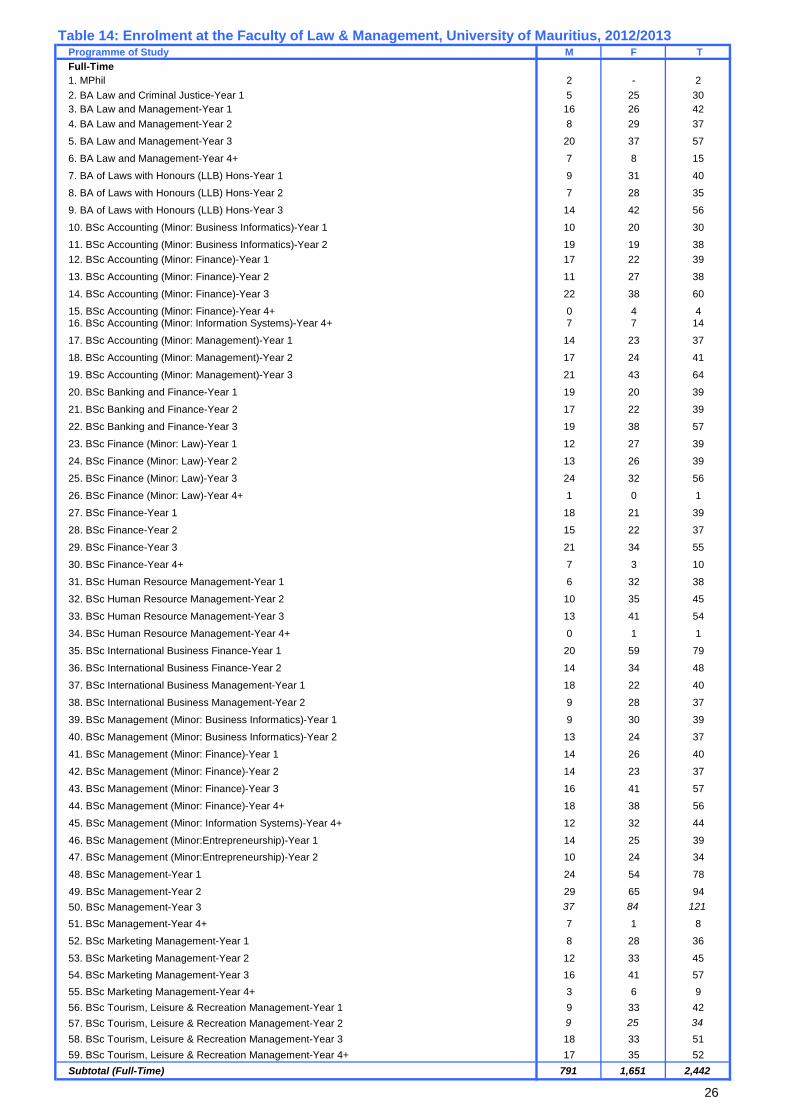
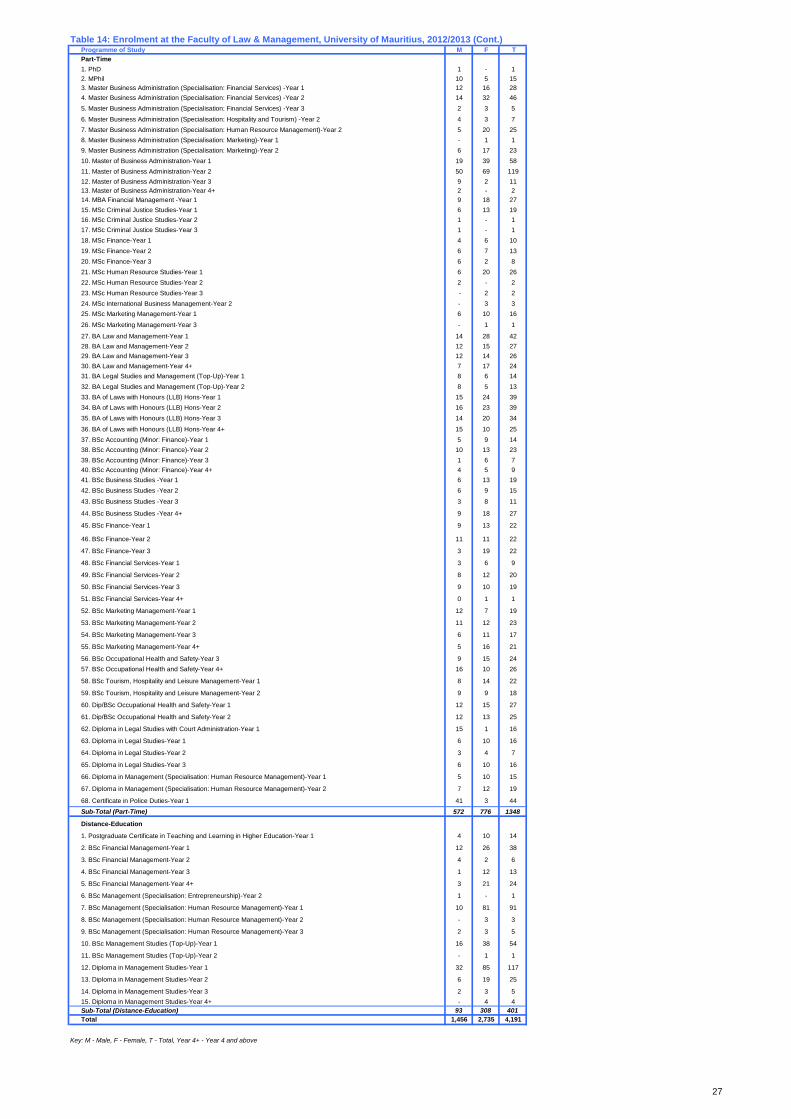
Table 14 Enrolment at the Faculty of Law & Management, University of Mauritius, 2012/2013
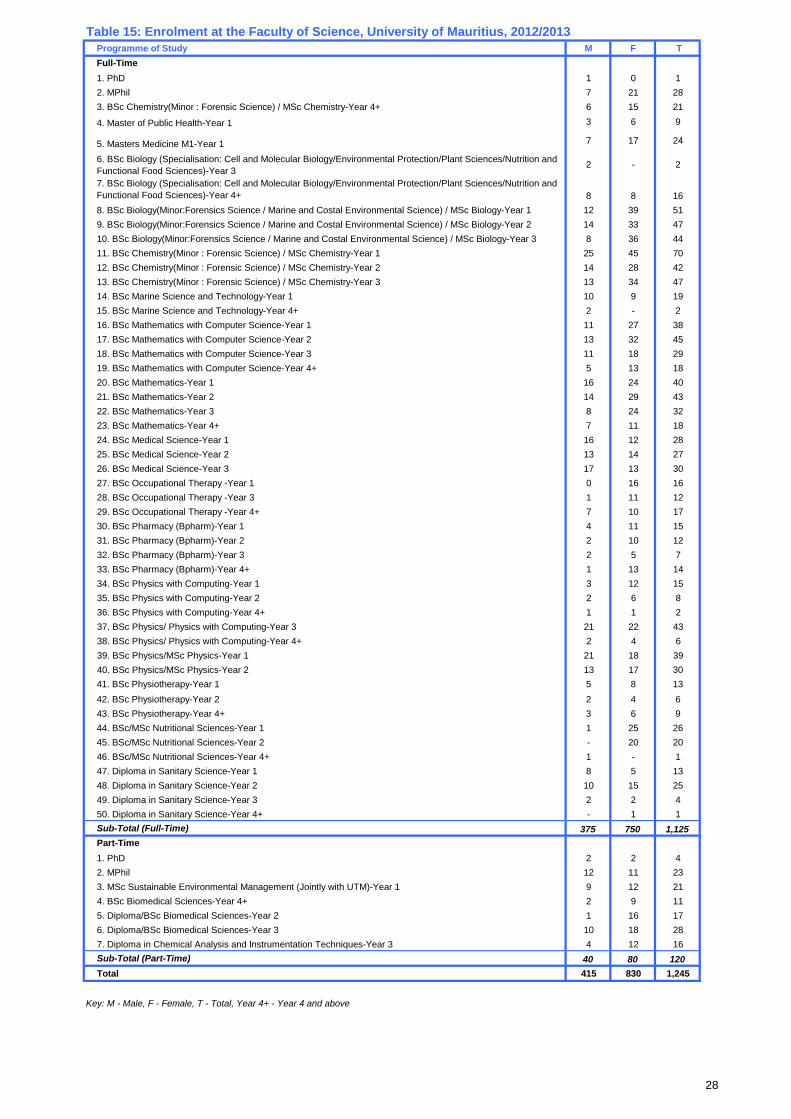
Table 15 Enrolment at the Faculty of Science, University of Mauritius, 2012/2013
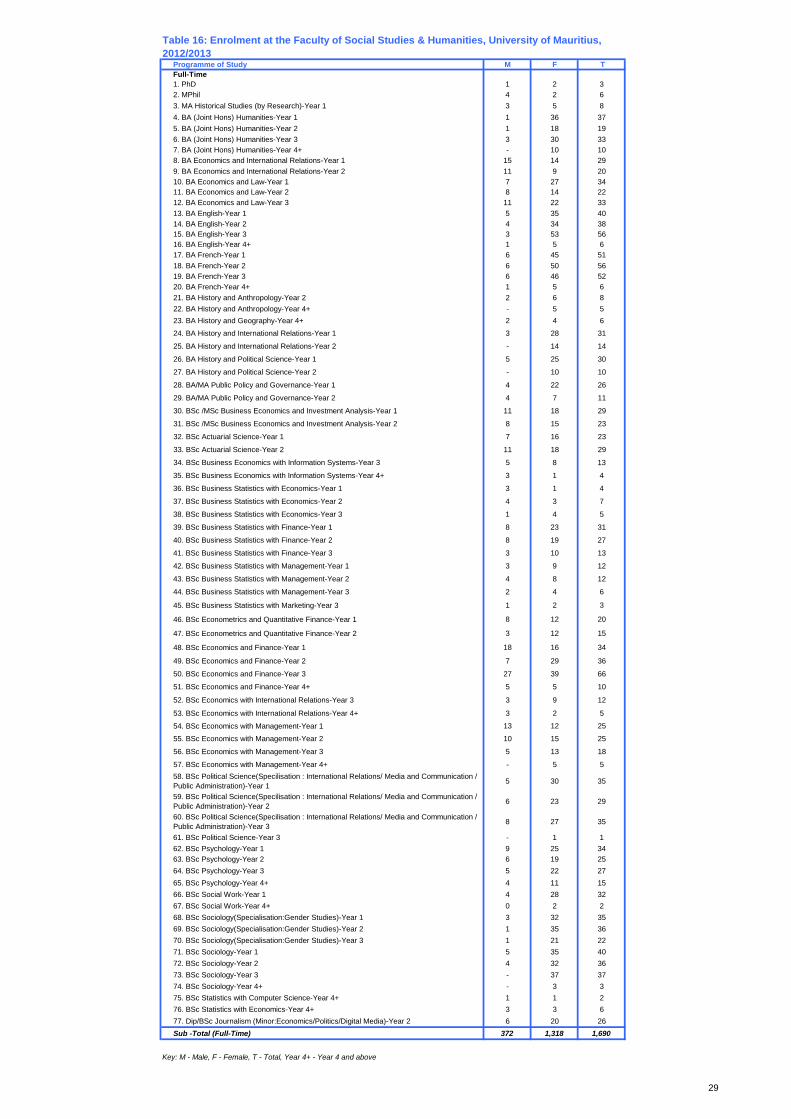
Table 16 Enrolment at the Faculty of Social Studies & Humanities, University of Mauritius, 2012/2013
Table 17 Enrolment on Joint University of Mauritius - Mauritius Institute of Education Programmes, 2012/2013
IV
Table 18 Enrolment on Joint University of Mauritius - Mahatma Gandhi Institute Programmes, 2012/2013
Table 19 Enrolment including joint programmes by Faculty, Mode and Year of Study at the University of Mauritius, 2012/2013
Table 20 New Admissions on Taught Programmes by Mode of Study, Faculty and Gender at the University of Mauritius, 2012/2013
Table 21 New Admissions on Taught Programmes by Faculty, Level and Mode of Study at the University of Mauritius, 2012/2013
Table 22 Enrolment by School, Mode of Study and Gender, at the University of Technology, Mauritius, 2012/2013
Table 23 Enrolment by School, Level of Study and Gender, at the University of Technology, Mauritius, 2012/2013
Table 24 Enrolment by School, Level and Mode of Study, at the University of Technology, Mauritius, 2012/2013
Table 25 Enrolment at the School of Business Management and Finance (SBMF), University of Technology, Mauritius, 2012/2013
Table 26 Enrolment at the School of Innovative Technologies and Engineering, University of Technology, Mauritius, 2012/2013
Table 27 Enrolment at the School of Sustainable Development and Tourism, University of Technology, Mauritius, 2012/2013
Table 28 Enrolment by School, Mode and Year of Study at the University of Technology, Mauritius, 2012/2013
Table 29 New Admissions on Taught Programmes by School, Mode of Study, Faculty and Gender at the University of Technology, Mauritius, 2012/2013
Table 30 New Admissions on Taught Programmes by School, Level and Mode of Study at the University of Technology, Mauritius, 2012/2013
Table 31 Enrolment at the Fashion and Design Institute, 2012/2013
Table 32 Enrolment by Programme, Mode, Year of Study and Gender, at the Mauritius Institute of Education, 2012/2013
Table 33 Enrolment by Programme, Mode, Year of Study and Gender, at the Mahatma Gandhi Institute, 2012/2013
Table 34 Enrolment by Programme, Mode, Year of Study and Gender at the Rabindranath Tagore Institute, 2012/2013
V
Table 35 Enrolment by Programme, Mode, Year of Study and Gender, at the Open University of Mauritius, 2012/2013
Table 36 Enrolment by Programme, Mode and Year of Study and Gender, at the Swami Dayanand Institute of Management, 2012/2013
Table 37 Enrolment by Programme, Mode, Year of Study and Gender, at the Institut Supérieur de Technologie, 2012/2013
Table 38 Enrolment by Programme, Mode, Year of Study and Gender, at the Mauritius Institute of Training and Development, 2012/2013
Table 39 Enrolment by Programme, Year of Study and Gender, at the Mauritius Institute of Health, 2012/2013
Table 40 List of Examinations Conducted by the Mauritius Examinations Syndicate on Behalf of Overseas Institutions by Country, Level and Field of Study, 2012
Table 41 List of Examinations Conducted from Non-Mauritius Examinations Syndicate Sources on behalf of Overseas Institutions by Local Partner, Country and Programme of Study, 2012
Table42 Enrolment by Field and Level of Study, in Post Secondary Educational Institutions/Distance Education, December 2012
Table 43 Total Enrolment in the Private Post Secondary Education Institutions, December 2012
Table 44 Enrolment in the Private Post Secondary Education Institutions by Field of Study and Gender, 2012/2013
Table 45 Enrolment by Level, Mode of Study and Gender, in the Private Post Secondary Education Institutions, 2012/2013
Table 46 Enrolment by Mode of Study and Gender, in the Private Post Secondary Education Institutions, 2012/2013
Table 47 Number of Students Pursuing Tertiary level studies locally in Private Institutions and through Distance Education by Field of Study and Mode, 2012/2013 (Estimate)
Table 48 Estimated Number of Students Pursuing Tertiary Education through Distance Education by Source and Field of Study, 2012-2013
Table 49 Enrolment in the Publicly-Funded Institutions by Distance Education Mode, 2012/2013
Table 50 Enrolment of International Students in Tertiary Education locally by Institution, Mode of Study and Gender, 2012/2013
VI
Table 51 Enrolment of International Students in Tertiary Education locally by Programme, Institution, Mode and Level of Study, 2012/13
Table 52 Enrolment of International Students in Tertiary Education locally by Country of Origin, Institution, Mode and Level of Study, 2012/13
Table 53 Estimated Number of Mauritian Students Going Overseas for Tertiary Education in 2012, by Field of Study and Country
Table 54 Estimated Total Number of Mauritian Students Pursuing Tertiary
Education Overseas, by Field of Study and Country, as at December 2012

VII
List of Figures
Figure 1 Evolution of Enrolment in Tertiary Education, by Source 2000-2012
Figure 2 Evolution of GTER, 2000-2012
VIII
List of Acronyms
1. CILT (UK) - Chartered Institute of Logistics and Transport, United Kingdom
2. DE - Distance Education
3. DUST - Diplome Universitaire Supérieur de Technologie
4. FDI- Fashion & Design Institute
5. FT – Full-time
6. GTER – Gross Tertiary Enrolment Rate
7. HND - Higher National Diploma
8. HSC – Higher School Certificate
9. IGNOU - Indira Gandhi National Open University
10. IFE - Institut de la Francophonie pour l’Entrepreneuriat
11. ISCED – International Standard Classification of Education
12. IST - Institut Supérieur de Technologie
13. MITD - Mauritius Institute of Training and Development
14. MPhil - Master of Philosophy
15. OUM - Open University of Mauritius
16. MES - Mauritius Examinations Syndicate
17. MGI - Mahatma Gandhi Institute
18. MIE - Mauritius Institute of Education
19. MIH - Mauritius Institute of Health
20. MRes - Master in Research
21. NTER- Net Tertiary Enrolment Rate
22. PFIs- Publicly-Funded Institutions
23. PG Certificate - Post Graduate Certificate
24. PG Diploma - Post Graduate Diploma
25. PhD - Doctor of Philosophy
26. PSEIs- Post Secondary Educational Institutions
27. PT- Part-time
28. RTI -Rabindranath Tagore Institute
29. SADC - Southern African Development Community
30. SDIM -Swami Dayanand Institute of Management
IX
31. SBMF-School of Business Management and Finance
32. S&T - Science & Technology
33. SITE-School of Innovative Technologies and Engineering
34. SSDT-School of Sustainable Development and Tourism
35. SS & Humanities - Social Studies and Humanities
36. TEC- Tertiary Education Commission
37. UoM - University of Mauritius
38. UdM - Université des Mascareignes
39. UTM - University of Technology, Mauritius
40. UNESCO- United Nations Educational, Scientific and Cultural Organisation
41. UK - United Kingdom
42. USA – United States of America
1
1.0 Introduction This annual publication of Participation in Tertiary Education is the fourteenth in a series. It reports on the state of enrolment at the tertiary level in Mauritius, as at December 2012.
2.0 Methodology The methodology adopted in the present edition has been revisited with enrolment classified under four broad sources, namely Publicly-funded institutions (PFIs), private Post-secondary Education Institutions (PSEIs), Self-studies as well as Mauritians studying overseas as opposed to three categories previously: PFIs, Private/ Distance Education and Mauritians studying overseas. Enrolment data was collected from Publicly-Funded Institutions (PFIs), or 10 in total, namely the University of Mauritius (UoM), the University of Technology, Mauritius (UTM), the Mauritius Institute of Education (MIE), the Mahatma Gandhi Institute (MGI), the Open University of Mauritius (OUM, ex-Mauritius College of the Air (MCA)), Université des Mascareignes (UdM, integrating the ex. Swami Dayanand Institute of Management (SDIM) and ex. Institut Supérieur de Technologie (IST)), the Mauritius Institute of Training and Development (MITD), the Fashion and Design Institute (FDI), the Rabindranath Tagore Institute (RTI) and the Mauritius Institute of Health (MIH). Statistics from PSEIs were derived from a survey of the private tertiary education providers. As at December 2012, 67 institutions were registered with the TEC of which 49 were in operation while 44 (90%) responded to our survey. Data in respect of self-studies was collected from examination centres locally, which numbered 28 in all, amongst which the most important is the Mauritius Examination Syndicate (MES). The examination statistics encompass students studying in the PSEIs as well as those pursuing self-studies through the distance and e-learning mode directly with an overseas awarding body. These statistics are matched with data from the PSEIs to enable a guesstimate of the number of students pursuing self-studies. The method used for collecting data in respect of ACCA students which constitutes a substantial share of total tertiary enrolment, especially with regard to self-studies, has also been revisited. Up till now, because of a paucity of information from source we have had to resort to proxy indicators, namely statistics from examination centres, for arriving at an estimate of the number of ACCA students. These data unfortunately do not always convey the full picture as many ACCA students do not take examinations during the year. This shortcoming is addressed in the present report, as for the first time, we have been able to obtain actual data from the ACCA Mauritius Office, of the number of ACCA students in Mauritius. The corresponding statistics for 2012 has, accordingly, registered a major increase following this revision. With regard to Mauritian students overseas, statistics thereof were captured from the foreign embassies and High Commissions locally, more particularly, the French Embassy through Campus France, the Australian Embassy through the Australian Trade Commission, the
2
British High Commission, the Chinese Embassy, the High Commission of India, the High Commission of Pakistan, the Russian Embassy and the US Embassy. Furthermore, secondary sources of information were tapped like the Employees Welfare Fund, the Scholarship Section of the Ministry of Education & Human Resources, private recruiting agents as well as international students’ databases.
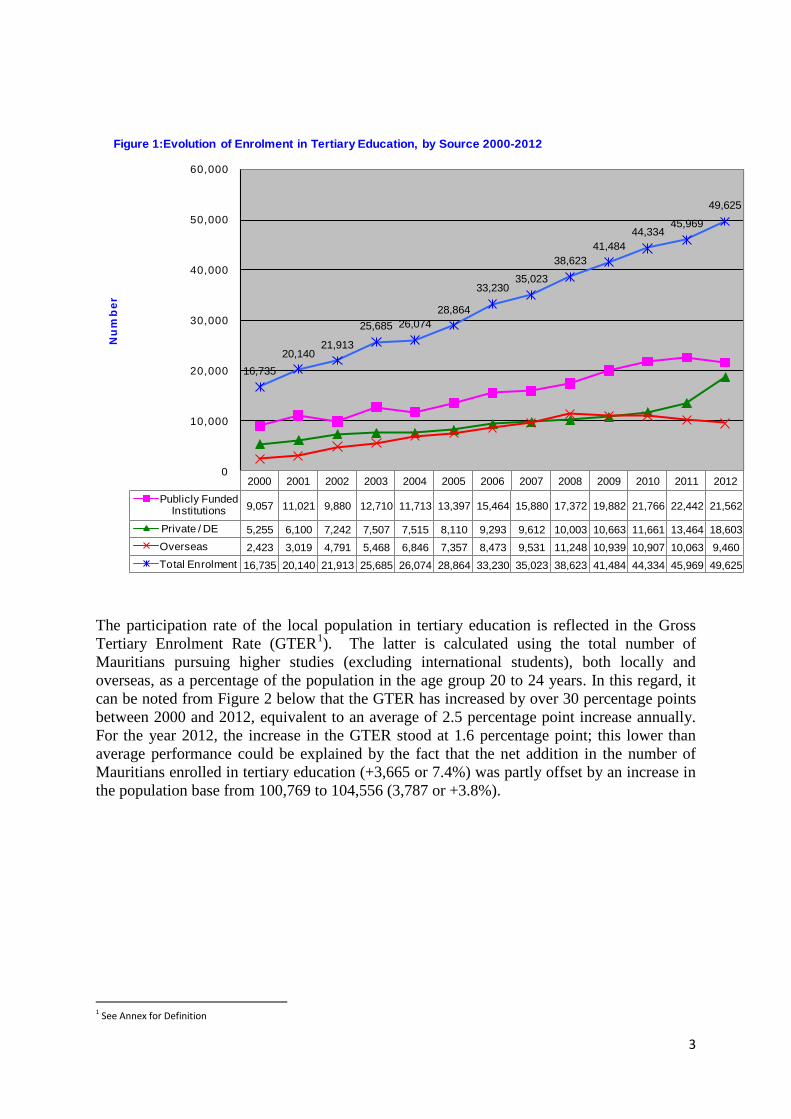
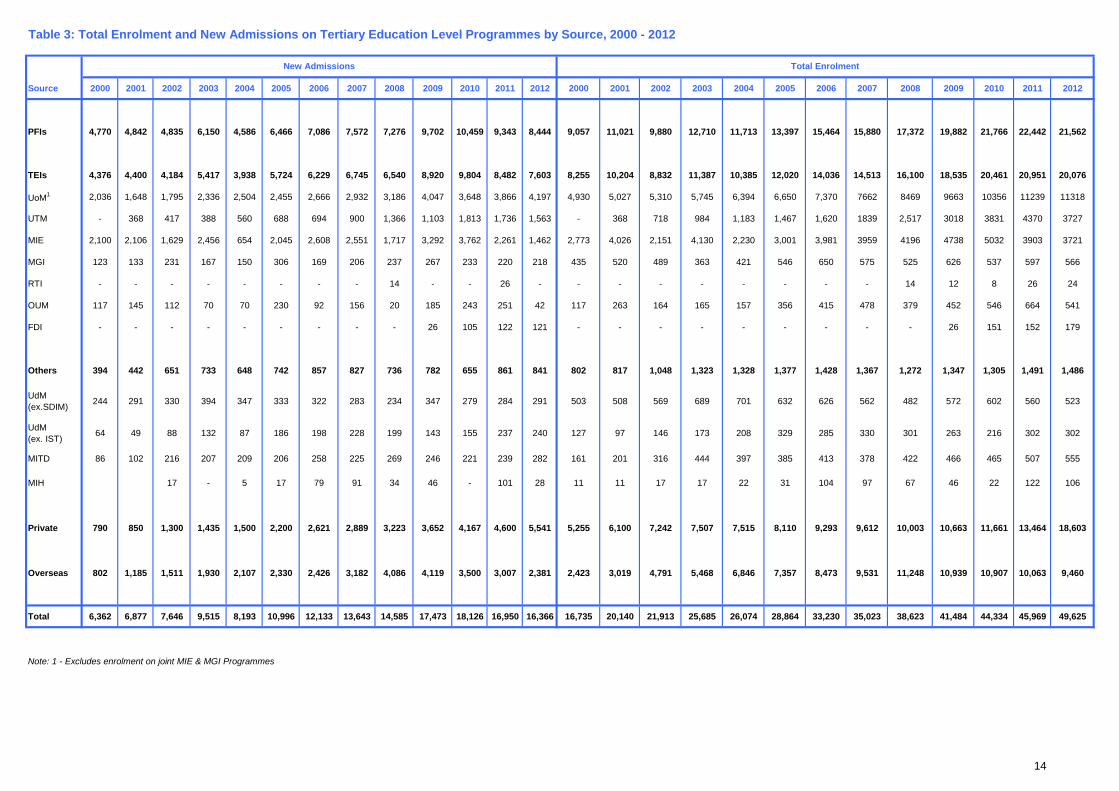
3.0 Tertiary Enrolment in 2012 Total tertiary enrolment which includes all students, local and international, enrolled and based locally as well as Mauritian students studying overseas, increased to 49,625 in 2012, up from 45,969 in 2011. Figure 1 shows the evolution of total enrolment over the period 2000-2012. As can be observed, there has been a continual and sustained increase in tertiary enrolment over the period, with growth averaging 9.5% annually. Enrolment in the PSEIs and through self-studies went up from 13,464 in 2011 to 18,603 in 2012. As mentioned above, this consequential increase in private enrolment is attributed besides an expansion of enrolment in the private institutions (+11%) to a change in the method of data collection in respect of self-studies which has resulted in a net increase of 3,645 ACCA students. In contrast, a decline in enrolment was registered in both the PFIs (from 22,442 in 2011 to 21,562 in 2012 or -3.9%) and in respect of Mauritian students overseas (from 10,063 to 9,460 or -6.0%), as shown below.
3
2000 2001 2002 2003 2004 2005 2006 2007 2008 2009 2010 2011 2012Publicly Funded
Institutions 9,057 11,021 9,880 12,710 11,713 13,397 15,464 15,880 17,372 19,882 21,766 22,442 21,562
Private / DE 5,255 6,100 7,242 7,507 7,515 8,110 9,293 9,612 10,003 10,663 11,661 13,464 18,603Overseas 2,423 3,019 4,791 5,468 6,846 7,357 8,473 9,531 11,248 10,939 10,907 10,063 9,460Total Enrolment 16,735 20,140 21,913 25,685 26,074 28,864 33,230 35,023 38,623 41,484 44,334 45,969 49,625
16,73520,140
21,913
25,685 26,07428,864
33,23035,023
38,62341,484
44,33445,969
49,625
0
10,000
20,000
30,000
40,000
50,000
60,000
Nu
mb
er
Figure 1:Evolution of Enrolment in Tertiary Education, by Source 2000-2012
The participation rate of the local population in tertiary education is reflected in the Gross Tertiary Enrolment Rate (GTER1
1 See Annex for Definition
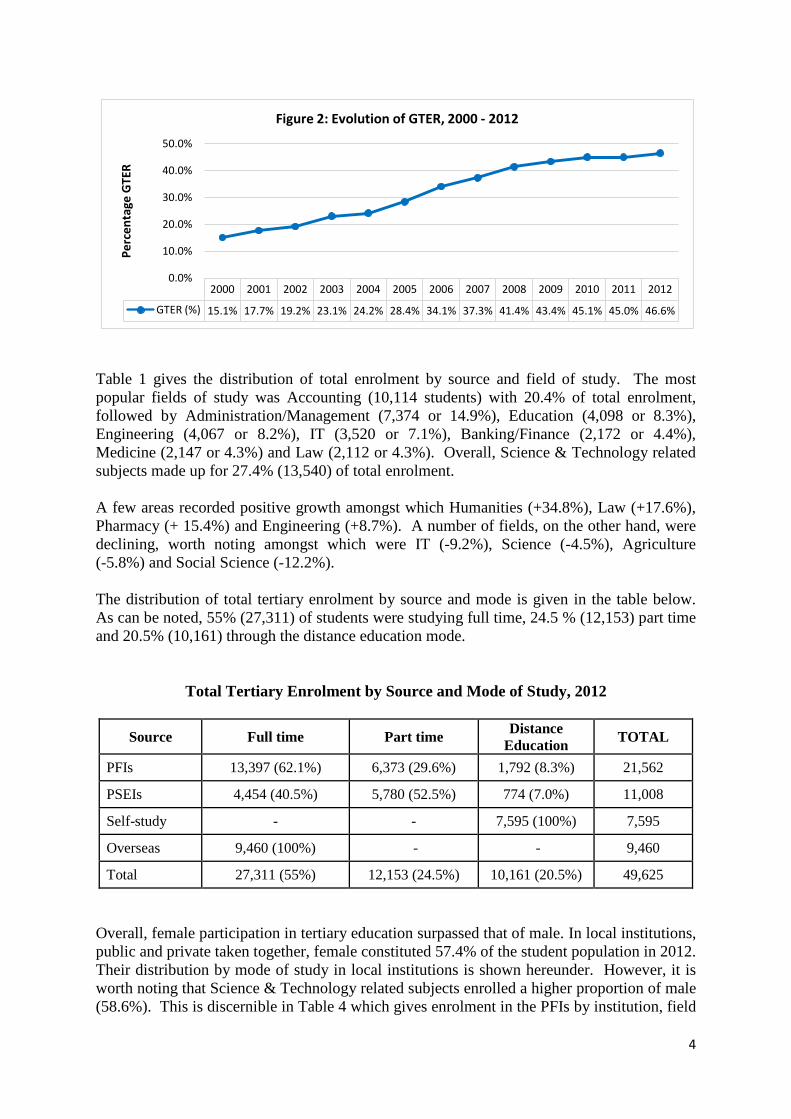
). The latter is calculated using the total number of Mauritians pursuing higher studies (excluding international students), both locally and overseas, as a percentage of the population in the age group 20 to 24 years. In this regard, it can be noted from Figure 2 below that the GTER has increased by over 30 percentage points between 2000 and 2012, equivalent to an average of 2.5 percentage point increase annually. For the year 2012, the increase in the GTER stood at 1.6 percentage point; this lower than average performance could be explained by the fact that the net addition in the number of Mauritians enrolled in tertiary education (+3,665 or 7.4%) was partly offset by an increase in the population base from 100,769 to 104,556 (3,787 or +3.8%).
4
2000 2001 2002 2003 2004 2005 2006 2007 2008 2009 2010 2011 2012
GTER (%) 15.1% 17.7% 19.2% 23.1% 24.2% 28.4% 34.1% 37.3% 41.4% 43.4% 45.1% 45.0% 46.6%
0.0%
10.0%
20.0%
30.0%
40.0%
50.0%Pe
rcen
tage
GTE
RFigure 2: Evolution of GTER, 2000 - 2012
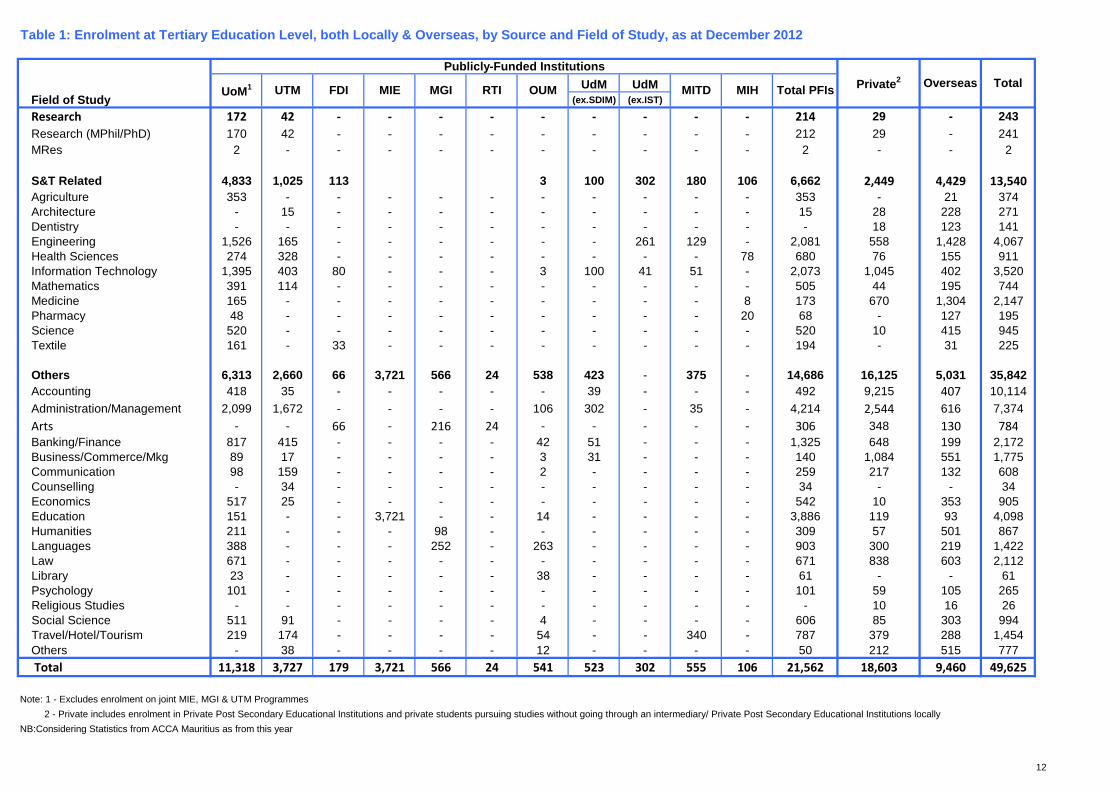
Table 1 gives the distribution of total enrolment by source and field of study. The most popular fields of study was Accounting (10,114 students) with 20.4% of total enrolment, followed by Administration/Management (7,374 or 14.9%), Education (4,098 or 8.3%), Engineering (4,067 or 8.2%), IT (3,520 or 7.1%), Banking/Finance (2,172 or 4.4%), Medicine (2,147 or 4.3%) and Law (2,112 or 4.3%). Overall, Science & Technology related subjects made up for 27.4% (13,540) of total enrolment. A few areas recorded positive growth amongst which Humanities (+34.8%), Law (+17.6%), Pharmacy (+ 15.4%) and Engineering (+8.7%). A number of fields, on the other hand, were declining, worth noting amongst which were IT (-9.2%), Science (-4.5%), Agriculture (-5.8%) and Social Science (-12.2%).
The distribution of total tertiary enrolment by source and mode is given in the table below. As can be noted, 55% (27,311) of students were studying full time, 24.5 % (12,153) part time and 20.5% (10,161) through the distance education mode.
Total Tertiary Enrolment by Source and Mode of Study, 2012
Source Full time Part time Distance Education TOTAL
PFIs 13,397 (62.1%) 6,373 (29.6%) 1,792 (8.3%) 21,562
PSEIs 4,454 (40.5%) 5,780 (52.5%) 774 (7.0%) 11,008
Self-study - - 7,595 (100%) 7,595
Overseas 9,460 (100%) - - 9,460
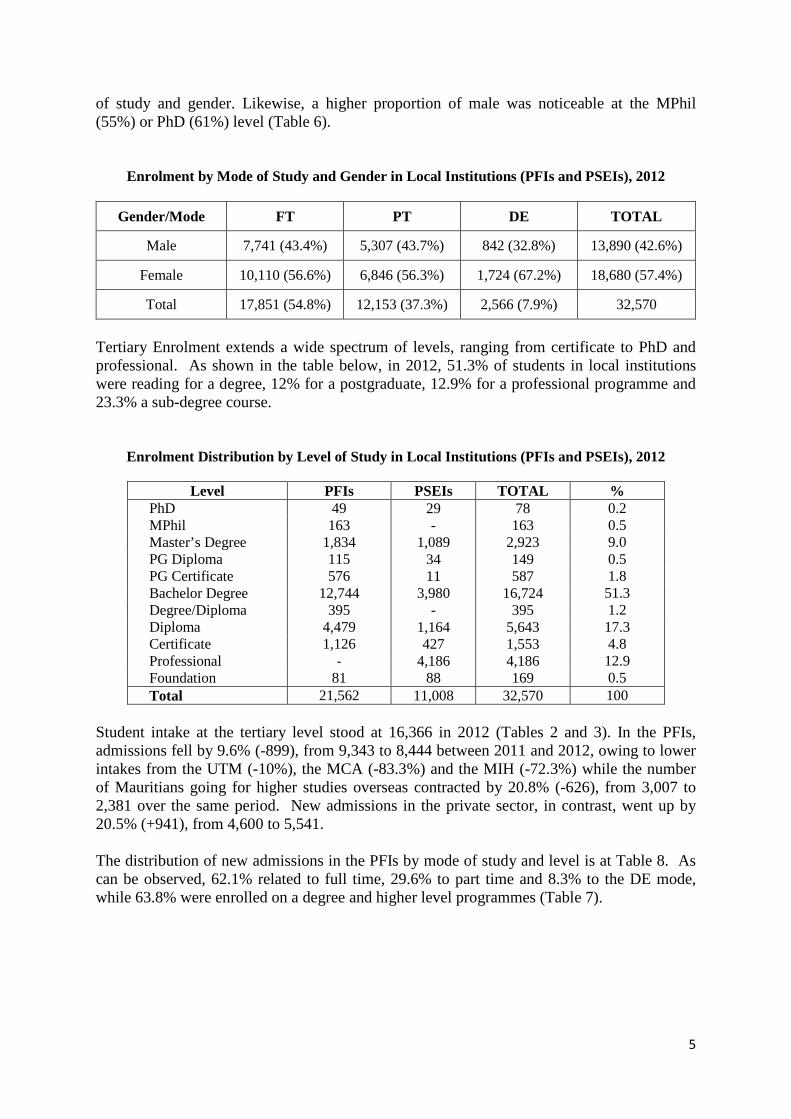
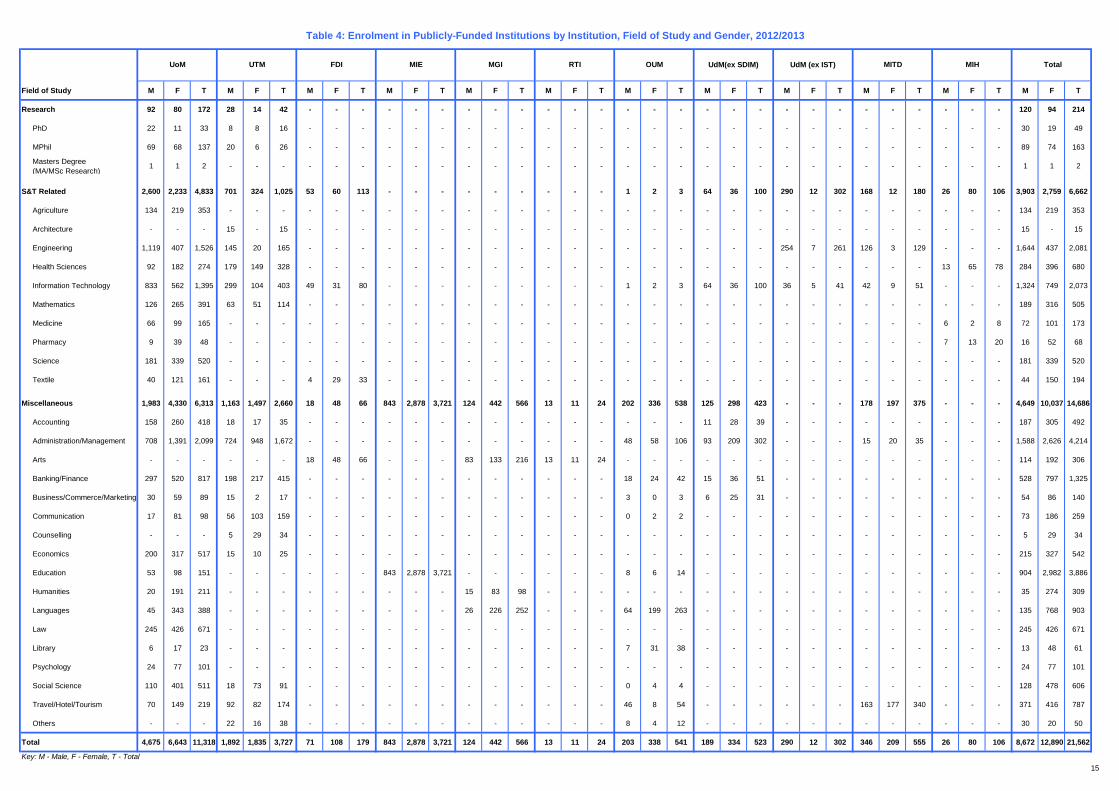
Total 27,311 (55%) 12,153 (24.5%) 10,161 (20.5%) 49,625 Overall, female participation in tertiary education surpassed that of male. In local institutions, public and private taken together, female constituted 57.4% of the student population in 2012. Their distribution by mode of study in local institutions is shown hereunder. However, it is worth noting that Science & Technology related subjects enrolled a higher proportion of male (58.6%). This is discernible in Table 4 which gives enrolment in the PFIs by institution, field
5
of study and gender. Likewise, a higher proportion of male was noticeable at the MPhil (55%) or PhD (61%) level (Table 6).
Enrolment by Mode of Study and Gender in Local Institutions (PFIs and PSEIs), 2012
Gender/Mode FT PT DE TOTAL
Male 7,741 (43.4%) 5,307 (43.7%) 842 (32.8%) 13,890 (42.6%)
Female 10,110 (56.6%) 6,846 (56.3%) 1,724 (67.2%) 18,680 (57.4%)
Total 17,851 (54.8%) 12,153 (37.3%) 2,566 (7.9%) 32,570
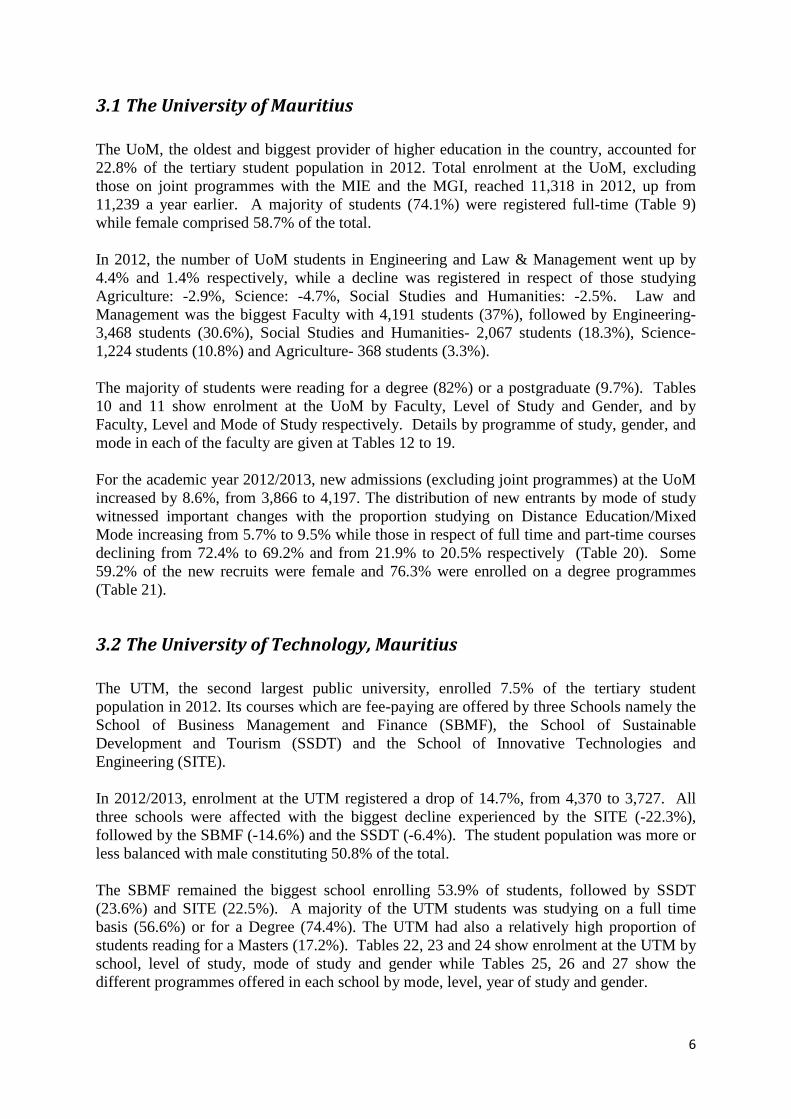
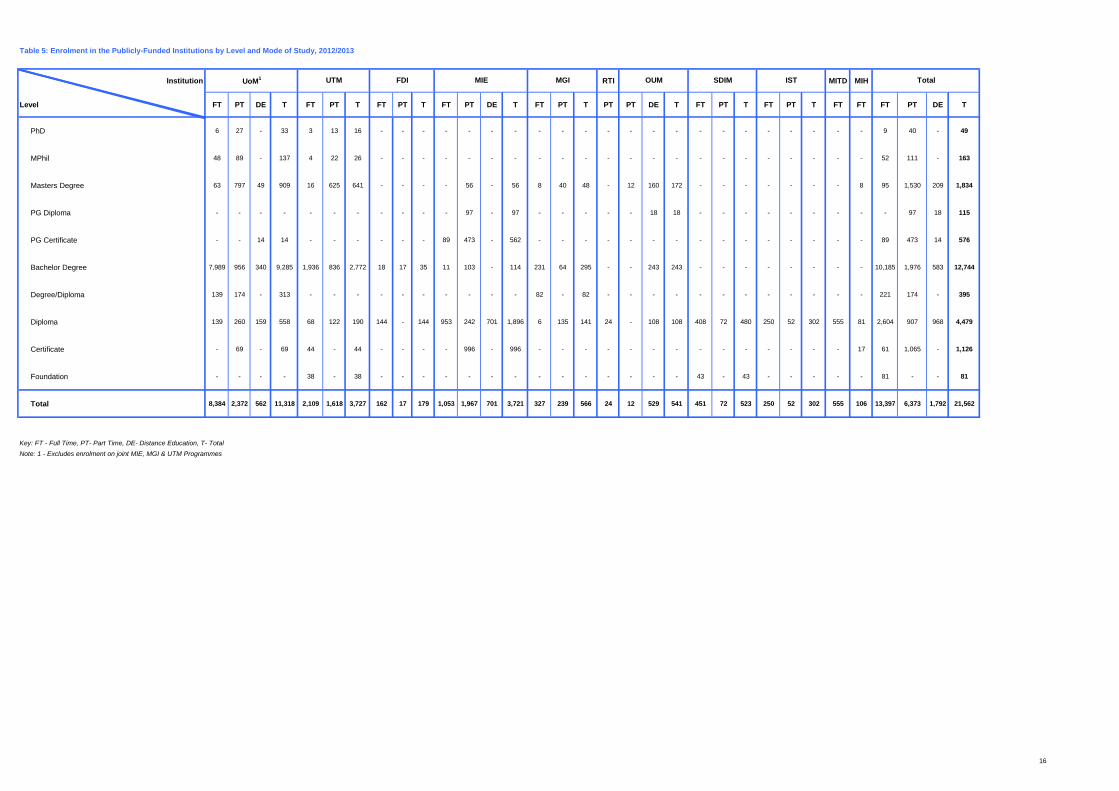
Tertiary Enrolment extends a wide spectrum of levels, ranging from certificate to PhD and professional. As shown in the table below, in 2012, 51.3% of students in local institutions were reading for a degree, 12% for a postgraduate, 12.9% for a professional programme and 23.3% a sub-degree course.
Enrolment Distribution by Level of Study in Local Institutions (PFIs and PSEIs), 2012
Level PFIs PSEIs TOTAL % PhD 49 29 78 0.2 MPhil 163 - 163 0.5 Master’s Degree 1,834 1,089 2,923 9.0 PG Diploma 115 34 149 0.5 PG Certificate 576 11 587 1.8 Bachelor Degree 12,744 3,980 16,724 51.3 Degree/Diploma 395 - 395 1.2 Diploma 4,479 1,164 5,643 17.3 Certificate 1,126 427 1,553 4.8 Professional - 4,186 4,186 12.9 Foundation 81 88 169 0.5 Total 21,562 11,008 32,570 100
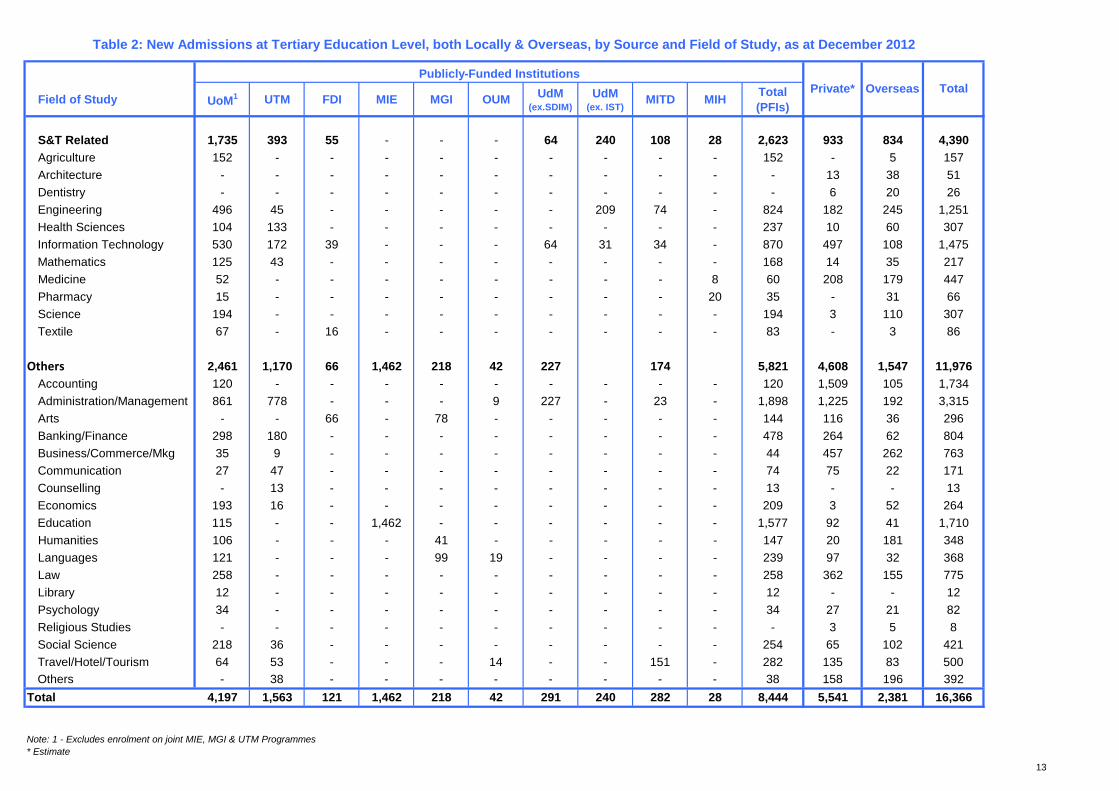
Student intake at the tertiary level stood at 16,366 in 2012 (Tables 2 and 3). In the PFIs, admissions fell by 9.6% (-899), from 9,343 to 8,444 between 2011 and 2012, owing to lower intakes from the UTM (-10%), the MCA (-83.3%) and the MIH (-72.3%) while the number of Mauritians going for higher studies overseas contracted by 20.8% (-626), from 3,007 to 2,381 over the same period. New admissions in the private sector, in contrast, went up by 20.5% (+941), from 4,600 to 5,541. The distribution of new admissions in the PFIs by mode of study and level is at Table 8. As can be observed, 62.1% related to full time, 29.6% to part time and 8.3% to the DE mode, while 63.8% were enrolled on a degree and higher level programmes (Table 7).
6
3.1 The University of Mauritius The UoM, the oldest and biggest provider of higher education in the country, accounted for 22.8% of the tertiary student population in 2012. Total enrolment at the UoM, excluding those on joint programmes with the MIE and the MGI, reached 11,318 in 2012, up from 11,239 a year earlier. A majority of students (74.1%) were registered full-time (Table 9) while female comprised 58.7% of the total. In 2012, the number of UoM students in Engineering and Law & Management went up by 4.4% and 1.4% respectively, while a decline was registered in respect of those studying Agriculture: -2.9%, Science: -4.7%, Social Studies and Humanities: -2.5%. Law and Management was the biggest Faculty with 4,191 students (37%), followed by Engineering- 3,468 students (30.6%), Social Studies and Humanities- 2,067 students (18.3%), Science- 1,224 students (10.8%) and Agriculture- 368 students (3.3%). The majority of students were reading for a degree (82%) or a postgraduate (9.7%). Tables 10 and 11 show enrolment at the UoM by Faculty, Level of Study and Gender, and by Faculty, Level and Mode of Study respectively. Details by programme of study, gender, and mode in each of the faculty are given at Tables 12 to 19. For the academic year 2012/2013, new admissions (excluding joint programmes) at the UoM increased by 8.6%, from 3,866 to 4,197. The distribution of new entrants by mode of study witnessed important changes with the proportion studying on Distance Education/Mixed Mode increasing from 5.7% to 9.5% while those in respect of full time and part-time courses declining from 72.4% to 69.2% and from 21.9% to 20.5% respectively (Table 20). Some 59.2% of the new recruits were female and 76.3% were enrolled on a degree programmes (Table 21).
3.2 The University of Technology, Mauritius The UTM, the second largest public university, enrolled 7.5% of the tertiary student population in 2012. Its courses which are fee-paying are offered by three Schools namely the School of Business Management and Finance (SBMF), the School of Sustainable Development and Tourism (SSDT) and the School of Innovative Technologies and Engineering (SITE). In 2012/2013, enrolment at the UTM registered a drop of 14.7%, from 4,370 to 3,727. All three schools were affected with the biggest decline experienced by the SITE (-22.3%), followed by the SBMF (-14.6%) and the SSDT (-6.4%). The student population was more or less balanced with male constituting 50.8% of the total. The SBMF remained the biggest school enrolling 53.9% of students, followed by SSDT (23.6%) and SITE (22.5%). A majority of the UTM students was studying on a full time basis (56.6%) or for a Degree (74.4%). The UTM had also a relatively high proportion of students reading for a Masters (17.2%). Tables 22, 23 and 24 show enrolment at the UTM by school, level of study, mode of study and gender while Tables 25, 26 and 27 show the different programmes offered in each school by mode, level, year of study and gender.
7
The UTM recruited 1,563 students in 2012 as opposed to 1,736 in 2011 and 1,813 in 2010, of which 53% were female and 64% full-time. Their distribution by school, mode of study, gender, level and year of study is given at Tables 28, 29 and 30.
3.3 The Mauritius Institute of Education The MIE which is devoted exclusively to the education and training of teachers spanning from pre-primary to the secondary level, including school administrators/managers, ran a total of 67 programmes ranging from Certificate to Master’s level in 2012. Total enrolment at the MIE has been declining over the last 3 years to reach 3,721 in 2012, down from 3,903 in 2011 and 5,032 in 2010, reflecting in part reduced number of teachers recruited by the sector over the period. In 2012, new intake of students stood at 1,462 with female accounting for over 3 in 4 (77.3%) of students overall. Some 1,896 (50.9%) students were enrolled on Diploma, 996 (26.8%) on Certificate/Advanced Certificate, 659 (17.7%) on Postgraduate Diploma/ Certificate, 114 (3.1%) on Degree programmes and 56 (1.5%) on Masters programmes; of these 52.9% were enrolled part time, 28.3% full time and 18.8% through the distance education mode. Enrolment distribution at the MIE, by programme, year and mode of study and gender is shown at Table 32.
3.4 The Mahatma Gandhi Institute In line with its objective to promote Indian culture and traditions, the MGI offers tertiary level programmes related to Indian philosophy and languages as well as performing arts, amongst others, at level ranging from Certificate to Masters. Degree and higher level programmes are awarded jointly by the University of Mauritius. In 2012, the MGI was running 33 programmes and had a total of 566 students including 218 new intake, of which 48 (8.5%) were enrolled on a Masters, 295 (52.1%) on a Degree, 82 (14.5%) on a Diploma/Degree and 141 (24.9%) on a Diploma programme. 327 students (57.8%) were studying full-time and 239 (42.2%) part time. The MGI did not offer distance education programmes. Female constituted 78.1% of the student population. Table 33 shows enrolment at the MGI by programme, mode of study, year of study and gender.
3.5 The Open University of Mauritius The OUM, the third public university, was created in 2012 from a takeover of the ex. Mauritius College of the Air (MCA). During its first year of operation, deemed to be transitional, only 42 new students were recruited by OUM as opposed to 251 in the previous year (from ex MCA). Total enrolment, accordingly, declined by 18.5%, from 664 in 2011 to 541 in 2012. Some 17 programmes were offered in collaboration with IGNOU, AMITY and the University of Madras (India), 4 were run jointly with local universities (UoM and UTM) and two in respect of the Chartered Institute of Logistics and Transport, UK. The students were enrolled on Degree (44.9%), Masters 172 (31.8%), Diploma 108 (20%) and Postgraduate
8
Diploma 18 (3.3%) programmes. Female accounted for 62.5% of total enrolment. Table 35 shows the distribution of the student population by programme, mode and year of study, and gender.
3.6 Université des Mascareignes Another new university, namely UdM integrated the tertiary education landscape in 2012 following the upgrading and absorption within its midst of two existing polytechnics namely the SDIM and IST. The UdM distinguishes itself from other providers by virtue of its French connection and the strong links it entertains with the University of Limoges, France. Both the SDIM and the IST which operated on their own at the time of the creation of UdM had a combined student population of 825, 64.4% of which were in their first year and 85% full time. The SDIM witnessed a 6.6% decline in its student population over the year, while that of the IST remained more or less constant. The SDIM offered 8 diploma-level programmes and 2 Foundation courses on a full time mode and 2 diploma programmes on a part time basis while the IST ran 4 full time and 3 part time diploma programmes. In view of the technical nature of its programmes, IST attracts predominantly male students (96%) while at the SDIM, the student population consist of a majority of female (63.9%). Tables 36 and 37 show enrolment by programmes, mode and year of study and gender at the SDIM and the IST respectively.
3.7 The Mauritius Institute of Training and Development Although the main focus of the MITD is technical, vocational education and training, the institution has been offering an increasing number of tertiary level programmes having a high practical component in recent years. In 2012, 11 diploma level courses were offered, all on full-time basis. The student population totalled 555 compared to 507 students in 2011, representing an increase of 9.5%. New recruits amounted to 282. The student population was dominated by male which represented 62.3% of the total. Male comprised the totality of enrolment on the Higher National Diploma (HND) in Electrical and Electronic Engineering, the National Diploma in Applied Mechanical and Electrical Engineering and the National Diploma in Building Services Engineering while the Diploma in Hotel Management and the National Diploma in Civil Engineering also registered very low female participation. A higher proportion of female students, on the other hand, were enrolled on the Diploma in Tourism Management and the HND in Hospitality Management. The distribution of students by broad programme was as follows: Tourism/Hospitality Management-267; Information Technology-51; Engineering-129; Culinary Arts- 73; Business Administration-35. Details by gender, mode and year of study are given at Table 38.
9
3.8 The Fashion and Design Institute The FDI broadened its programme portfolio in 2012 with a total of 6 programmes, 5 full-time and 1 part-time, including 2 at degree and 4 at diploma-level, on which were enrolled 179 students. The degree programmes were awarded by the UTM, while the Diploma programmes were from Edexcel, UK. The student population was dominated by female, which represented 60.3% (108) while new recruits accounted for 67.6% (121) of the total. Table 31 shows enrolment at the FDI by programme, awarding body, gender, year and mode of study.
3.9 The Rabindranath Tagore Institute The RTI enrolled only 24 students on a part time diploma programme in Dramatic Arts (Table 34) in 2012 including 11 female. There were no new recruits during the year at the institution and the 24 students were in their second year of study.
3.10 The Mauritius Institute of Health The MIH, a public body under the Ministry of Health and Quality of Life, undertakes training and research in the health sector and health related disciplines. It enrolled a total of 106 full-time students, including 80 female, in 2012. Some 8 students were doing a postgraduate course, 81 were registered on 2 diploma programmes and 17 were following a certificate level programme. Table 39 shows enrolment at the institution by programme, gender, year and mode of study.
3.11 Private Providers Private enrolment which comprises students attending private PSEIs as well as those undertaking self-studies through the distance and open learning mode directly with an overseas awarding body amounted to 11,008 and 7,595 students respectively in 2012 or a total of 18,603. The private students were registered with a total of 91 awarding bodies, of which 86 were based overseas, namely in the UK (58), France/Reunion (7), India (6), Australia (5), South Africa (4), Malaysia (2), USA (1), New Zealand (1), Sudan (1) and Pakistan (1) and 5 locally (AMITY, CTI, MEF, UoM, UTM) Table 42 gives enrolment in PSEIs by field and level. A majority of students or 55.2% were enrolled on professional, 27.1% on Degree, 6.9% on Diploma, 6.7% on Master’s and 3.2% on Certificate- level programmes. The remaining 0.9% of students was enrolled on PhD (29), postgraduate diploma (36) and foundation courses (88). Students were studying on a part-time (52.5%), full-time (40.5%) as well as distance mode (7%) basis. Wide variation exists in enrolment in the PSEIs. Of the 44 institutions (out of a total of 49) surveyed, 11 had a student population of less than 50, 9 between 50 and less than 100, 17
10
between 100 and less than 350, 4 between 350 and 600 and 3 more than 1400 students. Table 43 shows a list of the PSEIs with their respective enrolment figures. Supply of tertiary education in the PSEIs remained concentrated on soft programmes, more specifically accounting (38%), Administration and Management (18.4%) and Business/Commerce/Marketing (6.3%). Science & Technology-related subjects, in contrast, made up for only 18.8% of enrolment, with Information Technology (8.8%) being the most popular followed by Medicine (6%). Engineering, on the other hand, enrolled only 3% of students. Female outnumbered male students and constituted 52.6% of the student population (Table 44). Tables 45 and 46 show the enrolment figures in the PSEIs by level, mode of study, gender. The number of students undertaking self-studies stood at 7,595 in 2012. From Table 47, it can be noted that nearly 2 in 3 students (66.2%) were registered in the field of Accountancy (66.2%). The remainder were studying in the fields of Administration & Management (6.8%), Law (6.4%) and Business/Commerce/Marketing (5.2%), among others.
3.12 Total Enrolment through the Distance Education Mode In 2012, 1 in 4 students (25.3%) enrolled and based locally or 10,161 out of 40,165 students were following a tertiary level programme through the DE mode: 17.6% (1,792) of the DE students were registered with the PFIs, 7.6% (774) with the PSEIs and 74.8% (7,595) directly with an awarding body from overseas. Table 48 gives DE enrolment by source and field of study. Accounting, Administration/ Management and Education were the most popular fields of study among the distance learners. Table 49 gives DE enrolment distribution in the PFIs by programme. As can be noted, only 3 PFIs were running DE programmes, namely the MIE, which had 701 DE students on its Teachers Diploma programme (primary), the UoM, 151 students and the OUM (ex. MCA), 529 students.
3.13 International Students Studying in Mauritius International student enrolment at the tertiary level maintained its momentum in 2012 to reach 924 compared to 635 in 2011, representing a growth rate of 45.5%. The PSEIs enrolled a majority of the students or some 839 (90.8%); these were concentrated in 24 institutions. The remaining students (85) were recruited by 5 PFIs, namely the UoM, UTM, IST, FDI and the MGI. Some 778 (84.2%) international students were studying full time; 77 (8.3%), on the other hand, were studying part time and 69 (7.5 %) through the DE mode. Male constituted nearly 60% of the total. Table 50 shows the enrolment of international students by institution, mode of study and gender. Some 543 (58.8%) students were enrolled on degree programmes, 235 (25.4%) on postgraduate including master level programmes and 109 (11.8%) on diploma level programmes amongst others. Table 51 shows enrolment of international students by programme, institution, mode and level of study.
11
The international students emanated from 60 different countries; the main source markets being India (200), South Africa (117), Nigeria (113), Madagascar (95) and Malawi (55). Table 52 shows the enrolment distribution of international students in tertiary education locally, by country of origin, institution, mode and level of study. Some 25.2% of international students were doing medicine, 22.8% Administration/ Management, 14.6% Information Technology and 10.1% Travel and Tourism. The majority of the Indian (53%) and South African (81.2%) students were studying medicine while 3 in 4 Nigerians were doing IT.
3.14 Mauritian Students Studying Abroad The number of Mauritian students who left the country during the year to pursue higher studies overseas declined for a third successive year to stand at 2,381 in 2012 after attaining peak of 4,119 in 2009. Australia was the most preferred overseas destination of Mauritians for higher studies in 2012 accounting for 36.7% (874) of new departures, followed by the UK (19.1%; 456), India (16.7%; 397), France/Reunion (7.6%;182) and China (5.3%; 127) amongst others. Table 53 shows the number of fresh Mauritian students going overseas for tertiary education in 2012, by field of study and country The total number of Mauritians studying abroad fell by 6%, from 10,063 in 2011 to 9,460 in 2012. The UK emerged as the lead destination with 2,701 students; Australia was relegated to second place with 2,227 students followed by France/Reunion (1,740), India (1,167) and China (448). Overall, Engineering (15.1%) was one of the most-sought after field of study by Mauritian students overseas besides Medicine (13.8%), Administration and Management (6.5%), Law (6.4%) and Business/ Commerce/ Marketing (5.8%). Of the 1,428 Engineering students, 513 (35.9%) studied in the UK, 328 (23%) in Australia and 119 (8.3%) in Malaysia. Similarly 435 (33.4%) of Medicine students went to France/Reunion, 369 to China (28.3%) and 258 (19.8%) to the UK. The majority of Law students, on the other hand, were undertaking their studies in the UK (71%) and France (21.7%). Likewise, out of 501 Humanities students, 96.6% were based in India. Table 54 shows the total number of Mauritian students pursuing tertiary education overseas by country and field of study.
12
UdM UdMField of Study (ex.SDIM) (ex.IST)
Research 172 42 - - - - - - - - - 214 29 - 243Research (MPhil/PhD) 170 42 - - - - - - - - - 212 29 - 241MRes 2 - - - - - - - - - - 2 - - 2
S&T Related 4,833 1,025 113 3 100 302 180 106 6,662 2,449 4,429 13,540Agriculture 353 - - - - - - - - - - 353 - 21 374Architecture - 15 - - - - - - - - - 15 28 228 271Dentistry - - - - - - - - - - - - 18 123 141Engineering 1,526 165 - - - - - - 261 129 - 2,081 558 1,428 4,067Health Sciences 274 328 - - - - - - - - 78 680 76 155 911Information Technology 1,395 403 80 - - - 3 100 41 51 - 2,073 1,045 402 3,520Mathematics 391 114 - - - - - - - - - 505 44 195 744Medicine 165 - - - - - - - - - 8 173 670 1,304 2,147Pharmacy 48 - - - - - - - - - 20 68 - 127 195Science 520 - - - - - - - - - - 520 10 415 945Textile 161 - 33 - - - - - - - - 194 - 31 225
Others 6,313 2,660 66 3,721 566 24 538 423 - 375 - 14,686 16,125 5,031 35,842Accounting 418 35 - - - - - 39 - - - 492 9,215 407 10,114Administration/Management 2,099 1,672 - - - - 106 302 - 35 - 4,214 2,544 616 7,374Arts - - 66 - 216 24 - - - - - 306 348 130 784Banking/Finance 817 415 - - - - 42 51 - - - 1,325 648 199 2,172Business/Commerce/Mkg 89 17 - - - - 3 31 - - - 140 1,084 551 1,775Communication 98 159 - - - - 2 - - - - 259 217 132 608Counselling - 34 - - - - - - - - - 34 - - 34Economics 517 25 - - - - - - - - - 542 10 353 905Education 151 - - 3,721 - - 14 - - - - 3,886 119 93 4,098Humanities 211 - - - 98 - - - - - - 309 57 501 867Languages 388 - - - 252 - 263 - - - - 903 300 219 1,422Law 671 - - - - - - - - - - 671 838 603 2,112Library 23 - - - - - 38 - - - - 61 - - 61Psychology 101 - - - - - - - - - - 101 59 105 265Religious Studies - - - - - - - - - - - - 10 16 26Social Science 511 91 - - - - 4 - - - - 606 85 303 994Travel/Hotel/Tourism 219 174 - - - - 54 - - 340 - 787 379 288 1,454Others - 38 - - - - 12 - - - - 50 212 515 777 Total 11,318 3,727 179 3,721 566 24 541 523 302 555 106 21,562 18,603 9,460 49,625
Note: 1 - Excludes enrolment on joint MIE, MGI & UTM Programmes 2 - Private includes enrolment in Private Post Secondary Educational Institutions and private students pursuing studies without going through an intermediary/ Private Post Secondary Educational Institutions locallyNB:Considering Statistics from ACCA Mauritius as from this year
MIE MGI RTI OUM MITD MIH Total PFIs Overseas Total
Table 1: Enrolment at Tertiary Education Level, both Locally & Overseas, by Source and Field of Study, as at December 2012
Publicly-Funded InstitutionsPrivate2
UoM1 UTM FDI
13
Field of Study UoM1 UTM FDI MIE MGI OUM UdM(ex.SDIM)
UdM (ex. IST)
MITD MIH Total (PFIs)
S&T Related 1,735 393 55 - - - 64 240 108 28 2,623 933 834 4,390Agriculture 152 - - - - - - - - - 152 - 5 157Architecture - - - - - - - - - - - 13 38 51Dentistry - - - - - - - - - - - 6 20 26Engineering 496 45 - - - - - 209 74 - 824 182 245 1,251Health Sciences 104 133 - - - - - - - - 237 10 60 307Information Technology 530 172 39 - - - 64 31 34 - 870 497 108 1,475Mathematics 125 43 - - - - - - - - 168 14 35 217Medicine 52 - - - - - - - - 8 60 208 179 447Pharmacy 15 - - - - - - - - 20 35 - 31 66Science 194 - - - - - - - - - 194 3 110 307Textile 67 - 16 - - - - - - - 83 - 3 86
Others 2,461 1,170 66 1,462 218 42 227 174 5,821 4,608 1,547 11,976Accounting 120 - - - - - - - - - 120 1,509 105 1,734Administration/Management 861 778 - - - 9 227 - 23 - 1,898 1,225 192 3,315Arts - - 66 - 78 - - - - - 144 116 36 296Banking/Finance 298 180 - - - - - - - - 478 264 62 804Business/Commerce/Mkg 35 9 - - - - - - - - 44 457 262 763Communication 27 47 - - - - - - - - 74 75 22 171Counselling - 13 - - - - - - - - 13 - - 13Economics 193 16 - - - - - - - - 209 3 52 264Education 115 - - 1,462 - - - - - - 1,577 92 41 1,710Humanities 106 - - - 41 - - - - - 147 20 181 348Languages 121 - - - 99 19 - - - - 239 97 32 368Law 258 - - - - - - - - - 258 362 155 775Library 12 - - - - - - - - - 12 - - 12Psychology 34 - - - - - - - - - 34 27 21 82Religious Studies - - - - - - - - - - - 3 5 8Social Science 218 36 - - - - - - - - 254 65 102 421Travel/Hotel/Tourism 64 53 - - - 14 - - 151 - 282 135 83 500Others - 38 - - - - - - - - 38 158 196 392
Total 4,197 1,563 121 1,462 218 42 291 240 282 28 8,444 5,541 2,381 16,366
Total
Note: 1 - Excludes enrolment on joint MIE, MGI & UTM Programmes* Estimate
Private* OverseasPublicly-Funded Institutions
Table 2: New Admissions at Tertiary Education Level, both Locally & Overseas, by Source and Field of Study, as at December 2012
14
Table 3: Total Enrolment and New Admissions on Tertiary Education Level Programmes by Source, 2000 - 2012
Source 2000 2001 2002 2003 2004 2005 2006 2007 2008 2009 2010 2011 2012 2000 2001 2002 2003 2004 2005 2006 2007 2008 2009 2010 2011 2012
PFIs 4,770 4,842 4,835 6,150 4,586 6,466 7,086 7,572 7,276 9,702 10,459 9,343 8,444 9,057 11,021 9,880 12,710 11,713 13,397 15,464 15,880 17,372 19,882 21,766 22,442 21,562
TEIs 4,376 4,400 4,184 5,417 3,938 5,724 6,229 6,745 6,540 8,920 9,804 8,482 7,603 8,255 10,204 8,832 11,387 10,385 12,020 14,036 14,513 16,100 18,535 20,461 20,951 20,076
UoM1 2,036 1,648 1,795 2,336 2,504 2,455 2,666 2,932 3,186 4,047 3,648 3,866 4,197 4,930 5,027 5,310 5,745 6,394 6,650 7,370 7662 8469 9663 10356 11239 11318
UTM - 368 417 388 560 688 694 900 1,366 1,103 1,813 1,736 1,563 - 368 718 984 1,183 1,467 1,620 1839 2,517 3018 3831 4370 3727
MIE 2,100 2,106 1,629 2,456 654 2,045 2,608 2,551 1,717 3,292 3,762 2,261 1,462 2,773 4,026 2,151 4,130 2,230 3,001 3,981 3959 4196 4738 5032 3903 3721
MGI 123 133 231 167 150 306 169 206 237 267 233 220 218 435 520 489 363 421 546 650 575 525 626 537 597 566
RTI - - - - - - - - 14 - - 26 - - - - - - - - - 14 12 8 26 24
OUM 117 145 112 70 70 230 92 156 20 185 243 251 42 117 263 164 165 157 356 415 478 379 452 546 664 541
FDI - - - - - - - - - 26 105 122 121 - - - - - - - - - 26 151 152 179
Others 394 442 651 733 648 742 857 827 736 782 655 861 841 802 817 1,048 1,323 1,328 1,377 1,428 1,367 1,272 1,347 1,305 1,491 1,486
UdM (ex.SDIM) 244 291 330 394 347 333 322 283 234 347 279 284 291 503 508 569 689 701 632 626 562 482 572 602 560 523
UdM(ex. IST) 64 49 88 132 87 186 198 228 199 143 155 237 240 127 97 146 173 208 329 285 330 301 263 216 302 302
MITD 86 102 216 207 209 206 258 225 269 246 221 239 282 161 201 316 444 397 385 413 378 422 466 465 507 555
MIH 17 - 5 17 79 91 34 46 - 101 28 11 11 17 17 22 31 104 97 67 46 22 122 106
Private 790 850 1,300 1,435 1,500 2,200 2,621 2,889 3,223 3,652 4,167 4,600 5,541 5,255 6,100 7,242 7,507 7,515 8,110 9,293 9,612 10,003 10,663 11,661 13,464 18,603
Overseas 802 1,185 1,511 1,930 2,107 2,330 2,426 3,182 4,086 4,119 3,500 3,007 2,381 2,423 3,019 4,791 5,468 6,846 7,357 8,473 9,531 11,248 10,939 10,907 10,063 9,460
Total 6,362 6,877 7,646 9,515 8,193 10,996 12,133 13,643 14,585 17,473 18,126 16,950 16,366 16,735 20,140 21,913 25,685 26,074 28,864 33,230 35,023 38,623 41,484 44,334 45,969 49,625
Note: 1 - Excludes enrolment on joint MIE & MGI Programmes
New Admissions Total Enrolment
15
Field of Study M F T M F T M F T M F T M F T M F T M F T M F T M F T M F T M F T M F T
Research 92 80 172 28 14 42 - - - - - - - - - - - - - - - - - - - - - - - - - - - 120 94 214
PhD 22 11 33 8 8 16 - - - - - - - - - - - - - - - - - - - - - - - - - - - 30 19 49
MPhil 69 68 137 20 6 26 - - - - - - - - - - - - - - - - - - - - - - - - - - - 89 74 163
Masters Degree (MA/MSc Research)
1 1 2 - - - - - - - - - - - - - - - - - - - - - - - - - - - - - - 1 1 2
S&T Related 2,600 2,233 4,833 701 324 1,025 53 60 113 - - - - - - - - - 1 2 3 64 36 100 290 12 302 168 12 180 26 80 106 3,903 2,759 6,662
Agriculture 134 219 353 - - - - - - - - - - - - - - - - - - - - - - - - - - - - - - 134 219 353
Architecture - - - 15 - 15 - - - - - - - - - - - - - - - - - - - - - - - - - - - 15 - 15
Engineering 1,119 407 1,526 145 20 165 - - - - - - - - - - - - - - - - - - 254 7 261 126 3 129 - - - 1,644 437 2,081
Health Sciences 92 182 274 179 149 328 - - - - - - - - - - - - - - - - - - - - - - - - 13 65 78 284 396 680
Information Technology 833 562 1,395 299 104 403 49 31 80 - - - - - - - - - 1 2 3 64 36 100 36 5 41 42 9 51 - - - 1,324 749 2,073
Mathematics 126 265 391 63 51 114 - - - - - - - - - - - - - - - - - - - - - - - - - - - 189 316 505
Medicine 66 99 165 - - - - - - - - - - - - - - - - - - - - - - - - - - - 6 2 8 72 101 173
Pharmacy 9 39 48 - - - - - - - - - - - - - - - - - - - - - - - - - - - 7 13 20 16 52 68
Science 181 339 520 - - - - - - - - - - - - - - - - - - - - - - - - - - - - - - 181 339 520
Textile 40 121 161 - - - 4 29 33 - - - - - - - - - - - - - - - - - - - - - - - - 44 150 194
Miscellaneous 1,983 4,330 6,313 1,163 1,497 2,660 18 48 66 843 2,878 3,721 124 442 566 13 11 24 202 336 538 125 298 423 - - - 178 197 375 - - - 4,649 10,037 14,686
Accounting 158 260 418 18 17 35 - - - - - - - - - - - - - - - 11 28 39 - - - - - - - - - 187 305 492
Administration/Management 708 1,391 2,099 724 948 1,672 - - - - - - - - - - - - 48 58 106 93 209 302 - - - 15 20 35 - - - 1,588 2,626 4,214
Arts - - - - - - 18 48 66 - - - 83 133 216 13 11 24 - - - - - - - - - - - - - - - 114 192 306
Banking/Finance 297 520 817 198 217 415 - - - - - - - - - - - - 18 24 42 15 36 51 - - - - - - - - - 528 797 1,325
Business/Commerce/Marketing 30 59 89 15 2 17 - - - - - - - - - - - - 3 0 3 6 25 31 - - - - - - - - - 54 86 140
Communication 17 81 98 56 103 159 - - - - - - - - - - - - 0 2 2 - - - - - - - - - - - - 73 186 259
Counselling - - - 5 29 34 - - - - - - - - - - - - - - - - - - - - - - - - - - - 5 29 34
Economics 200 317 517 15 10 25 - - - - - - - - - - - - - - - - - - - - - - - - - - - 215 327 542
Education 53 98 151 - - - - - - 843 2,878 3,721 - - - - - - 8 6 14 - - - - - - - - - - - - 904 2,982 3,886
Humanities 20 191 211 - - - - - - - - - 15 83 98 - - - - - - - - - - - - - - - - - - 35 274 309
Languages 45 343 388 - - - - - - - - - 26 226 252 - - - 64 199 263 - - - - - - - - - - - - 135 768 903
Law 245 426 671 - - - - - - - - - - - - - - - - - - - - - - - - - - - - - - 245 426 671
Library 6 17 23 - - - - - - - - - - - - - - - 7 31 38 - - - - - - - - - - - - 13 48 61
Psychology 24 77 101 - - - - - - - - - - - - - - - - - - - - - - - - - - - - - - 24 77 101
Social Science 110 401 511 18 73 91 - - - - - - - - - - - - 0 4 4 - - - - - - - - - - - - 128 478 606
Travel/Hotel/Tourism 70 149 219 92 82 174 - - - - - - - - - - - - 46 8 54 - - - - - - 163 177 340 - - - 371 416 787
Others - - - 22 16 38 - - - - - - - - - - - - 8 4 12 - - - - - - - - - - - - 30 20 50
Total 4,675 6,643 11,318 1,892 1,835 3,727 71 108 179 843 2,878 3,721 124 442 566 13 11 24 203 338 541 189 334 523 290 12 302 346 209 555 26 80 106 8,672 12,890 21,562
MITD MIHUoM UTM FDI MIE MGI
Key: M - Male, F - Female, T - Total
Total
Table 4: Enrolment in Publicly-Funded Institutions by Institution, Field of Study and Gender, 2012/2013
RTI OUM UdM(ex SDIM) UdM (ex IST)
16
Table 5: Enrolment in the Publicly-Funded Institutions by Level and Mode of Study, 2012/2013
Institution RTI MITD MIH
Level FT PT DE T FT PT T FT PT T FT PT DE T FT PT T PT PT DE T FT PT T FT PT T FT FT FT PT DE T
PhD 6 27 - 33 3 13 16 - - - - - - - - - - - - - - - - - - - - - - 9 40 - 49
MPhil 48 89 - 137 4 22 26 - - - - - - - - - - - - - - - - - - - - - - 52 111 - 163
Masters Degree 63 797 49 909 16 625 641 - - - - 56 - 56 8 40 48 - 12 160 172 - - - - - - - 8 95 1,530 209 1,834
PG Diploma - - - - - - - - - - - 97 - 97 - - - - - 18 18 - - - - - - - - - 97 18 115
PG Certificate - - 14 14 - - - - - - 89 473 - 562 - - - - - - - - - - - - - - - 89 473 14 576
Bachelor Degree 7,989 956 340 9,285 1,936 836 2,772 18 17 35 11 103 - 114 231 64 295 - - 243 243 - - - - - - - - 10,185 1,976 583 12,744
Degree/Diploma 139 174 - 313 - - - - - - - - - - 82 - 82 - - - - - - - - - - - - 221 174 - 395
Diploma 139 260 159 558 68 122 190 144 - 144 953 242 701 1,896 6 135 141 24 - 108 108 408 72 480 250 52 302 555 81 2,604 907 968 4,479
Certificate - 69 - 69 44 - 44 - - - - 996 - 996 - - - - - - - - - - - - - - 17 61 1,065 - 1,126
Foundation - - - - 38 - 38 - - - - - - - - - - - - - - 43 - 43 - - - - - 81 - - 81
Total 8,384 2,372 562 11,318 2,109 1,618 3,727 162 17 179 1,053 1,967 701 3,721 327 239 566 24 12 529 541 451 72 523 250 52 302 555 106 13,397 6,373 1,792 21,562
Key: FT - Full Time, PT- Part Time, DE- Distance Education, T- TotalNote: 1 - Excludes enrolment on joint MIE, MGI & UTM Programmes
OUM SDIM IST TotalUoM1 UTM MIE MGIFDI
17
Table 6: Enrolment in the Publicly-Funded Institutions by Level and Gender, 2012/2013
Institution
Level M F T M F T M F T M F T M F T M F T M F T M F T M F T M F T M F T M F T
PhD 22 11 33 8 8 16 - - - - - - - - - - - - - - - - - - - - - - - - - - - 30 19 49
MPhil 69 68 137 20 6 26 - - - - - - - - - - - - - - - - - - - - - - - - - - - 89 74 163
Masters Degree 364 545 909 341 300 641 - - - 17 39 56 14 34 48 - - - 61 111 172 - - - - - - - - - 6 2 8 803 1,031 1,834
PG Diploma - - - - - - - - - 50 47 97 - - - - - - 7 11 18 - - - - - - - - - - - - 57 58 115
PG Certificate 4 10 14 - - - - - - 157 405 562 - - - - - - - - - - - - - - - - - - - - - 161 415 576
Bachelor Degree 3,740 5,545 9,285 1,383 1,389 2,772 19 16 35 28 86 114 36 259 295 - - - 74 169 243 - - - - - - - - - - - - 5,280 7,464 12,744
Degree/Diploma 133 180 313 - - - - - - - - - 32 50 82 - - - - - - - - - - - - - - - - - - 165 230 395
Diploma 278 280 558 102 88 190 52 92 144 471 1,425 1,896 42 99 141 13 11 24 61 47 108 166 314 480 290 12 302 346 209 555 19 62 81 1,840 2,639 4,479
Certificate 65 4 69 16 28 44 - - - 120 876 996 - - - - - - - - - - - - - - - - - - 1 16 17 202 924 1,126
Foundation - - - 22 16 38 - - - - - - - - - - - - - - - 23 20 43 - - - - - - - - - 45 36 81
4,675 6,643 11,318 1,892 1,835 3,727 71 108 179 843 2,878 3,721 124 442 566 13 11 24 203 338 541 189 334 523 290 12 302 346 209 555 26 80 106 8,672 12,890 21,562
Note: 1 - Excludes enrolment on joint MIE, MGI &UTM Programmes
TotalMGI RTI MCA SDIM
Key: M - Male, F - Female, T - Total
IST MITD MIHUoM1 UTM FDI MIE
18
Table 7: Enrolment in the Publicly-Funded Institutions by Mode of Study and Gender, 2012/2013
Institution
Gender FT PT DE T FT PT T FT PT T FT PT DE T FT PT T PT T PT DE T FT PT T FT PT T FT T FT T FT PT DE T
Male 3,410 1,108 157 4,675 1,040 852 1,892 60 11 71 231 448 164 843 66 58 124 13 13 8 195 203 165 24 189 238 52 290 346 346 26 26 5,582 2,574 516 8,672
Female 4,974 1,264 405 6,643 1,069 766 1,835 102 6 108 822 1,519 537 2,878 261 181 442 11 11 4 334 338 286 48 334 12 0 12 209 209 80 80 7,815 3,799 1,276 12,890
Total 8,384 2,372 562 11,318 2,109 1,618 3,727 162 17 179 1,053 1,967 701 3,721 327 239 566 24 24 12 529 541 451 72 523 250 52 302 555 555 106 106 13,397 6,373 1,792 21,562
Key: FT - Full Time, PT- Part Time, DE- Distance Education, T- Total
Note: 1 - Excludes enrolment on joint MIE, MGI & UTM programmes
MGI RTI IST MITD MIH TotalUoM1 UTM OUM SDIMFDI MIE

19
Table 8: New Admissions on Taught Programmes in the Publicly-Funded Institutions by Level and Mode of Study, 2012/2013
Institution OUM MITD MIH
Level FT PT DE T FT PT T FT PT T FT PT DE T FT PT T DE FT PT T FT PT T FT FT FT PT DE T
Masters Degree 41 347 47 435 16 332 348 - - - - 19 - 19 8 5 13 19 - - - - - - - 8 73 703 66 842
PG Diploma - - - - - - - - - - - 46 - 46 - - - 9 - - - - - - - - - 46 9 55
PG Certificate - - 14 14 - - - - - - 89 234 - 323 - - - - - - - - - - - - 89 234 14 337
Bachelor Degree 2,718 254 251 3,223 879 178 1,057 18 17 35 - 103 - 103 97 32 129 - - - - - - - - - 3712 584 251 4547
Degree/Diploma 91 80 - 171 - - - - - - - - - - 19 - 19 - - - - - - - - - 110 80 - 190
Diploma 56 109 120 285 31 45 76 86 - 86 286 80 - 366 6 51 57 14 228 20 248 188 52 240 282 20 1183 357 134 1674
Certificate - 69 - 69 44 - 44 - - - - 605 - 605 - - - - - - - - - - - - 44 674 - 718
Foundation - - - - 38 - 38 - - - - - - - - - - - 43 - 43 - - - - - 81 - - 81
Total 2,906 859 432 4,197 1,008 555 1,563 104 17 121 375 1,087 1,462 130 88 218 42 271 20 291 188 52 240 282 28 5292 2678 474 8444
TotalMIE MGI SDIM IST
Note: 1 - Excludes enrolment on joint MIE & MGI&UTM programmes
Key: FT - Full Time, PT- Part Time, DE-Distance Education, T- Total
UoM1 UTM FDI
20
Faculty
Mode M F T M F T M F T M F T M F T M F T M F T M F T
Full-time 109 216 325 1,763 1,039 2,802 791 1,651 2,442 375 750 1,125 372 1,318 1,690 - - - 52 266 318 3,462 5,240 8,702
Part-time 34 9 43 375 130 505 572 776 1,348 40 80 120 96 281 377 40 78 118 38 115 153 1,195 1,469 2,664
Distance -Education - - - 64 97 161 93 308 401 - - - - - - - - - - - - 157 405 562
Total 143 225 368 2,202 1,266 3,468 1,456 2,735 4,191 415 830 1,245 468 1,599 2,067 40 78 118 90 381 471 4,814 7,114 11,928
4 - Includes 1 student of Lifelong Learning Centre, of which 1M
Science3
Key: M - Male, F - Female, T - Total
Note:
2 - Includes 401 students of Lifelong Learning Centre, of which 93 M
1 - Includes 396 students of Life Long Learning Centre, of which 206M
3 - Includes 21 students of UTM, of which 9M
Table 9: Enrolment including joint programmes by Faculty, Mode of Study and Gender at the University of Mauritius, 2012/2013
SS & Humanities4 UoM/MGIUoM/MIE TotalAgriculture Engineering1 Law & Management2
21
Faculty
Level M F T M F T M F T M F T M F T M F T M F T M F T
PhD 3 0 3 11 6 17 1 0 1 3 2 5 4 3 7 - - - - - - 22 11 33
MPhil 6 6 12 20 12 32 12 5 17 19 32 51 12 13 25 - - - - - - 69 68 137
Masters Degree 2 6 8 137 107 244 170 284 454 25 50 75 39 110 149 - - - 26 64 90 399 621 1,020
PG Certificate - - - - - - 4 10 14 - - - - - - - - - - - - 4 10 14
Bachelor Degree 109 213 322 1,791 1,028 2,819 1,122 2,247 3,369 333 677 1,010 385 1,380 1,765 40 78 118 52 297 349 3,832 5,920 9,752
Degree/Diploma - - - 76 42 118 24 28 52 11 34 45 22 76 98 - - - 12 20 32 145 200 345
Diploma - - - 166 70 236 82 158 240 24 35 59 6 17 23 - - - - - - 278 280 558
Certificate 23 0 23 1 1 2 41 3 44 - - - - - - - - - - - - 65 4 69
- 143 225 368 2,202 1,266 3,468 1,456 2,735 4,191 415 830 1,245 468 1,599 2,067 40 78 118 90 381 471 4,814 7,114 11,928
Table 10: Enrolment including joint programmes by Faculty, Level of Study and Gender at the University of Mauritius, 2012/2013
Agriculture Engineering1 Law & Management2 Science3 SS & Humanities4 UoM/MIE UoM/MGI Total
3 - Includes 21 students of UTM ( Master Degree:9 M)
4 - Includes 1 student of Lifelong Learning Centre ( MPhil:1 M)
Key: M - Male, F - Female, T - Total
Note:
1 - Includes 396 from Lifelong Learning Centre( Master Degree:50 of which 15M,Bachelor Degree:124 of which 59 M, Degree/Diploma:118 of which 76 M and 104 Diploma of which 56 M)
2 - Includes 401 students of Lifelong Learning Centre ( PG Cert: 14 of which 4M, Bachelor Degree:236 of which 49 M, Diploma:151 of which 40M)
22
Table 11: Enrolment including joint programmes by Faculty, Level and Mode of Study at the University of Mauritius, 2012/2013
Faculty
Level FT PT T FT PT DE T FT PT DE T FT PT T FT PT T PT T FT PT T FT PT DE T
PhD 0 3 3 2 15 - 17 - 1 - 1 1 4 5 3 4 7 - - - - - 6 27 - 33
MPhil 3 9 12 9 23 - 32 2 15 - 17 28 23 51 6 19 25 - - - - - 48 89 - 137
Masters Degree - 8 8 1 194 49 244 - 454 - 454 54 21 75 8 141 149 - - - 90 90 63 908 49 1,020
PG Certificate - - - - - - - - - 14 14 - - - - - - - - - - - - - 14 14
Bachelor Degree 322 - 322 2,581 134 104 2,819 2,440 693 236 3,369 999 11 1,010 1,647 118 1,765 118 118 286 63 349 8,275 1,137 340 9,752
Degree/Diploma - - - 113 5 - 118 - 52 - 52 - 45 45 26 72 98 - - 32 - 32 171 174 - 345
Diploma - - - 96 132 8 236 - 89 151 240 43 16 59 - 23 23 - - - - - 139 260 159 558
Certificate - 23 23 - 2 - 2 - 44 - 44 - - - - - - - - - - - - 69 - 69
Total 325 43 368 2,802 505 161 3,468 2,442 1,348 401 4,191 1,125 120 1,245 1,690 377 2,067 118 118 318 153 471 8,702 2,664 562 11,928
Key: FT - Full Time, PT- Part Time, DE-Distance Education, T- Total
Note:
4 - Includes 1 student of Lifelong Learning Centre Programmes (MPhil:1 PT)
SS & Humanities4 UoM/MIE UoM/MGI TotalAgriculture
3 - Includes 21 students of UTM (Master Degree:21 PT)
Engineering1 Law & Management2 Science3
1 - Includes 396 students of Life Long Learning Centre(50- Masters Level,124-Bachelor Degree , 118 Degree/Diploma and 104-Diploma)
2 - Includes 401students of Lifelong Learning Centre Programmes ( PG Cert: 14, Bachelor Degree:236,Diploma:151)
23
Programme of Study M F T
Full-Time
1. MPhil - 3 3
2. BSc Agricultural Biotechnology-Year 4+ 1 1 2
3. BSc Agriculture (Specialisation : Aquaculture)-Year 3 11 12 23
4. BSc Agriculture (Specialisation : Land and Water Management)-Year 2 10 12 22
5. BSc Agriculture (Specialisation: Agricultural Extension)-Year 1 12 21 33
6. BSc Agriculture (Specialisation: Sustainable Forestry)-Year 4+ 4 2 6
7. BSc Agriscience and Technology (Minor: Agrifood Marketing)-Year 1 7 22 29
8. BSc Agriscience and Technology-Year 2 8 15 23
9. BSc Agriscience and Technology-Year 4+ 5 - 5
10. BSc Biotechnology-Year 1 7 21 28
11. BSc Biotechnology-Year 3 7 18 25
12. BSc Biotechnology-Year 4+ 3 5 8
13. BSc Crop Technology(Specialisation:Landscape Management)-Year 3 11 14 25
14. BSc Food Safety and Quality-Year 2 8 20 28
15. BSc Food Science & Technology-Year 1 7 24 31
16. BSc Food Science & Technology-Year 4+ 1 5 6
17. BSc Microbiology-Year 2 7 21 28
Sub-Total (Full-Time) 109 216 325
Part-Time
1. PhD 3 - 3
2. MPhil 6 3 9
3. MSc Sustainable Agrochemical Management-Year 1 2 6 8
4. Certificate in Forestry -Year 1 23 - 23
Sub-Total (Part-Time) 34 9 43
Total 143 225 368
Table 12: Enrolment at the Faculty of Agriculture, University of Mauritius, 2012/2013
24
Programme of Study M F TFull-Time1. PhD - 2 22. MPhil 3 6 93. MSc by Research 1 - 14. BEng Chemical and Environmental Engineering-Year 1 15 31 465. BEng Chemical and Environmental Engineering-Year 2 14 19 336. BEng Chemical and Environmental Engineering-Year 3 11 26 377. BEng Chemical and Environmental Engineering-Year 4+ 9 32 418. BEng Chemical and Renewable Energy Engineering-Year 1 22 26 489. BEng Chemical and Renewable Energy Engineering-Year 2 22 12 3410. BEng Chemical and Renewable Energy Engineering-Year 3 11 25 3611. BEng Chemical and Renewable Energy Engineering-Year 4+ 22 19 4112. BEng Civil Engineering-Year 1 32 7 3913. BEng Civil Engineering-Year 2 26 12 3814. BEng Civil Engineering-Year 3 25 10 3515. BEng Civil Engineering-Year 4+ 39 5 4416. BEng Electrical and Electronic Engineering-Year 1 23 7 3017. BEng Electrical and Electronic Engineering-Year 2 22 8 3018. BEng Electrical and Electronic Engineering-Year 3 17 7 2419. BEng Electrical and Electronic Engineering-Year 4+ 25 8 3320. BEng Electronic and Communication Engineering-Year 1 23 11 3421. BEng Electronic and Communication Engineering-Year 2 8 11 1922. BEng Electronic and Communication Engineering-Year 3 9 10 1923. BEng Electronic and Communication Engineering-Year 4+ 11 11 2224. BEng Manufacturing Engineering-Year 1 33 3 3625. BEng Manufacturing Engineering-Year 2 20 1 2126. BEng Manufacturing Engineering-Year 3 22 1 2327. BEng Manufacturing Engineering-Year 4+ 18 3 2128. BEng Mechanical Engineering-Year 1 44 8 5229. BEng Mechanical Engineering-Year 2 42 4 4630. BEng Mechanical Engineering-Year 3 43 6 4931. BEng Mechanical Engineering-Year 4+ 69 3 7232. BEng Mechatronics-Year 1 49 5 5433. BEng Mechatronics-Year 2 39 4 4334. BEng Mechatronics-Year 3 33 10 4335. BEng Mechatronics-Year 4+ 65 6 7136. BSc (Hons) Sustainable Product Design-Year 1 26 7 3337. BSc (Hons) Web and Multimedia Development (Top-Up)-Year 1 3 - 338. BSc (Hons) Web and Multimedia Development (Top-Up)-Year 2 11 6 1739. BSc Computer Applications-Year 1 57 34 9140. BSc Computer Applications-Year 2 46 37 8341. BSc Computer Applications-Year 3 43 20 6342. BSc Computer Applications-Year 4+ 25 23 4843. BSc Computer Science and Engineering-Year 4+ 11 8 1944. BSc Computer Science-Year 1 55 41 9645. BSc Computer Science-Year 2 56 38 9446. BSc Computer Science-Year 3 65 48 11347. BSc Electronics and Computer Science-Year 3 10 4 1448. BSc Electronics and Computer Science-Year 4+ 4 1 549. BSc Electronics with Computer Science-Year 1 31 8 3950. BSc Electronics with Computer Science-Year 2 7 3 1051. BSc Electronics with Computer Science-Year 3 8 3 1152. BSc Fashion Technology-Year 1 14 19 3353. BSc Fashion Technology-Year 2 2 12 1454. BSc Fashion Technology-Year 3 6 23 2955. BSc Information and Communication Technologies-Year 1 29 7 3656. BSc Information and Communication Technologies-Year 2 12 11 2357. BSc Information and Communication Technologies-Year 3 8 5 1358. BSc Information and Communication Technologies-Year 4+ 8 6 1459. BSc Information Systems-Year 1 51 42 9360. BSc Information Systems-Year 2 43 35 7861. BSc Information Systems-Year 3 34 33 67
Key: M - Male, F - Female, T - Total, Year 4+ - Year 4 and above
Table 13: Enrolment at the Faculty of Engineering, University of Mauritius, 2012/2013
25
Table 13: Enrolment at the Faculty of Engineering, University of Mauritius, 2012/2013 (Cont.)Programme of Study M F T62. BSc Information Systems-Year 4+ 28 19 4763. BSc Production & Operations Management-Year 1 20 12 3264. BSc Production & Operations Management-Year 2 15 11 2665. BSc Production & Operations Management-Year 3 15 6 2166. BSc Production & Operations Management-Year 4+ 13 4 1767. BSc Textile and Fashion Design-Year 1 4 30 3468. BSc Textile and Fashion Design-Year 2 8 19 2769. BSc Textile and Fashion Design-Year 3 6 17 2370. BSc Textile and Fashion Design-Year 4+ 0 1 171. Diploma/BSc Web and Multimedia Development-Year 1 58 33 9172. Diploma/BSc Web and Multimedia Development-Year 2 13 9 2273. Diploma in Web and Multimedia Development-Year 1 23 20 43
74. Diploma in Web and Multimedia Development-Year 2 28 24 5275. Diploma in Web and Multimedia Development-Year 4+ - 1 1Subtotal Full-Time 1,763 1,039 2,802Part-Time1. PhD 11 4 152. MPhil 17 6 233. MSc Building Services Engineering-Year 1 15 3 184. MSc Enterprise Systems Development and Management-Year 2 6 1 75. MSc Industrial Engineering and Management-Year 2 15 6 216. MSc Internet Technology and Web Development-Year 2 1 0 17. MSc Project Management-Year 1 21 8 298. MSc Project Management-Year 2 22 9 319. MSc Software Engineering Projects and Management-Year 1 8 8 1610. MSc Software Engineering Projects and Management-Year 2 11 17 2811. MSc Solid Waste and Resource Management-Year 2 8 3 1112. MSc Total Quality Management and Performance Excellence-Year 1 4 12 1613. MSc Total Quality Management and Performance Excellence-Year 2 11 5 1614. BEng Civil Engineering -Year 2 19 5 2415. BEng Civil Engineering -Year 4+ 27 1 2816. BSc Computer Applications-Year 4+ 10 5 1517. BSc Information Systems-Year 4+ 10 3 13
18. BSc Quantity Surveying-Year 1 32 3 3519. BSc Town and Country Planning-Year 1 11 8 1920. Diploma/BSc Web and Multimedia Development-Year 1 5 0 521. Diploma in Land Surveying-Year 1 8 1 922. Diploma in Land Surveying-Year 2 15 3 1823. Diploma in Land Surveying-Year 3 4 1 524. Diploma in Quantity Surveying-Year 1 20 2 2225. Diploma in Quantity Surveying-Year 2 17 4 2126. Diploma in Quantity Surveying-Year 3 17 2 1927. Diploma Town and Country Planning-Year 1 16 3 1928. Diploma Town and Country Planning-Year 2 13 5 18
29. Diploma Town and Country Planning-Year 3 0 1 1
30. Certificate Town and Country Planning-Year 1 1 1 2Subtotal (Part-Time) 375 130 505Distance-Education1. MSc Educational Technologies (Specialisation: Science Education/Technology Education/Language Education)-Year 1 13 34 47
2. MSc Educational Technologies (Specialisation: Science Education/Technology Education/Language Education)-Year 2 1 1 2
3. BSc (Hons) Web and Multimedia Development (Top-Up)-Year 1 9 5 14
4. BSc (Hons) Web and Multimedia Development (Top-Up)-Year 2 1 1 25. BSc Educational and Instructional Technologies (Specialisation: Science Education/Technology Education/Language Education)-Year 1 20 34 54
6. BSc Educational and Instructional Technologies (Specialisation: Science Education/Technology Education/Language Education)-Year 2 15 19 34
7. Diploma in Web and Multimedia Development-Year 1 2 1 3
8. Diploma in Web and Multimedia Development-Year 2 3 2 5Subtotal (Distance -Education) 64 97 161Total 2,202 1,266 3,468
Key: M - Male, F - Female, T - Total, Year 4+ - Year 4 and above
26
Table 14: Enrolment at the Faculty of Law & Management, University of Mauritius, 2012/2013Programme of Study M F TFull-Time1. MPhil 2 - 22. BA Law and Criminal Justice-Year 1 5 25 303. BA Law and Management-Year 1 16 26 424. BA Law and Management-Year 2 8 29 37
5. BA Law and Management-Year 3 20 37 57
6. BA Law and Management-Year 4+ 7 8 15
7. BA of Laws with Honours (LLB) Hons-Year 1 9 31 40
8. BA of Laws with Honours (LLB) Hons-Year 2 7 28 35
9. BA of Laws with Honours (LLB) Hons-Year 3 14 42 56
10. BSc Accounting (Minor: Business Informatics)-Year 1 10 20 30
11. BSc Accounting (Minor: Business Informatics)-Year 2 19 19 3812. BSc Accounting (Minor: Finance)-Year 1 17 22 39
13. BSc Accounting (Minor: Finance)-Year 2 11 27 38
14. BSc Accounting (Minor: Finance)-Year 3 22 38 60
15. BSc Accounting (Minor: Finance)-Year 4+ 0 4 416. BSc Accounting (Minor: Information Systems)-Year 4+ 7 7 14
17. BSc Accounting (Minor: Management)-Year 1 14 23 37
18. BSc Accounting (Minor: Management)-Year 2 17 24 41
19. BSc Accounting (Minor: Management)-Year 3 21 43 64
20. BSc Banking and Finance-Year 1 19 20 39
21. BSc Banking and Finance-Year 2 17 22 39
22. BSc Banking and Finance-Year 3 19 38 57
23. BSc Finance (Minor: Law)-Year 1 12 27 39
24. BSc Finance (Minor: Law)-Year 2 13 26 39
25. BSc Finance (Minor: Law)-Year 3 24 32 56
26. BSc Finance (Minor: Law)-Year 4+ 1 0 1
27. BSc Finance-Year 1 18 21 39
28. BSc Finance-Year 2 15 22 37
29. BSc Finance-Year 3 21 34 55
30. BSc Finance-Year 4+ 7 3 10
31. BSc Human Resource Management-Year 1 6 32 38
32. BSc Human Resource Management-Year 2 10 35 45
33. BSc Human Resource Management-Year 3 13 41 54
34. BSc Human Resource Management-Year 4+ 0 1 1
35. BSc International Business Finance-Year 1 20 59 79
36. BSc International Business Finance-Year 2 14 34 48
37. BSc International Business Management-Year 1 18 22 40
38. BSc International Business Management-Year 2 9 28 37
39. BSc Management (Minor: Business Informatics)-Year 1 9 30 39
40. BSc Management (Minor: Business Informatics)-Year 2 13 24 37
41. BSc Management (Minor: Finance)-Year 1 14 26 40
42. BSc Management (Minor: Finance)-Year 2 14 23 37
43. BSc Management (Minor: Finance)-Year 3 16 41 57
44. BSc Management (Minor: Finance)-Year 4+ 18 38 56
45. BSc Management (Minor: Information Systems)-Year 4+ 12 32 44
46. BSc Management (Minor:Entrepreneurship)-Year 1 14 25 3947. BSc Management (Minor:Entrepreneurship)-Year 2 10 24 34
48. BSc Management-Year 1 24 54 78
49. BSc Management-Year 2 29 65 9450. BSc Management-Year 3 37 84 121
51. BSc Management-Year 4+ 7 1 8
52. BSc Marketing Management-Year 1 8 28 36
53. BSc Marketing Management-Year 2 12 33 4554. BSc Marketing Management-Year 3 16 41 5755. BSc Marketing Management-Year 4+ 3 6 956. BSc Tourism, Leisure & Recreation Management-Year 1 9 33 4257. BSc Tourism, Leisure & Recreation Management-Year 2 9 25 3458. BSc Tourism, Leisure & Recreation Management-Year 3 18 33 5159. BSc Tourism, Leisure & Recreation Management-Year 4+ 17 35 52Subtotal (Full-Time) 791 1,651 2,442
27
Table 14: Enrolment at the Faculty of Law & Management, University of Mauritius, 2012/2013 (Cont.)Programme of Study M F TPart-Time1. PhD 1 - 12. MPhil 10 5 153. Master Business Administration (Specialisation: Financial Services) -Year 1 12 16 284. Master Business Administration (Specialisation: Financial Services) -Year 2 14 32 465. Master Business Administration (Specialisation: Financial Services) -Year 3 2 3 56. Master Business Administration (Specialisation: Hospitality and Tourism) -Year 2 4 3 77. Master Business Administration (Specialisation: Human Resource Management)-Year 2 5 20 258. Master Business Administration (Specialisation: Marketing)-Year 1 - 1 19. Master Business Administration (Specialisation: Marketing)-Year 2 6 17 2310. Master of Business Administration-Year 1 19 39 5811. Master of Business Administration-Year 2 50 69 11912. Master of Business Administration-Year 3 9 2 1113. Master of Business Administration-Year 4+ 2 - 214. MBA Financial Management -Year 1 9 18 2715. MSc Criminal Justice Studies-Year 1 6 13 1916. MSc Criminal Justice Studies-Year 2 1 - 117. MSc Criminal Justice Studies-Year 3 1 - 118. MSc Finance-Year 1 4 6 1019. MSc Finance-Year 2 6 7 1320. MSc Finance-Year 3 6 2 821. MSc Human Resource Studies-Year 1 6 20 2622. MSc Human Resource Studies-Year 2 2 - 223. MSc Human Resource Studies-Year 3 - 2 224. MSc International Business Management-Year 2 - 3 325. MSc Marketing Management-Year 1 6 10 16
26. MSc Marketing Management-Year 3 - 1 1
27. BA Law and Management-Year 1 14 28 4228. BA Law and Management-Year 2 12 15 2729. BA Law and Management-Year 3 12 14 2630. BA Law and Management-Year 4+ 7 17 2431. BA Legal Studies and Management (Top-Up)-Year 1 8 6 1432. BA Legal Studies and Management (Top-Up)-Year 2 8 5 1333. BA of Laws with Honours (LLB) Hons-Year 1 15 24 3934. BA of Laws with Honours (LLB) Hons-Year 2 16 23 3935. BA of Laws with Honours (LLB) Hons-Year 3 14 20 34
36. BA of Laws with Honours (LLB) Hons-Year 4+ 15 10 2537. BSc Accounting (Minor: Finance)-Year 1 5 9 1438. BSc Accounting (Minor: Finance)-Year 2 10 13 2339. BSc Accounting (Minor: Finance)-Year 3 1 6 740. BSc Accounting (Minor: Finance)-Year 4+ 4 5 941. BSc Business Studies -Year 1 6 13 1942. BSc Business Studies -Year 2 6 9 15
43. BSc Business Studies -Year 3 3 8 11
44. BSc Business Studies -Year 4+ 9 18 27
45. BSc Finance-Year 1 9 13 22
46. BSc Finance-Year 2 11 11 22
47. BSc Finance-Year 3 3 19 22
48. BSc Financial Services-Year 1 3 6 9
49. BSc Financial Services-Year 2 8 12 20
50. BSc Financial Services-Year 3 9 10 19
51. BSc Financial Services-Year 4+ 0 1 1
52. BSc Marketing Management-Year 1 12 7 19
53. BSc Marketing Management-Year 2 11 12 23
54. BSc Marketing Management-Year 3 6 11 17
55. BSc Marketing Management-Year 4+ 5 16 21
56. BSc Occupational Health and Safety-Year 3 9 15 2457. BSc Occupational Health and Safety-Year 4+ 16 10 26
58. BSc Tourism, Hospitality and Leisure Management-Year 1 8 14 22
59. BSc Tourism, Hospitality and Leisure Management-Year 2 9 9 18
60. Dip/BSc Occupational Health and Safety-Year 1 12 15 27
61. Dip/BSc Occupational Health and Safety-Year 2 12 13 25
62. Diploma in Legal Studies with Court Administration-Year 1 15 1 16
63. Diploma in Legal Studies-Year 1 6 10 16
64. Diploma in Legal Studies-Year 2 3 4 7
65. Diploma in Legal Studies-Year 3 6 10 16
66. Diploma in Management (Specialisation: Human Resource Management)-Year 1 5 10 15
67. Diploma in Management (Specialisation: Human Resource Management)-Year 2 7 12 19
68. Certificate in Police Duties-Year 1 41 3 44Sub-Total (Part-Time) 572 776 1348
Distance-Education
1. Postgraduate Certificate in Teaching and Learning in Higher Education-Year 1 4 10 14
2. BSc Financial Management-Year 1 12 26 38
3. BSc Financial Management-Year 2 4 2 6
4. BSc Financial Management-Year 3 1 12 13
5. BSc Financial Management-Year 4+ 3 21 24
6. BSc Management (Specialisation: Entrepreneurship)-Year 2 1 - 1
7. BSc Management (Specialisation: Human Resource Management)-Year 1 10 81 91
8. BSc Management (Specialisation: Human Resource Management)-Year 2 - 3 3
9. BSc Management (Specialisation: Human Resource Management)-Year 3 2 3 5
10. BSc Management Studies (Top-Up)-Year 1 16 38 54
11. BSc Management Studies (Top-Up)-Year 2 - 1 1
12. Diploma in Management Studies-Year 1 32 85 117
13. Diploma in Management Studies-Year 2 6 19 25
14. Diploma in Management Studies-Year 3 2 3 515. Diploma in Management Studies-Year 4+ - 4 4Sub-Total (Distance-Education) 93 308 401Total 1,456 2,735 4,191
Key: M - Male, F - Female, T - Total, Year 4+ - Year 4 and above
28
Programme of Study M F TFull-Time1. PhD 1 0 12. MPhil 7 21 283. BSc Chemistry(Minor : Forensic Science) / MSc Chemistry-Year 4+ 6 15 21
4. Master of Public Health-Year 1 3 6 9
5. Masters Medicine M1-Year 1 7 17 24
6. BSc Biology (Specialisation: Cell and Molecular Biology/Environmental Protection/Plant Sciences/Nutrition and Functional Food Sciences)-Year 3
2 - 2
7. BSc Biology (Specialisation: Cell and Molecular Biology/Environmental Protection/Plant Sciences/Nutrition and Functional Food Sciences)-Year 4+ 8 8 168. BSc Biology(Minor:Forensics Science / Marine and Costal Environmental Science) / MSc Biology-Year 1 12 39 519. BSc Biology(Minor:Forensics Science / Marine and Costal Environmental Science) / MSc Biology-Year 2 14 33 4710. BSc Biology(Minor:Forensics Science / Marine and Costal Environmental Science) / MSc Biology-Year 3 8 36 4411. BSc Chemistry(Minor : Forensic Science) / MSc Chemistry-Year 1 25 45 7012. BSc Chemistry(Minor : Forensic Science) / MSc Chemistry-Year 2 14 28 4213. BSc Chemistry(Minor : Forensic Science) / MSc Chemistry-Year 3 13 34 4714. BSc Marine Science and Technology-Year 1 10 9 1915. BSc Marine Science and Technology-Year 4+ 2 - 216. BSc Mathematics with Computer Science-Year 1 11 27 3817. BSc Mathematics with Computer Science-Year 2 13 32 4518. BSc Mathematics with Computer Science-Year 3 11 18 2919. BSc Mathematics with Computer Science-Year 4+ 5 13 1820. BSc Mathematics-Year 1 16 24 4021. BSc Mathematics-Year 2 14 29 4322. BSc Mathematics-Year 3 8 24 3223. BSc Mathematics-Year 4+ 7 11 1824. BSc Medical Science-Year 1 16 12 2825. BSc Medical Science-Year 2 13 14 2726. BSc Medical Science-Year 3 17 13 3027. BSc Occupational Therapy -Year 1 0 16 1628. BSc Occupational Therapy -Year 3 1 11 1229. BSc Occupational Therapy -Year 4+ 7 10 1730. BSc Pharmacy (Bpharm)-Year 1 4 11 1531. BSc Pharmacy (Bpharm)-Year 2 2 10 1232. BSc Pharmacy (Bpharm)-Year 3 2 5 733. BSc Pharmacy (Bpharm)-Year 4+ 1 13 1434. BSc Physics with Computing-Year 1 3 12 1535. BSc Physics with Computing-Year 2 2 6 836. BSc Physics with Computing-Year 4+ 1 1 237. BSc Physics/ Physics with Computing-Year 3 21 22 4338. BSc Physics/ Physics with Computing-Year 4+ 2 4 639. BSc Physics/MSc Physics-Year 1 21 18 3940. BSc Physics/MSc Physics-Year 2 13 17 3041. BSc Physiotherapy-Year 1 5 8 1342. BSc Physiotherapy-Year 2 2 4 643. BSc Physiotherapy-Year 4+ 3 6 944. BSc/MSc Nutritional Sciences-Year 1 1 25 2645. BSc/MSc Nutritional Sciences-Year 2 - 20 2046. BSc/MSc Nutritional Sciences-Year 4+ 1 - 147. Diploma in Sanitary Science-Year 1 8 5 1348. Diploma in Sanitary Science-Year 2 10 15 2549. Diploma in Sanitary Science-Year 3 2 2 450. Diploma in Sanitary Science-Year 4+ - 1 1Sub-Total (Full-Time) 375 750 1,125Part-Time1. PhD 2 2 42. MPhil 12 11 233. MSc Sustainable Environmental Management (Jointly with UTM)-Year 1 9 12 214. BSc Biomedical Sciences-Year 4+ 2 9 115. Diploma/BSc Biomedical Sciences-Year 2 1 16 176. Diploma/BSc Biomedical Sciences-Year 3 10 18 287. Diploma in Chemical Analysis and Instrumentation Techniques-Year 3 4 12 16Sub-Total (Part-Time) 40 80 120Total 415 830 1,245
Key: M - Male, F - Female, T - Total, Year 4+ - Year 4 and above
Table 15: Enrolment at the Faculty of Science, University of Mauritius, 2012/2013
29
Programme of Study M F TFull-Time1. PhD 1 2 32. MPhil 4 2 63. MA Historical Studies (by Research)-Year 1 3 5 84. BA (Joint Hons) Humanities-Year 1 1 36 375. BA (Joint Hons) Humanities-Year 2 1 18 196. BA (Joint Hons) Humanities-Year 3 3 30 337. BA (Joint Hons) Humanities-Year 4+ - 10 108. BA Economics and International Relations-Year 1 15 14 299. BA Economics and International Relations-Year 2 11 9 2010. BA Economics and Law-Year 1 7 27 3411. BA Economics and Law-Year 2 8 14 2212. BA Economics and Law-Year 3 11 22 3313. BA English-Year 1 5 35 4014. BA English-Year 2 4 34 3815. BA English-Year 3 3 53 5616. BA English-Year 4+ 1 5 617. BA French-Year 1 6 45 5118. BA French-Year 2 6 50 5619. BA French-Year 3 6 46 5220. BA French-Year 4+ 1 5 621. BA History and Anthropology-Year 2 2 6 822. BA History and Anthropology-Year 4+ - 5 523. BA History and Geography-Year 4+ 2 4 6
24. BA History and International Relations-Year 1 3 28 31
25. BA History and International Relations-Year 2 - 14 14
26. BA History and Political Science-Year 1 5 25 30
27. BA History and Political Science-Year 2 - 10 10
28. BA/MA Public Policy and Governance-Year 1 4 22 26
29. BA/MA Public Policy and Governance-Year 2 4 7 11
30. BSc /MSc Business Economics and Investment Analysis-Year 1 11 18 29
31. BSc /MSc Business Economics and Investment Analysis-Year 2 8 15 23
32. BSc Actuarial Science-Year 1 7 16 23
33. BSc Actuarial Science-Year 2 11 18 29
34. BSc Business Economics with Information Systems-Year 3 5 8 13
35. BSc Business Economics with Information Systems-Year 4+ 3 1 4
36. BSc Business Statistics with Economics-Year 1 3 1 4
37. BSc Business Statistics with Economics-Year 2 4 3 7
38. BSc Business Statistics with Economics-Year 3 1 4 5
39. BSc Business Statistics with Finance-Year 1 8 23 31
40. BSc Business Statistics with Finance-Year 2 8 19 27
41. BSc Business Statistics with Finance-Year 3 3 10 13
42. BSc Business Statistics with Management-Year 1 3 9 12
43. BSc Business Statistics with Management-Year 2 4 8 12
44. BSc Business Statistics with Management-Year 3 2 4 6
45. BSc Business Statistics with Marketing-Year 3 1 2 3
46. BSc Econometrics and Quantitative Finance-Year 1 8 12 20
47. BSc Econometrics and Quantitative Finance-Year 2 3 12 15
48. BSc Economics and Finance-Year 1 18 16 34
49. BSc Economics and Finance-Year 2 7 29 36
50. BSc Economics and Finance-Year 3 27 39 66
51. BSc Economics and Finance-Year 4+ 5 5 10
52. BSc Economics with International Relations-Year 3 3 9 12
53. BSc Economics with International Relations-Year 4+ 3 2 5
54. BSc Economics with Management-Year 1 13 12 25
55. BSc Economics with Management-Year 2 10 15 25
56. BSc Economics with Management-Year 3 5 13 18
57. BSc Economics with Management-Year 4+ - 5 558. BSc Political Science(Specilisation : International Relations/ Media and Communication / Public Administration)-Year 1 5 30 35
59. BSc Political Science(Specilisation : International Relations/ Media and Communication / Public Administration)-Year 2 6 23 29
60. BSc Political Science(Specilisation : International Relations/ Media and Communication / Public Administration)-Year 3 8 27 35
61. BSc Political Science-Year 3 - 1 162. BSc Psychology-Year 1 9 25 3463. BSc Psychology-Year 2 6 19 2564. BSc Psychology-Year 3 5 22 2765. BSc Psychology-Year 4+ 4 11 1566. BSc Social Work-Year 1 4 28 3267. BSc Social Work-Year 4+ 0 2 268. BSc Sociology(Specialisation:Gender Studies)-Year 1 3 32 3569. BSc Sociology(Specialisation:Gender Studies)-Year 2 1 35 3670. BSc Sociology(Specialisation:Gender Studies)-Year 3 1 21 2271. BSc Sociology-Year 1 5 35 4072. BSc Sociology-Year 2 4 32 3673. BSc Sociology-Year 3 - 37 3774. BSc Sociology-Year 4+ - 3 375. BSc Statistics with Computer Science-Year 4+ 1 1 276. BSc Statistics with Economics-Year 4+ 3 3 677. Dip/BSc Journalism (Minor:Economics/Politics/Digital Media)-Year 2 6 20 26Sub -Total (Full-Time) 372 1,318 1,690
Key: M - Male, F - Female, T - Total, Year 4+ - Year 4 and above
Table 16: Enrolment at the Faculty of Social Studies & Humanities, University of Mauritius, 2012/2013
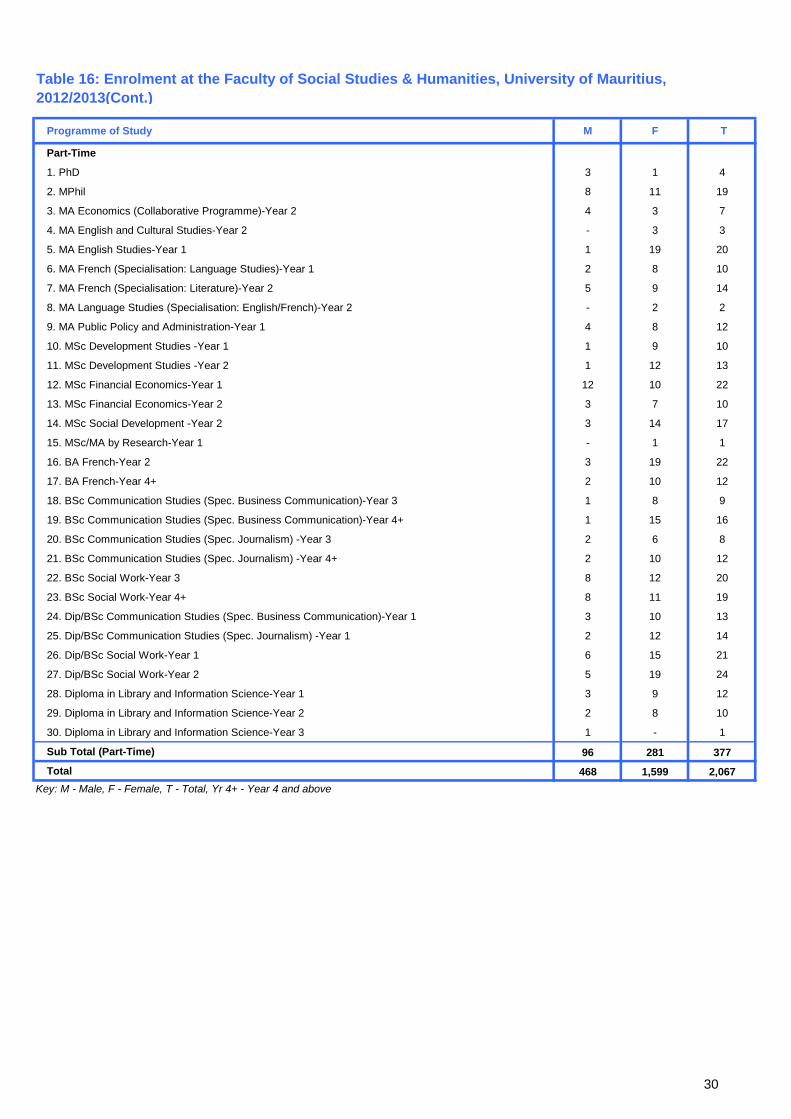
30
Programme of Study M F T
Part-Time
1. PhD 3 1 4
2. MPhil 8 11 19
3. MA Economics (Collaborative Programme)-Year 2 4 3 7
4. MA English and Cultural Studies-Year 2 - 3 3
5. MA English Studies-Year 1 1 19 20
6. MA French (Specialisation: Language Studies)-Year 1 2 8 10
7. MA French (Specialisation: Literature)-Year 2 5 9 14
8. MA Language Studies (Specialisation: English/French)-Year 2 - 2 2
9. MA Public Policy and Administration-Year 1 4 8 12
10. MSc Development Studies -Year 1 1 9 10
11. MSc Development Studies -Year 2 1 12 13
12. MSc Financial Economics-Year 1 12 10 22
13. MSc Financial Economics-Year 2 3 7 10
14. MSc Social Development -Year 2 3 14 17
15. MSc/MA by Research-Year 1 - 1 1
16. BA French-Year 2 3 19 22
17. BA French-Year 4+ 2 10 12
18. BSc Communication Studies (Spec. Business Communication)-Year 3 1 8 9
19. BSc Communication Studies (Spec. Business Communication)-Year 4+ 1 15 16
20. BSc Communication Studies (Spec. Journalism) -Year 3 2 6 8
21. BSc Communication Studies (Spec. Journalism) -Year 4+ 2 10 12
22. BSc Social Work-Year 3 8 12 20
23. BSc Social Work-Year 4+ 8 11 19
24. Dip/BSc Communication Studies (Spec. Business Communication)-Year 1 3 10 13
25. Dip/BSc Communication Studies (Spec. Journalism) -Year 1 2 12 14
26. Dip/BSc Social Work-Year 1 6 15 21
27. Dip/BSc Social Work-Year 2 5 19 24
28. Diploma in Library and Information Science-Year 1 3 9 12
29. Diploma in Library and Information Science-Year 2 2 8 10
30. Diploma in Library and Information Science-Year 3 1 - 1
Sub Total (Part-Time) 96 281 377Total 468 1,599 2,067
Key: M - Male, F - Female, T - Total, Yr 4+ - Year 4 and above
Table 16: Enrolment at the Faculty of Social Studies & Humanities, University of Mauritius, 2012/2013(Cont.)
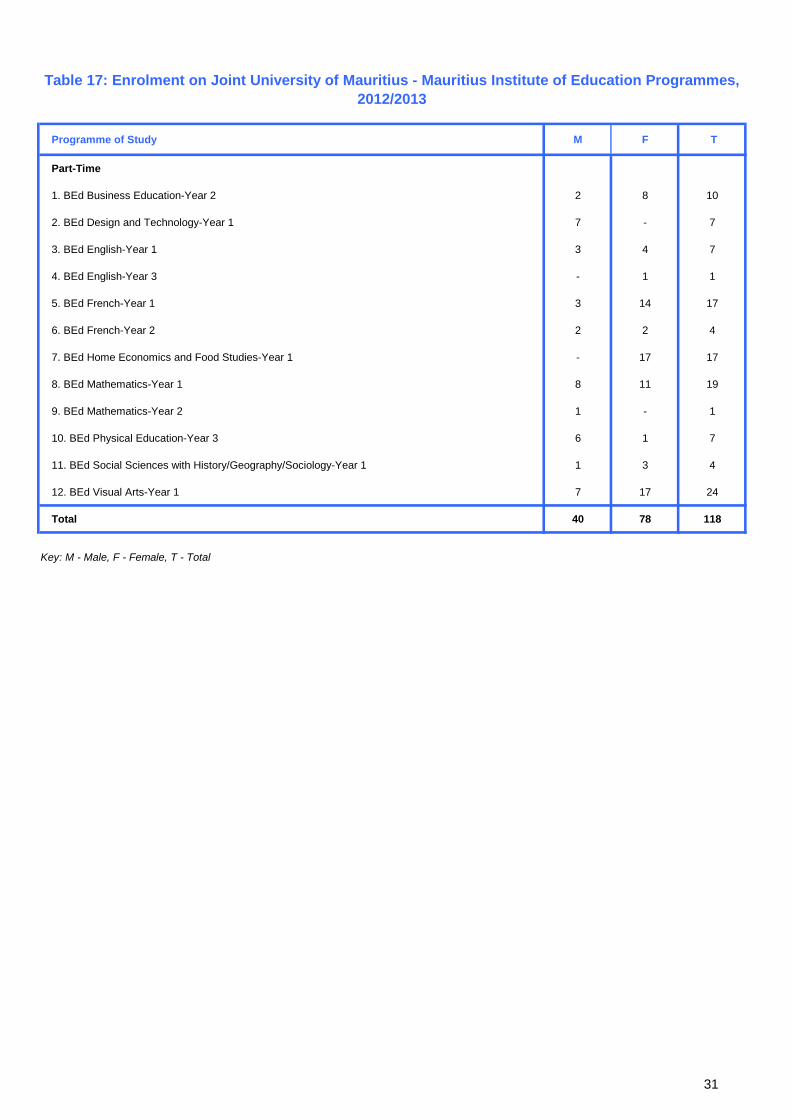
31
Programme of Study M F T
Part-Time
1. BEd Business Education-Year 2 2 8 10
2. BEd Design and Technology-Year 1 7 - 7
3. BEd English-Year 1 3 4 7
4. BEd English-Year 3 - 1 1
5. BEd French-Year 1 3 14 17
6. BEd French-Year 2 2 2 4
7. BEd Home Economics and Food Studies-Year 1 - 17 17
8. BEd Mathematics-Year 1 8 11 19
9. BEd Mathematics-Year 2 1 - 1
10. BEd Physical Education-Year 3 6 1 7
11. BEd Social Sciences with History/Geography/Sociology-Year 1 1 3 4
12. BEd Visual Arts-Year 1 7 17 24
Total 40 78 118
Key: M - Male, F - Female, T - Total
Table 17: Enrolment on Joint University of Mauritius - Mauritius Institute of Education Programmes, 2012/2013
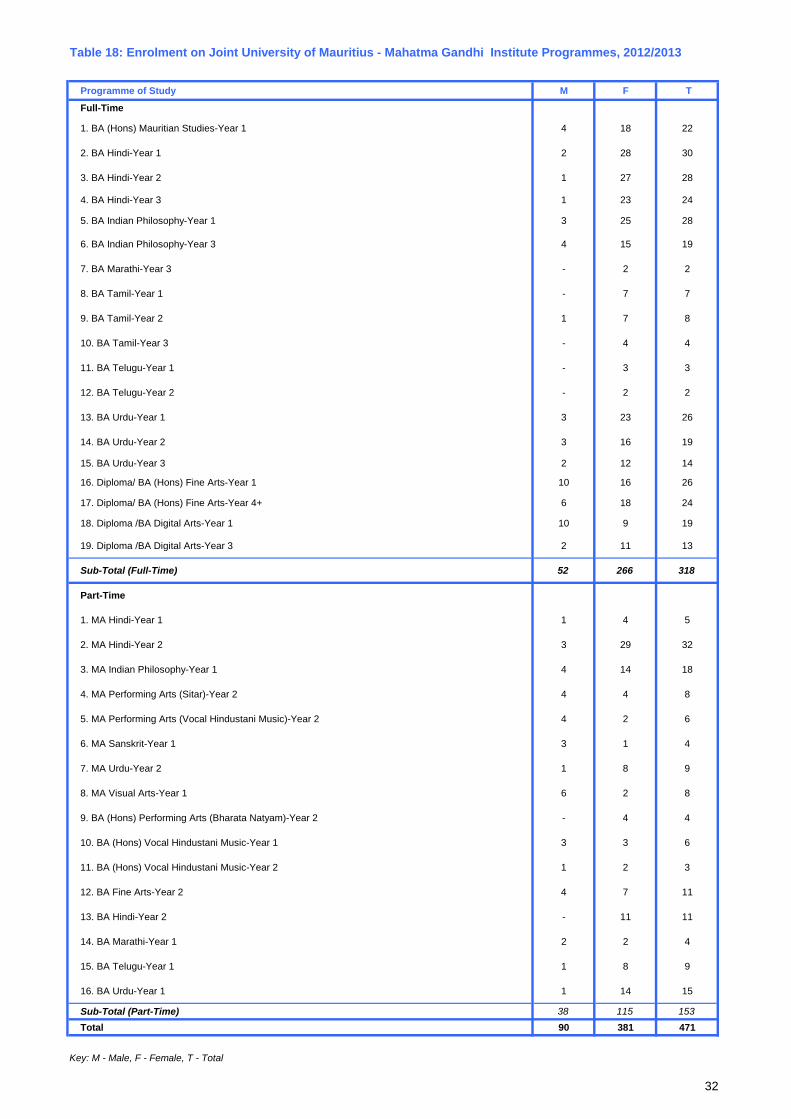
32
Programme of Study M F T
Full-Time
1. BA (Hons) Mauritian Studies-Year 1 4 18 22
2. BA Hindi-Year 1 2 28 30
3. BA Hindi-Year 2 1 27 28
4. BA Hindi-Year 3 1 23 24
5. BA Indian Philosophy-Year 1 3 25 28
6. BA Indian Philosophy-Year 3 4 15 19
7. BA Marathi-Year 3 - 2 2
8. BA Tamil-Year 1 - 7 7
9. BA Tamil-Year 2 1 7 8
10. BA Tamil-Year 3 - 4 4
11. BA Telugu-Year 1 - 3 3
12. BA Telugu-Year 2 - 2 2
13. BA Urdu-Year 1 3 23 26
14. BA Urdu-Year 2 3 16 19
15. BA Urdu-Year 3 2 12 14
16. Diploma/ BA (Hons) Fine Arts-Year 1 10 16 26
17. Diploma/ BA (Hons) Fine Arts-Year 4+ 6 18 24
18. Diploma /BA Digital Arts-Year 1 10 9 19
19. Diploma /BA Digital Arts-Year 3 2 11 13
Sub-Total (Full-Time) 52 266 318
Part-Time
1. MA Hindi-Year 1 1 4 5
2. MA Hindi-Year 2 3 29 32
3. MA Indian Philosophy-Year 1 4 14 18
4. MA Performing Arts (Sitar)-Year 2 4 4 8
5. MA Performing Arts (Vocal Hindustani Music)-Year 2 4 2 6
6. MA Sanskrit-Year 1 3 1 4
7. MA Urdu-Year 2 1 8 9
8. MA Visual Arts-Year 1 6 2 8
9. BA (Hons) Performing Arts (Bharata Natyam)-Year 2 - 4 4
10. BA (Hons) Vocal Hindustani Music-Year 1 3 3 6
11. BA (Hons) Vocal Hindustani Music-Year 2 1 2 3
12. BA Fine Arts-Year 2 4 7 11
13. BA Hindi-Year 2 - 11 11
14. BA Marathi-Year 1 2 2 4
15. BA Telugu-Year 1 1 8 9
16. BA Urdu-Year 1 1 14 15
Sub-Total (Part-Time) 38 115 153
Total 90 381 471
Key: M - Male, F - Female, T - Total
Table 18: Enrolment on Joint University of Mauritius - Mahatma Gandhi Institute Programmes, 2012/2013
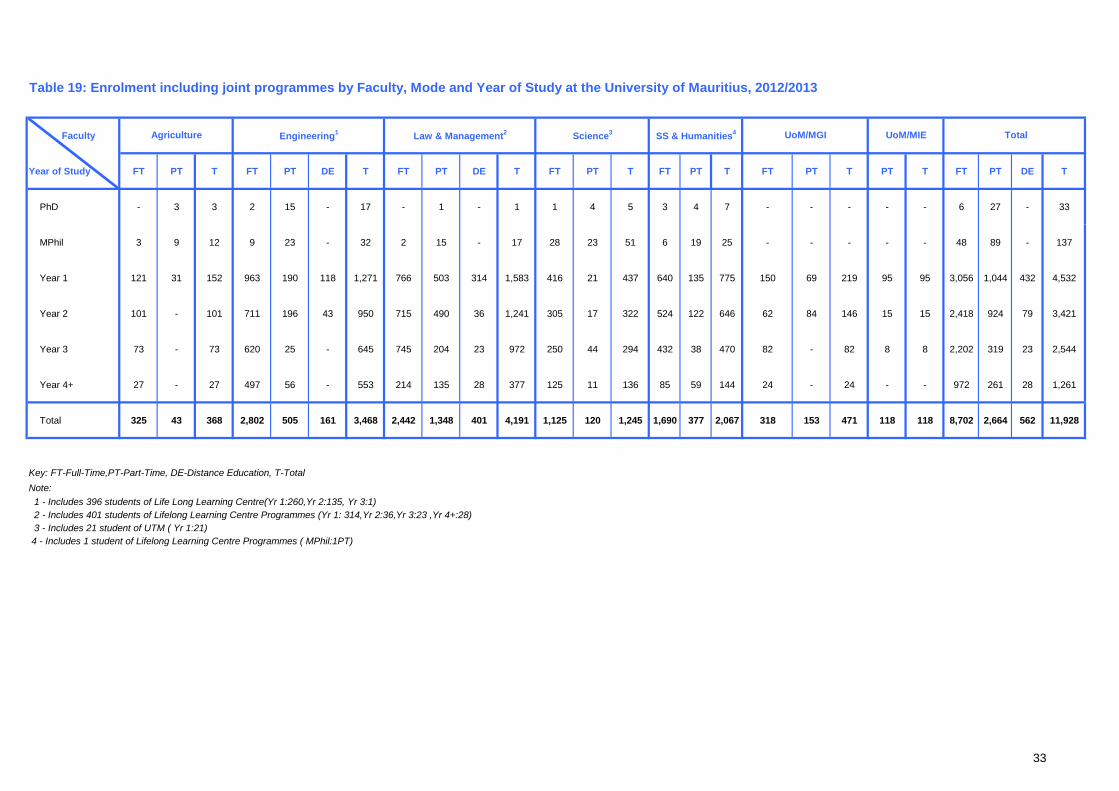
33
Faculty
Year of Study FT PT T FT PT DE T FT PT DE T FT PT T FT PT T FT PT T PT T FT PT DE T
PhD - 3 3 2 15 - 17 - 1 - 1 1 4 5 3 4 7 - - - - - 6 27 - 33
MPhil 3 9 12 9 23 - 32 2 15 - 17 28 23 51 6 19 25 - - - - - 48 89 - 137
Year 1 121 31 152 963 190 118 1,271 766 503 314 1,583 416 21 437 640 135 775 150 69 219 95 95 3,056 1,044 432 4,532
Year 2 101 - 101 711 196 43 950 715 490 36 1,241 305 17 322 524 122 646 62 84 146 15 15 2,418 924 79 3,421
Year 3 73 - 73 620 25 - 645 745 204 23 972 250 44 294 432 38 470 82 - 82 8 8 2,202 319 23 2,544
Year 4+ 27 - 27 497 56 - 553 214 135 28 377 125 11 136 85 59 144 24 - 24 - - 972 261 28 1,261
Total 325 43 368 2,802 505 161 3,468 2,442 1,348 401 4,191 1,125 120 1,245 1,690 377 2,067 318 153 471 118 118 8,702 2,664 562 11,928
Key: FT-Full-Time,PT-Part-Time, DE-Distance Education, T-TotalNote:
SS & Humanities4 UoM/MGI UoM/MIE Total
1 - Includes 396 students of Life Long Learning Centre(Yr 1:260,Yr 2:135, Yr 3:1) 2 - Includes 401 students of Lifelong Learning Centre Programmes (Yr 1: 314,Yr 2:36,Yr 3:23 ,Yr 4+:28) 3 - Includes 21 student of UTM ( Yr 1:21) 4 - Includes 1 student of Lifelong Learning Centre Programmes ( MPhil:1PT)
Table 19: Enrolment including joint programmes by Faculty, Mode and Year of Study at the University of Mauritius, 2012/2013
Agriculture Engineering1 Law & Management2 Science3
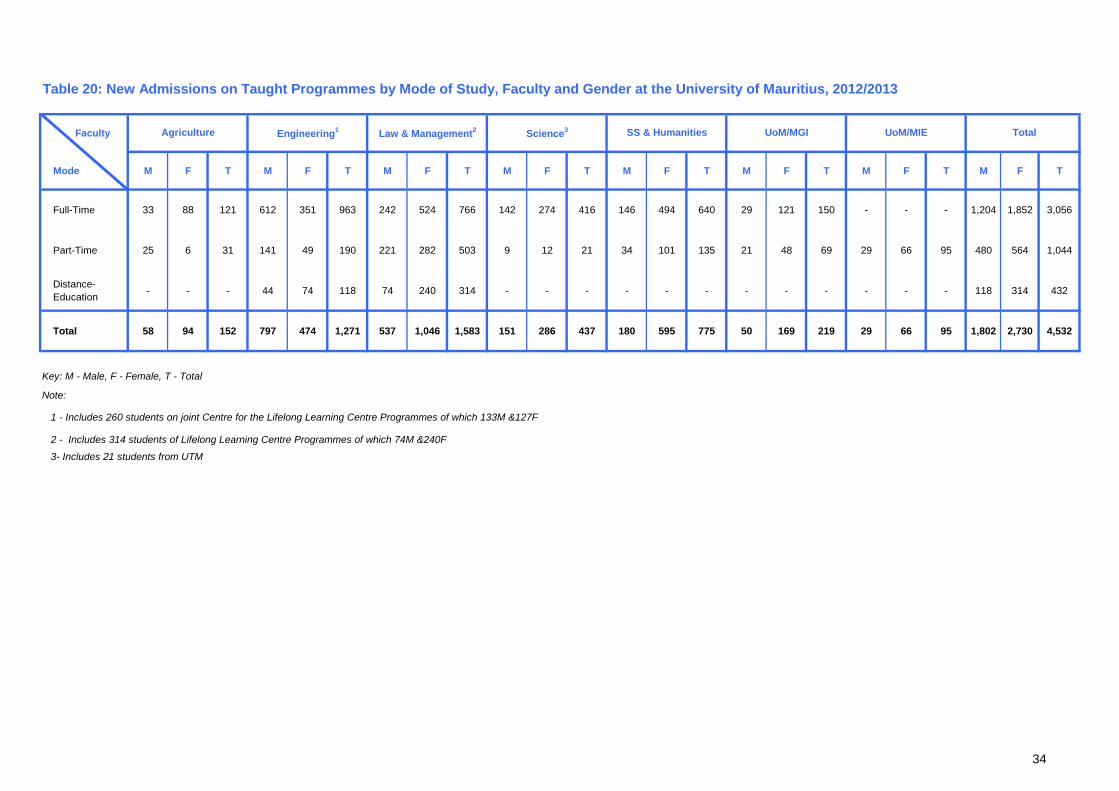
34
Table 20: New Admissions on Taught Programmes by Mode of Study, Faculty and Gender at the University of Mauritius, 2012/2013
Faculty
Mode M F T M F T M F T M F T M F T M F T M F T M F T
Full-Time 33 88 121 612 351 963 242 524 766 142 274 416 146 494 640 29 121 150 - - - 1,204 1,852 3,056
Part-Time 25 6 31 141 49 190 221 282 503 9 12 21 34 101 135 21 48 69 29 66 95 480 564 1,044
Distance-Education - - - 44 74 118 74 240 314 - - - - - - - - - - - - 118 314 432
Total 58 94 152 797 474 1,271 537 1,046 1,583 151 286 437 180 595 775 50 169 219 29 66 95 1,802 2,730 4,532
Note:
Key: M - Male, F - Female, T - Total
Science3
3- Includes 21 students from UTM
UoM/MIE
1 - Includes 260 students on joint Centre for the Lifelong Learning Centre Programmes of which 133M &127F
SS & Humanities TotalUoM/MGI
2 - Includes 314 students of Lifelong Learning Centre Programmes of which 74M &240F
Agriculture Engineering1 Law & Management2
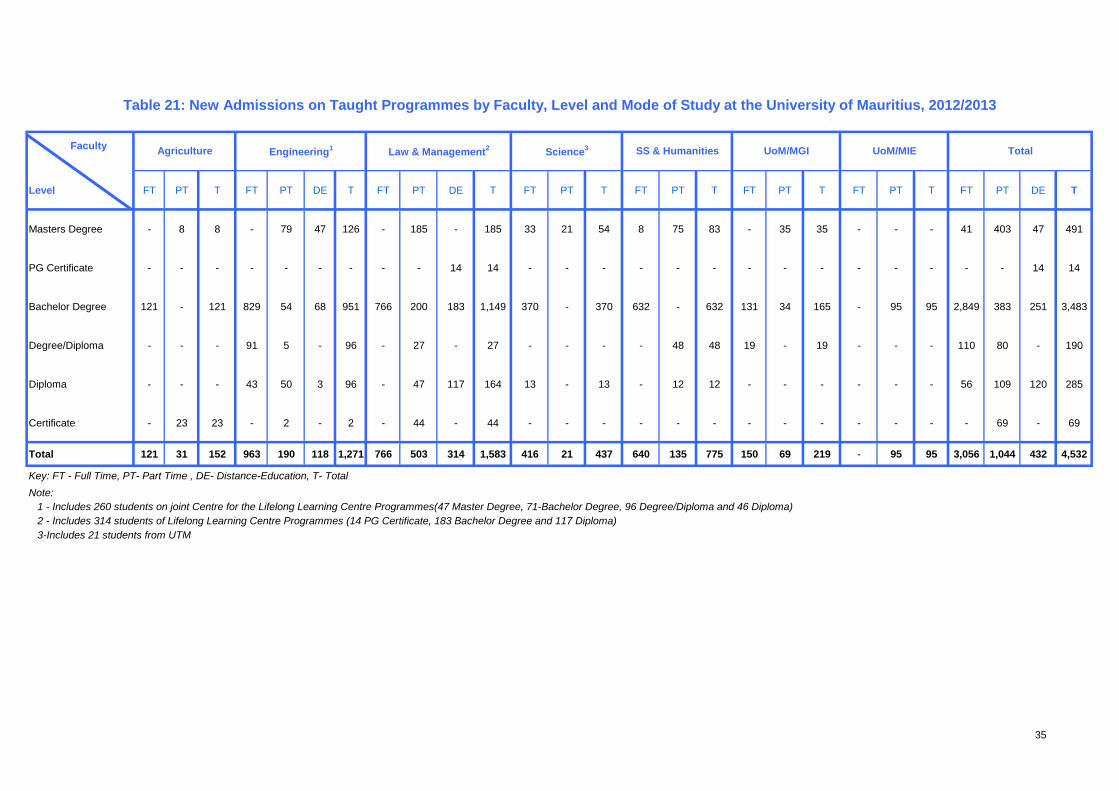
35
Level FT PT T FT PT DE T FT PT DE T FT PT T FT PT T FT PT T FT PT T FT PT DE T
Masters Degree - 8 8 - 79 47 126 - 185 - 185 33 21 54 8 75 83 - 35 35 - - - 41 403 47 491
PG Certificate - - - - - - - - - 14 14 - - - - - - - - - - - - - - 14 14
Bachelor Degree 121 - 121 829 54 68 951 766 200 183 1,149 370 - 370 632 - 632 131 34 165 - 95 95 2,849 383 251 3,483
Degree/Diploma - - - 91 5 - 96 - 27 - 27 - - - - 48 48 19 - 19 - - - 110 80 - 190
Diploma - - - 43 50 3 96 - 47 117 164 13 - 13 - 12 12 - - - - - - 56 109 120 285
Certificate - 23 23 - 2 - 2 - 44 - 44 - - - - - - - - - - - - - 69 - 69
Total 121 31 152 963 190 118 1,271 766 503 314 1,583 416 21 437 640 135 775 150 69 219 - 95 95 3,056 1,044 432 4,532
Key: FT - Full Time, PT- Part Time , DE- Distance-Education, T- TotalNote:
Table 21: New Admissions on Taught Programmes by Faculty, Level and Mode of Study at the University of Mauritius, 2012/2013
UoM/MGI UoM/MIE
1 - Includes 260 students on joint Centre for the Lifelong Learning Centre Programmes(47 Master Degree, 71-Bachelor Degree, 96 Degree/Diploma and 46 Diploma) 2 - Includes 314 students of Lifelong Learning Centre Programmes (14 PG Certificate, 183 Bachelor Degree and 117 Diploma) 3-Includes 21 students from UTM
TotalAgriculture Engineering1 Law & Management2 Science3 SS & HumanitiesFaculty
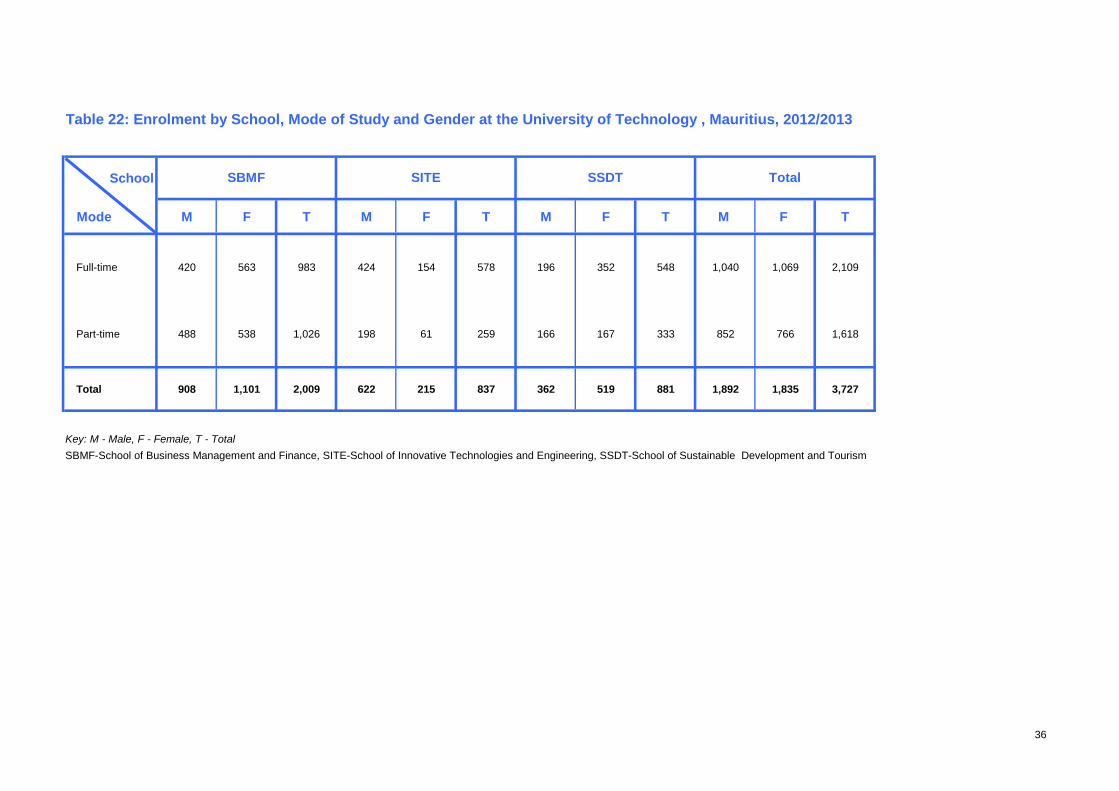
36
School
Mode M F T M F T M F T M F T
Full-time 420 563 983 424 154 578 196 352 548 1,040 1,069 2,109
Part-time 488 538 1,026 198 61 259 166 167 333 852 766 1,618
Total 908 1,101 2,009 622 215 837 362 519 881 1,892 1,835 3,727
SBMF-School of Business Management and Finance, SITE-School of Innovative Technologies and Engineering, SSDT-School of Sustainable Development and Tourism
Total
Key: M - Male, F - Female, T - Total
Table 22: Enrolment by School, Mode of Study and Gender at the University of Technology , Mauritius, 2012/2013
SBMF SITE SSDT
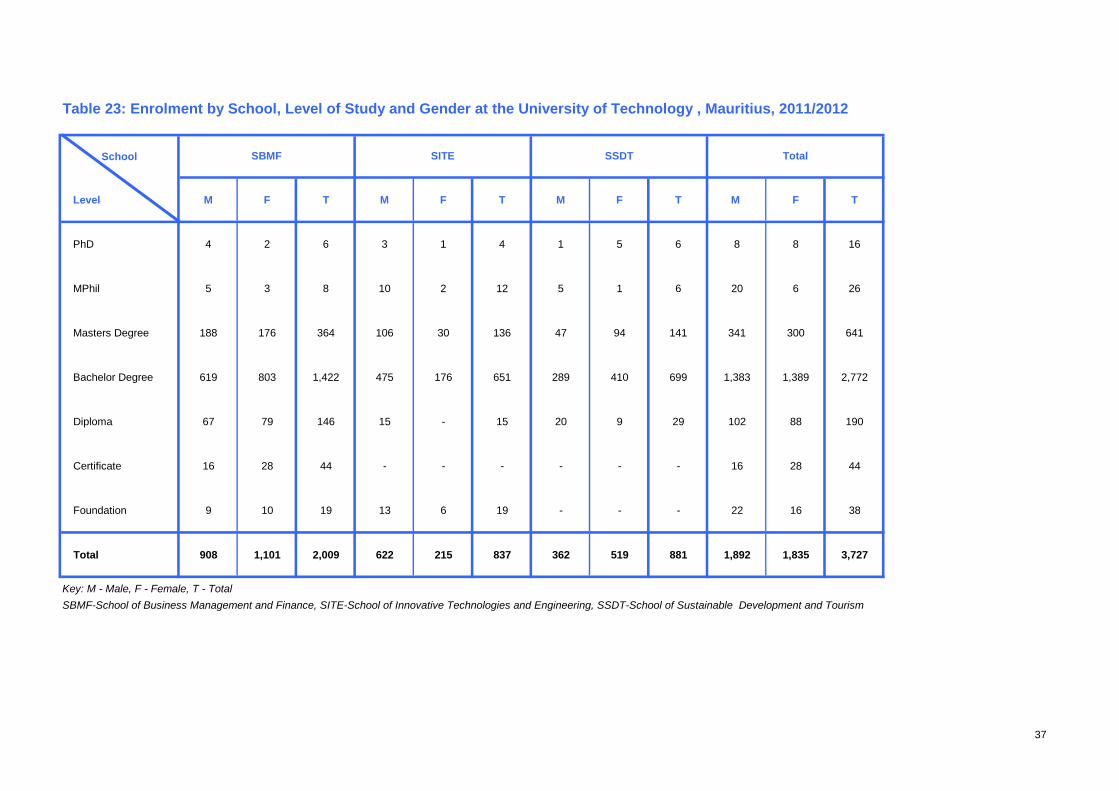
37
School
Level M F T M F T M F T M F T
PhD 4 2 6 3 1 4 1 5 6 8 8 16
MPhil 5 3 8 10 2 12 5 1 6 20 6 26
Masters Degree 188 176 364 106 30 136 47 94 141 341 300 641
Bachelor Degree 619 803 1,422 475 176 651 289 410 699 1,383 1,389 2,772
Diploma 67 79 146 15 - 15 20 9 29 102 88 190
Certificate 16 28 44 - - - - - - 16 28 44
Foundation 9 10 19 13 6 19 - - - 22 16 38
Total 908 1,101 2,009 622 215 837 362 519 881 1,892 1,835 3,727
SBMF-School of Business Management and Finance, SITE-School of Innovative Technologies and Engineering, SSDT-School of Sustainable Development and Tourism
Total
Key: M - Male, F - Female, T - Total
Table 23: Enrolment by School, Level of Study and Gender at the University of Technology , Mauritius, 2011/2012
SBMF SITE SSDT
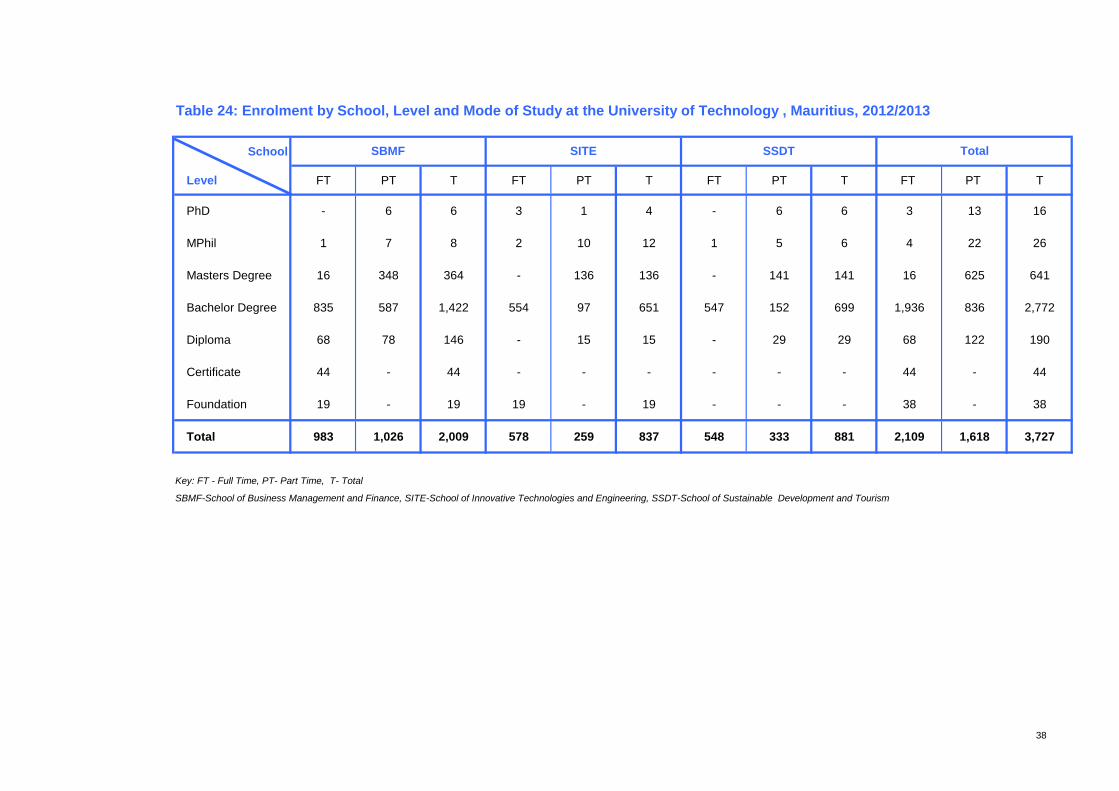
38
Table 24: Enrolment by School, Level and Mode of Study at the University of Technology , Mauritius, 2012/2013
School
Level FT PT T FT PT T FT PT T FT PT T
PhD - 6 6 3 1 4 - 6 6 3 13 16
MPhil 1 7 8 2 10 12 1 5 6 4 22 26
Masters Degree 16 348 364 - 136 136 - 141 141 16 625 641
Bachelor Degree 835 587 1,422 554 97 651 547 152 699 1,936 836 2,772
Diploma 68 78 146 - 15 15 - 29 29 68 122 190
Certificate 44 - 44 - - - - - - 44 - 44
Foundation 19 - 19 19 - 19 - - - 38 - 38
Total 983 1,026 2,009 578 259 837 548 333 881 2,109 1,618 3,727
Key: FT - Full Time, PT- Part Time, T- Total
SBMF-School of Business Management and Finance, SITE-School of Innovative Technologies and Engineering, SSDT-School of Sustainable Development and Tourism
SBMF TotalSITE SSDT
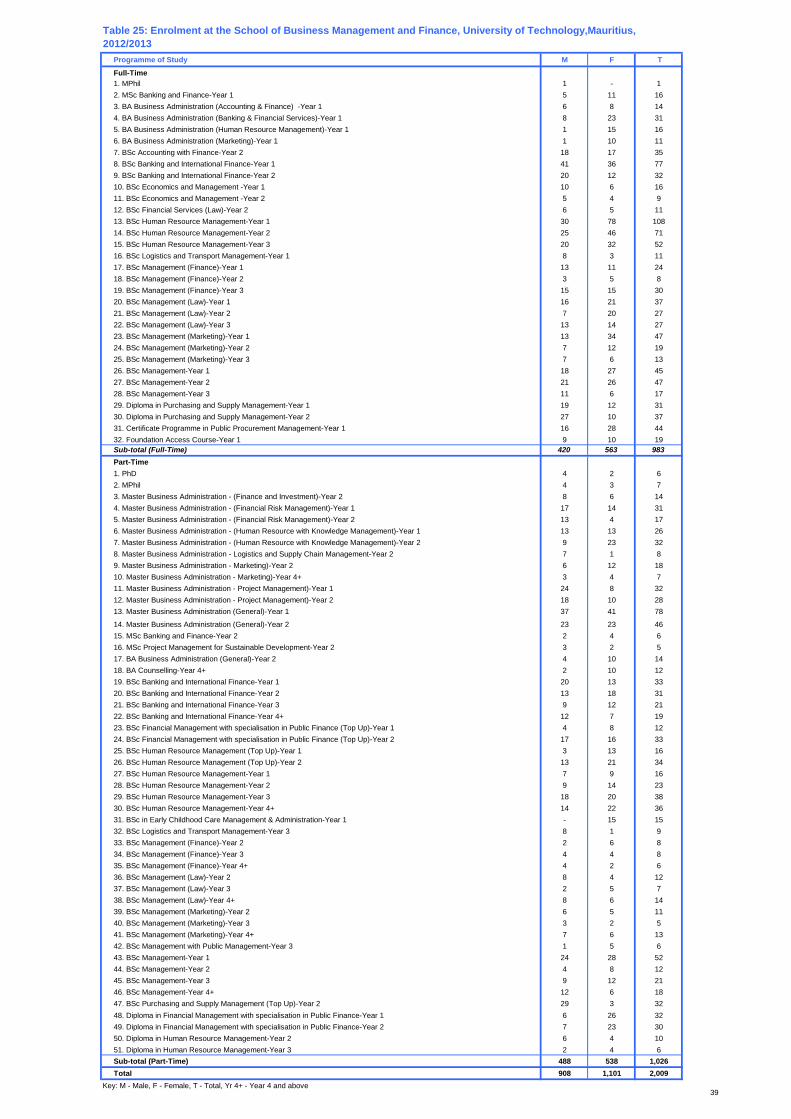
39
Programme of Study M F T
Full-Time1. MPhil 1 - 12. MSc Banking and Finance-Year 1 5 11 163. BA Business Administration (Accounting & Finance) -Year 1 6 8 144. BA Business Administration (Banking & Financial Services)-Year 1 8 23 315. BA Business Administration (Human Resource Management)-Year 1 1 15 166. BA Business Administration (Marketing)-Year 1 1 10 117. BSc Accounting with Finance-Year 2 18 17 358. BSc Banking and International Finance-Year 1 41 36 779. BSc Banking and International Finance-Year 2 20 12 3210. BSc Economics and Management -Year 1 10 6 1611. BSc Economics and Management -Year 2 5 4 912. BSc Financial Services (Law)-Year 2 6 5 1113. BSc Human Resource Management-Year 1 30 78 10814. BSc Human Resource Management-Year 2 25 46 7115. BSc Human Resource Management-Year 3 20 32 5216. BSc Logistics and Transport Management-Year 1 8 3 1117. BSc Management (Finance)-Year 1 13 11 2418. BSc Management (Finance)-Year 2 3 5 819. BSc Management (Finance)-Year 3 15 15 3020. BSc Management (Law)-Year 1 16 21 3721. BSc Management (Law)-Year 2 7 20 2722. BSc Management (Law)-Year 3 13 14 2723. BSc Management (Marketing)-Year 1 13 34 4724. BSc Management (Marketing)-Year 2 7 12 1925. BSc Management (Marketing)-Year 3 7 6 1326. BSc Management-Year 1 18 27 4527. BSc Management-Year 2 21 26 4728. BSc Management-Year 3 11 6 1729. Diploma in Purchasing and Supply Management-Year 1 19 12 3130. Diploma in Purchasing and Supply Management-Year 2 27 10 3731. Certificate Programme in Public Procurement Management-Year 1 16 28 4432. Foundation Access Course-Year 1 9 10 19Sub-total (Full-Time) 420 563 983Part-Time1. PhD 4 2 62. MPhil 4 3 73. Master Business Administration - (Finance and Investment)-Year 2 8 6 144. Master Business Administration - (Financial Risk Management)-Year 1 17 14 315. Master Business Administration - (Financial Risk Management)-Year 2 13 4 176. Master Business Administration - (Human Resource with Knowledge Management)-Year 1 13 13 267. Master Business Administration - (Human Resource with Knowledge Management)-Year 2 9 23 328. Master Business Administration - Logistics and Supply Chain Management-Year 2 7 1 89. Master Business Administration - Marketing)-Year 2 6 12 1810. Master Business Administration - Marketing)-Year 4+ 3 4 711. Master Business Administration - Project Management)-Year 1 24 8 3212. Master Business Administration - Project Management)-Year 2 18 10 2813. Master Business Administration (General)-Year 1 37 41 78
14. Master Business Administration (General)-Year 2 23 23 4615. MSc Banking and Finance-Year 2 2 4 616. MSc Project Management for Sustainable Development-Year 2 3 2 517. BA Business Administration (General)-Year 2 4 10 1418. BA Counselling-Year 4+ 2 10 1219. BSc Banking and International Finance-Year 1 20 13 3320. BSc Banking and International Finance-Year 2 13 18 3121. BSc Banking and International Finance-Year 3 9 12 2122. BSc Banking and International Finance-Year 4+ 12 7 1923. BSc Financial Management with specialisation in Public Finance (Top Up)-Year 1 4 8 1224. BSc Financial Management with specialisation in Public Finance (Top Up)-Year 2 17 16 3325. BSc Human Resource Management (Top Up)-Year 1 3 13 1626. BSc Human Resource Management (Top Up)-Year 2 13 21 3427. BSc Human Resource Management-Year 1 7 9 1628. BSc Human Resource Management-Year 2 9 14 2329. BSc Human Resource Management-Year 3 18 20 3830. BSc Human Resource Management-Year 4+ 14 22 3631. BSc in Early Childhood Care Management & Administration-Year 1 - 15 1532. BSc Logistics and Transport Management-Year 3 8 1 933. BSc Management (Finance)-Year 2 2 6 834. BSc Management (Finance)-Year 3 4 4 835. BSc Management (Finance)-Year 4+ 4 2 636. BSc Management (Law)-Year 2 8 4 1237. BSc Management (Law)-Year 3 2 5 738. BSc Management (Law)-Year 4+ 8 6 1439. BSc Management (Marketing)-Year 2 6 5 1140. BSc Management (Marketing)-Year 3 3 2 541. BSc Management (Marketing)-Year 4+ 7 6 1342. BSc Management with Public Management-Year 3 1 5 643. BSc Management-Year 1 24 28 5244. BSc Management-Year 2 4 8 1245. BSc Management-Year 3 9 12 2146. BSc Management-Year 4+ 12 6 1847. BSc Purchasing and Supply Management (Top Up)-Year 2 29 3 3248. Diploma in Financial Management with specialisation in Public Finance-Year 1 6 26 3249. Diploma in Financial Management with specialisation in Public Finance-Year 2 7 23 3050. Diploma in Human Resource Management-Year 2 6 4 1051. Diploma in Human Resource Management-Year 3 2 4 6Sub-total (Part-Time) 488 538 1,026Total 908 1,101 2,009
Key: M - Male, F - Female, T - Total, Yr 4+ - Year 4 and above
Table 25: Enrolment at the School of Business Management and Finance, University of Technology,Mauritius, 2012/2013
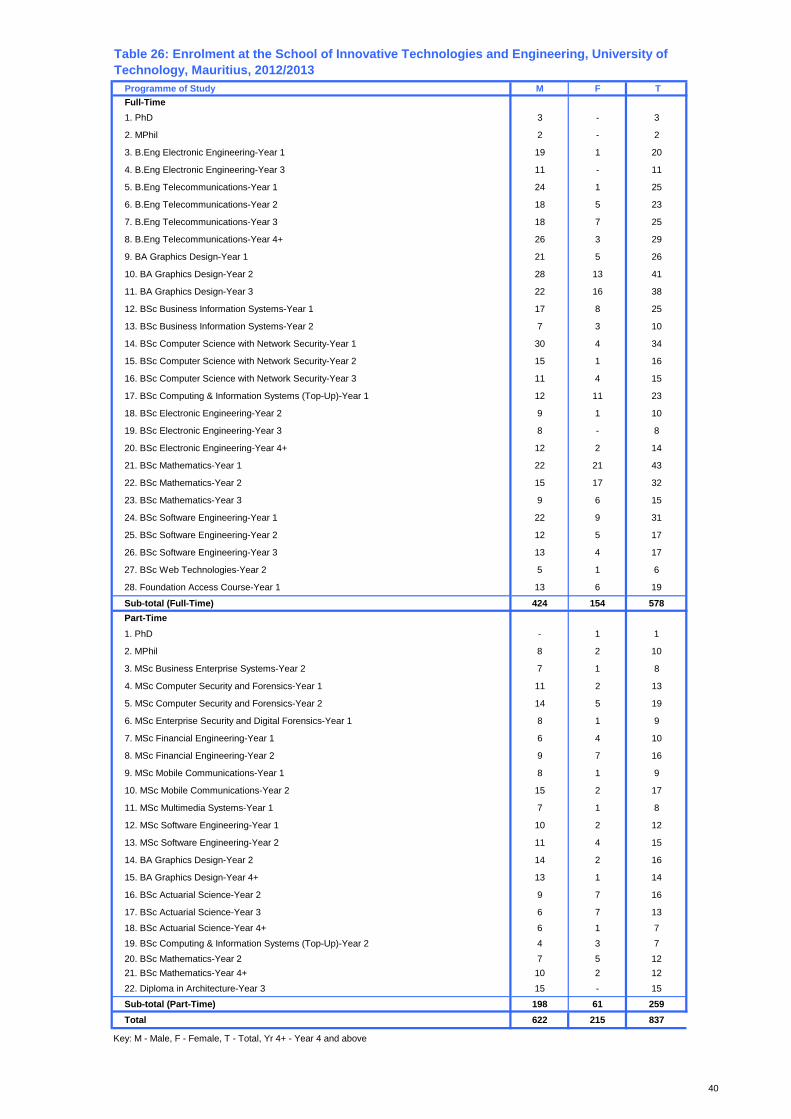
40
Programme of Study M F TFull-Time1. PhD 3 - 3
2. MPhil 2 - 2
3. B.Eng Electronic Engineering-Year 1 19 1 20
4. B.Eng Electronic Engineering-Year 3 11 - 11
5. B.Eng Telecommunications-Year 1 24 1 25
6. B.Eng Telecommunications-Year 2 18 5 23
7. B.Eng Telecommunications-Year 3 18 7 25
8. B.Eng Telecommunications-Year 4+ 26 3 29
9. BA Graphics Design-Year 1 21 5 26
10. BA Graphics Design-Year 2 28 13 41
11. BA Graphics Design-Year 3 22 16 38
12. BSc Business Information Systems-Year 1 17 8 25
13. BSc Business Information Systems-Year 2 7 3 10
14. BSc Computer Science with Network Security-Year 1 30 4 34
15. BSc Computer Science with Network Security-Year 2 15 1 16
16. BSc Computer Science with Network Security-Year 3 11 4 15
17. BSc Computing & Information Systems (Top-Up)-Year 1 12 11 23
18. BSc Electronic Engineering-Year 2 9 1 10
19. BSc Electronic Engineering-Year 3 8 - 8
20. BSc Electronic Engineering-Year 4+ 12 2 14
21. BSc Mathematics-Year 1 22 21 43
22. BSc Mathematics-Year 2 15 17 32
23. BSc Mathematics-Year 3 9 6 15
24. BSc Software Engineering-Year 1 22 9 31
25. BSc Software Engineering-Year 2 12 5 17
26. BSc Software Engineering-Year 3 13 4 17
27. BSc Web Technologies-Year 2 5 1 6
28. Foundation Access Course-Year 1 13 6 19
Sub-total (Full-Time) 424 154 578Part-Time1. PhD - 1 1
2. MPhil 8 2 10
3. MSc Business Enterprise Systems-Year 2 7 1 8
4. MSc Computer Security and Forensics-Year 1 11 2 13
5. MSc Computer Security and Forensics-Year 2 14 5 19
6. MSc Enterprise Security and Digital Forensics-Year 1 8 1 9
7. MSc Financial Engineering-Year 1 6 4 10
8. MSc Financial Engineering-Year 2 9 7 16
9. MSc Mobile Communications-Year 1 8 1 9
10. MSc Mobile Communications-Year 2 15 2 17
11. MSc Multimedia Systems-Year 1 7 1 8
12. MSc Software Engineering-Year 1 10 2 12
13. MSc Software Engineering-Year 2 11 4 15
14. BA Graphics Design-Year 2 14 2 16
15. BA Graphics Design-Year 4+ 13 1 14
16. BSc Actuarial Science-Year 2 9 7 16
17. BSc Actuarial Science-Year 3 6 7 13
18. BSc Actuarial Science-Year 4+ 6 1 7
19. BSc Computing & Information Systems (Top-Up)-Year 2 4 3 720. BSc Mathematics-Year 2 7 5 1221. BSc Mathematics-Year 4+ 10 2 12
22. Diploma in Architecture-Year 3 15 - 15
Sub-total (Part-Time) 198 61 259Total 622 215 837
Key: M - Male, F - Female, T - Total, Yr 4+ - Year 4 and above
Table 26: Enrolment at the School of Innovative Technologies and Engineering, University of Technology, Mauritius, 2012/2013
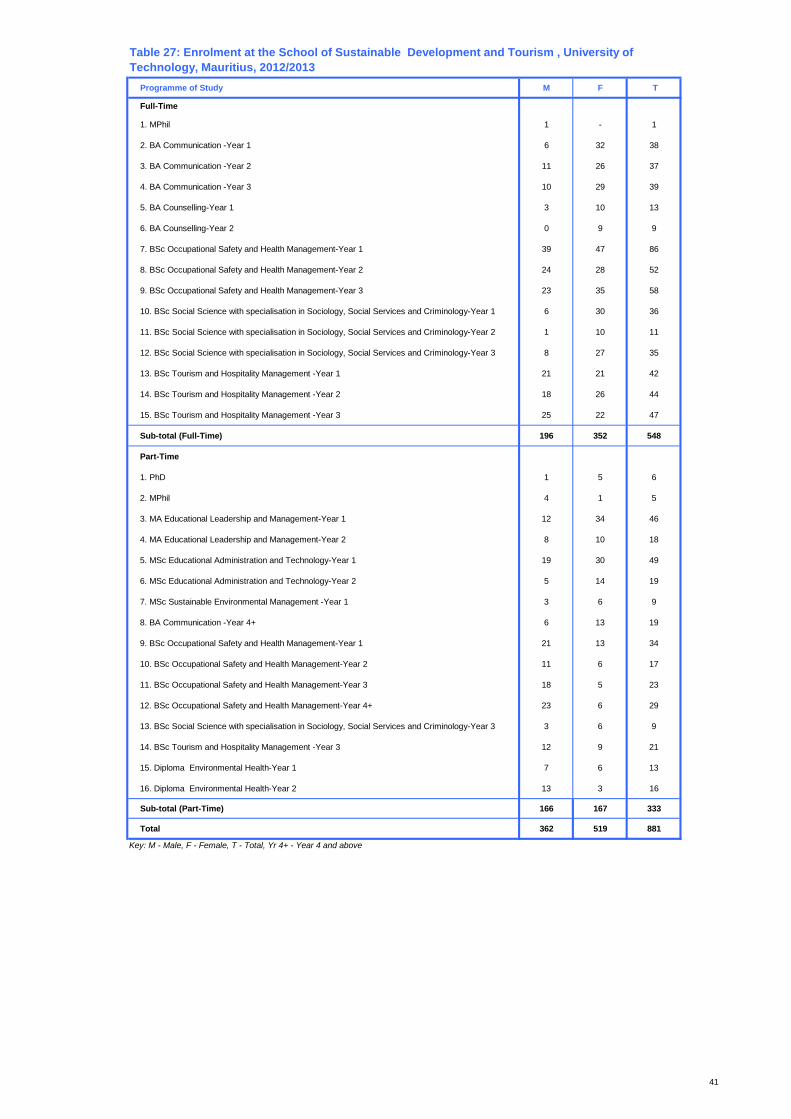
41
Programme of Study M F T
Full-Time
1. MPhil 1 - 1
2. BA Communication -Year 1 6 32 38
3. BA Communication -Year 2 11 26 37
4. BA Communication -Year 3 10 29 39
5. BA Counselling-Year 1 3 10 13
6. BA Counselling-Year 2 0 9 9
7. BSc Occupational Safety and Health Management-Year 1 39 47 86
8. BSc Occupational Safety and Health Management-Year 2 24 28 52
9. BSc Occupational Safety and Health Management-Year 3 23 35 58
10. BSc Social Science with specialisation in Sociology, Social Services and Criminology-Year 1 6 30 36
11. BSc Social Science with specialisation in Sociology, Social Services and Criminology-Year 2 1 10 11
12. BSc Social Science with specialisation in Sociology, Social Services and Criminology-Year 3 8 27 35
13. BSc Tourism and Hospitality Management -Year 1 21 21 42
14. BSc Tourism and Hospitality Management -Year 2 18 26 44
15. BSc Tourism and Hospitality Management -Year 3 25 22 47
Sub-total (Full-Time) 196 352 548
Part-Time
1. PhD 1 5 6
2. MPhil 4 1 5
3. MA Educational Leadership and Management-Year 1 12 34 46
4. MA Educational Leadership and Management-Year 2 8 10 18
5. MSc Educational Administration and Technology-Year 1 19 30 49
6. MSc Educational Administration and Technology-Year 2 5 14 19
7. MSc Sustainable Environmental Management -Year 1 3 6 9
8. BA Communication -Year 4+ 6 13 19
9. BSc Occupational Safety and Health Management-Year 1 21 13 34
10. BSc Occupational Safety and Health Management-Year 2 11 6 17
11. BSc Occupational Safety and Health Management-Year 3 18 5 23
12. BSc Occupational Safety and Health Management-Year 4+ 23 6 29
13. BSc Social Science with specialisation in Sociology, Social Services and Criminology-Year 3 3 6 9
14. BSc Tourism and Hospitality Management -Year 3 12 9 21
15. Diploma Environmental Health-Year 1 7 6 13
16. Diploma Environmental Health-Year 2 13 3 16
Sub-total (Part-Time) 166 167 333
Total 362 519 881
Key: M - Male, F - Female, T - Total, Yr 4+ - Year 4 and above
Table 27: Enrolment at the School of Sustainable Development and Tourism , University of Technology, Mauritius, 2012/2013
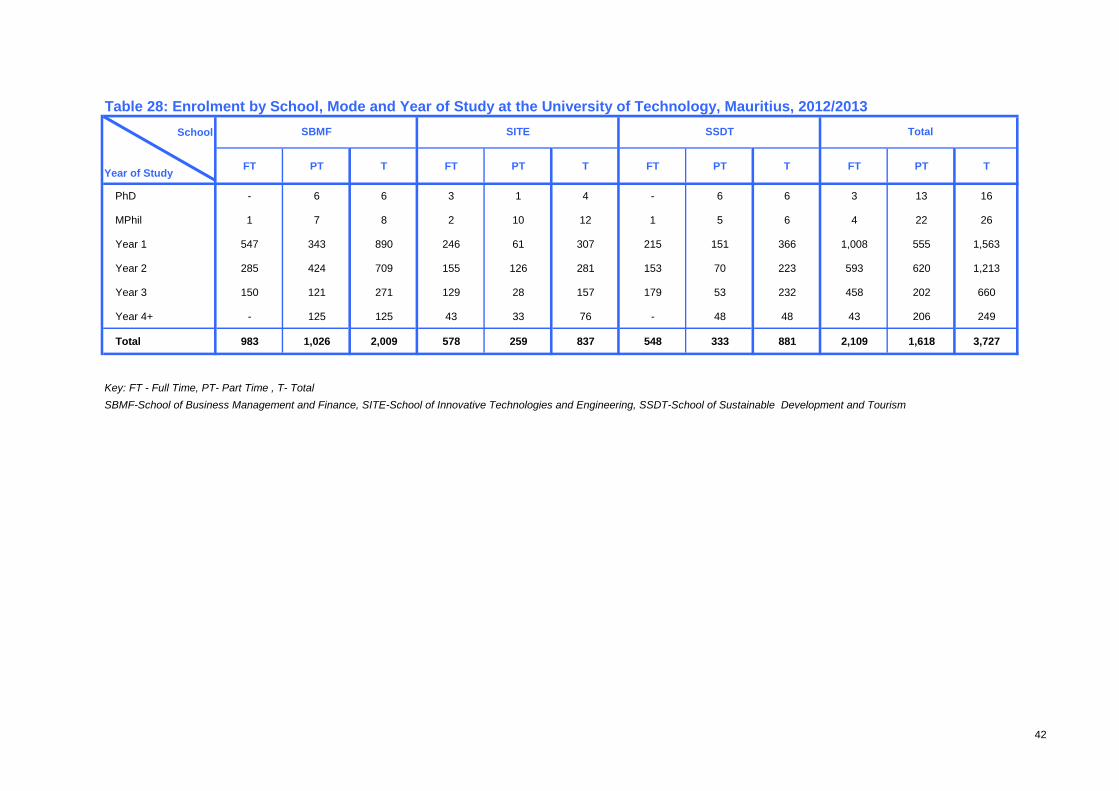
42
Table 28: Enrolment by School, Mode and Year of Study at the University of Technology, Mauritius, 2012/2013School
Year of Study FT PT T FT PT T FT PT T FT PT T
PhD - 6 6 3 1 4 - 6 6 3 13 16
MPhil 1 7 8 2 10 12 1 5 6 4 22 26
Year 1 547 343 890 246 61 307 215 151 366 1,008 555 1,563
Year 2 285 424 709 155 126 281 153 70 223 593 620 1,213
Year 3 150 121 271 129 28 157 179 53 232 458 202 660
Year 4+ - 125 125 43 33 76 - 48 48 43 206 249
Total 983 1,026 2,009 578 259 837 548 333 881 2,109 1,618 3,727
Key: FT - Full Time, PT- Part Time , T- TotalSBMF-School of Business Management and Finance, SITE-School of Innovative Technologies and Engineering, SSDT-School of Sustainable Development and Tourism
TotalSBMF SITE SSDT
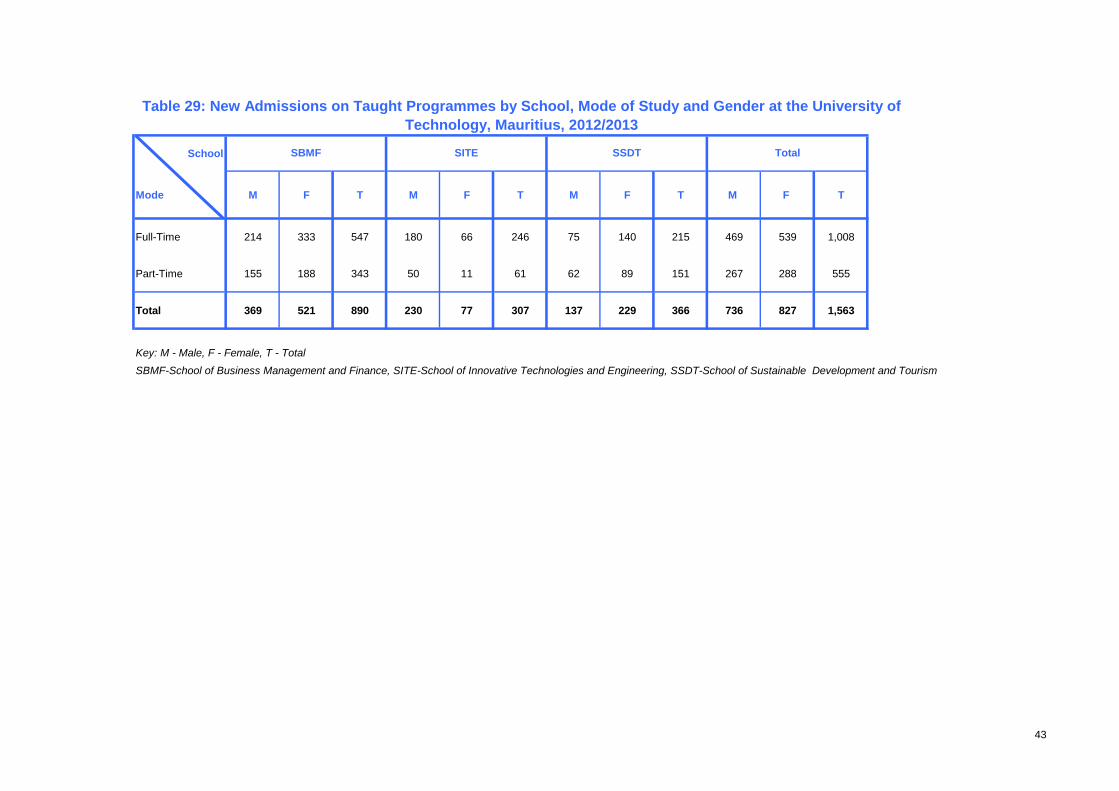
43
School
Mode M F T M F T M F T M F T
Full-Time 214 333 547 180 66 246 75 140 215 469 539 1,008
Part-Time 155 188 343 50 11 61 62 89 151 267 288 555
Total 369 521 890 230 77 307 137 229 366 736 827 1,563
SBMF-School of Business Management and Finance, SITE-School of Innovative Technologies and Engineering, SSDT-School of Sustainable Development and Tourism
Table 29: New Admissions on Taught Programmes by School, Mode of Study and Gender at the University of Technology, Mauritius, 2012/2013
Key: M - Male, F - Female, T - Total
TotalSBMF SITE SSDT
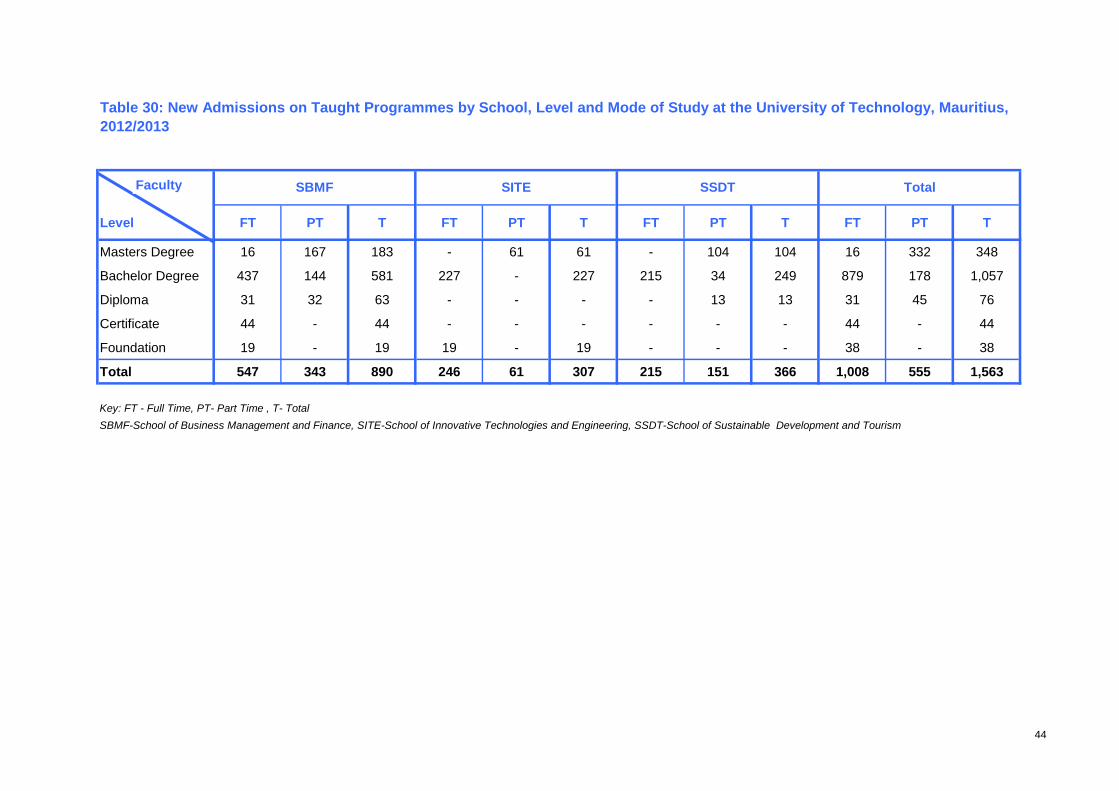
44
Level FT PT T FT PT T FT PT T FT PT T
Masters Degree 16 167 183 - 61 61 - 104 104 16 332 348
Bachelor Degree 437 144 581 227 - 227 215 34 249 879 178 1,057
Diploma 31 32 63 - - - - 13 13 31 45 76
Certificate 44 - 44 - - - - - - 44 - 44
Foundation 19 - 19 19 - 19 - - - 38 - 38
Total 547 343 890 246 61 307 215 151 366 1,008 555 1,563
Key: FT - Full Time, PT- Part Time , T- TotalSBMF-School of Business Management and Finance, SITE-School of Innovative Technologies and Engineering, SSDT-School of Sustainable Development and Tourism
TotalSITE SSDT
Table 30: New Admissions on Taught Programmes by School, Level and Mode of Study at the University of Technology, Mauritius, 2012/2013
SBMFFaculty
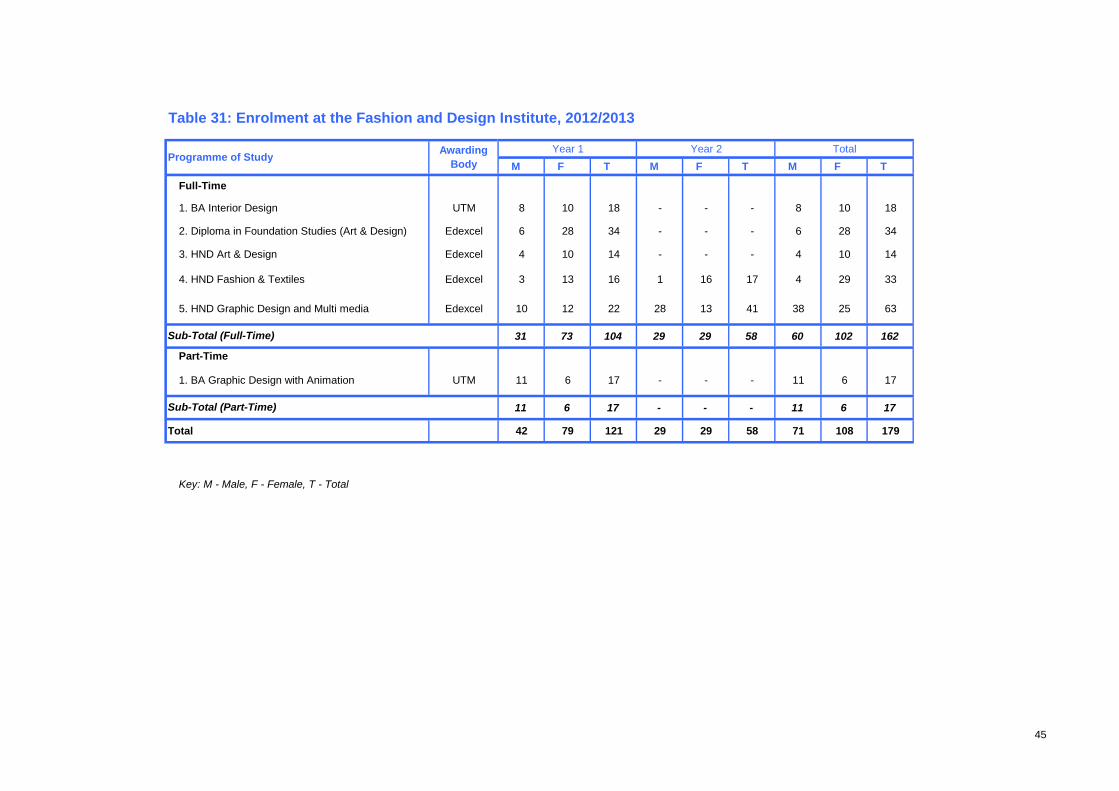
45
M F T M F T M F T
Full-Time
1. BA Interior Design UTM 8 10 18 - - - 8 10 18
2. Diploma in Foundation Studies (Art & Design) Edexcel 6 28 34 - - - 6 28 34
3. HND Art & Design Edexcel 4 10 14 - - - 4 10 14
4. HND Fashion & Textiles Edexcel 3 13 16 1 16 17 4 29 33
5. HND Graphic Design and Multi media Edexcel 10 12 22 28 13 41 38 25 63
31 73 104 29 29 58 60 102 162
Part-Time
1. BA Graphic Design with Animation UTM 11 6 17 - - - 11 6 17
11 6 17 - - - 11 6 17
Total 42 79 121 29 29 58 71 108 179
Key: M - Male, F - Female, T - Total
Sub-Total (Part-Time)
Sub-Total (Full-Time)
Table 31: Enrolment at the Fashion and Design Institute, 2012/2013
Year 1 Year 2 TotalAwarding BodyProgramme of Study
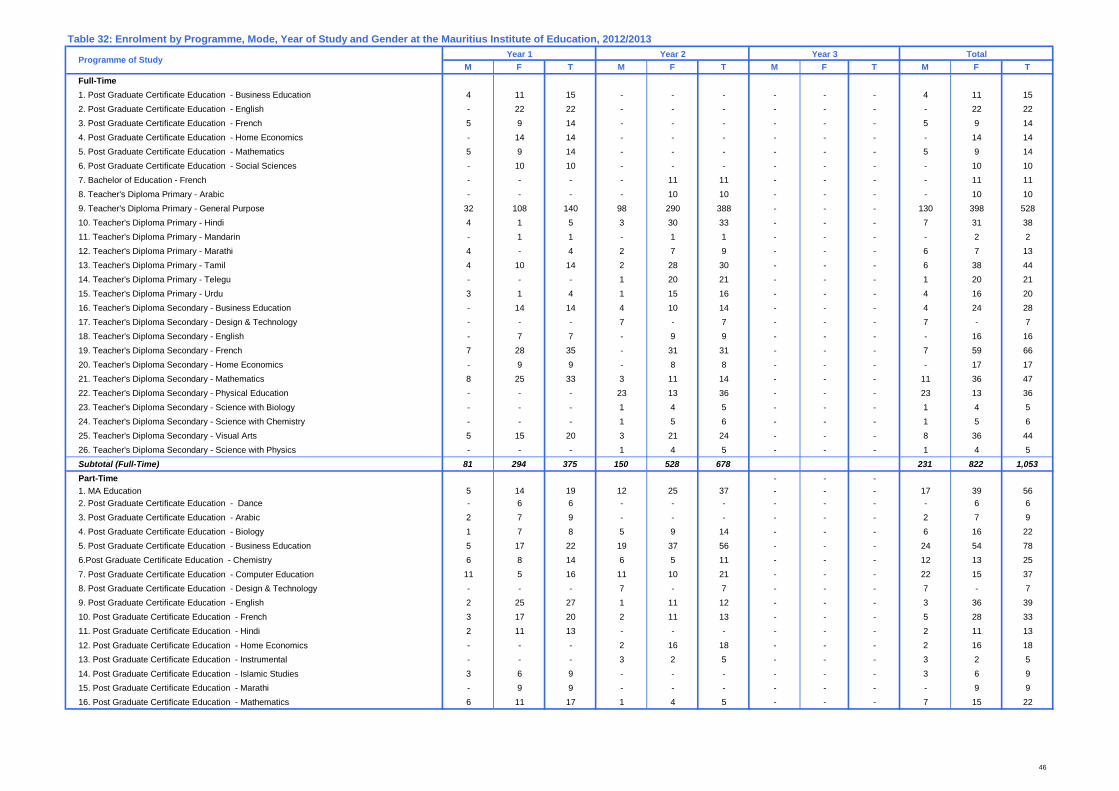
46
M F T M F T M F T M F TFull-Time1. Post Graduate Certificate Education - Business Education 4 11 15 - - - - - - 4 11 152. Post Graduate Certificate Education - English - 22 22 - - - - - - - 22 223. Post Graduate Certificate Education - French 5 9 14 - - - - - - 5 9 144. Post Graduate Certificate Education - Home Economics - 14 14 - - - - - - - 14 145. Post Graduate Certificate Education - Mathematics 5 9 14 - - - - - - 5 9 146. Post Graduate Certificate Education - Social Sciences - 10 10 - - - - - - - 10 107. Bachelor of Education - French - - - - 11 11 - - - - 11 118. Teacher's Diploma Primary - Arabic - - - - 10 10 - - - - 10 109. Teacher's Diploma Primary - General Purpose 32 108 140 98 290 388 - - - 130 398 52810. Teacher's Diploma Primary - Hindi 4 1 5 3 30 33 - - - 7 31 3811. Teacher's Diploma Primary - Mandarin - 1 1 - 1 1 - - - - 2 212. Teacher's Diploma Primary - Marathi 4 - 4 2 7 9 - - - 6 7 1313. Teacher's Diploma Primary - Tamil 4 10 14 2 28 30 - - - 6 38 4414. Teacher's Diploma Primary - Telegu - - - 1 20 21 - - - 1 20 2115. Teacher's Diploma Primary - Urdu 3 1 4 1 15 16 - - - 4 16 2016. Teacher's Diploma Secondary - Business Education - 14 14 4 10 14 - - - 4 24 2817. Teacher's Diploma Secondary - Design & Technology - - - 7 - 7 - - - 7 - 718. Teacher's Diploma Secondary - English - 7 7 - 9 9 - - - - 16 1619. Teacher's Diploma Secondary - French 7 28 35 - 31 31 - - - 7 59 6620. Teacher's Diploma Secondary - Home Economics - 9 9 - 8 8 - - - - 17 1721. Teacher's Diploma Secondary - Mathematics 8 25 33 3 11 14 - - - 11 36 4722. Teacher's Diploma Secondary - Physical Education - - - 23 13 36 - - - 23 13 3623. Teacher's Diploma Secondary - Science with Biology - - - 1 4 5 - - - 1 4 524. Teacher's Diploma Secondary - Science with Chemistry - - - 1 5 6 - - - 1 5 625. Teacher's Diploma Secondary - Visual Arts 5 15 20 3 21 24 - - - 8 36 4426. Teacher's Diploma Secondary - Science with Physics - - - 1 4 5 - - - 1 4 5Subtotal (Full-Time) 81 294 375 150 528 678 231 822 1,053Part-Time - - -1. MA Education 5 14 19 12 25 37 - - - 17 39 562. Post Graduate Certificate Education - Dance - 6 6 - - - - - - - 6 63. Post Graduate Certificate Education - Arabic 2 7 9 - - - - - - 2 7 94. Post Graduate Certificate Education - Biology 1 7 8 5 9 14 - - - 6 16 225. Post Graduate Certificate Education - Business Education 5 17 22 19 37 56 - - - 24 54 786.Post Graduate Certificate Education - Chemistry 6 8 14 6 5 11 - - - 12 13 25
7. Post Graduate Certificate Education - Computer Education 11 5 16 11 10 21 - - - 22 15 378. Post Graduate Certificate Education - Design & Technology - - - 7 - 7 - - - 7 - 79. Post Graduate Certificate Education - English 2 25 27 1 11 12 - - - 3 36 3910. Post Graduate Certificate Education - French 3 17 20 2 11 13 - - - 5 28 3311. Post Graduate Certificate Education - Hindi 2 11 13 - - - - - - 2 11 13
12. Post Graduate Certificate Education - Home Economics - - - 2 16 18 - - - 2 16 1813. Post Graduate Certificate Education - Instrumental - - - 3 2 5 - - - 3 2 5
14. Post Graduate Certificate Education - Islamic Studies 3 6 9 - - - - - - 3 6 915. Post Graduate Certificate Education - Marathi - 9 9 - - - - - - - 9 916. Post Graduate Certificate Education - Mathematics 6 11 17 1 4 5 - - - 7 15 22
Table 32: Enrolment by Programme, Mode, Year of Study and Gender at the Mauritius Institute of Education, 2012/2013TotalProgramme of Study Year 1 Year 2 Year 3
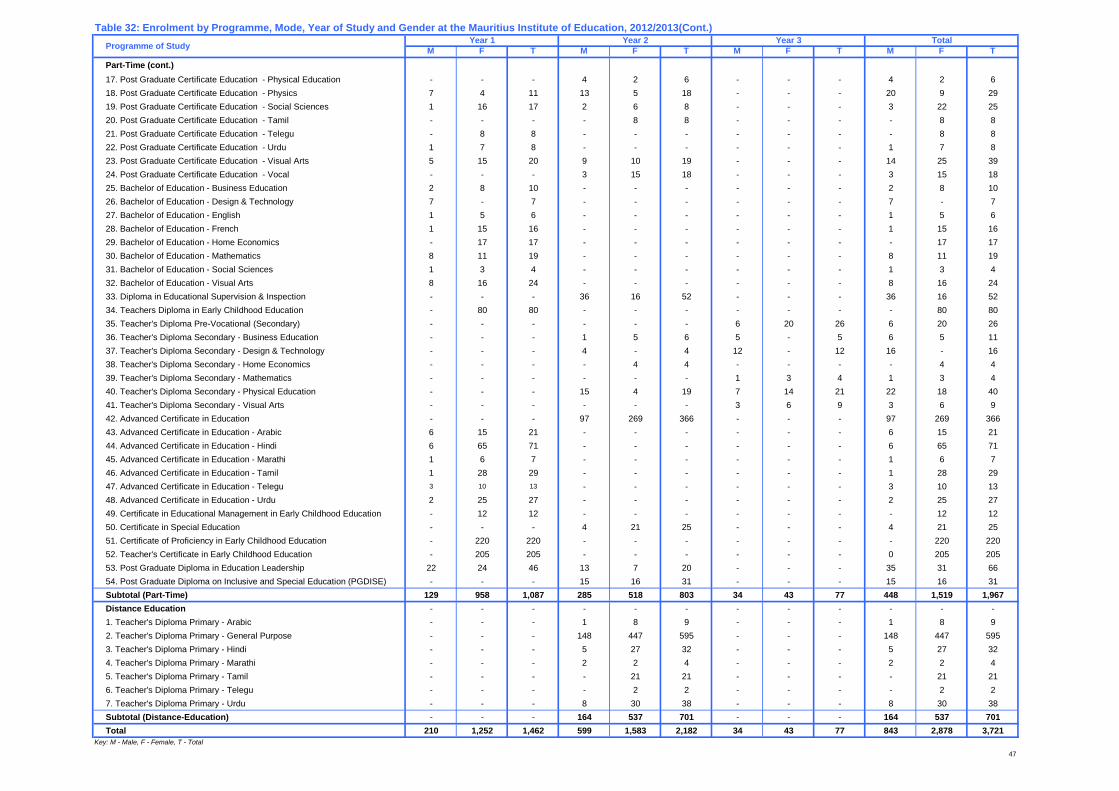
M F T M F T M F T M F TPart-Time (cont.)17. Post Graduate Certificate Education - Physical Education - - - 4 2 6 - - - 4 2 618. Post Graduate Certificate Education - Physics 7 4 11 13 5 18 - - - 20 9 2919. Post Graduate Certificate Education - Social Sciences 1 16 17 2 6 8 - - - 3 22 2520. Post Graduate Certificate Education - Tamil - - - - 8 8 - - - - 8 821. Post Graduate Certificate Education - Telegu - 8 8 - - - - - - - 8 822. Post Graduate Certificate Education - Urdu 1 7 8 - - - - - - 1 7 823. Post Graduate Certificate Education - Visual Arts 5 15 20 9 10 19 - - - 14 25 3924. Post Graduate Certificate Education - Vocal - - - 3 15 18 - - - 3 15 1825. Bachelor of Education - Business Education 2 8 10 - - - - - - 2 8 1026. Bachelor of Education - Design & Technology 7 - 7 - - - - - - 7 - 727. Bachelor of Education - English 1 5 6 - - - - - - 1 5 628. Bachelor of Education - French 1 15 16 - - - - - - 1 15 1629. Bachelor of Education - Home Economics - 17 17 - - - - - - - 17 1730. Bachelor of Education - Mathematics 8 11 19 - - - - - - 8 11 1931. Bachelor of Education - Social Sciences 1 3 4 - - - - - - 1 3 432. Bachelor of Education - Visual Arts 8 16 24 - - - - - - 8 16 2433. Diploma in Educational Supervision & Inspection - - - 36 16 52 - - - 36 16 5234. Teachers Diploma in Early Childhood Education - 80 80 - - - - - - - 80 8035. Teacher's Diploma Pre-Vocational (Secondary) - - - - - - 6 20 26 6 20 2636. Teacher's Diploma Secondary - Business Education - - - 1 5 6 5 - 5 6 5 1137. Teacher's Diploma Secondary - Design & Technology - - - 4 - 4 12 - 12 16 - 1638. Teacher's Diploma Secondary - Home Economics - - - - 4 4 - - - - 4 439. Teacher's Diploma Secondary - Mathematics - - - - - - 1 3 4 1 3 440. Teacher's Diploma Secondary - Physical Education - - - 15 4 19 7 14 21 22 18 4041. Teacher's Diploma Secondary - Visual Arts - - - - - - 3 6 9 3 6 942. Advanced Certificate in Education - - - 97 269 366 - - - 97 269 36643. Advanced Certificate in Education - Arabic 6 15 21 - - - - - - 6 15 2144. Advanced Certificate in Education - Hindi 6 65 71 - - - - - - 6 65 7145. Advanced Certificate in Education - Marathi 1 6 7 - - - - - - 1 6 746. Advanced Certificate in Education - Tamil 1 28 29 - - - - - - 1 28 2947. Advanced Certificate in Education - Telegu 3 10 13 - - - - - - 3 10 1348. Advanced Certificate in Education - Urdu 2 25 27 - - - - - - 2 25 2749. Certificate in Educational Management in Early Childhood Education - 12 12 - - - - - - - 12 1250. Certificate in Special Education - - - 4 21 25 - - - 4 21 2551. Certificate of Proficiency in Early Childhood Education - 220 220 - - - - - - - 220 22052. Teacher's Certificate in Early Childhood Education - 205 205 - - - - - - 0 205 20553. Post Graduate Diploma in Education Leadership 22 24 46 13 7 20 - - - 35 31 6654. Post Graduate Diploma on Inclusive and Special Education (PGDISE) - - - 15 16 31 - - - 15 16 31Subtotal (Part-Time) 129 958 1,087 285 518 803 34 43 77 448 1,519 1,967Distance Education - - - - - - - - - - - -1. Teacher's Diploma Primary - Arabic - - - 1 8 9 - - - 1 8 92. Teacher's Diploma Primary - General Purpose - - - 148 447 595 - - - 148 447 5953. Teacher's Diploma Primary - Hindi - - - 5 27 32 - - - 5 27 324. Teacher's Diploma Primary - Marathi - - - 2 2 4 - - - 2 2 45. Teacher's Diploma Primary - Tamil - - - - 21 21 - - - - 21 216. Teacher's Diploma Primary - Telegu - - - - 2 2 - - - - 2 27. Teacher's Diploma Primary - Urdu - - - 8 30 38 - - - 8 30 38Subtotal (Distance-Education) - - - 164 537 701 - - - 164 537 701Total 210 1,252 1,462 599 1,583 2,182 34 43 77 843 2,878 3,721
47
Key: M - Male, F - Female, T - Total
Table 32: Enrolment by Programme, Mode, Year of Study and Gender at the Mauritius Institute of Education, 2012/2013(Cont.)Programme of Study Year 1 Year 2 Year 3 Total
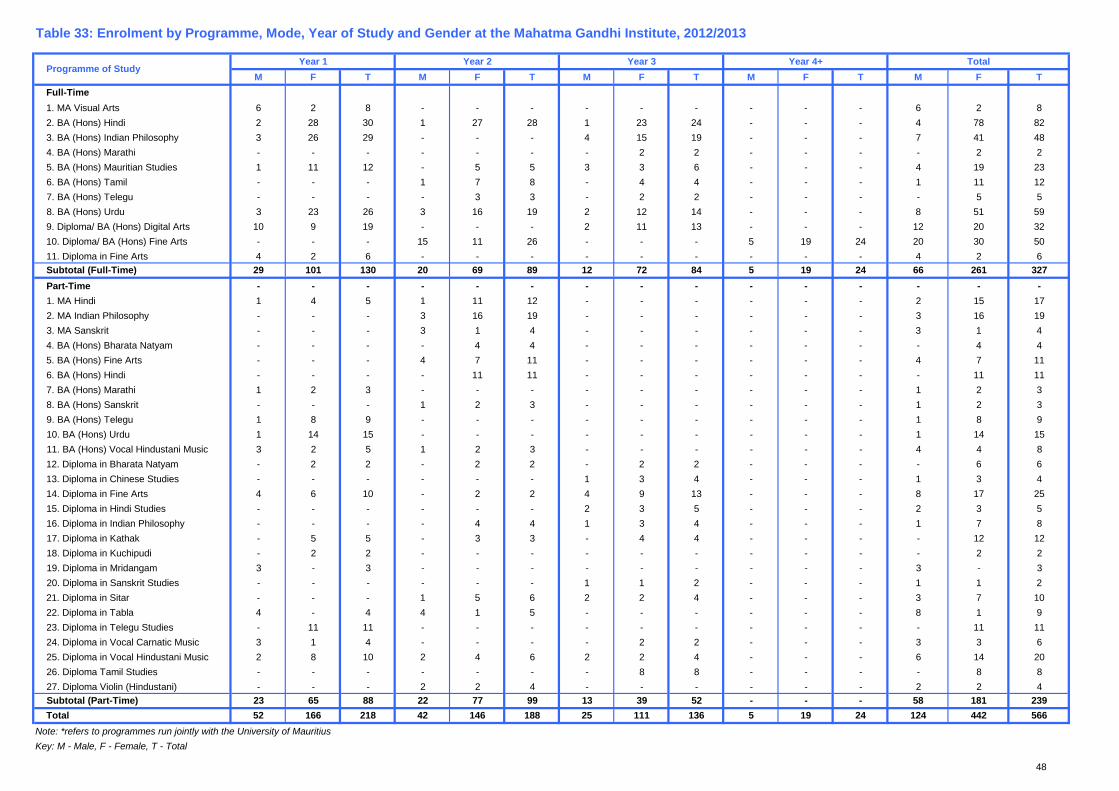
48
Table 33: Enrolment by Programme, Mode, Year of Study and Gender at the Mahatma Gandhi Institute, 2012/2013
M F T M F T M F T M F T M F TFull-Time 1. MA Visual Arts 6 2 8 - - - - - - - - - 6 2 82. BA (Hons) Hindi 2 28 30 1 27 28 1 23 24 - - - 4 78 823. BA (Hons) Indian Philosophy 3 26 29 - - - 4 15 19 - - - 7 41 484. BA (Hons) Marathi - - - - - - - 2 2 - - - - 2 25. BA (Hons) Mauritian Studies 1 11 12 - 5 5 3 3 6 - - - 4 19 236. BA (Hons) Tamil - - - 1 7 8 - 4 4 - - - 1 11 127. BA (Hons) Telegu - - - - 3 3 - 2 2 - - - - 5 58. BA (Hons) Urdu 3 23 26 3 16 19 2 12 14 - - - 8 51 599. Diploma/ BA (Hons) Digital Arts 10 9 19 - - - 2 11 13 - - - 12 20 3210. Diploma/ BA (Hons) Fine Arts - - - 15 11 26 - - - 5 19 24 20 30 5011. Diploma in Fine Arts 4 2 6 - - - - - - - - - 4 2 6Subtotal (Full-Time) 29 101 130 20 69 89 12 72 84 5 19 24 66 261 327Part-Time - - - - - - - - - - - - - - -1. MA Hindi 1 4 5 1 11 12 - - - - - - 2 15 172. MA Indian Philosophy - - - 3 16 19 - - - - - - 3 16 193. MA Sanskrit - - - 3 1 4 - - - - - - 3 1 44. BA (Hons) Bharata Natyam - - - - 4 4 - - - - - - - 4 45. BA (Hons) Fine Arts - - - 4 7 11 - - - - - - 4 7 116. BA (Hons) Hindi - - - - 11 11 - - - - - - - 11 117. BA (Hons) Marathi 1 2 3 - - - - - - - - - 1 2 38. BA (Hons) Sanskrit - - - 1 2 3 - - - - - - 1 2 39. BA (Hons) Telegu 1 8 9 - - - - - - - - - 1 8 910. BA (Hons) Urdu 1 14 15 - - - - - - - - - 1 14 1511. BA (Hons) Vocal Hindustani Music 3 2 5 1 2 3 - - - - - - 4 4 812. Diploma in Bharata Natyam - 2 2 - 2 2 - 2 2 - - - - 6 613. Diploma in Chinese Studies - - - - - - 1 3 4 - - - 1 3 414. Diploma in Fine Arts 4 6 10 - 2 2 4 9 13 - - - 8 17 2515. Diploma in Hindi Studies - - - - - - 2 3 5 - - - 2 3 516. Diploma in Indian Philosophy - - - - 4 4 1 3 4 - - - 1 7 817. Diploma in Kathak - 5 5 - 3 3 - 4 4 - - - - 12 1218. Diploma in Kuchipudi - 2 2 - - - - - - - - - - 2 219. Diploma in Mridangam 3 - 3 - - - - - - - - - 3 - 320. Diploma in Sanskrit Studies - - - - - - 1 1 2 - - - 1 1 221. Diploma in Sitar - - - 1 5 6 2 2 4 - - - 3 7 1022. Diploma in Tabla 4 - 4 4 1 5 - - - - - - 8 1 923. Diploma in Telegu Studies - 11 11 - - - - - - - - - - 11 1124. Diploma in Vocal Carnatic Music 3 1 4 - - - - 2 2 - - - 3 3 625. Diploma in Vocal Hindustani Music 2 8 10 2 4 6 2 2 4 - - - 6 14 2026. Diploma Tamil Studies - - - - - - - 8 8 - - - - 8 827. Diploma Violin (Hindustani) - - - 2 2 4 - - - - - - 2 2 4Subtotal (Part-Time) 23 65 88 22 77 99 13 39 52 - - - 58 181 239Total 52 166 218 42 146 188 25 111 136 5 19 24 124 442 566
Note: *refers to programmes run jointly with the University of MauritiusKey: M - Male, F - Female, T - Total
Programme of StudyYear 1 Year 2 Year 3 TotalYear 4+
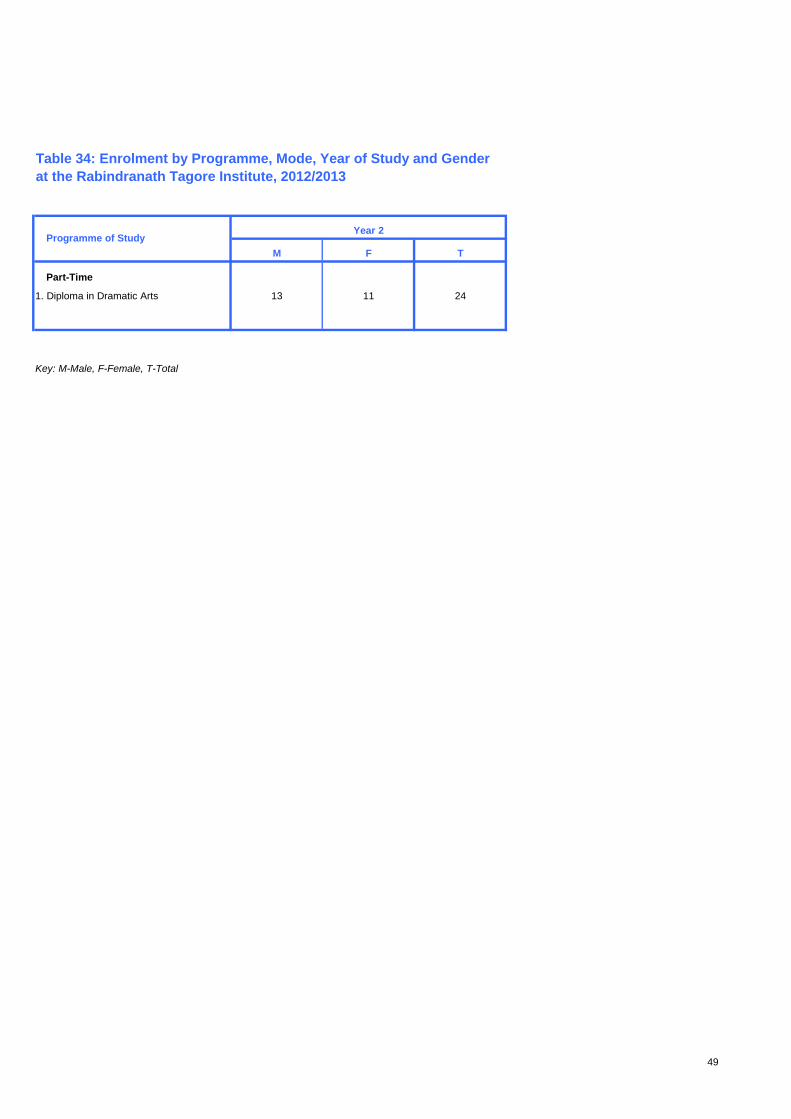
49
M F T
Part-Time
1. Diploma in Dramatic Arts 13 11 24
Key: M-Male, F-Female, T-Total
Programme of StudyYear 2
Table 34: Enrolment by Programme, Mode, Year of Study and Gender at the Rabindranath Tagore Institute, 2012/2013
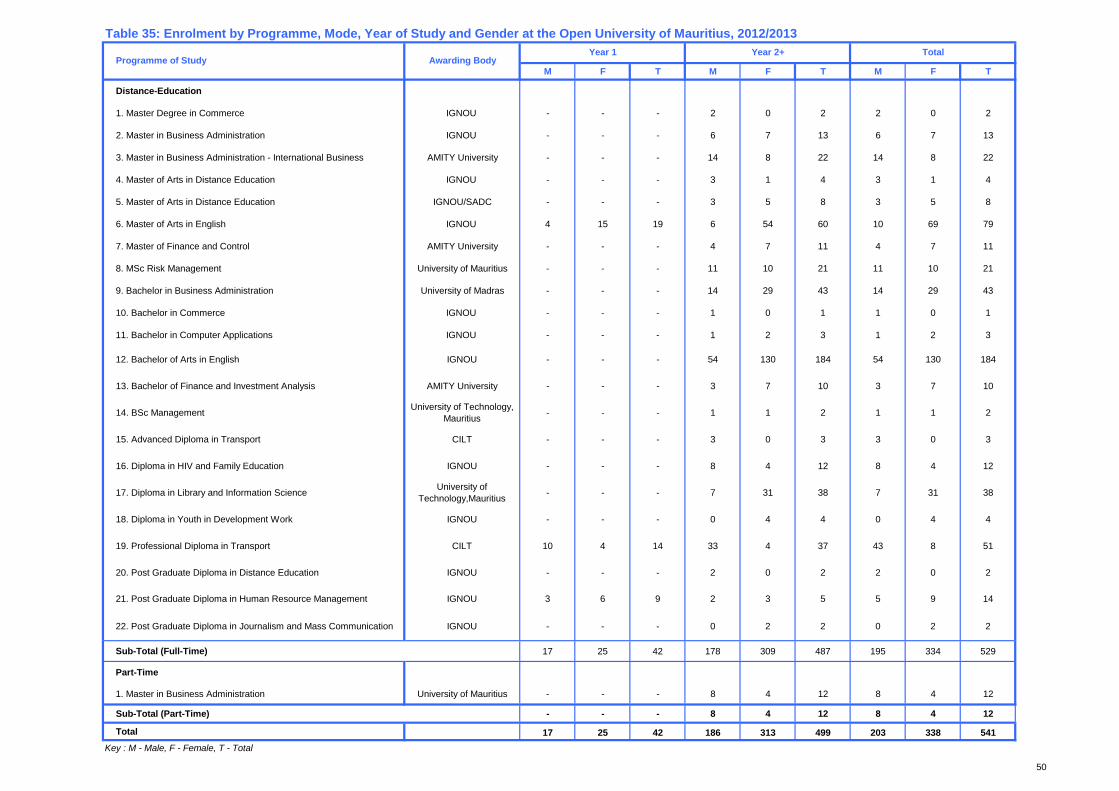
50
M F T M F T M F T
Distance-Education
1. Master Degree in Commerce IGNOU - - - 2 0 2 2 0 2
2. Master in Business Administration IGNOU - - - 6 7 13 6 7 13
3. Master in Business Administration - International Business AMITY University - - - 14 8 22 14 8 22
4. Master of Arts in Distance Education IGNOU - - - 3 1 4 3 1 4
5. Master of Arts in Distance Education IGNOU/SADC - - - 3 5 8 3 5 8
6. Master of Arts in English IGNOU 4 15 19 6 54 60 10 69 79
7. Master of Finance and Control AMITY University - - - 4 7 11 4 7 11
8. MSc Risk Management University of Mauritius - - - 11 10 21 11 10 21
9. Bachelor in Business Administration University of Madras - - - 14 29 43 14 29 43
10. Bachelor in Commerce IGNOU - - - 1 0 1 1 0 1
11. Bachelor in Computer Applications IGNOU - - - 1 2 3 1 2 3
12. Bachelor of Arts in English IGNOU - - - 54 130 184 54 130 184
13. Bachelor of Finance and Investment Analysis AMITY University - - - 3 7 10 3 7 10
14. BSc Management University of Technology, Mauritius - - - 1 1 2 1 1 2
15. Advanced Diploma in Transport CILT - - - 3 0 3 3 0 3
16. Diploma in HIV and Family Education IGNOU - - - 8 4 12 8 4 12
17. Diploma in Library and Information Science University of Technology,Mauritius - - - 7 31 38 7 31 38
18. Diploma in Youth in Development Work IGNOU - - - 0 4 4 0 4 4
19. Professional Diploma in Transport CILT 10 4 14 33 4 37 43 8 51
20. Post Graduate Diploma in Distance Education IGNOU - - - 2 0 2 2 0 2
21. Post Graduate Diploma in Human Resource Management IGNOU 3 6 9 2 3 5 5 9 14
22. Post Graduate Diploma in Journalism and Mass Communication IGNOU - - - 0 2 2 0 2 2
Sub-Total (Full-Time) 17 25 42 178 309 487 195 334 529
Part-Time
1. Master in Business Administration University of Mauritius - - - 8 4 12 8 4 12
Sub-Total (Part-Time) - - - 8 4 12 8 4 12
Total 17 25 42 186 313 499 203 338 541Key : M - Male, F - Female, T - Total
Table 35: Enrolment by Programme, Mode, Year of Study and Gender at the Open University of Mauritius, 2012/2013Year 2+Year 1 Total
Awarding BodyProgramme of Study
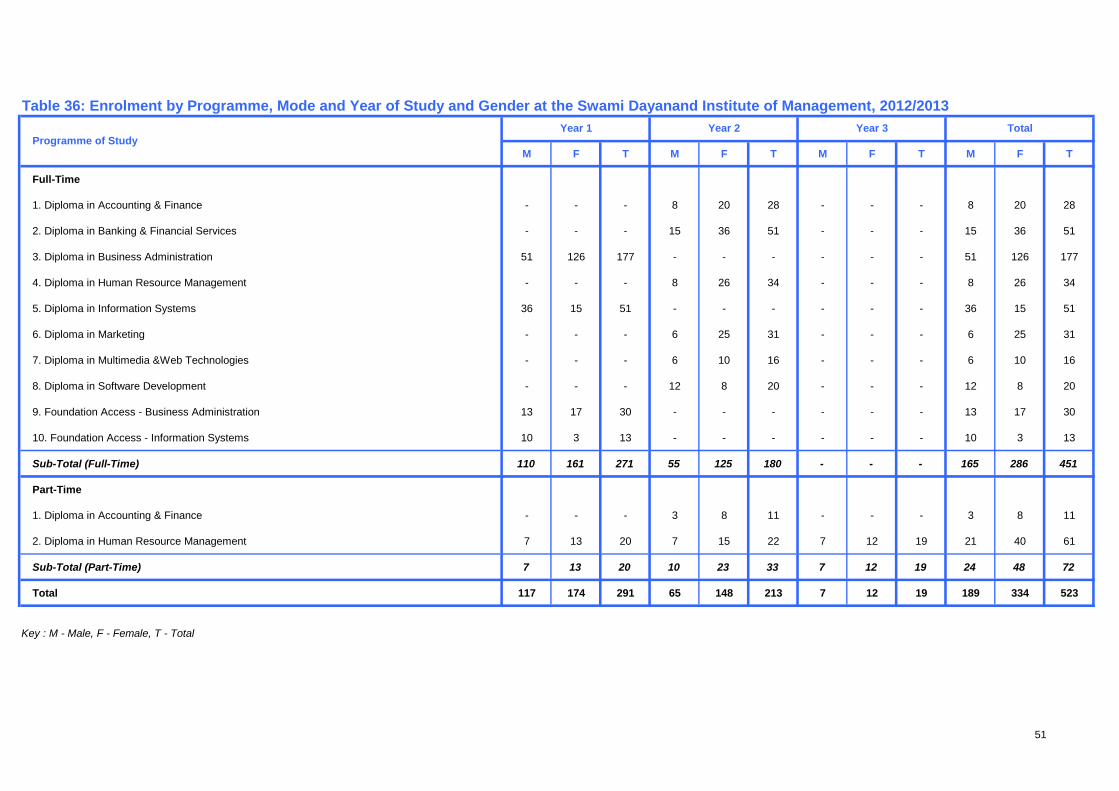
51
M F T M F T M F T M F T
Full-Time
1. Diploma in Accounting & Finance - - - 8 20 28 - - - 8 20 28
2. Diploma in Banking & Financial Services - - - 15 36 51 - - - 15 36 51
3. Diploma in Business Administration 51 126 177 - - - - - - 51 126 177
4. Diploma in Human Resource Management - - - 8 26 34 - - - 8 26 34
5. Diploma in Information Systems 36 15 51 - - - - - - 36 15 51
6. Diploma in Marketing - - - 6 25 31 - - - 6 25 31
7. Diploma in Multimedia &Web Technologies - - - 6 10 16 - - - 6 10 16
8. Diploma in Software Development - - - 12 8 20 - - - 12 8 20
9. Foundation Access - Business Administration 13 17 30 - - - - - - 13 17 30
10. Foundation Access - Information Systems 10 3 13 - - - - - - 10 3 13
Sub-Total (Full-Time) 110 161 271 55 125 180 - - - 165 286 451
Part-Time
1. Diploma in Accounting & Finance - - - 3 8 11 - - - 3 8 11
2. Diploma in Human Resource Management 7 13 20 7 15 22 7 12 19 21 40 61
Sub-Total (Part-Time) 7 13 20 10 23 33 7 12 19 24 48 72
Total 117 174 291 65 148 213 7 12 19 189 334 523
Table 36: Enrolment by Programme, Mode and Year of Study and Gender at the Swami Dayanand Institute of Management, 2012/2013
Programme of Study
Key : M - Male, F - Female, T - Total
Year 1 Year 2 Year 3 Total
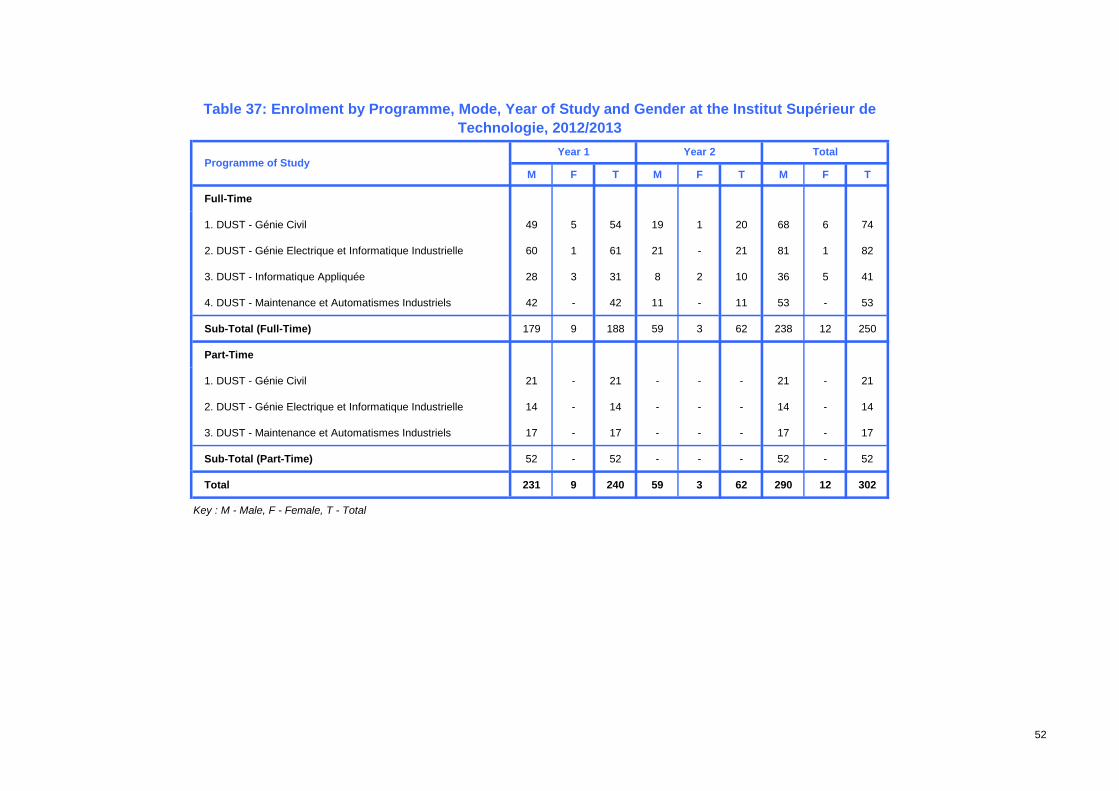
52
M F T M F T M F T
Full-Time
1. DUST - Génie Civil 49 5 54 19 1 20 68 6 74
2. DUST - Génie Electrique et Informatique Industrielle 60 1 61 21 - 21 81 1 82
3. DUST - Informatique Appliquée 28 3 31 8 2 10 36 5 41
4. DUST - Maintenance et Automatismes Industriels 42 - 42 11 - 11 53 - 53
Sub-Total (Full-Time) 179 9 188 59 3 62 238 12 250
Part-Time
1. DUST - Génie Civil 21 - 21 - - - 21 - 21
2. DUST - Génie Electrique et Informatique Industrielle 14 - 14 - - - 14 - 14
3. DUST - Maintenance et Automatismes Industriels 17 - 17 - - - 17 - 17
Sub-Total (Part-Time) 52 - 52 - - - 52 - 52
Total 231 9 240 59 3 62 290 12 302
Key : M - Male, F - Female, T - Total
Total
Table 37: Enrolment by Programme, Mode, Year of Study and Gender at the Institut Supérieur de Technologie, 2012/2013
Year 1 Year 2Programme of Study
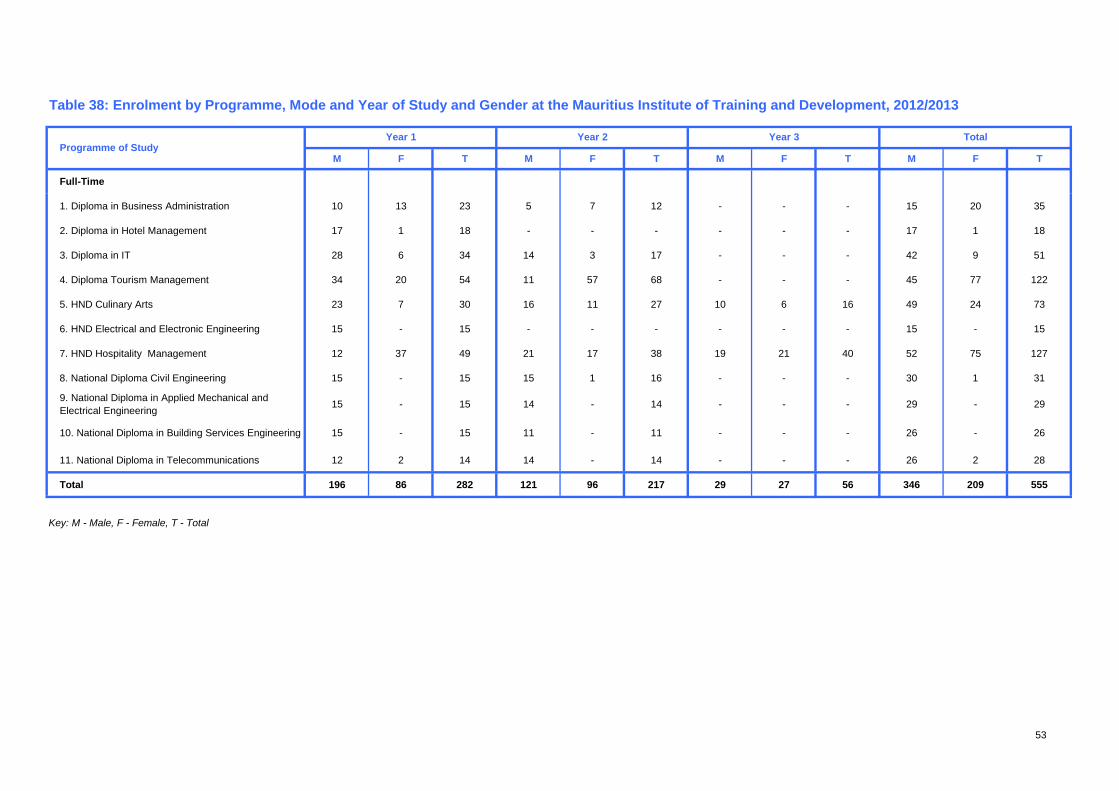
53
M F T M F T M F T M F T
Full-Time
1. Diploma in Business Administration 10 13 23 5 7 12 - - - 15 20 35
2. Diploma in Hotel Management 17 1 18 - - - - - - 17 1 18
3. Diploma in IT 28 6 34 14 3 17 - - - 42 9 51
4. Diploma Tourism Management 34 20 54 11 57 68 - - - 45 77 122
5. HND Culinary Arts 23 7 30 16 11 27 10 6 16 49 24 73
6. HND Electrical and Electronic Engineering 15 - 15 - - - - - - 15 - 15
7. HND Hospitality Management 12 37 49 21 17 38 19 21 40 52 75 127
8. National Diploma Civil Engineering 15 - 15 15 1 16 - - - 30 1 31
9. National Diploma in Applied Mechanical and Electrical Engineering 15 - 15 14 - 14 - - - 29 - 29
10. National Diploma in Building Services Engineering 15 - 15 11 - 11 - - - 26 - 26
11. National Diploma in Telecommunications 12 2 14 14 - 14 - - - 26 2 28
Total 196 86 282 121 96 217 29 27 56 346 209 555
Key: M - Male, F - Female, T - Total
Table 38: Enrolment by Programme, Mode and Year of Study and Gender at the Mauritius Institute of Training and Development, 2012/2013
Programme of Study Year 1 Year 2 TotalYear 3
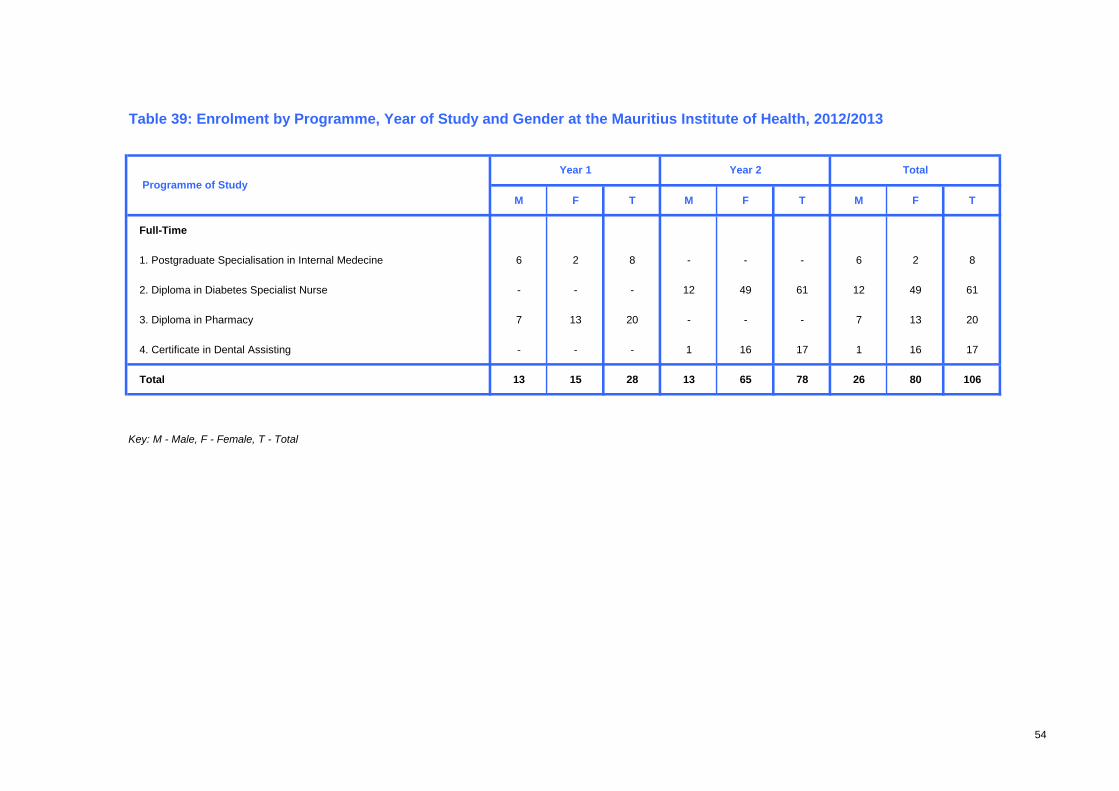
54
M F T M F T M F T
Full-Time
1. Postgraduate Specialisation in Internal Medecine 6 2 8 - - - 6 2 8
2. Diploma in Diabetes Specialist Nurse - - - 12 49 61 12 49 61
3. Diploma in Pharmacy 7 13 20 - - - 7 13 20
4. Certificate in Dental Assisting - - - 1 16 17 1 16 17
Total 13 15 28 13 65 78 26 80 106
Table 39: Enrolment by Programme, Year of Study and Gender at the Mauritius Institute of Health, 2012/2013
Key: M - Male, F - Female, T - Total
Total Programme of Study
Year 1 Year 2
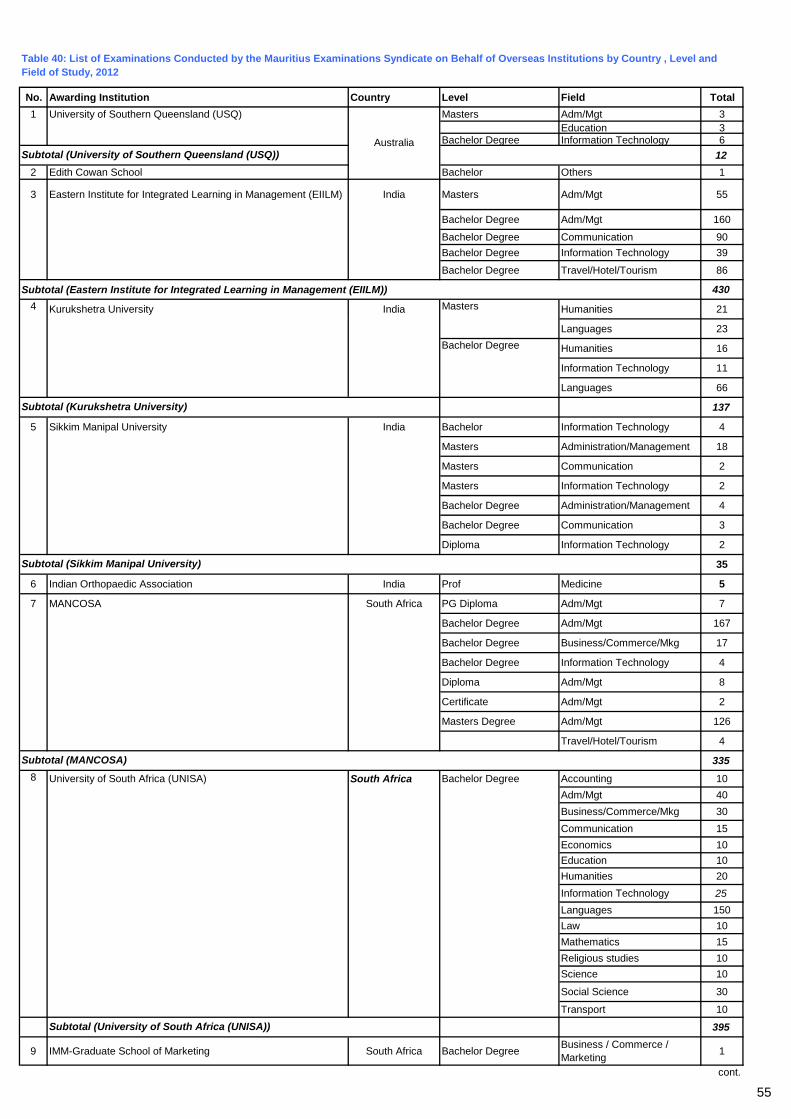
55
No. Awarding Institution Country Level Field Total1 University of Southern Queensland (USQ) Masters Adm/Mgt 3
Education 3Bachelor Degree Information Technology 6
122 Edith Cowan School Bachelor Others 1
3 Eastern Institute for Integrated Learning in Management (EIILM) India Masters Adm/Mgt 55
Bachelor Degree Adm/Mgt 160
Bachelor Degree Communication 90Bachelor Degree Information Technology 39
Bachelor Degree Travel/Hotel/Tourism 86
Subtotal (Eastern Institute for Integrated Learning in Management (EIILM)) 430
Kurukshetra University India Humanities 21
Languages 23
Humanities 16
Information Technology 11
Languages 66
137
5 Sikkim Manipal University India Bachelor Information Technology 4
Masters Administration/Management 18
Masters Communication 2
Masters Information Technology 2
Bachelor Degree Administration/Management 4
Bachelor Degree Communication 3
Diploma Information Technology 2
35
6 Indian Orthopaedic Association India Prof Medicine 5
7 MANCOSA South Africa PG Diploma Adm/Mgt 7
Bachelor Degree Adm/Mgt 167
Bachelor Degree Business/Commerce/Mkg 17
Bachelor Degree Information Technology 4
Diploma Adm/Mgt 8
Certificate Adm/Mgt 2
Masters Degree Adm/Mgt 126
Travel/Hotel/Tourism 4
335University of South Africa (UNISA) South Africa Bachelor Degree Accounting 10
Adm/Mgt 40Business/Commerce/Mkg 30Communication 15Economics 10Education 10Humanities 20Information Technology 25Languages 150Law 10Mathematics 15Religious studies 10Science 10
Social Science 30
Transport 10
395
9 IMM-Graduate School of Marketing South Africa Bachelor Degree Business / Commerce / Marketing 1
cont.
Bachelor Degree
8
Subtotal (Kurukshetra University)
4
Subtotal (University of South Africa (UNISA))
Table 40: List of Examinations Conducted by the Mauritius Examinations Syndicate on Behalf of Overseas Institutions by Country , Level and Field of Study, 2012
Subtotal (University of Southern Queensland (USQ))Australia
Subtotal (Sikkim Manipal University)
Subtotal (MANCOSA)
Masters
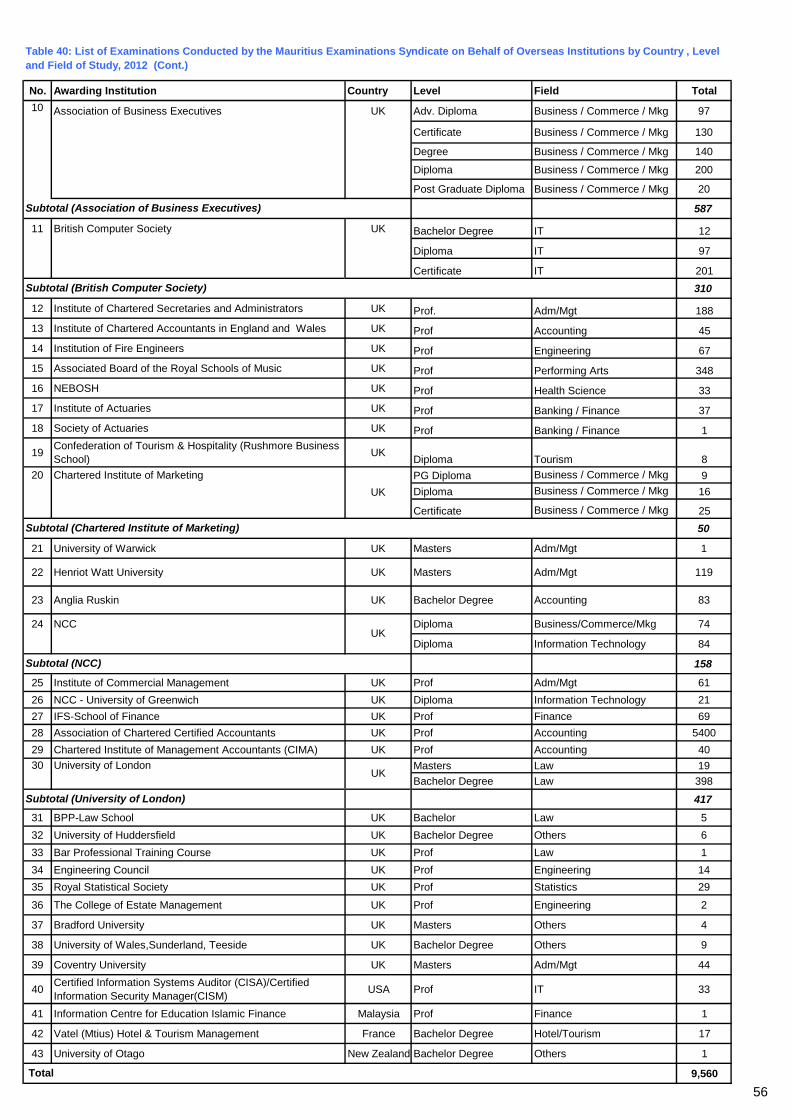
56
No. Awarding Institution Country Level Field Total
Association of Business Executives UK Adv. Diploma Business / Commerce / Mkg 97
Certificate Business / Commerce / Mkg 130
Degree Business / Commerce / Mkg 140
Diploma Business / Commerce / Mkg 200
Post Graduate Diploma Business / Commerce / Mkg 20
587
11 British Computer Society UK Bachelor Degree IT 12
Diploma IT 97
Certificate IT 201310
12 Institute of Chartered Secretaries and Administrators UK Prof. Adm/Mgt 18813 Institute of Chartered Accountants in England and Wales UK Prof Accounting 4514 Institution of Fire Engineers UK Prof Engineering 6715 Associated Board of the Royal Schools of Music UK Prof Performing Arts 34816 NEBOSH UK Prof Health Science 3317 Institute of Actuaries UK Prof Banking / Finance 3718 Society of Actuaries UK Prof Banking / Finance 1
19 Confederation of Tourism & Hospitality (Rushmore Business School) UK Diploma Tourism 8
20 Chartered Institute of Marketing PG Diploma Business / Commerce / Mkg 9Diploma Business / Commerce / Mkg 16
Certificate Business / Commerce / Mkg 2550
21 University of Warwick UK Masters Adm/Mgt 1
22 Henriot Watt University UK Masters Adm/Mgt 119
23 Anglia Ruskin UK Bachelor Degree Accounting 83
24 NCC Diploma Business/Commerce/Mkg 74
Diploma Information Technology 84
158
25 Institute of Commercial Management UK Prof Adm/Mgt 6126 NCC - University of Greenwich UK Diploma Information Technology 2127 IFS-School of Finance UK Prof Finance 6928 Association of Chartered Certified Accountants UK Prof Accounting 540029 Chartered Institute of Management Accountants (CIMA) UK Prof Accounting 40
Masters Law 19Bachelor Degree Law 398
41731 BPP-Law School UK Bachelor Law 532 University of Huddersfield UK Bachelor Degree Others 633 Bar Professional Training Course UK Prof Law 134 Engineering Council UK Prof Engineering 1435 Royal Statistical Society UK Prof Statistics 29
36 The College of Estate Management UK Prof Engineering 2
37 Bradford University UK Masters Others 4
38 University of Wales,Sunderland, Teeside UK Bachelor Degree Others 9
39 Coventry University UK Masters Adm/Mgt 44
40 Certified Information Systems Auditor (CISA)/Certified Information Security Manager(CISM) USA Prof IT 33
41 Information Centre for Education Islamic Finance Malaysia Prof Finance 1
42 Vatel (Mtius) Hotel & Tourism Management France Bachelor Degree Hotel/Tourism 17
43 University of Otago New Zealand Bachelor Degree Others 1
9,560
UK
Table 40: List of Examinations Conducted by the Mauritius Examinations Syndicate on Behalf of Overseas Institutions by Country , Level and Field of Study, 2012 (Cont.)
Total
Subtotal (University of London)
University of London30
Subtotal (Chartered Institute of Marketing)
Subtotal (British Computer Society)
Subtotal (Association of Business Executives)
Subtotal (NCC)
10
UK
UK
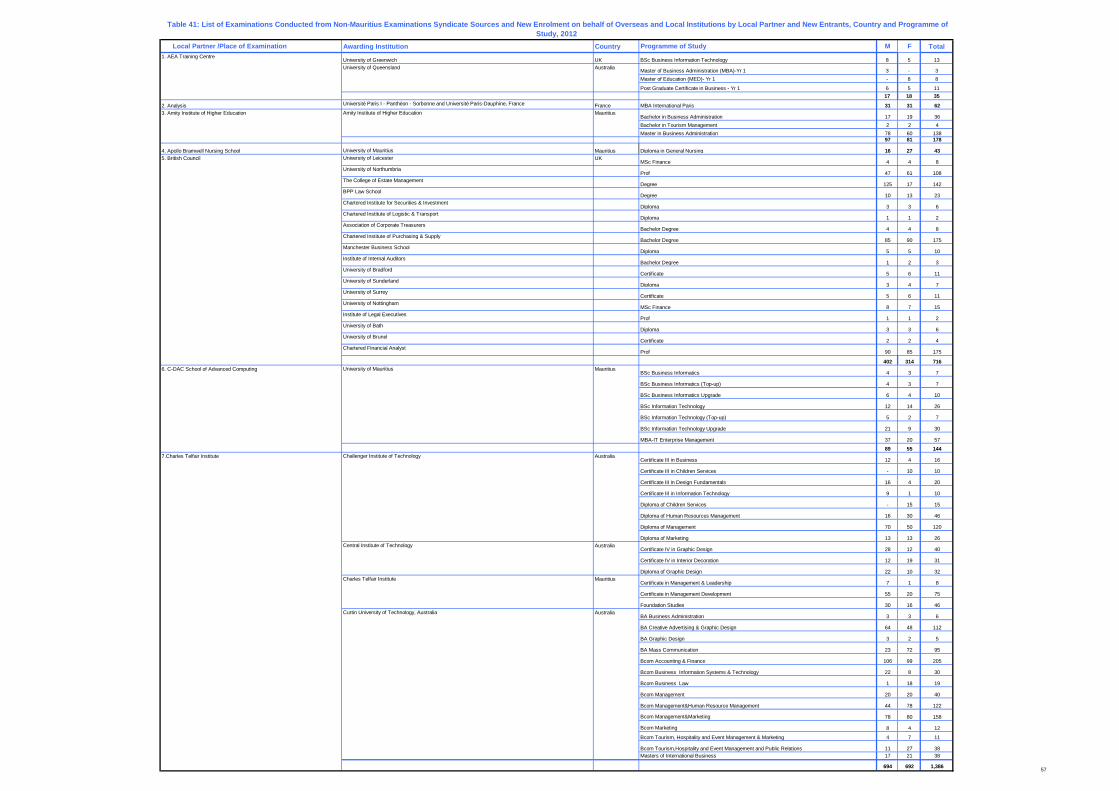
57
Local Partner /Place of Examination Awarding Institution Country Programme of Study M F Total1. AEA Training Centre
University of Greenwich UK BSc Business Information Technology 8 5 13
Master of Business Administration (MBA)-Yr 1 3 - 3Master of Education (MED)- Yr 1 - 8 8
Post Graduate Certificate in Business - Yr 1 6 5 1117 18 35
2. Analysis Université Paris I - Panthéon - Sorbonne and Université Paris-Dauphine, France France MBA International Paris 31 31 62
Bachelor in Business Administration 17 19 36Bachelor in Tourism Management 2 2 4Master in Business Administration 78 60 138
97 81 178
4. Apollo Bramwell Nursing School University of Mauritius Mauritius Diploma in General Nursing 16 27 43University of Leicester UK
MSc Finance 4 4 8University of Northumbria
Prof 47 61 108The College of Estate Management
Degree 125 17 142BPP Law School
Degree 10 13 23Chartered Institute for Securities & Investment
Diploma 3 3 6Chartered Institute of Logistic & Transport
Diploma 1 1 2Association of Corporate Treasurers
Bachelor Degree 4 4 8Chartered Institute of Purchasing & Supply
Bachelor Degree 85 90 175Manchester Business School
Diploma 5 5 10Institute of Internal Auditors
Bachelor Degree 1 2 3University of Bradford
Certificate 5 6 11University of Sunderland
Diploma 3 4 7University of Surrey
Certificate 5 6 11University of Nottingham
MSc Finance 8 7 15Institute of Legal Executives
Prof 1 1 2University of Bath
Diploma 3 3 6University of Brunel
Certificate 2 2 4Chartered Financial Analyst
Prof 90 85 175
402 314 716
BSc Business Informatics 4 3 7
BSc Business Informatics (Top-up) 4 3 7
BSc Business Informatics Upgrade 6 4 10
BSc Information Technology 12 14 26
BSc Information Technology (Top-up) 5 2 7
BSc Information Technology Upgrade 21 9 30
MBA-IT Enterprise Management 37 20 57
89 55 144
Certificate III in Business 12 4 16
Certificate III in Children Services - 10 10
Certificate III in Design Fundamentals 16 4 20
Certificate III in Information Technology 9 1 10
Diploma of Children Services - 15 15
Diploma of Human Resources Management 16 30 46
Diploma of Management 70 50 120
Diploma of Marketing 13 13 26Central Institute of Technology Australia
Certificate IV in Graphic Design 28 12 40
Certificate IV in Interior Decoration 12 19 31
Diploma of Graphic Design 22 10 32Mauritius
Certificate in Management & Leadership 7 1 8
Certificate in Management Development 55 20 75
Foundation Studies 30 16 46Curtin University of Technology, Australia Australia
BA Business Administration 3 3 6
BA Creative Advertising & Graphic Design 64 48 112
BA Graphic Design 3 2 5
BA Mass Communication 23 72 95
Bcom Accounting & Finance 106 99 205
Bcom Business Information Systems & Technology 22 8 30
Bcom Business Law 1 18 19
Bcom Management 20 20 40
Bcom Management&Human Resource Management 44 78 122
Bcom Management&Marketing 78 80 158
Bcom Marketing 8 4 12
Bcom Tourism, Hospitality and Event Management & Marketing 4 7 11
Bcom Tourism,Hospitality and Event Management and Public Relations 11 27 38Masters of International Business 17 21 38
694 692 1,386
Mauritius
University of Queensland
7.Charles Telfair Institute
5. British Council
Table 41: List of Examinations Conducted from Non-Mauritius Examinations Syndicate Sources and New Enrolment on behalf of Overseas and Local Institutions by Local Partner and New Entrants, Country and Programme of Study, 2012
Challenger Institute of Technology Australia
Charles Telfair Institute
6. C-DAC School of Advanced Computing University of Mauritius
Australia
MauritiusAmity Institute of Higher Education3. Amity Institute of Higher Education
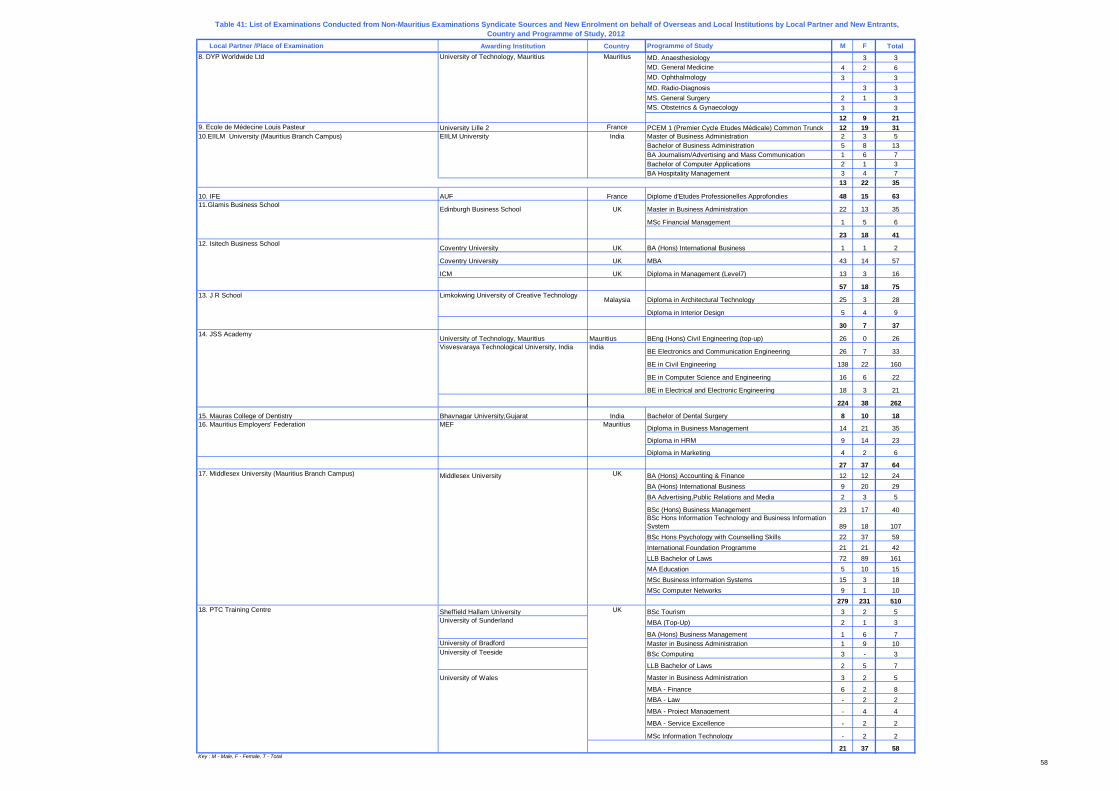
58
Local Partner /Place of Examination Awarding Institution Country Programme of Study M F TotalMD. Anaesthesiology 3 3MD. General Medicine 4 2 6MD. Ophthalmology 3 3MD. Radio-Diagnosis 3 3MS. General Surgery 2 1 3MS. Obstetrics & Gynaecology 3 3
12 9 219. Ecole de Médecine Louis Pasteur University Lille 2 France PCEM 1 (Premier Cycle Etudes Médicale) Common Trunck 12 19 31
Master of Business Administration 2 3 5Bachelor of Business Administration 5 8 13BA Journalism/Advertising and Mass Communication 1 6 7Bachelor of Computer Applications 2 1 3BA Hospitality Management 3 4 7
13 22 35
10. IFE AUF France Diplome d'Etudes Professionelles Approfondies 48 15 63
Edinburgh Business School UK Master in Business Administration 22 13 35
MSc Financial Management 1 5 6
23 18 41
Coventry University UK BA (Hons) International Business 1 1 2
Coventry University UK MBA 43 14 57
ICM UK Diploma in Management (Level7) 13 3 16
57 18 75
Malaysia Diploma in Architectural Technology 25 3 28
Diploma in Interior Design 5 4 9
30 7 37
University of Technology, Mauritius Mauritius BEng (Hons) Civil Engineering (top-up) 26 0 26
BE Electronics and Communication Engineering 26 7 33
BE in Civil Engineering 138 22 160
BE in Computer Science and Engineering 16 6 22
BE in Electrical and Electronic Engineering 18 3 21
224 38 262
15. Mauras College of Dentistry Bhavnagar University,Gujarat India Bachelor of Dental Surgery 8 10 18
Diploma in Business Management 14 21 35
Diploma in HRM 9 14 23
Diploma in Marketing 4 2 6
27 37 64Middlesex University BA (Hons) Accounting & Finance 12 12 24
BA (Hons) International Business 9 20 29BA Advertising,Public Relations and Media 2 3 5
BSc (Hons) Business Management 23 17 40BSc Hons Information Technology and Business Information System 89 18 107BSc Hons Psychology with Counselling Skills 22 37 59International Foundation Programme 21 21 42LLB Bachelor of Laws 72 89 161MA Education 5 10 15MSc Business Information Systems 15 3 18MSc Computer Networks 9 1 10
279 231 51018. PTC Training Centre Sheffield Hallam University BSc Tourism 3 2 5
MBA (Top-Up) 2 1 3
BA (Hons) Business Management 1 6 7University of Bradford Master in Business Administration 1 9 10
BSc Computing 3 - 3
LLB Bachelor of Laws 2 5 7
University of Wales Master in Business Administration 3 2 5
MBA - Finance 6 2 8MBA - Law - 2 2
MBA - Project Management - 4 4
MBA - Service Excellence - 2 2
MSc Information Technology - 2 2
21 37 58Key : M - Male, F - Female, T - Total
India10.EIILM University (Mauritius Branch Campus) EIILM University
16. Mauritius Employers' Federation MEF
UK
Limkokwing University of Creative Technology
11.Glamis Business School
University of Sunderland
University of Teeside
17. Middlesex University (Mauritius Branch Campus) UK
Mauritius
India
Mauritius
Visvesvaraya Technological University, India
Table 41: List of Examinations Conducted from Non-Mauritius Examinations Syndicate Sources and New Enrolment on behalf of Overseas and Local Institutions by Local Partner and New Entrants, Country and Programme of Study, 2012
13. J R School
8. DYP Worldwide Ltd
14. JSS Academy
12. Isitech Business School
University of Technology, Mauritius
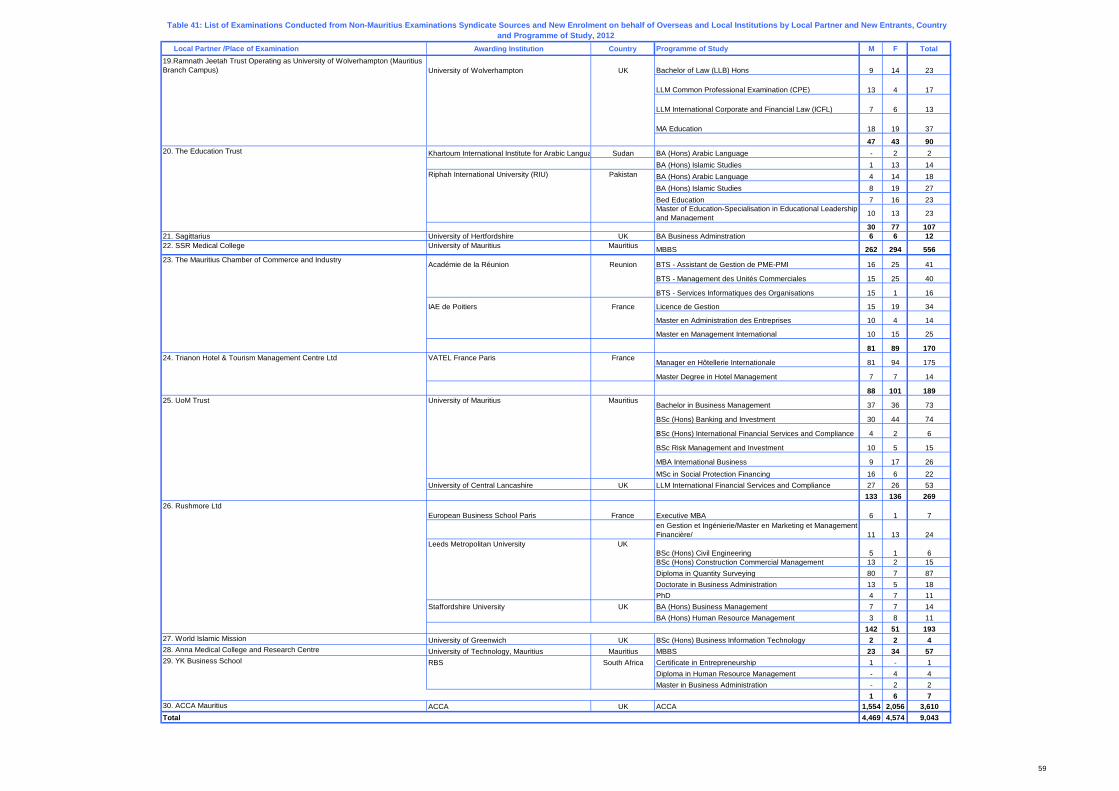
59
Local Partner /Place of Examination Awarding Institution Country Programme of Study M F Total19.Ramnath Jeetah Trust Operating as University of Wolverhampton (Mauritius Branch Campus) University of Wolverhampton UK Bachelor of Law (LLB) Hons 9 14 23
LLM Common Professional Examination (CPE) 13 4 17
LLM International Corporate and Financial Law (ICFL) 7 6 13
MA Education 18 19 37
47 43 90Khartoum International Institute for Arabic Langua Sudan BA (Hons) Arabic Language - 2 2
BA (Hons) Islamic Studies 1 13 14BA (Hons) Arabic Language 4 14 18BA (Hons) Islamic Studies 8 19 27Bed Education 7 16 23Master of Education-Specialisation in Educational Leadership and Management 10 13 23
30 77 10721. Sagittarius University of Hertfordshire UK BA Business Adminstration 6 6 1222. SSR Medical College University of Mauritius Mauritius MBBS 262 294 556
Académie de la Réunion Reunion BTS - Assistant de Gestion de PME-PMI 16 25 41
BTS - Management des Unités Commerciales 15 25 40
BTS - Services Informatiques des Organisations 15 1 16
IAE de Poitiers France Licence de Gestion 15 19 34
Master en Administration des Entreprises 10 4 14
Master en Management International 10 15 25
81 89 170
Manager en Hôtellerie Internationale 81 94 175
Master Degree in Hotel Management 7 7 14
88 101 189
Bachelor in Business Management 37 36 73
BSc (Hons) Banking and Investment 30 44 74
BSc (Hons) International Financial Services and Compliance 4 2 6
BSc Risk Management and Investment 10 5 15
MBA International Business 9 17 26MSc in Social Protection Financing 16 6 22
University of Central Lancashire UK LLM International Financial Services and Compliance 27 26 53133 136 269
European Business School Paris France Executive MBA 6 1 7 en Gestion et Ingénierie/Master en Marketing et Management Financière/ 11 13 24
BSc (Hons) Civil Engineering 5 1 6BSc (Hons) Construction Commercial Management 13 2 15Diploma in Quantity Surveying 80 7 87Doctorate in Business Administration 13 5 18PhD 4 7 11
Staffordshire University UK BA (Hons) Business Management 7 7 14BA (Hons) Human Resource Management 3 8 11
142 51 19327. World Islamic Mission University of Greenwich UK BSc (Hons) Business Information Technology 2 2 428. Anna Medical College and Research Centre University of Technology, Mauritius Mauritius MBBS 23 34 57
RBS South Africa Certificate in Entrepreneurship 1 - 1Diploma in Human Resource Management - 4 4Master in Business Administration - 2 2
1 6 730. ACCA Mauritius ACCA UK ACCA 1,554 2,056 3,610Total 4,469 4,574 9,043
26. Rushmore Ltd
Leeds Metropolitan University UK
24. Trianon Hotel & Tourism Management Centre Ltd
20. The Education Trust
Riphah International University (RIU) Pakistan
VATEL France Paris France
29. YK Business School
Table 41: List of Examinations Conducted from Non-Mauritius Examinations Syndicate Sources and New Enrolment on behalf of Overseas and Local Institutions by Local Partner and New Entrants, Country and Programme of Study, 2012
23. The Mauritius Chamber of Commerce and Industry
25. UoM Trust University of Mauritius Mauritius
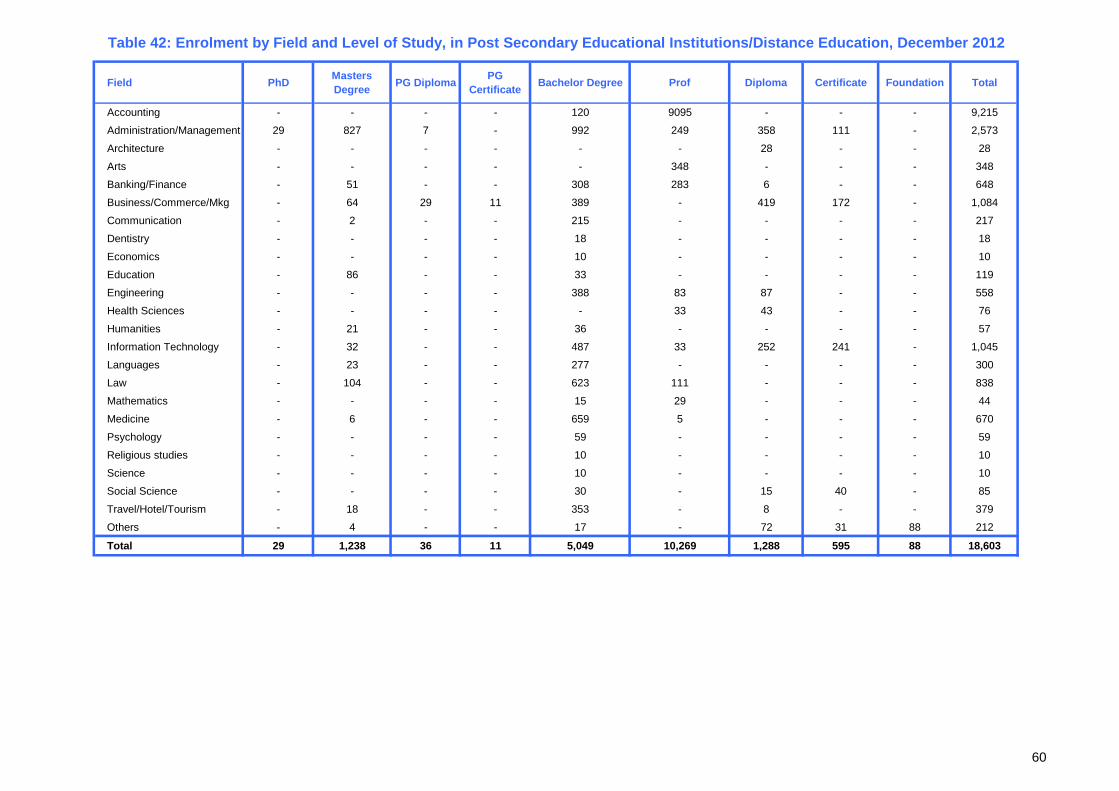
60
Field PhD Masters Degree PG Diploma PG
Certificate Bachelor Degree Prof Diploma Certificate Foundation Total
Accounting - - - - 120 9095 - - - 9,215
Administration/Management 29 827 7 - 992 249 358 111 - 2,573
Architecture - - - - - - 28 - - 28
Arts - - - - - 348 - - - 348
Banking/Finance - 51 - - 308 283 6 - - 648
Business/Commerce/Mkg - 64 29 11 389 - 419 172 - 1,084
Communication - 2 - - 215 - - - - 217
Dentistry - - - - 18 - - - - 18
Economics - - - - 10 - - - - 10
Education - 86 - - 33 - - - - 119
Engineering - - - - 388 83 87 - - 558
Health Sciences - - - - - 33 43 - - 76
Humanities - 21 - - 36 - - - - 57
Information Technology - 32 - - 487 33 252 241 - 1,045
Languages - 23 - - 277 - - - - 300
Law - 104 - - 623 111 - - - 838
Mathematics - - - - 15 29 - - - 44
Medicine - 6 - - 659 5 - - - 670
Psychology - - - - 59 - - - - 59
Religious studies - - - - 10 - - - - 10
Science - - - - 10 - - - - 10
Social Science - - - - 30 - 15 40 - 85
Travel/Hotel/Tourism - 18 - - 353 - 8 - - 379
Others - 4 - - 17 - 72 31 88 212
Total 29 1,238 36 11 5,049 10,269 1,288 595 88 18,603
Table 42: Enrolment by Field and Level of Study, in Post Secondary Educational Institutions/Distance Education, December 2012
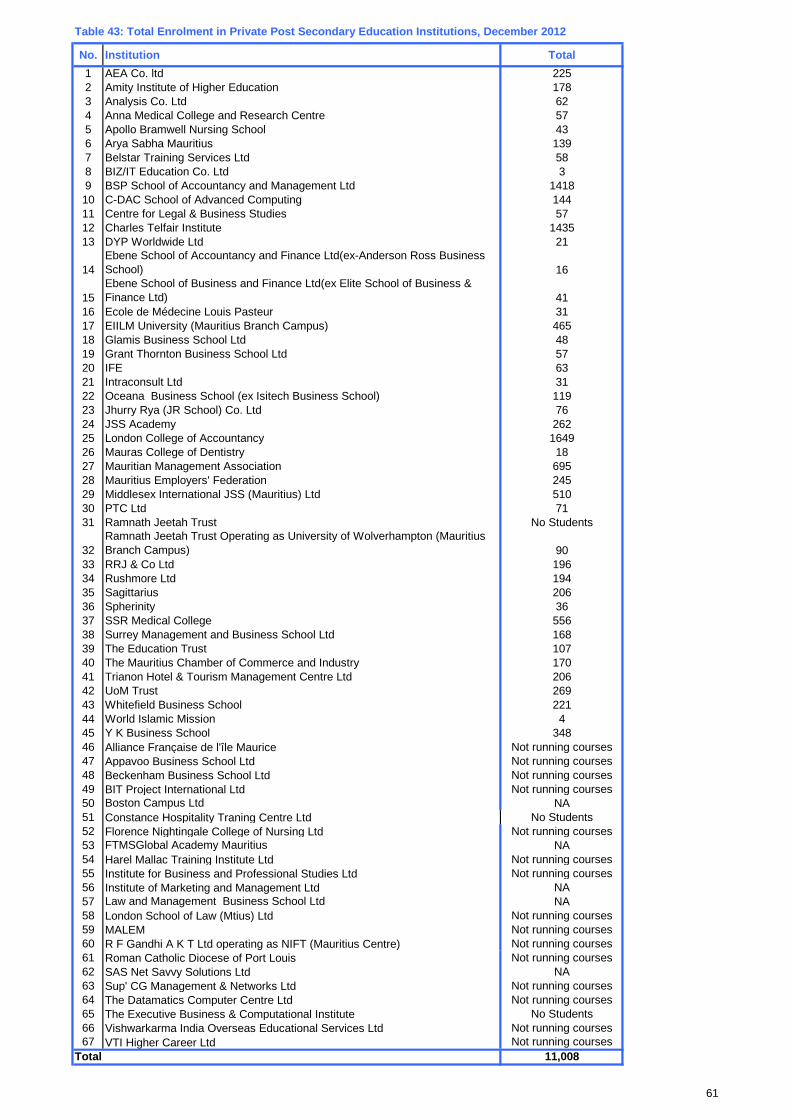
61
Table 43: Total Enrolment in Private Post Secondary Education Institutions, December 2012
No. Institution Total1 AEA Co. ltd 2252 Amity Institute of Higher Education 1783 Analysis Co. Ltd 624 Anna Medical College and Research Centre 575 Apollo Bramwell Nursing School 436 Arya Sabha Mauritius 1397 Belstar Training Services Ltd 588 BIZ/IT Education Co. Ltd 39 BSP School of Accountancy and Management Ltd 141810 C-DAC School of Advanced Computing 14411 Centre for Legal & Business Studies 5712 Charles Telfair Institute 143513 DYP Worldwide Ltd 21
14Ebene School of Accountancy and Finance Ltd(ex-Anderson Ross Business School) 16
15Ebene School of Business and Finance Ltd(ex Elite School of Business & Finance Ltd) 41
16 Ecole de Médecine Louis Pasteur 3117 EIILM University (Mauritius Branch Campus) 46518 Glamis Business School Ltd 4819 Grant Thornton Business School Ltd 5720 IFE 6321 Intraconsult Ltd 3122 Oceana Business School (ex Isitech Business School) 11923 Jhurry Rya (JR School) Co. Ltd 7624 JSS Academy 26225 London College of Accountancy 164926 Mauras College of Dentistry 1827 Mauritian Management Association 69528 Mauritius Employers' Federation 24529 Middlesex International JSS (Mauritius) Ltd 51030 PTC Ltd 7131 Ramnath Jeetah Trust No Students
32Ramnath Jeetah Trust Operating as University of Wolverhampton (Mauritius Branch Campus) 90
33 RRJ & Co Ltd 19634 Rushmore Ltd 19435 Sagittarius 20636 Spherinity 3637 SSR Medical College 55638 Surrey Management and Business School Ltd 16839 The Education Trust 10740 The Mauritius Chamber of Commerce and Industry 17041 Trianon Hotel & Tourism Management Centre Ltd 20642 UoM Trust 26943 Whitefield Business School 22144 World Islamic Mission 445 Y K Business School 34846 Alliance Française de l'île Maurice Not running courses47 Appavoo Business School Ltd Not running courses48 Beckenham Business School Ltd Not running courses49 BIT Project International Ltd Not running courses50 Boston Campus Ltd NA51 Constance Hospitality Traning Centre Ltd No Students52 Florence Nightingale College of Nursing Ltd Not running courses53 FTMSGlobal Academy Mauritius NA54 Harel Mallac Training Institute Ltd Not running courses55 Institute for Business and Professional Studies Ltd Not running courses56 Institute of Marketing and Management Ltd NA57 Law and Management Business School Ltd NA58 London School of Law (Mtius) Ltd Not running courses59 MALEM Not running courses60 R F Gandhi A K T Ltd operating as NIFT (Mauritius Centre) Not running courses61 Roman Catholic Diocese of Port Louis Not running courses62 SAS Net Savvy Solutions Ltd NA63 Sup' CG Management & Networks Ltd Not running courses64 The Datamatics Computer Centre Ltd Not running courses65 The Executive Business & Computational Institute No Students66 Vishwarkarma India Overseas Educational Services Ltd Not running courses67 VTI Higher Career Ltd Not running courses
11,008Total
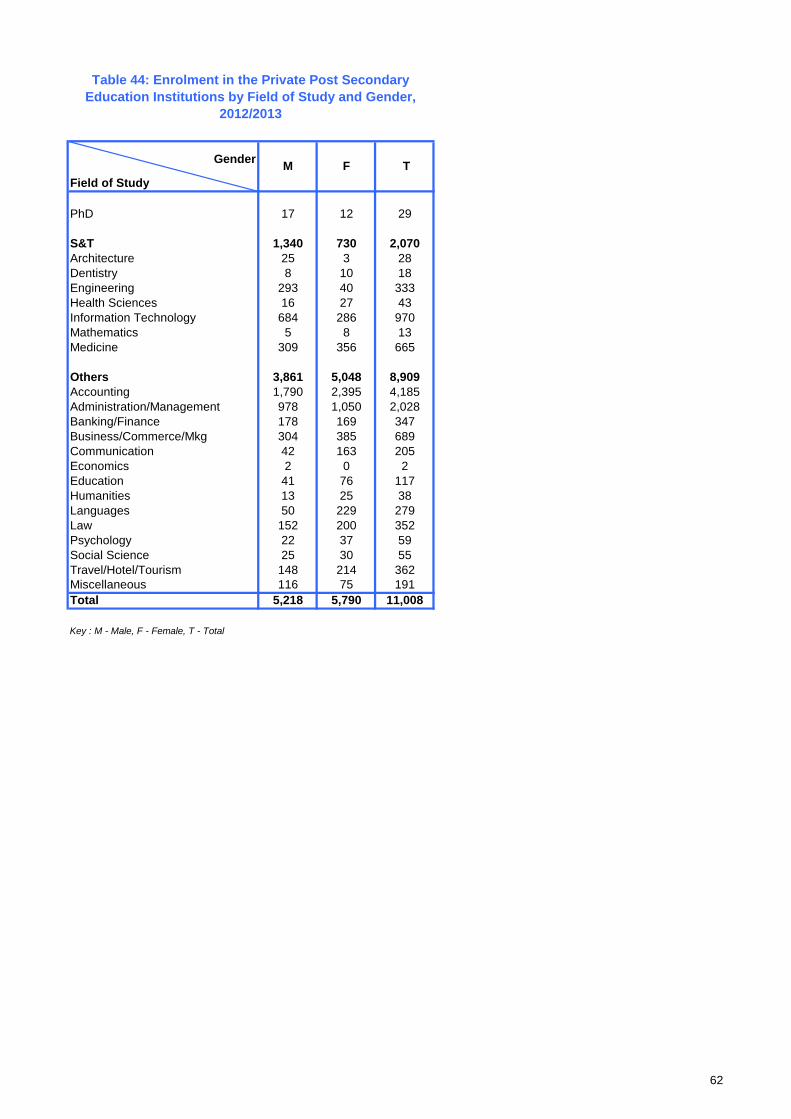
62
Gender
Field of Study
PhD 17 12 29
S&T 1,340 730 2,070Architecture 25 3 28Dentistry 8 10 18Engineering 293 40 333Health Sciences 16 27 43Information Technology 684 286 970Mathematics 5 8 13Medicine 309 356 665
Others 3,861 5,048 8,909Accounting 1,790 2,395 4,185Administration/Management 978 1,050 2,028Banking/Finance 178 169 347Business/Commerce/Mkg 304 385 689Communication 42 163 205Economics 2 0 2Education 41 76 117Humanities 13 25 38Languages 50 229 279Law 152 200 352Psychology 22 37 59Social Science 25 30 55Travel/Hotel/Tourism 148 214 362Miscellaneous 116 75 191Total 5,218 5,790 11,008
Key : M - Male, F - Female, T - Total
M F T
Table 44: Enrolment in the Private Post Secondary Education Institutions by Field of Study and Gender,
2012/2013
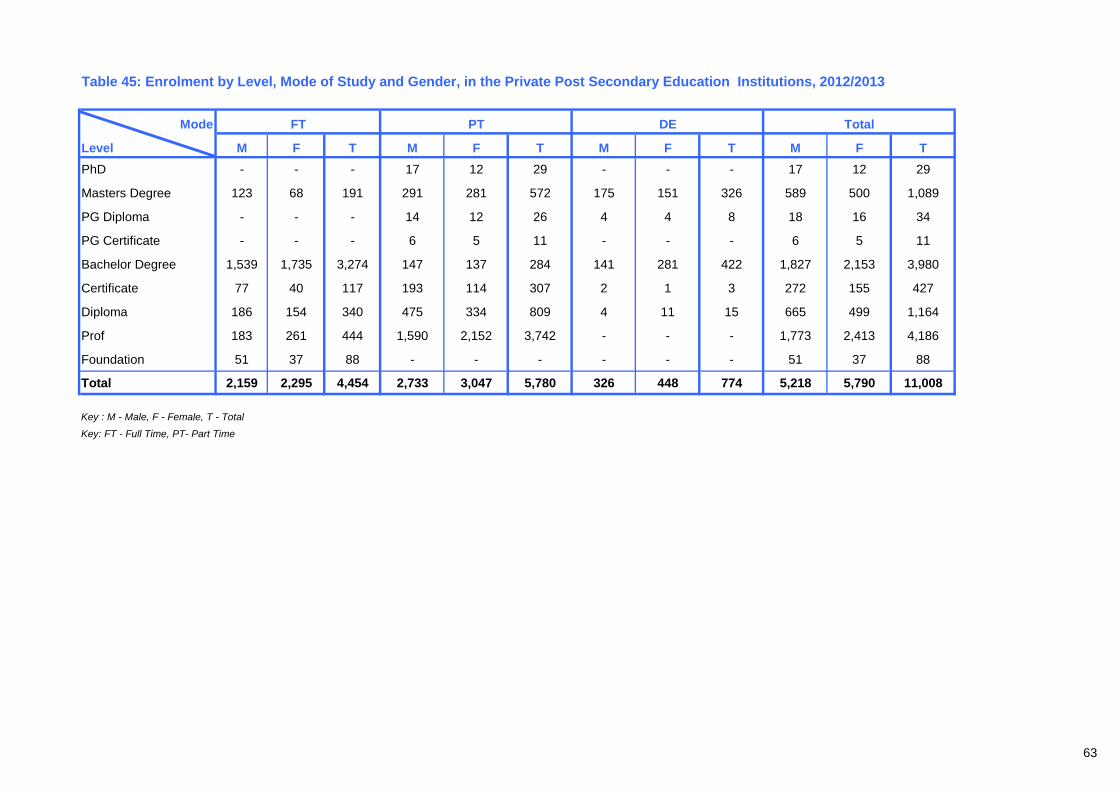
63
Table 45: Enrolment by Level, Mode of Study and Gender, in the Private Post Secondary Education Institutions, 2012/2013
Mode
Level M F T M F T M F T M F TPhD - - - 17 12 29 - - - 17 12 29
Masters Degree 123 68 191 291 281 572 175 151 326 589 500 1,089
PG Diploma - - - 14 12 26 4 4 8 18 16 34
PG Certificate - - - 6 5 11 - - - 6 5 11
Bachelor Degree 1,539 1,735 3,274 147 137 284 141 281 422 1,827 2,153 3,980
Certificate 77 40 117 193 114 307 2 1 3 272 155 427
Diploma 186 154 340 475 334 809 4 11 15 665 499 1,164
Prof 183 261 444 1,590 2,152 3,742 - - - 1,773 2,413 4,186
Foundation 51 37 88 - - - - - - 51 37 88
Total 2,159 2,295 4,454 2,733 3,047 5,780 326 448 774 5,218 5,790 11,008
Key: FT - Full Time, PT- Part Time
FT PT DE Total
Key : M - Male, F - Female, T - Total
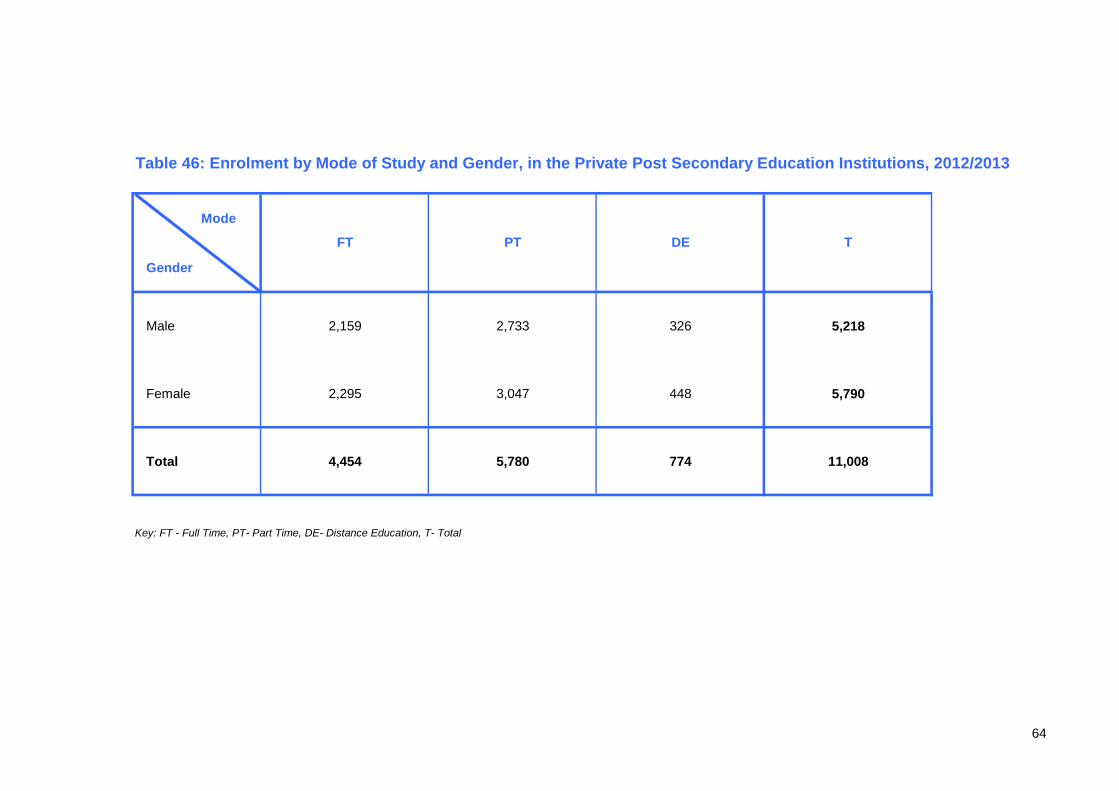
64
Table 46: Enrolment by Mode of Study and Gender, in the Private Post Secondary Education Institutions, 2012/2013
Mode
Gender
Male 2,159 2,733 326 5,218
Female 2,295 3,047 448 5,790
Total 4,454 5,780 774 11,008
Key: FT - Full Time, PT- Part Time, DE- Distance Education, T- Total
FT PT DE T
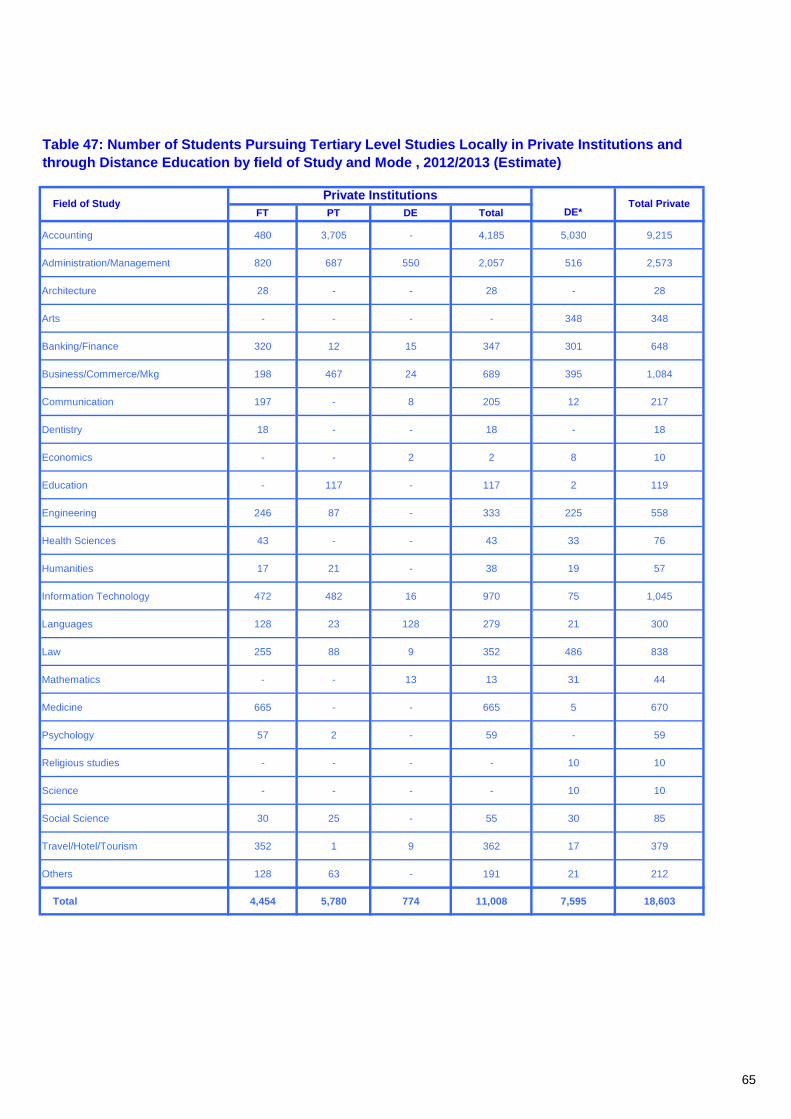
65
FT PT DE Total
Accounting 480 3,705 - 4,185 5,030 9,215
Administration/Management 820 687 550 2,057 516 2,573
Architecture 28 - - 28 - 28
Arts - - - - 348 348
Banking/Finance 320 12 15 347 301 648
Business/Commerce/Mkg 198 467 24 689 395 1,084
Communication 197 - 8 205 12 217
Dentistry 18 - - 18 - 18
Economics - - 2 2 8 10
Education - 117 - 117 2 119
Engineering 246 87 - 333 225 558
Health Sciences 43 - - 43 33 76
Humanities 17 21 - 38 19 57
Information Technology 472 482 16 970 75 1,045
Languages 128 23 128 279 21 300
Law 255 88 9 352 486 838
Mathematics - - 13 13 31 44
Medicine 665 - - 665 5 670
Psychology 57 2 - 59 - 59
Religious studies - - - - 10 10
Science - - - - 10 10
Social Science 30 25 - 55 30 85
Travel/Hotel/Tourism 352 1 9 362 17 379
Others 128 63 - 191 21 212
Total 4,454 5,780 774 11,008 7,595 18,603
Table 47: Number of Students Pursuing Tertiary Level Studies Locally in Private Institutions and through Distance Education by field of Study and Mode , 2012/2013 (Estimate)
Field of StudyPrivate Institutions
DE*Total Private
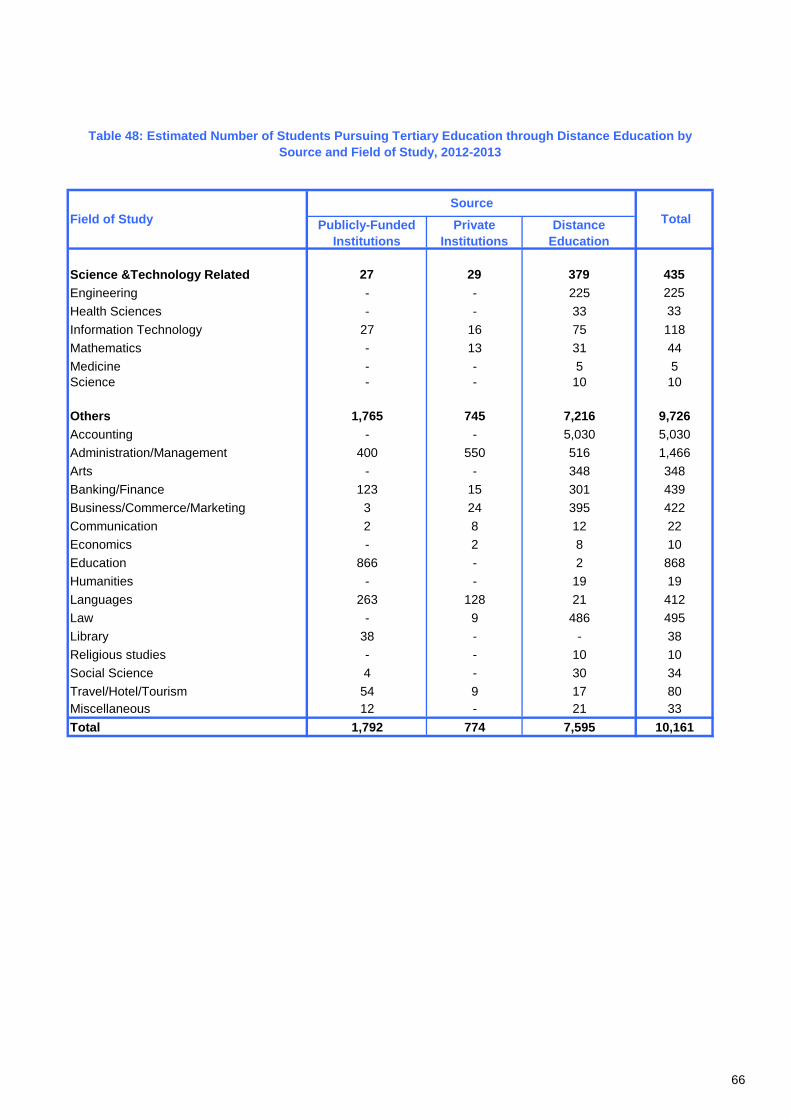
66
Publicly-Funded Institutions
Private Institutions
Distance Education
Science &Technology Related 27 29 379 435Engineering - - 225 225Health Sciences - - 33 33Information Technology 27 16 75 118Mathematics - 13 31 44Medicine - - 5 5Science - - 10 10
Others 1,765 745 7,216 9,726Accounting - - 5,030 5,030Administration/Management 400 550 516 1,466Arts - - 348 348Banking/Finance 123 15 301 439Business/Commerce/Marketing 3 24 395 422Communication 2 8 12 22Economics - 2 8 10Education 866 - 2 868Humanities - - 19 19Languages 263 128 21 412Law - 9 486 495Library 38 - - 38Religious studies - - 10 10Social Science 4 - 30 34Travel/Hotel/Tourism 54 9 17 80Miscellaneous 12 - 21 33Total 1,792 774 7,595 10,161
Table 48: Estimated Number of Students Pursuing Tertiary Education through Distance Education by Source and Field of Study, 2012-2013
Field of StudySource
Total
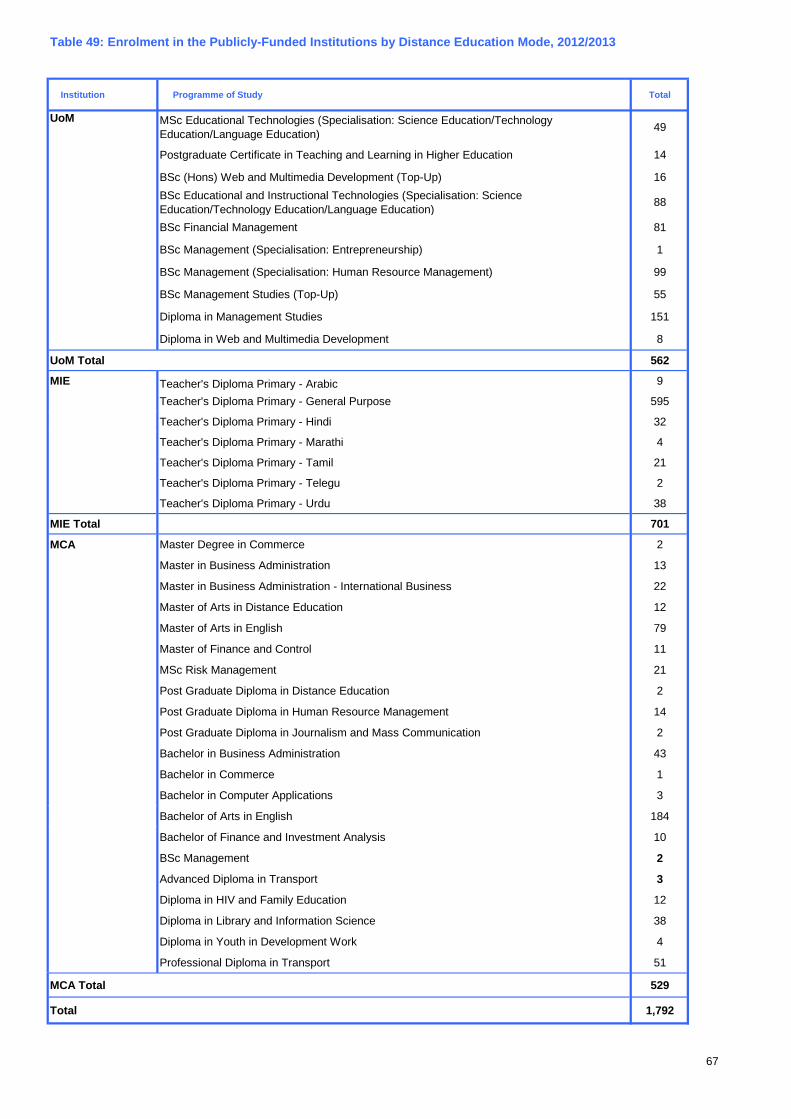
67
Institution Programme of Study Total
MSc Educational Technologies (Specialisation: Science Education/Technology Education/Language Education) 49
Postgraduate Certificate in Teaching and Learning in Higher Education 14
BSc (Hons) Web and Multimedia Development (Top-Up) 16BSc Educational and Instructional Technologies (Specialisation: Science Education/Technology Education/Language Education) 88
BSc Financial Management 81
BSc Management (Specialisation: Entrepreneurship) 1
BSc Management (Specialisation: Human Resource Management) 99
BSc Management Studies (Top-Up) 55
Diploma in Management Studies 151
Diploma in Web and Multimedia Development 8
UoM Total 562
MIE Teacher's Diploma Primary - Arabic 9
Teacher's Diploma Primary - General Purpose 595
Teacher's Diploma Primary - Hindi 32
Teacher's Diploma Primary - Marathi 4
Teacher's Diploma Primary - Tamil 21
Teacher's Diploma Primary - Telegu 2
Teacher's Diploma Primary - Urdu 38
MIE Total 701
MCA Master Degree in Commerce 2
Master in Business Administration 13
Master in Business Administration - International Business 22
Master of Arts in Distance Education 12
Master of Arts in English 79
Master of Finance and Control 11
MSc Risk Management 21
Post Graduate Diploma in Distance Education 2
Post Graduate Diploma in Human Resource Management 14
Post Graduate Diploma in Journalism and Mass Communication 2
Bachelor in Business Administration 43
Bachelor in Commerce 1
Bachelor in Computer Applications 3
Bachelor of Arts in English 184
Bachelor of Finance and Investment Analysis 10
BSc Management 2
Advanced Diploma in Transport 3
Diploma in HIV and Family Education 12
Diploma in Library and Information Science 38
Diploma in Youth in Development Work 4
Professional Diploma in Transport 51
MCA Total 529
Total 1,792
Table 49: Enrolment in the Publicly-Funded Institutions by Distance Education Mode, 2012/2013
UoM
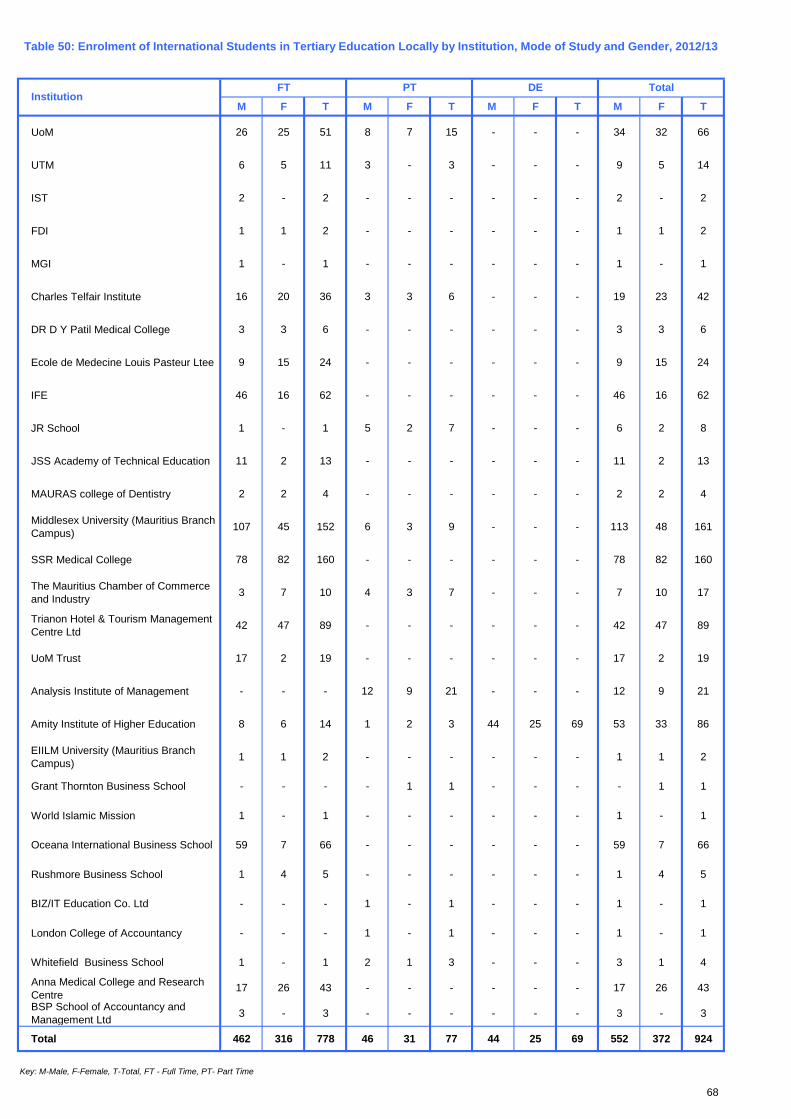
68
M F T M F T M F T M F T
UoM 26 25 51 8 7 15 - - - 34 32 66
UTM 6 5 11 3 - 3 - - - 9 5 14
IST 2 - 2 - - - - - - 2 - 2
FDI 1 1 2 - - - - - - 1 1 2
MGI 1 - 1 - - - - - - 1 - 1
Charles Telfair Institute 16 20 36 3 3 6 - - - 19 23 42
DR D Y Patil Medical College 3 3 6 - - - - - - 3 3 6
Ecole de Medecine Louis Pasteur Ltee 9 15 24 - - - - - - 9 15 24
IFE 46 16 62 - - - - - - 46 16 62
JR School 1 - 1 5 2 7 - - - 6 2 8
JSS Academy of Technical Education 11 2 13 - - - - - - 11 2 13
MAURAS college of Dentistry 2 2 4 - - - - - - 2 2 4
Middlesex University (Mauritius Branch Campus) 107 45 152 6 3 9 - - - 113 48 161
SSR Medical College 78 82 160 - - - - - - 78 82 160
The Mauritius Chamber of Commerce and Industry 3 7 10 4 3 7 - - - 7 10 17
Trianon Hotel & Tourism Management Centre Ltd 42 47 89 - - - - - - 42 47 89
UoM Trust 17 2 19 - - - - - - 17 2 19
Analysis Institute of Management - - - 12 9 21 - - - 12 9 21
Amity Institute of Higher Education 8 6 14 1 2 3 44 25 69 53 33 86
EIILM University (Mauritius Branch Campus) 1 1 2 - - - - - - 1 1 2
Grant Thornton Business School - - - - 1 1 - - - - 1 1
World Islamic Mission 1 - 1 - - - - - - 1 - 1
Oceana International Business School 59 7 66 - - - - - - 59 7 66
Rushmore Business School 1 4 5 - - - - - - 1 4 5
BIZ/IT Education Co. Ltd - - - 1 - 1 - - - 1 - 1
London College of Accountancy - - - 1 - 1 - - - 1 - 1
Whitefield Business School 1 - 1 2 1 3 - - - 3 1 4
Anna Medical College and Research Centre
17 26 43 - - - - - - 17 26 43
BSP School of Accountancy and Management Ltd 3 - 3 - - - - - - 3 - 3
Total 462 316 778 46 31 77 44 25 69 552 372 924
Key: M-Male, F-Female, T-Total, FT - Full Time, PT- Part Time
DEPTFTInstitution
Total
Table 50: Enrolment of International Students in Tertiary Education Locally by Institution, Mode of Study and Gender, 2012/13
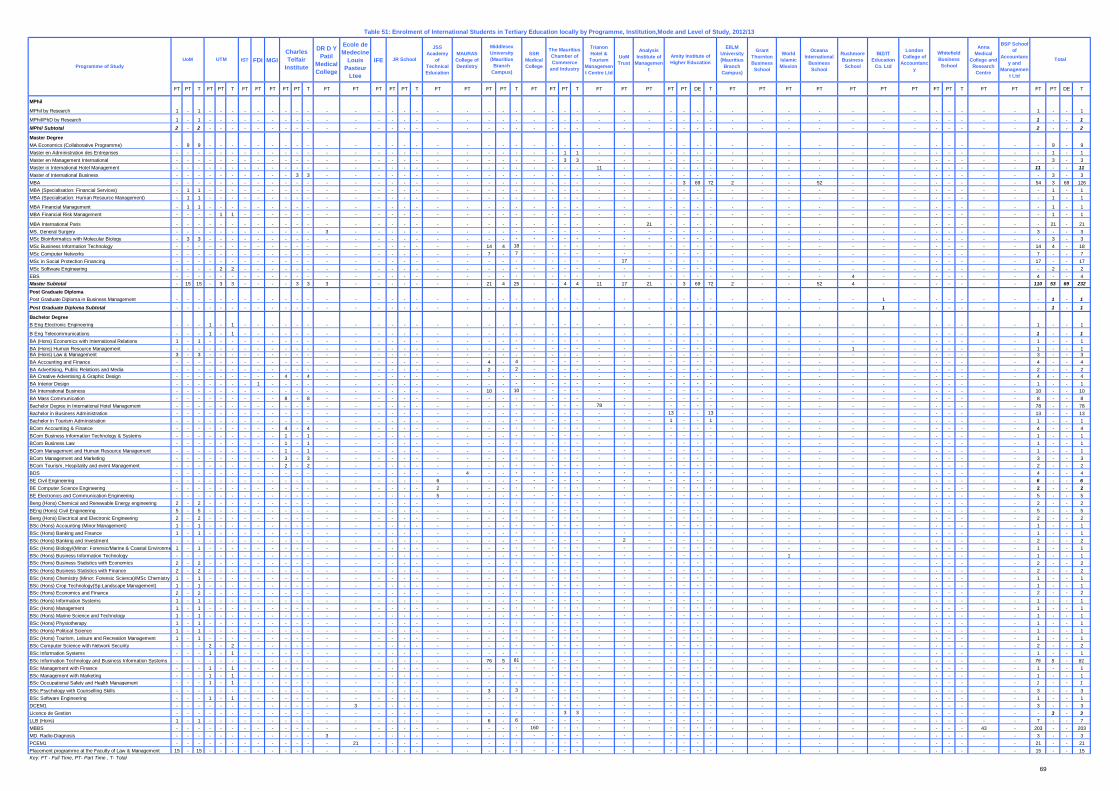
69
IST FDI MGI
DR D Y Patil
Medical College
Ecole de Medecine
Louis Pasteur
Ltee
IFE
JSS Academy
of Technical Education
MAURAS College of Dentistry
SSR Medical College
Trianon Hotel & Tourism
Management Centre Ltd
UoM Trust
Analysis Institute of
Management
EIILM University (Mauritius
Branch Campus)
Grant Thornton Business School
World Islamic Mission
Oceana International
Business School
Rushmore Business School
BIZ/IT Education
Co. Ltd
London College of
Accountancy
Anna Medical
College and Research
Centre
BSP School of
Accountancy and
Management Ltd
FT PT T FT PT T FT FT FT FT PT T FT FT FT FT PT T FT FT FT PT T FT FT PT T FT FT PT FT PT DE T FT PT FT FT FT PT PT FT PT T FT FT FT PT DE T
MPhil
MPhil by Research 1 - 1 - - - - - - - - - - - - - - - - - - - - - - - - - - - - - - - - - - - - - - - - - - - 1 - - 1
MPhil/PhD by Research 1 - 1 - - - - - - - - - - - - - - - - - - - - - - - - - - - - - - - - - - - - - - - - - - - 1 - - 1MPhil Subtotal 2 - 2 - - - - - - - - - - - - - - - - - - - - - - - - - - - - - - - - - - - - - - - - - - - 2 - - 2
Master DegreeMA Economics (Collaborative Programme) - 9 9 - - - - - - - - - - - - - - - - - - - - - - - - - - - - - - - - - - - - - - - - - - - - 9 - 9Master en Administration des Entreprises - - - - - - - - - - - - - - - - - - - - - - - - - 1 1 - - - - - - - - - - - - - - - - - - - - 1 - 1Master en Management International - - - - - - - - - - - - - - - - - - - - - - - - - 3 3 - - - - - - - - - - - - - - - - - - - - 3 - 3Master in International Hotel Management - - - - - - - - - - - - - - - - - - - - - - - - - - - 11 - - - - - - - - - - - - - - - - - - 11 - - 11Master of International Business - - - - - - - - - - 3 3 - - - - - - - - - - - - - - - - - - - - - - - - - - - - - - - - - - - 3 - 3MBA - - - - - - - - - - - - - - - - - - - - - - - - - - - - - - - 3 69 72 2 - - 52 - - - - - - - - 54 3 69 126MBA (Specialisation: Financial Services) - 1 1 - - - - - - - - - - - - - - - - - - - - - - - - - - - - - - - - - - - - - - - - - - - - 1 - 1MBA (Specialisation: Human Resource Management) - 1 1 - - - - - - - - - - - - - - - - - - - - - - - - - - - - - - - - - - - - - - - - - - - - 1 - 1
MBA Financial Management - 1 1 - - - - - - - - - - - - - - - - - - - - - - - - - - - - - - - - - - - - - - - - - - - - 1 - 1MBA Financial Risk Management - - - - 1 1 - - - - - - - - - - - - - - - - - - - - - - - - - - - - - - - - - - - - - - - - - 1 - 1
MBA International Paris - - - - - - - - - - - - - - - - - - - - - - - - - - - - - 21 - - - - - - - - - - - - - - - - - 21 - 21MS. General Surgery - - - - - - - - - - - - 3 - - - - - - - - - - - - - - - - - - - - - - - - - - - - - - - - - 3 - - 3MSc Bioinformatics with Molecular Biology - 3 3 - - - - - - - - - - - - - - - - - - - - - - - - - - - - - - - - - - - - - - - - - - - - 3 - 3MSc Business Information Technology - - - - - - - - - - - - - - - - - - - - 14 4 18 - - - - - - - - - - - - - - - - - - - - - - - 14 4 - 18MSc Computer Networks - - - - - - - - - - - - - - - - - - - - 7 - 7 - - - - - - - - - - - - - - - - - - - - - - - 7 - - 7MSc in Social Protection Financing - - - - - - - - - - - - - - - - - - - - - - - - - - - - 17 - - - - - - - - - - - - - - - - - 17 - - 17MSc Software Engineering - - - - 2 2 - - - - - - - - - - - - - - - - - - - - - - - - - - - - - - - - - - - - - - - - - 2 - 2EBS - - - - - - - - - - - - - - - - - - - - - - - - - - - - - - - - - - - - - - 4 - - - - - - - 4 - - 4Master Subtotal - 15 15 - 3 3 - - - - 3 3 3 - - - - - - - 21 4 25 - - 4 4 11 17 21 - 3 69 72 2 - - 52 4 - - - - - - - 110 53 69 232Post Graduate DiplomaPost Graduate Diploma in Business Management - - - - - - - - - - - - - - - - - - - - - - - - - - - - - - - - - - - - - - - 1 - - - - - - - 1 - 1Post Graduate Diploma Subtotal - - - - - - - - - - - - - - - - - - - - - - - - - - - - - - - - - - - - - - - 1 - - - - - - - 1 - 1
Bachelor Degree B Eng Electronic Engineering - - - 1 - 1 - - - - - - - - - - - - - - - - - - - - - - - - - - - - - - - - - - - - - - - - 1 - - 1
B Eng Telecommunications - - - 1 - 1 - - - - - - - - - - - - - - - - - - - - - - - - - - - - - - - - - - - - - - - - 1 - - 1BA (Hons) Economics with International Relations 1 - 1 - - - - - - - - - - - - - - - - - - - - - - - - - - - - - - - - - - - - - - - - - - - 1 - - 1BA (Hons) Human Resource Management - - - - - - - - - - - - - - - - - - - - - - - - - - - - - - - - - - - - - - 1 - - - - - - - 1 - - 1BA (Hons) Law & Management 3 - 3 - - - - - - - - - - - - - - - - - - - - - - - - - - - - - - - - - - - - - - - - - - - 3 - - 3BA Accounting and Finance - - - - - - - - - - - - - - - - - - - - 4 - 4 - - - - - - - - - - - - - - - - - - - - - - - 4 - - 4BA Advertising, Public Relations and Media - - - - - - - - - - - - - - - - - - - - 2 - 2 - - - - - - - - - - - - - - - - - - - - - - - 2 - - 2BA Creative Advertising & Graphic Design - - - - - - - - - 4 - 4 - - - - - - - - - - - - - - - - - - - - - - - - - - - - - - - - - - 4 - - 4BA Interior Design - - - - - - - 1 - - - - - - - - - - - - - - - - - - - - - - - - - - - - - - - - - - - - - - 1 - - 1BA International Business - - - - - - - - - - - - - - - - - - - - 10 - 10 - - - - - - - - - - - - - - - - - - - - - - - 10 - - 10BA Mass Communication - - - - - - - - - 8 - 8 - - - - - - - - - - - - - - - - - - - - - - - - - - - - - - - - - - 8 - - 8Bachelor Degree in International Hotel Management - - - - - - - - - - - - - - - - - - - - - - - - - - - 78 - - - - - - - - - - - - - - - - - - 78 - - 78Bachelor in Business Administration - - - - - - - - - - - - - - - - - - - - - - - - - - - - - - 13 - - 13 - - - - - - - - - - - - 13 - - 13Bachelor in Tourism Administration - - - - - - - - - - - - - - - - - - - - - - - - - - - - - - 1 - - 1 - - - - - - - - - - - - 1 - - 1BCom Accounting & Finance - - - - - - - - - 4 - 4 - - - - - - - - - - - - - - - - - - - - - - - - - - - - - - - - - - 4 - - 4BCom Business Information Technology & Systems - - - - - - - - - 1 - 1 - - - - - - - - - - - - - - - - - - - - - - - - - - - - - - - - - - 1 - - 1BCom Business Law - - - - - - - - - 1 - 1 - - - - - - - - - - - - - - - - - - - - - - - - - - - - - - - - - - 1 - - 1BCom Management and Human Resource Management - - - - - - - - - 1 - 1 - - - - - - - - - - - - - - - - - - - - - - - - - - - - - - - - - - 1 - - 1BCom Management and Marketing - - - - - - - - - 3 - 3 - - - - - - - - - - - - - - - - - - - - - - - - - - - - - - - - - - 3 - - 3BCom Tourism, Hospitality and event Management - - - - - - - - - 2 - 2 - - - - - - - - - - - - - - - - - - - - - - - - - - - - - - - - - - 2 - - 2BDS - - - - - - - - - - - - - - - - - - - 4 - - - - - - - - - - - - - - - - - - - - - - - - - - 4 - - 4BE Civil Engineering - - - - - - - - - - - - - - - - - - 6 - - - - - - - - - - - - - - - - - - - - - - - - - - - 6 - - 6BE Computer Science Engineering - - - - - - - - - - - - - - - - - - 2 - - - - - - - - - - - - - - - - - - - - - - - - - - - 2 - - 2BE Electronics and Communication Engineering - - - - - - - - - - - - - - - - - - 5 - - - - - - - - - - - - - - - - - - - - - - - - - - - 5 - - 5Beng (Hons) Chemical and Renewable Energy engineering 2 - 2 - - - - - - - - - - - - - - - - - - - - - - - - - - - - - - - - - - - - - - - - - - - 2 - - 2BEng (Hons) Civil Engineering 5 - 5 - - - - - - - - - - - - - - - - - - - - - - - - - - - - - - - - - - - - - - - - - - - 5 - - 5Beng (Hons) Electrical and Electronic Engineering 2 - 2 - - - - - - - - - - - - - - - - - - - - - - - - - - - - - - - - - - - - - - - - - - - 2 - - 2BSc (Hons) Accounting (Minor:Management) 1 - 1 - - - - - - - - - - - - - - - - - - - - - - - - - - - - - - - - - - - - - - - - - - - 1 - - 1BSc (Hons) Banking and Finance 1 - 1 - - - - - - - - - - - - - - - - - - - - - - - - - - - - - - - - - - - - - - - - - - - 1 - - 1BSc (Hons) Banking and Investment - - - - - - - - - - - - - - - - - - - - - - - - - - - - 2 - - - - - - - - - - - - - - - - - 2 - - 2BSc (Hons) Biology/(Minor: Forensic/Marine & Coastal Environme 1 - 1 - - - - - - - - - - - - - - - - - - - - - - - - - - - - - - - - - - - - - - - - - - - 1 - - 1BSc (Hons) Business Information Technology - - - - - - - - - - - - - - - - - - - - - - - - - - - - - - - - - - - - 1 - - - - - - - - - 1 - - 1BSc (Hons) Business Statistics with Economics 2 - 2 - - - - - - - - - - - - - - - - - - - - - - - - - - - - - - - - - - - - - - - - - - - 2 - - 2BSc (Hons) Business Statistics with Finance 2 - 2 - - - - - - - - - - - - - - - - - - - - - - - - - - - - - - - - - - - - - - - - - - - 2 - - 2BSc (Hons) Chemistry (Minor: Forensic Science)/MSc Chemistry 1 - 1 - - - - - - - - - - - - - - - - - - - - - - - - - - - - - - - - - - - - - - - - - - - 1 - - 1BSc (Hons) Crop Technology(Sp:Landscape Management) 1 - 1 - - - - - - - - - - - - - - - - - - - - - - - - - - - - - - - - - - - - - - - - - - - 1 - - 1BSc (Hons) Economics and Finance 2 - 2 - - - - - - - - - - - - - - - - - - - - - - - - - - - - - - - - - - - - - - - - - - - 2 - - 2BSc (Hons) Information Systems 1 - 1 - - - - - - - - - - - - - - - - - - - - - - - - - - - - - - - - - - - - - - - - - - - 1 - - 1BSc (Hons) Management 1 - 1 - - - - - - - - - - - - - - - - - - - - - - - - - - - - - - - - - - - - - - - - - - - 1 - - 1BSc (Hons) Marine Science and Technology 1 - 1 - - - - - - - - - - - - - - - - - - - - - - - - - - - - - - - - - - - - - - - - - - - 1 - - 1BSc (Hons) Physiotherapy 1 - 1 - - - - - - - - - - - - - - - - - - - - - - - - - - - - - - - - - - - - - - - - - - - 1 - - 1BSc (Hons) Political Science 1 - 1 - - - - - - - - - - - - - - - - - - - - - - - - - - - - - - - - - - - - - - - - - - - 1 - - 1BSc (Hons) Tourism, Leisure and Recreation Management 1 - 1 - - - - - - - - - - - - - - - - - - - - - - - - - - - - - - - - - - - - - - - - - - - 1 - - 1BSc Computer Science with Network Security - - - 2 - 2 - - - - - - - - - - - - - - - - - - - - - - - - - - - - - - - - - - - - - - - - 2 - - 2BSc Information Systems - - - 1 - 1 - - - - - - - - - - - - - - - - - - - - - - - - - - - - - - - - - - - - - - - - 1 - - 1BSc Information Technology and Business Information Systems - - - - - - - - - - - - - - - - - - - - 76 5 81 - - - - - - - - - - - - - - - - - - - - - - - 76 5 - 81BSc Management with Finance - - - 1 - 1 - - - - - - - - - - - - - - - - - - - - - - - - - - - - - - - - - - - - - - - - 1 - - 1BSc Management with Marketing - - - 1 - 1 - - - - - - - - - - - - - - - - - - - - - - - - - - - - - - - - - - - - - - - - 1 - - 1BSc Occupational Safety and Health Management - - - 1 - 1 - - - - - - - - - - - - - - - - - - - - - - - - - - - - - - - - - - - - - - - - 1 - - 1BSc Psychology with Counselling Skills - - - - - - - - - - - - - - - - - - - - 3 - 3 - - - - - - - - - - - - - - - - - - - - - - - 3 - - 3BSc Software Engineering - - - 1 - 1 - - - - - - - - - - - - - - - - - - - - - - - - - - - - - - - - - - - - - - - - 1 - - 1DCEM1 - - - - - - - - - - - - - 3 - - - - - - - - - - - - - - - - - - - - - - - - - - - - - - - - 3 - - 3Licence de Gestion - - - - - - - - - - - - - - - - - - - - - - - - - 3 3 - - - - - - - - - - - - - - - - - - - - 3 - 3LLB (Hons) 1 - 1 - - - - - - - - - - - - - - - - - 6 - 6 - - - - - - - - - - - - - - - - - - - - - - - 7 - - 7MBBS - - - - - - - - - - - - - - - - - - - - - - - 160 - - - - - - - - - - - - - - - - - - - - 43 - 203 - - 203MD. Radio-Diagnosis - - - - - - - - - - - - 3 - - - - - - - - - - - - - - - - - - - - - - - - - - - - - - - - - 3 - - 3PCEM1 - - - - - - - - - - - - - 21 - - - - - - - - - - - - - - - - - - - - - - - - - - - - - - - - 21 - - 21Placement programme at the Faculty of Law & Management 15 - 15 - - - - - - - - - - - - - - - - - - - - - - - - - - - - - - - - - - - - - - - - - - - 15 - - 15Key: FT - Full Time, PT- Part Time , T- Total
The Mauritius Chamber of Commerce
and Industry
Table 51: Enrolment of International Students in Tertiary Education locally by Programme, Institution,Mode and Level of Study, 2012/13
Amity Institute of Higher Education
Whitefield Business School
TotalProgramme of Study
UoM UTMCharles Telfair
InstituteJR School
Middlesex University (Mauritius
Branch Campus)
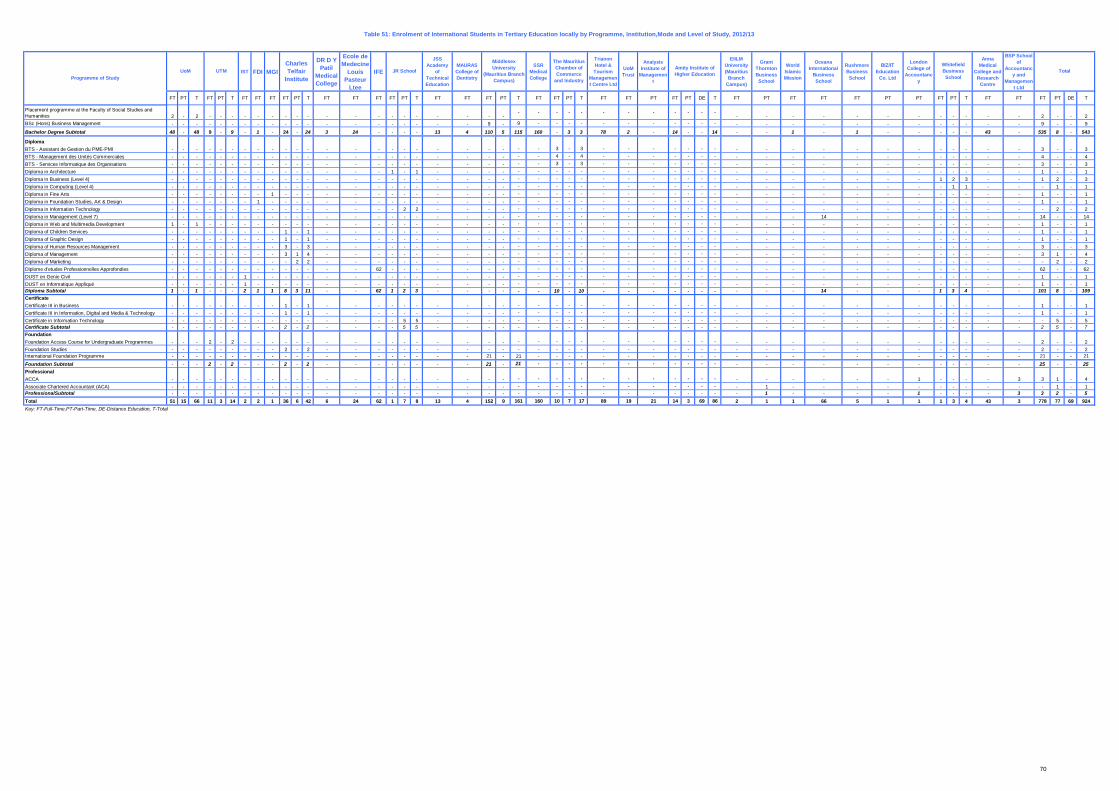
70
IST FDI MGI
DR D Y Patil
Medical College
Ecole de Medecine
Louis Pasteur
Ltee
IFE
JSS Academy
of Technical Education
MAURAS College of Dentistry
SSR Medical College
Trianon Hotel & Tourism
Management Centre Ltd
UoM Trust
Analysis Institute of
Management
EIILM University (Mauritius
Branch Campus)
Grant Thornton Business School
World Islamic Mission
Oceana International
Business School
Rushmore Business School
BIZ/IT Education
Co. Ltd
London College of
Accountancy
Anna Medical
College and Research
Centre
BSP School of
Accountancy and
Management Ltd
FT PT T FT PT T FT FT FT FT PT T FT FT FT FT PT T FT FT FT PT T FT FT PT T FT FT PT FT PT DE T FT PT FT FT FT PT PT FT PT T FT FT FT PT DE T
Placement programme at the Faculty of Social Studies and Humanities 2 - 2 - - - - - - - - - - - - - - - - - - -
- - - - - - - - - - - -- - - - - - - - - - - - 2 - - 2
BSc (Hons) Business Management - - - - - - - - - - - - - - - - - - - - 9 - 9 - - - - - - - - - - - - - - - - - - - - - - - 9 - - 9
Bachelor Degree Subtotal 48 - 48 9 - 9 - 1 - 24 - 24 3 24 - - - - 13 4 110 5 115 160 - 3 3 78 2 - 14 - - 14 - - 1 - 1 - - - - - 43 - 535 8 - 543
DiplomaBTS - Assistant de Gestion du PME-PMI - - - - - - - - - - - - - - - - - - - - - - - - 3 - 3 - - - - - - - - - - - - - - - - - - - 3 - - 3BTS - Management des Unités Commerciales - - - - - - - - - - - - - - - - - - - - - - - - 4 - 4 - - - - - - - - - - - - - - - - - - - 4 - - 4BTS - Services Informatique des Organisations - - - - - - - - - - - - - - - - - - - - - - - - 3 - 3 - - - - - - - - - - - - - - - - - - - 3 - - 3Diploma in Architecture - - - - - - - - - - - - - - - 1 - 1 - - - - - - - - - - - - - - - - - - - - - - - - - - - - 1 - - 1Diploma in Business (Level 4) - - - - - - - - - - - - - - - - - - - - - - - - - - - - - - - - - - - - - - - - - 1 2 3 - - 1 2 - 3Diploma in Computing (Level 4) - - - - - - - - - - - - - - - - - - - - - - - - - - - - - - - - - - - - - - - - - - 1 1 - - - 1 - 1Diploma in Fine Arts - - - - - - - - 1 - - - - - - - - - - - - - - - - - - - - - - - - - - - - - - - - - - - - - 1 - - 1Diploma in Foundation Studies, Art & Design - - - - - - - 1 - - - - - - - - - - - - - - - - - - - - - - - - - - - - - - - - - - - - - - 1 - - 1Diploma in Information Technology - - - - - - - - - - - - - - - - 2 2 - - - - - - - - - - - - - - - - - - - - - - - - - - - - - 2 - 2Diploma in Management (Level 7) - - - - - - - - - - - - - - - - - - - - - - - - - - - - - - - - - - - - - 14 - - - - - - - - 14 - - 14Diploma in Web and Multimedia Development 1 - 1 - - - - - - - - - - - - - - - - - - - - - - - - - - - - - - - - - - - - - - - - - - - 1 - - 1Diploma of Children Services - - - - - - - - - 1 - 1 - - - - - - - - - - - - - - - - - - - - - - - - - - - - - - - - - - 1 - - 1Diploma of Graphic Design - - - - - - - - - 1 - 1 - - - - - - - - - - - - - - - - - - - - - - - - - - - - - - - - - - 1 - - 1Diploma of Human Resources Management - - - - - - - - - 3 - 3 - - - - - - - - - - - - - - - - - - - - - - - - - - - - - - - - - - 3 - - 3Diploma of Management - - - - - - - - - 3 1 4 - - - - - - - - - - - - - - - - - - - - - - - - - - - - - - - - - - 3 1 - 4Diploma of Marketing - - - - - - - - - - 2 2 - - - - - - - - - - - - - - - - - - - - - - - - - - - - - - - - - - - 2 - 2Diplome d'etudes Professionnelles Approfondies - - - - - - - - - - - - - - 62 - - - - - - - - - - - - - - - - - - - - - - - - - - - - - - - 62 - - 62DUST en Genie Civil - - - - - - 1 - - - - - - - - - - - - - - - - - - - - - - - - - - - - - - - - - - - - - - - 1 - - 1DUST en Informatique Appliqué - - - - - - 1 - - - - - - - - - - - - - - - - - - - - - - - - - - - - - - - - - - - - - - - 1 - - 1Diploma Subtotal 1 - 1 - - - 2 1 1 8 3 11 - - 62 1 2 3 - - - - - - 10 - 10 - - - - - - - - - - 14 - - - 1 3 4 - - 101 8 - 109CertificateCertificate III in Business - - - - - - - - - 1 - 1 - - - - - - - - - - - - - - - - - - - - - - - - - - - - - - - - - - 1 - - 1Certificate III in Information, Digital and Media & Technology - - - - - - - - - 1 - 1 - - - - - - - - - - - - - - - - - - - - - - - - - - - - - - - - - - 1 - - 1Certificate in Information Technology - - - - - - - - - - - - - - - - 5 5 - - - - - - - - - - - - - - - - - - - - - - - - - - - - - 5 - 5Certificate Subtotal - - - - - - - - - 2 - 2 - - - - 5 5 - - - - - - - - - - - - - - - - - - - - - - - - - - - - 2 5 - 7FoundationFoundation Access Course for Undergraduate Programmes - - - 2 - 2 - - - - - - - - - - - - - - - - - - - - - - - - - - - - - - - - - - - - - - - - 2 - - 2Foundation Studies - - - - - - - - - 2 - 2 - - - - - - - - - - - - - - - - - - - - - - - - - - - - - - - - - - 2 - - 2International Foundation Programme - - - - - - - - - - - - - - - - - - - - 21 - 21 - - - - - - - - - - - - - - - - - - - - - - - 21 - - 21Foundation Subtotal - - - 2 - 2 - - - 2 - 2 - - - - - - - - 21 - 21 - - - - - - - - - - - - - - - - - - - - - - - 25 - - 25ProfessionalACCA - - - - - - - - - - - - - - - - - - - - - - - - - - - - - - - - - - - - - - - - 1 - - - - 3 3 1 - 4Associate Chartered Accountant (ACA) - - - - - - - - - - - - - - - - - - - - - - - - - - - - - - - - - - - 1 - - - - - - - - - - - 1 - 1ProfessionalSubtotal - - - - - - - - - - - - - - - - - - - - - - - - - - - - - - - - - - - 1 - - - - 1 - - - - 3 3 2 - 5Total 51 15 66 11 3 14 2 2 1 36 6 42 6 24 62 1 7 8 13 4 152 9 161 160 10 7 17 89 19 21 14 3 69 86 2 1 1 66 5 1 1 1 3 4 43 3 778 77 69 924Key: FT-Full-Time,PT-Part-Time, DE-Distance Education, T-Total
Table 51: Enrolment of International Students in Tertiary Education locally by Programme, Institution,Mode and Level of Study, 2012/13
TotalJR School
The Mauritius Chamber of Commerce
and Industry
Amity Institute of Higher EducationUoM
Middlesex University
(Mauritius Branch Campus)
Whitefield Business SchoolProgramme of Study
UTMCharles Telfair
Institute
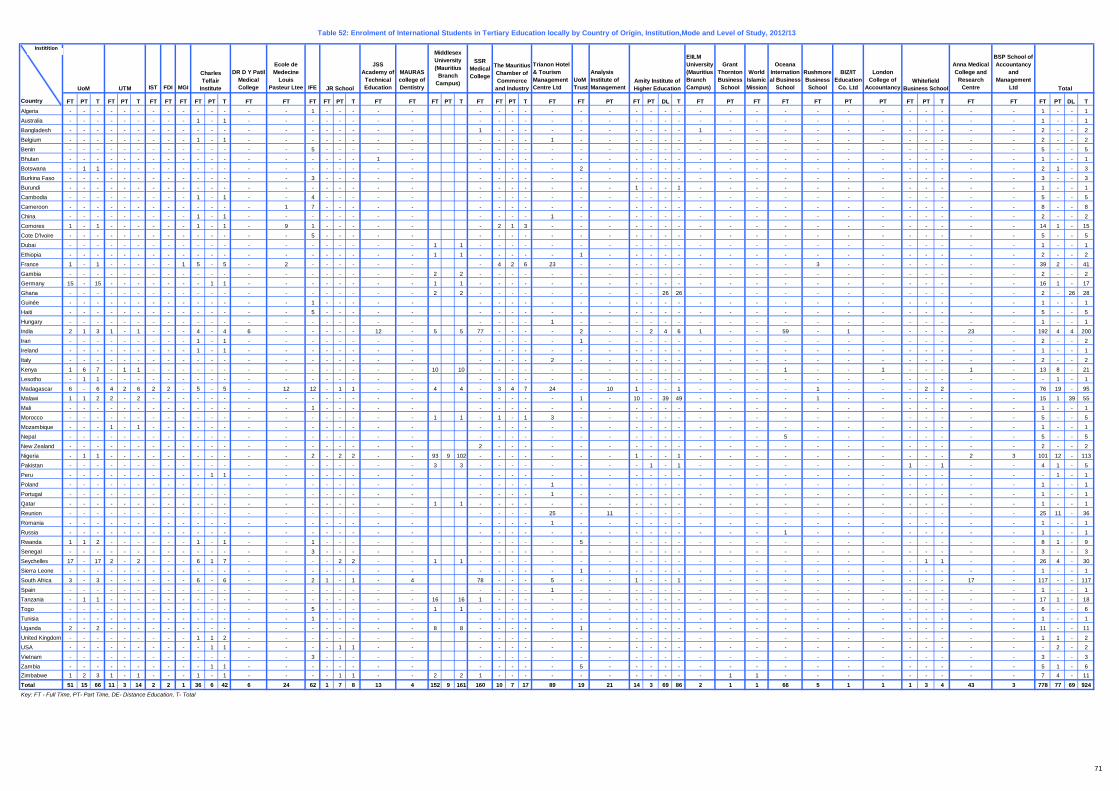
71
IST FDI MGI
DR D Y Patil Medical College
Ecole de Medecine
Louis Pasteur Ltee IFE
JSS Academy of
Technical Education
MAURAS college of Dentistry
SSR Medical College
Trianon Hotel & Tourism Management Centre Ltd
UoM Trust
Analysis Institute of Management
EIILM University (Mauritius Branch Campus)
Grant Thornton Business School
World Islamic Mission
Oceana International Business
School
Rushmore Business School
BIZ/IT Education
Co. Ltd
London College of
Accountancy
Anna Medical College and
Research Centre
BSP School of Accountancy
and Management
Ltd
FT PT T FT PT T FT FT FT FT PT T FT FT FT FT PT T FT FT FT PT T FT FT PT T FT FT PT FT PT DL T FT PT FT FT FT PT PT FT PT T FT FT FT PT DL TAlgeria - - - - - - - - - - - - - - 1 - - - - - - - - - - - - - - - - - - - - - - - - - - - - 1 - - 1
Australia - - - - - - - - - 1 - 1 - - - - - - - - - - - - - - - - - - - - - - - - - - - - - - - 1 - - 1
Bangladesh - - - - - - - - - - - - - - - - - - - - 1 - - - - - - - - - - 1 - - - - - - - - - - - 2 - - 2
Belgium - - - - - - - - - 1 - 1 - - - - - - - - - - - - 1 - - - - - - - - - - - - - - - - - - 2 - - 2
Benin - - - - - - - - - - - - - - 5 - - - - - - - - - - - - - - - - - - - - - - - - - - - - 5 - - 5
Bhutan - - - - - - - - - - - - - - - - - - 1 - - - - - - - - - - - - - - - - - - - - - - - - 1 - - 1
Botswana - 1 1 - - - - - - - - - - - - - - - - - - - - - - 2 - - - - - - - - - - - - - - - - - 2 1 - 3
Burkina Faso - - - - - - - - - - - - - - 3 - - - - - - - - - - - - - - - - - - - - - - - - - - - - 3 - - 3
Burundi - - - - - - - - - - - - - - - - - - - - - - - - - - - 1 - - 1 - - - - - - - - - - - - 1 - - 1
Cambodia - - - - - - - - - 1 - 1 - - 4 - - - - - - - - - - - - - - - - - - - - - - - - - - - - 5 - - 5
Cameroon - - - - - - - - - - - - - 1 7 - - - - - - - - - - - - - - - - - - - - - - - - - - - - 8 - - 8
China - - - - - - - - - 1 - 1 - - - - - - - - - - - - 1 - - - - - - - - - - - - - - - - - - 2 - - 2
Comores 1 - 1 - - - - - - 1 - 1 - 9 1 - - - - - - 2 1 3 - - - - - - - - - - - - - - - - - - - 14 1 - 15
Cote D'Ivoire - - - - - - - - - - - - - - 5 - - - - - - - - - - - - - - - - - - - - - - - - - - - - 5 - - 5
Dubai - - - - - - - - - - - - - - - - - - - - 1 1 - - - - - - - - - - - - - - - - - - - - - - - 1 - - 1
Ethiopia - - - - - - - - - - - - - - - - - - - - 1 1 - - - - - 1 - - - - - - - - - - - - - - - - - 2 - - 2
France 1 - 1 - - - - - 1 5 - 5 - 2 - - - - - - - 4 2 6 23 - - - - - - - - - - 3 - - - - - - - 39 2 - 41
Gambia - - - - - - - - - - - - - - - - - - - - 2 2 - - - - - - - - - - - - - - - - - - - - - - - 2 - - 2
Germany 15 - 15 - - - - - - - 1 1 - - - - - - - - 1 1 - - - - - - - - - - - - - - - - - - - - - - - 16 1 - 17
Ghana - - - - - - - - - - - - - - - - - - - - 2 2 - - - - - - - - - 26 26 - - - - - - - - - - - - 2 - 26 28
Guinée - - - - - - - - - - - - - - 1 - - - - - - - - - - - - - - - - - - - - - - - - - - - - 1 - - 1
Haiti - - - - - - - - - - - - - - 5 - - - - - - - - - - - - - - - - - - - - - - - - - - - - 5 - - 5
Hungary - - - - - - - - - - - - - - - - - - - - - - - - 1 - - - - - - - - - - - - - - - - - - 1 - - 1
India 2 1 3 1 - 1 - - - 4 - 4 6 - - - - - 12 - 5 5 77 - - - - 2 - - 2 4 6 1 - - 59 - 1 - - - - 23 - 192 4 4 200
Iran - - - - - - - - - 1 - 1 - - - - - - - - - - - - - 1 - - - - - - - - - - - - - - - - - 2 - - 2
Ireland - - - - - - - - - 1 - 1 - - - - - - - - - - - - - - - - - - - - - - - - - - - - - - - 1 - - 1
Italy - - - - - - - - - - - - - - - - - - - - - - - - 2 - - - - - - - - - - - - - - - - - - 2 - - 2
Kenya 1 6 7 - 1 1 - - - - - - - - - - - - - - 10 10 - - - - - - - - - - - - - - 1 - - 1 - - - 1 - 13 8 - 21
Lesotho - 1 1 - - - - - - - - - - - - - - - - - - - - - - - - - - - - - - - - - - - - - - - - - 1 - 1
Madagascar 6 - 6 4 2 6 2 2 - 5 - 5 - 12 12 - 1 1 - - 4 4 - 3 4 7 24 - 10 1 - - 1 - - - - 1 - - - 2 2 - - 76 19 - 95
Malawi 1 1 2 2 - 2 - - - - - - - - - - - - - - - - - - - 1 - 10 - 39 49 - - - - 1 - - - - - - - 15 1 39 55
Mali - - - - - - - - - - - - - - 1 - - - - - - - - - - - - - - - - - - - - - - - - - - - - 1 - - 1
Morocco - - - - - - - - - - - - - - - - - - - - 1 1 - 1 - 1 3 - - - - - - - - - - - - - - - - - - 5 - - 5
Mozambique - - - 1 - 1 - - - - - - - - - - - - - - - - - - - - - - - - - - - - - - - - - - - - - 1 - - 1
Nepal - - - - - - - - - - - - - - - - - - - - - - - - - - - - - - - - - - 5 - - - - - - - - 5 - - 5
New Zealand - - - - - - - - - - - - - - - - - - - - 2 - - - - - - - - - - - - - - - - - - - - - - 2 - - 2
Nigeria - 1 1 - - - - - - - - - - - 2 - 2 2 - - 93 9 102 - - - - - - - 1 - - 1 - - - - - - - - - - 2 3 101 12 - 113
Pakistan - - - - - - - - - - - - - - - - - - - - 3 3 - - - - - - - - 1 - 1 - - - - - - - 1 - 1 - - 4 1 - 5
Peru - - - - - - - - - - 1 1 - - - - - - - - - - - - - - - - - - - - - - - - - - - - - - - - 1 - 1
Poland - - - - - - - - - - - - - - - - - - - - - - - - 1 - - - - - - - - - - - - - - - - - - 1 - - 1
Portugal - - - - - - - - - - - - - - - - - - - - - - - - 1 - - - - - - - - - - - - - - - - - - 1 - - 1
Qatar - - - - - - - - - - - - - - - - - - - - 1 1 - - - - - - - - - - - - - - - - - - - - - - - 1 - - 1
Reunion - - - - - - - - - - - - - - - - - - - - - - - - 25 - 11 - - - - - - - - - - - - - - - - 25 11 - 36
Romania - - - - - - - - - - - - - - - - - - - - - - - - 1 - - - - - - - - - - - - - - - - - - 1 - - 1
Russia - - - - - - - - - - - - - - - - - - - - - - - - - - - - - - - - - - 1 - - - - - - - - 1 - - 1
Rwanda 1 1 2 - - - - - - 1 - 1 - - 1 - - - - - - - - - - 5 - - - - - - - - - - - - - - - - - 8 1 - 9
Senegal - - - - - - - - - - - - - - 3 - - - - - - - - - - - - - - - - - - - - - - - - - - - - 3 - - 3
Seychelles 17 - 17 2 - 2 - - - 6 1 7 - - - - 2 2 - - 1 1 - - - - - - - - - - - - - - - - - - - 1 1 - - 26 4 - 30
Sierra Leone - - - - - - - - - - - - - - - - - - - - - - - - - 1 - - - - - - - - - - - - - - - - - 1 - - 1
South Africa 3 - 3 - - - - - - 6 - 6 - - 2 1 - 1 - 4 78 - - - 5 - - 1 - - 1 - - - - - - - - - - 17 - 117 - - 117
Spain - - - - - - - - - - - - - - - - - - - - - - - - 1 - - - - - - - - - - - - - - - - - - 1 - - 1
Tanzania - 1 1 - - - - - - - - - - - - - - - - - 16 16 1 - - - - - - - - - - - - - - - - - - - - - - 17 1 - 18
Togo - - - - - - - - - - - - - - 5 - - - - - 1 1 - - - - - - - - - - - - - - - - - - - - - - - 6 - - 6
Tunisia - - - - - - - - - - - - - - 1 - - - - - - - - - - - - - - - - - - - - - - - - - - - - 1 - - 1
Uganda 2 - 2 - - - - - - - - - - - - - - - - - 8 8 - - - - - 1 - - - - - - - - - - - - - - - - - 11 - - 11
United Kingdom - - - - - - - - - 1 1 2 - - - - - - - - - - - - - - - - - - - - - - - - - - - - - - - 1 1 - 2
USA - - - - - - - - - - 1 1 - - - - 1 1 - - - - - - - - - - - - - - - - - - - - - - - - - - 2 - 2
Vietnam - - - - - - - - - - - - - - 3 - - - - - - - - - - - - - - - - - - - - - - - - - - - - 3 - - 3
Zambia - - - - - - - - - - 1 1 - - - - - - - - - - - - - 5 - - - - - - - - - - - - - - - - - 5 1 - 6Zimbabwe 1 2 3 1 - 1 - - - 1 - 1 - - - - 1 1 - - 2 2 1 - - - - - - - - - - - 1 1 - - - - - - - - - 7 4 - 11
Total 51 15 66 11 3 14 2 2 1 36 6 42 6 24 62 1 7 8 13 4 152 9 161 160 10 7 17 89 19 21 14 3 69 86 2 1 1 66 5 1 1 1 3 4 43 3 778 77 69 924Key: FT - Full Time, PT- Part Time, DE- Distance Education, T- Total
Country
Table 52: Enrolment of International Students in Tertiary Education locally by Country of Origin, Institution,Mode and Level of Study, 2012/13
Amity Institute of Higher Education
Whitefield Business School TotalUoM
Middlesex University (Mauritius
Branch Campus)
UTM
Charles Telfair
Institute JR School
The Mauritius Chamber of Commerce
and Industry
Institition
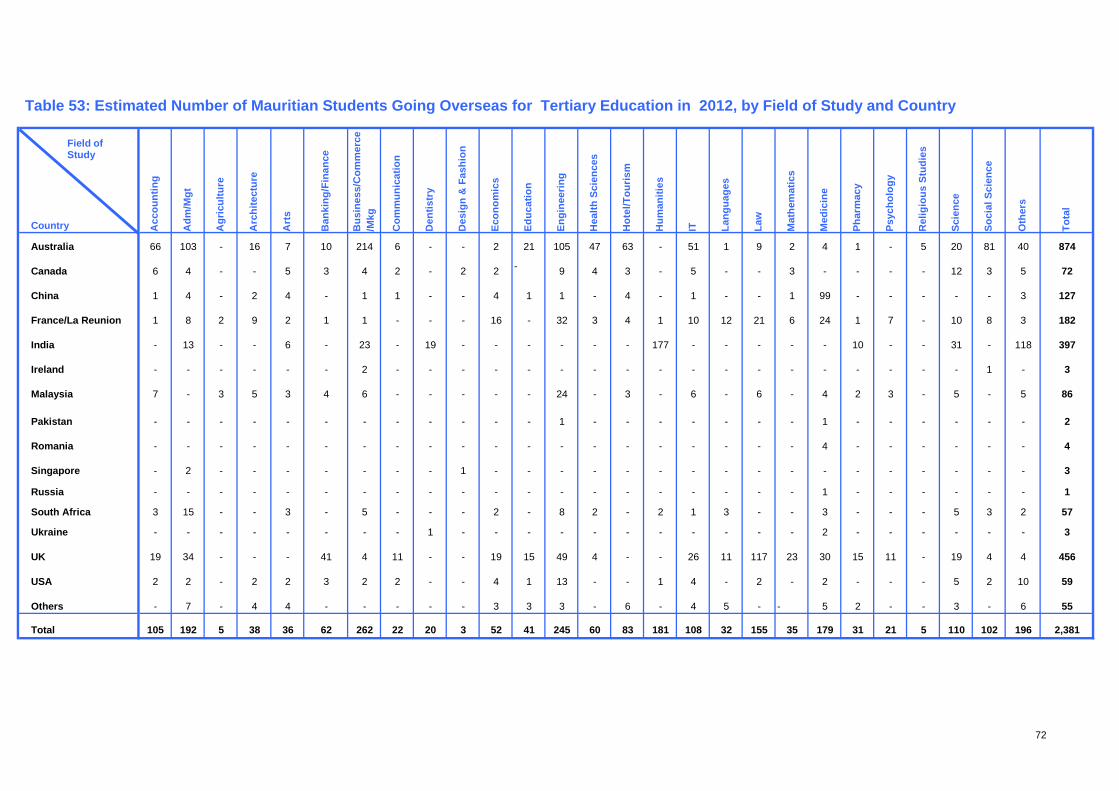
72
Country Acc
ount
ing
Adm
/Mgt
Agr
icul
ture
Arc
hite
ctur
e
Art
s
Ban
king
/Fin
ance
Bus
ines
s/C
omm
erce
/Mkg
Com
mun
icat
ion
Den
tistr
y
Des
ign
& F
ashi
on
Econ
omic
s
Educ
atio
n
Engi
neer
ing
Hea
lth S
cien
ces
Hot
el/T
ouris
m
Hum
aniti
es
IT Lang
uage
s
Law
Mat
hem
atic
s
Med
icin
e
Phar
mac
y
Psyc
holo
gy
Rel
igio
us S
tudi
es
Scie
nce
Soci
al S
cien
ce
Oth
ers
Tota
l
Australia 66 103 - 16 7 10 214 6 - - 2 21 105 47 63 - 51 1 9 2 4 1 - 5 20 81 40 874
Canada 6 4 - - 5 3 4 2 - 2 2 - 9 4 3 - 5 - - 3 - - - - 12 3 5 72
China 1 4 - 2 4 - 1 1 - - 4 1 1 - 4 - 1 - - 1 99 - - - - - 3 127
France/La Reunion 1 8 2 9 2 1 1 - - - 16 - 32 3 4 1 10 12 21 6 24 1 7 - 10 8 3 182
India - 13 - - 6 - 23 - 19 - - - - - - 177 - - - - - 10 - - 31 - 118 397
Ireland - - - - - - 2 - - - - - - - - - - - - - - - - - - 1 - 3
Malaysia 7 - 3 5 3 4 6 - - - - - 24 - 3 - 6 - 6 - 4 2 3 - 5 - 5 86
Pakistan - - - - - - - - - - - - 1 - - - - - - - 1 - - - - - - 2
Romania - - - - - - - - - - - - - - - - - - - - 4 - - - - - - 4
Singapore - 2 - - - - - - - 1 - - - - - - - - - - - - - - - - - 3
Russia - - - - - - - - - - - - - - - - - - - - 1 - - - - - - 1
South Africa 3 15 - - 3 - 5 - - - 2 - 8 2 - 2 1 3 - - 3 - - - 5 3 2 57
Ukraine - - - - - - - - 1 - - - - - - - - - - - 2 - - - - - - 3
UK 19 34 - - - 41 4 11 - - 19 15 49 4 - - 26 11 117 23 30 15 11 - 19 4 4 456
USA 2 2 - 2 2 3 2 2 - - 4 1 13 - - 1 4 - 2 - 2 - - - 5 2 10 59
Others - 7 - 4 4 - - - - - 3 3 3 - 6 - 4 5 - - 5 2 - - 3 - 6 55
Total 105 192 5 38 36 62 262 22 20 3 52 41 245 60 83 181 108 32 155 35 179 31 21 5 110 102 196 2,381
Table 53: Estimated Number of Mauritian Students Going Overseas for Tertiary Education in 2012, by Field of Study and Country
Field of Study
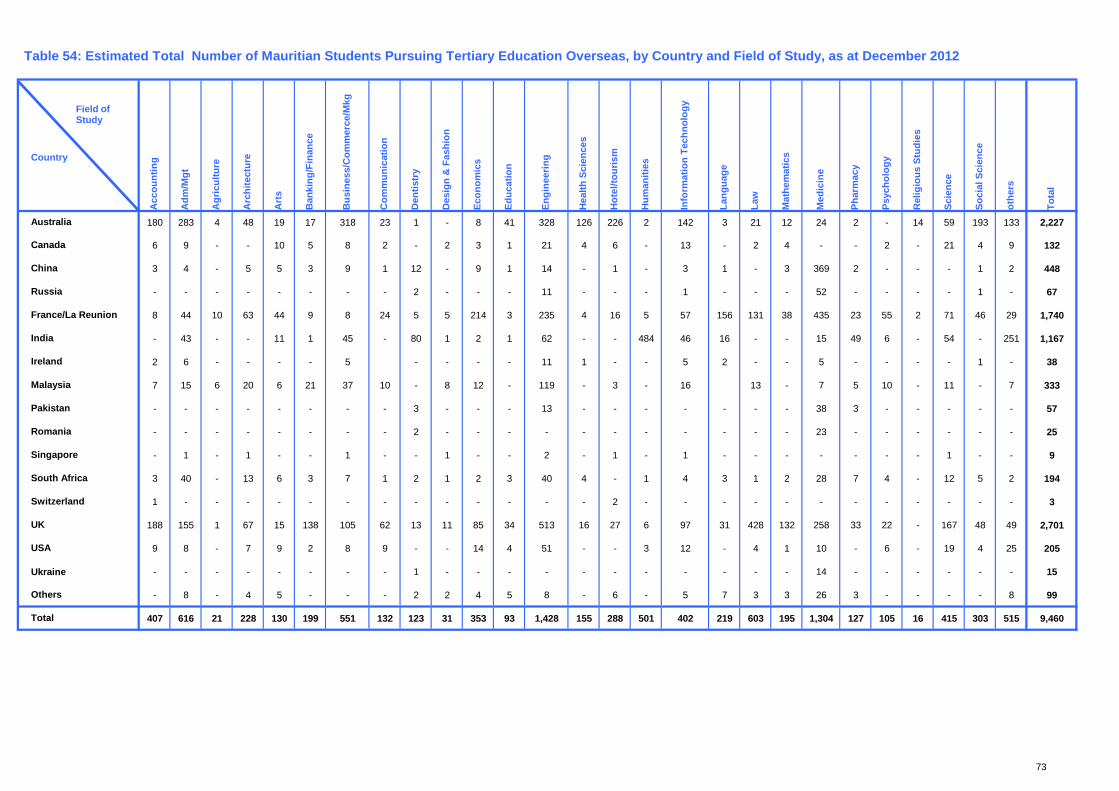
73
Acc
ount
ing
Adm
/Mgt
Agr
icul
ture
Arc
hite
ctur
e
Art
s
Ban
king
/Fin
ance
Bus
ines
s/C
omm
erce
/Mkg
Com
mun
icat
ion
Den
tistr
y
Des
ign
& F
ashi
on
Econ
omic
s
Educ
atio
n
Engi
neer
ing
Hea
lth S
cien
ces
Hot
el/to
uris
m
Hum
aniti
es
Info
rmat
ion
Tech
nolo
gy
Lang
uage
Law
Mat
hem
atic
s
Med
icin
e
Phar
mac
y
Psyc
holo
gy
Rel
igio
us S
tudi
es
Scie
nce
Soci
al S
cien
ce
othe
rs
Tota
l
180 283 4 48 19 17 318 23 1 - 8 41 328 126 226 2 142 3 21 12 24 2 - 14 59 193 133 2,227
6 9 - - 10 5 8 2 - 2 3 1 21 4 6 - 13 - 2 4 - - 2 - 21 4 9 132
3 4 - 5 5 3 9 1 12 - 9 1 14 - 1 - 3 1 - 3 369 2 - - - 1 2 448
- - - - - - - - 2 - - - 11 - - - 1 - - - 52 - - - - 1 - 67
8 44 10 63 44 9 8 24 5 5 214 3 235 4 16 5 57 156 131 38 435 23 55 2 71 46 29 1,740
- 43 - - 11 1 45 - 80 1 2 1 62 - - 484 46 16 - - 15 49 6 - 54 - 251 1,167
2 6 - - - - 5 - - - - 11 1 - - 5 2 - - 5 - - - - 1 - 38
7 15 6 20 6 21 37 10 - 8 12 - 119 - 3 - 16 13 - 7 5 10 - 11 - 7 333
- - - - - - - - 3 - - - 13 - - - - - - - 38 3 - - - - - 57
- - - - - - - - 2 - - - - - - - - - - - 23 - - - - - - 25
- 1 - 1 - - 1 - - 1 - - 2 - 1 - 1 - - - - - - - 1 - - 9
3 40 - 13 6 3 7 1 2 1 2 3 40 4 - 1 4 3 1 2 28 7 4 - 12 5 2 194
1 - - - - - - - - - - - - - 2 - - - - - - - - - - - - 3
188 155 1 67 15 138 105 62 13 11 85 34 513 16 27 6 97 31 428 132 258 33 22 - 167 48 49 2,701
9 8 - 7 9 2 8 9 - - 14 4 51 - - 3 12 - 4 1 10 - 6 - 19 4 25 205
Ukraine - - - - - - - - 1 - - - - - - - - - - - 14 - - - - - - 15
- 8 - 4 5 - - - 2 2 4 5 8 - 6 - 5 7 3 3 26 3 - - - - 8 99
407 616 21 228 130 199 551 132 123 31 353 93 1,428 155 288 501 402 219 603 195 1,304 127 105 16 415 303 515 9,460Total
Singapore
South Africa
Switzerland
UK
USA
Others
France/La Reunion
India
Ireland
Malaysia
Pakistan
Romania
Table 54: Estimated Total Number of Mauritian Students Pursuing Tertiary Education Overseas, by Country and Field of Study, as at December 2012
Country
Australia
Canada
China
Russia
Field of Study
74
ANNEX
DEFINITION OF TERTIARY EDUCATION AND TERTIARY EDUCATION ENROLMENT RATE
According to UNESCO, the Gross Enrolment Rate at the tertiary level (GTER) is defined as the number of students enrolled in tertiary education (ISCED level 5 and 6), regardless of age, expressed as a percentage of the population in the theoretical age group for that level of education, that is the five-year age group following official secondary school graduation age (taken in our case as 20 to 24 years) i.e, GTER= (Enrolment in Tertiary Education/population aged 20-24 years) * 100 UNESCO defines tertiary education to include universities, teachers’ colleges, and higher professional schools, requiring as a minimum condition of admission the successful completion of education at the secondary level, or evidence of the attainment of an equivalent level of knowledge. TEC’s definition of tertiary education aligns itself with that of UNESCO and encompasses all post-HSC/ A Level or equivalent programmes leading, upon completion to the award of either a Certificate- 1 full academic year; or a Diploma- 2 full academic year; or a Degree– 3 full academic year; or Postgraduate Degree or any other qualification recognized by the TEC. However, the computation of GTER by UNESCO and TEC differs, as follows:
• For UNESCO, the number of students enrolled in tertiary education includes all students, local and international,enrolled and based locally andexcludes all local students studying overseas
i.e GER = Total Local Enrolment including international students divided by Population
aged 20-24 yr multiply by 100 = ((40,165)/104,556))*100 = 38%
• For TEC, on the other hand, the number of students enrolled in tertiary education refers to Mauritian students only
, irrespective of whether they are studying locally or overseas.
As a result, our GTER reflects the participation rate of the local population in tertiary education
as opposed to that of UNESCO which gauges the local supply capacity with regard to tertiary
education.
75
Our GTER for 2012, accordingly, works out at 46.6%, as follows:
GTER= (Total Enrolment minus International students divided by (Population aged
20-24 yr) multiply by 100 = (49,625- 924/ 104,556)* 100 =48,701/ 104,556 * 100 = 46.6%
The attention of users is drawn to the fact that the GTER and not the Net Tertiary enrolment Rate (NTER) is the most widely adopted indicator internationally, for obvious practical reasons. The GTER refers to the number of students enrolled at the tertiary level, whether or not they belong to the relevant age group for that level. The NTER, on the other hand, is the number of students enrolled at the tertiary level who belong in the relevant age group as a percentage of the population in that age group.