Embed Size (px)
DESCRIPTION
Particle Pollution and Greenhouse Gas Emissions Metropolitan Washington Area. Metropolitan Washington Council of Governments Joan Rohlfs November 1, 2007. Outline. Clean Air Act and the Metropolitan Washington Region Fine Particle Pollution Climate Change Measures with Co-Benefits - PowerPoint PPT Presentation
Citation preview
1
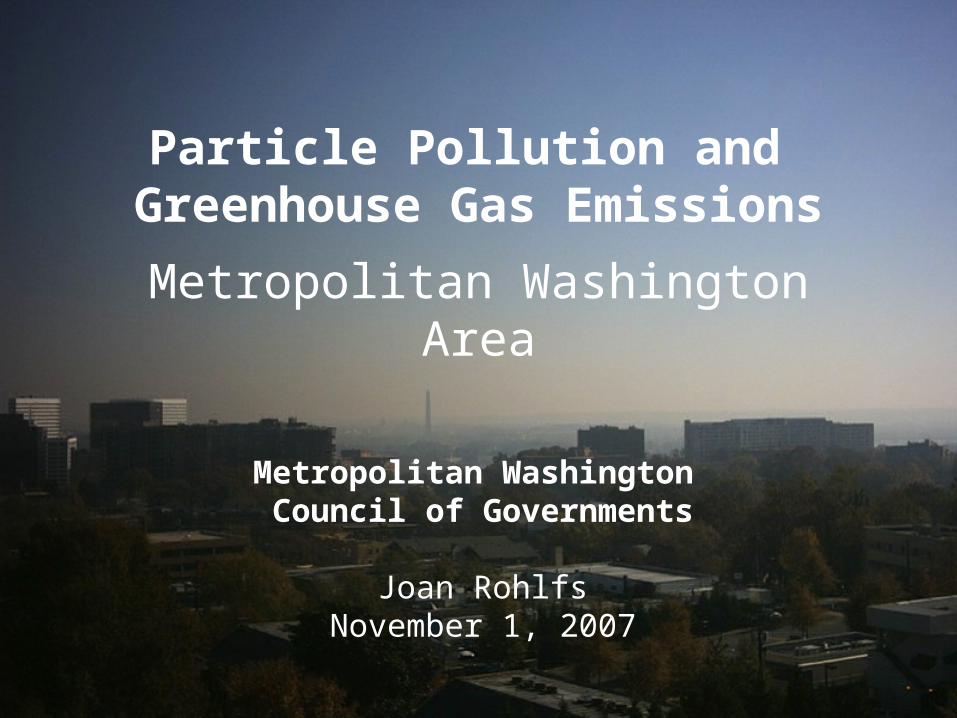
Particle Pollution and Greenhouse Gas Emissions
Metropolitan Washington Area
Metropolitan Washington Council of Governments
Joan RohlfsNovember 1, 2007
2
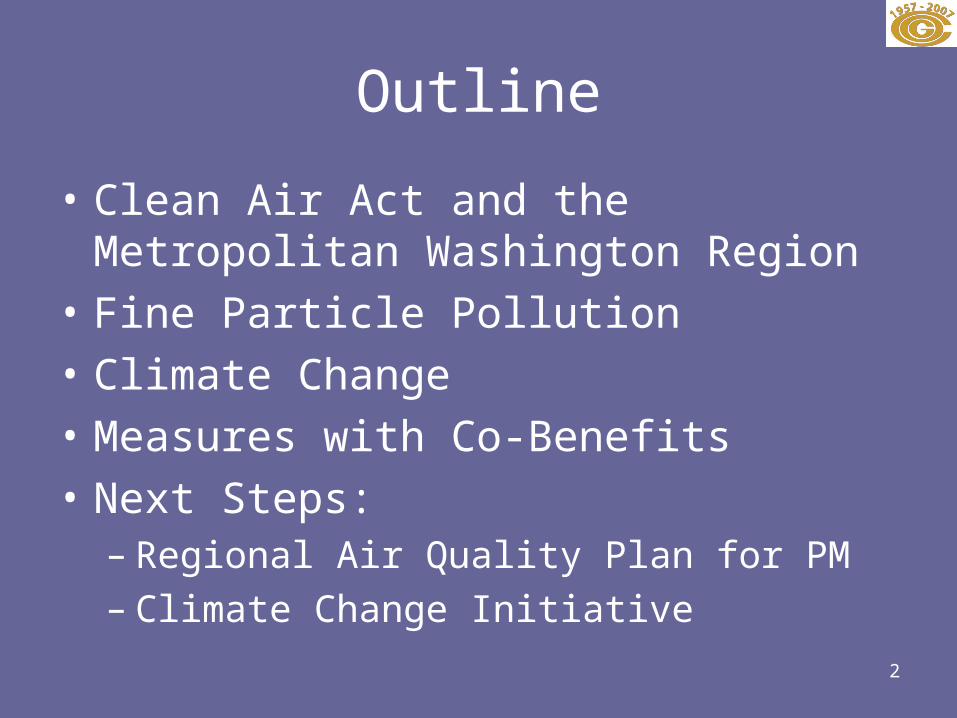
Outline
• Clean Air Act and the Metropolitan Washington Region
• Fine Particle Pollution
• Climate Change
• Measures with Co-Benefits
• Next Steps: – Regional Air Quality Plan for PM– Climate Change Initiative
3
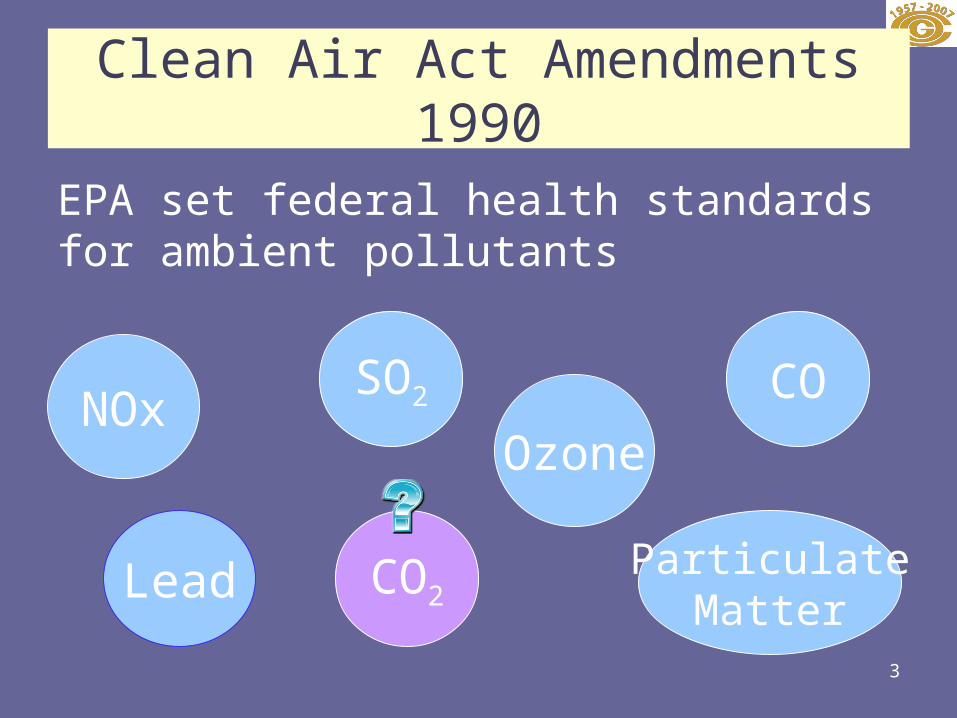
Clean Air Act Amendments 1990
EPA set federal health standards for ambient pollutants
NOxSO2
Lead
Ozone
CO
ParticulateMatter
CO2
4
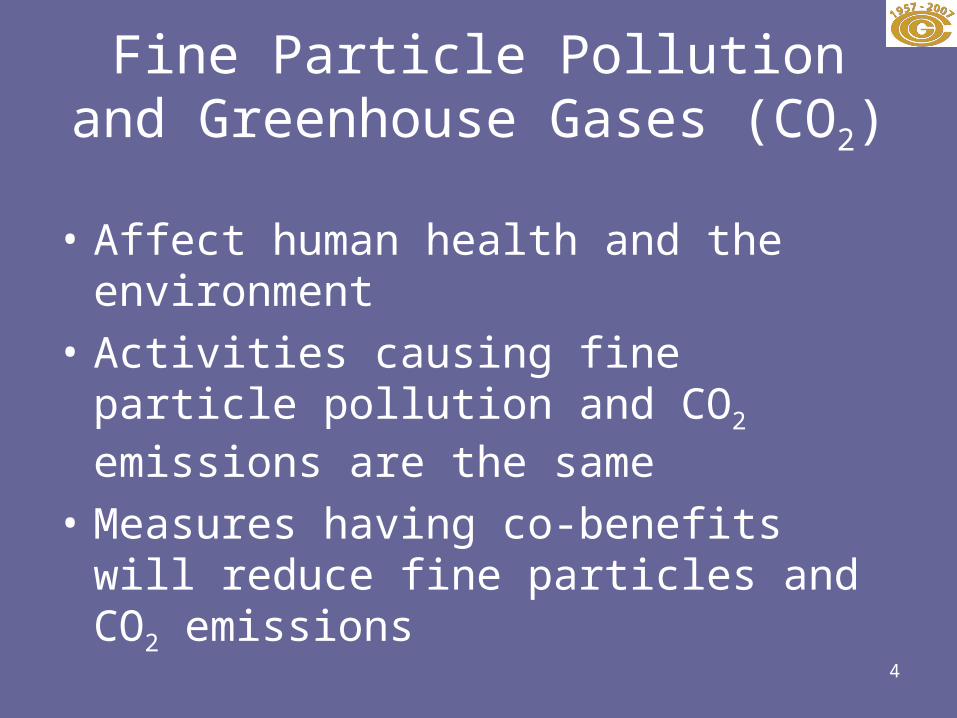
Fine Particle Pollution and Greenhouse Gases (CO2)
• Affect human health and the environment
• Activities causing fine particle pollution and CO2 emissions are the same
• Measures having co-benefits will reduce fine particles and CO2 emissions
5
Metropolitan Washington Air Quality Committee (MWAQC)
• Certified in 1992 by Mayor of the District of Columbia and governors of MD and VA
• Purpose: to prepare regional air quality plans
• Membership includes local government elected officials, state air and transportation planning officials, and the Transportation Planning Board chair
6
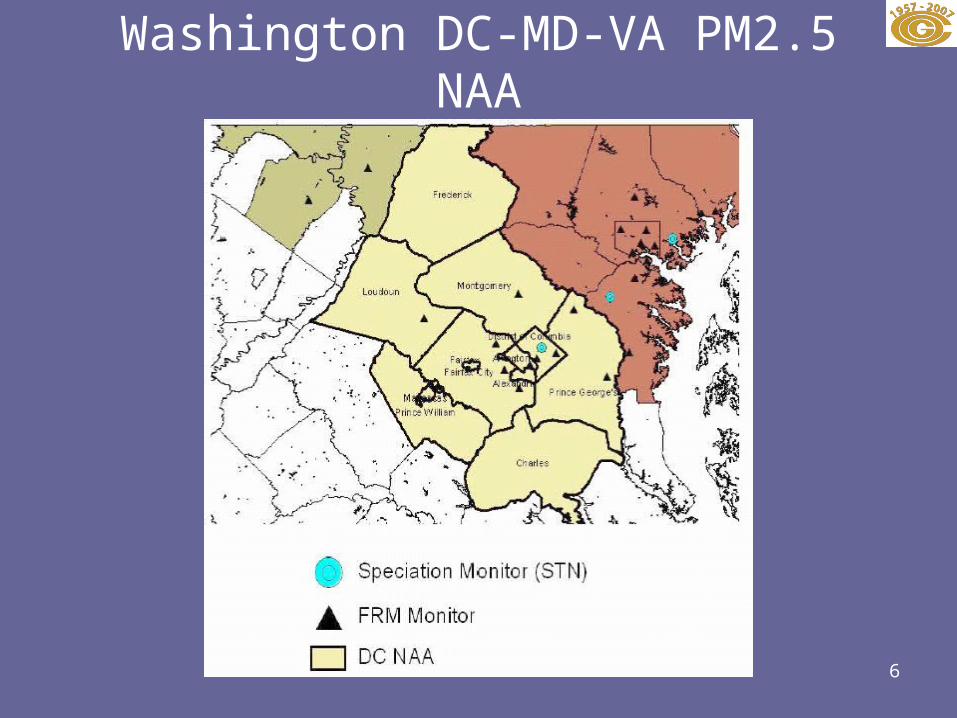
Washington DC-MD-VA PM2.5 NAA
7
AQI Range
AQI Color
8-Hr O3 Range (ppb)
24-Hr PM2.5 Range (µg/m3)
201-300
Purple 125-374 150.5-250.4
151-200
Red 105-124 65.5-150.4
101-150
Orange 85-104 40.5-65.4
51-100 Yellow 65-84 15.5-40.4
0-50 Green 0-64 0-15.4
AIR QUALITY INDEX
100
Federal Health Standard
8
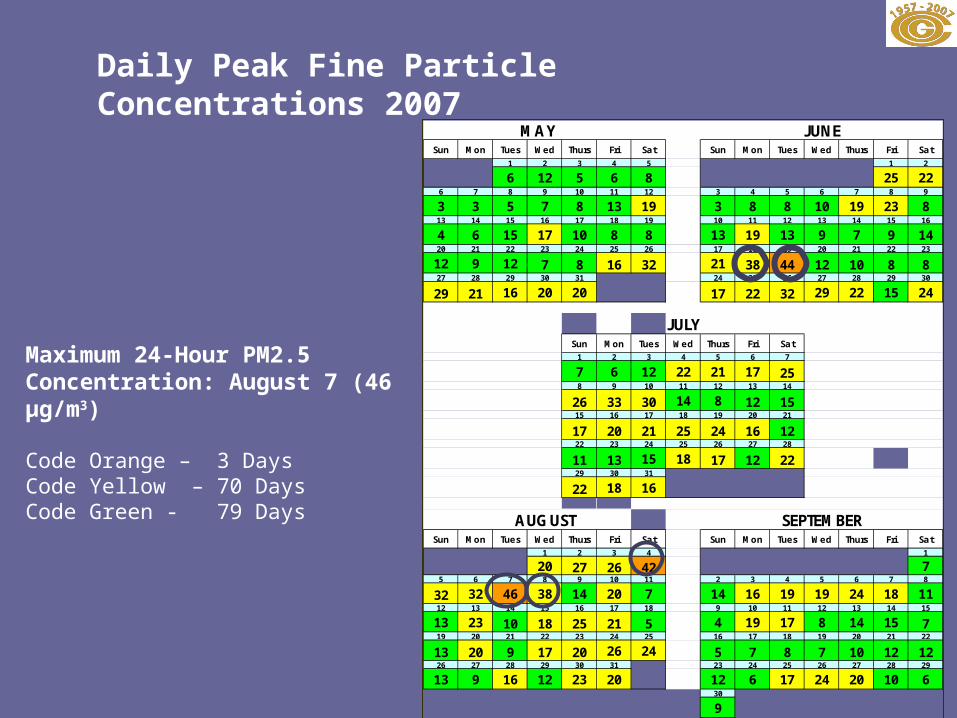
Daily Peak Fine Particle Concentrations 2007
Maximum 24-Hour PM2.5 Concentration: August 7 (46 µg/m3)
Code Orange – 3 DaysCode Yellow – 70 DaysCode Green - 79 Days
Sun Mon Tues Wed Thurs Fri Sat Sun Mon Tues Wed Thurs Fri Sat1 2 3 4 5 1 2
6 12 5 6 8 25 226 7 8 9 10 11 12 3 4 5 6 7 8 9
3 3 5 7 8 13 19 3 8 8 10 19 23 813 14 15 16 17 18 19 10 11 12 13 14 15 16
4 6 15 17 10 8 8 13 19 13 9 7 9 1420 21 22 23 24 25 26 17 18 19 20 21 22 23
12 9 12 7 8 16 32 21 38 44 12 10 8 827 28 29 30 31 24 25 26 27 28 29 30
29 21 16 20 20 17 22 32 29 22 15 24
JULYSun Mon Tues Wed Thurs Fri Sat
1 2 3 4 5 6 7
7 6 12 22 21 17 258 9 10 11 12 13 14
26 33 30 14 8 12 1515 16 17 18 19 20 21
17 20 21 25 24 16 1222 23 24 25 26 27 28
11 13 15 18 17 12 2229 30 31
22 18 16
AUGUST SEPTEMBERSun Mon Tues Wed Thurs Fri Sat Sun Mon Tues Wed Thurs Fri Sat
1 2 3 4 1
20 27 26 42 75 6 7 8 9 10 11 2 3 4 5 6 7 8
32 32 46 38 14 20 7 14 16 19 19 24 18 1112 13 14 15 16 17 18 9 10 11 12 13 14 15
13 23 10 18 25 21 5 4 19 17 8 14 15 719 20 21 22 23 24 25 16 17 18 19 20 21 22
13 20 9 17 20 26 24 5 7 8 7 10 12 1226 27 28 29 30 31 23 24 25 26 27 28 29
13 9 16 12 23 20 12 6 17 24 20 10 630
9
MAY JUNE
9
Air Quality Planning
• Washington region does not meet the National Ambient Air Quality Standards for ozone or fine particles
• The region prepares a plan (“SIP”)to meet the standard by a certain date
• Ozone SIP submitted May 2007; expect to meet ozone standard in 2009
• Currently the region is preparing a plan to reduce annual levels of fine particles by 2009
10
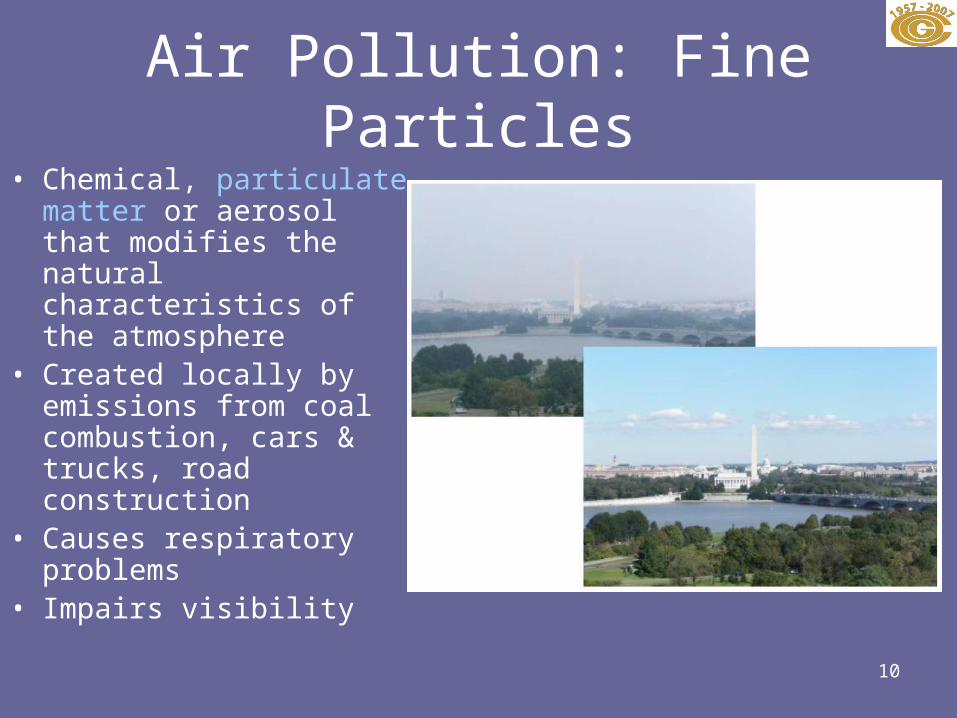
Air Pollution: Fine Particles• Chemical, particulate
matter or aerosol that modifies the natural characteristics of the atmosphere
• Created locally by emissions from coal combustion, cars & trucks, road construction
• Causes respiratory problems
• Impairs visibility
11MWCOG Dept. of Environmental Programs 2007
12
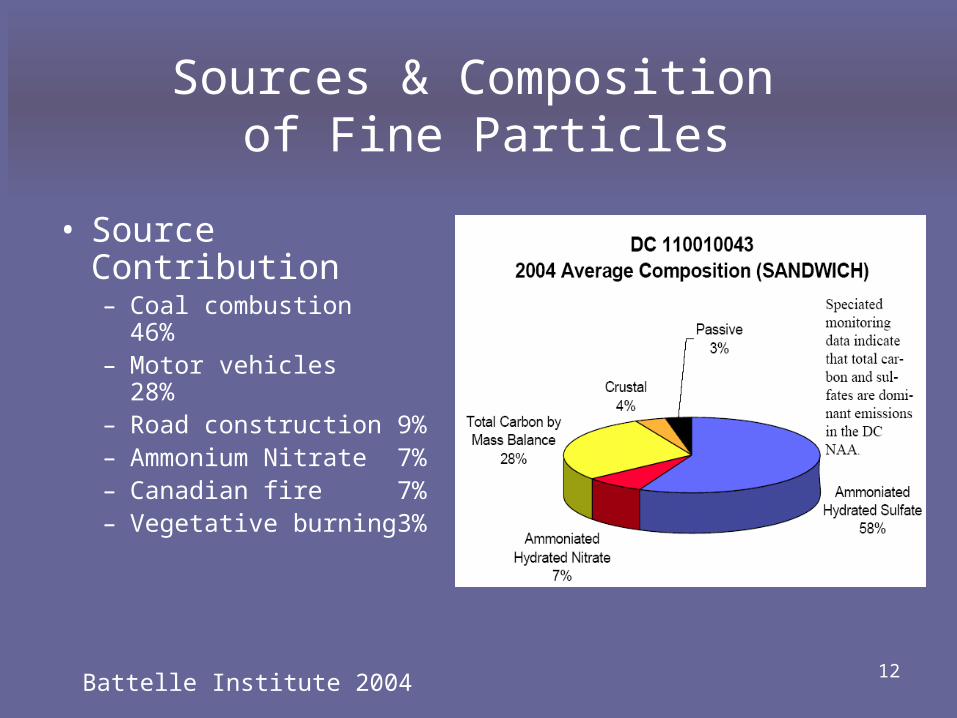
Sources & Composition of Fine Particles
• Source Contribution– Coal combustion
46%– Motor vehicles 28%– Road construction
9%– Ammonium Nitrate
7%– Canadian fire 7%– Vegetative burning
3%
Battelle Institute 2004
13
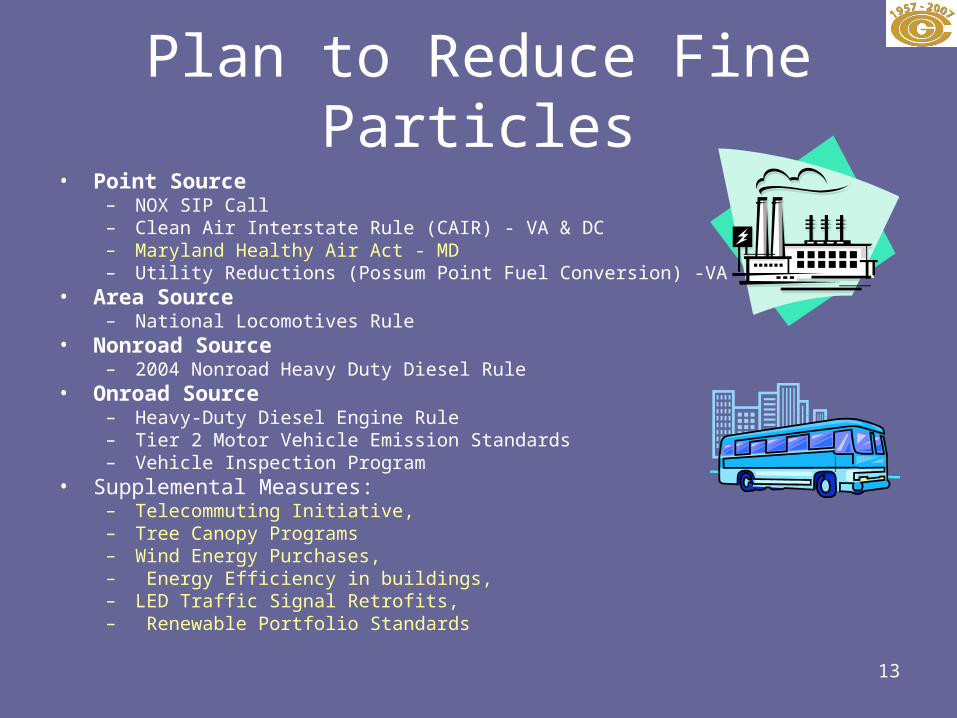
Plan to Reduce Fine Particles• Point Source
– NOX SIP Call– Clean Air Interstate Rule (CAIR) - VA & DC– Maryland Healthy Air Act - MD– Utility Reductions (Possum Point Fuel Conversion) -VA
• Area Source– National Locomotives Rule
• Nonroad Source– 2004 Nonroad Heavy Duty Diesel Rule
• Onroad Source– Heavy-Duty Diesel Engine Rule – Tier 2 Motor Vehicle Emission Standards– Vehicle Inspection Program
• Supplemental Measures: – Telecommuting Initiative, – Tree Canopy Programs– Wind Energy Purchases,– Energy Efficiency in buildings,– LED Traffic Signal Retrofits,– Renewable Portfolio Standards
14
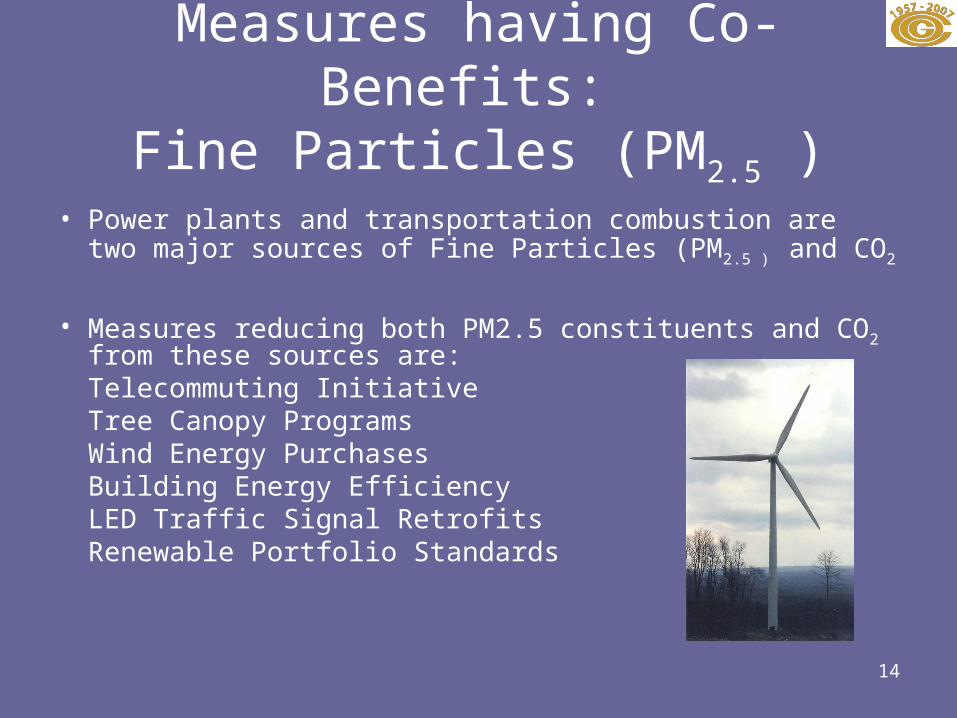
Measures having Co-Benefits: Fine Particles (PM2.5 )
• Power plants and transportation combustion are two major sources of Fine Particles (PM2.5 ) and CO2
• Measures reducing both PM2.5 constituents and CO2 from these sources are:
Telecommuting InitiativeTree Canopy ProgramsWind Energy PurchasesBuilding Energy EfficiencyLED Traffic Signal RetrofitsRenewable Portfolio Standards
15
16
Climate Change
• Variability in climate due to increase in heat trapping gases
• Increase in CO2 largely due to combustion of fossil fuels
• Affects sea levels, weather patterns, ecosystems
17
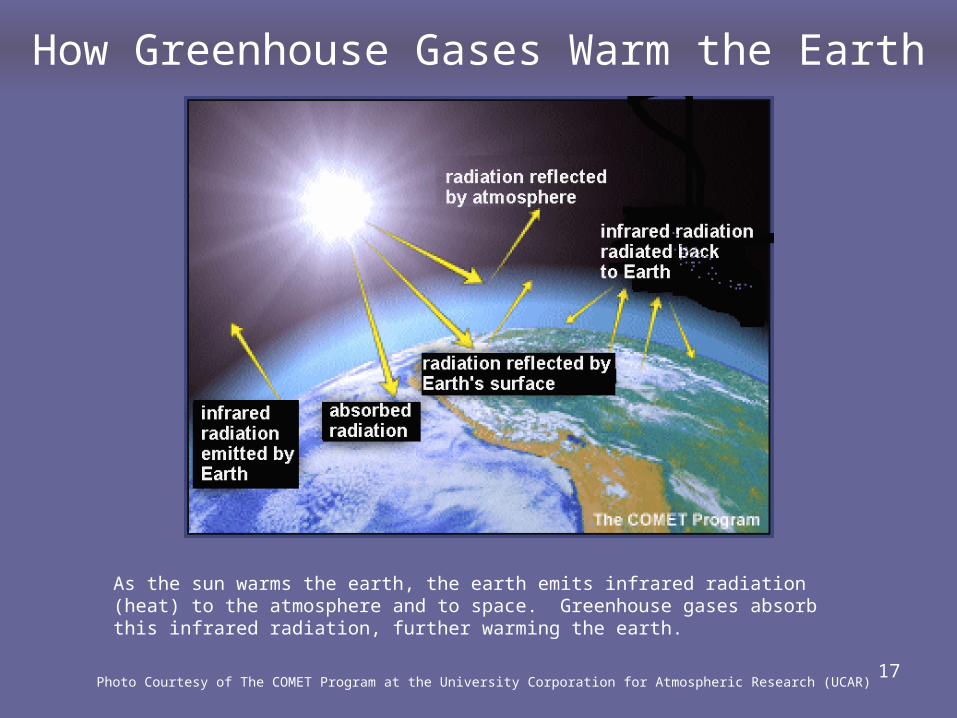
How Greenhouse Gases Warm the Earth
Photo Courtesy of The COMET Program at the University Corporation for Atmospheric Research (UCAR)
As the sun warms the earth, the earth emits infrared radiation (heat) to the atmosphere and to space. Greenhouse gases absorb this infrared radiation, further warming the earth.
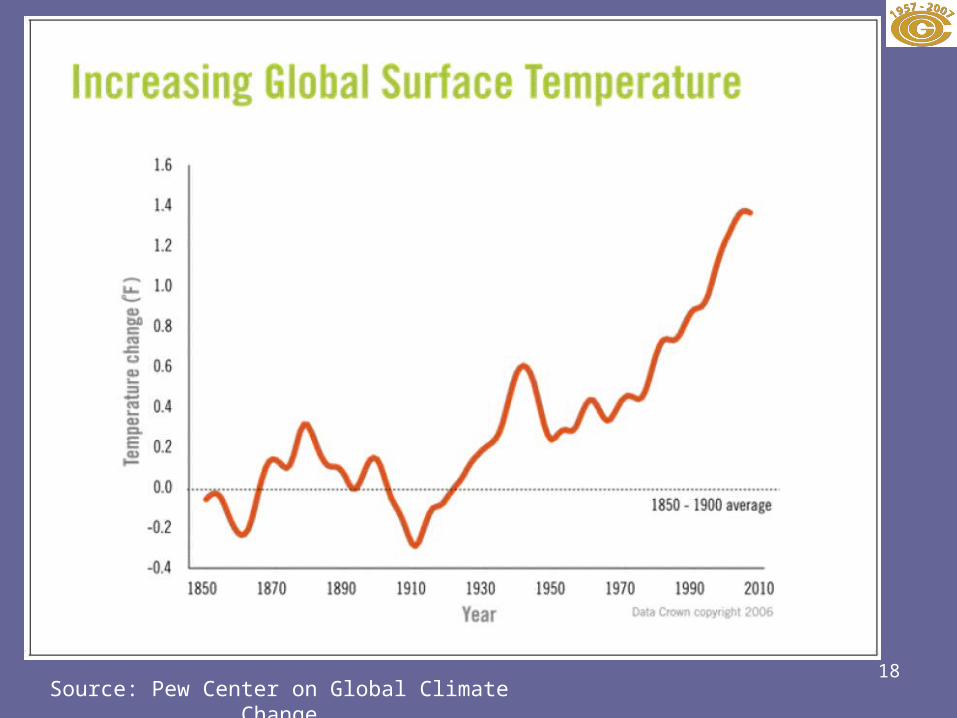
18Source: Pew Center on Global Climate Change
19
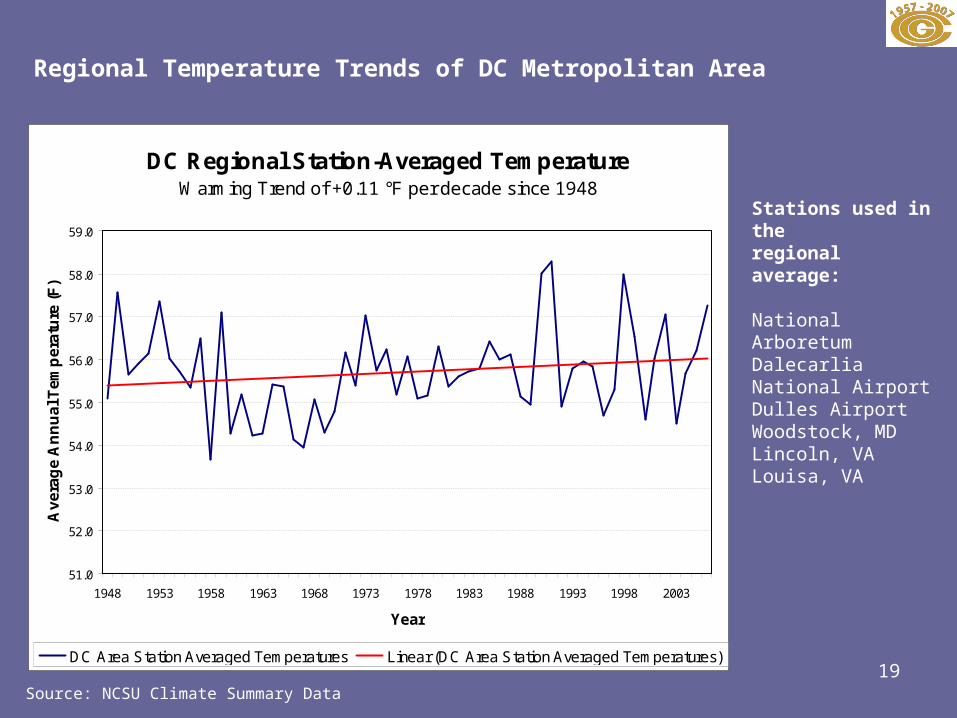
DC Regional Station-Averaged TemperatureWarming Trend of +0.11 °F per decade since 1948
51.0
52.0
53.0
54.0
55.0
56.0
57.0
58.0
59.0
1948 1953 1958 1963 1968 1973 1978 1983 1988 1993 1998 2003
Year
Av
era
ge
An
nu
al T
em
pe
ratu
re (
F)
DC Area Station Averaged Temperatures Linear (DC Area Station Averaged Temperatures)
Source: NCSU Climate Summary Data
Regional Temperature Trends of DC Metropolitan Area
Stations used in the regional average:
National Arboretum DalecarliaNational AirportDulles AirportWoodstock, MDLincoln, VALouisa, VA
20
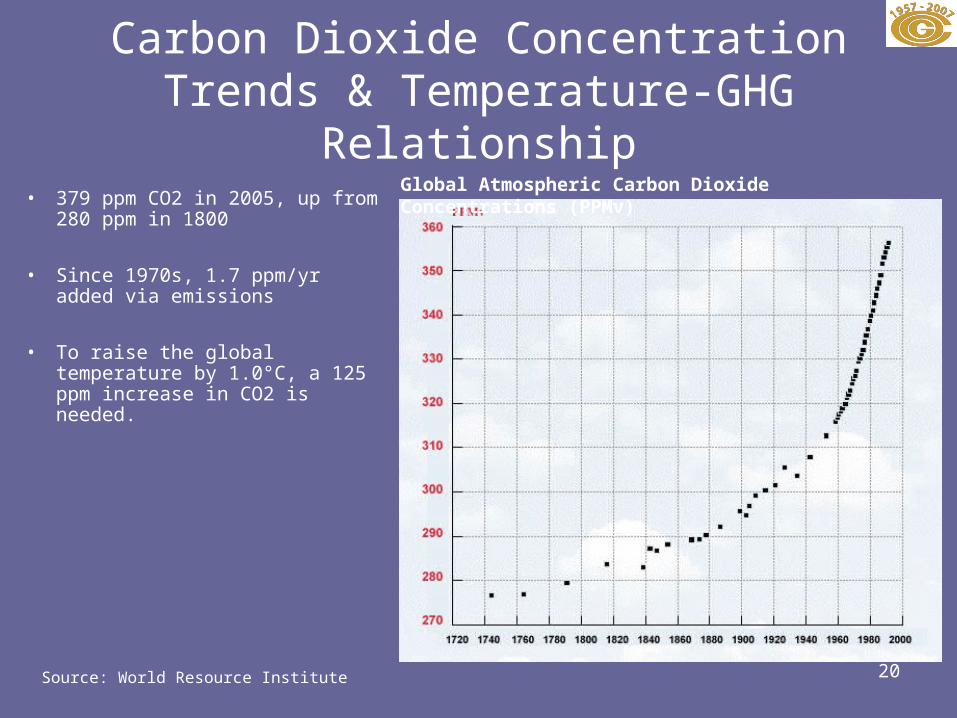
Carbon Dioxide Concentration Trends & Temperature-GHG Relationship
• 379 ppm CO2 in 2005, up from 280 ppm in 1800
• Since 1970s, 1.7 ppm/yr added via emissions
• To raise the global temperature by 1.0°C, a 125 ppm increase in CO2 is needed.
Source: World Resource Institute
Global Atmospheric Carbon Dioxide Concentrations (PPMv)
21
Intergovernmental Panel on Climate Change
“ Most of the observed increase in globally averaged temperatures since the mid-20th century is very likely due to the observed increase in anthropogenic greenhouse gas emissions”
IPCC Summary for Policy Makers, Climate Change 2007. The Physical Science Basis, working Group Report, February 2, 2007
22
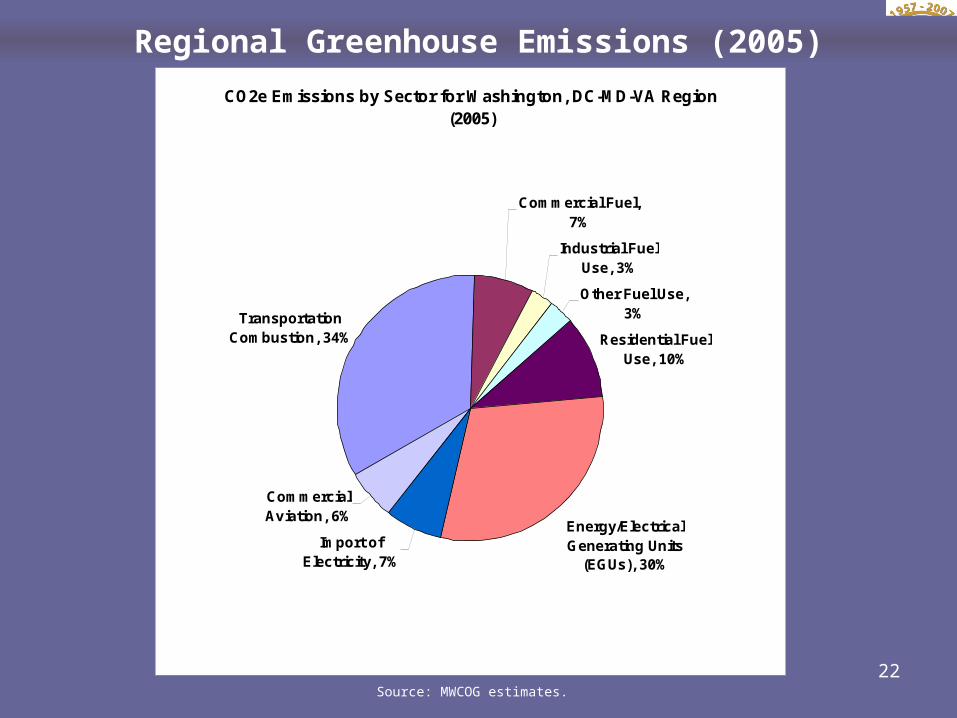
Regional Greenhouse Emissions (2005)
Source: MWCOG estimates.
CO2e Emissions by Sector for Washington, DC-MD-VA Region (2005)
Commercial Fuel, 7%
Industrial Fuel Use, 3%
Other Fuel Use, 3%
Residential Fuel Use, 10%
Import of Electricity, 7%
Commercial Aviation, 6%
Transportation Combustion, 34%
Energy/Electrical Generating Units
(EGUs), 30%
23
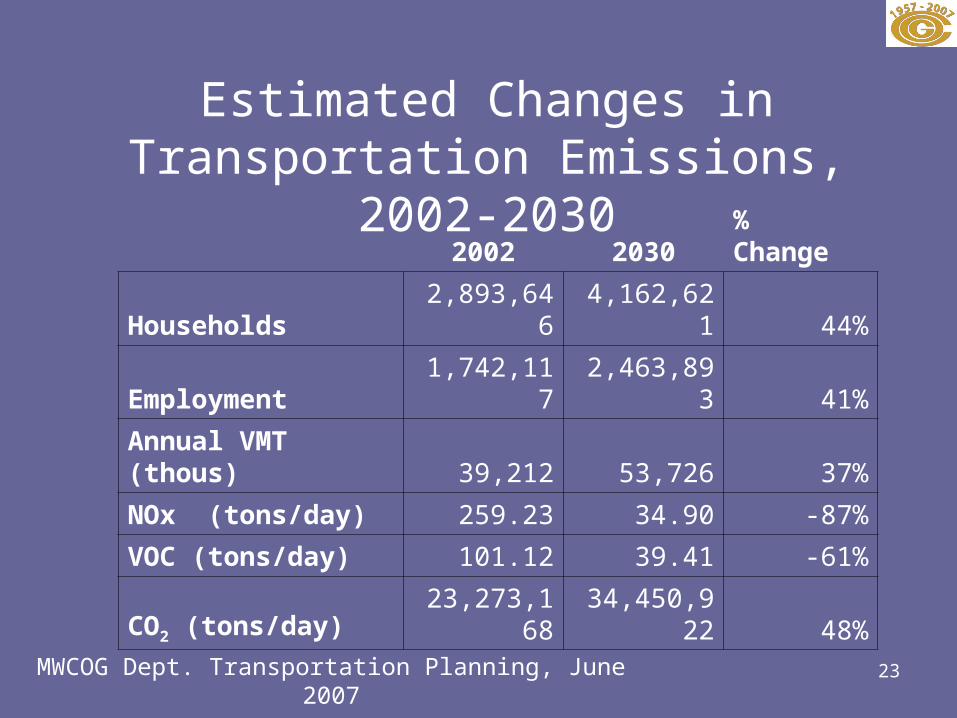
2002 2030% Change
Households 2,893,646 4,162,621 44%
Employment 1,742,117 2,463,893 41%
Annual VMT (thous) 39,212 53,726 37%
NOx (tons/day) 259.23 34.90 -87%
VOC (tons/day) 101.12 39.41 -61%
CO2 (tons/day) 23,273,168 34,450,922 48%
Estimated Changes in Transportation Emissions, 2002-
2030
MWCOG Dept. Transportation Planning, June 2007
24
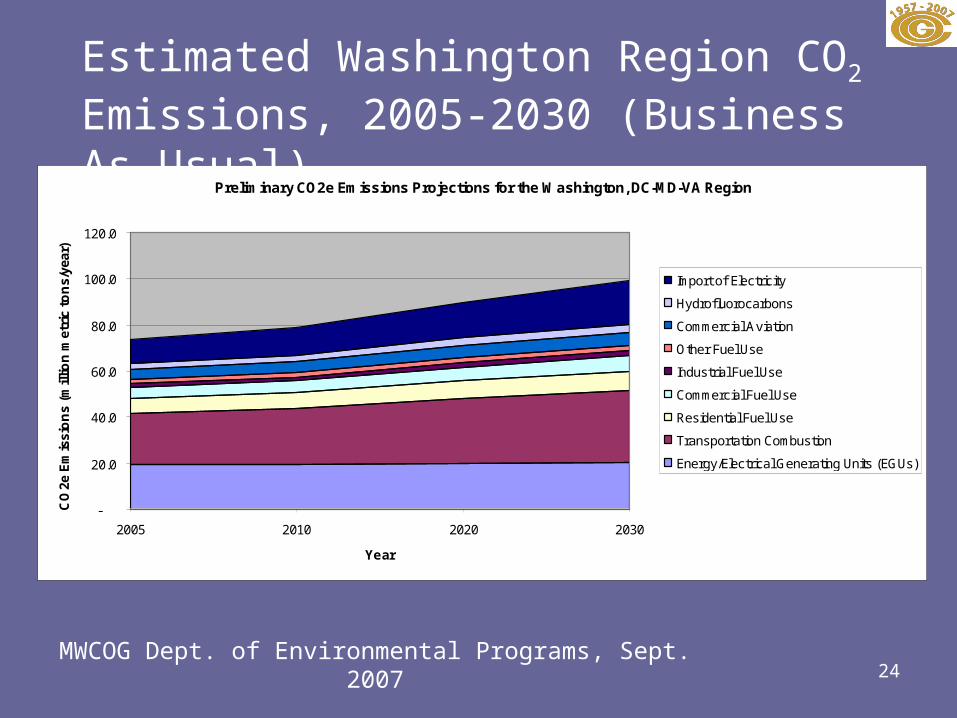
Preliminary CO2e Emissions Projections for the Washington, DC-MD-VA Region
-
20.0
40.0
60.0
80.0
100.0
120.0
2005 2010 2020 2030
Year
CO
2e E
mis
sio
ns
(mill
ion
met
ric
ton
s/ye
ar)
Import of Electricity
Hydrofluorocarbons
Commercial Aviation
Other Fuel Use
Industrial Fuel Use
Commercial Fuel Use
Residential Fuel Use
Transportation Combustion
Energy/Electrical Generating Units (EGUs)
Estimated Washington Region CO2 Emissions, 2005-2030 (Business As Usual)
MWCOG Dept. of Environmental Programs, Sept. 2007
25
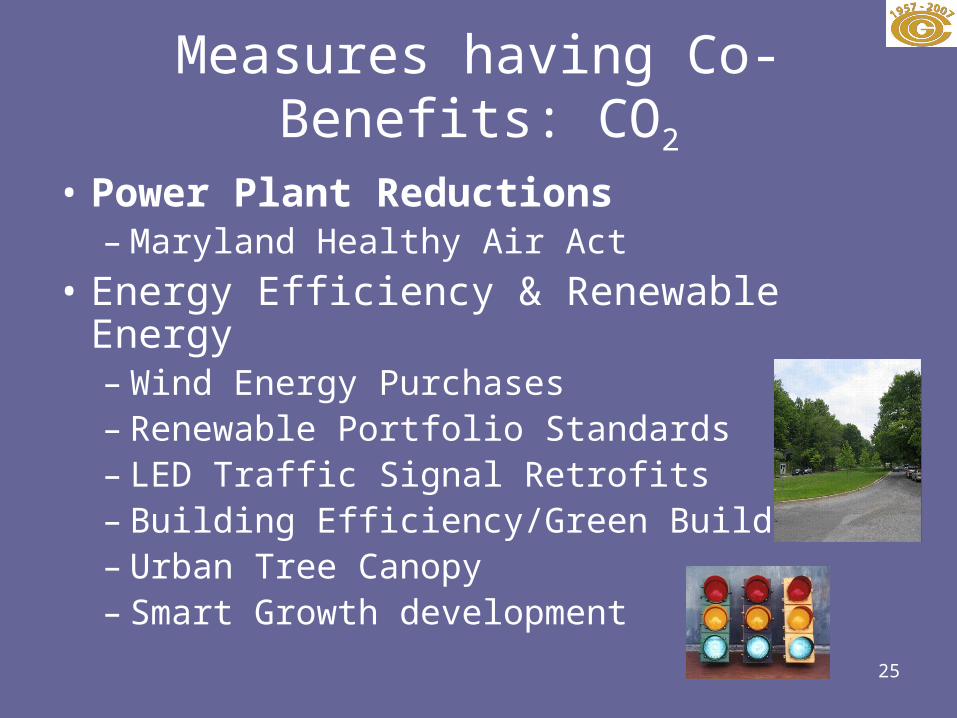
Measures having Co-Benefits: CO2
• Power Plant Reductions– Maryland Healthy Air Act
• Energy Efficiency & Renewable Energy– Wind Energy Purchases– Renewable Portfolio Standards– LED Traffic Signal Retrofits– Building Efficiency/Green Buildings– Urban Tree Canopy– Smart Growth development
26
Some GHG Reduction Goals
• Cool Counties (Arlington, Fairfax, Montgomery)– Stop growth in CO2 emissions by 2010– 80% below current levels by 2050
• Mayor’s Agreement (D.C.)– 7% below 1990 levels by 2012
• RGGI (Maryland)– 1990 levels by 2015– 10% below 2009 by 2019
27
• Regional Plan to Reduce Particle Pollution (“SIP”)– In December MWAQC will approve a draft plan for public hearing– Public hearings will be held in January-February 2008– Plan to be approved in March 2008
• COG’s Regional Climate Change Initiative (April 2008)– Regional targets and goals for reducing greenhouse gases will be
proposed– Best practices for mitigating greenhouse gases– Catalogue of local government measures to reduce GHG– Report on regional impacts from climate change– Recommendations on policy actions to reduce regional greenhouse
gases– Recommendations on state and national policy on climate change and
energy
The Next Steps
28
Contacts
MWAQC mwcog.org/environment/air
District Dept. of the Environment ddoe.dc.gov
Maryland Dept. of the Environment mde.state.md.us
Virginia Dept. of Environmental Quality deq.virginia.gov
Clean Air Partners cleanairpartners.net