Embed Size (px)
Citation preview
Particle Swarm Optimization Based Composite
Power System Reliability Analysis Using FACTS
Venkata Padmavathi S EEE Dept., GITAM University, Hyderabad, A.P., India
Email:[email protected]
Sarat Kumar Sahu EEE Dept., M.V.G.R Engg. Col., Vizianagaram, A.P., India
Email: [email protected]
A. Jayalaxmi EEE Dept., JNTU University, Hyderabad, A.P., India
Email: [email protected]
Abstract—With the introduction of competition in the
existing electrical market, it becomes necessary to enhance
the transmission capacity of the power system through the
existing transmission lines. The utilization of FACTS
technologies can have significant impact on power system
reliability. Low cost and feasibly better improvement can be
achieved by using power electronics based devices in the
system. Such devices are called Flexible Alternating Current
Transmission system (FACTS) devices. This work deals
with the reliability evaluation of generation system,
transmission system, and load system by probabilistic
technique. The composite system reliability can be enhanced
by adjusting the settings of the FACTS device (such as
reactance, phase angles, reactive power injection) with
respect to the system. This is based on DC and AC load flow
model. In this paper, the settings of Thyristor Controlled
Series Capacitor or Compensator (TCSC) and Unified
Power Flow Controller (UPFC) are found out using PSO
technique for enhancing the transmission power capability
to improve composite power system reliability. Now by
finding Loss of Load Probability(LOLP) by inserting TCSC
and UPFC in the line and compare the reliability after
connecting TCSC and UPFC separately.
Index Terms—flexible AC transmission system (FACTS),
thyristor controlled series capacitors (TCSC), particle
swarm optimization technique (PSO), loss of load
probability (LOLP), unified power flow controller (UPFC)
I. INTRODUCTION
The function of power system is to supply electrical
energy on demand, economically and within acceptable
levels of reliability and service quality. The basic element
in power system planning is the determination of how
much generation capacity required giving a reasonable
assurance of satisfying the load requirements. There are
wide range of probabilistic techniques have been
developed for the evaluation of system behavior. These
Manuscript received February 11, 2014; revised May 20, 2014.
include techniques for reliability evaluation, and
probabilistic load flow [1].
All the techniques are concerned with future behavior
of the component or system. In all cases the problem
cannot be defined as deterministic [2] but as stochastic in
nature (i.e.) it varies randomly with time.
FACTS [3] devices are well known for their voltage
control, reactive power compensation and power flow
control applications. FACTS technologies are proven
solutions to rapidly enhancing reliability and upgrading
transmission capacity on long term and cost effective
basis. These are effective where new transmission line
construction is not feasible. FACTS are high speed,
reliable, power electronic controllers that offer,
(a) Greater control of power so that it flows on the
prescribed transmission routes
(b) Secure loading of transmission lines to levels
nearer their thermal limits
(c) Greater ability to transfer between controlled areas
(d) Prevention of cascading outages and in damping of
power system oscillation.
II. COMPOSITE POWER SYSTEM RELIABILITY
EVALUATION
The total problem of assessing the adequacy of the
generation and bulk power transmission systems in regard
to provide suitable supply at the terminal stations can be
designed as composite power system reliability
evaluation[1], [4], [5].
2.1 Generation system reliability
2.2 Transmission system reliability
2.3 Composite power system reliability
A. Generation System Reliability
The total system generation is examined to determine
its adequacy to meet the total system load requirement.
This is usually termed “generation capacity reliability
evaluation”. In this study the transmission system and its
ability to move the generation energy to the consumer
International Journal of Electronics and Electrical Engineering Vol. 3, No. 2, April, 2015
©2015 Engineering and Technology Publishing 105doi: 10.12720/ijeee.3.2.105-109
load points is ignored. The only concern is in estimating
the necessary generation capacity to satisfy the system
demand and to have sufficient capacity to satisfy to
perform corrective and preventive maintenance on the
generation facilities.
B. Generation System Model
The generating units are divided into two groups: the
conventional units, which may be controlled and
scheduled, and the non-conventional units, which
generally can be scheduled. For the generation system
model the generation outages are treated individually and
the model is evaluated.
The generation system model failure probability
computed with the known data by
Probability (Pg) = ncrprq
n-r (1)
where n is number of units, p is availability of each unit,
and q is unavailability of each unit.
Using the above said formulas the generation system
model is computed.
C. Transmission System Reliability
Transmission system deals with the transfer of electric
power to the consumers in a reliable manner.
The electric power produced at the power station is
transmitted over large distances to the load center by
transmission lines. The transmission system associates
with itself the substation, switching station and their
associated components such as current transformers,
potential transformers, breakers, relays, bus bars, reactors,
capacitor banks, transmission lines. The bus scheme or
the configuration of components along with bus bars is to
be effectively planned for reliable supply of power to
consumers. The system under study usually end at
secondary buses, low voltage-switching devices may not
be considered. The components of almost consideration
are circuit breakers power transformers. This in contrast
to the generating systems the variety of components are
involved and the modeling of such a diversity of devices
can make the transmission system reliability evaluation
quiet formidable.
D. Transmission System Model
Transmission system model failure probability is
computed by using
Probability (Pt) = ncrprq
n-r (2)
where n is number of lines, r is number of available lines,
p is availability of each line, and q is unavailability of
each line.
E. Composite System Reliability
Composite system reliability evaluation refers to
assessments that consider both generation and
transmission contingencies. Some of the existing
network-based programs do have limited capability to
model generating unit outages. However there are several
concerns in the industry regarding the limitations of the
existing programs for composite system reliability
evaluation. For example, generation contingencies are not
considered accurately and efficiently on terms of
reliability programs could be defined to (1) multi area
reliability programs (generating unit outages, no
transmission outages, no load flows); (2) transmission
system reliability programs (load flow analysis
transmission outages, no generating unit outages); (3)
composite system reliability programs (load flow analysis,
generation and transmission outages).
In the network, based programs failure is defined in
terms line overloads and unacceptable bus voltage levels,
and load curtailment needed to alleviate these conditions.
Using the probability (or frequency) of contingencies that
could cause this condition, probability (or frequency)
different unacceptable conditions are computed as indices
of reliability. A major difficulty in developing these
programs has been to analyze a sufficient number of
contingencies a reasonable computation time in order to
have confidence in the calculated reliability indices. This
is particularly true when generation outages are included.
Composite Probability, Pc = Pg*Pt (3)
where,
Pg=probability of generating unit
Pt=probability of transmitting unit
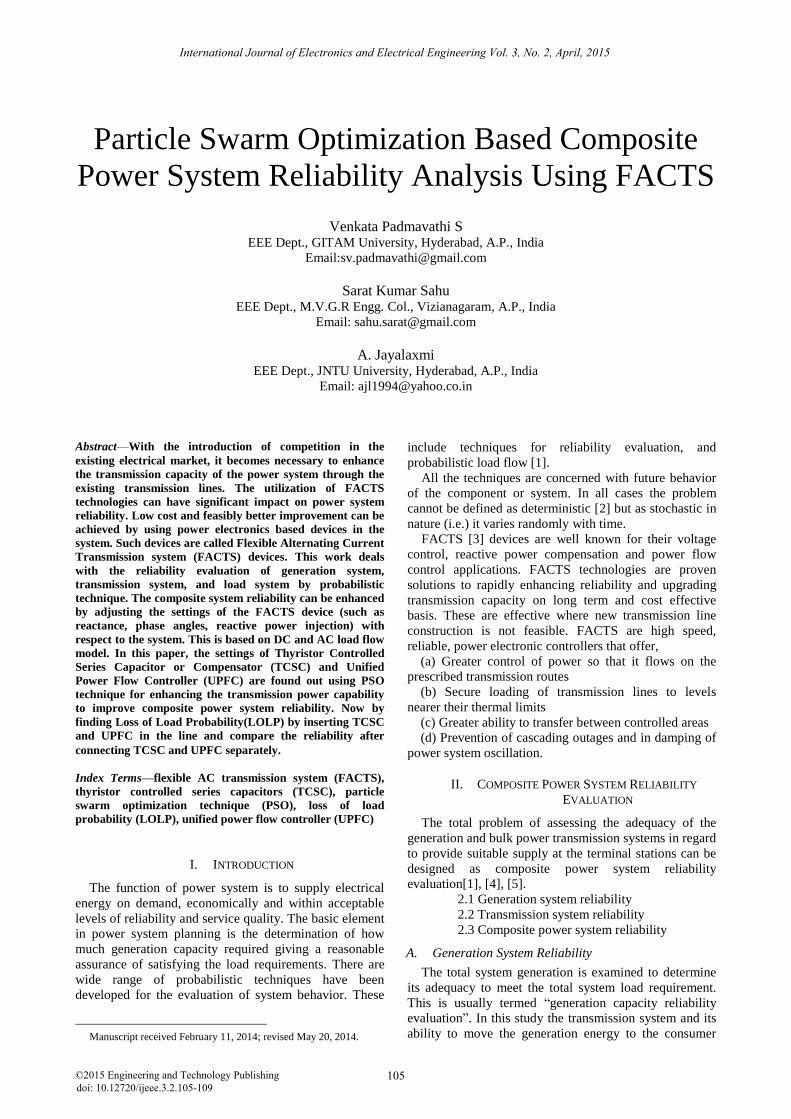
III. THYRISTOR CONTROLLED SERIES CAPACITORS
TCSC [3] is a capacitive reactance compensator which
consists of a series capacitor banks shunted by a thyristor
controlled reactor in order to provide a smoothly variable
series capacitive reactance. The TCSC model shown in
Fig. 1 has a variable reactor such as a thyristor controlled
reactor (TCR) is connected across a series capacitor.
When the TCR firing angle is 1800 the reactor becomes
non-conducting and series capacitor has its normal
reactance. As the firing angle reduces to less than 1800
the capacitive reactance increasing. When TCR firing
angle is 900 the reactor becomes fully conducting and the
total reactance becomes inductive because the reactor
impedance is designed to be much lower than the series
capacitor impedance with 900 to limit the fault current.
The TCSC may have one of the two possible
characteristics: capacitive or inductive, respectively to
decrease or increase the impedance of the branch. It is
modeled with variable series reactance. Its value is
function of the reactance of the line XL where the device
is located [6]. It is in the range:
-0.8XL<XTCSC<0.2XL
Figure 1. Model of TCSC
International Journal of Electronics and Electrical Engineering Vol. 3, No. 2, April, 2015
©2015 Engineering and Technology Publishing 106
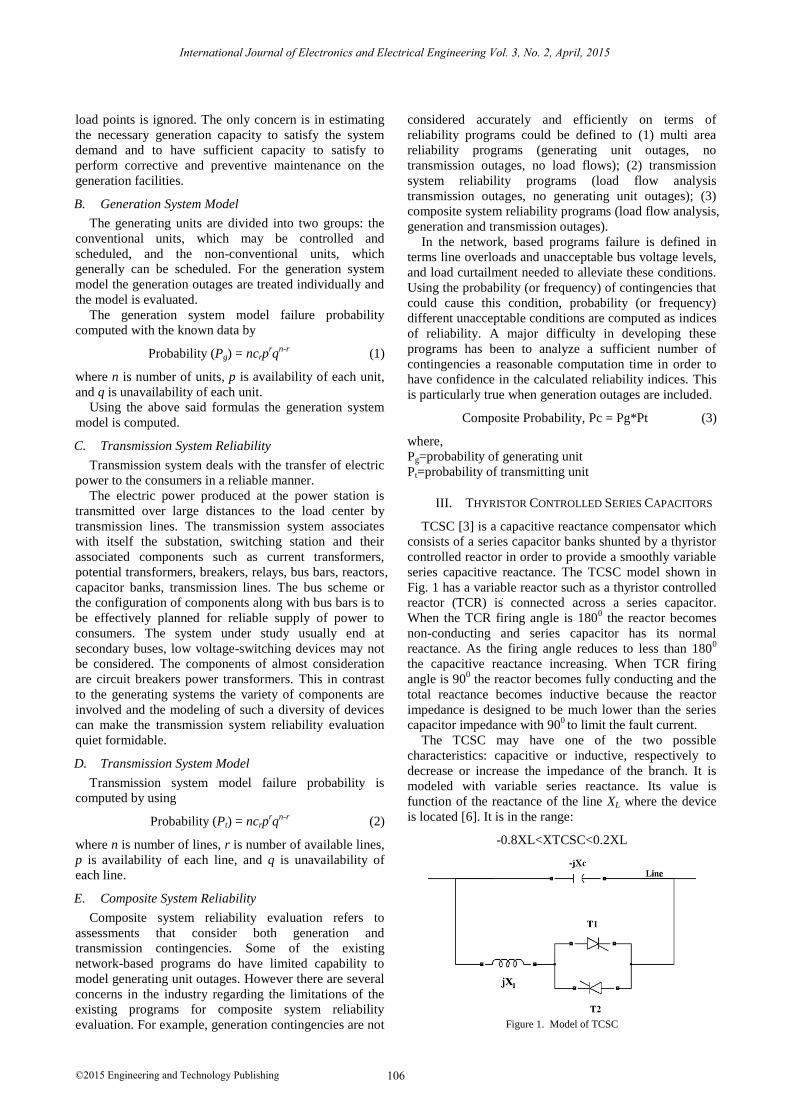
IV. UNIFIED POWER FLOW CONTROLLER
This could be a combination of separate shunt and
series controllers, which are controlled in a coordinated
manner, or a unified power flow controller with series
and shunt elements as shown in Fig. 2. In principle,
combined shunt and series controllers inject current into
the system with the shunt part of the controller and
voltage in series in the line with the series part of the
controller. However, when the shunt and series
controllers are unified, there can be a real power
exchange between the series and shunt controllers via the
power link.
UPFC consists of two voltage sourced converters are
operated from a common DC link provided by a DC
storage capacitor. The real power can flow in either
direction and each converter can independently generate
or absorb reactive power at its terminals.
The converter 2 provides the main function of UPFC
[3] by injecting a voltage in series with the line via an
insertion transformer. This injected voltage will act as
synchronous AC voltage source. The transmission line
current flows through this voltage source resulting in
reactive and real power exchange between it and the ac
system.
The reactive power exchanged at the AC terminal i.e.
at the terminal of the series insertion transformer is
generated internally by the converter. The real power
exchanged at the AC terminal is converted into DC at the
DC link. Converter 1 can also generate or absorb reactive
power and provide independent shunt reactive
compensation for the line. There is a closed direct path
for the real power by the series voltage injection through
converters 1 and 2 back to the line, the corresponding
reactive power exchanged is supplied or absorbed locally
by converter two. Alternatively it can independently
control both the real and reactive power flow in the line.
Figure 2. Model of UPFC
V. OVER VIEW OF PSO
Particle swarm optimization (PSO) [7] is an
evolutionary computation technique developed by Dr.
Eberhart and Dr. Kennedy in 1995, inspired by social
behavior of bird flocking or fish schooling. Similar to
genetic algorithms (GA), PSO is a population based
optimization tool. The system is initialized with a
population of random solutions and searches for optima
by updating generations. However, unlike GA, PSO has
no evolution operators such as crossover and mutation. In
PSO, the potential solutions, called particles are “flown”
through the problem space by following the current
optimum particles. The detailed information will be given
in the following sections.
Compared to GA, the advantages of PSO are that PSO
is easy to implement and there are few parameters to
adjust. PSO has been successfully applied in many areas:
function optimization, artificial neural network training,
fuzzy system control, and other areas where genetic
algorithm can be applied.
VI. METHODOLOGY
A. Probabilistic Elements Models
The forced outage rates for generating units, which
described the outage capacity density function for units
when two state models were used. The same type of
probabilistic description will be used for other
transmission elements in transmission system reliability.
Each transmission element can be described adequately
by two state models and associated FORs.
For simplicity two state models will be used
throughout.
B. Basic Philosophy
Given that each element, Vm, m=1, 2……….., E, in the
system under study [8] can reside in either the “0” state,
with probability qm, in which it has no capacity and is out
of service, or the “1” state, with probability pm, in which
it has capacity Cm and is in service, the system will have
2E distinct capacity states Xi, i=1, 2, 3…………..2
E. Take
the 6bus RBTS system it has 11 elements: 2 generators
and 9 lines so the system can reside in any one of 211
different capacity states Xi. Obviously the upper and
lower limiting states denoted by X =(1,1,1,1,1,1,1,1,1,1,1),
and the state X
=(0,0,0,0,0,0,0,0,0,0,0).
The Associated state probabilities with each of the 2E
states is a probability f(Xi) that it will occur; for example
the probability, f(x), that the 6 bus system will reside in
upper limiting state is
f X
=
1
m
m
Ep
=p1p2p3p4p5 p6p7p8p9p10p11 (4)
The probability for lower limiting states is
f X
=
1
m
E
m
q
=q1q2q3q4q5 q6 q7q8q9q10q11 (5)
The probability for that system will reside in any state
f(xi) = Π f(Vm) (6)
where f(Vm) = pm if Vm=1, f(Vm) = qm if Vm=0.
Decompose the system states into acceptable and
unacceptable states, for those unacceptable states
calculate the LOLP [6].
LOLP = Σf(xi) (7)
where xi=all unacceptable states.
International Journal of Electronics and Electrical Engineering Vol. 3, No. 2, April, 2015
©2015 Engineering and Technology Publishing 107
C. Problem Formulation
A simple test system [8], [9] is considered in which the
DC load flow was run and the Loss of load probability
calculation was done using the probabilistic method. For
studying the effect of FACTS controllers, TCSC a series
controller is incorporated in the lines on a random
selection and the effect on LOLP was observed. The
analysis was done on the Roy Billinton test system
(RBTS). The study was done by installing a single TCSC
at a line and running the DC load flow for testing the
effect of the variation in the system impedance through
TCSC. Here for calculation of LOLP single and double
line contingencies are considered [10].
For installing UPFC in the line run the AC load flow
for to know the behavior of the system. PSO is used in
estimating the optimal setting of the TCSC to be installed
in the lines. Several possible combinations with the use of
TCSC in the system were tried and the variations in the
LOLP for system are observed. The choice for PSO is
that it is a very efficient algorithm in converging towards
the global solution that optimizes the function. Choice of
TCSC among various FACTS device for this problem is
that, it can be easily modeled as a reactance to be in series
with that of the line reactance in the equivalent circuit.
Based on the power flow model, get the base case
powers calculations typically assumes a lossless system,
where changes in the line real power flows are linearly
related to changes in the net real power injections. The
LOLP can be determined as by doing single line outages
and double line outages and get the unacceptable states
and 3, 4 etc. line contingencies are eliminated because the
probability is less than 10-6
so those are neglected. So for
the unacceptable states calculate the LOLP by using
subset decomposition theorem. The line power flow can
be calculated by using
Pij= / ij1 X * (θi-θj) (8)
where Pij is the power flow between the bus i and bus j,
Xij is line reactance, and θi, θj are the angles at buses i and
j.
For a given positive line flow limit Pijmax
, which is
assumed to be equal to the line MVA rating.
The objective of the problem is to maximize the power
flow using TCSC, UPFC.
The problem is solved as a minimization problem with
the objective of maximizing the power flow as given
below,
Max{Pij} = min{1/(1+Pij)} (10)
VII. RESULTS AND COMPARISON
The simulation for the RBTS is studied with single
TCSC, UPFC located to enhance the power flow and
simultaneously adjust the line parameters with in the line
limit. The simulation is carried out in MATLAB version
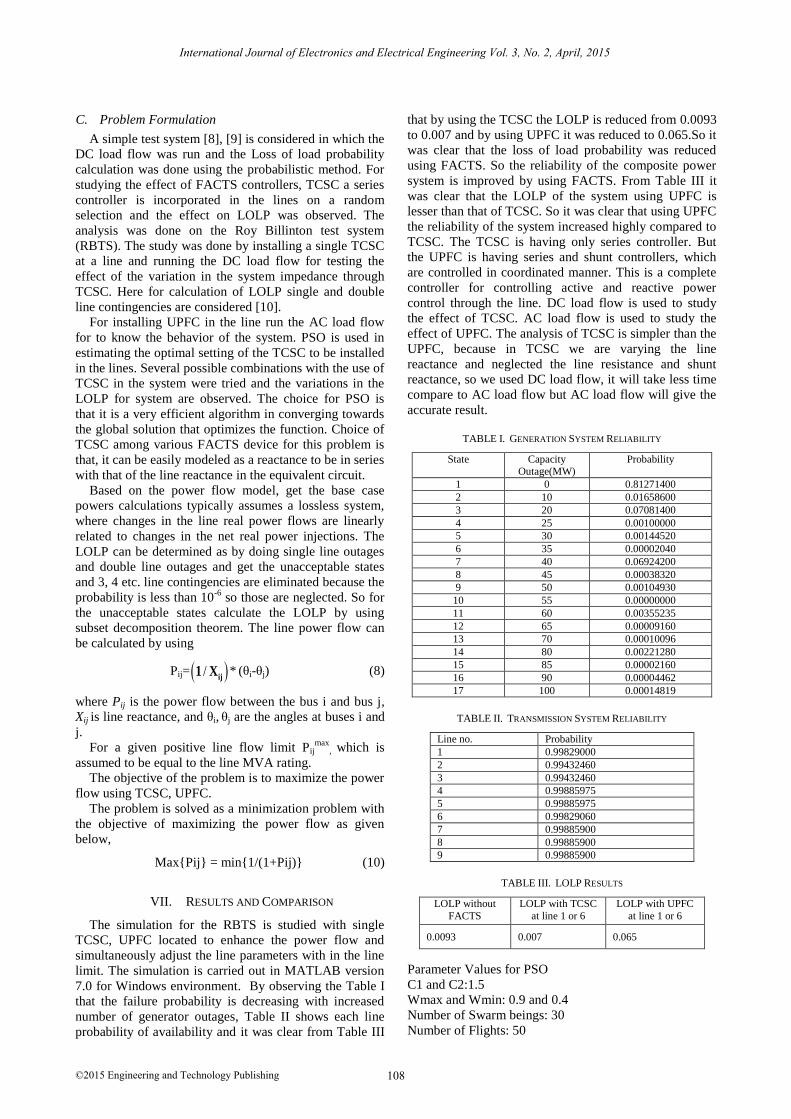
7.0 for Windows environment. By observing the Table I
that the failure probability is decreasing with increased
number of generator outages, Table II shows each line
probability of availability and it was clear from Table III
that by using the TCSC the LOLP is reduced from 0.0093
to 0.007 and by using UPFC it was reduced to 0.065.So it
was clear that the loss of load probability was reduced
using FACTS. So the reliability of the composite power
system is improved by using FACTS. From Table III it
was clear that the LOLP of the system using UPFC is
lesser than that of TCSC. So it was clear that using UPFC
the reliability of the system increased highly compared to
TCSC. The TCSC is having only series controller. But
the UPFC is having series and shunt controllers, which
are controlled in coordinated manner. This is a complete
controller for controlling active and reactive power
control through the line. DC load flow is used to study
the effect of TCSC. AC load flow is used to study the
effect of UPFC. The analysis of TCSC is simpler than the
UPFC, because in TCSC we are varying the line
reactance and neglected the line resistance and shunt
reactance, so we used DC load flow, it will take less time
compare to AC load flow but AC load flow will give the
accurate result.
TABLE I. GENERATION SYSTEM RELIABILITY
State Capacity Outage(MW)
Probability
1 0 0.81271400
2 10 0.01658600
3 20 0.07081400
4 25 0.00100000
5 30 0.00144520
6 35 0.00002040
7 40 0.06924200
8 45 0.00038320
9 50 0.00104930
10 55 0.00000000
11 60 0.00355235
12 65 0.00009160
13 70 0.00010096
14 80 0.00221280
15 85 0.00002160
16 90 0.00004462
17 100 0.00014819
TABLE II. TRANSMISSION SYSTEM RELIABILITY
Line no. Probability
1 0.99829000
2 0.99432460
3 0.99432460
4 0.99885975
5 0.99885975
6 0.99829060
7 0.99885900
8 0.99885900
9 0.99885900
TABLE III. LOLP RESULTS
LOLP without
FACTS
LOLP with TCSC
at line 1 or 6
LOLP with UPFC
at line 1 or 6
0.0093 0.007 0.065
Parameter Values for PSO
C1 and C2:1.5
Wmax and Wmin: 0.9 and 0.4
Number of Swarm beings: 30
Number of Flights: 50
International Journal of Electronics and Electrical Engineering Vol. 3, No. 2, April, 2015
©2015 Engineering and Technology Publishing 108
VIII. CONCLUSION
The composite power system reliability was improved
by employing the FACTS in the transmission line. In this
paper PSO was used to set the TCSC and UPFC
parameter values. By increasing transmission line
capacity using FACTS the failure probability reduced. So
the composite power system Reliability was increased.
And by using UPFC the reliability of the system
increased highly compared to TCSC.
REFERENCES
[1] Roy Billinton and R. N. Allan, Reliability Evaluation of Power
Systems, New York: Plenum Press, 1984.
[2] C. Grigg, P. Wong, et al., “IEEE Reliability test system-1996. A
report prepared by the reliability test system task force of the
application of probability methods subcommittee,” IEEE Transactions on Power Systems, vol. 14, no. 3, pp. 1010-1020,
1999. [3] N. G. Hingorani and L. Gyugyi, Understanding FACTS, Concepts
and Technology of Flexible AC Transmission Systems, New York:
IEEE Press, 2000. [4] Roy Billinton, Power system Reliability Evaluation, New York:
Gordon & Breach Science Publishers, 1970. [5] R. N. Allan, R. Billinton, and N. M. K. Abdel-Gawad, “The IEEE
reliability test system – Extensions to and evaluation of the
generating system, IEEE Transactions on Power Systems, vol. 1, no. 4, pp. 1-7, 1986.
[6] S. Gerberi, R. Chercaoui, and A. J. Germond, “Optimal location of FACTS devices to enhance power system security,” in Proc. IEEE
Bologna Power Tech Conference Proceedings, 2003.
[7] J. Kennedy and R. Eberhart, “Particle swarm optimization”, in Proc. IEEE International Conference on Neural Networks, 1995,
pp. 1942-1948.
[8] R. Billinton and Y. Cui, “Reliability evaluation of composite electric power systems incorporating FACTS,” in Proc. IEEE
Canadian Conference on Electrical and Computer Engineering,
2002, pp. 1-6. [9] R. Billinton, S. Kumar, et al., “A reliability test system for
educational purposes-Basic data,” IEEE Transactions on Power Systems, vol. 4, no. 3, pp. 1238-1244, 1989.
[10] A. J. Wood and B. F. Woolenberg, Power Generation, Operation
and Control, editorial John Wiley & Sons, 1996.
Dr. Sarat Kumar Sahu completed his B.Tech. (EEE) from Acharya Nagarjuna University, in 1999 and M.Tech. (Power Electronics) from
Jawaharlal Nehru Technological University, Hyderabad in 2003 and
completed Ph.D from Jawaharlal Nehru Technological University, Hyderabad in 2010. His research area is FACTS. He is currently
working as Professor, Electrical & Electronics Eng, MVGR College of Engineering, Vizianagaram.
Dr. A. Jayalaxmi completed her B.Tech. (EEE) from Osmania University College of Engineering, Hyderabad in 1991, M. Tech.(Power
Systems) from REC Warangal, Andhra Pradesh in 1996 and completed Ph.D. (Power Quality) from Jawaharlal Nehru Technological University,
Hyderabad in 2007. She has five years of Industrial experience and 14
years of teaching experience. Presently, working as Professor, Electrical & Electronics Engg., and Coordinator, Centre for Energy Studies,
JNTUH College of Engineering, Jawaharlal Nehru Technological University Hyderabad, Kukatpally, Hyderabad. Her research interests
are Neural Networks, Power Systems & Power Quality.
Venkata Padmavathi S received the B.Tech degree in Electrical and
Electronics Engineering in 2003 from Grandhi Mallikarjunarao Institute of Technology, Rajam and M.Tech Degree in Power Systems
Engineering in 2006 from Thiagarajar College of Engg. Madurai.
Currently, working as Asst. Professor at GITAM University, Hyderabad and doing research in JNTU Hyderabad in the research area of FACTS.
International Journal of Electronics and Electrical Engineering Vol. 3, No. 2, April, 2015
©2015 Engineering and Technology Publishing 109