Embed Size (px)
Citation preview

PARTICULATE EMISSIONS TEST REPORT
STARCH PROCESS STACK
for NATIONAL STARCH 81 CHEMICAL COMPANY
North Kansas City, Missouri
August, 1986 86-1773
AP-42 Section 9. %? Reference 1-3 Report Sect. Reference
I

.
.
I, Richard L. Howes, hereby certify that the Particulate Emission
tests conducted at National Starch & Chemical Corporation in North
Kansas City, Missouri are in accordance with procedures established
by the United States Environmental Protection Agency. This report
accurately and faithfully represents the data obtained from this
test and the results determined from analysis of this data.
Richard L. Howes Field Test Crew Chief Air Quality Control Division
46W EAST 63rd STREET, PO BOX 173. KANSAS CITY, MlSSOUAlti4141 . TEL. 8lM33-4375 TWX 91(2771-3059

I. II.
-_ III.
IV. v.
TABLE OF CONTENTS
INTRODUCTION SUMWRY-OF TEST RESULTS
DESCRIPTION OF TESTED FACILITY
SAMPLING AND ANALYTICAL PRDCEDURES APPENDIX
EPA Fozmulas
Test Data Sheets Plant Data Sheets
Calibration of Testing Equipment Laboratory Reports
Quality Assurance

. --
-P I .
/- i INTRODUCTION

-
c
P
INTRODUCTION
This report presents the results of the source emission testing performed
on Unit 1 starch process dryer unit at the National Starch and Chemical
Company plant. located in North Kansas City, Missouri.
The purpose of the test was to determine the particulate emission rate
from the unit. The test results are located in Section II of this report.
The emissions testing was performed by Burns & McDonnell Engineering Company
whose main office is located at 4800 East 63rd Street, Kansas City,
Missouri 64130.
Testing was performed on August 5, 1986. The emissions tests were performed
in accordance with EPA reference Methods 1, 2, 3, 4 and 5 as published in
the Federal Register, "Standards of Performance for New Stationary Sources,"
with all the latest revisions in the July 1, 1985 Code of Federal Regula-
tions, Title 40 - "Protection of the Environment" Parts 53 to 80.
The testing equipment, sampling procedures, and analytical procedures are
described in Section IV of this report. The raw field data, plant data,
equipment calibration, lab analysis reports and equations used in
determining final results are presented in the Appendix.
1

.
.
SUMMARY OF TEST RESULTS

Summary of Test Results
The following table shows the test results of the three particulate emission tests runs made on Unit 1 starch D4, process dryer on August 5, 1986:
, P/lec/Laa ml4 Emission Rate
b/h t/A& Test Run 1 10.63 lb/hr 3q Im /5. OS
Test Run 2 10.33 lb/hr a ?,mo /4# 5
Test Run 3 9.39 lb/hr 8 7, D@ w 5
Daily Average 10.12 lb/hr
The computer printout sheets listing complete test results are included in this section of the report on the following page.
J-
-

1
I
a
3
4
I
6
7
8
9
I1
1’
1;
I:
14
I!
1,
1;
11
1%
2c
21
2z
2:
24
21
LC
27
2e
2s
JC
JI
31
32
J4
33
3c
1’1
38
39
4C
41
41
43
44
413
4a
47
4r
4,
Sl
I
5,
5:
1.
S!
5'
8: .
k------ 3 1
86 121

.
DESCRIPTION OF TESTED FACILITY
, I

.
.
--
-- -
NATIONAL STARCH AND CHEMICAL COMPANY
STARCH FLASH DRYER GENERAL DESCRIPTION
The wet corn starch cake is discharged from each centrifuge into a pair of double paddle mixers. Here it can be blended with recycled dry product to produce a suitable feed for the dryer.
From each mixer the conditioned feed passes through a variable speed screw conveyor which, while maintaining an air seal, discharges at a controlled rate into a cascading screen.
Each pair of cascading screens disperses the feed material evenly into the drying air pasjing through a venturi. The venturi accelerates the starch through the drying column and duct to the Barr C Murphy “simplified manifold” which centrifugally classifies the material. Heavier, wet particles return to the ring duct for further drying, while dry starch continues on to a set of high efficiency cyclones. Here the product is separated from the exhaust air and discharged through a rotary valve/screw conveyor concatenation.
The incoming drying air’s temperature is elevated to approximately 410 degrees fahrenheit in a gas-fired heater. The exhaust temperature is controlled at 115-140 degree fahrenheit range. An induced draft fan positioned after the cyclones will draw the drying air through the entire system and veot it to atmosphere via a wet scrubber.

!
.- r‘.
.-
__
.
SAMPLING AND ANALYTICAL PROCEDURES

-
-
--
_-
--
-- -
_
--
--
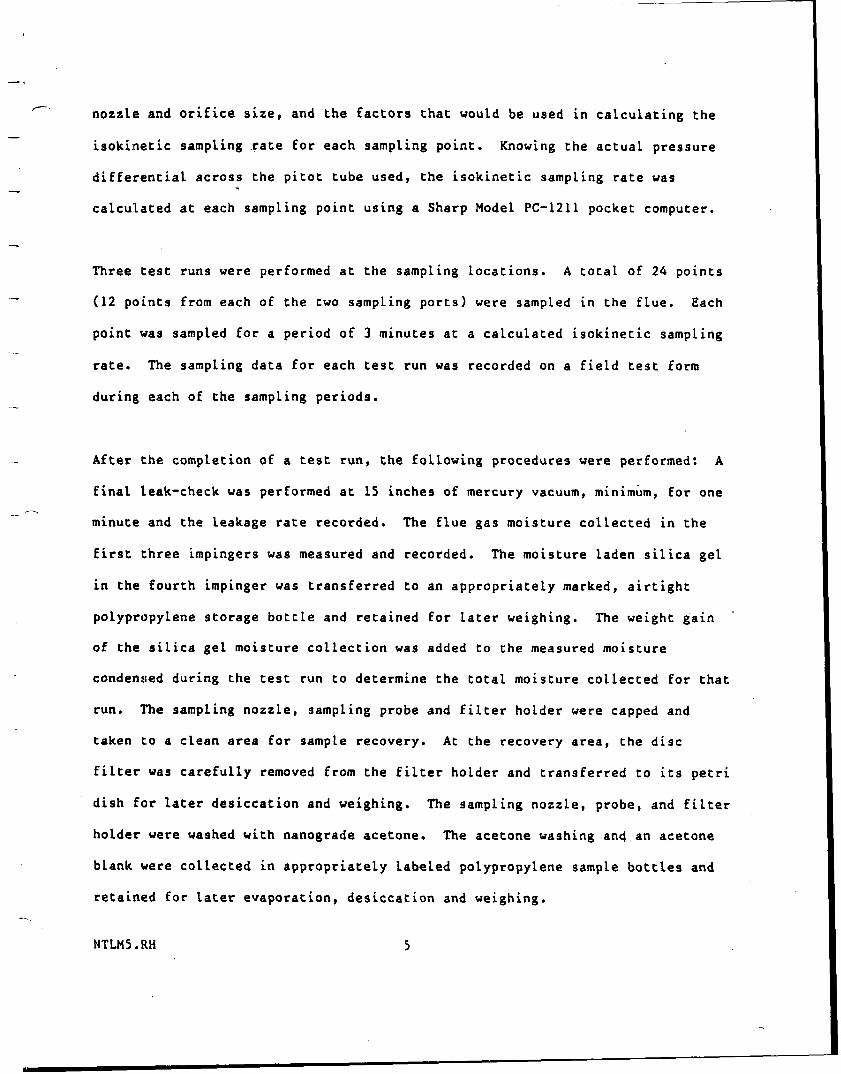
TESTING EQUIPMENT - EPA REFERENCE METHOD 5 (PARTICULATE)
High-Volume Source Sampling Train
An Acurex Corp., Aerotherm High-Volume Stack Sampler (Model HVSS-045) was used
at the sampling Location(s). The HVSS particuLate sampling train consisted
basically of a T-foot effective Length x 2-l/2-inch-diameter stainless-steel
probe; a variable-heat-controlled filter oven with a calibrated Type K
(Chrome/AlumeL) thermocouple; a stainless-steel, Teflon-coated filter holder; a
standard lexan/stainL&ss-steel impinger assembly with a calibrated Type K
(ChronneL/ALumeL) thermocouple Located at the impinger outlet; a 3/4-hp,
shaft-sealed, carbon vane vacuum pump assembly with a vacuum gauge: a control
unit with an elapse time indicator, a temperature selector switch, a temperature
indicator (potentiometer), temperature controllers, calibrated magnehelic
gauges, a calibrated dry gas meter and a calibrated variable-diameter
orifice; and an umbilical and various interconnecting hoses, fittings and
valves. An appropriately sized stainless-steel nozzle, a calibrated Type K
(ChromeL/ALumeL) temperature sensor, a static pressure tube, a calibrated S-type
pitot tube and a variable-heat-controlled stainless-steel liner with a
calibrated Type K (CbromeL/AlumeL) thermocouple are integral parts of the probe
assembly.
The vaicuum pump unit was used to control gas sampling rates. The controL unit
was us;ed to control probe and oven temperatures. The control unit was also used
to monitor elapsed sampling times, temperatures, velocities, static pressure,
gas sampling rates and sampled gas volume.
NTLMS .RH

--
--
_-
0.3.micron particles were individually numbered, placed separately in similarly
numbered glass petri,dishes, oven dried at 220 degrees Fahrenheit for two to
three hours, cooled in a desiccator for two hours and individually weighed on a .
Sartorious analytical balance to the nearest 0.1.milligram, and then weighed
every six hours, minimum, until two consecutive weights within +0.5-milligram
were obtained. Several 250 milliliter crucibles were desiccated for a minimum
of 24 hours and weighed in the same manner as the filters and petri dishes.
Also, several 3500gram quantities of Type 6-16 mesh indicating silica gel were
weighed-out on an a Mettle= top-loader balance and individually placed into
separate airtight polypropylene storage bottles.
The number of sampling points and positions of the points in the flue at the
sampling Location(s), and the sampling time at each point were determined prior
to the particulate testing. the sampling procedures were performed in
accordance with the Environmental Protection Agency’s Reference Method 5,
“Determination of Particulate Emissions from Stationary Sources” in the
Thursday, August 18, 1977 Federal Register, “Standards of Performance for New
Stationary Sources” and subsequent revisions in the July 1, 1985 Code of Federal.
Regulations, Title 40, “Protection of Environment, Parts 53 to 80.
A HVSS sampling train was prepared inpart at the sampling locations(s), before
each test run, in the following manner: An appropriately sized sampling nozzle
was installed onto the inlet of a sampling probe and capped. The probe was then
dimensioned and marked with glass-cloth tape at increments that corresponded
with the predetermined sampling point positions in the flue. A standard
__
NTLMS . RH 3
-,
7. nozzle and orifice size, and the factors that would be used in calculating the -
isokinetic sampling .fate for each sampling point. Knowing the actual pressure
differential across the pitot tube used, the isokinetic sampling rate was .a
caLcuLated at each sampling point using a Sharp Model PC-1211 pocket computer.
Three test runs were performed at the sampling locations. A totat of 24 points
(12 points from each of the two sampling ports) were sampled in the flue. Each
point was sampled for a period of 3 minutes at a calculated isokinetic sampling
rate. The sampling data for each test run was recorded on a field test form
during each of the sampling periods.
-- -
After the completion of a test run, the following procedures were performed: A
final leak-check was performed at 15 inches of mercury vacuum, minimum, for one
minute and the leakage rate recorded. The flue gas moisture collected in the
first three impingers was measured and recorded. The moisture Laden silica gel
in the fourth impinger was transferred to an appropriately marked, airtight
polypropylene storage bottle and retained for later weighing. The weight gain ’
of the silica gel moisture collection was added to the measured moisture
condensed during the test run to determine the total moisture collected for that
run. The sampling nozzle, sampling probe and filter holder were capped and
taken to a clean area for sample recovery. At the recovery area, the disc
filter was carefully removed from the filter holder and transferred to its petri
dish for later desiccation and weighing. The sampling nozzle, probe, and filter
holder were washed with nanograde acetone. The acetone washing and an acetone
blank were collected in appropriately Labeted polypropylene sample bottles and
retained for Later evaporation, desiccation and weighing.
NTLMS .RH 5

evaporation on a low-temperature water bath at 130 degrees Fahrenheit. when the
acetone in a crucible had completely evaporated, the crucible was transferred to
a desiccator for further drying at room temperature for a minimum of 24 hours
before weighing, and weighed every six hours, minimum, until two consecutive
weights within +0.5-milligram were obtained. Each acetone blank collected was
used to determine the amount of residual weight each crucible retained due to
acetone impurities. Each disc filter and petri dish, acetone washing and
acetone blank was individually weighed on a Sartorious analytical balance with a
sensitivity of O.l-milligram.
All test instruments were recalibrated to determine the deviation percentage.
-.
NTLMS .RH
SMALL OVEN -I
STEEL’BRAIDED TEFLON LINED SAMPLING HOSE
IMPINGER TRAIN
VACUUM GAUGE -
SAMPLING NOZZLE
SAMPLING PROBE
THERMOCOUPLE
LFILTER HOLDER
I
I GAS FLOW
STAINLESS STEEL CONDENSER
RUBBER SAMPLING HOSE
VACUUM PUMP
. . PA El
8. @’
\r
CONTROL UNIT
Exhibit 1 AEROTHERM
SAMPLING TRAIN

,- II- -a.. ,” .,.~,.,~~
6’ 10 9 8 7
l a 0 0
10 l
POINTS 1 2 3 4 5 6 7 8 9
10 11 12
DISTANCE FROM INSIDE WALL
1.6” 5.2” 9.2”
13.8” 19.5” 27.7” 50.2” 58.5” 64.2” 68.8” 72.7” 76.4”
DIAMETER STACK 6 ‘-6”
PORT LENGTH 3” (4” 8)
Exhibit 2 STACK TEST POINT
LOCATIONS
022081 Form AQDfT4).J4

SAMPLING PROBE
I
RATE METER
r- CONDENSER 81 MOISTURE TRAP
t
rL
i \
!f
rL PLASTIC BAG
VACUUM PUMP RIGID CONTAINCR
.
Exhibit 3
INTEGRATED BAG SAMPLING TRAIN

--\
I --- +I+
I
l :

-
.
.
APPENDIX

NOMENCLATURE
/--‘
.-
_-
-_
_.
. .-
--
ad = actual cubic feet
acfm = actual cubic feet per minute A = effective area of flue in square feet
acm = actual cubic meters . . acmm = actual cubic meters per minute
An = inside area of sampling nozzle in square feet
Bws = water vapor in gas stream, proportion by volume
%c = percent carbon by weight, dry basis %CO = percent carbon monoxide by volume, dry basis
w02 = percent carbon dioxide by volume, dry basis
cP = pitot tube coefficient
DI = dust loading per heat input in pounds (grams) per million Btu (calories) per Fr constant
01’ = dust loading per heat input in pounds (grams) per million Btu (calories) per Fr calculated
dscf = dry standard cubic feet dscfh = dry standard cubic feet per hour dscm = (dry standard cubic meters dscmh = dry standard cubic meters per hour
fps = lfeet per second
Fr = ratio factor of dry flue gas volume to heat value of combusted fuel in dry standard cubic feet (meters) per million Btu (calories)
gms = grams gm-mole = gram-mole
:Ii = grains
= orifice pressure drop in inches water, average
%H = percent hydrogen by weight, dry basis
HC = heat of combustion in Btu per pound, dry basis hr = hour %I = percent isokinetic in. Hg = inches mercury Ibs = pounds lb-mole = p’ound-mole
%M = percent moisture by volume mmBtu = mlillion Btu mmcal = mlillion calories mmHg = millimeters mercury
ws = meters per second
MS = molecular weight in pound (gram) per pound (gram) mole (wet basis)
%N = percent nitrogen by weight, dry basis
%N2 f percent nitrogen by difference, dry basis %o = percent oxygen by difference, dry basis
m2 = percent oxygen by volume, dry basis
pb = barometric pressure in inches mercury
pstd = standard absolute pressure (29.92 in Hg)
Pf = static pressure in flue in inches water, average
a = square root of velocity head in inches water,
%5 scf
scm
Tstd
TS
Tm
VS
VI
WC
Vm
Vms
vo
Qsd
vt
VW
VWC
vwsg
Wa
wd
WI3 wh
WP
ws
Wsf3 Y
0
average
- percent sulfur by weight, dry basis = standard cubic feet = standard cubic meters
= absolute temperature of air in degrees Rankine at standard conditions (528 degrees)
= absolute temperature of flue gas in degrees Ran kine, average
= absolute temperature at meter in degrees Ran kine, average
= velocity of flue gas in feet (meters) per second
= volume of condensate through the impingers in milliliters
= volume of liquid collected in condenser in milliliters plus weight of liquid absorbed in silica gel in grams indicated as milliliters
= volume of metered gas measured at meter conditions in cubic feet
= volume of metered gas corrected to dry standard conditions in cubic feet (meters)
= volume of flue gas at actual conditions in cubic feet (meters) per minute
= volume of flue gas corrected to dry standard conditions in cubic feet (meters) per hour
= total volume of flue gas sampled at actual conditions in cubic feet (meters)
= volume of water vapor in metered gas corrected to standard conditions in cubic feet (meters)
= volume of water condensed in impingers corrected to standard conditions
= volume of water collected in silica gel corrected to standard conditions
= total weight of dust collected per unit volume in grains (grams) per actual cubic feet (meters)
= total weight of dust collected per unit volume in pounds (grams) per dry standard cubic feet (meters)
= total weight of dust collected in grams = total weight of dust collected per unit volume
in pounds (grams) per hour, dry basis = total weight of dust collected in pounds
= total weight of dust collected per unit volume in grains (grams) per dry standard cubic feet (meters)
= impinger silica gel weight gain in grams = metered gas volume correction factor
= total elapsed sampling time in minutes
ps = absolute pressure in flue in inches (millimeters) mercury
Form AQD-(TS)- J N
Page J 013
7.7

.
.-. EPA DUST LOADING FORMULAS
-- \

EPA DUST LOADING FORMULAS (Continued)
(11) DUST CONCENTRATION FOR INDIRECT HEATING UNIT AT ACTUAL CONDITIONS AND STANDARD CONDITIONS
wg = ms .
WI? = 0.002205 x Wg (lb)
b&j = wp Vms
(Ibldscf)
wh = Wd X Qsd (Ib/hr dry)
Wa. = 7oOOxw vt P (grlacf)
w, = 7000 x Wd (gr/dscf)
Dl = ‘“(z “9 “;i p” (Ib/mmBtu with constant 9820 Fr) . - 2
Fr = 106 x [(3.64x %H) + (1.53 X %c) + (0.57 X %s) + (0.14 X %N) - (0.46 X %o)] (,,scf,mmBtu)
HC
DI’ = 2o’g ’ wd ’ Fr (Ib/mmBtu with calculated Fr) (20.9 - %02)
I
(12) PERCENT OF ISOKINETIC SAMPLING
%I .= 1.667 x TS x 0.00267 x Vlc + VmXY
7 x
UXVsXPsXAn
30 030281 aurns & HcDonnoll ,UIos uc.1ICW~ im,.Af..,, Form .-LQD-(7.S)-1.V
Prnr 3.7f’

-
_-
.
. .
TEST DATA SHEETS
,-.

AIR QUALITY CONTROL OIVISION TESTING FORM
--
--
Integrated IBag Leak Check:
o2osao Fcwm AQ~.SCI
kpr I of I
T> e-

AIR aUALlfY CONTROL DIVISION TESTING FORM
. Particulate Field Data Sheet Client
/ s%zEGx Propcn No. -
Ia-m-3 .smlolrn~ LocatW& - /
Date me 1 Of & s=84 1 2
Orsat Analysis
co
Pitot Tube Leak Check:
integrated B(ag Leak Check: Before ! Before ndt(

PLANT DATA SHEETS
--\

z-c-n >o

. --
.-
.-
-.
.
CALIBRATION OF TESTING EQUIPMENT

,c--
.-
Project No. ;G *I,; .--- / 7 ? -,-) Oate C-2 o-Q4;
Module 78% f Barometric Press 2 9.3 0 Or if ice 5Gm& s
AH VW VW VW Vd Vd Vd tw tdi tdo Pw Time in. H20 initial final fL3 initial final ft.3 OF OF ,OF in.l-bO8min.
.5 59x8 s933 s,o 9*9- ?3s%+S’ 9,,4et 7y.5 74f 72 . I /2.3s 1.0 s93*- 5439 4.9e* 7s 7y,s 7x3- . I 8.9 2.0 SW/ 4.0 SW3 SQSA 3.0 9y9,9* 4sw;tu 4.984 7s.s 7% 7y 4s xc
1 6.0 -53 2963 IO*‘3 qs.sxqt=em 9.8?3 76 gLs’7yq m/s 7.c
AlI3 ‘4’ --3’4TROL DIVISION TESTING FOAM
/q; , -l-&f5 7
Dry Gas Meter Calibration Sheet . _
Client
‘L MC (v A Ha (For Small Orif ice Only) AH VW Pb (td + 460)
AH 13.6 0.0317 A H
Vd (Pb + AH/13.6) (tw + 460) Pb (td + 460) 1 .5 1 .0366 1 /.ooa 1 1.0 1 .0737 1 ,999 1 1 2.0 1 .147 1 , $292
I 1
AH VW Vd Pw tw
tdi tdo td 8 MC
AHa
020 760
Orifice Setting Volume of Gas of Wet Test Meter Volume of Gas of Dry Gas Meter Pressure of Wet Test Meter Temperature of Fluid in Wet Test Meter Inlet Temperature of Dry Gas Meter
. Outlet Temperature of 0~ Gas Meter Average Temperature of Dry Gas Meter Time required to pull specified cubic feet Dry Gas Meter Correction Factor Orifice setting that would pull .75 cfm of air at standard conditions
Bornr & lVDonn8ll Form AQD-(T-S)-6

,
- Aal CJLALI . LONtROL OIVlSl0N TESTING FOAM
Pitot Calibration Form
Client _ P ! :*I/-/-/ Ld?. sL-~,,-.. /..
Project No. PG. .- /7 7 - 7
Test Location k., I( . I..~:,.,I 4, _. , f 1
.-
I 0 “A” Sidr Calibrrti m I ; --
--
--
AVWWJO I cp (Side Al
Avrng~ I Ep We BJ
Deviation C&l Cpls) - e,rBl
I
.3g
t78/ ,
Run By
Date &zl’-8’6
Pitot No. ./> Y-
/+;: &..4.’ r-3
Calculations:
J A P handard)
cp ISI - 0.99 A P 1s)
Deviation = C&r) = &IA or 8)
3 2 K&l - ep(A or Bl I
Average Deviation = a(A or B) = 1 ,
3
I~p(Sidr A) - &(Side Bl I = ro/
Nozzle size used for Calibrations (inches) .c #*
Intercomponent Spacings During Calibrations:
Pitot - Nozzle: If
/I Pitot - Thermocouple: 3
Pitot - Probe Sheath:
Bum & WLlonn8ll -- 112079

-
-
L i,,, , &C’. c ,L 0; .3N
‘ESI, . 4
Nozzle Calibration t
Sized By 2?c. &es 0
All Dimensions are in Inches.
!imn .4QD(T-S)-J J

- ,’ t Oven -
Client . -//4 *,,,f y-f-2 , e, f!L Barometric Press 29 a
Project No. ,F( me-/ :/ ;J -3
-
-
- .
AIR QUALITY CONTROL DIVISION TESTING FORM
Thermocouple Calibrations
Thermocouple Identification
(31/Fn/
Ru.NJjH
R b&v& L
Trendicator Thermometer
281 2 so
274 277
790 2.Q7
Thermometer Number Date
zY7-6 37 6sw?6 !
I I I I
I I I I
.- : -
051579 Earna 6 WDonndl --9 Form AQB(T-S)-10
c-1 C-I

, -
.
-_
-
AIR aUALlTY CONTROL DIVISION TESTING FORM
Thermocouple Calibrations Gas Meter
Client . A .+?.‘.~...jc 5Y, , J- Barometric Press 29 549
Project No. g r-/,-s+ - -5 , .
OS1 579 Form .4QD(T-y-9

h s I
; I

.
- .---, ----

i i 1 I 1 i I I
Client
Analytical Data Sheet
Project No. &-- /‘)3-3 Date E - 7- Y 6
Run No.-- /
Filter No. 2.5-v
Acetone No. $76
Amount liquid lost during transport -
Acetone blank volume, ml ..2 &a 0 /,J.
Acetone wash volume, ml 2 7L ,4.
Acetone blank concentration, mg/mg (equation 54)” . 0 = . GO-As 5.
Acetone wash blank, mg (equation $5)” . 4t*.; -I. .oou 9,r,, P ti
, Weight of Particulate Collected
Container Q Number
Final Weight Tare Weight Weight Gain
1
2
TOti
/.A‘?. 4163 /.29. q/s3 f). 0010 +%./LO3 $u. t?fo G.OL-13
0. c c.A3
Less acetone blank - D.GtD7
Weight of particulate matter 0. otj b
Volume of Liquid Water Collected
Impinger Silica Gel Volume, Weight,
ml. Q
Initial sac, 3 ------
Liquid Collected i
Total Volume Collected /u
Run No. x
Filter No. AT/
Acetone No. 6L
Amount liquid lost during transport CT
Acetone blank volume, ml AGO hd.
Acetone wash volume, ml 2 L s-- /r-J.
Acetone blank concentration, mg/mg (equation %I)*+ --&a - . Dc.zy,.-rr
Acetone wash blank, mg (equation 5-5)” --*G-frc &<,,I/ 7 //COO -
oaks L p ,.
Container Number
Weight of Particulate Collected
Q
Less acetone blank
Weight of particulate matter Io.o62/
Volume of Liquid Water Collected
Final
Initial
Liquid Collected
Total Volume Collected
Impinger Volume,
ml.
6 J-
5-3 Tc .
--I 1 C,
/ 2 y..y
Silica Gel Weight,
Q
.3 6 y. 5
ISU _
--/y. cy
0. ml
? l Convert weight of water to volume by dividing total weight increase by density of water (IQ/ml): Increase, Q
j lg/ml = Volume Water,. ml
**See Federal Register, Method 5, 6.6 & 6.7.

3
FILTER DATA
-
‘-
!.
069497serle8 Ghu flkr flltws, Typa A/E, Gelman, manutadured tmm m&rotilamenls of glass. m0 wrafdile Rbr8 can be used in many type8 of finralbn 83pplkam. Wdely used lo determine air pollullng subslancea in municipal and hdustM atmospheres. They are pure. oqanbfme, blndw-be and Ideal for gravlmetk analyua
lhlgned for general use u pre4lnm up stream of membrane~fllten. Rated at 999%
TypeAEGIamFlbwFllternalsooHerhlgh flow ratu. urtmpurlty (low frau aemenla MdllOOQlkMCS),tiQOOdWOtstrengmf# ill Rltmtlon wurk.
YkNo. DknMn PtgLat 066367 61626 13 500 066-606 61630 26 600 089613 61631 47 100 06S62l 61632 60 100 367.761 61666 127 1OO 367-776 61&S 142 100

‘- .-
L-
.-
i
_-
. 4.
.
‘.
.
QUALITY ASSURANCE
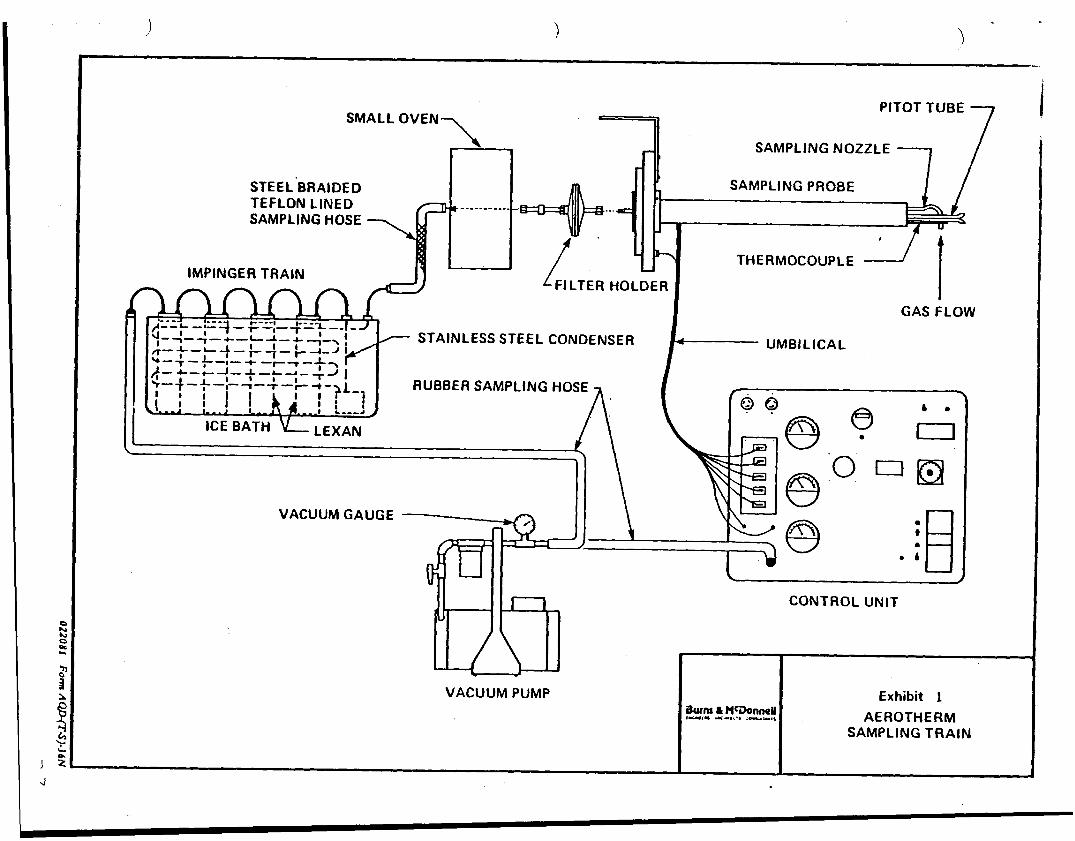
AiR QUALITY CONTROL OIVlSl0N TESTI NO FORM
Chain of Custody Project No.
a--/37-3 Plant Name /L!&&a( 5*4/&J. .
Type of Sample r; /teis *& /kc+-5 r?c 5 dL4c
Sampling Location .ikaesS sm&*/ ’
Run No. / Filter No. 2 s
Acetone No. $?‘G
Sample Recovery: BY Date
Samples received in laboIrator *
2’ & BY- - ‘LJCS
Date, IT-5 -Sb
Samples handled in laboratory: BY-
0 LdCS
Date _ 4-6 -8 6
Time, /C ,‘~a AC%
Laboratory Report received: By %6 ux?5 Date- &-7- 86
Run No. x Filter No, a4/
Acetone No. j (-&
Sample Recovery: BY 7?- fi 1+3 Date e-s-e&
Samples received in laboratory:
BY i?. ties
Date 6-S -8 6
Samples handled in laboratory: By $?. +LJU
Date f-6-Ec
Time //,‘P Hm
Laboratory Report received: By R. fiw Date B-7- tic
Run No. 3 Filter No. .7 i j
Acetone No. / 2./
Samp!e_ Reyvery: By 2f /.C.JCJ Date ,E -2.7 -F 6.
Samples received in laboratory: BY :i?, /?v !..ms Date G-L--z 4,
Samples handled in laboratory: By 17: /rt;: s,,ki’ Date z - : - f* c.
Time//sB/ri*f
Laboratory Report
Date G-7-5C
Comments:
t-
foioao

f-
/--
--
-
-
-
--
-
1.
2.
3.
4.
5.
6.
‘7.
METHOD 5
TEST CONDITIONS
Determine testing dates and time for start and estimated completion.
Units to be"tested will be checked thoroughly before testing commences to minimize the possibility of operational problems during the test. The test equipment, as well as other items required for testing, such as the electrical power sources will also be checked thoroughly before- hand to prevent unnecessary delay9 during testing.
Sampling pol-t location and traverse point locations shall be determined as outlined in Method 1 of EPA. Cyclonic flow shall not occur at any of these locations. Safe sampling platform(s) and access shall be provided by the source for approval by a representative of MDNR prior to testing. .
During testing, each unit will be baseloaded to maintain a steady- state level of operation. Each unit and its related air pollution control equipment will be operated In the same manner as for normal day-to-day operation except for those changes necessaryto maintain the steady-state levels. Soot blowing or other normal operations that may effect emissions must be pcrfonned during the test to give represent- ative results. Every effort must be made to test at the maximum operating rate. If this rate cannot be achieved due to circumstances beyond the sources I control, a deviation can be allowed, providing the deviation does not exceed 10% of the maximum.opcratlng rate. The testing personnel will record, at uminutc intervals and in Ink, the operational data necessary to define the operating conditions for testing. The operational data will be included In the source test report.
Fuel used, shall be of the same type and mixture normally used. A coal sample increment of approximately 2 pounds will be obtained from each of the coal feeders every l.J minutes during testing. A composite sample will be formed for each test run from the individual sample increments. Proximate and ultimate analyses will be performed on the composite samples using the appropriate ASTM methods. The test report will include descriptions of the sample preparation and analytical procedures.
The emission rates shall be determined by the use of+F factors as described in 40 CFR 60, Subpart D. The F factors will be calculated from analytical data for the coal as outlined in 40 CFR 60.45 (f)(5). Calculation of the emission rate using F factors requires a very accurate determination of the oxygen content of the stack gas obtained in accordance with 40 CFH 60.46, (f). ..
Copies of the calibration work sheets for the dry gas meter, pitot tube assemblies, temperature gauges, probe nozzles, probe heaters, and barometer (if used) shall be presented to the MDNR observer prior td the commencement of testing. The calibration and use'of'the type S pitot tube assemblies continues to be of special concern. They must be calibrated and used In accordance with the requirements of Method 2. The calibration records must show the values of the intercomponent' spacings (pitot-nozzle, pitot-thermocouple, pitot-probe ,sheath) and the sizes of temperature gauges used for determination of stack temperatures
t’ c;