Embed Size (px)
Citation preview
Partisanship and Representation in Local Politics:New Evidence from Mid-Size U.S. Cities
Katherine Levine EinsteinDepartment of Political Science
Boston [email protected]
Vladimir KoganDepartment of Political Science
Ohio State [email protected]
Abstract
Do elected officials in city government have the tools necessary to respond to the
preferences of their constituents? Or, is the menu of available policy options effec-
tively determined by forces beyond their direct control? Using what we believe
to be the most comprehensive and detailed database linking voter preferences
to local policy outcomes covering more than 1,000 mid-size cities, we examine
the degree to which local governments adapt local policies in response to voters’
views. Overall, our analysis paints a positive picture of democracy in the city.
We document tremendous variation in local policy outcomes and show that voter
preferences play an important role in explaining why cities tend to adopt different
policies. As they grow more Democratic, cities increase their spending across a
number of service areas. In addition, we show that voter sentiment shapes the
other side of the ledger, determining the mix of revenues on which cities rely.
As they grow more Democratic, cities adopt more progressive forms of taxation,
relying on property taxes to a greater extent than regressive sales taxes. In short,
cities appear to be quite responsive to the needs and wants of their constituents,
even on redistributive questions generally thought to lie beyond the capacity and
competency of local government.
Keywords: city politics, budgetary politics, progressive taxation, redistribution
1 Introduction
Democratic representation in the United States is a complex, multi-level affair. Every few
years, voters have the opportunity to select the president, determine the balance of partisan
power in Congress, choose officials to fill state offices, pick councilmen and mayors, and, in
many cases, participate in a large number of other low-profile races, including elections of
judges, school board members, tax assessors, and mosquito abatement commissioners.1 Many
normative theorists praise America’s system of federalism and decentralization, arguing that
allowing policy to be made by a number of smaller jurisdictions provides constituents with the
benefits of choice (Ostrom, Tiebout, and Warren 1961; Tiebout 1956), enhances oversight and
accountability by bringing policymaking closer to the people (Fisman and Gatti 2002), and
creates “laboratories of democracy” that allow for experimentation and eventual diffusion of
effective policies and best practices (Makse and Volden 2012; Volden 2006).
Although national and state races often attract the greatest attention from the media and
public, most policymaking that directly impacts voters on a day-to-day basis actually takes
place at the local level. Cities, in particular, control a number of vital public functions —
including public safety, fire protection, land-use regulations, and transportation options —
that affect public health, safety, and quality of life in very real and often dramatic ways. Our
knowledge of the political dynamics in America’s cities remains very limited, however. Many
observers have raised serious questions about whether elected officials in city government have
the tools necessary to respond to the preferences of their constituents or whether the menu
of available policy options is effectively determined by forces beyond their direct control.
In this paper, we assess the quality of democratic representation in America’s cities.
Using what we believe to be the most comprehensive and detailed database linking voter
preferences to local policy outcomes covering more than 1,000 mid-size cities, we examine the
1Lowery, Lyons, and DeHoog (1990) among others have raised serious questions about whether theAmerican system is too complex, making the task of matching elected officials with the policy outcomes forwhich they are responsible impossible for regular voters. Others have noted the potential for collective-actionproblems among local agencies that compete with one another for scarce public resources (Berry 2008).
3
degree to which local governments respond to the wishes and desires of their voters. Unlike
existing studies that rely on rough proxies of local voter preferences (e.g., Craw 2010; Hajnal
and Trounstine 2010), we construct direct measures of local partisanship by aggregating
precinct-level presidential results at the city level. This allows us to expand our analysis to
a much larger number of jurisdictions and to measure voter preferences much more precisely
than has previously been the case.
Overall, our analysis paints a positive picture of democracy in the city. We document
tremendous variation in local policy outcomes and show that voter preferences play an im-
portant role in explaining why cities tend to adopt different policies. As they grow more
Democratic, cities increase their spending across a number of service areas. In addition,
we show that voter sentiment shapes the other side of the ledger, determining the mix of
revenues on which cities rely. As they grow more Democratic, cities adopt more progressive
forms of taxation, relying on property taxes to a greater extent than regressive sales taxes.
In short, cities appear to be quite responsive to the needs and wants of their constituents,
even on redistributive questions general thought to lie beyond the capacity and competency
of local government.
We begin by reviewing the existing record of theoretical and empirical research on city
government. Prior research largely agrees that external forces limit the ability of local officials
to respond to their constituents’ preferences. Next, we describe our new dataset on voter
partisanship in American cities built from precinct-level presidential vote results. Studies
on voter behavior show that, given ever-increasing ideological sorting by party, presidential
vote share serves as an accurate gauge of voter sentiment on a wide range of policy questions
(e.g., Levendusky 2009; McCarty, Poole, and Rosenthal 2006). In the following section,
we document the relationship between local partisanship and policy outcomes for a large
number of mid-size American cities. The conclusion describes the broader implications of
our findings for American democracy.
4
2 Constraints and the Growth Imperative in City Gov-
ernment
Since the 1970s, political parties have come to play an increasingly central role in Amer-
ican politics. At the national level, parties regularly stake out distinct platforms on the
most salient issues of the day, particularly in the modern age of rising partisan polariza-
tion (Abramowitz 2010; Gerring 2001; Hacker and Pierson 2010; Jacobson 2003; McCarty,
Poole, and Rosenthal 2006). Party leaders have also emerged at the forefront of negotiations
between the branches of government and have carefully managed the policymaking taking
place within them (see, e.g., Alrich 1995; Cox and McCubbins 1993; Cox and McCubbins
2005; Kiewiet and McCubbins 1991; Rohde 1991). Among voters, party affiliation is one of
the most important and consistent predictors of voting behavior on Election Day (Camp-
bell, Converse, Miller, and Stokes 1960). It serves both as an important heuristic for voters
sorting through complex policy positions (Popkin 1994) and as a social identity shaped by
voters’ views and opinions about the world around them (Green, Palmquist, and Shickler
2002).
Despite the documented importance of partisan conflict at the national level, most schol-
arly accounts of local politics either overlook or expressly dismiss the role of partisanship in
local government. In their now-classic textbook on city government, Banfield and Wilson
(1963) assert that, in local elections, “the party as such seldom has any concrete program
or platform” (p. 277). While many argue that local issues are inherently nonpartisan —
Fiorello La Guardia once famously observed that there is no Democratic or Republican way
to pick up the garbage — others point to political and economic constraints that limit the
discretion of local policymakers and can thus thwart partisan policy goals. Many sources of
constraint are vertical, resulting from local governments’ subordinate legal status as “crea-
tures of the state.” This context sometimes places cities at the whim of inhospitable state
legislatures (Desmond 1955). Gamm and Kousser (2010) find evidence that such interference
5
is most likely to occur when the preferences of local voters diverge from the political interests
of the officials who control the state house.
The most binding constraints, however, appear to be horizontal: they emerge through the
process of competition among neighboring cities to attract and retain scarce resources. In the
most prominent formulation of this argument, Peterson (1981) describes how jurisdictional
competition among local agencies can effectively limit the policy discretion available to local
officials, particularly on economic issues. Competition, and the mere threat thereof, creates
a Darwinian dynamic in local government that pushes all cities, regardless of the preferences
of their voters or leaders, toward policy convergence. To succeed, cities must grow, and to
grow, cities must compete with one another to attract the mobile capital and high-skilled
labor critical to sustaining a successful economy.
The growth imperative imposes severe limits on the scope of local policymaking, helping
explain the “lack of a distinctive partisan impact on local policy outcomes” (Peterson 1981, p.
174). In particular, Peterson argues that competition among cities eliminates opportunities
for economic redistribution by giving wealthy taxpayers and business owners a credible exit
option they can use to avoid intolerably high local tax burdens or inadequate support for the
interests of the local business community. Anticipation of such tax avoidance, with its con-
comitant negative impacts on the local economy, gives even the most progressive community
good reasons to not enact its preferences into actual policy. “The politics of redistribution at
the local level,” Peterson writes, “is thus an arena where certain kinds of citizen needs and
preferences seldom become demands; an arena where redistributive questions, even when
posed as major political issues, are treated by a variety of strategies designed to forestall,
delay, and preclude their implementation” (p. 182). In short, competitive threats push all
cities — regardless of the preferences of their voters and residents — to both adopt the same
types of policies in order to maximize their communities’ economic opportunities and avoid
using local taxes and expenditures to carry out economic redistribution.
6
3 Re-evaluating the RD Design
Despite strong theoretical expectations of policy convergence, relatively little empirical work
has attempted to measure the influence of partisanship on local policy outcomes. In addition
to being small in quantity, much of the existing work points to mixed findings. In two early
studies of municipal expenditures, Brazer (1959) and Fried (1975) find little evidence of a
relationship between local partisan leanings and patterns in city spending. Minkoff (2012)
also documents evidence of convergence, especially among spatially proximate jurisdictions.
By contrast, other studies find substantial variation in policy adoption across cities, some of
which appears to be explained by local political considerations (e.g., Hajnal and Trounstine
2010).
One important drawback in the existing literature — and, we believe, one cause for the
conflicting findings — is insufficient clarity about the proposed mechanisms and poor trans-
lation of the theoretical construct into empirical operational measures. It useful to separate
the relationship between partisanship and policy into two separate components: partisan-
ship of the voters and partisanship of the officials they elect. While there is clearly a strong
relationship between the two — overall, Democratic voters tend to support Democratic law-
makers, even in local elections (Oliver and Ha 2007; Schleicher 2007) — the latter does not
always serve as useful proxy for the former.
We focus our attention in particular on two recent studies, Ferreira and Gyourko (2009)
(F+G) and Gerber and Hopkins (2011) (G+H), which use the regression discontinuity design
to examine the relationship between partisanship and policy in American cities. Both sets of
analyses build on the work of Lee, Moretti, and Butler (2004) and exploit close mayoral elec-
tions as “natural experiments.” These studies represent some of the most methodologically
sophisticated work on the subject, with an emphasis on causal inferences. They are, how-
ever, flawed in several respects. First, although both studies purport to study the influence
of partisanship in local politics in broad terms — F+G describe their results as measuring
the “strength of partisan impulses at the local level” (p. 421) while G+H ask, “Does par-
7
tisanship lead cities to adopt significantly different fiscal policies?” — the design of both
studies allows them examine only the party in government while providing few insights about
the role played by the party in the electorate (Key 1964). Second, the strength of the RD
design rests on the assumption that close elections are indeed decided randomly. We show
that, in the case of G+H, this assumption appears to be violated in a way that undermines
the authors’ central findings.
It is worth considering each of these critiques in more detail. Lee (2008) demonstrates
the conditions under which elections provide an as-if random assignment mechanism that
can be used to identify causal effects in observational studies. Both F+G and G+H examine
mayoral elections in American cities, focusing on close contests in which Republican and
Democratic candidates prevail over their opponents by very small margins. When these
elections are so close that the winner is determined effectively by chance, this design ensures
that elected Democratic mayors are identical to their Republican mayors on most covariates,
providing an unbiased estimate of the effect of mayoral partisanship on policy outcomes.
While close elections have a number of properties that make them useful for estimating
many quantities of interest, one clear disadvantage is that this design estimates only the
effect of mayoral partisanship, ignoring other pathways through partisanship may be influ-
encing local policy outcomes. Indeed, the key assumption of the design is that cities with
close elections are identical both in terms of the partisan composition of city councils —
the legislative branches of local government that generally have greater direct influence over
policy than mayors who possess few formal legislative powers — and the partisanship of the
electorate. By effectively holding constant other partisan influences, the regression discon-
tinuity design estimates the effect of mayoral partisanship on policy. It cannot, however,
speak to the other potential mechanisms through which partisanship might play an active
role in local democracy.2 By contrast, our analysis shifts the focus to examine the role of
2A related concern is that RD studies estimate only the local treatment effect. If expect close electionsto be different from other contests — for example, by depriving the winning mayoral candidate of a clearmandate to implement their preferred policies — these local effects may be substantially different from thebroader phenomena to which we may wish to generalize the findings.
8
voter preferences, providing evidence that voters’ partisan predispositions have important
impacts on the size of local government and the distributive implications of city fiscal policy.3
The limited substantive focus of regression discontinuity studies likely explains why this
work produced largely null findings. There is, however, one clear exception: G+H appear to
show that Republican mayors allocate a greater share of local resources toward public safety,
increasing the share of the budget spent on police relative to their Democratic counterparts.
The causal strength of this finding rests on the critical assumptions that very close mayoral
contests are indeed decided randomly, something that only rarely appears to be the case in
practice (see Caughey and Sekhon 2011; Grimmer, Hersh, Feinstein, and Carpenter 2012).
Instead, close electoral contests magnify inherent differences between candidates — in terms
of candidate quality, resources, and interest group endorsements — by providing the most
likely context in which relatively small electoral advantages are likely to make the difference
between winning and losing the election.
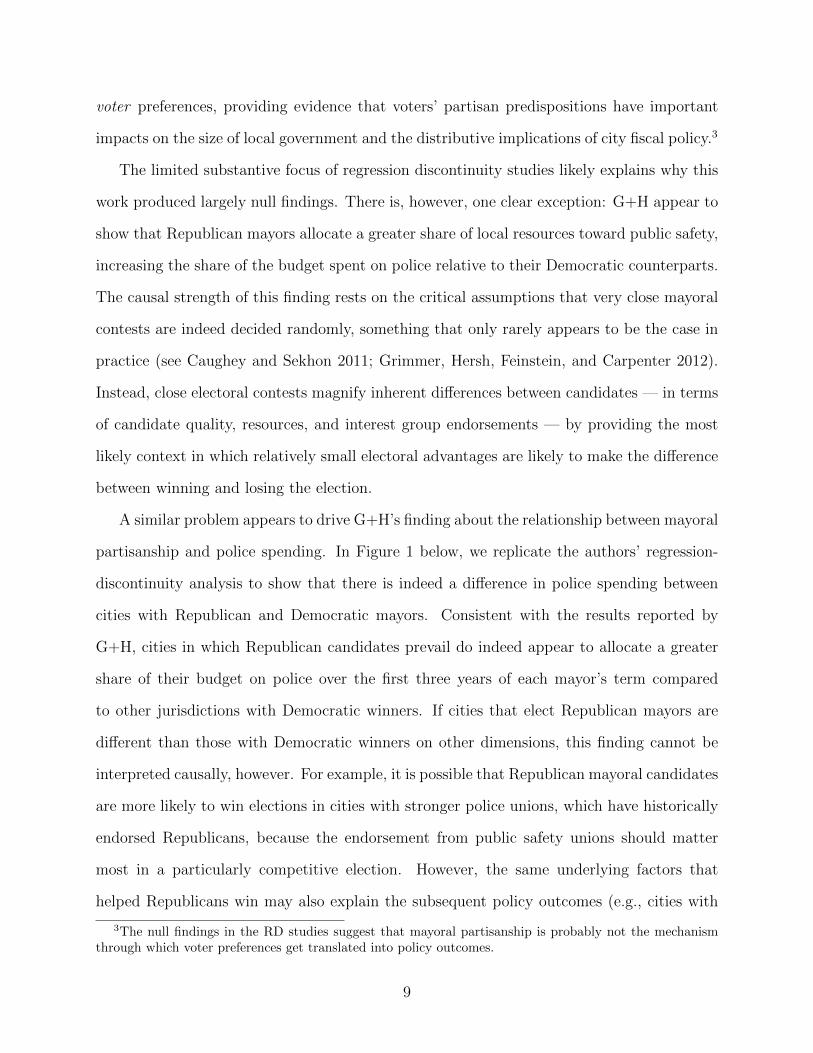
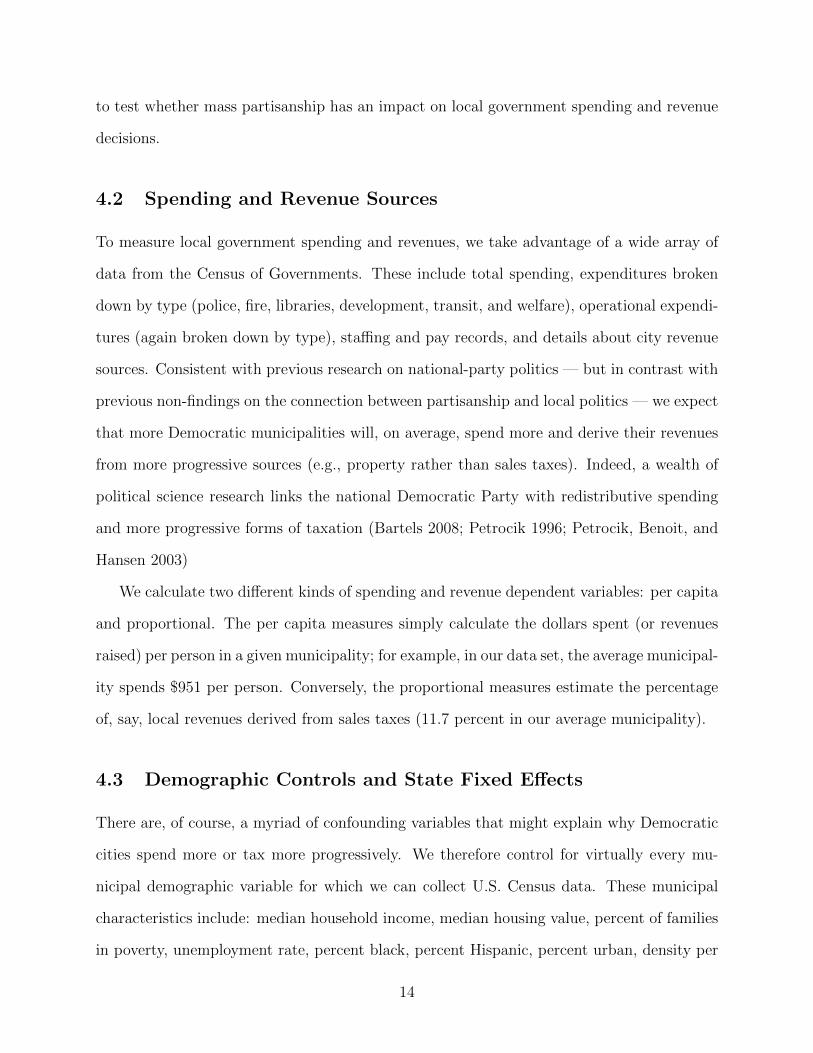
A similar problem appears to drive G+H’s finding about the relationship between mayoral
partisanship and police spending. In Figure 1 below, we replicate the authors’ regression-
discontinuity analysis to show that there is indeed a difference in police spending between
cities with Republican and Democratic mayors. Consistent with the results reported by
G+H, cities in which Republican candidates prevail do indeed appear to allocate a greater
share of their budget on police over the first three years of each mayor’s term compared
to other jurisdictions with Democratic winners. If cities that elect Republican mayors are
different than those with Democratic winners on other dimensions, this finding cannot be
interpreted causally, however. For example, it is possible that Republican mayoral candidates
are more likely to win elections in cities with stronger police unions, which have historically
endorsed Republicans, because the endorsement from public safety unions should matter
most in a particularly competitive election. However, the same underlying factors that
helped Republicans win may also explain the subsequent policy outcomes (e.g., cities with
3The null findings in the RD studies suggest that mayoral partisanship is probably not the mechanismthrough which voter preferences get translated into policy outcomes.
9
strong police unions allocate a greater share of their budget toward public safety).
●
●
●
●
●
●
●
●
●
●
●
●
●●
●
●
●
●
●
●
●
●
●
●
●
●
●
●
●
●
●●
●
●
●
●
●
●
●
●
●
●
●
●
●
●
●
●
●
●
●
●
●●
●
●
●
●
●
●
● ●
●
●●
●
●
●
●
●
●
●
●
●
●
●
●
●
●
●
●
●
●
●
●
●
●●
●
●
●
●
●
●
●
●
●
●
●
●●
●
●
●
●
●
●●
●●●
●
●
●
●
●
●
●
●
● ●
●
●
●
●
●
●
●
0.2 0.4 0.6 0.8
−0.
040.
000.
040.
08
Impact on Policing
Democratic Vote Share
Cha
nge
in P
olic
e S
pend
ing
● ● ● ● ● ● ● ● ● ● ● ● ● ● ● ● ● ● ● ● ● ● ● ● ● ● ● ● ● ● ● ● ●
● ● ● ● ● ● ● ● ● ● ● ● ● ● ● ● ● ● ● ● ● ● ● ● ● ● ● ● ● ● ● ● ●●
RepublicanWins
DemocratWins
●●
●
●
●●
●
● ● ●
●●
●
●
●
●
●
●●●
●
●
●
●
●
●●
●
●
●
●
●
●
●
●
●
●●
●
●
●
●●
●
●
●
●
●
●
●
●●●
●●
●
●
●
●
●
●
●
●●
●●
●
●
●
●
●
●
●
●
●●
●
●
●
●
●
●
●
●
● ●
●
●
● ●
●
● ●
●
●●
●
●
●●●
●
●
●
●
●
●●
●
●
●
●
●
●
●
●● ●
●
●
●
●●
●
●●
●●
●
●
●
●●
0.2 0.4 0.6 0.8
0.00
0.05
0.10
0.15
0.20
Placebo Test
Democratic Vote Share
Pol
ice
Spe
ndin
g P
rior
to E
lect
ion
● ● ● ● ● ● ● ● ● ● ● ● ● ● ● ● ● ● ● ● ● ● ● ● ● ● ● ● ● ● ● ● ● ●
● ● ● ● ● ● ● ● ● ● ● ● ● ● ● ● ● ● ● ● ● ● ● ● ● ● ● ● ● ● ● ●●
●
RepublicanWins
DemocratWins
Figure 1: Effect of mayoral partisanship on change in city police spending (replicating Gerberand Hopkins 2011).
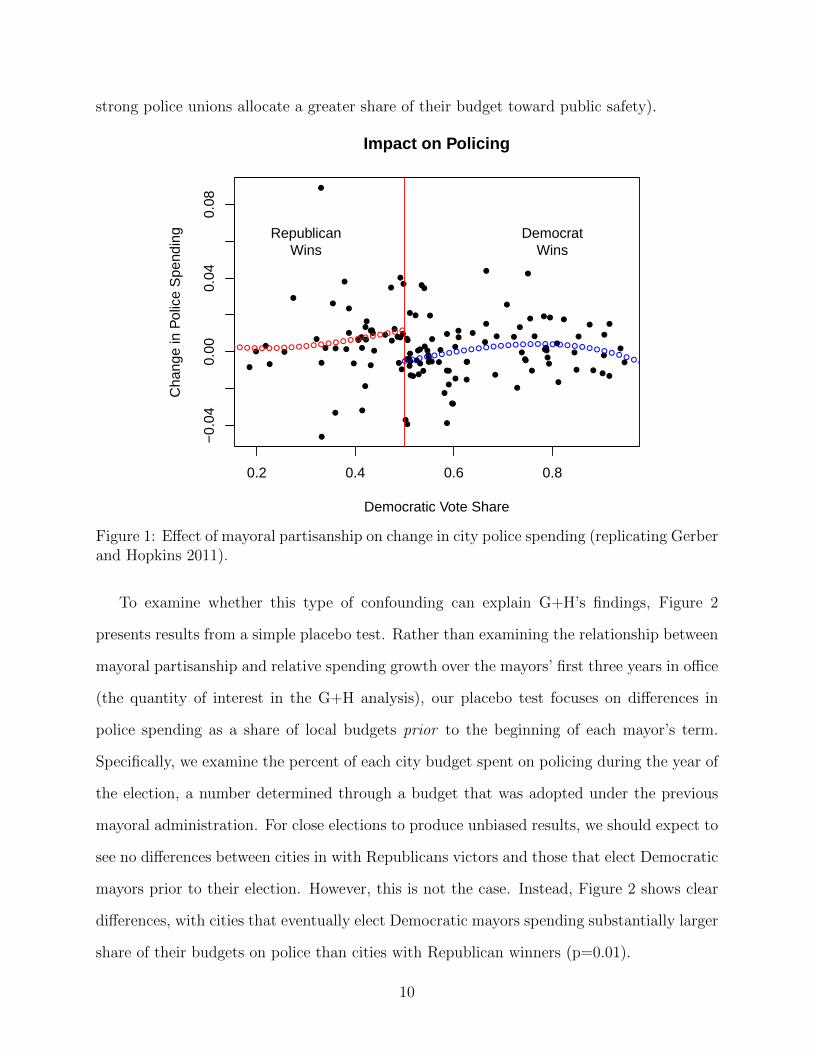
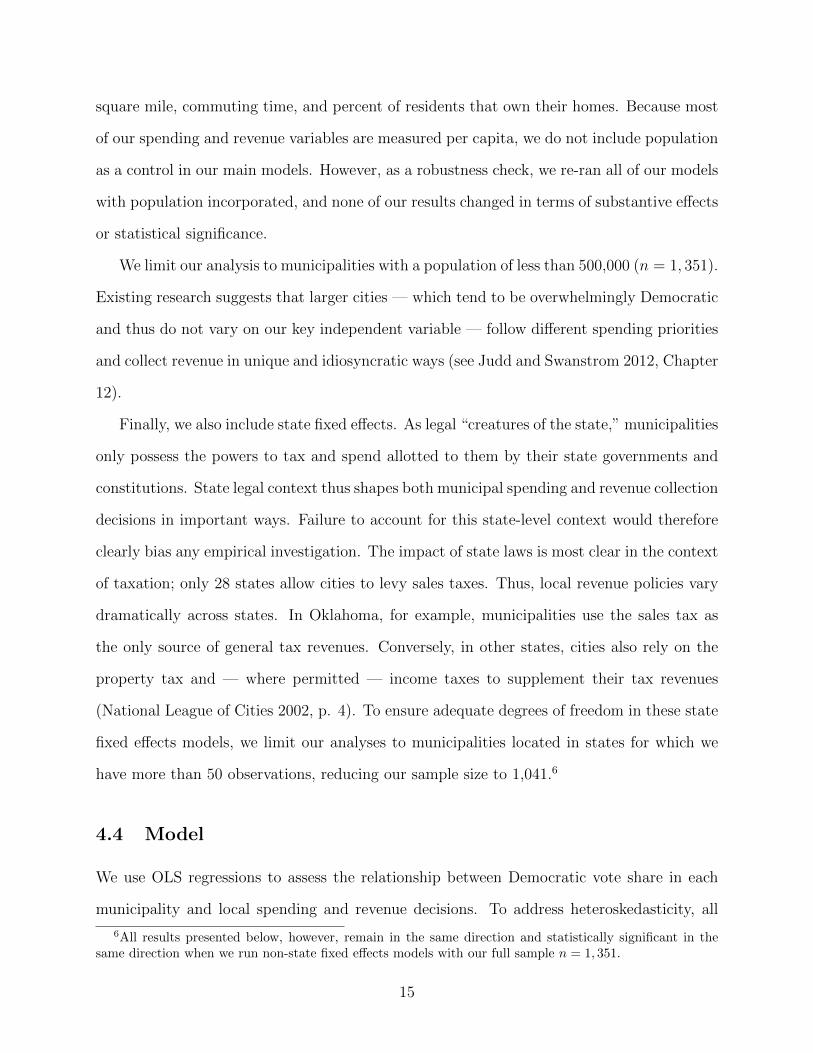
To examine whether this type of confounding can explain G+H’s findings, Figure 2
presents results from a simple placebo test. Rather than examining the relationship between
mayoral partisanship and relative spending growth over the mayors’ first three years in office
(the quantity of interest in the G+H analysis), our placebo test focuses on differences in
police spending as a share of local budgets prior to the beginning of each mayor’s term.
Specifically, we examine the percent of each city budget spent on policing during the year of
the election, a number determined through a budget that was adopted under the previous
mayoral administration. For close elections to produce unbiased results, we should expect to
see no differences between cities in with Republicans victors and those that elect Democratic
mayors prior to their election. However, this is not the case. Instead, Figure 2 shows clear
differences, with cities that eventually elect Democratic mayors spending substantially larger
share of their budgets on police than cities with Republican winners (p=0.01).
10
●
●
●
●
●
●
●
●
●
●
●
●
●●
●
●
●
●
●
●
●
●
●
●
●
●
●
●
●
●
●●
●
●
●
●
●
●
●
●
●
●
●
●
●
●
●
●
●
●
●
●
●●
●
●
●
●
●
●
● ●
●
●●
●
●
●
●
●
●
●
●
●
●
●
●
●
●
●
●
●
●
●
●
●
●●
●
●
●
●
●
●
●
●
●
●
●
●●
●
●
●
●
●
●●
●●●
●
●
●
●
●
●
●
●
● ●
●
●
●
●
●
●
●
0.2 0.4 0.6 0.8
−0.
040.
000.
040.
08
Impact on Policing
Democratic Vote Share
Cha
nge
in P
olic
e S
pend
ing
● ● ● ● ● ● ● ● ● ● ● ● ● ● ● ● ● ● ● ● ● ● ● ● ● ● ● ● ● ● ● ● ●
● ● ● ● ● ● ● ● ● ● ● ● ● ● ● ● ● ● ● ● ● ● ● ● ● ● ● ● ● ● ● ● ●●
RepublicanWins
DemocratWins
●●
●
●
●●
●
● ● ●
●●
●
●
●
●
●
●●●
●
●
●
●
●
●●
●
●
●
●
●
●
●
●
●
●●
●
●
●
●●
●
●
●
●
●
●
●
●●●
●●
●
●
●
●
●
●
●
●●
●●
●
●
●
●
●
●
●
●
●●
●
●
●
●
●
●
●
●
● ●
●
●
● ●
●
● ●
●
●●
●
●
●●●
●
●
●
●
●
●●
●
●
●
●
●
●
●
●● ●
●
●
●
●●
●
●●
●●
●
●
●
●●
0.2 0.4 0.6 0.8
0.00
0.05
0.10
0.15
0.20
Placebo Test
Democratic Vote Share
Pol
ice
Spe
ndin
g P
rior
to E
lect
ion
● ● ● ● ● ● ● ● ● ● ● ● ● ● ● ● ● ● ● ● ● ● ● ● ● ● ● ● ● ● ● ● ● ●
● ● ● ● ● ● ● ● ● ● ● ● ● ● ● ● ● ● ● ● ● ● ● ● ● ● ● ● ● ● ● ●●
●
RepublicanWins
DemocratWins
Figure 2: Placebo test: Effect on mayoral partisanship on police spending under previousadministration.
The magnitude of the effect, 3 percentage points, is almost identical to the 2.5 percentage
point difference between Republican and Democratic mayors reported in G+H. The placebo
test points to two possible explanations. First, it may be the case that low levels of police
spending create political opportunities for Republican candidates, who can exploit public
concern over public safety to their electoral advantage. Alternatively, the G+H result may
simply represent regression to the mean, with cities that previously spent a smaller share
of their budget on policing increasing their public safety budget at a faster rate rate over
time. Regardless of which explanation is the correct one, the placebo tests provides clear
evidence that the differences between these cities do not appear to be causally related to the
partisanship of their mayors.
11
4 Data and Methods
Unlike the RD studies, which focus exclusively on mayoral partisanship, we look at the
relationship between the partisan predispositions of voters and local policy outcomes. Thus,
our analysis expands the mechanisms through which parties can play a role, including election
to legislative offices and even perhaps direct democracy. We discuss the possible mechanisms
and offer our speculation about which ones appear to be most consistent with the empirical
relationships we document in the conclusion.
In our analysis, we use three types of data to estimate the impact of partisanship on local
governing: (1) municipal-level partisanship; (2) local spending; (3) local revenue sources. In
addition, we include a variety of important controls to address the potentially confounding
influences of municipal demography and state-level legal context.
4.1 Municipal Partisanship
To calculate our key independent variable — the proportion of a municipality that is Demo-
cratic — we use precinct-level presidential returns from the Federal Elections Project dataset
(Lublin and Voss 2007). With these precinct results, we generate an original data set that
calculates the the percent of each municipality that supported Democratic candidate Al Gore
in the 2000 presidential election. Because the Federal Election Project includes precinct-level
data from only one election, our results look at cross-sectional variation and do not allow for
comparisons within cities over time. Our data’s cross-sectional nature introduces one impor-
tant limitation into our analysis: we cannot fully separate whether an observed connection
between Democratic vote share and spending are a result of preferences shaping spending or
preferences being shaped by spending. We suspect both are at play. However, even finding a
link between partisanship and local spending/revenue decisions would represent an impor-
tant improvement in our understanding of local democracy; thus far, no study has uncovered
a clear and consistent correlation between voter preferences and local government resource
12
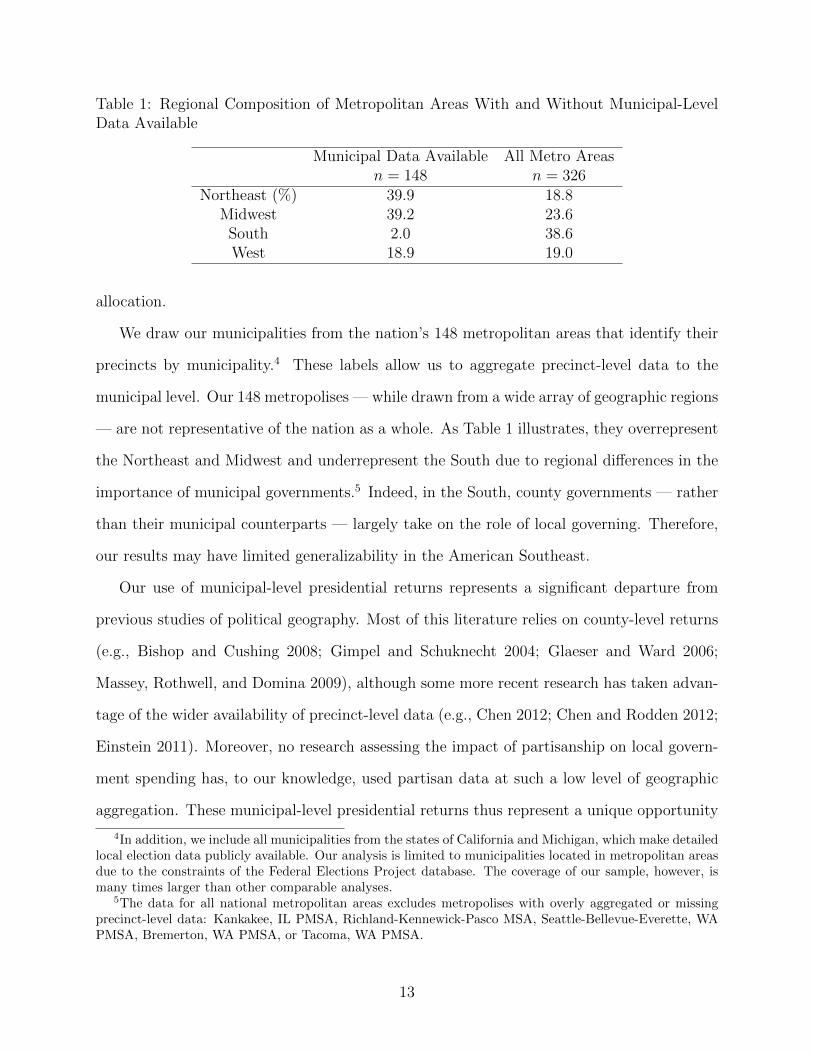
Table 1: Regional Composition of Metropolitan Areas With and Without Municipal-LevelData Available
Municipal Data Available All Metro Areasn = 148 n = 326
Northeast (%) 39.9 18.8Midwest 39.2 23.6
South 2.0 38.6West 18.9 19.0
allocation.
We draw our municipalities from the nation’s 148 metropolitan areas that identify their
precincts by municipality.4 These labels allow us to aggregate precinct-level data to the
municipal level. Our 148 metropolises — while drawn from a wide array of geographic regions
— are not representative of the nation as a whole. As Table 1 illustrates, they overrepresent
the Northeast and Midwest and underrepresent the South due to regional differences in the
importance of municipal governments.5 Indeed, in the South, county governments — rather
than their municipal counterparts — largely take on the role of local governing. Therefore,
our results may have limited generalizability in the American Southeast.
Our use of municipal-level presidential returns represents a significant departure from
previous studies of political geography. Most of this literature relies on county-level returns
(e.g., Bishop and Cushing 2008; Gimpel and Schuknecht 2004; Glaeser and Ward 2006;
Massey, Rothwell, and Domina 2009), although some more recent research has taken advan-
tage of the wider availability of precinct-level data (e.g., Chen 2012; Chen and Rodden 2012;
Einstein 2011). Moreover, no research assessing the impact of partisanship on local govern-
ment spending has, to our knowledge, used partisan data at such a low level of geographic
aggregation. These municipal-level presidential returns thus represent a unique opportunity
4In addition, we include all municipalities from the states of California and Michigan, which make detailedlocal election data publicly available. Our analysis is limited to municipalities located in metropolitan areasdue to the constraints of the Federal Elections Project database. The coverage of our sample, however, ismany times larger than other comparable analyses.
5The data for all national metropolitan areas excludes metropolises with overly aggregated or missingprecinct-level data: Kankakee, IL PMSA, Richland-Kennewick-Pasco MSA, Seattle-Bellevue-Everette, WAPMSA, Bremerton, WA PMSA, or Tacoma, WA PMSA.
13
to test whether mass partisanship has an impact on local government spending and revenue
decisions.
4.2 Spending and Revenue Sources
To measure local government spending and revenues, we take advantage of a wide array of
data from the Census of Governments. These include total spending, expenditures broken
down by type (police, fire, libraries, development, transit, and welfare), operational expendi-
tures (again broken down by type), staffing and pay records, and details about city revenue
sources. Consistent with previous research on national-party politics — but in contrast with
previous non-findings on the connection between partisanship and local politics — we expect
that more Democratic municipalities will, on average, spend more and derive their revenues
from more progressive sources (e.g., property rather than sales taxes). Indeed, a wealth of
political science research links the national Democratic Party with redistributive spending
and more progressive forms of taxation (Bartels 2008; Petrocik 1996; Petrocik, Benoit, and
Hansen 2003)
We calculate two different kinds of spending and revenue dependent variables: per capita
and proportional. The per capita measures simply calculate the dollars spent (or revenues
raised) per person in a given municipality; for example, in our data set, the average municipal-
ity spends $951 per person. Conversely, the proportional measures estimate the percentage
of, say, local revenues derived from sales taxes (11.7 percent in our average municipality).
4.3 Demographic Controls and State Fixed Effects
There are, of course, a myriad of confounding variables that might explain why Democratic
cities spend more or tax more progressively. We therefore control for virtually every mu-
nicipal demographic variable for which we can collect U.S. Census data. These municipal
characteristics include: median household income, median housing value, percent of families
in poverty, unemployment rate, percent black, percent Hispanic, percent urban, density per
14
square mile, commuting time, and percent of residents that own their homes. Because most
of our spending and revenue variables are measured per capita, we do not include population
as a control in our main models. However, as a robustness check, we re-ran all of our models
with population incorporated, and none of our results changed in terms of substantive effects
or statistical significance.
We limit our analysis to municipalities with a population of less than 500,000 (n = 1, 351).
Existing research suggests that larger cities — which tend to be overwhelmingly Democratic
and thus do not vary on our key independent variable — follow different spending priorities
and collect revenue in unique and idiosyncratic ways (see Judd and Swanstrom 2012, Chapter
12).
Finally, we also include state fixed effects. As legal “creatures of the state,” municipalities
only possess the powers to tax and spend allotted to them by their state governments and
constitutions. State legal context thus shapes both municipal spending and revenue collection
decisions in important ways. Failure to account for this state-level context would therefore
clearly bias any empirical investigation. The impact of state laws is most clear in the context
of taxation; only 28 states allow cities to levy sales taxes. Thus, local revenue policies vary
dramatically across states. In Oklahoma, for example, municipalities use the sales tax as
the only source of general tax revenues. Conversely, in other states, cities also rely on the
property tax and — where permitted — income taxes to supplement their tax revenues
(National League of Cities 2002, p. 4). To ensure adequate degrees of freedom in these state
fixed effects models, we limit our analyses to municipalities located in states for which we
have more than 50 observations, reducing our sample size to 1,041.6
4.4 Model
We use OLS regressions to assess the relationship between Democratic vote share in each
municipality and local spending and revenue decisions. To address heteroskedasticity, all
6All results presented below, however, remain in the same direction and statistically significant in thesame direction when we run non-state fixed effects models with our full sample n = 1, 351.
15
standard errors are robust.
5 Results
We first present our results for spending — including total expenditures levels, operations
spending (all expenditures excluding capital projects), and spending on payroll — before
moving to our discussion of revenues and debt.
5.1 Spending
Our models reveal that, all else held constant, Democratic cities spend more total, on op-
erations, and on pay than their Republican counterparts across an array of spending types.
Table 6 illustrates the magnitude of these results. To allow easy comparison across the many
different categories of spending, we only present our OLS coefficients for our key indepen-
dent variable (the proportion of a municipality that is Democratic) with heteroskedasticity-
consistent standard errors in parentheses. All of these coefficients, however, are derived
from models containing a full set of controls, including income, poverty, unemployment rate,
percent black, percent Hispanic, percent urban, density per square mile, commuting time,
percent homeownership, and state fixed effects. Our analysis of staffing focuses on police,
fire, and libraries, as these are the most common functions widely provided by city gov-
ernments in nearly every state. Full model results are available in the Appendix A. The
dependent variables in each model can be identified by looking at column and row headings
in Table 6. For example, looking at the first row from left to right, the dependent variables
are total municipal expenditures and total expenditures on operations (both per capita).
Table 6 reveals that, as expected, more Democratic cities spend more — in total, on
operations, and on payroll — across a wide array of spending arenas. The coefficient on
Democratic vote share is most consistent in three arenas: total expenditures, police spending,
and welfare spending. Looking at the per-capita total spending models, an increase in
16
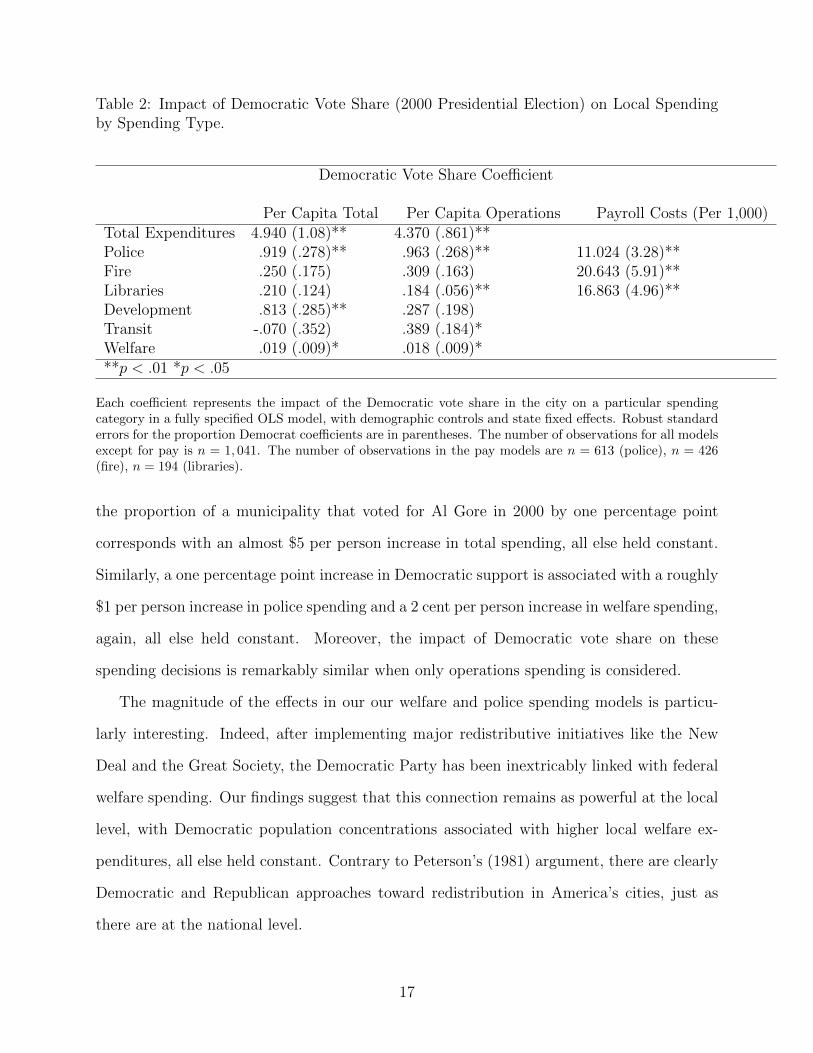
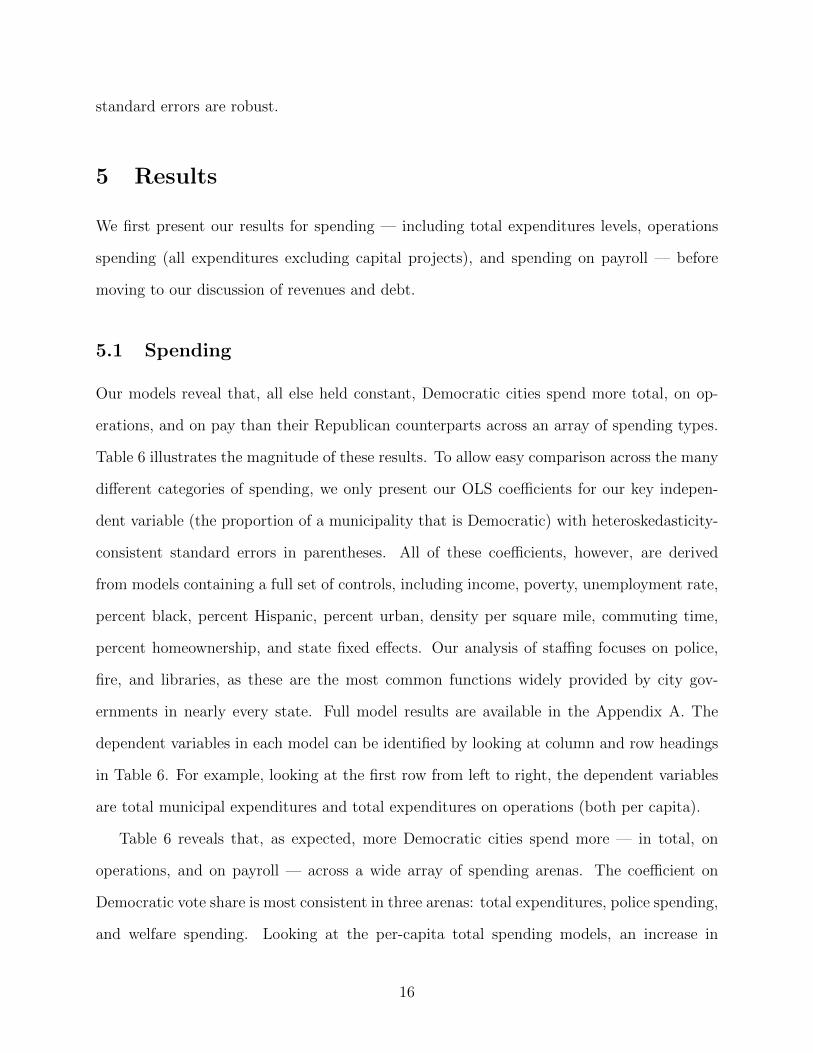
Table 2: Impact of Democratic Vote Share (2000 Presidential Election) on Local Spendingby Spending Type.
Democratic Vote Share Coefficient
Per Capita Total Per Capita Operations Payroll Costs (Per 1,000)Total Expenditures 4.940 (1.08)** 4.370 (.861)**Police .919 (.278)** .963 (.268)** 11.024 (3.28)**Fire .250 (.175) .309 (.163) 20.643 (5.91)**Libraries .210 (.124) .184 (.056)** 16.863 (4.96)**Development .813 (.285)** .287 (.198)Transit -.070 (.352) .389 (.184)*Welfare .019 (.009)* .018 (.009)***p < .01 *p < .05
Each coefficient represents the impact of the Democratic vote share in the city on a particular spendingcategory in a fully specified OLS model, with demographic controls and state fixed effects. Robust standarderrors for the proportion Democrat coefficients are in parentheses. The number of observations for all modelsexcept for pay is n = 1, 041. The number of observations in the pay models are n = 613 (police), n = 426(fire), n = 194 (libraries).
the proportion of a municipality that voted for Al Gore in 2000 by one percentage point
corresponds with an almost $5 per person increase in total spending, all else held constant.
Similarly, a one percentage point increase in Democratic support is associated with a roughly
$1 per person increase in police spending and a 2 cent per person increase in welfare spending,
again, all else held constant. Moreover, the impact of Democratic vote share on these
spending decisions is remarkably similar when only operations spending is considered.
The magnitude of the effects in our our welfare and police spending models is particu-
larly interesting. Indeed, after implementing major redistributive initiatives like the New
Deal and the Great Society, the Democratic Party has been inextricably linked with federal
welfare spending. Our findings suggest that this connection remains as powerful at the local
level, with Democratic population concentrations associated with higher local welfare ex-
penditures, all else held constant. Contrary to Peterson’s (1981) argument, there are clearly
Democratic and Republican approaches toward redistribution in America’s cities, just as
there are at the national level.
17
While social welfare is an issue that has been firmly identified as Democratic at the
national level, the Republican Party has historically retained a reputation of being tough
on crime (e.g., Petrocik 1996; Petrocik, Benoit, and Hansen 2003; although see Holian
2004). Nonetheless, we see a close positive relationship between the Democratic vote share
in each municipality and its levels of per capita police spending. Although Republicans may
prioritize public safety programs, Democrats’ support for bigger city government appears to
apply to police functions as well. One possibility is that Democratic cities simply experience
more crime. We control for many of the most likely drivers of local crime — including
unemployment, percent non-white, percent urban, density, poverty, income, and rates of
homeownership — but we do not have a municipal-level measure of crime in our models.
In addition, it might be that left-leaning political leaders seek to neutralize the inherent
Republican advantage on this issue by spending more on the police force.
5.2 Revenue
We also discover that, all else held constant, more Democratic cities are more likely to
collect their taxes progressively, relying more heavily on the property tax than the sales tax.
The impact of partisanship on revenue choices, however, appears to be substantively smaller
than in local spending decisions. Table 3 highlights this relationship by displaying the model
coefficients for our key independent variable of interest, Democratic vote share at the city
level. These coefficients are derived from our full state fixed effects models. The dependent
variables in this table can be easily identified by looking at the row names: from top to
bottom, we explore the impact of local voter partisanship on total own source revenue (the
total revenue derived from local taxation), per capita property tax collection, per capita
sales tax collection, sales tax as a percent of total revenue, total per capita debt, and total
per capita long-term debt.
The only statistically significant impact of Democratic vote share emerges when sales tax
as a share of total revenue is the dependent variable. All else held equal, as cities grow more
18
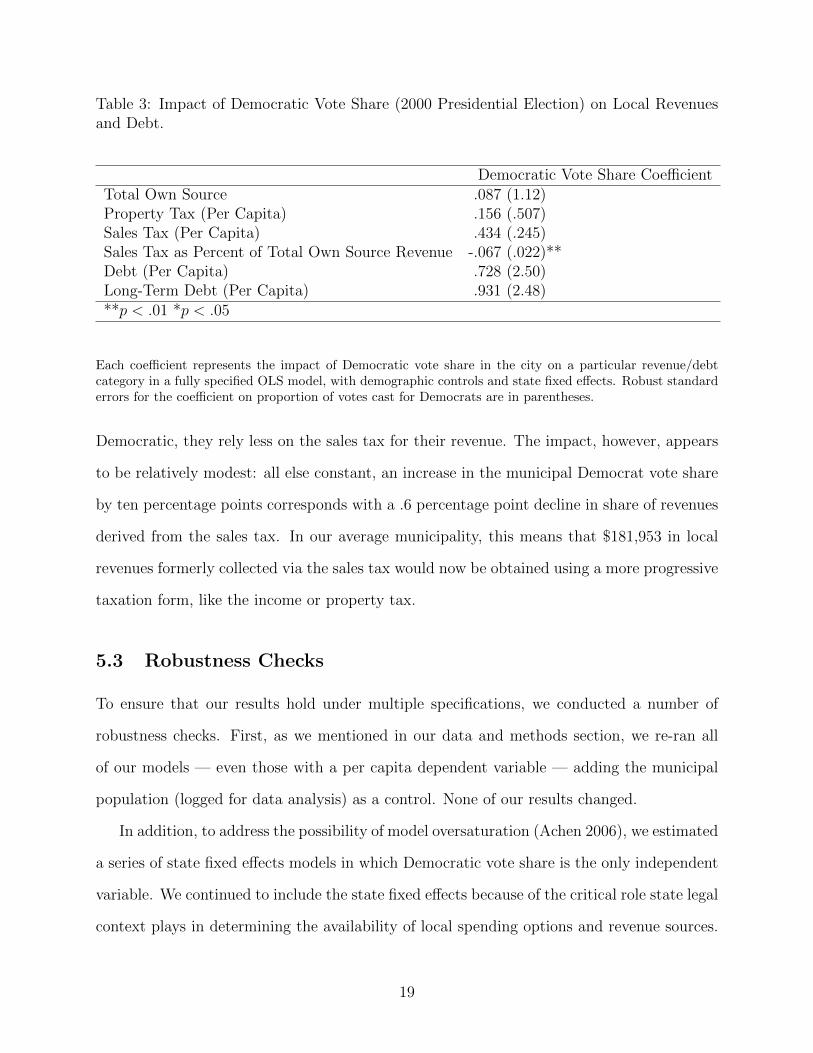
Table 3: Impact of Democratic Vote Share (2000 Presidential Election) on Local Revenuesand Debt.
Democratic Vote Share CoefficientTotal Own Source .087 (1.12)Property Tax (Per Capita) .156 (.507)Sales Tax (Per Capita) .434 (.245)Sales Tax as Percent of Total Own Source Revenue -.067 (.022)**Debt (Per Capita) .728 (2.50)Long-Term Debt (Per Capita) .931 (2.48)**p < .01 *p < .05
Each coefficient represents the impact of Democratic vote share in the city on a particular revenue/debtcategory in a fully specified OLS model, with demographic controls and state fixed effects. Robust standarderrors for the coefficient on proportion of votes cast for Democrats are in parentheses.
Democratic, they rely less on the sales tax for their revenue. The impact, however, appears
to be relatively modest: all else constant, an increase in the municipal Democrat vote share
by ten percentage points corresponds with a .6 percentage point decline in share of revenues
derived from the sales tax. In our average municipality, this means that $181,953 in local
revenues formerly collected via the sales tax would now be obtained using a more progressive
taxation form, like the income or property tax.
5.3 Robustness Checks
To ensure that our results hold under multiple specifications, we conducted a number of
robustness checks. First, as we mentioned in our data and methods section, we re-ran all
of our models — even those with a per capita dependent variable — adding the municipal
population (logged for data analysis) as a control. None of our results changed.
In addition, to address the possibility of model oversaturation (Achen 2006), we estimated
a series of state fixed effects models in which Democratic vote share is the only independent
variable. We continued to include the state fixed effects because of the critical role state legal
context plays in determining the availability of local spending options and revenue sources.
19
The Democratic vote share coefficient does not change in direction or significance in any of
our key spending results (total, police, or welfare spending).
However, the coefficient on the Democratic vote share variable does change in both
direction and significance when it is the sole explanatory variable and the share of revenue
derived from the sales tax is the dependent variable. We added each of our demographic
controls one at a time to see which needed to be in the model for the proportion Democrat
to become statistically significant; we discovered that the density per square mile has to be
controlled for in the the share sales tax model in order for the proportion Democrat to have
a negative and statistically significant coefficient. Taken in concert with the substantively
small effect on the share of local revenue collected by sales tax, we feel much more confident
in our spending results than in our revenue findings.7
6 Discussion
The strength of our spending results relative to our revenue findings suggests that local
governments have more leeway to represent the interests of their constituents in expendi-
ture allocation than in revenue collection. Why might preferences be better represented in
spending than in taxation? One potential answer lies in the inter-jurisdictional fragmenta-
tion described in Peterson’s (1981) seminal account. Competing metropolitan municipalities
might worry about losing residents and businesses to neighboring communities with lower
tax rates. These powerful economic forces may constrain the range of tax rates (and types
of taxation) actually available to local political leaders.
Another possibility centers on state regulatory power over taxation. We noted in our
discussion of state fixed effects that state governments have a particularly potent influence on
the taxation options available to local governments, with many municipalities unable to levy
7The coefficient on the Democratic vote share variable in the sales tax model also fails to remain statisti-cally significant when we estimate a robust regression using iteratively reweighted least squares. Conversely,all of our spending models the coefficients remain in the same direction and statistically significant underthis robust specification.
20
any sales tax. Thus, municipal legal context may be working in concert with jurisdictional
competition to dampen the representation of political preferences in the taxation realm.
7 Conclusion
Overall, our results provide clear evidence that city governments are responsive to the pref-
erences of their voters. As cities grow more Democratic, they increase their levels of service
provision across an array of policy arenas in response to their voters’ desires for bigger govern-
ment. Thus, the partisanship of voters plays an important role in accounting for variation in
budgetary policy across cities. In light of the null/mixed findings in the mayoral partisanship
literature — indeed, G+H’s are the opposite of those presented here — our results suggest
that scholars interested in exploring the process of policy formation in cities should focus
their attention on mechanisms outside of the partisan identification of mayors. In particular,
we believe that city councils — which are even more powerful than Congress in terms of their
ability to shape budgetary policy in the face of executive branch opposition — represent one
of the primary mechanisms through which voter partisanship comes to influence local policy
outcomes. It is also probably the case that the electoral connection looms large in the minds
of elected officials: Republican mayors elected in largely Democratic cities would certainly
think twice about not giving their constituents what they want if their intent is to remain
in office after the next election.
Future research might begin to adjudicate between these two possibilities by taking ad-
vantage of ever-improving longitudinal precinct data. Such longitudinal data would also
allow scholars to address another potential question presented by this analysis: does public
opinion affect spending levels, or does spending shape public opinion? The causal arrow
likely points in both directions; we are unable, however, to empirically separate these two
separate causal pathways with our cross-sectional data. Nonetheless, by uncovering the
first empirical link between partisan preferences and local spending, our results represent
21
an important first step in demonstrating that local public opinion matters and that local
governments have the power to respond to these voter preferences.
22
References
Abramowitz, A. I. (2010). The Disappearing Center: Engaged Citizens, Polarization, and
American Democracy. New Haven, CT: Yale University Press.
Achen, C. (2006). Let’s put garbage-can regressions and probits where they belong. Con-
flict Management and Peace Research 22, 327–339.
Alrich, J. H. (1995). Why Parties? The Origins and Transformation of Political Parties
in America. Chicago: University of Chicago Press.
Banfield, E. C. and J. Q. Wilson (1963). City Politics. Cambridge, MA: Harvard University
Press.
Bartels, L. M. (2008). Unequal Democracy: The Political Economy of the New Gilded Age.
Princeton, NJ: Princeton University Press.
Berry, C. (2008). Piling on: Multilevel government and the fiscal common-pool. American
Journal of Political Science 52 (4), 802–820.
Bishop, B. and R. G. Cushing (2008). The Big Sort: Why the Clustering of Like-Minded
America is Tearing Us Apart. Chicago: Houghton Mifflin Harcourt.
Brazer, H. S. (1959). City expenditures in the United States. National Bureau of Economic
Research Occasional Paper No. 66.
Campbell, A., P. E. Converse, W. E. Miller, and D. Stokes (1960). The Amercan Voter.
New York: Wiley.
Caughey, D. and J. S. Sekhon (2011). Elections and the regression discontinuity design:
Lessons from close U.S. house races, 1942-2008. Political Analysis 19 (4), 385–408.
Chen, J. (2012). The effect of electoral geography on competitive elections and partisan
gerrymandering. Working Paper.
Chen, J. and J. Rodden (2012). Unintentional gerrymandering: Political geography and
electoral bias in legislatures. Working Paper.
23
Cox, G. W. and M. D. McCubbins (1993). Legislative Leviathan: Party Government in
the House. Berkeley: University of California Press.
Cox, G. W. and M. D. McCubbins (2005). Setting the Agenda: Responsible Party Gov-
ernment in the U.S. House of Representatives. New York, NY: Cambridge University
Press.
Craw, M. (2010). Deciding to provide: Local decisions on providing social welfare. Amer-
ican Journal of Political Science 54 (4), 906–920.
Desmond, T. (1955). States eclipse the cities. National Municipal Review 44, 296–300.
Einstein, K. L. (2011). Divided regions: Race, political segregation, and the political
polarization of metropolitan America. Working Paper.
Ferreira, F. and J. Gyourko (2009). Do political parties matter? evidence from u.s. cities.
Quarterly Journal of Economics 124 (1), 349–397.
Fisman, R. and R. Gatti (2002). Decentralization and corruption: Evidence across coun-
tries. Journal of Public Economics 83, 325–345.
Fried, R. (1975). Comparative urban policy and performance. In N. Polsby and F. Green-
stein (Eds.), Handbook of Political Science, Volume 6, pp. 305–379. Addison-Wesley.
Gamm, G. and T. Kousser (2010). The embattled metropolis: Big cities in amer-
ican state legislatures. APSA 2010 Annual Meeting Paper. Available at SSRN:
http://ssrn.com/abstract=1642912.
Gerber, E. R. and D. J. Hopkins (2011). When mayors matter: Estimating the impact
of mayoral partisanship on city policy. American Journal of Political Science 55 (2),
326–339.
Gerring, J. (2001). Party Ideologies in America, 1828-1996. New York: Cambridge Uni-
versity Press.
24
Gimpel, J. S. and J. E. Schuknecht (2004). Patchwork National: Sectionalism and Political
Change in American Politics. Ann Arbor, MI: University of Michigan Press.
Glaeser, E. L. and B. A. Ward (2006). Myths and realities of American political geography.
Journal of Economic Perspectives 2 (2), 119–144.
Green, D. P., B. Palmquist, and E. Shickler (2002). Partisan Hearts and Minds: Political
Parties and the Social Idintity of Voters. New Haven: Yale University Press.
Grimmer, J., E. Hersh, B. Feinstein, and D. Carpenter (2012). Are close elections random?
Working Paper.
Hacker, J. S. and P. Pierson (2010). Winner-Take-All Politics: How Washington Made
the Rich Richer – and Turned Its Back on the Middle Class. New York, NY: Simon &
Schuster.
Hajnal, Z. L. and J. Trounstine (2010). Who or what governs?: The effects of economics,
politics, institutions, and needs on local spending. American Politics Research 38 (6),
1130–1163.
Holian, D. B. (2004). He’s stealing my issues! Clinton’s crime rhetoric and the dynamics
of issue ownership. Political Behavior 26 (2), 95–104.
Jacobson, G. C. (2003). Partisan polarization in presidential support: The electoral con-
nection. Congress & the Presidency 30, 1–36.
Judd, D. R. and T. Swanstrom (2012). City Politics: The Political Economy of Urban
America.
Key, V. (1964). Politics, Parties, and Pressure Groups (5 ed.).
Kiewiet, D. R. and M. D. McCubbins (1991). The Logic of Delegation. Chicago: University
of Chicago Press.
Lee, D. S. (2008). Randomized experiments from non-random selection in U.S. house
elections. Journal of Econometrics 142 (2), 675–697.
25
Lee, D. S., E. Moretti, and M. J. Butler (2004). Do voters affect or elect policies? evidence
from the U.S. house. Quarterly Journal of Economics 119 (3), 807–859.
Levendusky, M. (2009). How Liberals Became Democrats and Conservatives Became Re-
publicans. Chicago: University of Chicago Press.
Lowery, D., W. E. Lyons, and R. H. DeHoog (1990). Institutionally-induced attribution
errors: Their composition and impact on citizen satisfaction with local government
services. American Politics Quarterly 18 (2), 169–196.
Lublin, D. and D. S. Voss (2007). Replication data for: Federal elections
project. http://hdl.handle.net/1902.1/10361 UNF:3:XKSkGdickAIIVuJaJgdUlA==
David Lublin[Distributor] V1 [Version].
Makse, T. and C. Volden (2012). The role of policy attributes in the diffusion of innova-
tions. Journal of Politics 73, 108–124.
Massey, D. S., J. Rothwell, and T. Domina (2009). The changing bases of segregation
in the United States. The ANNALS of the American Academy of Political and Social
Science 626, 74–90.
McCarty, N., K. T. Poole, and H. Rosenthal (2006). Polarized America: The Dance of
Ideology and Unequal Riches. Cambridge, MA: MIT Press.
Minkoff, S. L. (2012). The proximate polity: Spatial context and political risk in develop-
mental goods. Urban Affairs Review 48 (3), 354–388.
National League of Cities (2002). City fiscal conditions in 2002. Research Report on Amer-
ica’s Cities.
Oliver, J. E. and S. E. Ha (2007). Vote choice in suburban elections. American Political
Science Review 101 (3), 393–408.
Ostrom, V., C. M. Tiebout, and R. Warren (1961). The organization of government in
metropolitan areas: A theoretical inquiry. American Political Science Review 55, 831–
26
842.
Peterson, P. (1981). City Limits. Chicago: University of Chicago Press.
Petrocik, J. R. (1996). Issue ownership in presidential elections, with a 1980 case study.
American Political Science Review 40 (3), 825–850.
Petrocik, J. R., W. L. Benoit, and G. J. Hansen (2003). Issue ownership and presidential
campaigning, 1952-2000. Political Science Quarterly 118 (4), 599–626.
Popkin, S. L. (1994).
Rohde, D. W. (1991). Parties and Leaders in the Postreform House. Chicago: University
of Chicago Press.
Schleicher, D. (2007). Why is there no partisan competition in city council elections? the
role of election law. American Politics Research 23 (4), 419–473.
Tiebout, C. (1956). A pure theory of local expenditures. Journal of Political Economy 54,
416–424.
Volden, C. (2006). States as policy laboratories: Emulating success in the children’s health
insurance program. American Journal of Political Science 50, 294–312.
27

A Appendix
28
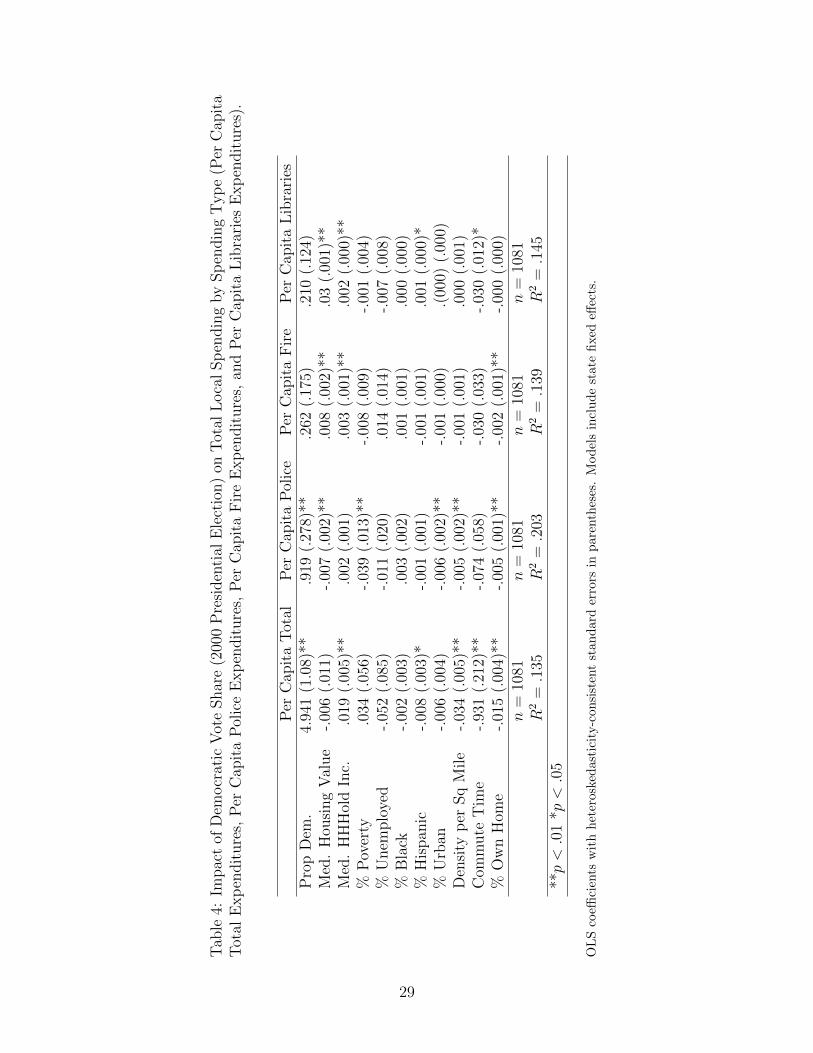
Tab
le4:
Impac
tof
Dem
ocr
atic
Vot
eShar
e(2
000
Pre
siden
tial
Ele
ctio
n)
onT
otal
Loca
lSp
endin
gby
Sp
endin
gT
yp
e(P
erC
apit
aT
otal
Exp
endit
ure
s,P
erC
apit
aP
olic
eE
xp
endit
ure
s,P
erC
apit
aF
ire
Exp
endit
ure
s,an
dP
erC
apit
aL
ibra
ries
Exp
endit
ure
s).
Per
Cap
ita
Tot
alP
erC
apit
aP
olic
eP
erC
apit
aF
ire
Per
Cap
ita
Lib
rari
esP
rop
Dem
.4.
941
(1.0
8)**
.919
(.27
8)**
.262
(.17
5).2
10(.
124)
Med
.H
ousi
ng
Val
ue
-.00
6(.
011)
-.00
7(.
002)
**.0
08(.
002)
**.0
3(.
001)
**M
ed.
HH
Hol
dIn
c..0
19(.
005)
**.0
02(.
001)
.003
(.00
1)**
.002
(.00
0)**
%P
over
ty.0
34(.
056)
-.03
9(.
013)
**-.
008
(.00
9)-.
001
(.00
4)%
Unem
plo
yed
-.05
2(.
085)
-.01
1(.
020)
.014
(.01
4)-.
007
(.00
8)%
Bla
ck-.
002
(.00
3).0
03(.
002)
.001
(.00
1).0
00(.
000)
%H
ispan
ic-.
008
(.00
3)*
-.00
1(.
001)
-.00
1(.
001)
.001
(.00
0)*
%U
rban
-.00
6(.
004)
-.00
6(.
002)
**-.
001
(.00
0).(
000)
(.00
0)D
ensi
typ
erSq
Mile
-.03
4(.
005)
**-.
005
(.00
2)**
-.00
1(.
001)
.000
(.00
1)C
omm
ute
Tim
e-.
931
(.21
2)**
-.07
4(.
058)
-.03
0(.
033)
-.03
0(.
012)
*%
Ow
nH
ome
-.01
5(.
004)
**-.
005
(.00
1)**
-.00
2(.
001)
**-.
000
(.00
0)n
=10
81n
=10
81n
=10
81n
=10
81R
2=
.135
R2
=.2
03R
2=
.139
R2
=.1
45**p<
.01
*p<
.05
OL
Sco
effici
ents
wit
hh
eter
oske
das
tici
ty-c
onsi
sten
tst
an
dard
erro
rsin
pare
nth
eses
.M
od
els
incl
ud
est
ate
fixed
effec
ts.
29
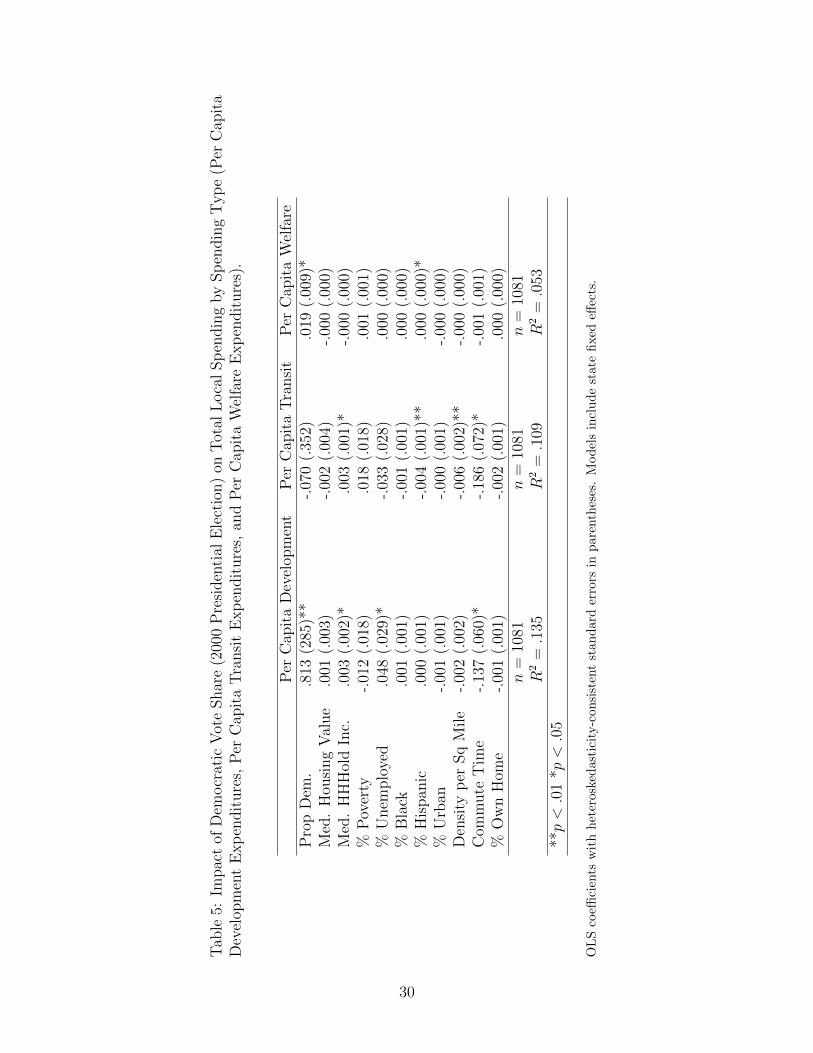
Tab
le5:
Impac
tof
Dem
ocr
atic
Vot
eShar
e(2
000
Pre
siden
tial
Ele
ctio
n)
onT
otal
Loca
lSp
endin
gby
Sp
endin
gT
yp
e(P
erC
apit
aD
evel
opm
ent
Exp
endit
ure
s,P
erC
apit
aT
ransi
tE
xp
endit
ure
s,an
dP
erC
apit
aW
elfa
reE
xp
endit
ure
s).
Per
Cap
ita
Dev
elop
men
tP
erC
apit
aT
ransi
tP
erC
apit
aW
elfa
reP
rop
Dem
..8
13(2
85)*
*-.
070
(.35
2).0
19(.
009)
*M
ed.
Hou
sing
Val
ue
.001
(.00
3)-.
002
(.00
4)-.
000
(.00
0)M
ed.
HH
Hol
dIn
c..0
03(.
002)
*.0
03(.
001)
*-.
000
(.00
0)%
Pov
erty
-.01
2(.
018)
.018
(.01
8).0
01(.
001)
%U
nem
plo
yed
.048
(.02
9)*
-.03
3(.
028)
.000
(.00
0)%
Bla
ck.0
01(.
001)
-.00
1(.
001)
.000
(.00
0)%
His
pan
ic.0
00(.
001)
-.00
4(.
001)
**.0
00(.
000)
*%
Urb
an-.
001
(.00
1)-.
000
(.00
1)-.
000
(.00
0)D
ensi
typ
erSq
Mile
-.00
2(.
002)
-.00
6(.
002)
**-.
000
(.00
0)C
omm
ute
Tim
e-.
137
(.06
0)*
-.18
6(.
072)
*-.
001
(.00
1)%
Ow
nH
ome
-.00
1(.
001)
-.00
2(.
001)
.000
(.00
0)n
=10
81n
=10
81n
=10
81R
2=
.135
R2
=.1
09R
2=
.053
**p<
.01
*p<
.05
OL
Sco
effici
ents
wit
hh
eter
oske
das
tici
ty-c
onsi
sten
tst
an
dard
erro
rsin
pare
nth
eses
.M
od
els
incl
ud
est
ate
fixed
effec
ts.
30
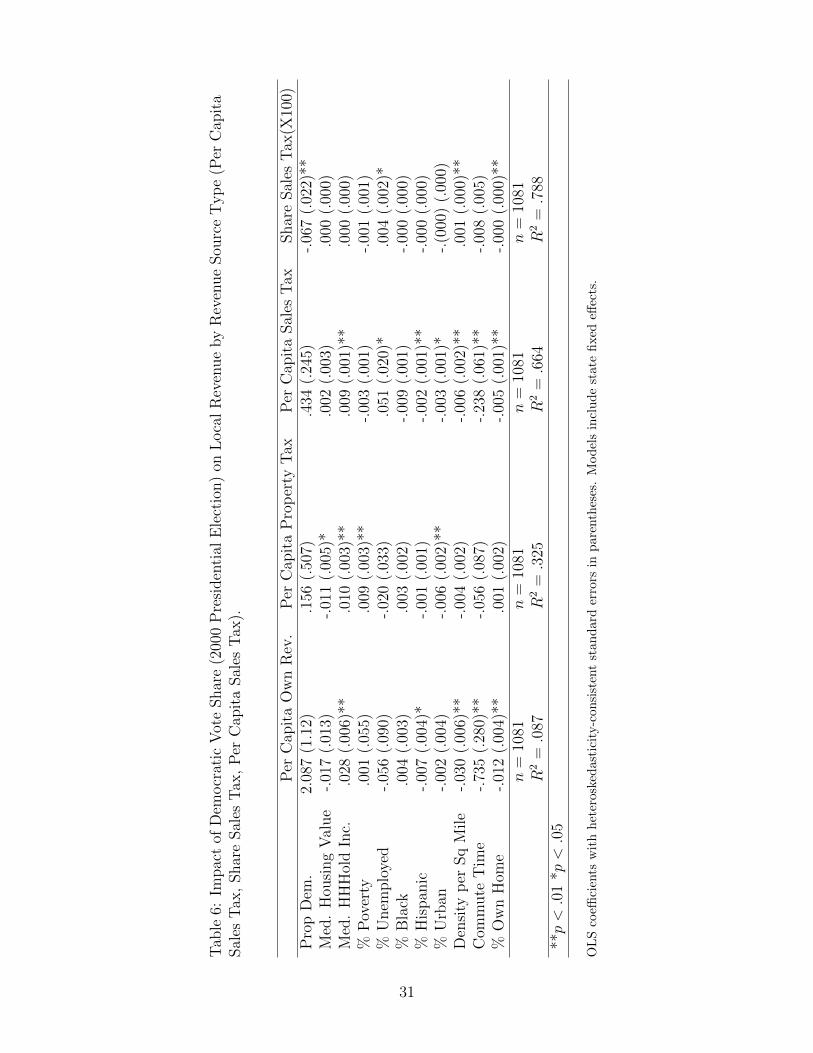
Tab
le6:
Impac
tof
Dem
ocr
atic
Vot
eShar
e(2
000
Pre
siden
tial
Ele
ctio
n)
onL
oca
lR
even
ue
by
Rev
enue
Sou
rce
Typ
e(P
erC
apit
aSal
esT
ax,
Shar
eSal
esT
ax,
Per
Cap
ita
Sal
esT
ax).
Per
Cap
ita
Ow
nR
ev.
Per
Cap
ita
Pro
per
tyT
axP
erC
apit
aSal
esT
axShar
eSal
esT
ax(X
100)
Pro
pD
em.
2.08
7(1
.12)
.156
(.50
7).4
34(.
245)
-.06
7(.
022)
**M
ed.
Hou
sing
Val
ue
-.01
7(.
013)
-.01
1(.
005)
*.0
02(.
003)
.000
(.00
0)M
ed.
HH
Hol
dIn
c..0
28(.
006)
**.0
10(.
003)
**.0
09(.
001)
**.0
00(.
000)
%P
over
ty.0
01(.
055)
.009
(.00
3)**
-.00
3(.
001)
-.00
1(.
001)
%U
nem
plo
yed
-.05
6(.
090)
-.02
0(.
033)
.051
(.02
0)*
.004
(.00
2)*
%B
lack
.004
(.00
3).0
03(.
002)
-.00
9(.
001)
-.00
0(.
000)
%H
ispan
ic-.
007
(.00
4)*
-.00
1(.
001)
-.00
2(.
001)
**-.
000
(.00
0)%
Urb
an-.
002
(.00
4)-.
006
(.00
2)**
-.00
3(.
001)
*-.
(000
)(.
000)
Den
sity
per
Sq
Mile
-.03
0(.
006)
**-.
004
(.00
2)-.
006
(.00
2)**
.001
(.00
0)**
Com
mute
Tim
e-.
735
(.28
0)**
-.05
6(.
087)
-.23
8(.
061)
**-.
008
(.00
5)%
Ow
nH
ome
-.01
2(.
004)
**.0
01(.
002)
-.00
5(.
001)
**-.
000
(.00
0)**
n=
1081
n=
1081
n=
1081
n=
1081
R2
=.0
87R
2=
.325
R2
=.6
64R
2=
.788
**p<
.01
*p<
.05
OL
Sco
effici
ents
wit
hh
eter
oske
das
tici
ty-c
onsi
sten
tst
an
dard
erro
rsin
pare
nth
eses
.M
od
els
incl
ud
est
ate
fixed
effec
ts.
31