Embed Size (px)
Citation preview
Partnering Toward a Healthier Future2013 PROGRESS REPORT
Adventist HealthCare Health Equity Report
Compilation analytics and graphic design
by Center for Health Equity and Wellness
Tiffany Capeles MBA
Nancy Flores
Talya Frelick MPH
Marilyn Lynk PhD
Eme Martin MPH
Nadine Monforte
Marcos Pesquera RPh MPH
Deidre Washington PhD
wwwadventisthealthcarecomdisparities
Table of Contents
Introduction 4
Background 6
About the 2013 Health Equity Report 10
Washington Adventist Hospital 15
Shady Grove Adventist Hospital 28
Adventist Behavioral Health 42
Specialty Care 53
Efforts to Reduce Readmissions 59
Conclusion and Next Steps 64
References 67
Introduction
Introduction | 5
IntroductionIn 2007 Adventist HealthCare created the Center on Health Disparities (CHD) to address and eliminate health disparities and inequalities in the communities served by the health system with particular emphasis on Montgomery Prince Georgersquos and Frederick Counties in Maryland Health disparities are differences ldquoin which disadvantaged social groupsmdashsuch as the poor racialethnic minorities women or other groups who have persistently experienced social disadvantage or discriminationmdashsystematically experience worse health or greater health risks than more advantaged social groupsrdquo1 For more than 20 years the Health and Wellness Department has worked with Adventist HealthCare health programs such as cardiovascular diabetes cancer and maternal and child health to raise awareness of health issues to screen for various conditions and to offer educational and support programs to community members
The new Center for Health Equity and Wellness brings these two departments together to ensure that the communities served by Adventist HealthCare thrive in a culture of wellness and enjoy access to and the benefits of high-quality equitable health care
OUR MISSION
The Center for Health Equity and Wellness ensures the delivery of population-based care and promotion of healthcare equity in the communities served by Adventist HealthCare We accomplish our mission by partnering with community members and organizations to implement health equity and community wellness approaches that improve population health The work being performed at the Center contributes to the overall mission of Adventist HealthCare which is to demonstrate Godrsquos care by improving the health of people and communities through a ministry of physical mental and spiritual healing The Center works with different Adventist HealthCare entities to understand the diverse patient populations they serve monitor differences by race ethnicity or preferred language in quality of care and address disparities in order to provide high-quality and equitable care for all patients
For the second consecutive year Adventist HealthCare is publishing a Health Equity Report to demonstrate how hospital patient data including data related to core quality measures readmissions and patient experience can be analyzed through a health equity framework to identify and address possible disparities in health care In 2012 we explored the data collected at Adventist HealthCare hospitals and how they could be used to inform strategies to address community needs This report will take an additional step forward to highlight the strategies and initiatives that are planned or already in place to move toward a healthier future for all The continuing evolution and dissemination of this report demonstrates Adventist HealthCarersquos commitment to transparency and accountability for performance excellence
Background
Background | 7
BackgroundMANAGING POPULATION HEALTH
In the 2012 Health Equity Report we discussed compelling reasons why hospitals should focus on reducing health disparities and improving quality of care for all populations Changes in demographic patterns and healthcare policies in our nation and reporting requirements for performance measures and patient experience by race and ethnicity are just a few Federal and state laws (eg health reform provisions to improve access quality of care and prevention strategies) compel hospitals to not just provide care to sick individuals but invest in keeping whole populations healthy Population health is a way of describing the health status and outcomes of people living within a community it requires understanding why some populations are healthier than others The ultimate purpose of population health is to improve the health of individuals and populations by investing in the determinants of healthmdashsocial economic and environmental factors that influence a populationrsquos well-beingmdashthrough policies and interventions that affect these determinants2 Population health outcomes are the product of multiple determinants of health including medical care public health services genetics behaviors cultural background health beliefs or practices and policies as well as social and environmental factors3 However health status is affected by a broad array of determinants not only in health care or public health4
Population health focuses greater attention on the influence of health disparitiesmdashdifferences in health outcomes that are often linked to social cultural and economic disadvantages For instance infant mortality rates are almost three times higher for Blacks compared to Whites across all income and insurance groups Hispanics are four times less likely to have health insurance compared with other racial and ethnic groups and the rate of new HIV cases for Blacks is more than 10 times the rate of that for Whites5 These differences are often considered not only avoidable but unfair and unjust6 Racial and ethnic minorities among other disadvantaged groups tend to receive a lower quality of care than non-Hispanic Whites regardless of healthcare-related factors such as insurance or other socioeconomic factors7 For this reason health disparities are also known as ldquohealth inequalitiesrdquo or ldquohealth inequitiesrdquo terms that may better capture the unfairness of the differences many are working to eliminate
Though there has been significant progress in improving the health of populations in Maryland and nationwide (eg mortality rates for a number of diseases and conditions have declined) racial and ethnic minorities and low-income populations remain disproportionately affected by poor health outcomes compared to non-minority and high-income populations8 Disparities are pervasive and must be addressed however healthcare providers and systems often see themselves as responsible for just some of community health and health care For example the Model of Health Improvement posits that hospitals and healthcare systems have significant control over 20 percent of input related to clinical care and shared control over 30 percent related to health behaviors but limited control and capabilities to address socioeconomic factors and the physical environment9
IMPACT OF HEALTHCARE REFORM ON POPULATION HEALTH
The Patient Protection and Affordable Care Act (ACA) of 2012mdashalso known as the healthcare reform billmdashexpands coverage to millions of individuals and families in need of health care Healthcare reform impacts population health in four ways (1) expanding insurance coverage to improve access to the healthcare delivery system (2) improving the quality of care delivered (3) enhancing prevention and health promotion measures within the healthcare delivery system and (4) promoting community- and population-based activities and providing incentives for workplace wellness programs10
Focusing on access equity quality and prevention the ACA provides resources to help promote prevention and wellness strategies that improve the health of people and communities and keep them healthy Also the ACA seeks to address disparities and promote health and healthcare equity among populations at risk11 For several years healthcare reform has been on the forefront of peoplersquos minds when it comes
8 | Background
to equity social justice and access to health care A large number of Americans who previously had no health insurance for instance will now have access to care However access to health care does not necessarily mean that the care delivered will be patient-centered high-quality or equitable Improving health for all depends on equality in access to care and care utilization that leads to high-quality health care and addresses disparities among different populations so that all populations have an opportunity to reach their full potential for good health121314
THE ROLE OF HEALTHCARE SYSTEMS
The focus on population health represents a shift in the field of public health understanding and managing it will become more and more integrated into the role of healthcare providers Hospitals not only have to rely on demographic and clinical data to identify populations in greatest need but also analyze those needs prepare comprehensive reports and leverage existing resources in attempts to reach and support community members15 Limited resources should be used to focus on the most pressing needs with the biggest possible impact Furthermore because hospitals and healthcare systems have limited control and capabilities to address socioeconomic factors and physical environments collaboration with community stakeholders is essential The American Hospital Association encourages hospitals to adopt population health management strategies because with healthcare reform it is imperative that stakeholders and community members work in partnership Healthcare reform is driving healthcare systems and hospitals toward a new role of shared accountability in population health management to explore new methods of care delivery16
PROVIDING POPULATION-BASED CARE
Managing population health means having an effective collaborative strategy for improving the health of all communities and reducing inequalities in health outcomes between different populations However promoting the good health of the community has to become more than just a mission statement After analyzing the distribution of health outcomes in different populations providers must find ways to improve the populationrsquos health that are tailored to meet community needs while leveraging their assets Hospitals and healthcare systems can ensure that they are promoting efficient care by (1) increasing the prevalence of evidence-based prevention health services (2) improving quality of patient care and (3) enhancing care coordination17
Currently chronic conditions account for more than 75 percent of US healthcare costs18 One goal of population-based care has been described as moving from treating chronically-ill individuals to having a chronically-well population19 Adventist HealthCare (AHC) is dedicated to achieving performance excellence expanding access to care and providing population-based care all integral parts of the organizationrsquos 2010ndash14 strategic plan AHC hospitals and their boards have focused their strategic priorities to make population health a central theme reallocate resources and commit to changes
A population-based health approach recognizes that achieving positive health outcomes for everyone in our communities is a shared responsibility Such collaborative efforts require partners to share responsibility and accountability for collecting data systematically or merging existing data identifying factors that influence population health measuring outcomes and addressing determinants of health through policies and interventions Partners include healthcare delivery systems public health agencies national and local entities primary care entities and community-level organizations as well as stakeholders in other non-health sectors such as schools and businesses
ldquoEquity in access to health care implies that everyone has the opportunity to reach their full health potential in short the playing field is leveled for all individualsrdquo20
Community Health Needs Assessment
To improve population health the Affordable Care Act (ACA) calls for nonprofit hospitals to assess the health needs of community members implement strategies that meet those needs and demonstrate community benefit Under the requirements of the ACA all 501(c)(3) hospitals must conduct a Community Health Needs Assessment (CHNA) to identify health or health-related problems and unmet needs as well as existing resources among populations in their service area A CHNA must be conducted every three years and the hospital must adopt an implementation strategy to prioritize and address the needs identified in the CHNA to improve the health status of people and communities in their service area When an organization owns more than one hospital facility a separate CHNA must be conducted for each facility These requirements which first began on March 23 2012 now take effect every taxable year
In 2013 Adventist HealthCarersquos Community Benefit Council collaborated with its Advisory Board community leaders community-based organizations public health stakeholders and the community to conduct a needs assessment for five of its entitiesmdashShady Grove Adventist Hospital Washington Adventist Hospital Adventist Rehabilitation Hospital of Maryland Adventist Behavioral Health - Rockville and Adventist Behavioral Health-Eastern Shore to determine the health needs of community members and develop implementation strategies to improve population health Below is a summary of information gathered to develop the CHNA and the implementation plans for Shady Grove Adventist Hospital and Washington Adventist Hospital Complete Community Health Needs Assessment reports for all entities will be available on the Adventist HealthCare website by the end of 2013 The implementation strategies for Shady Grove and Washington Adventist hospitals have been posted on the Adventist HealthCare website implementation strategies for the three specialty care hospitals will be available by the end of the second quarter of 2014
Shady Grove Adventist Hospital (SGAH) serves residents of Montgomery County Maryland primarily (882 of discharges) Within the hospitalrsquos Community Benefit Service Area (CBSA) approximately 416 percent are minorities The Shady Grove Adventist Hospital Board of Trustees and the Adventist HealthCare Board of Trustees each reviewed and approved two priority areas for SGAHrsquos implementation strategy in response to the CHNA findings lung cancer in the Asian population and diabetes among Montgomery Cares (uninsured) patients Compared to hospitals nationally SGAH has a higher incidence of lung cancer patients in the Asian population (99 compared to 18 nationally) One goal for the implementation strategy is to improve early screening and detection of lung cancer in the Asian population served by SGAH to improve their five-year survival rate Findings from the SGAH needs assessment also show that diabetes is the eighth leading cause of death in Montgomery County and it disproportionately affects minority populations and the elderly The second priority for implementation is to improve the percent of patients who receive the recommended number of hemoglobin A1C screenings each year among known diabetic patients in the Montgomery Cares Program (uninsured) within SGAHrsquos service area
Washington Adventist Hospital (WAH) serves residents of Prince Georgersquos County (445 of discharges) and Montgomery County (403 of discharges) Maryland primarily Washington Adventist Hospitalrsquos CBSA serves a highly diverse patient population approximately 665 percent of their patients are non-White minorities Based on the results of its CHNA WAHrsquos Presidentrsquos Council decided to focus its implementation strategy on behavioral health and influenza prevention Statistics from WAHrsquos needs assessment show that the rate of hospital discharges for bipolar disorder increased for Montgomery County adults and there was a two-fold increase in readmissions in the past decade Among several interventions to address these needs WAH plans to establish a transitional care plan for discharged patients with bipolar disorder and refer patients admitted for substance abuse or alcohol abuse to appropriate resources for intervention and follow-up Additionally results revealed high emergency department visit rates due to immunization-preventable influenza and pneumonia To address this need WAH will provide a combination of free and low-cost influenza vaccinations to residents in target areas
About the 2013 Health Equity Report
About the 2013 Health Equity Report | 11
About the 2013 Health Equity ReportAdventist HealthCare Inc(AHC) is an integrated healthcare delivery network that includes five nationally accredited acute-care and specialty hospitals mental health services and home health agencies serving the Maryland and the greater Washington DC metropolitan area and northwestern New Jersey The 2013 Health Equity report includes patient data from both of AHCrsquos two Maryland-based acute-care hospitals Washington Adventist Hospital (WAH) and Shady Grove Adventist Hospital (SGAH) For the first time this yearrsquos report also features data from AHCrsquos specialty care entities Adventist Behavioral Health (ABH) Adventist Home Care Services (AHCS) and Adventist Rehabilitation Hospital of Maryland (ARHM) The organization of the report is described below
SNAPSHOT OF DIVERSITY
For each AHC entity we begin with a Snapshot of Diversity which describes the entityrsquos patient population in 2012 stratified by patientsrsquo self-reported raceethnicity As defined by the United States Office of Management and Budget (OMB) ethnicity and race are two separate constructs Ethnicity is defined as either Hispanic or Latino (or of Spanish origin) or not Hispanic or Latino OMB defines race using five categories American Indian or Alaska Native Asian Black or African American Native Hawaiian or Other Pacific Islander and White Hispanics can be of any race Both ethnicity and race should be self-reported by the patient For the purposes of this report we use the term Hispanic for any patient who has identified as such regardless of their identified race We use the race categories Asian Black and White for any patient who has identified as such and has not identified as Hispanic The category Other designates a patient who has self-identified as American Indian or Alaska Native Native Hawaiian or Other Pacific Islander any other race or who does not identify with any of the five OMB categories
With the exception of AHCS for which we used data from a report to the Maryland Health Care Commission data for the Snapshot of Diversity sections were obtained from patient electronic medical records For all entities some patient race andor ethnicity data was unknown andor missing
Note In previous reports the Snapshot of Diversity and Where We See Our Patients sections included all patient encounters that is the same patient was counted more than once if heshe was seen in the same setting (inpatient outpatient or emergency department) more than once This year the Snapshot of Diversity includes data that distinguishes unique patients from all patient encounters (ie total volume) When reporting unique patients if a patient was seen in the same setting multiple times only their first encounter is included However if a patient was seen in two different settings on separate occasions both encounters are included (eg once as an inpatient and once as an outpatient) In subsequent sections the analyses reflect all patient encounters unless otherwise specified
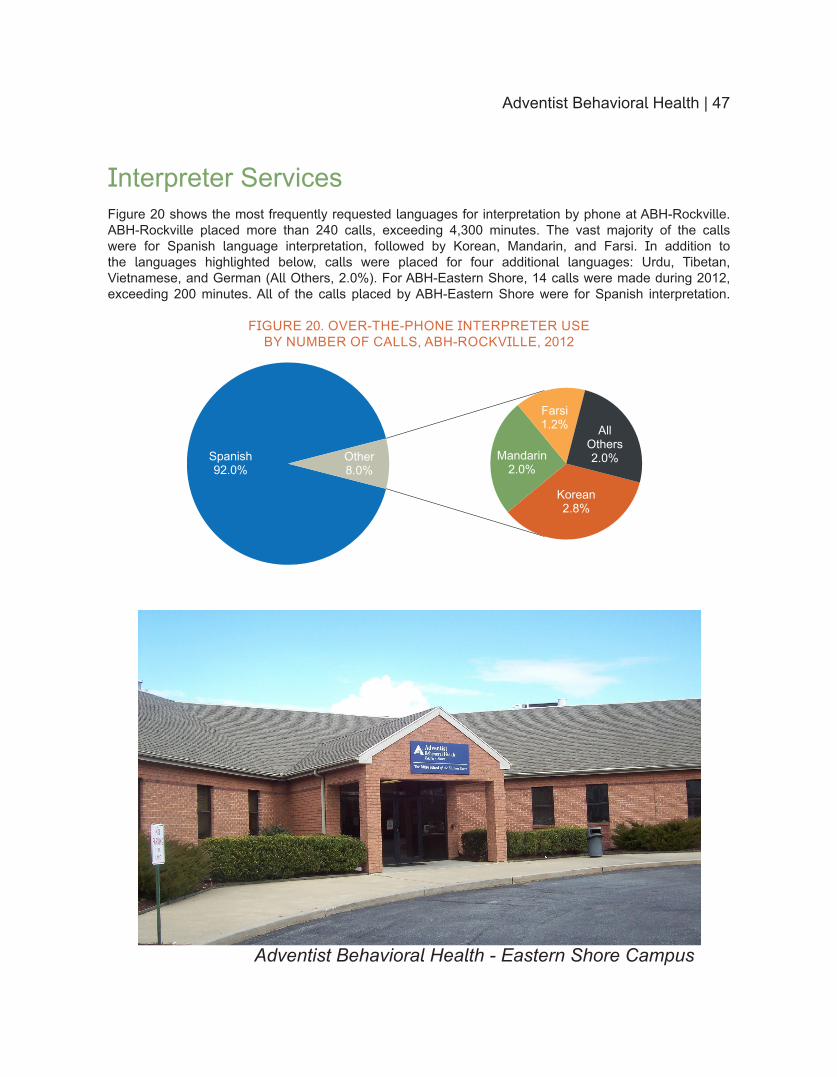
LANGUAGE PREFERENCE AND INTERPRETER SERVICES
In addition to race and ethnicity language preference is another important demographic characteristic to consider when describing the diversity of the hospital patient population AHC is committed to providing high quality care to all patients in the language in which they prefer to communicate including sign language in addition to spoken language Effective patient-provider communication is essential to providing patient-centered care and is necessary for patient safety AHC continues to provide various language service options for the limited English proficient (LEP) population that we serve These options include on-site full-time Spanish interpreters Qualified Bilingual Staff on-call contracted interpreters video remote interpreting for the Deaf and hard-of-hearing and a telephone interpretation service that provides foreign language interpretation in more than 180 different languages seven days a week 24 hours a day In Language Preference and Interpreter Services for the two acute-care hospitals we describe the patient population by preferred language For all entities we describe the usage of over-the-phone interpretation for the past year
12 | About the 2013 Health Equity Report
Within Language Preference and Interpreter Services data related to the patientrsquos preferred language were obtained from patient electronic medical records For some patients data on preferred language was unknown andor missing this is reflected in the tables and figures There are numerous encounters that are not reported here (ie with full-time interpreters and Qualified Bilingual Staff) however we are working to document the use of these services at our hospitals and other entities All data pertaining to the use of over-the-phone interpretation were obtained from the vendor that provides this service to all of AHC
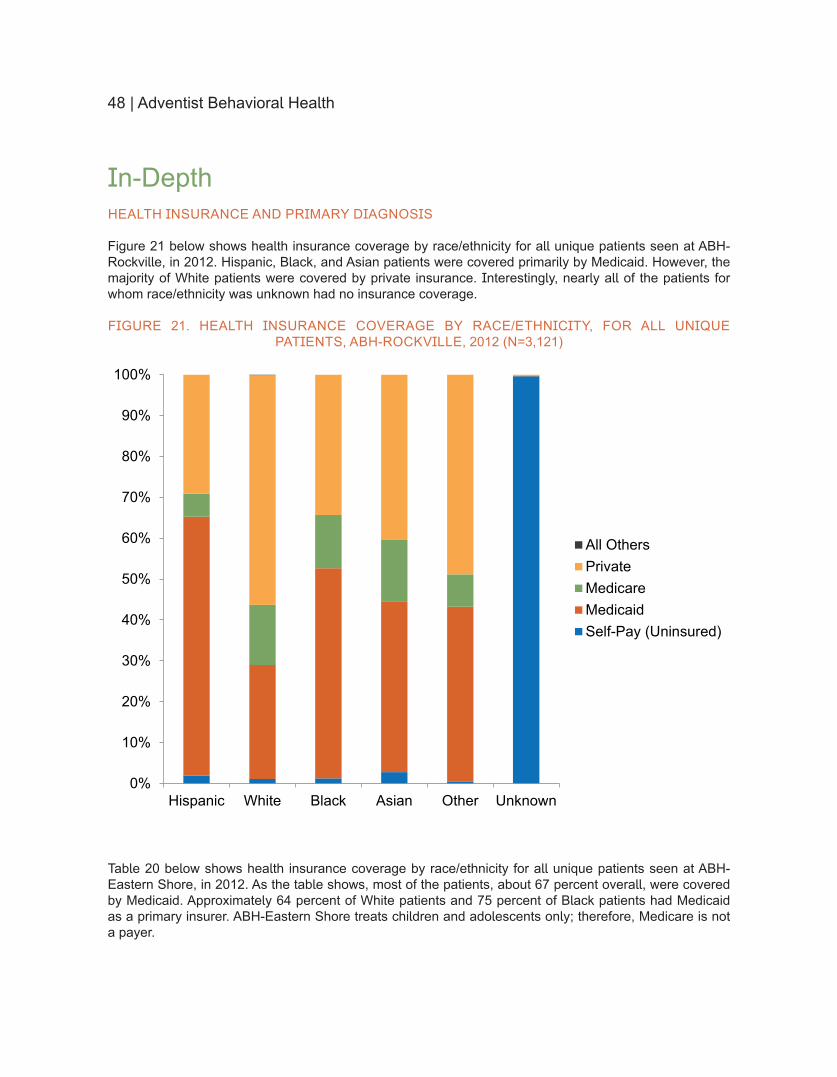
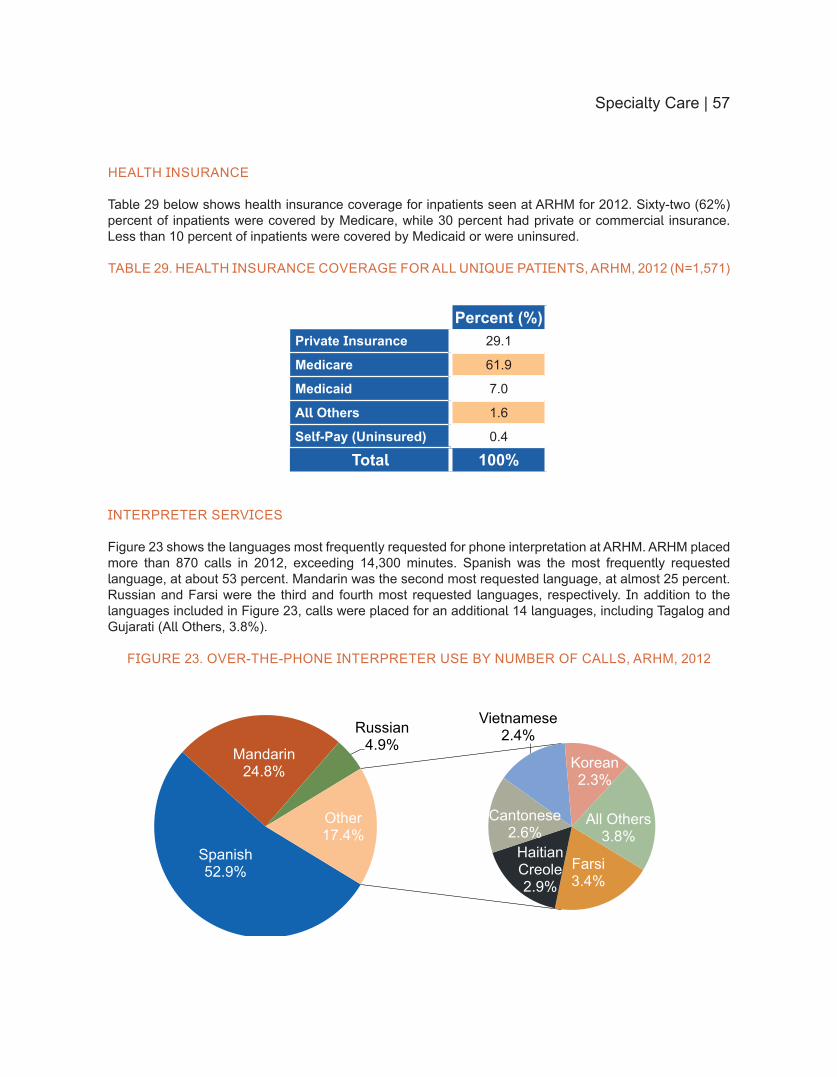
IN-DEPTH HOSPITAL SETTING HEALTH INSURANCE AND PRIMARY DIAGNOSES
For WAH and SGAH the In-Depth sections provide a detailed look at the hospital settings in which patients were seen (inpatient outpatient and emergency department) primary diagnoses and primary health insurance coverage stratified by raceethnicity For ABH the In-Depth section includes data on health insurance as well as primary patient diagnoses Specialty Care sections (AHCS and ARHM) include health insurance data and primary diagnoses (AHCS only) For all entities data on the setting diagnoses and insurance were obtained from patient electronic medical records
Any of the hospital settings described above may be an appropriate place to seek care we make no assumptions or conclusions regarding the appropriateness of any encounter based on this data However higher rates of emergency department utilization may be associated with lack of a primary care physician or medical home or being uninsured or underinsured21 By examining these characteristics over time patterns may emerge that illuminate racialethnic differences in both healthcare-seeking behaviors and access
Note For ease of reporting a basic five level categorization scheme was developed to identify the patientrsquos primary health insurance coverage The categories include Self-Pay (uninsured or underinsured) Medicaid Private Insurance Medicare and All Others This scheme differs from the data requirements used for state reporting to the Maryland Health Services Cost Review Commission (HSCRC) Private insurance for example includes managed care organizations health maintenance organizations (HMOs) and commercial payers which differs from the HSCRC data reporting requirements Therefore the data reported here will not align with the data reported to HSCRC
INPATIENT QUALITY MEASURES
For WAH and SGAH in the Inpatient Quality section we describe the overall scores for inpatient quality core measures pneumonia heart failure acute myocardial infarction and surgical care A total of 50 measures were collected at both SGAH and WAH ranging in scores from 9143 percent to 100 percent The data shown represents the overall summation of all patients and measures within each of the core areas at the hospital For example the pneumonia care data represents the summation of six individual measures related to the quality of care for patients with pneumonia The data is presented this way because of the overall high scores achieved within and across each of the measurement groups This also did not allow for statistical calculations of differences between racial and ethnic groups The inpatient quality measures were abstracted from the Quantros platform used by AHC for core measure reporting
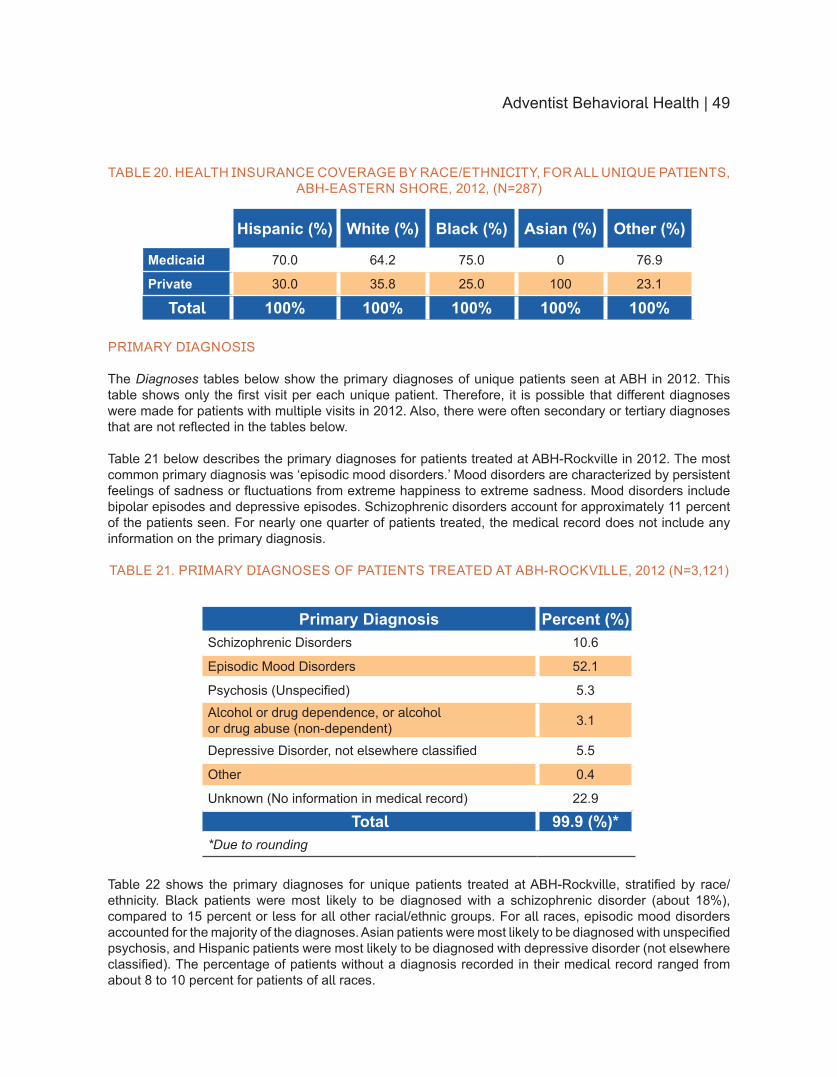
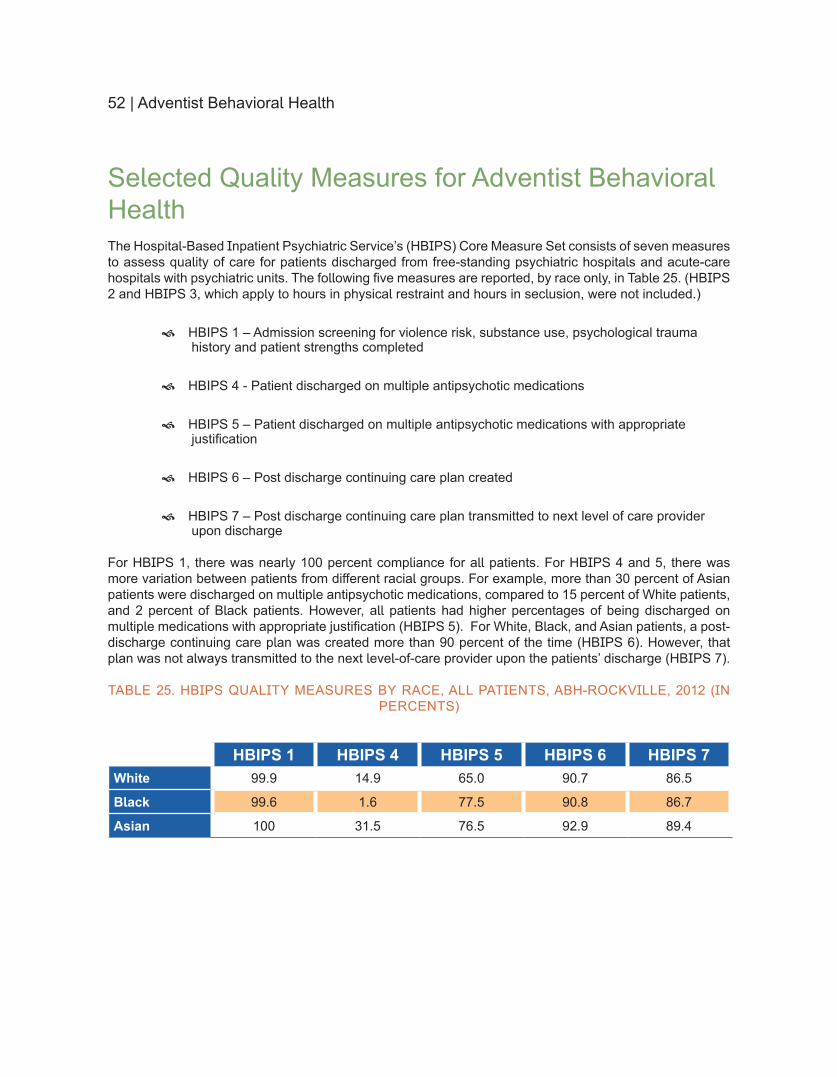
For ABH the quality measures are from the Hospital-Based Inpatient Psychiatric Servicersquos (HBIPS) Core Measure Set which consists of seven measures to assess quality of care for patients discharged from free-standing psychiatric hospitals and acute-care hospitals with psychiatric units Information on five of the seven measures are presented and stratified by race
Looking ahead to 2014 the Maryland Health Care Commission (MHCC) will be adopting an expanded hospital quality data collection policy This change will serve to ldquoexpand Marylandrsquos system for monitoring and public reporting on hospital performance and qualityrdquo and increase alignment with the Centers for Medicare and Medicaidrsquos (CMS) hospital quality program22 With this expansion there appears a trend that seems to be shifting focus from inpatient to outpatient measures
About the 2013 Health Equity Report | 13
In recent years a significant amount of change has occurred around inpatient measures Among the core measurement groups described in this section many of the measures have been retired leaving only two each for acute myocardial infarction and pneumonia one for heart failure and seven for surgery to be reported in 2014 While these measures have phased out others have been added In 2013 measures consistent with the CMS Value-Based Purchasing and Meaningful Use Programs were adopted
Outpatient measures to be collected in 2014 fit into three categories claims based imaging efficiency (7) chart abstracted (13) and structural (4) In the chart abstracted category measures focus on acute myocardial infarction and chest pain emergency department throughput stroke and surgical care The structural measures will require hospitals to report whether certain activities are performed such as tracking clinical results between visits and utilizing a safe surgery checklist
HOSPITAL READMISSIONS
One of the provisions in the Affordable Care Act addresses the high rate of readmissions Hospital reimbursements can now be adjusted based on higher than expected readmission rates23 Hospital readmission rates can vary depending on several different factors including income race health condition hospital patient case mix and insurance coverage In some instances a hospital readmission may be appropriate andor unavoidable However lack of post-discharge care coordination disease management severity of illness medical errors or adverse events poor patient adherence to the treatment plan or ineffective communication may result in a readmission that is potentially preventable
Both acute-care hospitals participate in the HSCRC Admission-Readmission Revenue (ARR) program a voluntary revenue constraint program that provides hospitals with a financial incentive to coordinate care and reduce unnecessary readmissions As reported in the HSCRC post-meeting minutes dated April 10 2013 from FY2011 to FY2012 Maryland hospitals reduced readmissions by 67 percent and admissions by 35 percent24 Based on this HSCRC is recommending that all Maryland hospitals not participating in the voluntary program be required to implement the ARRCharge Per Episode (CPE) policy With the understanding that many factors may influence the likelihood of readmission hospitals can collaborate with various community partners and develop innovative programs to reduce potentially preventable hospital readmissions
The Readmissions section presents 30-day all cause readmissions data stratified by raceethnicity The readmission logic used for this analysis followed the HSCRC ARR methodology Under this methodology a readmission takes place when an admission occurs within 30 days of the previous discharge to the same facility The number of discharges included in this analysis excludes zero and one-day stays per HSCRC guidelines and it also excludes readmissions Our data model does not include case mix adjusted data
PATIENT EXPERIENCE RESPONSES TO THE HCAHPS SURVEY
Research shows that a number of factors such as age health literacy or education level health status and raceethnicity or cultural beliefs can affect ratings of care25 Although Latino and African Americans typically provide higher overall ratings of care more information is needed to determine whether differences in ratings stem from actual differences in quality of care or from differences in patient perceptions expectations or response styles26 To further explore this area in this yearrsquos Health Equity report we present responses to selected Hospital Consumer Assessment of Healthcare Providers and Systems (HCAHPS) questions stratified by education level A survey of over one million patients discharged between 2006ndash2007 showed that while health status race and language variables are strong predictors of HCAHPS performance patient education and age contribute moderately to overall patient satisfaction27
In the Patient Experience section we present responses to items about patientsrsquo experiences and satisfaction with care from the HCAHPS stratified by (1) raceethnicity and (2) education level (highest grade or level of school completed) HCAHPS survey data were obtained directly from the HealthStream
14 | About the 2013 Health Equity Report
(HSTM) Insights Online database HealthStream is the vendor that administers this survey This survey is only applicable to inpatients it was administered to a sample of discharged patients and participation was voluntary The percentages in the tables represent the top box score which is the percent of patients who responded positively to composite and individual survey items (ie ldquoAlwaysrdquo ldquoDefinitelyrdquo or ldquoYesrdquo responses) or rated items on a scale from 1 to 10 positively (ie if 10 is the highest rating on a scale of 1 to 10 the percentage of patients who responded either 9 or 10) In the tables the column labeled HSTM contains the top box scores that represent the 50th percentile of national hospitals in the HealthStream database
ADVENTIST BEHAVIORAL HEALTH
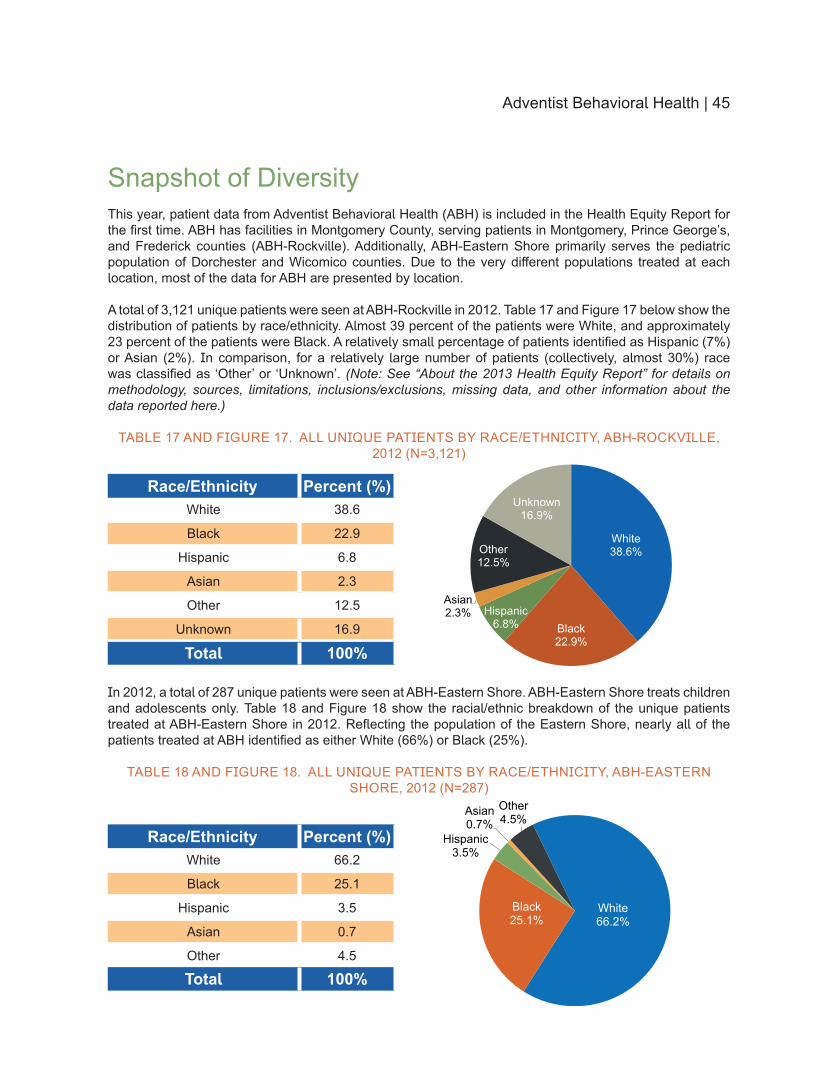
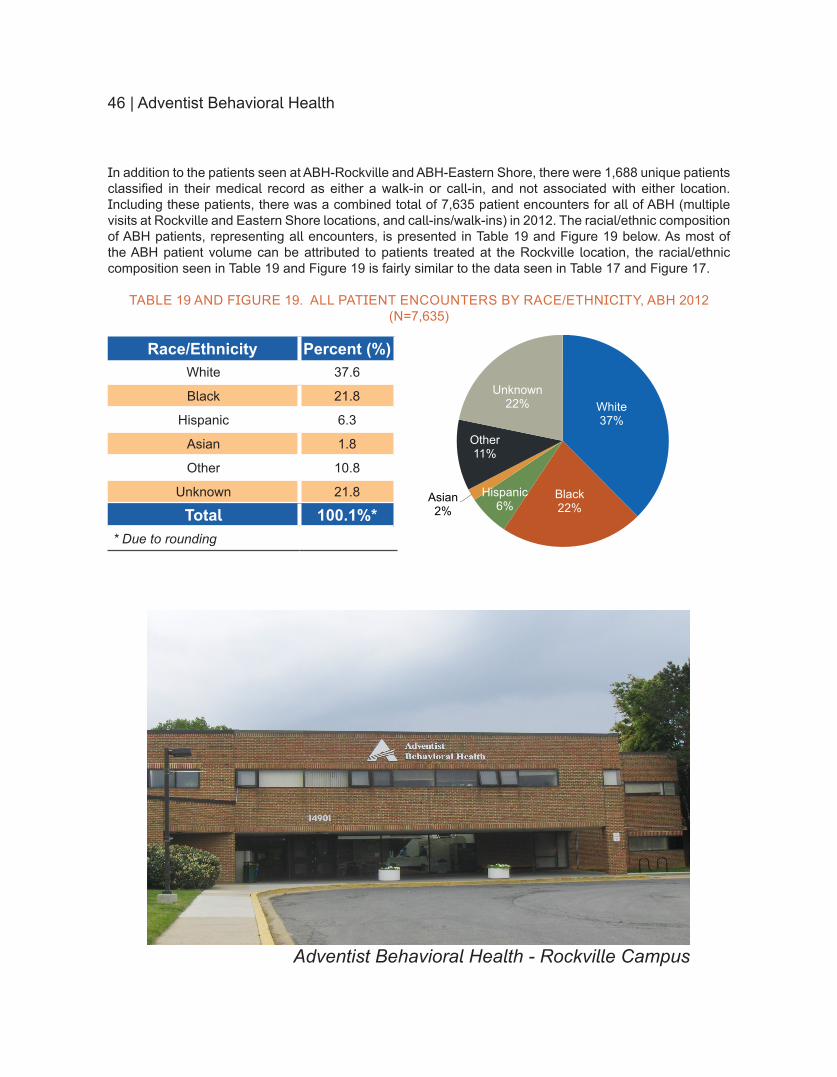
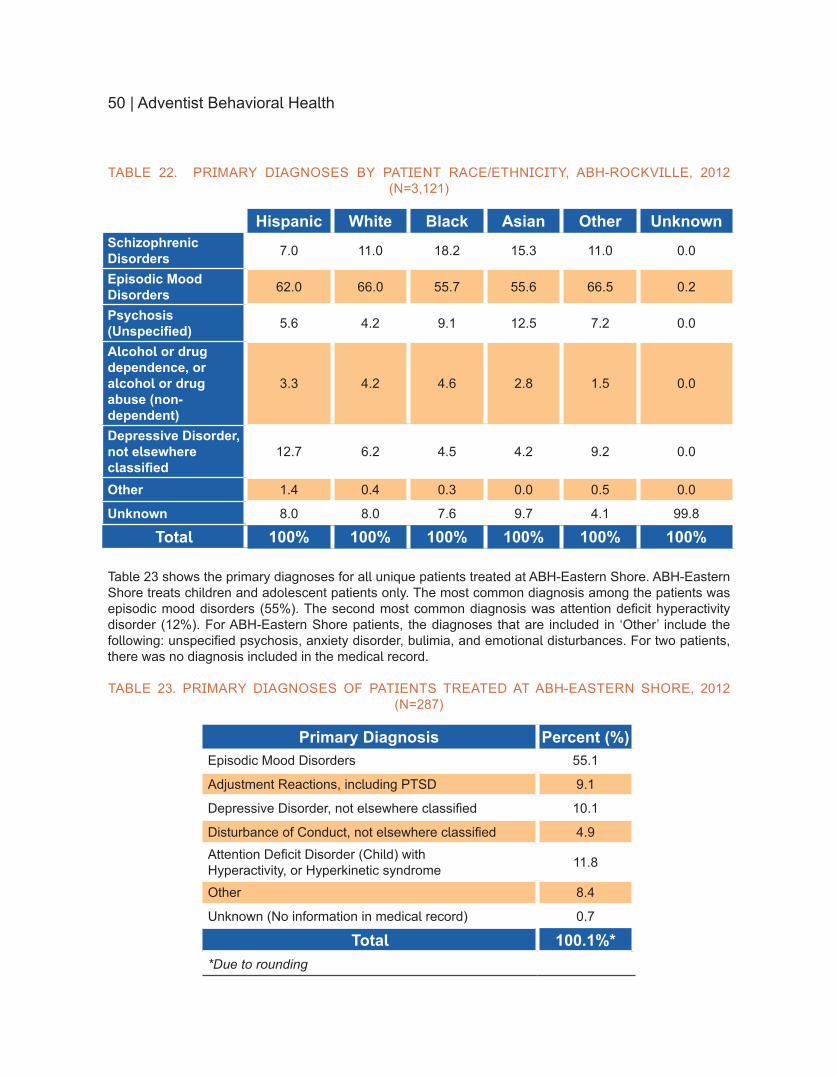
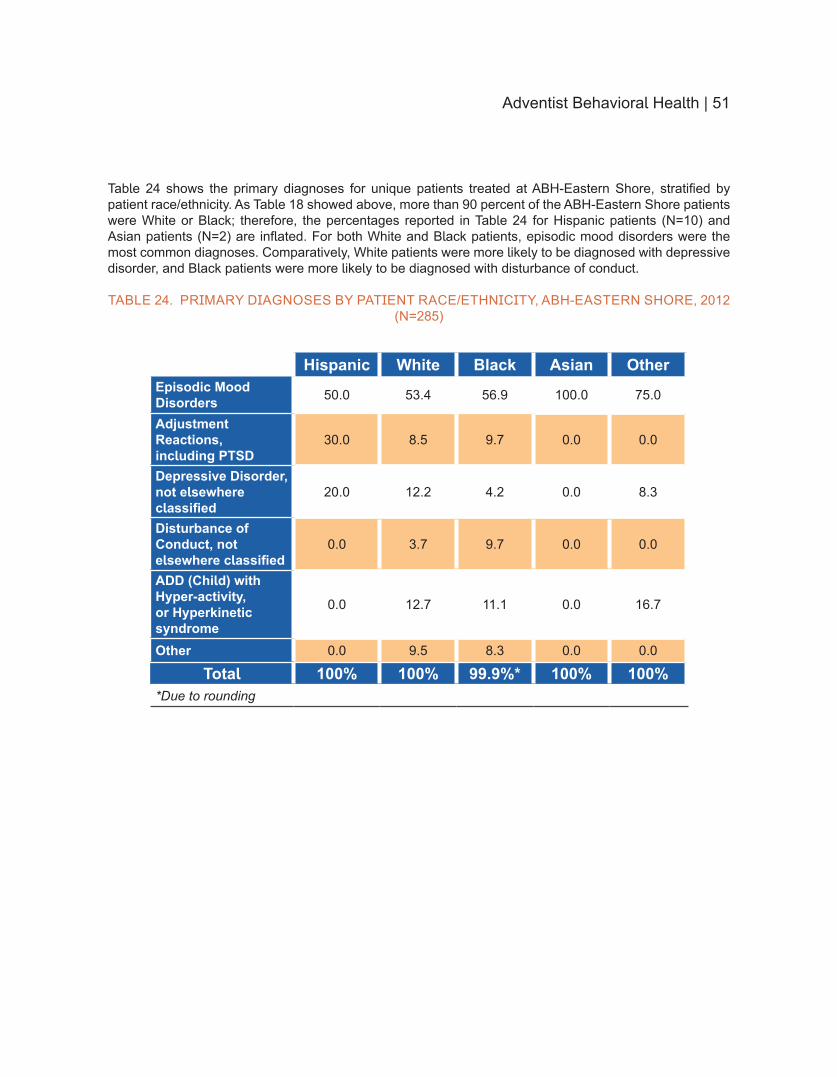
In alignment with the theme of the 2013 Center on Health Disparities Annual Fall Conference ldquoPartnering Toward a Healthier Future Addressing Disparities in Behavioral Healthrdquo we devote one section to the issue of mental and behavioral health in the United States highlighting the patients and work of Adventist Behavioral Health (ABH) which has facilities in both Montgomery County and Dorchester County in Maryland The facility in Montgomery County primarily serves patients of all ages from Montgomery Prince Georgersquos and Frederick counties The facility in Dorchester County primarily serves the pediatric population of Dorchester and Wicomico counties Prior to presenting patient data the ABH section begins with background information on mental and behavioral health on national state and local levels Due to the very different populations treated at each location most of the data for ABH are presented by location
ADDITIONAL HIGHLIGHTS
Special highlights in the report include information about federal standards to increase culturally competent care and reduce health disparities the implementation of the Affordable Care Act (ACA) in the state of Maryland efforts to reduce readmissions and improve patient-centered care across the Adventist HealthCare system and AHC hospitalsrsquo community health needs assessment results The report concludes with Next Steps for all hospitals striving to implement a data-driven health equity agenda to achieve patient care that is high-quality and accessible across the state of Maryland
The primary goal of this report is to share demographic clinical and quality information about AHC hospitals and other entities and highlight efforts to improve patient experiences and outcomes in the communities we serve A majority of the information is descriptive and analyses are exploratory detailed discussion and interpretation of findings is beyond the scope of this report Nevertheless we hope the information will be used by our hospital leadership to inform overall strategies and interventions that will have a positive impact on the health of populations
Washington Adventist Hospital
16 | Washington Adventist Hospital
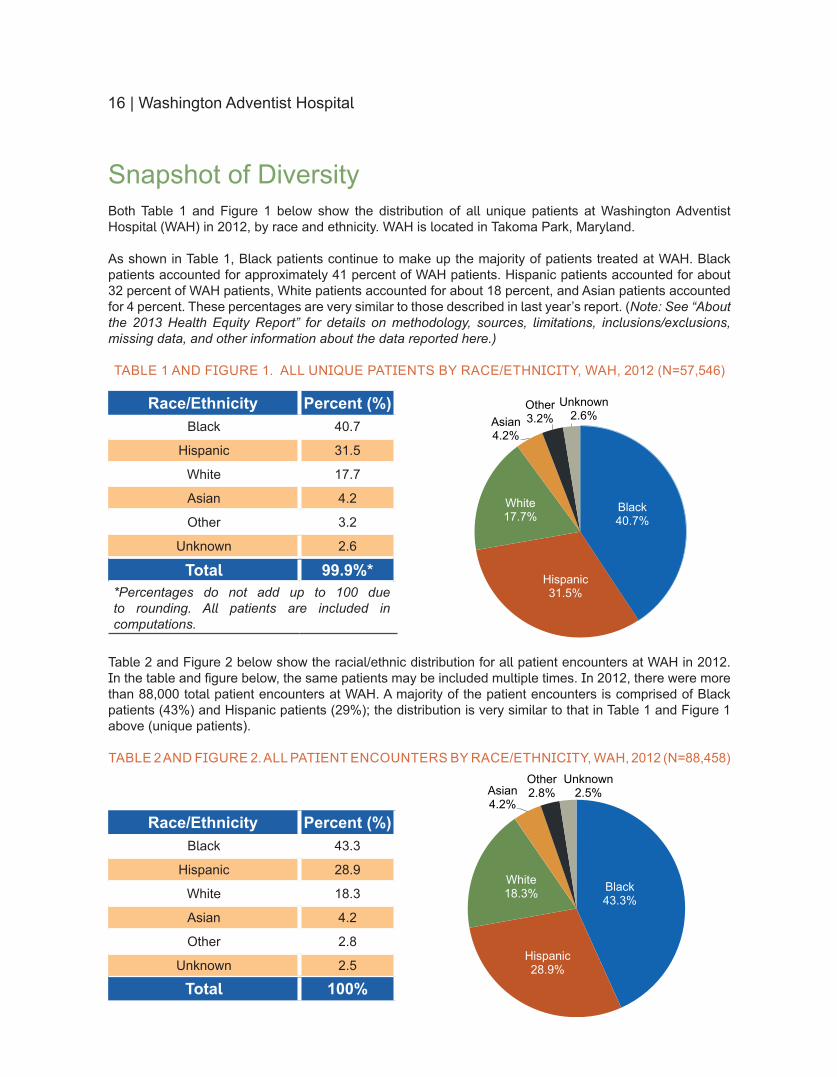
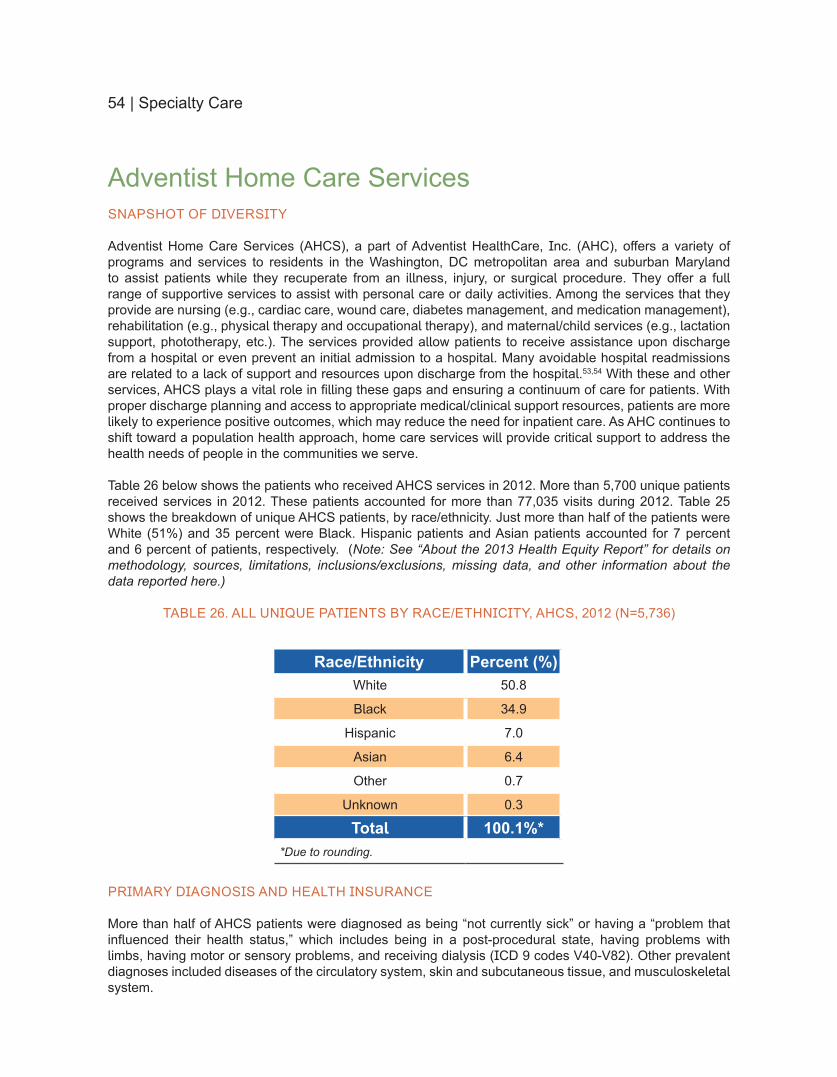
Snapshot of DiversityBoth Table 1 and Figure 1 below show the distribution of all unique patients at Washington Adventist Hospital (WAH) in 2012 by race and ethnicity WAH is located in Takoma Park Maryland
As shown in Table 1 Black patients continue to make up the majority of patients treated at WAH Black patients accounted for approximately 41 percent of WAH patients Hispanic patients accounted for about 32 percent of WAH patients White patients accounted for about 18 percent and Asian patients accounted for 4 percent These percentages are very similar to those described in last yearrsquos report (Note See ldquoAbout the 2013 Health Equity Reportrdquo for details on methodology sources limitations inclusionsexclusions missing data and other information about the data reported here)
TABLE 1 AND FIGURE 1 ALL UNIQUE PATIENTS BY RACEETHNICITY WAH 2012 (N=57546)
RaceEthnicity Percent ()Black 407
Hispanic 315
White 177
Asian 42
Other 32
Unknown 26
Total 999Percentages do not add up to 100 due to rounding All patients are included in computations
Table 2 and Figure 2 below show the racialethnic distribution for all patient encounters at WAH in 2012 In the table and figure below the same patients may be included multiple times In 2012 there were more than 88000 total patient encounters at WAH A majority of the patient encounters is comprised of Black patients (43) and Hispanic patients (29) the distribution is very similar to that in Table 1 and Figure 1 above (unique patients)
TABLE 2 AND FIGURE 2 ALL PATIENT ENCOUNTERS BY RACEETHNICITY WAH 2012 (N=88458)
RaceEthnicity Percent ()Black 433
Hispanic 289
White 183
Asian 42
Other 28
Unknown 25
Total 100
Black 407
Hispanic 315
White 177
Asian 42
Other 32
Unknown 26
Black 433
Hispanic 289
White 183
Asian 42
Other 28
Unknown 25
Washington Adventist Hospital | 17
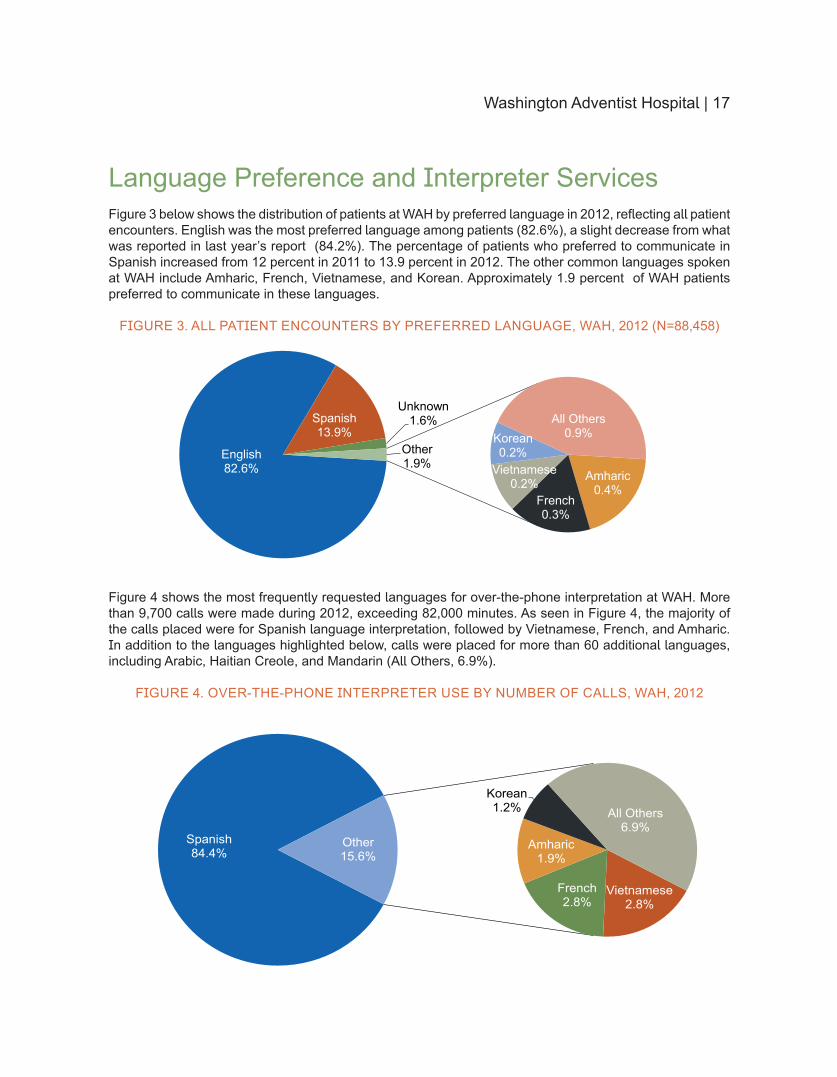
Language Preference and Interpreter ServicesFigure 3 below shows the distribution of patients at WAH by preferred language in 2012 reflecting all patient encounters English was the most preferred language among patients (826) a slight decrease from what was reported in last yearrsquos report (842) The percentage of patients who preferred to communicate in Spanish increased from 12 percent in 2011 to 139 percent in 2012 The other common languages spoken at WAH include Amharic French Vietnamese and Korean Approximately 19 percent of WAH patients preferred to communicate in these languages
FIGURE 3 ALL PATIENT ENCOUNTERS BY PREFERRED LANGUAGE WAH 2012 (N=88458)
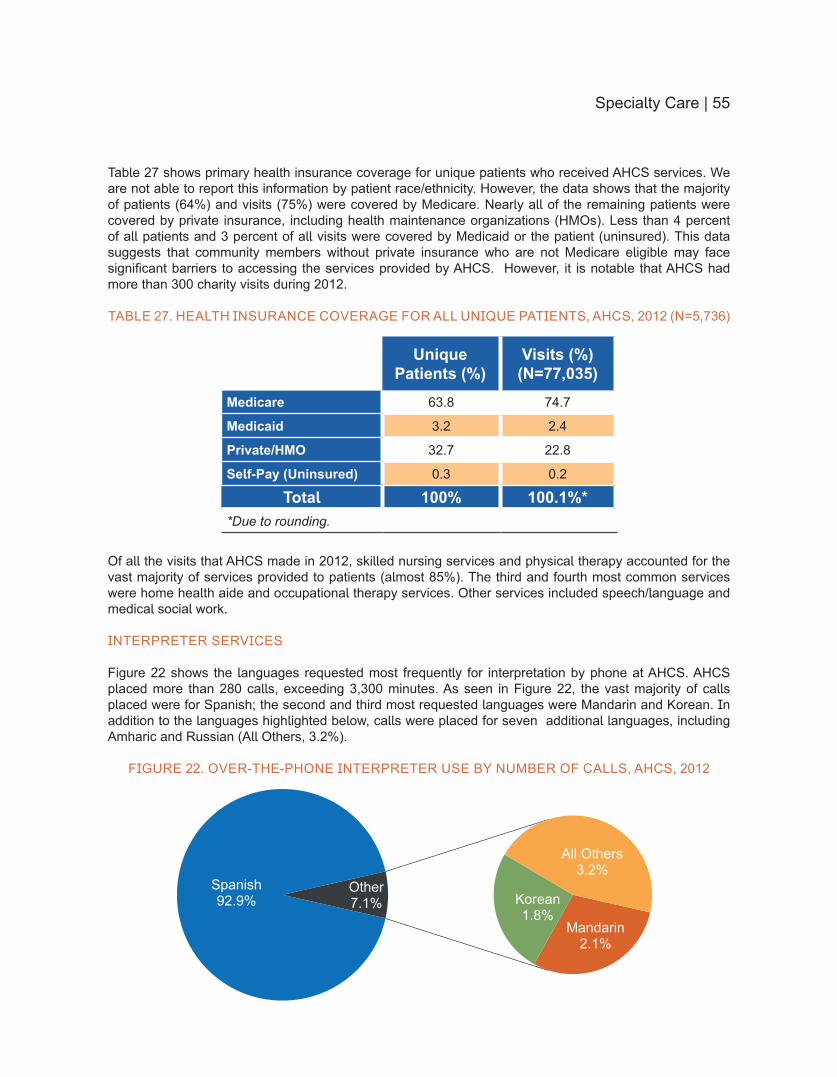
Figure 4 shows the most frequently requested languages for over-the-phone interpretation at WAH More than 9700 calls were made during 2012 exceeding 82000 minutes As seen in Figure 4 the majority of the calls placed were for Spanish language interpretation followed by Vietnamese French and Amharic In addition to the languages highlighted below calls were placed for more than 60 additional languages including Arabic Haitian Creole and Mandarin (All Others 69)
FIGURE 4 OVER-THE-PHONE INTERPRETER USE BY NUMBER OF CALLS WAH 2012
English 826
Spanish 139
Unknown 16
Amharic 04
French 03
Vietnamese 02
Korean 02
All Others 09
Other 19
Spanish 844
Vietnamese 28
French 28
Amharic 19
Korean 12 All Others
69 Other 156
18 | Washington Adventist Hospital
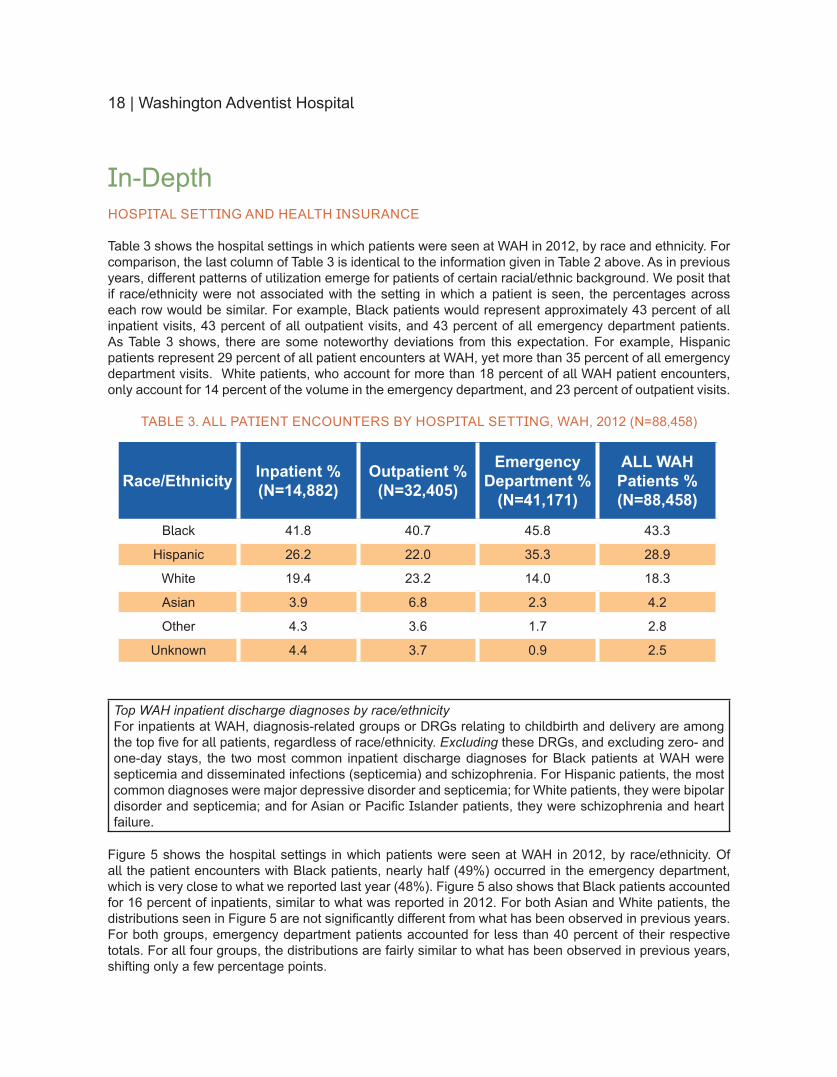
In-DepthHOSPITAL SETTING AND HEALTH INSURANCE
Table 3 shows the hospital settings in which patients were seen at WAH in 2012 by race and ethnicity For comparison the last column of Table 3 is identical to the information given in Table 2 above As in previous years different patterns of utilization emerge for patients of certain racialethnic background We posit that if raceethnicity were not associated with the setting in which a patient is seen the percentages across each row would be similar For example Black patients would represent approximately 43 percent of all inpatient visits 43 percent of all outpatient visits and 43 percent of all emergency department patients As Table 3 shows there are some noteworthy deviations from this expectation For example Hispanic patients represent 29 percent of all patient encounters at WAH yet more than 35 percent of all emergency department visits White patients who account for more than 18 percent of all WAH patient encounters only account for 14 percent of the volume in the emergency department and 23 percent of outpatient visits
TABLE 3 ALL PATIENT ENCOUNTERS BY HOSPITAL SETTING WAH 2012 (N=88458)
RaceEthnicity Inpatient (N=14882)
Outpatient (N=32405)
Emergency Department
(N=41171)
ALL WAH Patients (N=88458)
Black 418 407 458 433
Hispanic 262 220 353 289
White 194 232 140 183
Asian 39 68 23 42
Other 43 36 17 28
Unknown 44 37 09 25
Top WAH inpatient discharge diagnoses by raceethnicityFor inpatients at WAH diagnosis-related groups or DRGs relating to childbirth and delivery are among the top five for all patients regardless of raceethnicity Excluding these DRGs and excluding zero- and one-day stays the two most common inpatient discharge diagnoses for Black patients at WAH were septicemia and disseminated infections (septicemia) and schizophrenia For Hispanic patients the most common diagnoses were major depressive disorder and septicemia for White patients they were bipolar disorder and septicemia and for Asian or Pacific Islander patients they were schizophrenia and heart failure
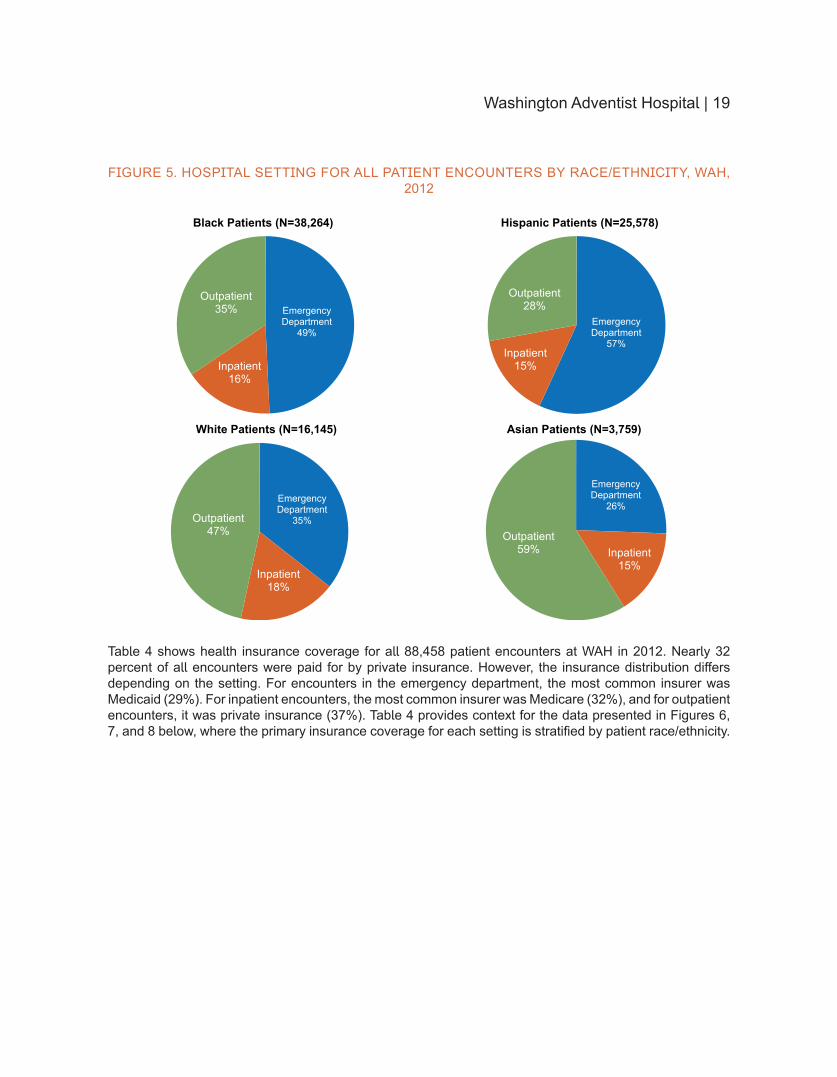
Figure 5 shows the hospital settings in which patients were seen at WAH in 2012 by raceethnicity Of all the patient encounters with Black patients nearly half (49) occurred in the emergency department which is very close to what we reported last year (48) Figure 5 also shows that Black patients accounted for 16 percent of inpatients similar to what was reported in 2012 For both Asian and White patients the distributions seen in Figure 5 are not significantly different from what has been observed in previous years For both groups emergency department patients accounted for less than 40 percent of their respective totals For all four groups the distributions are fairly similar to what has been observed in previous years shifting only a few percentage points
Washington Adventist Hospital | 19
FIGURE 5 HOSPITAL SETTING FOR ALL PATIENT ENCOUNTERS BY RACEETHNICITY WAH 2012
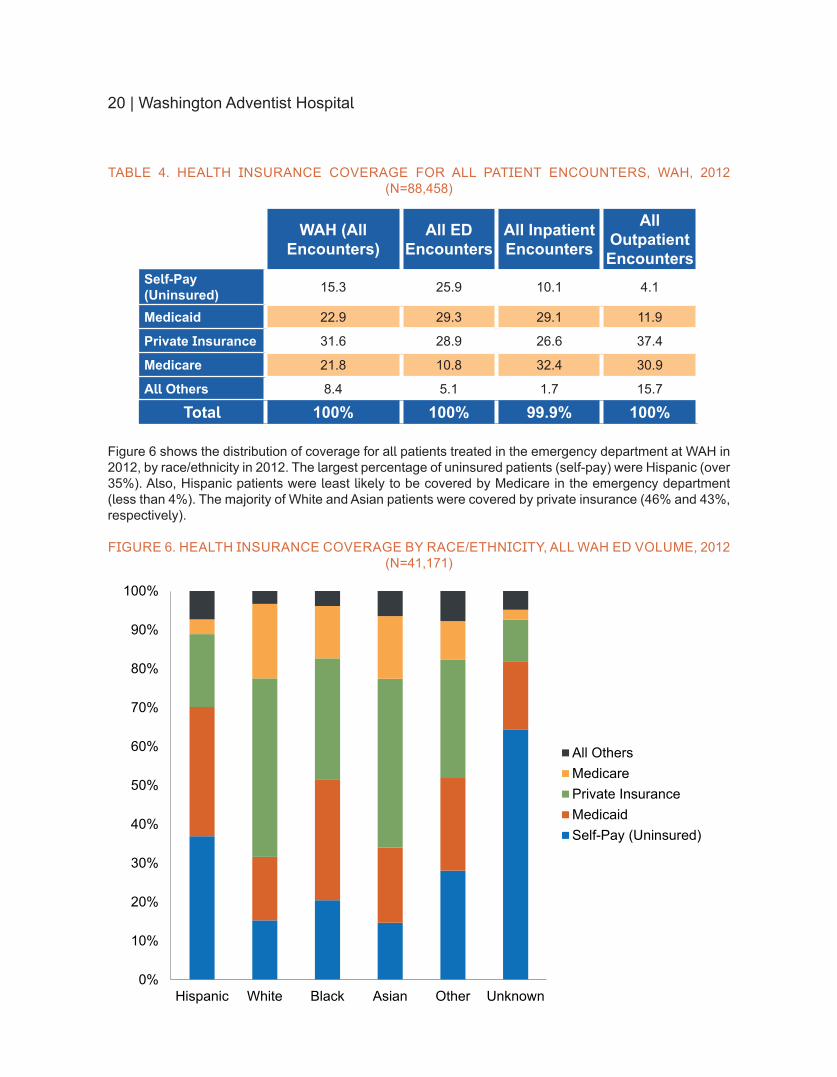
Table 4 shows health insurance coverage for all 88458 patient encounters at WAH in 2012 Nearly 32 percent of all encounters were paid for by private insurance However the insurance distribution differs depending on the setting For encounters in the emergency department the most common insurer was Medicaid (29) For inpatient encounters the most common insurer was Medicare (32) and for outpatient encounters it was private insurance (37) Table 4 provides context for the data presented in Figures 6 7 and 8 below where the primary insurance coverage for each setting is stratified by patient raceethnicity
Emergency Department
49
Inpatient 16
Outpatient 35
Black Patients (N=38264)
Emergency Department
35
Inpatient 18
Outpatient 47
White Patients (N=16145)
Emergency Department
57 Inpatient
15
Outpatient 28
Hispanic Patients (N=25578)
Emergency Department
26
Inpatient 15
Outpatient 59
Asian Patients (N=3759)
20 | Washington Adventist Hospital
TABLE 4 HEALTH INSURANCE COVERAGE FOR ALL PATIENT ENCOUNTERS WAH 2012 (N=88458)
WAH (All Encounters)
All ED Encounters
All Inpatient Encounters
All Outpatient Encounters
Self-Pay (Uninsured) 153 259 101 41
Medicaid 229 293 291 119
Private Insurance 316 289 266 374
Medicare 218 108 324 309
All Others 84 51 17 157
Total 100 100 999 100
Figure 6 shows the distribution of coverage for all patients treated in the emergency department at WAH in 2012 by raceethnicity in 2012 The largest percentage of uninsured patients (self-pay) were Hispanic (over 35) Also Hispanic patients were least likely to be covered by Medicare in the emergency department (less than 4) The majority of White and Asian patients were covered by private insurance (46 and 43 respectively)
FIGURE 6 HEALTH INSURANCE COVERAGE BY RACEETHNICITY ALL WAH ED VOLUME 2012 (N=41171)
0
10
20
30
40
50
60
70
80
90
100
Hispanic White Black Asian Other Unknown
All OthersMedicarePrivate InsuranceMedicaidSelf-Pay (Uninsured)
Washington Adventist Hospital | 21
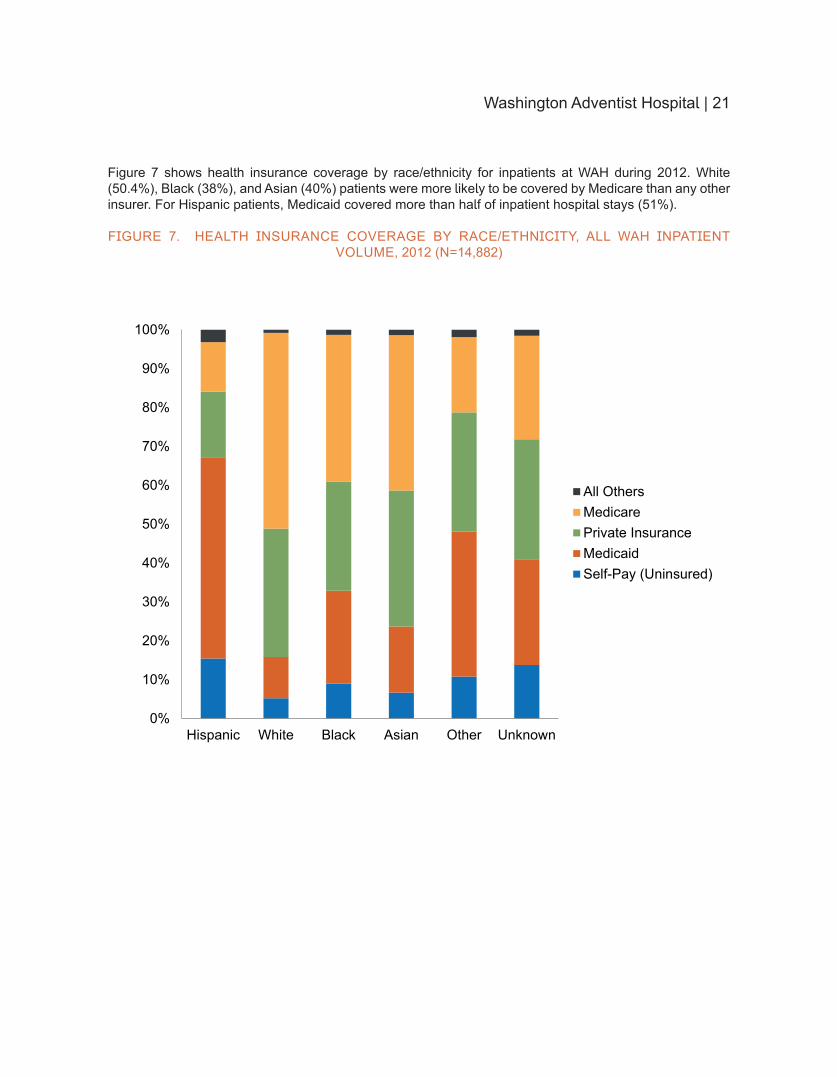
Figure 7 shows health insurance coverage by raceethnicity for inpatients at WAH during 2012 White (504) Black (38) and Asian (40) patients were more likely to be covered by Medicare than any other insurer For Hispanic patients Medicaid covered more than half of inpatient hospital stays (51)
FIGURE 7 HEALTH INSURANCE COVERAGE BY RACEETHNICITY ALL WAH INPATIENT VOLUME 2012 (N=14882)
0
10
20
30
40
50
60
70
80
90
100
Hispanic White Black Asian Other Unknown
All OthersMedicarePrivate InsuranceMedicaidSelf-Pay (Uninsured)
22 | Washington Adventist Hospital
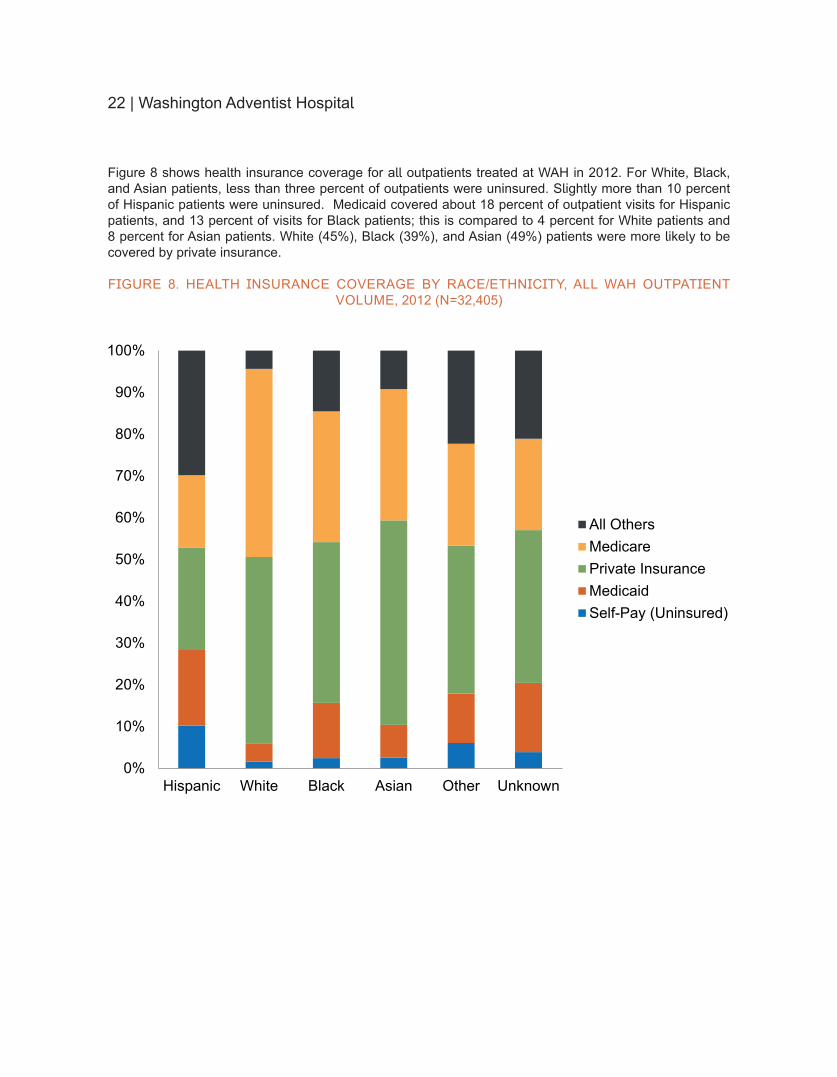
Figure 8 shows health insurance coverage for all outpatients treated at WAH in 2012 For White Black and Asian patients less than three percent of outpatients were uninsured Slightly more than 10 percent of Hispanic patients were uninsured Medicaid covered about 18 percent of outpatient visits for Hispanic patients and 13 percent of visits for Black patients this is compared to 4 percent for White patients and 8 percent for Asian patients White (45) Black (39) and Asian (49) patients were more likely to be covered by private insurance
FIGURE 8 HEALTH INSURANCE COVERAGE BY RACEETHNICITY ALL WAH OUTPATIENT VOLUME 2012 (N=32405)
0
10
20
30
40
50
60
70
80
90
100
Hispanic White Black Asian Other Unknown
All OthersMedicarePrivate InsuranceMedicaidSelf-Pay (Uninsured)
Washington Adventist Hospital | 23
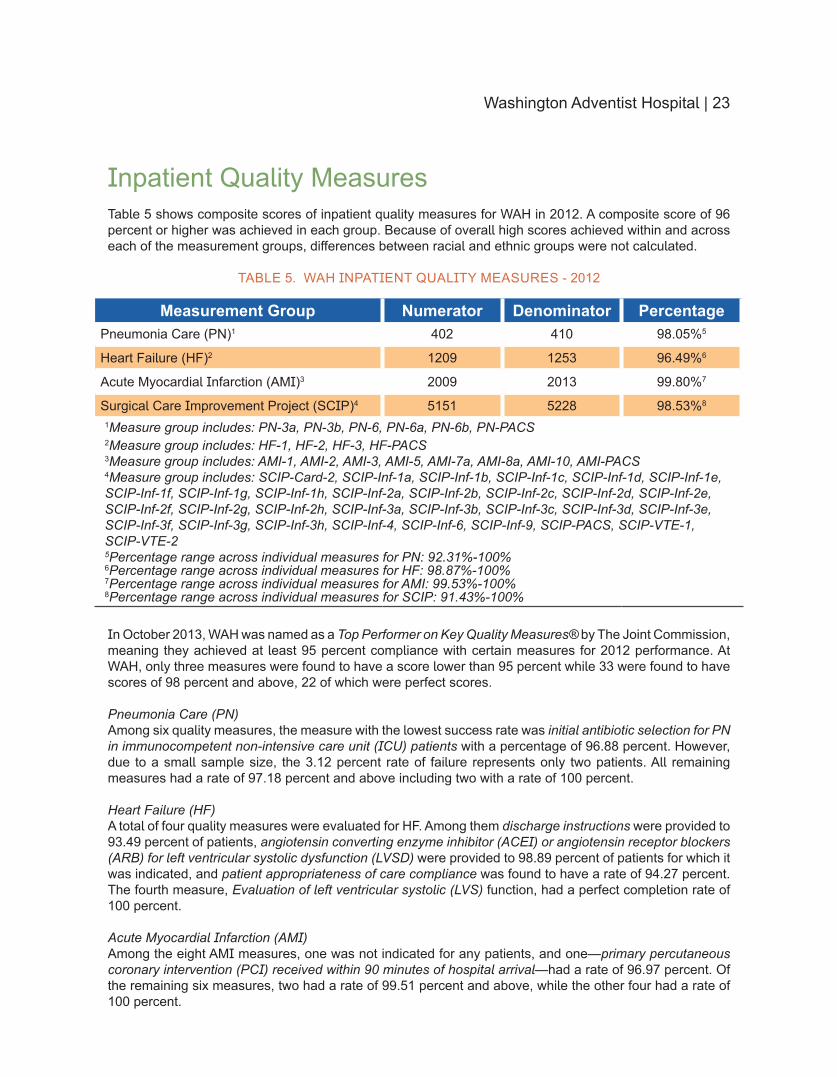
Inpatient Quality MeasuresTable 5 shows composite scores of inpatient quality measures for WAH in 2012 A composite score of 96 percent or higher was achieved in each group Because of overall high scores achieved within and across each of the measurement groups differences between racial and ethnic groups were not calculated
TABLE 5 WAH INPATIENT QUALITY MEASURES - 2012
Measurement Group Numerator Denominator PercentagePneumonia Care (PN)1 402 410 98055
Heart Failure (HF)2 1209 1253 96496
Acute Myocardial Infarction (AMI)3 2009 2013 99807
Surgical Care Improvement Project (SCIP)4 5151 5228 98538
1Measure group includes PN-3a PN-3b PN-6 PN-6a PN-6b PN-PACS2Measure group includes HF-1 HF-2 HF-3 HF-PACS3Measure group includes AMI-1 AMI-2 AMI-3 AMI-5 AMI-7a AMI-8a AMI-10 AMI-PACS4Measure group includes SCIP-Card-2 SCIP-Inf-1a SCIP-Inf-1b SCIP-Inf-1c SCIP-Inf-1d SCIP-Inf-1e SCIP-Inf-1f SCIP-Inf-1g SCIP-Inf-1h SCIP-Inf-2a SCIP-Inf-2b SCIP-Inf-2c SCIP-Inf-2d SCIP-Inf-2e SCIP-Inf-2f SCIP-Inf-2g SCIP-Inf-2h SCIP-Inf-3a SCIP-Inf-3b SCIP-Inf-3c SCIP-Inf-3d SCIP-Inf-3e SCIP-Inf-3f SCIP-Inf-3g SCIP-Inf-3h SCIP-Inf-4 SCIP-Inf-6 SCIP-Inf-9 SCIP-PACS SCIP-VTE-1 SCIP-VTE-2 5Percentage range across individual measures for PN 9231-1006Percentage range across individual measures for HF 9887-1007Percentage range across individual measures for AMI 9953-1008Percentage range across individual measures for SCIP 9143-100
In October 2013 WAH was named as a Top Performer on Key Quality Measuresreg by The Joint Commission meaning they achieved at least 95 percent compliance with certain measures for 2012 performance At WAH only three measures were found to have a score lower than 95 percent while 33 were found to have scores of 98 percent and above 22 of which were perfect scores
Pneumonia Care (PN)Among six quality measures the measure with the lowest success rate was initial antibiotic selection for PN in immunocompetent non-intensive care unit (ICU) patients with a percentage of 9688 percent However due to a small sample size the 312 percent rate of failure represents only two patients All remaining measures had a rate of 9718 percent and above including two with a rate of 100 percent
Heart Failure (HF)A total of four quality measures were evaluated for HF Among them discharge instructions were provided to 9349 percent of patients angiotensin converting enzyme inhibitor (ACEI) or angiotensin receptor blockers(ARB) for left ventricular systolic dysfunction (LVSD) were provided to 9889 percent of patients for which it was indicated and patient appropriateness of care compliance was found to have a rate of 9427 percent The fourth measure Evaluation of left ventricular systolic (LVS) function had a perfect completion rate of 100 percent
Acute Myocardial Infarction (AMI)Among the eight AMI measures one was not indicated for any patients and onemdashprimary percutaneous coronary intervention (PCI) received within 90 minutes of hospital arrivalmdashhad a rate of 9697 percent Of the remaining six measures two had a rate of 9951 percent and above while the other four had a rate of 100 percent
24 | Washington Adventist Hospital
Surgical Care Improvement Project (SCIP)Among the four groups of inpatient quality measures SCIP had the largest number of measures with a total of 32 Twenty-one of these measures had a score of at least 985 percent while 15 had a perfect score of 100 percent The measure with the lowest score of 9453 percent was patient appropriateness of care compliance
Washington Adventist Hospital
Washington Adventist Hospital | 25
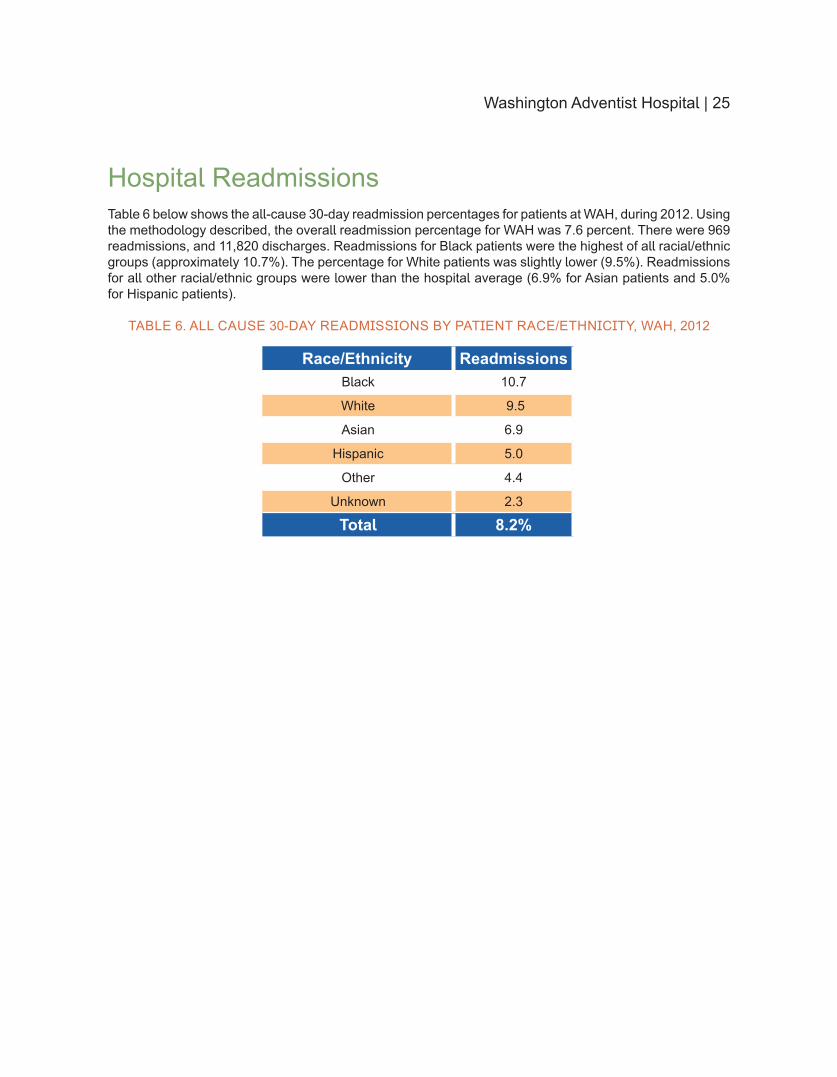
Hospital ReadmissionsTable 6 below shows the all-cause 30-day readmission percentages for patients at WAH during 2012 Using the methodology described the overall readmission percentage for WAH was 76 percent There were 969 readmissions and 11820 discharges Readmissions for Black patients were the highest of all racialethnic groups (approximately 107) The percentage for White patients was slightly lower (95) Readmissions for all other racialethnic groups were lower than the hospital average (69 for Asian patients and 50 for Hispanic patients)
TABLE 6 ALL CAUSE 30-DAY READMISSIONS BY PATIENT RACEETHNICITY WAH 2012
RaceEthnicity ReadmissionsBlack 107
White 95
Asian 69
Hispanic 50
Other 44
Unknown 23
Total 82
26 | Washington Adventist Hospital
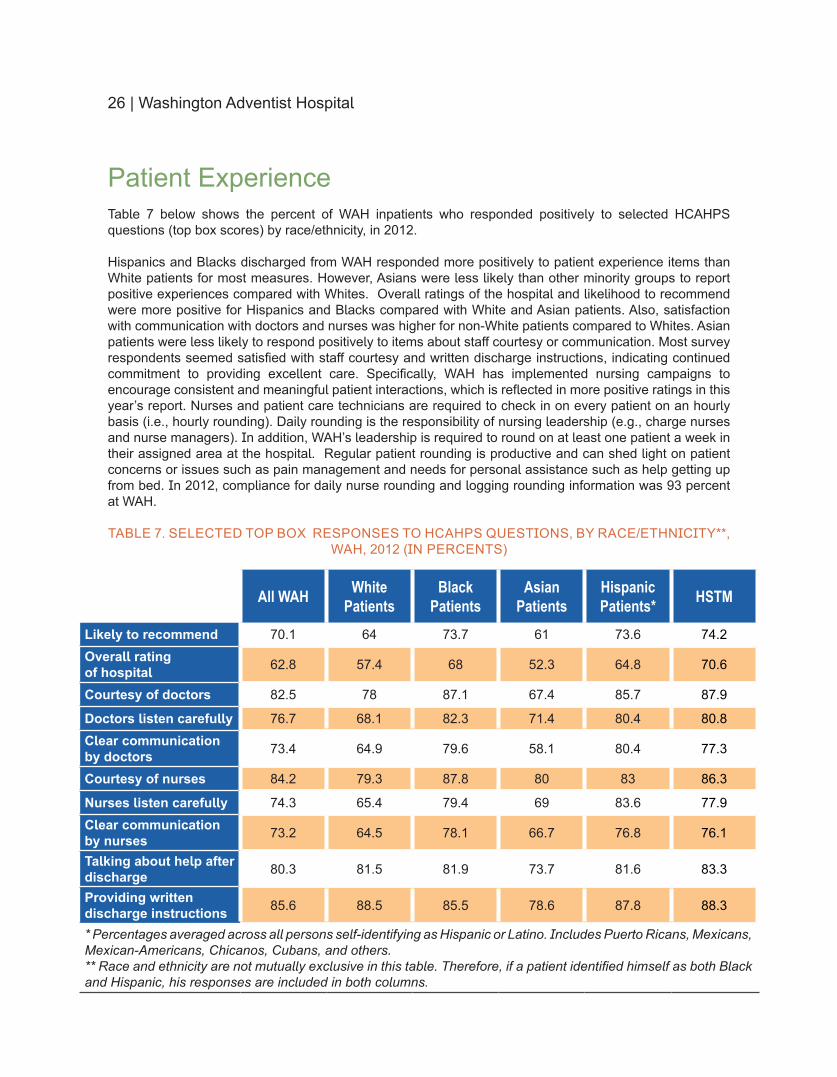
Patient Experience Table 7 below shows the percent of WAH inpatients who responded positively to selected HCAHPS questions (top box scores) by raceethnicity in 2012
Hispanics and Blacks discharged from WAH responded more positively to patient experience items than White patients for most measures However Asians were less likely than other minority groups to report positive experiences compared with Whites Overall ratings of the hospital and likelihood to recommend were more positive for Hispanics and Blacks compared with White and Asian patients Also satisfaction with communication with doctors and nurses was higher for non-White patients compared to Whites Asian patients were less likely to respond positively to items about staff courtesy or communication Most survey respondents seemed satisfied with staff courtesy and written discharge instructions indicating continued commitment to providing excellent care Specifically WAH has implemented nursing campaigns to encourage consistent and meaningful patient interactions which is reflected in more positive ratings in this yearrsquos report Nurses and patient care technicians are required to check in on every patient on an hourly basis (ie hourly rounding) Daily rounding is the responsibility of nursing leadership (eg charge nurses and nurse managers) In addition WAHrsquos leadership is required to round on at least one patient a week in their assigned area at the hospital Regular patient rounding is productive and can shed light on patient concerns or issues such as pain management and needs for personal assistance such as help getting up from bed In 2012 compliance for daily nurse rounding and logging rounding information was 93 percent at WAH
TABLE 7 SELECTED TOP BOX RESPONSES TO HCAHPS QUESTIONS BY RACEETHNICITY WAH 2012 (IN PERCENTS)
All WAH White Patients
Black Patients
Asian Patients
Hispanic Patients HSTM
Likely to recommend 701 64 737 61 736 742Overall rating of hospital 628 574 68 523 648 706
Courtesy of doctors 825 78 871 674 857 879
Doctors listen carefully 767 681 823 714 804 808Clear communication by doctors 734 649 796 581 804 773
Courtesy of nurses 842 793 878 80 83 863
Nurses listen carefully 743 654 794 69 836 779Clear communication by nurses 732 645 781 667 768 761
Talking about help after discharge 803 815 819 737 816 833
Providing written discharge instructions 856 885 855 786 878 883
Percentages averaged across all persons self-identifying as Hispanic or Latino Includes Puerto Ricans Mexicans Mexican-Americans Chicanos Cubans and others Race and ethnicity are not mutually exclusive in this table Therefore if a patient identified himself as both Black and Hispanic his responses are included in both columns
Washington Adventist Hospital | 27
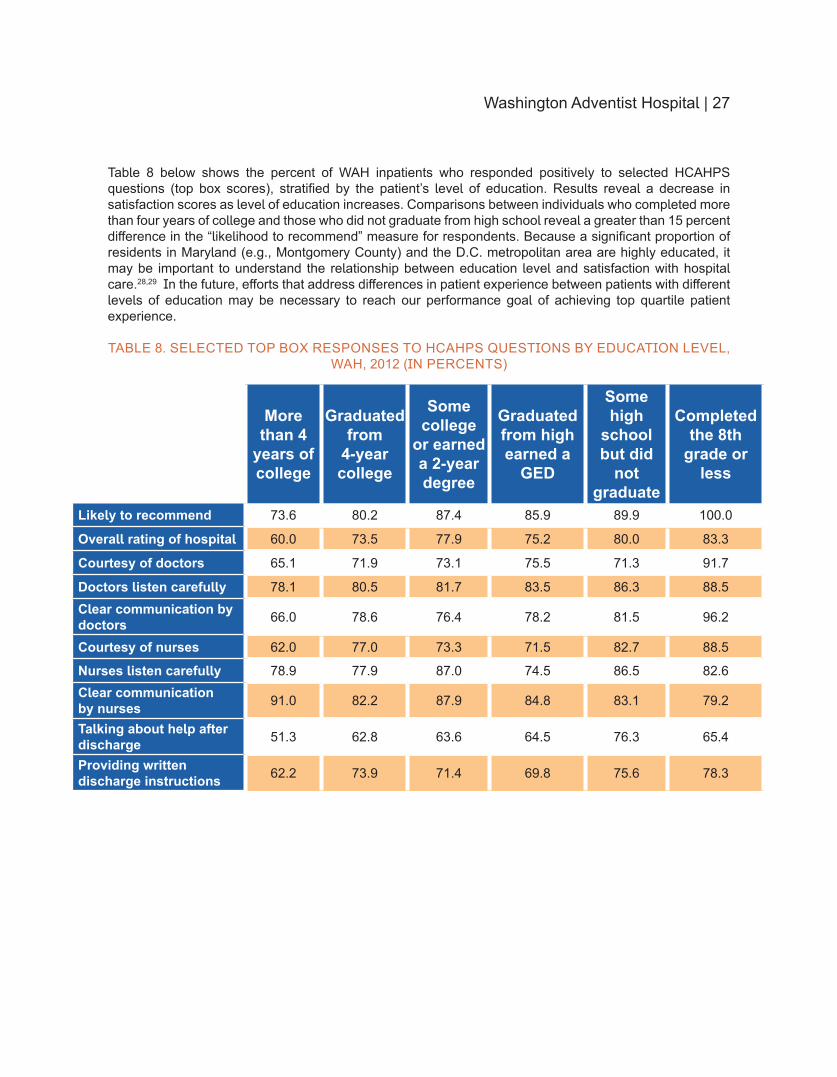
Table 8 below shows the percent of WAH inpatients who responded positively to selected HCAHPS questions (top box scores) stratified by the patientrsquos level of education Results reveal a decrease in satisfaction scores as level of education increases Comparisons between individuals who completed more than four years of college and those who did not graduate from high school reveal a greater than 15 percent difference in the ldquolikelihood to recommendrdquo measure for respondents Because a significant proportion of residents in Maryland (eg Montgomery County) and the DC metropolitan area are highly educated it may be important to understand the relationship between education level and satisfaction with hospital care2829 In the future efforts that address differences in patient experience between patients with different levels of education may be necessary to reach our performance goal of achieving top quartile patient experience
TABLE 8 SELECTED TOP BOX RESPONSES TO HCAHPS QUESTIONS BY EDUCATION LEVEL WAH 2012 (IN PERCENTS)
More than 4
years of college
Graduated from
4-year college
Some college
or earned a 2-year degree
Graduated from high earned a
GED
Some high
school but did
not graduate
Completed the 8th
grade or less
Likely to recommend 736 802 874 859 899 1000
Overall rating of hospital 600 735 779 752 800 833
Courtesy of doctors 651 719 731 755 713 917
Doctors listen carefully 781 805 817 835 863 885Clear communication by doctors 660 786 764 782 815 962
Courtesy of nurses 620 770 733 715 827 885
Nurses listen carefully 789 779 870 745 865 826Clear communication by nurses 910 822 879 848 831 792
Talking about help after discharge 513 628 636 645 763 654
Providing written discharge instructions 622 739 714 698 756 783
Shady Grove Adventist Hospital
Shady Grove Adventist Hospital | 29
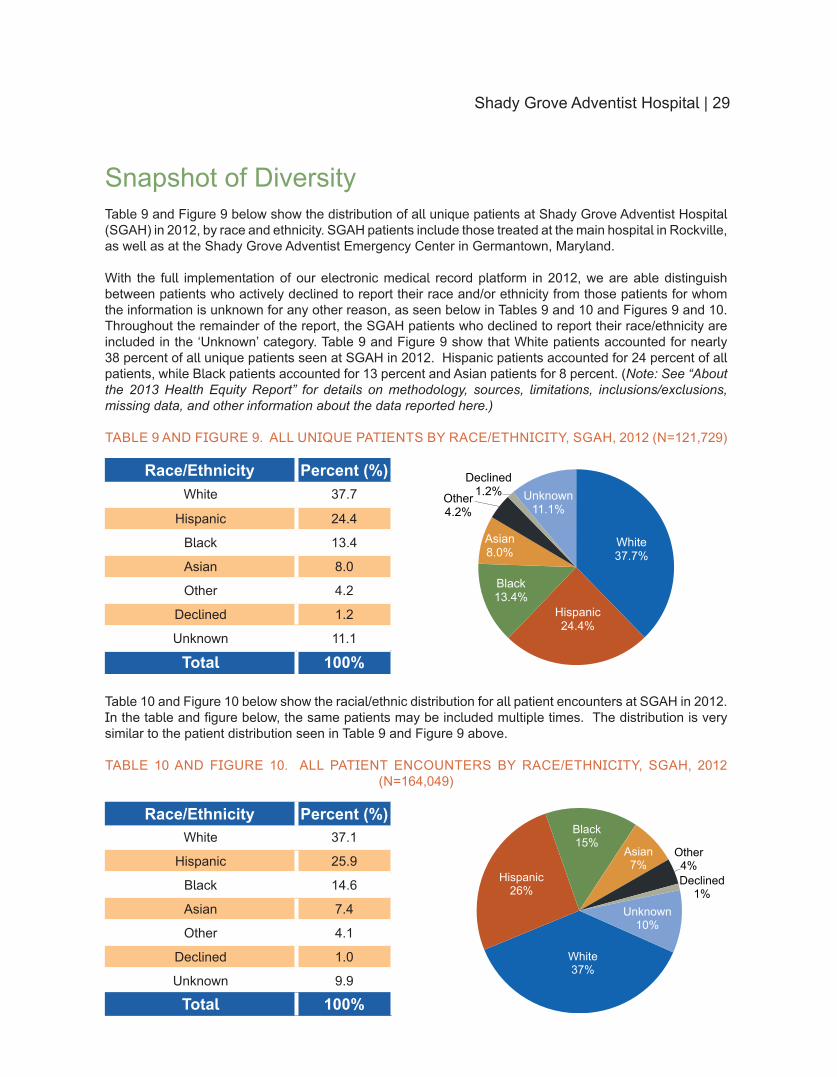
Snapshot of DiversityTable 9 and Figure 9 below show the distribution of all unique patients at Shady Grove Adventist Hospital (SGAH) in 2012 by race and ethnicity SGAH patients include those treated at the main hospital in Rockville as well as at the Shady Grove Adventist Emergency Center in Germantown Maryland
With the full implementation of our electronic medical record platform in 2012 we are able distinguish between patients who actively declined to report their race andor ethnicity from those patients for whom the information is unknown for any other reason as seen below in Tables 9 and 10 and Figures 9 and 10 Throughout the remainder of the report the SGAH patients who declined to report their raceethnicity are included in the lsquoUnknownrsquo category Table 9 and Figure 9 show that White patients accounted for nearly 38 percent of all unique patients seen at SGAH in 2012 Hispanic patients accounted for 24 percent of all patients while Black patients accounted for 13 percent and Asian patients for 8 percent (Note See ldquoAbout the 2013 Health Equity Reportrdquo for details on methodology sources limitations inclusionsexclusions missing data and other information about the data reported here)
TABLE 9 AND FIGURE 9 ALL UNIQUE PATIENTS BY RACEETHNICITY SGAH 2012 (N=121729)
RaceEthnicity Percent ()White 377
Hispanic 244
Black 134
Asian 80
Other 42
Declined 12
Unknown 111
Total 100
Table 10 and Figure 10 below show the racialethnic distribution for all patient encounters at SGAH in 2012 In the table and figure below the same patients may be included multiple times The distribution is very similar to the patient distribution seen in Table 9 and Figure 9 above
TABLE 10 AND FIGURE 10 ALL PATIENT ENCOUNTERS BY RACEETHNICITY SGAH 2012 (N=164049)
RaceEthnicity Percent ()White 371
Hispanic 259
Black 146
Asian 74
Other 41
Declined 10
Unknown 99
Total 100
White 377
Hispanic 244
Black 134
Asian 80
Other 42
Declined 12 Unknown
111
White 37
Hispanic 26
Black 15
Asian 7
Other 4 Declined
1 Unknown
10
30 | Shady Grove Adventist Hospital
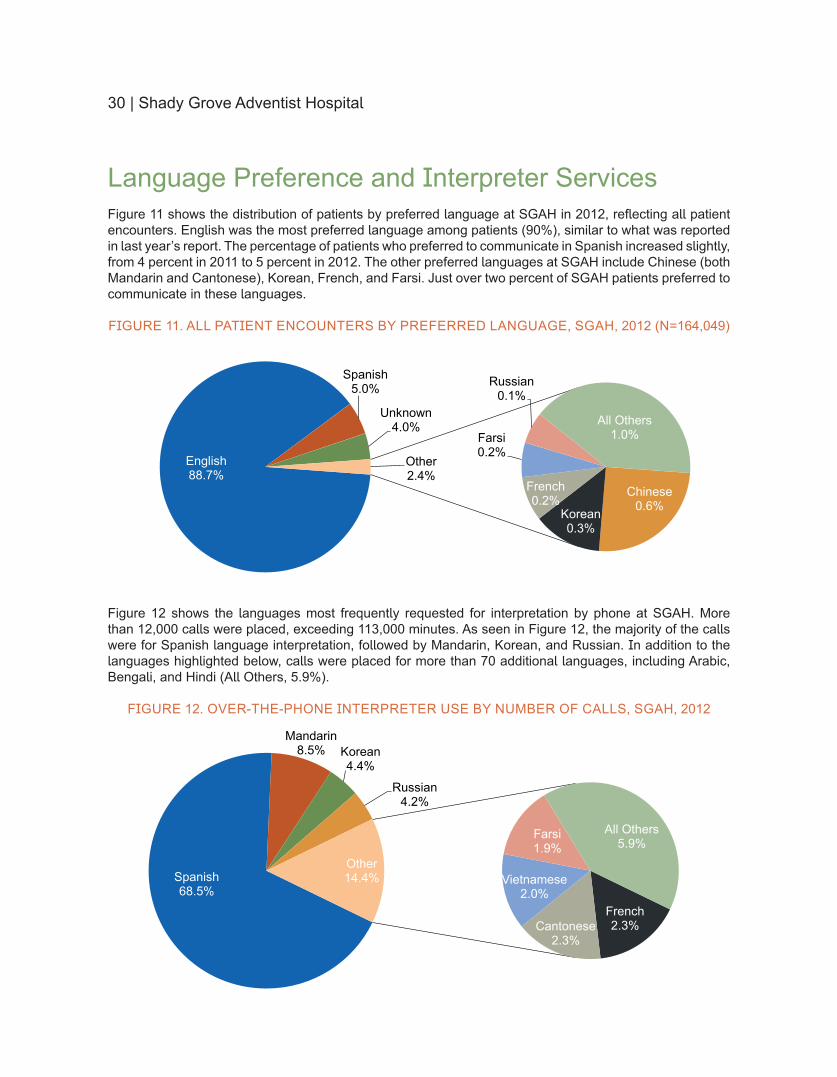
Language Preference and Interpreter ServicesFigure 11 shows the distribution of patients by preferred language at SGAH in 2012 reflecting all patient encounters English was the most preferred language among patients (90) similar to what was reported in last yearrsquos report The percentage of patients who preferred to communicate in Spanish increased slightly from 4 percent in 2011 to 5 percent in 2012 The other preferred languages at SGAH include Chinese (both Mandarin and Cantonese) Korean French and Farsi Just over two percent of SGAH patients preferred to communicate in these languages
FIGURE 11 ALL PATIENT ENCOUNTERS BY PREFERRED LANGUAGE SGAH 2012 (N=164049)
Figure 12 shows the languages most frequently requested for interpretation by phone at SGAH More than 12000 calls were placed exceeding 113000 minutes As seen in Figure 12 the majority of the calls were for Spanish language interpretation followed by Mandarin Korean and Russian In addition to the languages highlighted below calls were placed for more than 70 additional languages including Arabic Bengali and Hindi (All Others 59)
FIGURE 12 OVER-THE-PHONE INTERPRETER USE BY NUMBER OF CALLS SGAH 2012
English 887
Spanish 50
Unknown 40
Chinese 06 Korean
03
French 02
Farsi 02
Russian 01
All Others 10
Other 24
Spanish 685
Mandarin 85 Korean
44
Russian 42
French 23 Cantonese
23
Vietnamese 20
Farsi 19
All Others 59
Other 144
Shady Grove Adventist Hospital | 31
In-DepthHOSPITAL SETTING AND HEALTH INSURANCE
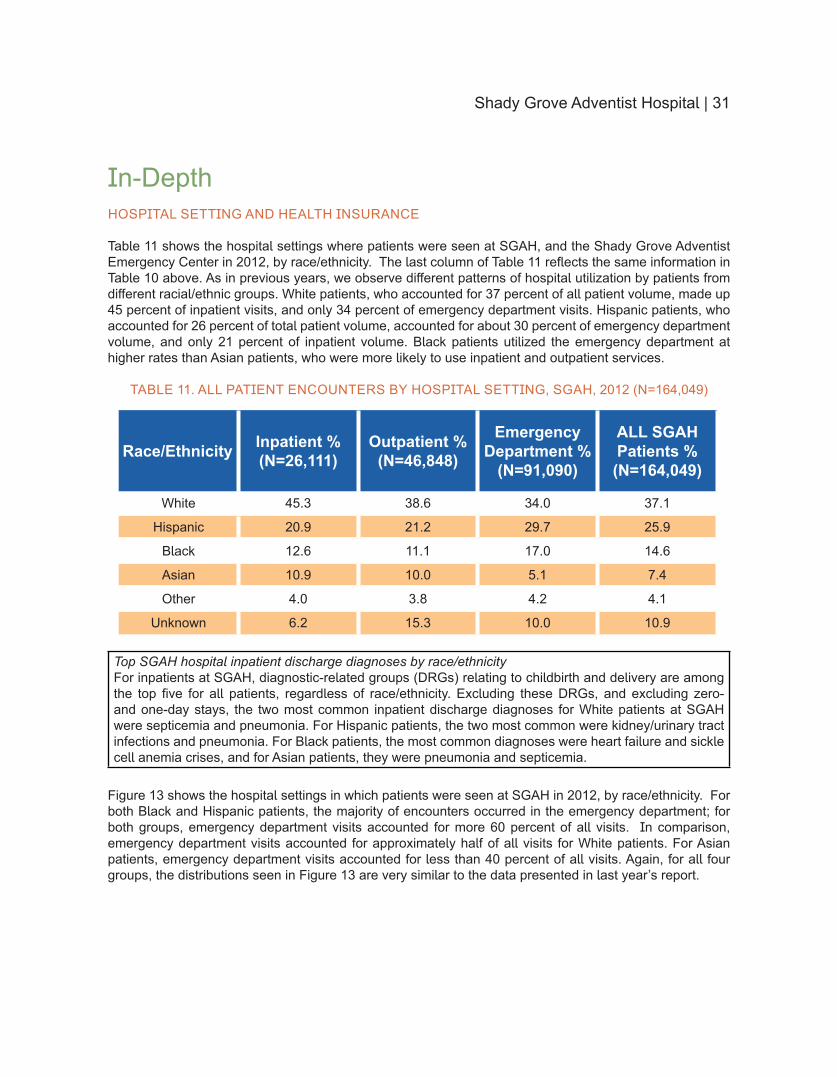
Table 11 shows the hospital settings where patients were seen at SGAH and the Shady Grove Adventist Emergency Center in 2012 by raceethnicity The last column of Table 11 reflects the same information in Table 10 above As in previous years we observe different patterns of hospital utilization by patients from different racialethnic groups White patients who accounted for 37 percent of all patient volume made up 45 percent of inpatient visits and only 34 percent of emergency department visits Hispanic patients who accounted for 26 percent of total patient volume accounted for about 30 percent of emergency department volume and only 21 percent of inpatient volume Black patients utilized the emergency department at higher rates than Asian patients who were more likely to use inpatient and outpatient services
TABLE 11 ALL PATIENT ENCOUNTERS BY HOSPITAL SETTING SGAH 2012 (N=164049)
RaceEthnicity Inpatient (N=26111)
Outpatient (N=46848)
Emergency Department
(N=91090)
ALL SGAH Patients (N=164049)
White 453 386 340 371
Hispanic 209 212 297 259
Black 126 111 170 146
Asian 109 100 51 74
Other 40 38 42 41
Unknown 62 153 100 109
Top SGAH hospital inpatient discharge diagnoses by raceethnicityFor inpatients at SGAH diagnostic-related groups (DRGs) relating to childbirth and delivery are among the top five for all patients regardless of raceethnicity Excluding these DRGs and excluding zero- and one-day stays the two most common inpatient discharge diagnoses for White patients at SGAH were septicemia and pneumonia For Hispanic patients the two most common were kidneyurinary tract infections and pneumonia For Black patients the most common diagnoses were heart failure and sickle cell anemia crises and for Asian patients they were pneumonia and septicemia
Figure 13 shows the hospital settings in which patients were seen at SGAH in 2012 by raceethnicity For both Black and Hispanic patients the majority of encounters occurred in the emergency department for both groups emergency department visits accounted for more 60 percent of all visits In comparison emergency department visits accounted for approximately half of all visits for White patients For Asian patients emergency department visits accounted for less than 40 percent of all visits Again for all four groups the distributions seen in Figure 13 are very similar to the data presented in last yearrsquos report
32 | Shady Grove Adventist Hospital
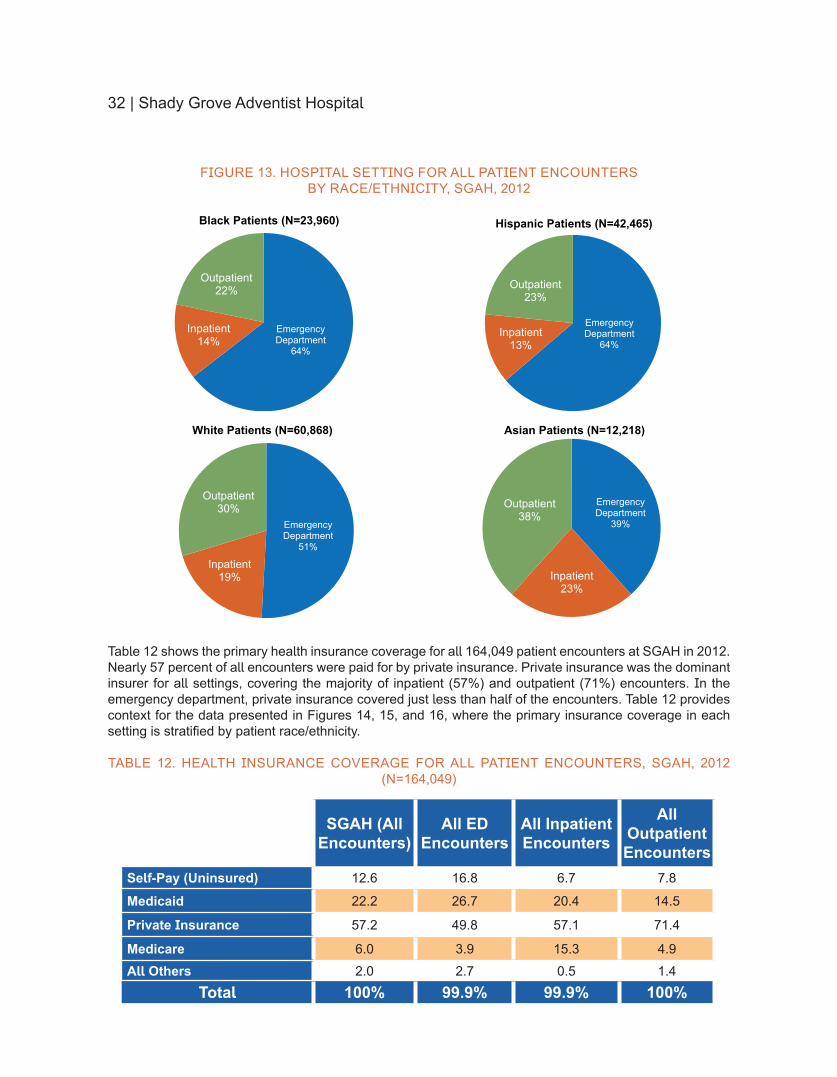
FIGURE 13 HOSPITAL SETTING FOR ALL PATIENT ENCOUNTERSBY RACEETHNICITY SGAH 2012
Table 12 shows the primary health insurance coverage for all 164049 patient encounters at SGAH in 2012 Nearly 57 percent of all encounters were paid for by private insurance Private insurance was the dominant insurer for all settings covering the majority of inpatient (57) and outpatient (71) encounters In the emergency department private insurance covered just less than half of the encounters Table 12 provides context for the data presented in Figures 14 15 and 16 where the primary insurance coverage in each setting is stratified by patient raceethnicity
TABLE 12 HEALTH INSURANCE COVERAGE FOR ALL PATIENT ENCOUNTERS SGAH 2012 (N=164049)
SGAH (All Encounters)
All ED Encounters
All Inpatient Encounters
All Outpatient Encounters
Self-Pay (Uninsured) 126 168 67 78
Medicaid 222 267 204 145
Private Insurance 572 498 571 714
Medicare 60 39 153 49All Others 20 27 05 14
Total 100 999 999 100
Emergency Department
64
Inpatient 14
Outpatient 22
Black Patients (N=23960)
Emergency Department
51
Inpatient 19
Outpatient 30
White Patients (N=60868)
Emergency Department
64 Inpatient
13
Outpatient 23
Hispanic Patients (N=42465)
Emergency Department
39
Inpatient 23
Outpatient 38
Asian Patients (N=12218)
Shady Grove Adventist Hospital | 33
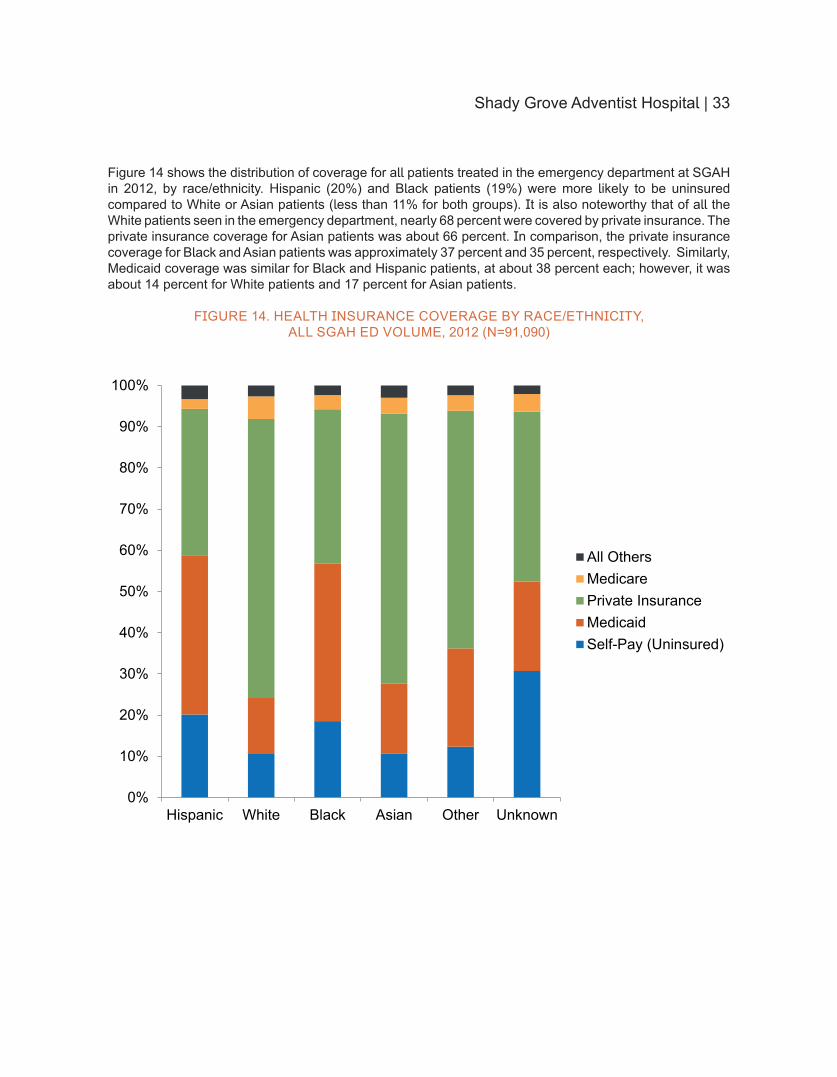
Figure 14 shows the distribution of coverage for all patients treated in the emergency department at SGAH in 2012 by raceethnicity Hispanic (20) and Black patients (19) were more likely to be uninsured compared to White or Asian patients (less than 11 for both groups) It is also noteworthy that of all the White patients seen in the emergency department nearly 68 percent were covered by private insurance The private insurance coverage for Asian patients was about 66 percent In comparison the private insurance coverage for Black and Asian patients was approximately 37 percent and 35 percent respectively Similarly Medicaid coverage was similar for Black and Hispanic patients at about 38 percent each however it was about 14 percent for White patients and 17 percent for Asian patients
FIGURE 14 HEALTH INSURANCE COVERAGE BY RACEETHNICITY ALL SGAH ED VOLUME 2012 (N=91090)
0
10
20
30
40
50
60
70
80
90
100
Hispanic White Black Asian Other Unknown
All OthersMedicarePrivate InsuranceMedicaidSelf-Pay (Uninsured)
34 | Shady Grove Adventist Hospital
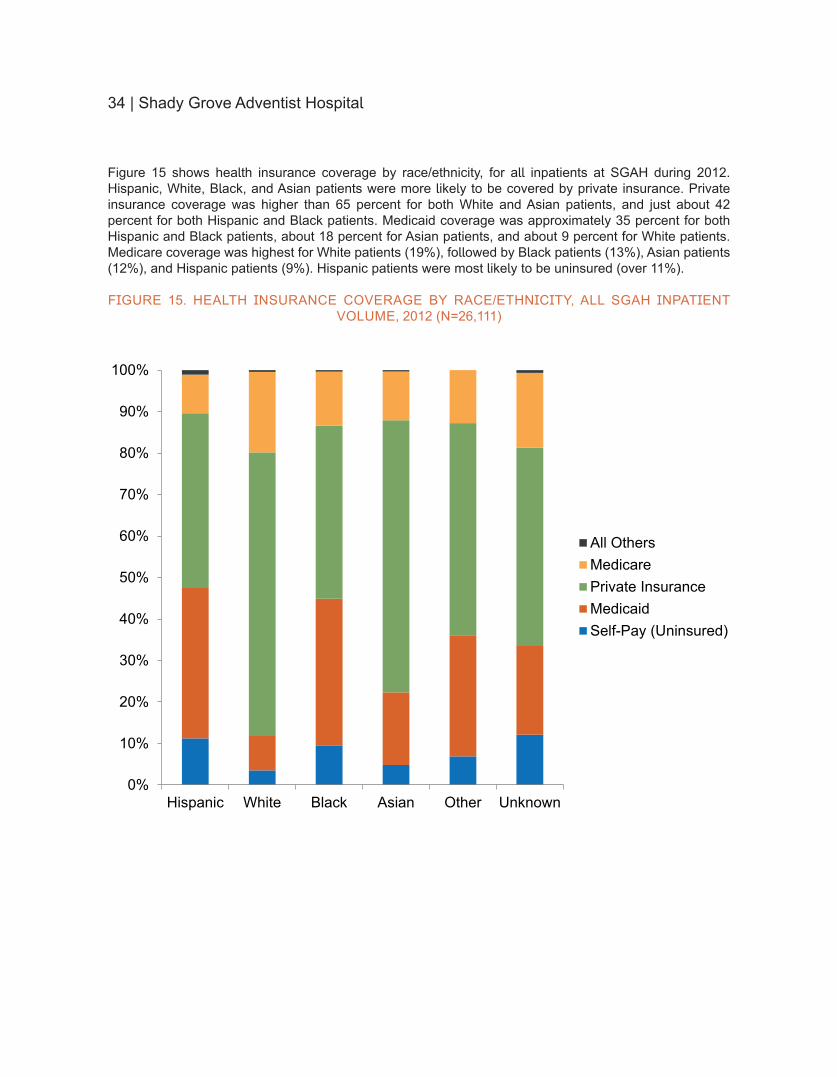
Figure 15 shows health insurance coverage by raceethnicity for all inpatients at SGAH during 2012 Hispanic White Black and Asian patients were more likely to be covered by private insurance Private insurance coverage was higher than 65 percent for both White and Asian patients and just about 42 percent for both Hispanic and Black patients Medicaid coverage was approximately 35 percent for both Hispanic and Black patients about 18 percent for Asian patients and about 9 percent for White patients Medicare coverage was highest for White patients (19) followed by Black patients (13) Asian patients (12) and Hispanic patients (9) Hispanic patients were most likely to be uninsured (over 11)
FIGURE 15 HEALTH INSURANCE COVERAGE BY RACEETHNICITY ALL SGAH INPATIENT VOLUME 2012 (N=26111)
0
10
20
30
40
50
60
70
80
90
100
Hispanic White Black Asian Other Unknown
All OthersMedicarePrivate InsuranceMedicaidSelf-Pay (Uninsured)
Shady Grove Adventist Hospital | 35
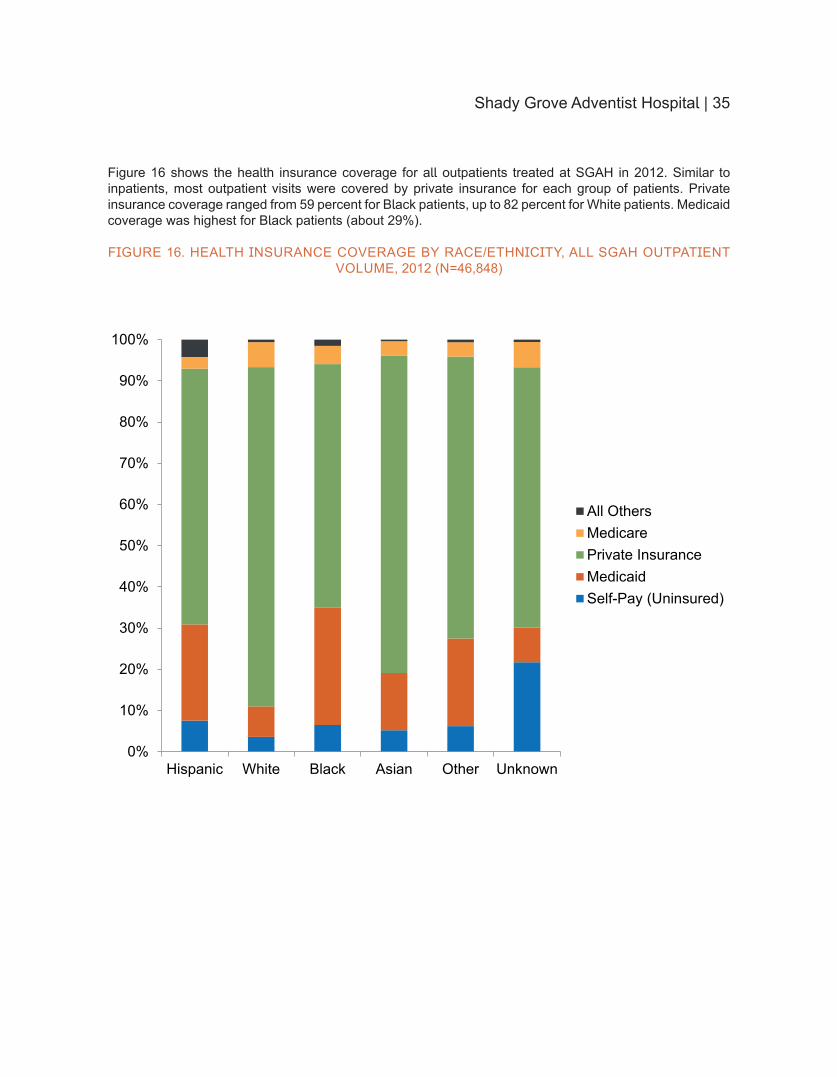
Figure 16 shows the health insurance coverage for all outpatients treated at SGAH in 2012 Similar to inpatients most outpatient visits were covered by private insurance for each group of patients Private insurance coverage ranged from 59 percent for Black patients up to 82 percent for White patients Medicaid coverage was highest for Black patients (about 29)
FIGURE 16 HEALTH INSURANCE COVERAGE BY RACEETHNICITY ALL SGAH OUTPATIENT VOLUME 2012 (N=46848)
0
10
20
30
40
50
60
70
80
90
100
Hispanic White Black Asian Other Unknown
All OthersMedicarePrivate InsuranceMedicaidSelf-Pay (Uninsured)
36 | Shady Grove Adventist Hospital
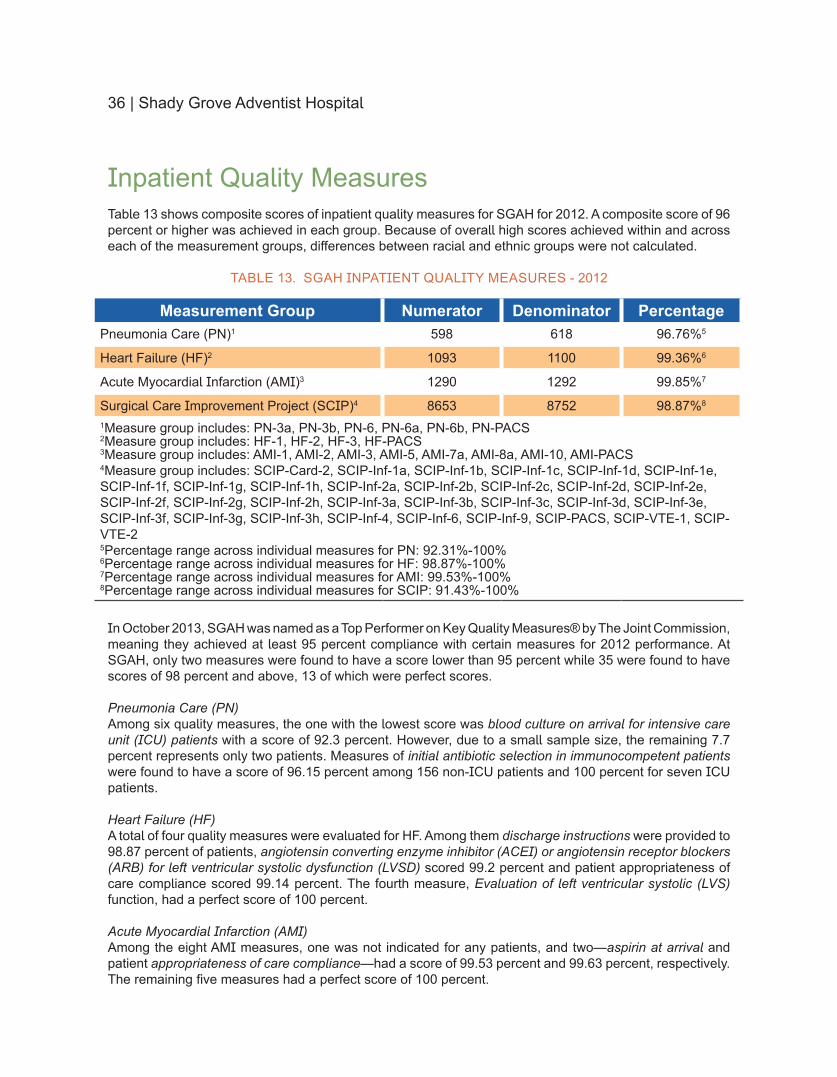
Inpatient Quality MeasuresTable 13 shows composite scores of inpatient quality measures for SGAH for 2012 A composite score of 96 percent or higher was achieved in each group Because of overall high scores achieved within and across each of the measurement groups differences between racial and ethnic groups were not calculated
TABLE 13 SGAH INPATIENT QUALITY MEASURES - 2012
Measurement Group Numerator Denominator PercentagePneumonia Care (PN)1 598 618 96765
Heart Failure (HF)2 1093 1100 99366
Acute Myocardial Infarction (AMI)3 1290 1292 99857
Surgical Care Improvement Project (SCIP)4 8653 8752 98878
1Measure group includes PN-3a PN-3b PN-6 PN-6a PN-6b PN-PACS2Measure group includes HF-1 HF-2 HF-3 HF-PACS3Measure group includes AMI-1 AMI-2 AMI-3 AMI-5 AMI-7a AMI-8a AMI-10 AMI-PACS4Measure group includes SCIP-Card-2 SCIP-Inf-1a SCIP-Inf-1b SCIP-Inf-1c SCIP-Inf-1d SCIP-Inf-1e SCIP-Inf-1f SCIP-Inf-1g SCIP-Inf-1h SCIP-Inf-2a SCIP-Inf-2b SCIP-Inf-2c SCIP-Inf-2d SCIP-Inf-2e SCIP-Inf-2f SCIP-Inf-2g SCIP-Inf-2h SCIP-Inf-3a SCIP-Inf-3b SCIP-Inf-3c SCIP-Inf-3d SCIP-Inf-3e SCIP-Inf-3f SCIP-Inf-3g SCIP-Inf-3h SCIP-Inf-4 SCIP-Inf-6 SCIP-Inf-9 SCIP-PACS SCIP-VTE-1 SCIP-VTE-2 5Percentage range across individual measures for PN 9231-1006Percentage range across individual measures for HF 9887-1007Percentage range across individual measures for AMI 9953-1008Percentage range across individual measures for SCIP 9143-100
In October 2013 SGAH was named as a Top Performer on Key Quality Measuresreg by The Joint Commission meaning they achieved at least 95 percent compliance with certain measures for 2012 performance At SGAH only two measures were found to have a score lower than 95 percent while 35 were found to have scores of 98 percent and above 13 of which were perfect scores
Pneumonia Care (PN)Among six quality measures the one with the lowest score was blood culture on arrival for intensive care unit (ICU) patients with a score of 923 percent However due to a small sample size the remaining 77 percent represents only two patients Measures of initial antibiotic selection in immunocompetent patients were found to have a score of 9615 percent among 156 non-ICU patients and 100 percent for seven ICU patients
Heart Failure (HF)A total of four quality measures were evaluated for HF Among them discharge instructions were provided to 9887 percent of patients angiotensin converting enzyme inhibitor (ACEI) or angiotensin receptor blockers (ARB) for left ventricular systolic dysfunction (LVSD) scored 992 percent and patient appropriateness of care compliance scored 9914 percent The fourth measure Evaluation of left ventricular systolic (LVS) function had a perfect score of 100 percent
Acute Myocardial Infarction (AMI)Among the eight AMI measures one was not indicated for any patients and twomdashaspirin at arrival and patient appropriateness of care compliancemdashhad a score of 9953 percent and 9963 percent respectively The remaining five measures had a perfect score of 100 percent
Shady Grove Adventist Hospital | 37
Surgical Care Improvement Project (SCIP)Among the four groups of inpatient quality measures SCIP had the largest number of measures with a total of 32 Seven of these measures were not applicable to the patients seen Twenty-one measures had a score of at least 985 percent while six had a perfect score of 100 percent Two of the measures discontinuation of prophylactic antibiotics within 24 hours after hysterectomy and beta blocker given during the perioperative period for those on beta blocker therapy preadmission had the lowest scores of 9143 percent and 9651 percent respectively
Shady Grove Adventist Hospital
38 | Shady Grove Adventist Hospital
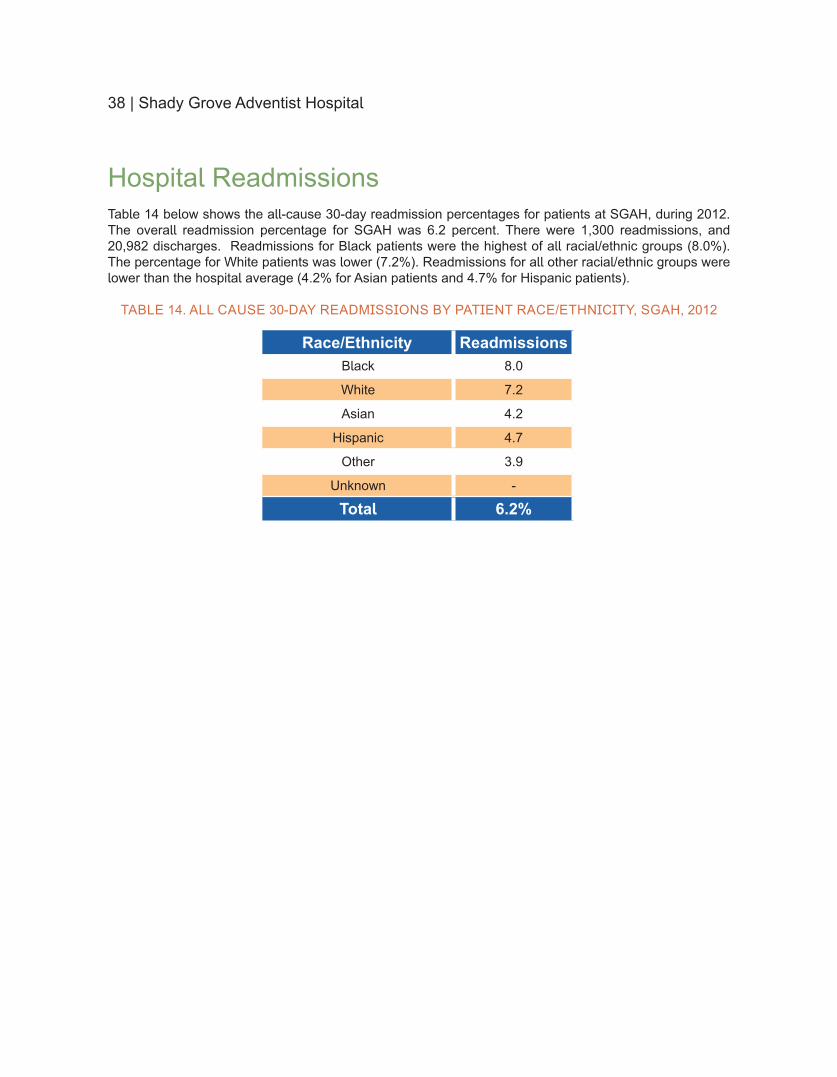
Hospital ReadmissionsTable 14 below shows the all-cause 30-day readmission percentages for patients at SGAH during 2012 The overall readmission percentage for SGAH was 62 percent There were 1300 readmissions and 20982 discharges Readmissions for Black patients were the highest of all racialethnic groups (80) The percentage for White patients was lower (72) Readmissions for all other racialethnic groups were lower than the hospital average (42 for Asian patients and 47 for Hispanic patients)
TABLE 14 ALL CAUSE 30-DAY READMISSIONS BY PATIENT RACEETHNICITY SGAH 2012
RaceEthnicity ReadmissionsBlack 80
White 72
Asian 42
Hispanic 47
Other 39
Unknown -
Total 62
Shady Grove Adventist Hospital | 39
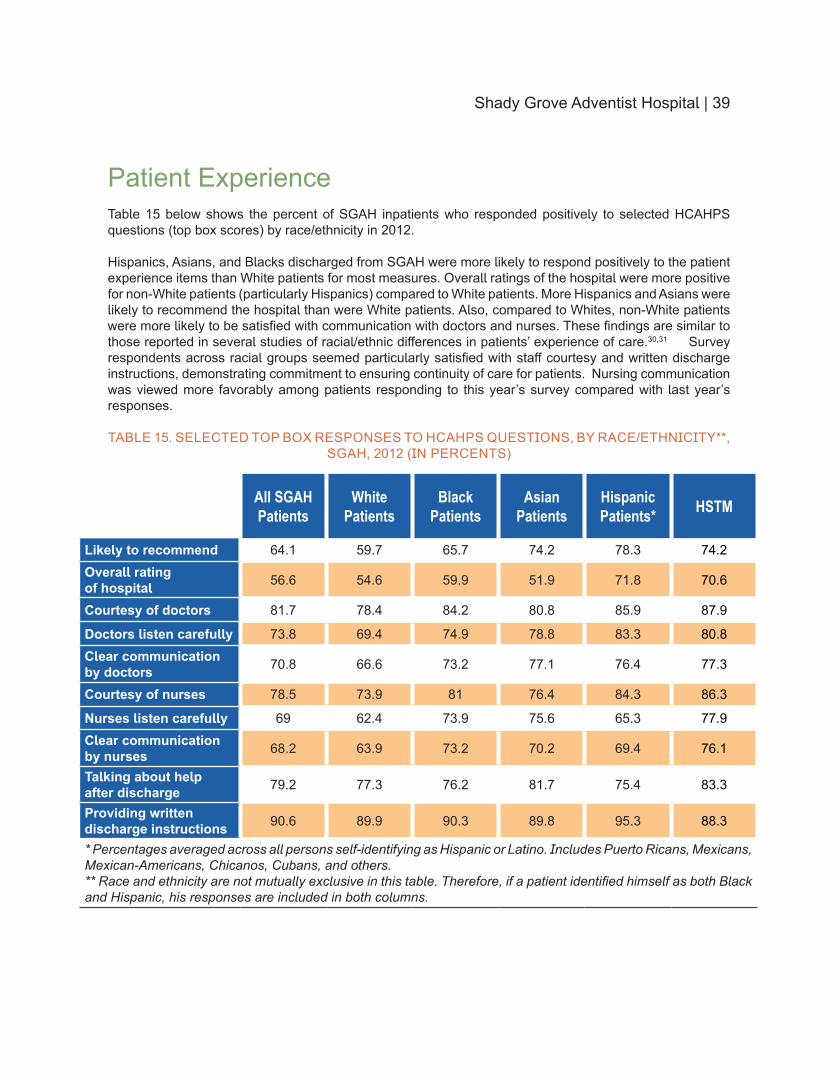
Patient ExperienceTable 15 below shows the percent of SGAH inpatients who responded positively to selected HCAHPS questions (top box scores) by raceethnicity in 2012
Hispanics Asians and Blacks discharged from SGAH were more likely to respond positively to the patient experience items than White patients for most measures Overall ratings of the hospital were more positive for non-White patients (particularly Hispanics) compared to White patients More Hispanics and Asians were likely to recommend the hospital than were White patients Also compared to Whites non-White patients were more likely to be satisfied with communication with doctors and nurses These findings are similar to those reported in several studies of racialethnic differences in patientsrsquo experience of care3031 Survey respondents across racial groups seemed particularly satisfied with staff courtesy and written discharge instructions demonstrating commitment to ensuring continuity of care for patients Nursing communication was viewed more favorably among patients responding to this yearrsquos survey compared with last yearrsquos responses
TABLE 15 SELECTED TOP BOX RESPONSES TO HCAHPS QUESTIONS BY RACEETHNICITY SGAH 2012 (IN PERCENTS)
All SGAH Patients
White Patients
Black Patients
Asian Patients
Hispanic Patients HSTM
Likely to recommend 641 597 657 742 783 742Overall rating of hospital 566 546 599 519 718 706
Courtesy of doctors 817 784 842 808 859 879
Doctors listen carefully 738 694 749 788 833 808Clear communication by doctors 708 666 732 771 764 773
Courtesy of nurses 785 739 81 764 843 863
Nurses listen carefully 69 624 739 756 653 779Clear communication by nurses 682 639 732 702 694 761
Talking about help after discharge 792 773 762 817 754 833
Providing written discharge instructions 906 899 903 898 953 883
Percentages averaged across all persons self-identifying as Hispanic or Latino Includes Puerto Ricans Mexicans Mexican-Americans Chicanos Cubans and others Race and ethnicity are not mutually exclusive in this table Therefore if a patient identified himself as both Black and Hispanic his responses are included in both columns
40 | Shady Grove Adventist Hospital
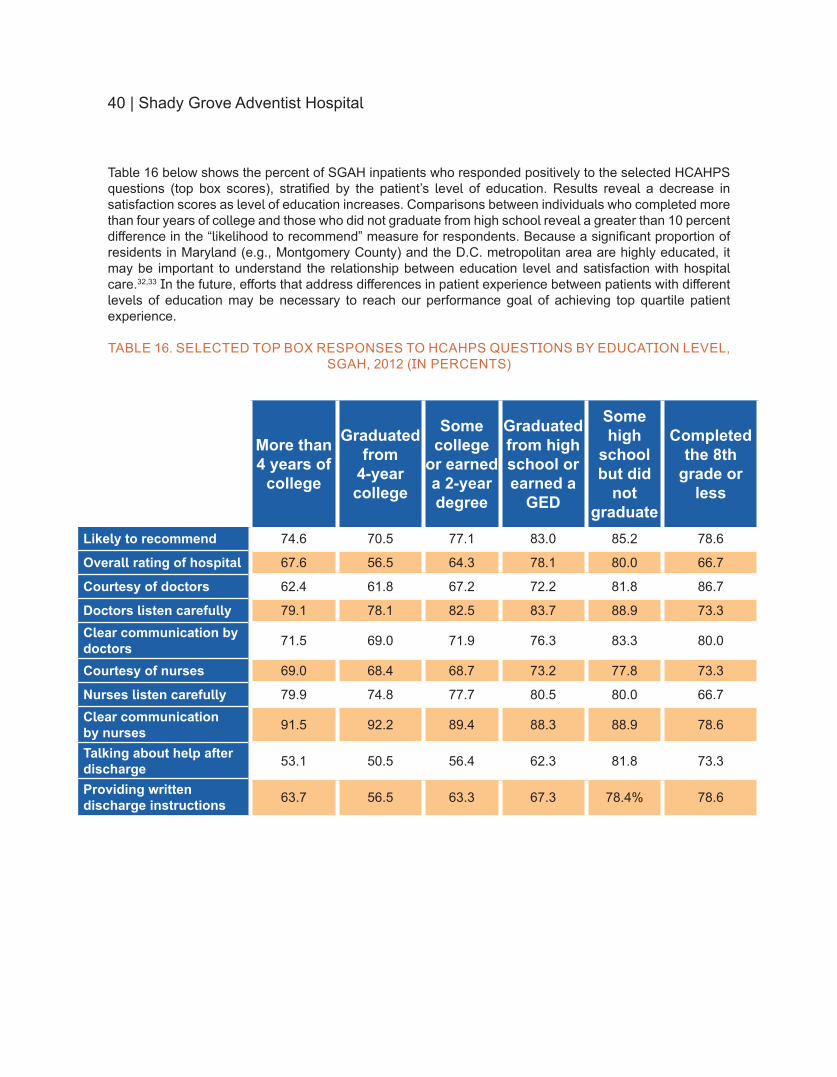
Table 16 below shows the percent of SGAH inpatients who responded positively to the selected HCAHPS questions (top box scores) stratified by the patientrsquos level of education Results reveal a decrease in satisfaction scores as level of education increases Comparisons between individuals who completed more than four years of college and those who did not graduate from high school reveal a greater than 10 percent difference in the ldquolikelihood to recommendrdquo measure for respondents Because a significant proportion of residents in Maryland (eg Montgomery County) and the DC metropolitan area are highly educated it may be important to understand the relationship between education level and satisfaction with hospital care3233 In the future efforts that address differences in patient experience between patients with different levels of education may be necessary to reach our performance goal of achieving top quartile patient experience
TABLE 16 SELECTED TOP BOX RESPONSES TO HCAHPS QUESTIONS BY EDUCATION LEVEL SGAH 2012 (IN PERCENTS)
More than 4 years of
college
Graduated from
4-year college
Some college
or earned a 2-year degree
Graduated from high school or earned a
GED
Some high
school but did
not graduate
Completed the 8th
grade or less
Likely to recommend 746 705 771 830 852 786
Overall rating of hospital 676 565 643 781 800 667
Courtesy of doctors 624 618 672 722 818 867
Doctors listen carefully 791 781 825 837 889 733Clear communication by doctors 715 690 719 763 833 800
Courtesy of nurses 690 684 687 732 778 733
Nurses listen carefully 799 748 777 805 800 667Clear communication by nurses 915 922 894 883 889 786
Talking about help after discharge 531 505 564 623 818 733
Providing written discharge instructions 637 565 633 673 784 786
Shady Grove Adventist Hospital | 41
Office of Minority Health CLAS Standards
In April 2013 the Office of Minority Health of the US Department of Health and Human Services released the Enhanced Culturally and Linguistically Appropriate Services (CLAS) Standards to improve quality eliminate health disparities and advance health equity These standards originally developed in 2000 were updated to reflect growing diversity in the nation and to improve understanding and use of culturally appropriate care at healthcare organizations The revised CLAS standards fall under four categories (1) principal standard (2) governance leadership and workforce (3) communication and language assistance and (4) engagement continuous improvement and accountability
PRINCIPAL STANDARD1) Provide effective equitable understandable and respectful quality care and services that are responsive
to diverse cultural health beliefs and practices preferred languages health literacy and other communication needs
Governance Leadership and Workforce2) Advance and sustain organizational governance and leadership that promotes CLAS and health equity
through policy practices and allocated resources3) Recruit promote and support a culturally and linguistically diverse governance leadership and workforce
that are responsive to the population in the service area4) Educate and train governance leadership and workforce in culturally and linguistically appropriate
policies and practices on an ongoing basis
Communication and Language Assistance5) Offer language assistance to individuals who have limited English proficiency andor other communication
needs at no cost to them to facilitate timely access to all health care and services6) Inform all individuals of the availability of language assistance services clearly and in their preferred
language verbally and in writing7) Ensure the competence of individuals providing language assistance recognizing that the use of
untrained individuals andor minors as interpreters should be avoided8) Provide easy-to-understand print and multimedia materials and signage in the languages commonly
used by the populations in the service area
Engagement Continuous Improvement and Accountability9) Establish culturally and linguistically appropriate goals policies and management accountability and
infuse them throughout the organizationsrsquo planning and operations10) Conduct ongoing assessments of the organizationrsquos CLAS-related activities and integrate CLAS-related
measures into assessment measurement and continuous quality improvement activities11) Collect and maintain accurate and reliable demographic data to monitor and evaluate the impact of
CLAS on health equity and outcomes and to inform service delivery12) Conduct regular assessments of community health assets and needs and use the results to plan and
implement services that respond to the cultural and linguistic diversity of populations in the service area13) Partner with the community to design implement and evaluate policies practices and services to
ensure cultural and linguistic appropriateness14) Create conflict- and grievance-resolution processes that are culturally and linguistically appropriate to
identify prevent and resolve conflicts or complaints15) Communicate the organizationrsquos progress in implementing and sustaining CLAS to all stakeholders
constituents and the general public
For more information about the enhanced CLAS Standards visit httpminorityhealthhhsgovtemplatesbrowseaspxlvl=2amplvlID=15
Adventist Behavioral Health
Adventist Behavioral Health | 43
SPOTLIGHT ON MENTAL HEALTH
Mental health includes emotional psychological and social well-being dealing with how we think and how we feel34 Mental disorders are health conditions that are characterized by alterations in normal cognitive function resulting in a change in mood andor behavior associated with distress andor impaired functioning In any given year one in four adults suffers from a mental health illness in the United States35 One in seventeen live with a serious mental illness such as schizophrenia major depression or bipolar disorder Among children the rates are slightly higher about one in 10 is diagnosed with a serious mental or emotional disorder the most common of which is attention deficit hyperactivity disorder (ADHD) Although an estimated 575 million adults and 96 million children suffer from mental disorders each year in the United States only 362 million Americans account for the $575 billion spent annually on mental health services indicating that many individuals may not be receiving the care they need36 In 2012 approximately 60 percent of adults and nearly half of youth ages 8 to 15 with a mental illness received no mental health services37 The impact of mental illness is far reaching nearly $1932 billion in earnings is lost annually mood disorders such as depression are the third leading cause of hospitalization for youth and adults ages 18 to 44 and suicide is the 10th leading cause of death in the United States
Among Marylandrsquos 56 million residents an estimated 175000 adults and 62000 children live with a serious mental health disorder38 However the proportion of individuals suffering from mental health illness far outweighs the services available Marylandrsquos public mental health system provides services to only 19 percent of adults who live with a serious mental illness Untreated mental illness can have deadly consequences For example in 2006 495 Maryland residents died by suicide which is nearly always the result of untreated or under-treated mental illness
In Montgomery County one in ten residents have been diagnosed with an anxiety disorder a general term used to describe a condition with excessive and unrealistic worrying anxiety and persistent fear3940
About 80 percent of Montgomery County residents report good mental health (ie two or fewer days of poor mental health a month) higher than the state average of 77 percent The level of substance abuse in Montgomery County continues to increase yearly and aligns with the state average In Wicomico County 79 percent of residents report feelings of good mental health41
MENTAL HEALTH DISPARITIES BY RACEETHNICITY
Despite the fact that mental illness is prevalent among racial and ethnic minorities as it is among Whites minorities have less access to and are less likely to use mental health services resulting in a higher proportion of individuals with unmet mental health needs Minority groups are also less likely to seek out mental health counseling and treatment than Whites decreasing their chances of having positive health outcomes Many factors contribute to onersquos overall mental health status including environment financial stability gender and raceethnicity
People are classified as having a serious mental illness if they currently or at any time in the past year had a diagnosable mental behavioral or emotional disorder resulting in substantial impairment in carrying out major life activities43 When stratified by race and ethnicity 53 percent of Whites 37 percent of Blacks and 4 percent of HispanicLatinos suffer from serious mental illnesses These rates of serious mental illness often mirror high rates of illicit drug use and abuse and act as a risk factor for suicide In regards to substance abuse treatment 15 percent of Blacks who needed treatment received it compared to only 7 percent of Hispanics and 2 percent of Asians44 These statistics could be due to barriers such as social stigmas cost of care language mistrust of physicians or poor access to mental health services After age-adjustment Blacks have a suicide rate of 5 per 100000 individuals which is lower than Hispanics (6 per 100000) and nearly half the rate of Whites (125 per 100000)45 The suicide rate for Blacks is 60 percent lower than that of non-Hispanic Whites however the death rate for Black men was almost four times that for Black women in 2009 Asian women have been found to have the highest suicide rates of all women over the age of 65 Among Hispanic girls of high school age suicide attempts were 70 percent higher than
44 | Adventist Behavioral Health
for White girls of the same age in 201146
Blacks have been found to be over-diagnosed with schizophrenia and under-diagnosed with mood disorders While Blacks are less likely to suffer from major depressive disorders they are more likely to rate their depression as severe and disabling47 Blacks are also less likely than Whites to receive mental health treatment at higher income and education levels while Hispanics are less likely to receive mental health treatment than Whites at every income and education level48 According to the Substance Abuse and Mental Health Services Administration poor individuals experience high rates of mental health treatment (158) compared to those who were near poor (128) or those who were not poor (13) underscoring the correlation between poverty and poor mental health49
In 2008 the state of Maryland spent $899 million dollars for mental health services These expenditures allocated to bridge the gap in mental health disparities have risen each year but have continued to fall short of meeting the needs of target populations Marylandrsquos Behavioral Risk Factor Surveillance System showed that minority groups in the state under-utilize mental health services In every age group non-Hispanic Whites are more likely to see a provider for a mental health problem than non-Hispanic Blacks despite having an equal burden Similar to national rates Maryland also reports similar statistics in regards to suicide rates For intentional self-harm 11 percent of Whites compared to 53 percent of Blacks and 91 percent of the overall population report intentionally harming themselves50 In Montgomery County White Medicaid recipients were more likely to receive inpatient outpatient andor professional services for episodic mood disorders (39) than Blacks (35) Hispanics (13) or Asians (58)51 Black Medicaid recipients in the county were more likely to receive support for attention deficit disorder attention deficit hyperactivity disorder and substance abuse than any other racial ethnic group In regards to substance abuse 143 percent of the county residents had reported levels of binge drinking only Whites exceeded the average rate Blacks were more likely to report being current smokers than adults of other racialethnic groups in the county In Wicomico County non-Hispanic Whites were more likely (818) to report positive feelings of mental health than non-Hispanic Blacks (724)52 These rates differ from national statistics This could be the result of changes in social and environmental support experienced by different sub-groups Blacks in Dorchester County experienced the highest rates of emergency department visits because of behavioral health issues (15138 per 100000 individuals) compared with Hispanics (3737 visits per 100000) and Whites (9789 visits per 100000)
ADVENTIST BEHAVIORAL HEALTH
Adventist Behavioral Health (ABH) is the most comprehensive provider of behavioral health services in the National Capital area providing a wide-ranging spectrum of services and treatment options With locations in Montgomery County in Maryland and on the Eastern Shore (ABH-Eastern Shore) of Maryland ABH offers a broad range of services such as acute care residential treatment special education and general education programs chemical dependency programs partial hospitalization programs intensive outpatient services and community-based residential services In addition to a free-standing facility in Rockville services are offered at Washington Adventist Hospital in Takoma Park Services are provided in a variety of settings including hospital-based programs residential treatment centers school programs residential group homes outpatient services and community-based services ABHrsquos inpatient treatment programs provide treatment for a range of mental and behavioral health illnesses including schizophrenia mood disorder post-traumatic stress disorder suicide ideations bipolar disorder and depression
The following tables and figures present more detailed information on patients treated at both the Montgomery County and Dorchester County campuses of ABH in 2012
Adventist Behavioral Health | 45
Snapshot of DiversityThis year patient data from Adventist Behavioral Health (ABH) is included in the Health Equity Report for the first time ABH has facilities in Montgomery County serving patients in Montgomery Prince Georgersquos and Frederick counties (ABH-Rockville) Additionally ABH-Eastern Shore primarily serves the pediatric population of Dorchester and Wicomico counties Due to the very different populations treated at each location most of the data for ABH are presented by location
A total of 3121 unique patients were seen at ABH-Rockville in 2012 Table 17 and Figure 17 below show the distribution of patients by raceethnicity Almost 39 percent of the patients were White and approximately 23 percent of the patients were Black A relatively small percentage of patients identified as Hispanic (7) or Asian (2) In comparison for a relatively large number of patients (collectively almost 30) race was classified as lsquoOtherrsquo or lsquoUnknownrsquo (Note See ldquoAbout the 2013 Health Equity Reportrdquo for details on methodology sources limitations inclusionsexclusions missing data and other information about the data reported here)
TABLE 17 AND FIGURE 17 ALL UNIQUE PATIENTS BY RACEETHNICITY ABH-ROCKVILLE 2012 (N=3121)
RaceEthnicity Percent ()White 386
Black 229
Hispanic 68
Asian 23
Other 125
Unknown 169
Total 100
In 2012 a total of 287 unique patients were seen at ABH-Eastern Shore ABH-Eastern Shore treats children and adolescents only Table 18 and Figure 18 show the racialethnic breakdown of the unique patients treated at ABH-Eastern Shore in 2012 Reflecting the population of the Eastern Shore nearly all of the patients treated at ABH identified as either White (66) or Black (25)
TABLE 18 AND FIGURE 18 ALL UNIQUE PATIENTS BY RACEETHNICITY ABH-EASTERN SHORE 2012 (N=287)
RaceEthnicity Percent ()White 662
Black 251
Hispanic 35
Asian 07
Other 45
Total 100
White 386
Black 229
Hispanic 68
Asian 23
Other 125
Unknown 169
White 662
Black 251
Hispanic 35
Asian 07
Other 45
46 | Adventist Behavioral Health
In addition to the patients seen at ABH-Rockville and ABH-Eastern Shore there were 1688 unique patients classified in their medical record as either a walk-in or call-in and not associated with either location Including these patients there was a combined total of 7635 patient encounters for all of ABH (multiple visits at Rockville and Eastern Shore locations and call-inswalk-ins) in 2012 The racialethnic composition of ABH patients representing all encounters is presented in Table 19 and Figure 19 below As most of the ABH patient volume can be attributed to patients treated at the Rockville location the racialethnic composition seen in Table 19 and Figure 19 is fairly similar to the data seen in Table 17 and Figure 17
TABLE 19 AND FIGURE 19 ALL PATIENT ENCOUNTERS BY RACEETHNICITY ABH 2012 (N=7635)
RaceEthnicity Percent ()White 376
Black 218
Hispanic 63
Asian 18
Other 108
Unknown 218
Total 1001 Due to rounding
White 37
Black 22
Hispanic 6
Asian 2
Other 11
Unknown 22
Adventist Behavioral Health - Rockville Campus
Adventist Behavioral Health | 47
Interpreter ServicesFigure 20 shows the most frequently requested languages for interpretation by phone at ABH-Rockville ABH-Rockville placed more than 240 calls exceeding 4300 minutes The vast majority of the calls were for Spanish language interpretation followed by Korean Mandarin and Farsi In addition to the languages highlighted below calls were placed for four additional languages Urdu Tibetan Vietnamese and German (All Others 20) For ABH-Eastern Shore 14 calls were made during 2012 exceeding 200 minutes All of the calls placed by ABH-Eastern Shore were for Spanish interpretation
FIGURE 20 OVER-THE-PHONE INTERPRETER USE BY NUMBER OF CALLS ABH-ROCKVILLE 2012
Spanish 920
Korean 28
Mandarin 20
Farsi 12 All
Others 20 Other
80
Adventist Behavioral Health - Eastern Shore Campus
48 | Adventist Behavioral Health
In-DepthHEALTH INSURANCE AND PRIMARY DIAGNOSIS
Figure 21 below shows health insurance coverage by raceethnicity for all unique patients seen at ABH-Rockville in 2012 Hispanic Black and Asian patients were covered primarily by Medicaid However the majority of White patients were covered by private insurance Interestingly nearly all of the patients for whom raceethnicity was unknown had no insurance coverage
FIGURE 21 HEALTH INSURANCE COVERAGE BY RACEETHNICITY FOR ALL UNIQUE PATIENTS ABH-ROCKVILLE 2012 (N=3121)
Table 20 below shows health insurance coverage by raceethnicity for all unique patients seen at ABH-Eastern Shore in 2012 As the table shows most of the patients about 67 percent overall were covered by Medicaid Approximately 64 percent of White patients and 75 percent of Black patients had Medicaid as a primary insurer ABH-Eastern Shore treats children and adolescents only therefore Medicare is not a payer
0
10
20
30
40
50
60
70
80
90
100
Hispanic White Black Asian Other Unknown
All OthersPrivateMedicareMedicaidSelf-Pay (Uninsured)
Adventist Behavioral Health | 49
TABLE 20 HEALTH INSURANCE COVERAGE BY RACEETHNICITY FOR ALL UNIQUE PATIENTS ABH-EASTERN SHORE 2012 (N=287)
Hispanic () White () Black () Asian () Other ()
Medicaid 700 642 750 0 769
Private 300 358 250 100 231
Total 100 100 100 100 100
PRIMARY DIAGNOSIS
The Diagnoses tables below show the primary diagnoses of unique patients seen at ABH in 2012 This table shows only the first visit per each unique patient Therefore it is possible that different diagnoses were made for patients with multiple visits in 2012 Also there were often secondary or tertiary diagnoses that are not reflected in the tables below
Table 21 below describes the primary diagnoses for patients treated at ABH-Rockville in 2012 The most common primary diagnosis was lsquoepisodic mood disordersrsquo Mood disorders are characterized by persistent feelings of sadness or fluctuations from extreme happiness to extreme sadness Mood disorders include bipolar episodes and depressive episodes Schizophrenic disorders account for approximately 11 percent of the patients seen For nearly one quarter of patients treated the medical record does not include any information on the primary diagnosis
TABLE 21 PRIMARY DIAGNOSES OF PATIENTS TREATED AT ABH-ROCKVILLE 2012 (N=3121)
Primary Diagnosis Percent ()Schizophrenic Disorders 106
Episodic Mood Disorders 521
Psychosis (Unspecified) 53Alcohol or drug dependence or alcohol or drug abuse (non-dependent) 31
Depressive Disorder not elsewhere classified 55
Other 04
Unknown (No information in medical record) 229
Total 999 ()Due to rounding
Table 22 shows the primary diagnoses for unique patients treated at ABH-Rockville stratified by raceethnicity Black patients were most likely to be diagnosed with a schizophrenic disorder (about 18) compared to 15 percent or less for all other racialethnic groups For all races episodic mood disorders accounted for the majority of the diagnoses Asian patients were most likely to be diagnosed with unspecified psychosis and Hispanic patients were most likely to be diagnosed with depressive disorder (not elsewhere classified) The percentage of patients without a diagnosis recorded in their medical record ranged from about 8 to 10 percent for patients of all races
50 | Adventist Behavioral Health
TABLE 22 PRIMARY DIAGNOSES BY PATIENT RACEETHNICITY ABH-ROCKVILLE 2012 (N=3121)
Hispanic White Black Asian Other UnknownSchizophrenic Disorders 70 110 182 153 110 00
Episodic Mood Disorders 620 660 557 556 665 02
Psychosis (Unspecified) 56 42 91 125 72 00
Alcohol or drug dependence or alcohol or drug abuse (non-dependent)
33 42 46 28 15 00
Depressive Disorder not elsewhere classified
127 62 45 42 92 00
Other 14 04 03 00 05 00
Unknown 80 80 76 97 41 998
Total 100 100 100 100 100 100
Table 23 shows the primary diagnoses for all unique patients treated at ABH-Eastern Shore ABH-Eastern Shore treats children and adolescent patients only The most common diagnosis among the patients was episodic mood disorders (55) The second most common diagnosis was attention deficit hyperactivity disorder (12) For ABH-Eastern Shore patients the diagnoses that are included in lsquoOtherrsquo include the following unspecified psychosis anxiety disorder bulimia and emotional disturbances For two patients there was no diagnosis included in the medical record
TABLE 23 PRIMARY DIAGNOSES OF PATIENTS TREATED AT ABH-EASTERN SHORE 2012 (N=287)
Primary Diagnosis Percent ()Episodic Mood Disorders 551
Adjustment Reactions including PTSD 91
Depressive Disorder not elsewhere classified 101
Disturbance of Conduct not elsewhere classified 49Attention Deficit Disorder (Child) with Hyperactivity or Hyperkinetic syndrome 118
Other 84
Unknown (No information in medical record) 07
Total 1001Due to rounding
Adventist Behavioral Health | 51
Table 24 shows the primary diagnoses for unique patients treated at ABH-Eastern Shore stratified by patient raceethnicity As Table 18 showed above more than 90 percent of the ABH-Eastern Shore patients were White or Black therefore the percentages reported in Table 24 for Hispanic patients (N=10) and Asian patients (N=2) are inflated For both White and Black patients episodic mood disorders were the most common diagnoses Comparatively White patients were more likely to be diagnosed with depressive disorder and Black patients were more likely to be diagnosed with disturbance of conduct
TABLE 24 PRIMARY DIAGNOSES BY PATIENT RACEETHNICITY ABH-EASTERN SHORE 2012 (N=285)
Hispanic White Black Asian OtherEpisodic Mood Disorders 500 534 569 1000 750
Adjustment Reactions including PTSD
300 85 97 00 00
Depressive Disorder not elsewhere classified
200 122 42 00 83
Disturbance of Conduct not elsewhere classified
00 37 97 00 00
ADD (Child) with Hyper-activity or Hyperkinetic syndrome
00 127 111 00 167
Other 00 95 83 00 00
Total 100 100 999 100 100Due to rounding
52 | Adventist Behavioral Health
Selected Quality Measures for Adventist Behavioral Health The Hospital-Based Inpatient Psychiatric Servicersquos (HBIPS) Core Measure Set consists of seven measures to assess quality of care for patients discharged from free-standing psychiatric hospitals and acute-care hospitals with psychiatric units The following five measures are reported by race only in Table 25 (HBIPS 2 and HBIPS 3 which apply to hours in physical restraint and hours in seclusion were not included)
HBIPS 1 ndash Admission screening for violence risk substance use psychological trauma history and patient strengths completed
HBIPS 4 - Patient discharged on multiple antipsychotic medications
HBIPS 5 ndash Patient discharged on multiple antipsychotic medications with appropriate justification
HBIPS 6 ndash Post discharge continuing care plan created
HBIPS 7 ndash Post discharge continuing care plan transmitted to next level of care provider upon discharge
For HBIPS 1 there was nearly 100 percent compliance for all patients For HBIPS 4 and 5 there was more variation between patients from different racial groups For example more than 30 percent of Asian patients were discharged on multiple antipsychotic medications compared to 15 percent of White patients and 2 percent of Black patients However all patients had higher percentages of being discharged on multiple medications with appropriate justification (HBIPS 5) For White Black and Asian patients a post-discharge continuing care plan was created more than 90 percent of the time (HBIPS 6) However that plan was not always transmitted to the next level-of-care provider upon the patientsrsquo discharge (HBIPS 7)
TABLE 25 HBIPS QUALITY MEASURES BY RACE ALL PATIENTS ABH-ROCKVILLE 2012 (IN PERCENTS)
HBIPS 1 HBIPS 4 HBIPS 5 HBIPS 6 HBIPS 7White 999 149 650 907 865
Black 996 16 775 908 867
Asian 100 315 765 929 894
Specialty Care
54 | Specialty Care
Adventist Home Care ServicesSNAPSHOT OF DIVERSITY
Adventist Home Care Services (AHCS) a part of Adventist HealthCare Inc (AHC) offers a variety of programs and services to residents in the Washington DC metropolitan area and suburban Maryland to assist patients while they recuperate from an illness injury or surgical procedure They offer a full range of supportive services to assist with personal care or daily activities Among the services that they provide are nursing (eg cardiac care wound care diabetes management and medication management) rehabilitation (eg physical therapy and occupational therapy) and maternalchild services (eg lactation support phototherapy etc) The services provided allow patients to receive assistance upon discharge from a hospital or even prevent an initial admission to a hospital Many avoidable hospital readmissions are related to a lack of support and resources upon discharge from the hospital5354 With these and other services AHCS plays a vital role in filling these gaps and ensuring a continuum of care for patients With proper discharge planning and access to appropriate medicalclinical support resources patients are more likely to experience positive outcomes which may reduce the need for inpatient care As AHC continues to shift toward a population health approach home care services will provide critical support to address the health needs of people in the communities we serve
Table 26 below shows the patients who received AHCS services in 2012 More than 5700 unique patients received services in 2012 These patients accounted for more than 77035 visits during 2012 Table 25 shows the breakdown of unique AHCS patients by raceethnicity Just more than half of the patients were White (51) and 35 percent were Black Hispanic patients and Asian patients accounted for 7 percent and 6 percent of patients respectively (Note See ldquoAbout the 2013 Health Equity Reportrdquo for details on methodology sources limitations inclusionsexclusions missing data and other information about the data reported here)
TABLE 26 ALL UNIQUE PATIENTS BY RACEETHNICITY AHCS 2012 (N=5736)
RaceEthnicity Percent ()White 508
Black 349
Hispanic 70
Asian 64
Other 07
Unknown 03
Total 1001Due to rounding
PRIMARY DIAGNOSIS AND HEALTH INSURANCE
More than half of AHCS patients were diagnosed as being ldquonot currently sickrdquo or having a ldquoproblem that influenced their health statusrdquo which includes being in a post-procedural state having problems with limbs having motor or sensory problems and receiving dialysis (ICD 9 codes V40-V82) Other prevalent diagnoses included diseases of the circulatory system skin and subcutaneous tissue and musculoskeletal system
Specialty Care | 55
Table 27 shows primary health insurance coverage for unique patients who received AHCS services We are not able to report this information by patient raceethnicity However the data shows that the majority of patients (64) and visits (75) were covered by Medicare Nearly all of the remaining patients were covered by private insurance including health maintenance organizations (HMOs) Less than 4 percent of all patients and 3 percent of all visits were covered by Medicaid or the patient (uninsured) This data suggests that community members without private insurance who are not Medicare eligible may face significant barriers to accessing the services provided by AHCS However it is notable that AHCS had more than 300 charity visits during 2012
TABLE 27 HEALTH INSURANCE COVERAGE FOR ALL UNIQUE PATIENTS AHCS 2012 (N=5736)
Unique Patients ()
Visits () (N=77035)
Medicare 638 747
Medicaid 32 24
PrivateHMO 327 228
Self-Pay (Uninsured) 03 02
Total 100 1001Due to rounding
Of all the visits that AHCS made in 2012 skilled nursing services and physical therapy accounted for the vast majority of services provided to patients (almost 85) The third and fourth most common services were home health aide and occupational therapy services Other services included speechlanguage and medical social work
INTERPRETER SERVICES
Figure 22 shows the languages requested most frequently for interpretation by phone at AHCS AHCS placed more than 280 calls exceeding 3300 minutes As seen in Figure 22 the vast majority of calls placed were for Spanish the second and third most requested languages were Mandarin and Korean In addition to the languages highlighted below calls were placed for seven additional languages including Amharic and Russian (All Others 32)
FIGURE 22 OVER-THE-PHONE INTERPRETER USE BY NUMBER OF CALLS AHCS 2012
Spanish 929
Mandarin 21
Korean 18
All Others 32
Other 71
56 | Specialty Care
Adventist Rehabilitation Hospital of MarylandSNAPSHOT OF DIVERSITY
Adventist Rehabilitation Hospital of Maryland (ARHM) is the first and only acute rehabilitation hospital in Montgomery County offering specialized inpatient and outpatient treatment for persons with functional limitations ARHM primarily serves adults 18 years or older who largely reside in Montgomery County (78) or Prince Georgersquos County (18)
ARHM has two hospital locations a free-standing 55-bed hospital adjacent to SGAH in Rockville and a 32-bed hospital located in WAH in Takoma Park Outpatient services are provided at both the Rockville location and a community-based center in Silver Spring Maryland
ARHM offers comprehensive rehabilitation programs for traumatic brain injuries spinal cord injuries strokes amputations orthopedic injuries and surgeries sports related injuries work-related injuries cardiopulmonary conditions and neurological disorders Currently ARHM is the only acute rehab facility within a five-state region with a Commission on Accreditation Facilities (CARF) accreditation for all four of its specialty programs stroke brain injury spinal cord injury and amputee It was one of the first acute rehabilitation facilities in the nation to earn specialty accreditation for its amputee program Further ARHM was recognized in 2013 by the Maryland Patient Safety Center (MPSC) for its innovative patient safety program to reduce acute-care readmissions and increase patient safety Like AHCrsquos other specialty entities the specialized services provided by ARHM illustrate the organizationrsquos commitment to population-based care and dedication to improve the overall health and well-being of the communities we serve
Approximately 1500 unique inpatients were treated at ARHM in 2012 The stratification of these patients by raceethnicity is illustrated in Table 28 below Data on outpatients are not presented here The majority of inpatients treated at ARHM (about 58) were White The percentage of White patients is nearly double the percentage of Black patients who account for about 30 percent of the patient population Hispanic patients and Asian patients account for nearly 6 and 7 percent of the remaining patients respectively (Note See ldquoAbout the 2013 Health Equity Reportrdquo for details on methodology sources limitations inclusionsexclusions missing data and other information about the data reported here)
TABLE 28 ALL UNIQUE PATIENTS BY RACEETHNICITY ARHM 2012 (N=1571)
RaceEthnicity Percent ()White 575
Black 300
Hispanic 57
Asian 66
OtherUnknown 02
Total 100
Specialty Care | 57
HEALTH INSURANCE
Table 29 below shows health insurance coverage for inpatients seen at ARHM for 2012 Sixty-two (62) percent of inpatients were covered by Medicare while 30 percent had private or commercial insurance Less than 10 percent of inpatients were covered by Medicaid or were uninsured
TABLE 29 HEALTH INSURANCE COVERAGE FOR ALL UNIQUE PATIENTS ARHM 2012 (N=1571)
Percent ()Private Insurance 291
Medicare 619
Medicaid 70
All Others 16
Self-Pay (Uninsured) 04
Total 100
INTERPRETER SERVICES
Figure 23 shows the languages most frequently requested for phone interpretation at ARHM ARHM placed more than 870 calls in 2012 exceeding 14300 minutes Spanish was the most frequently requested language at about 53 percent Mandarin was the second most requested language at almost 25 percent Russian and Farsi were the third and fourth most requested languages respectively In addition to the languages included in Figure 23 calls were placed for an additional 14 languages including Tagalog and Gujarati (All Others 38)
FIGURE 23 OVER-THE-PHONE INTERPRETER USE BY NUMBER OF CALLS ARHM 2012
Spanish 529
Mandarin 248
Russian 49
Farsi 34
Haitian Creole 29
Cantonese 26
Vietnamese 24
Korean 23
All Others 38
Other 174
Affordable Care Act Implementation in the State of Maryland
Maryland Governor Martin OrsquoMalley signed into law the Maryland Health Improvement and Disparities Reduction Act of 2012 to expand access to care reduce chronic illness and promote equity particularly in underserved areas known as Health Enterprise Zones (HEZs) The HEZ initiative was created to reduce racial and ethnic health disparities improve health care access and outcomes in underserved populations and reduce hospital readmissions Five locations in Maryland designated as health enterprise zones in 2013 will receive a range of incentives benefits and grant funding to address disparities MedStar St Maryrsquos Hospital Greater Lexington Park (St Maryrsquos County) Prince Georgersquos County Health Department Capital Heights Dorchester County Health Department Dorchester and Caroline counties Bon Secours Baltimore Health System West Baltimore and Anne Arundel Health System Annapolis For additional information about the HEZ initiative and specific proposals visit httpdhmhmarylandgovhealthenterprisezonesSitePagesUpdatesaspx
Marylandrsquos law to reduce health disparities includes requirements for health care organizations to collect standard categories of race and ethnicity and report efforts to track and reduce disparities In 2013 the Health Services Cost Review Commission of the Maryland Department of Health and Mental Hygiene (HSCRC) provided funding to the Center on Health Disparities at Adventist HealthCare to provide race ethnicity and language data collection training to Maryland hospital staff including patient registrars quality coordinators admission directors and leadership The Center and the Institute for Patient- and Family-Centered Care (IPFCC) in partnership with HSCRC and the Maryland Hospital Association (MHA) held three Train-the-Trainer sessions on how to collect and use patient data and address patientsrsquo concerns at MHA in Elkridge (Central Maryland) Shore Health System The Memorial Hospital at Easton (Eastern Maryland) and Frederick Memorial Hospital in Frederick (Western Maryland) Training sessions such as these serve as a valuable resource to hospital leadership and staff as they strive to be in compliance with data reporting requirements outlined by HSCRC Standardized collection of patient demographic data is important to inform quality improvement efforts address needs of vulnerable populations and ultimately reduce disparities Through the collaborative work of all the partners on this project hospitals across the state are now well-equipped to collect accurate data and provide the highest quality care to all residents of the state of Maryland
Efforts to Reduce Readmissions
60 | Efforts to Reduce Readmissions
BACKGROUND As a part of its strategic plan for 2010ndash2014 Adventist HealthCare (AHC) has employed a strategy of providing population-based care to the communities it serves Through the use of innovative and patient-centered discharge processes and the cultivation of community partnerships AHC has become a leader in its efforts to ensure patient wellness after discharge from its hospitals ldquoNearly one in five Medicare patients discharged from a hospitalmdashapproximately 26 million seniorsmdashis readmitted within 30 days at a cost of over $26 billion every yearrdquo55 While not all readmissions can be predicted or prevented it is estimated that more than $17 billion each year pays for readmissions that are in fact preventable56
Adventist Rehabilitation Hospital of Maryland (ARHM) and AHCrsquos acute-care hospitalsmdashShady Grove Adventist Hospital (SGAH) and Washington Adventist Hospital (WAH)mdashparticipate in the Partnership for Patients a CMS program with goals to improve patient safety and support effective transitions from hospitals to other settings57 Our hospitals are part of Premierrsquos Hospital Engagement Network (HEN) a collaborative of 450 hospitals and the largest CMS-approved HEN in the nation The HEN focuses on multiple areas that affect patient safety including preventable hospital readmissions HEN rates are calculated using the Admission-Readmission Revenue (ARR) method giving credence to Marylandrsquos modernized all-payer rate-setting system for hospital services an unprecedented effort to enhance care for patients improve health care outcomes and control costs across the state58 Participation in the HEN provides significant opportunities to exchange best practices among hospitals across the country to address care and safety for Medicare program participants Because of AHCrsquos commitment to quality and safety and its partnership with Walgreens Premier invited WAH to present their efforts at their annual Breakthroughs Conference in November 2013
A CALL TO ACTION
The need for action around reducing preventable readmissions has recently been reinvigorated with a sense of urgency due to new provisions in the Patient Protection and Affordable Care Act (ACA) The Medicare Readmission Reduction program which went into effect October of 2012 reduced payments up to one percent for hospitals with excess preventable readmission rates related to heart failure acute myocardial infarction and pneumonia59 This deduction will increase to two percent in 2014 and peak at three percent in 2015 while also expanding to conditions including chronic obstructive pulmonary disease and coronary bypass grafting In addition to financial penalties for doing poorly new Medicare policies have been instituted to provide financial rewards to those hospitals that are meeting or exceeding certain quality measures Several of these quality measures focus on discharge practices such as informing patients of symptoms to look out for post-discharge and inquiring if they will have the necessary help and support once they return home60
A high rate of preventable readmissions is often a complex problem stemming from multiple causes and therefore requires a multifaceted approach to remedy Over the past two years WAH has successfully implemented programs to enhance the discharge process for all patients adopted an added focus on high-risk patients and cultivated community partnerships to improve the continuum of care post-discharge Through its efforts WAH has seen a 45 percent reduction in readmissions decreasing from 11 percent in December of 2011 to 65 percent in September of 2013
At the same time SGAH has implemented programs to assist in the post-discharge care of high-risk patients partnering with post-acute care providers and using a disease-specific model to address the most vulnerable patients SGAH has seen a 107 percent reduction in readmissions decreasing from 683 percent in December of 2011 to 576 percent in August of 2013 The hospital continues to work on other disease specific initiatives to reduce readmissions
Efforts to Reduce Readmissions | 61
ARHM was recognized in 2013 by the Maryland Patient Safety Center (MPSC) for its innovative patient safety program to reduce acute-care readmissions and increase patient safety ARHM instituted new processes in the fall of 2010 to decrease the number of patients readmitted to acute-care hospitals by implementing a collaborative clinical review of each patient throughout the transfer process According to the hospitalrsquos medical director the program has resulted in fewer patients returning to acute-care hospitals and more patients being discharged home Nationally their ldquodischarge to homerdquo rates are in the 80th percentile (ie better than 80) of all hospitals in the country
In collaboration with partners Carelink Community Clinic Inc Family Services Inc and WAH Adventist Behavioral Health (ABH) is working to better serve the chronically mentally ill by providing necessary support in the community and expanding outpatient services ABH has increased its outreach to the community using multiple approaches to engage families in the treatment process From family days to providing transportation to treatment centers and using videoconferencing technologies these efforts have increased familiesrsquo access to patients contributed to positive treatment outcomes and reduced the incidence of readmission
OVERVIEW OF PROGRAMS
Enhancing the Discharge Process
Following discharge patients often return home feeling overwhelmed and unsure of next steps In order to simplify the transition AHC has been working to ensure that all discharged hospital patients who need support with follow-up care receive assistance with finding a physician and scheduling a primary care appointment before they leave the hospital For instance ABH is working with payers to establish what are known as ldquobridgerdquo services for individuals who have difficulty scheduling follow-up outpatient care within seven days Through a partnership with Walgreens both WAH and SGAH have been able to ensure that patients can easily fill prescriptions and speak to a pharmacist prior to discharge
The Walgreens Bedside Prescription Delivery Service initiated in June of 2011 is available to all inpatients and includes a follow-up call from the pharmacist within 48ndash72 hours of discharge During the follow-up call the pharmacist is able to answer questions about medications and provide additional patient education Among those patients taking part in this program there has been an increase in medication compliance and as a result improved health status and fewer emergent needs This patient resource has also contributed to reducing readmissions thus helping individuals stay well and complete a prescribed medication course Additional resources for patients are available as needed to assess and support patientsrsquo discharge needs (eg resources to address behavioral health needs outpatient case management and help with transition to adult day care)
Also both WAH and SGAH are enrolled as 340B outpatient pharmacy programs with Walgreens Through this federal program which provides reduced pricing for most drugs money is returning to the hospitals to be applied toward the cost of medication for underserved patients
Adopting an Added Focus on High-Risk Patients
Each patient receiving care at AHC hospitals varies both in their condition and in the resources and support to which they have access In order to ensure that those with more complex conditions and circumstances have the added support they need when they leave the hospital hospital staff (including nurse managers case managers and transition care team members) identify patients at high-risk for readmission and then provide appropriate follow-up care
62 | Efforts to Reduce Readmissions
Patients identified as high-risk (eg non-adherent to recommendations having multiple co-morbidities diagnosed with congestive heart failure or lacking a support system or resources) are able to benefit from multiple programs designed to help navigate the road to recovery SGAH and WAH participate in the WellTransitions Program (in partnership with Walgreens) which provides high-risk patients with three follow-up calls from a pharmacist within 30 days of leaving the hospital During these follow-up calls pharmacists are able to address questions around prescribed hospital medications home medications side effects dosage and any additional health issues the patient may have In addition both hospitalsmdashtogether with Adventist Home Care Services (AHCS)mdashhave developed the Healthy Heart at Home program that focuses on patients with congestive heart failure Pill boxes and scales are provided to patients to help them better manage their disease A cardiac nurse assists patients with education family support nutrition and medication management as well
In 2013 WAH and partner Conifer Health Solutions launched the My Health Placereg program which utilizes the model of a personal healthcare nurse Through this program the transitional care team ensures that all discharged high-risk patients have a scheduled follow-up appointment before leaving the hospital Each of these patients receives a My Health Placereg Passport booklet which includes the name and number of their doctor as well as the date time and location of their follow-up appointment Additional helpful information such as a phone number to call with questions reminders of what to bring to the follow-up appointment the duration of the hospital stay and the procedures that were performed is also included The Passport is available in English Spanish French and Amharic In addition to providing patients with a Passport a member of the care team meets with each patient prior to discharge and conducts three follow-up calls within 30 days of leaving the hospital The care team implements individualized interventions often meeting the needs of patients within one week of discharge Interventions may include support for a spouse or loved one assistance with sub-acute placement referrals to wound care to avoid unnecessary readmission home health services transition to a nursing home or hospice care and arranging transportation
Developing Community Partnerships
AHC fosters partnerships with community members and organizations to improve care transitions for discharged patients A Community Coalition to Improve Care Transitions was initially established as a method for each hospital to begin thinking outside the box to develop care coordination solutions for patients and reduce readmissions The coalition at WAH launched in March of 2013 has since grown into a partnership between 35 different health services throughout the community with a mission to improve the transition of care from hospital to community for residents of the region The partners meet monthly to collaboratively and creatively solve patient challenges with an aim to reduce preventable readmissions at acute-care hospitals by 20 percent over a three year period
At SGAH the coalition to develop and strengthen partnerships among providers serves patients throughout the greater community In May of 2013 the coalition began meeting quarterly with an aim to reduce readmissions by 10 percent over the following 12 months SGAH has several other successful partnerships in place through which they are able to offer patients invaluable resources (eg ranging from transportation to outpatient case management) to improve their health and primary care following discharge
In order to reach those in need of health care before they even come to the emergency department AHC has developed direct partnerships with three local housing facilitiesmdashand a fourth in progressmdashto provide accessible primary care Through these partnerships AHC has increased access to primary care services for elderly and underserved populations who otherwise may have gone without care
Efforts to Reduce Readmissions | 63
FUTURE DIRECTIONS
While it is difficult to determine the impact of programs to reduce readmissions both WAH and SGAH have been successful in achieving an overall reduction in readmission rates over the course of one and a half years Going forward AHC will continue to grow its readmission reduction initiatives and community partnerships while also expanding its focus to outpatient care Beginning in 2014 efforts will be put in place at WAH to address the needs of individuals who pay frequent visits to the emergency department One such program will assist patients with becoming better advocates for their own health Individuals at high risk for emergency department visits or for not following through with doctor appointments will be matched with volunteer health coaches These coaches will be available to accompany patients to their doctor appointments
Looking forward for SGAH greater emphasis will be put on addressing needs of uninsured and homeless patients Potential efforts include a partnership with the Montgomery County Agency on Aging to increase medical beds and funding for uninsured and homeless patients needed for short-term rehabilitation or continued treatment Additionally Shady Grove would like to obtain funding for increased community case management to assist with medication refills physician follow-up and compliance with treatments for homeless county residents
Conclusion and Next Steps
Conclusion and Next Steps | 65
Conclusion and Next Steps The Institute for Healthcare Improvementrsquos Triple Aim for improving the US healthcare system focuses on improving patient experience reducing costs for the population and improving the health of the community61 Meeting these strategic aims to achieve health equity requires targeted efforts that ldquoeliminate potentially avoidable differences or disparities in health between socially advantaged and disadvantaged groupsrdquo62
The 2013 Adventist HealthCare Health Equity Report presents a comprehensive snapshot of the patient populationsmdashstratified by race ethnicity and preferred languagemdashthat received care at Washington Adventist Hospital (WAH) and Shady Grove Adventist Hospital (SGAH) in 2012 In addition we include data from specialty care entities Adventist Behavioral Health Adventist Rehabilitation Hospital of Maryland and Adventist Home Care Services The report presents patient demographics and information about hospital readmissions quality measures primary diagnoses patient experiences with care and use of interpreter services for different populations receiving care at Adventist HealthCare hospitals and other entities
At the end of last yearrsquos Health Equity Report we offered a set of recommendations for hospitals and healthcare systems to improve quality of care and outcomes
1 Improve patient demographic data collection and increase transparency by reporting hospital performance data by race ethnicity and language preference data
2 Monitor differences in quality of care and healthcare outcomes to inform hospitalsrsquo strategic goals develop community outreach programs and target quality improvement efforts
3 Implement data-driven interventions to improve healthcare quality and outcomes
4 Promote the provision of culturally competent patient-centered care
This yearrsquos report highlights specific initiatives at Adventist HealthCare (AHC) to connect mission-driven strategies with quality and patient experience transitions in care and partnerships to improve outcomes for people and communities AHC has implemented various strategies to identify and monitor differences in health status that lead to inequalities in care among minority populations (Recommendations 2-3) In the summer of 2013 the Center on Health Disparities partnered with the Institute for Patient- and Family-Centered Care Maryland Hospital Association and the Health Services Cost Review Commission (HSCRC) to provide raceethnicity and language data collection training to Maryland hospitals in order to ensure accurate data collection and compliance with state data reporting requirements (Recommendations 1 4) Hospitals equipped with the knowledge and resources to collect use and monitor standardized patient demographic data are able to implement data-driven interventions that align with identified community health needs and enhance community benefit reporting Along with information from this report and findings from needs assessments AHC will be able to assess its progress at addressing disparities and community health needs and promoting culturally competent care (Recommendations 2 4) AHCrsquos community health needs assessment reports and implementation plans for its hospitals and other entities will be publicly available by the end of this year and early next year Next steps will include rolling out initiatives to address the needs and concerns of individuals and populations in the healthcare systemrsquos service areas (Recommendation 3)
Hospitals are embracing the idea of better managing ldquotransitions of carerdquo and ensuring that patients experience a smooth transition from inpatient to outpatient care Population-based care and access to care are important strategic goals for Adventist HealthCarersquos hospitals these goals are informed by community input and quality improvement efforts focused on improving the health of people in our communities (Recommendation 2) Specifically collaborative population-based initiatives such as the Community Coalitions to Improve Care Transitions patient and family engagement and patient safety programs have been effective at improving outcomes and reducing preventable hospital readmissions (Recommendation 4)
66 | Conclusion and Next Steps
In our last report we stated that effective patient-provider communication is essential to providing high-quality patient-centered care and is necessary for patient safety Patient experience data collected from patients who speak a language other than English is an important part of providing population-based care and demonstrates compliance with national standards for effective communication in health care In the third quarter of 2013 WAH began conducting patient experience surveys with limited English-proficient patients in response to the growing proportion of Hispanic patients being served there Patient-provider communication is a key factor in perceived experience of care Also patient-centered culturally appropriate discharge instructions are critical tools that help patients understand next steps for follow-up care upon leaving the hospital which factors into our ability to provide the best care possible (Recommendation 4) Next steps might include analysis of patient experience data in specific departments implementing culturally competent population-based initiatives
Information beyond race and ethnicity are important indicators to measure to ensure that patientsrsquo needs are met (Recommendations 1ndash3) Key indicators of interest might include age gender sexual orientation income education insurance status religion health status and disability status In some cases it may be necessary to survey specific samples of people from different populations using various methods (ie using online surveys vs paper or phone surveys) to assess perceptions of organizational cultural competence or the effectiveness of programs and initiatives (eg interpreter services)
In conclusion achieving health equity will require shifting the focus beyond access and health care delivery to quality and appropriateness of care as well as addressing disparities and numerous factors that play a role in shaping population health outcomes We encourage leadership in our hospitals and other healthcare organizations to use valuable hospital data and information about community needs to shift their focus to population health health equity and healthcare quality improvement
References
68 | References
References1 Braveman P (2006) Health disparities and
health equity Concepts and measurement Annual Review of Public Health 27(1) 167ndash194
2 Kindig D (2007) Understanding Population Health Madison Blackwell Publishing
3 Kindig D amp Stoddart G (2003) What is population health American Journal of Public Health 380ndash383
4 Center on Health Disparities 2010 Progress Report Partnering Toward a Healthier Future Social Determinants of Health Adventist HealthCare Inc Rockville MD
5 Office of Minority Health and Health Disparities (2012) Maryland Chartbook of Minority Health and Health Disparities Data 2012 Third edition Maryland Department of Health and Mental Hygiene Retrieved from httpdhmhmarylandgovmhhdSitePagesHealth20Equity20Dataaspx
6 Whitehead M (1992) The concepts and principles of equity in health International Journal of Health Services 22(3) 429ndash445
7 Institute of Medicine (2003) Unequal treatment Confronting racial and ethnic disparities in health care Washington DC The National Academies Press
8 Agency for Healthcare Research and Quality (2012) National Healthcare Disparities Report (13-0003) US Department of Health amp Human Services Retrieved from wwwahrqgovresearchfindingsnhqrdrindexhtml
9 May E L (2013) Population health management Defining the providerrsquos role Healthcare Executive 20ndash29
10 Stoto M A (2013) Population health in the Affordable Care Act era Academy Health 1ndash6
11 Center on Health Disparities 2011 Progress Report Partnering toward a healthier future Health disparities in the era of reform implementation Adventist HealthCare Inc Rockville MD
12 Ibid 113 US Department of Health and Human
Services (2011) Health equity amp disparities National Partnership for Action to End Health Disparities Retrieved from httpminorityhealthhhsgovnpatemplatesbrowseaspxlvl=1amplvlid=34
14 Ibid 6
15 Morrissey J (2012) 10 facts about population health Trustee 10ndash14
16 Managing population health The role of the hospital Health Research amp Educational Trust Chicago April 2012 Retrieved from wwwhpoeorg
17 Ibid 1618 Centers for Disease Control and Prevention
Chronic diseases The power to prevent the call to control At a glance 2009 US Department of Health amp Human Services Retrieved from httpwwwcdcgovchronicdiseaseresourcespublicationsaagchronichtm
19 Institute of Medicine (2013) Population health implications of the Affordable Care Act Workshop summary Washington DC The National Academies Press
20 Goldberg A (2013) It matters how we define health care equity Commentary Institute of Medicine Washington DC Retrieved from httpwwwiomeduHomeGlobalPerspectives2013DefineHealthCareEquityaspx
21 Center on Health Disparities 2012 Progress Report Partnering toward a healthier future Adventist HealthCare Health Equity Report Adventist HealthCare Inc Rockville MD
22 Hasnain-Wynia R Kang R Landrum M B Vogeli C Baker D amp Weissman J (2010) Racial and ethnic disparities within and between hospitals for inpatient quality of care An examination of patient-level Hospital Quality Alliance measures Journal of Health Care for the Poor and Underserved 21(2) 629ndash648
23 Centers for Medicare amp Medicaid Services (2013) Readmissions Reduction Program Retrieved from httpwwwcmsgovMedicare Medicare-Fee- for -Serv ice-PaymentAcuteInpatientPPSReadmissions-Reduction-Programhtml
24 Health Services Cost Review Commission Post-meeting Documents from the 497th Meeting of the Health Services Cost Review Commission May 1 2013 Maryland Department of Health and Mental Hygiene Retrieved from httpwwwhscrcstatemdusdocumentsCommissionMeeting201305-01hscrc-post-comm-meet-docs2013-05-01pdf
References | 69
25 Young GJ Meterko M amp Desai KR (2000) Patient satisfaction with hospital care Effects of demographic and institutional characteristics Medical Care 38(3) 325ndash334
26 Murray-Garciacutea J Selby J Schmittdiel J Grumbach K amp Quesenberry C (2000) Racial and ethnic differences in a patient survey Patientsrsquo values ratings and reports regarding physician primary care performance in a large health maintenance organization Medical Care 38(3) 300ndash310
27 Elliott M Lehrman W Goldstein E Hambarsoomian K Beckett M Giordano L (2010) Do hospitals rank differently on HCAHPS for different patient subgroups Medical Care Research and Review 67(1) 56ndash73 Retrieved from httpmcrsagepubcomcontent67156
28 Sauter M Hess A (2012) Americarsquos best (and worst) educated states Fox Report Retrieved from httpwwwfoxbusinesscompersonal-finance20121015americas-best-and-worst-educated-states
29 Kurtzleben D (2013) The 10 most educated US cities US News Retrieved from httpwwwusnewscomnewsbest-citiesslideshowsthe-10-most-educated-us-cities9
30 Ibid 2731 Goldstein E Elliott MN Lehrman
WG Hambarsoomian K Giordano LA (2010) Racialethnic differences in patientsrsquo perceptions of inpatient care using the HCAHPS survey Medical Care Research and Review 67(1) 74ndash92
32 Ibid 2833 Ibid 2934 US Department of Health amp Human
Services What is mental health Retrieved from MentalHealthgov website httpwwwmentalhealthgovbasicswhat-is-mental-healthindexhtml
35 The National Alliance on Mental Illness (2013 March) Mental illness facts and numbers Retrieved from httpwwwnamiorgfactsheetsmentalillness_factsheetpdf
36 National Institute of Mental Health (2006) Mental healthcare cost data for all Americans Retrieved from httpwwwnimhnihgovstatistics4COST_AM2006shtml
37 Ibid 35
38 National Alliance on Mental Illness State Advocacy 2010 State statistics Maryland Retrieved from httpwwwnamiorgContentManagementContentDisplaycfmContentFileID=93498
39 Anxiety amp Stress Center PC Generalized anxiety disorder (GAD) Retrieved from httpanxiety-stresscentercomanxietygeneralized-anxiety-disorder
40 Maryland Behavioral Risk Factor Surveillance System 2009 Montgomery County Behavioral Health Profile httpwwwmarylandbrfssorgcgi-binbrokerexe
41 Peninsula Regional Medical Center (2011) Creating healthy communities Community Dashboard Indicators for Wicomico County Retrieved from httpwwwpeninsulaorgbodycfmid=627ampoTopId=627
42 National Institute on Minority Health and Health Disparities Health disparities ndash mental health National Institutes of Health Retrieved from httpwwwnimhdnihgovhdFactSheetasp
43 Substance Abuse and Mental Health Services Administration (2010) Results from the 2009 National Survey on Drug Use and Health Volume I Summary of National Findings (Office of Applied Studies NSDUH Series H-38A HHS Publication No SMA 10-4586Findings)
44 National Alliance on Mental Illness (2005) Eliminating disparities in mental health An overview Arlington VA Retrieved from httpwwwnamiorgContentNavigationMenuF ind_Suppor t Mul t icu l tura l_Suppor t Sharing_Hope1DisparitiesOverviewpdf
45 Substance Abuse and Mental Health Services Administration (2012) Mental health United States 2010 HHS Publication No (SMA) 12-4681 Rockville MD Retrieved from httpwwwsamhsagovdata2k12MHUS2010MHUS-2010pdf
46 Office of Minority Health (2013) Mental health datastatistics US Department of Health amp Human Services Retrieved from httpwwwminorityhealthhhsgovtemplatesbrowseaspxlvl=3amplvlid=539
70 | References
47 Williams D R Jackson J Gonzaacutelez H M Neighbors H Nesse R Abelson J M amp Sweetman J (2007) Prevalence and distribution of major depressive disorder in African Americans Caribbean Blacks and Non-Hispanic Whites Archives of General Psychiatry 64(3) 305ndash315
48 Ibid 4449 Ibid 4550 Maryland Department of Health and Mental
Hygiene Vital Statistics Administration (2011) Maryland vital statistics annual report 2011 Retrieved from httpdhmhmarylandgovvsaDocuments11annualpdf
51 Ibid 4352 Ibid 4453 Van Walraven C Seth R Austin P amp
Laupacis A (2002) Effect of discharge summary availability during post-discharge visits on hospital readmission Journal of General Internal Medicine 17(3) 186ndash192
54 Nelson E Maruish M amp Axler J (2000) Effects of discharge planning and compliance with outpatient appointments on readmission rates Psychiatric Services 51(7) 885ndash889
55 Centers for Medicare amp Medicaid Services Community-based care transitions program Retrieved from httpinnovationcmsgovinitiativesCCTPindexhtml
56 Lavizzo-Mourey R (2013) In the revolving door A report on US hospital readmissions Retrieved from httpwwwrwjforgcontentdamfarmreportsreports2013rwjf404178
57 Premier Inc (2013) Partnership for Patients Retrieved from httpswwwpremierinccomsafetytopicsHAIHAI-Partnership-for-patientsjsp
58 Maryland Department of Health and Mental Hygiene (2013) DHMH posts revised proposal for modernization of MDrsquos all-payer hospital system for comment Retrieved from httpdhmhmarylandgovnewsroom1PagesDHMH-Posts-Revised-Proposal-for-Modernization-of-MDrsquos-All-Payer-Hospital-System-for-Commentaspx
59 Ibid 2360 Burton R (2012) Improving care transitions
(Policy Brief 9-13) Retrieved from httpwwwhealthaffairsorghealthpolicybriefsbriefphpbrief_id=76
61 Institute for Healthcare Improvement (2013) The IHI triple aim Retrieved from httpwwwihiorgofferingsInitiativesTripleAimPagesdefaultaspx
62 Ibid 1
References | 71
AcknowledgmentsThis report is the result of collaborative efforts among Adventist HealthCare staff and interns across the health system A great deal of gratitude is given to the members of the report planning committee for their valuable contributions to the report Joy Gill Robert Wells Peter Mbugua Arumani Manisundaram Marcos Pesquera Deidre Washington and Marilyn Lynk Debra Illig Joy Gill and Khyati Mehta helped with interpreting quality performance data and shared information on system-wide efforts to improve patient quality and safety Robert Wells and Daymara Hernandez provided detailed hospital performance data as well as data on readmissions Peter Mbugua helped with gaining access to and conducting analysis of patience experience data and described ongoing hospital initiatives to improve patient experience of care Mairene Win Pam Woynicz Caterina Pangilinan Dawn Chriss Lynette Godhard Barbara Toops and Clarencia Stephen provided assistance with gathering entity specific data information on patient demographics various process and outcome metrics and best practices to improve health care outcomes Judith Kurtis and Jo Cimino provided detailed information about efforts to reduce readmission rates through community-based initiatives and partnerships to improve care transitions Cindy Glass and Danielle Lewald assisted with editing and facilitated efforts to format and print the report for publication and dissemination
Special thanks goes to the Center for Health Equity and Wellness staff who have worked tirelessly to improve the way data are collected monitored stored retrieved and reported throughout the Adventist HealthCare system Our gratitude goes to Dr Deidre Washington for her tremendous efforts at data gathering analysis interpretation and writing and for managing contributions to the report Tiffany Capeles provided creative leadership and perseverance in the design and production of the report Talya Frelick and Eme Martin shared valuable information especially on language services and needs assessment findings and provided unending support in the development of the report Graduate interns Christopher Smith and Gina Maxham worked diligently and independently to prepare sections on patient experience quality performance and readmission reduction efforts Research Assistant Nadine Monforte along with undergraduate interns Michele Troutman Akash Syngal and Guofan Li provided assistance with background information references and data analysis Last but not least Marcos Pesquera and Dr Marilyn Lynk provided continuous leadership and encouragement in the development of this informative report leveraging stakeholders at AHC reviewing drafts and managing planning and production through the year
Adventist HealthCare Center for Health Equity and Wellness820 West Diamond Avenue bull Suite 400 bull Gaithersburg MD 20878 bull 301-315-3677
httpwwwadventisthealthcarecomdisparities

Compilation analytics and graphic design
by Center for Health Equity and Wellness
Tiffany Capeles MBA
Nancy Flores
Talya Frelick MPH
Marilyn Lynk PhD
Eme Martin MPH
Nadine Monforte
Marcos Pesquera RPh MPH
Deidre Washington PhD
wwwadventisthealthcarecomdisparities
Table of Contents
Introduction 4
Background 6
About the 2013 Health Equity Report 10
Washington Adventist Hospital 15
Shady Grove Adventist Hospital 28
Adventist Behavioral Health 42
Specialty Care 53
Efforts to Reduce Readmissions 59
Conclusion and Next Steps 64
References 67
Introduction
Introduction | 5
IntroductionIn 2007 Adventist HealthCare created the Center on Health Disparities (CHD) to address and eliminate health disparities and inequalities in the communities served by the health system with particular emphasis on Montgomery Prince Georgersquos and Frederick Counties in Maryland Health disparities are differences ldquoin which disadvantaged social groupsmdashsuch as the poor racialethnic minorities women or other groups who have persistently experienced social disadvantage or discriminationmdashsystematically experience worse health or greater health risks than more advantaged social groupsrdquo1 For more than 20 years the Health and Wellness Department has worked with Adventist HealthCare health programs such as cardiovascular diabetes cancer and maternal and child health to raise awareness of health issues to screen for various conditions and to offer educational and support programs to community members
The new Center for Health Equity and Wellness brings these two departments together to ensure that the communities served by Adventist HealthCare thrive in a culture of wellness and enjoy access to and the benefits of high-quality equitable health care
OUR MISSION
The Center for Health Equity and Wellness ensures the delivery of population-based care and promotion of healthcare equity in the communities served by Adventist HealthCare We accomplish our mission by partnering with community members and organizations to implement health equity and community wellness approaches that improve population health The work being performed at the Center contributes to the overall mission of Adventist HealthCare which is to demonstrate Godrsquos care by improving the health of people and communities through a ministry of physical mental and spiritual healing The Center works with different Adventist HealthCare entities to understand the diverse patient populations they serve monitor differences by race ethnicity or preferred language in quality of care and address disparities in order to provide high-quality and equitable care for all patients
For the second consecutive year Adventist HealthCare is publishing a Health Equity Report to demonstrate how hospital patient data including data related to core quality measures readmissions and patient experience can be analyzed through a health equity framework to identify and address possible disparities in health care In 2012 we explored the data collected at Adventist HealthCare hospitals and how they could be used to inform strategies to address community needs This report will take an additional step forward to highlight the strategies and initiatives that are planned or already in place to move toward a healthier future for all The continuing evolution and dissemination of this report demonstrates Adventist HealthCarersquos commitment to transparency and accountability for performance excellence
Background
Background | 7
BackgroundMANAGING POPULATION HEALTH
In the 2012 Health Equity Report we discussed compelling reasons why hospitals should focus on reducing health disparities and improving quality of care for all populations Changes in demographic patterns and healthcare policies in our nation and reporting requirements for performance measures and patient experience by race and ethnicity are just a few Federal and state laws (eg health reform provisions to improve access quality of care and prevention strategies) compel hospitals to not just provide care to sick individuals but invest in keeping whole populations healthy Population health is a way of describing the health status and outcomes of people living within a community it requires understanding why some populations are healthier than others The ultimate purpose of population health is to improve the health of individuals and populations by investing in the determinants of healthmdashsocial economic and environmental factors that influence a populationrsquos well-beingmdashthrough policies and interventions that affect these determinants2 Population health outcomes are the product of multiple determinants of health including medical care public health services genetics behaviors cultural background health beliefs or practices and policies as well as social and environmental factors3 However health status is affected by a broad array of determinants not only in health care or public health4
Population health focuses greater attention on the influence of health disparitiesmdashdifferences in health outcomes that are often linked to social cultural and economic disadvantages For instance infant mortality rates are almost three times higher for Blacks compared to Whites across all income and insurance groups Hispanics are four times less likely to have health insurance compared with other racial and ethnic groups and the rate of new HIV cases for Blacks is more than 10 times the rate of that for Whites5 These differences are often considered not only avoidable but unfair and unjust6 Racial and ethnic minorities among other disadvantaged groups tend to receive a lower quality of care than non-Hispanic Whites regardless of healthcare-related factors such as insurance or other socioeconomic factors7 For this reason health disparities are also known as ldquohealth inequalitiesrdquo or ldquohealth inequitiesrdquo terms that may better capture the unfairness of the differences many are working to eliminate
Though there has been significant progress in improving the health of populations in Maryland and nationwide (eg mortality rates for a number of diseases and conditions have declined) racial and ethnic minorities and low-income populations remain disproportionately affected by poor health outcomes compared to non-minority and high-income populations8 Disparities are pervasive and must be addressed however healthcare providers and systems often see themselves as responsible for just some of community health and health care For example the Model of Health Improvement posits that hospitals and healthcare systems have significant control over 20 percent of input related to clinical care and shared control over 30 percent related to health behaviors but limited control and capabilities to address socioeconomic factors and the physical environment9
IMPACT OF HEALTHCARE REFORM ON POPULATION HEALTH
The Patient Protection and Affordable Care Act (ACA) of 2012mdashalso known as the healthcare reform billmdashexpands coverage to millions of individuals and families in need of health care Healthcare reform impacts population health in four ways (1) expanding insurance coverage to improve access to the healthcare delivery system (2) improving the quality of care delivered (3) enhancing prevention and health promotion measures within the healthcare delivery system and (4) promoting community- and population-based activities and providing incentives for workplace wellness programs10
Focusing on access equity quality and prevention the ACA provides resources to help promote prevention and wellness strategies that improve the health of people and communities and keep them healthy Also the ACA seeks to address disparities and promote health and healthcare equity among populations at risk11 For several years healthcare reform has been on the forefront of peoplersquos minds when it comes
8 | Background
to equity social justice and access to health care A large number of Americans who previously had no health insurance for instance will now have access to care However access to health care does not necessarily mean that the care delivered will be patient-centered high-quality or equitable Improving health for all depends on equality in access to care and care utilization that leads to high-quality health care and addresses disparities among different populations so that all populations have an opportunity to reach their full potential for good health121314
THE ROLE OF HEALTHCARE SYSTEMS
The focus on population health represents a shift in the field of public health understanding and managing it will become more and more integrated into the role of healthcare providers Hospitals not only have to rely on demographic and clinical data to identify populations in greatest need but also analyze those needs prepare comprehensive reports and leverage existing resources in attempts to reach and support community members15 Limited resources should be used to focus on the most pressing needs with the biggest possible impact Furthermore because hospitals and healthcare systems have limited control and capabilities to address socioeconomic factors and physical environments collaboration with community stakeholders is essential The American Hospital Association encourages hospitals to adopt population health management strategies because with healthcare reform it is imperative that stakeholders and community members work in partnership Healthcare reform is driving healthcare systems and hospitals toward a new role of shared accountability in population health management to explore new methods of care delivery16
PROVIDING POPULATION-BASED CARE
Managing population health means having an effective collaborative strategy for improving the health of all communities and reducing inequalities in health outcomes between different populations However promoting the good health of the community has to become more than just a mission statement After analyzing the distribution of health outcomes in different populations providers must find ways to improve the populationrsquos health that are tailored to meet community needs while leveraging their assets Hospitals and healthcare systems can ensure that they are promoting efficient care by (1) increasing the prevalence of evidence-based prevention health services (2) improving quality of patient care and (3) enhancing care coordination17
Currently chronic conditions account for more than 75 percent of US healthcare costs18 One goal of population-based care has been described as moving from treating chronically-ill individuals to having a chronically-well population19 Adventist HealthCare (AHC) is dedicated to achieving performance excellence expanding access to care and providing population-based care all integral parts of the organizationrsquos 2010ndash14 strategic plan AHC hospitals and their boards have focused their strategic priorities to make population health a central theme reallocate resources and commit to changes
A population-based health approach recognizes that achieving positive health outcomes for everyone in our communities is a shared responsibility Such collaborative efforts require partners to share responsibility and accountability for collecting data systematically or merging existing data identifying factors that influence population health measuring outcomes and addressing determinants of health through policies and interventions Partners include healthcare delivery systems public health agencies national and local entities primary care entities and community-level organizations as well as stakeholders in other non-health sectors such as schools and businesses
ldquoEquity in access to health care implies that everyone has the opportunity to reach their full health potential in short the playing field is leveled for all individualsrdquo20
Community Health Needs Assessment
To improve population health the Affordable Care Act (ACA) calls for nonprofit hospitals to assess the health needs of community members implement strategies that meet those needs and demonstrate community benefit Under the requirements of the ACA all 501(c)(3) hospitals must conduct a Community Health Needs Assessment (CHNA) to identify health or health-related problems and unmet needs as well as existing resources among populations in their service area A CHNA must be conducted every three years and the hospital must adopt an implementation strategy to prioritize and address the needs identified in the CHNA to improve the health status of people and communities in their service area When an organization owns more than one hospital facility a separate CHNA must be conducted for each facility These requirements which first began on March 23 2012 now take effect every taxable year
In 2013 Adventist HealthCarersquos Community Benefit Council collaborated with its Advisory Board community leaders community-based organizations public health stakeholders and the community to conduct a needs assessment for five of its entitiesmdashShady Grove Adventist Hospital Washington Adventist Hospital Adventist Rehabilitation Hospital of Maryland Adventist Behavioral Health - Rockville and Adventist Behavioral Health-Eastern Shore to determine the health needs of community members and develop implementation strategies to improve population health Below is a summary of information gathered to develop the CHNA and the implementation plans for Shady Grove Adventist Hospital and Washington Adventist Hospital Complete Community Health Needs Assessment reports for all entities will be available on the Adventist HealthCare website by the end of 2013 The implementation strategies for Shady Grove and Washington Adventist hospitals have been posted on the Adventist HealthCare website implementation strategies for the three specialty care hospitals will be available by the end of the second quarter of 2014
Shady Grove Adventist Hospital (SGAH) serves residents of Montgomery County Maryland primarily (882 of discharges) Within the hospitalrsquos Community Benefit Service Area (CBSA) approximately 416 percent are minorities The Shady Grove Adventist Hospital Board of Trustees and the Adventist HealthCare Board of Trustees each reviewed and approved two priority areas for SGAHrsquos implementation strategy in response to the CHNA findings lung cancer in the Asian population and diabetes among Montgomery Cares (uninsured) patients Compared to hospitals nationally SGAH has a higher incidence of lung cancer patients in the Asian population (99 compared to 18 nationally) One goal for the implementation strategy is to improve early screening and detection of lung cancer in the Asian population served by SGAH to improve their five-year survival rate Findings from the SGAH needs assessment also show that diabetes is the eighth leading cause of death in Montgomery County and it disproportionately affects minority populations and the elderly The second priority for implementation is to improve the percent of patients who receive the recommended number of hemoglobin A1C screenings each year among known diabetic patients in the Montgomery Cares Program (uninsured) within SGAHrsquos service area
Washington Adventist Hospital (WAH) serves residents of Prince Georgersquos County (445 of discharges) and Montgomery County (403 of discharges) Maryland primarily Washington Adventist Hospitalrsquos CBSA serves a highly diverse patient population approximately 665 percent of their patients are non-White minorities Based on the results of its CHNA WAHrsquos Presidentrsquos Council decided to focus its implementation strategy on behavioral health and influenza prevention Statistics from WAHrsquos needs assessment show that the rate of hospital discharges for bipolar disorder increased for Montgomery County adults and there was a two-fold increase in readmissions in the past decade Among several interventions to address these needs WAH plans to establish a transitional care plan for discharged patients with bipolar disorder and refer patients admitted for substance abuse or alcohol abuse to appropriate resources for intervention and follow-up Additionally results revealed high emergency department visit rates due to immunization-preventable influenza and pneumonia To address this need WAH will provide a combination of free and low-cost influenza vaccinations to residents in target areas
About the 2013 Health Equity Report
About the 2013 Health Equity Report | 11
About the 2013 Health Equity ReportAdventist HealthCare Inc(AHC) is an integrated healthcare delivery network that includes five nationally accredited acute-care and specialty hospitals mental health services and home health agencies serving the Maryland and the greater Washington DC metropolitan area and northwestern New Jersey The 2013 Health Equity report includes patient data from both of AHCrsquos two Maryland-based acute-care hospitals Washington Adventist Hospital (WAH) and Shady Grove Adventist Hospital (SGAH) For the first time this yearrsquos report also features data from AHCrsquos specialty care entities Adventist Behavioral Health (ABH) Adventist Home Care Services (AHCS) and Adventist Rehabilitation Hospital of Maryland (ARHM) The organization of the report is described below
SNAPSHOT OF DIVERSITY
For each AHC entity we begin with a Snapshot of Diversity which describes the entityrsquos patient population in 2012 stratified by patientsrsquo self-reported raceethnicity As defined by the United States Office of Management and Budget (OMB) ethnicity and race are two separate constructs Ethnicity is defined as either Hispanic or Latino (or of Spanish origin) or not Hispanic or Latino OMB defines race using five categories American Indian or Alaska Native Asian Black or African American Native Hawaiian or Other Pacific Islander and White Hispanics can be of any race Both ethnicity and race should be self-reported by the patient For the purposes of this report we use the term Hispanic for any patient who has identified as such regardless of their identified race We use the race categories Asian Black and White for any patient who has identified as such and has not identified as Hispanic The category Other designates a patient who has self-identified as American Indian or Alaska Native Native Hawaiian or Other Pacific Islander any other race or who does not identify with any of the five OMB categories
With the exception of AHCS for which we used data from a report to the Maryland Health Care Commission data for the Snapshot of Diversity sections were obtained from patient electronic medical records For all entities some patient race andor ethnicity data was unknown andor missing
Note In previous reports the Snapshot of Diversity and Where We See Our Patients sections included all patient encounters that is the same patient was counted more than once if heshe was seen in the same setting (inpatient outpatient or emergency department) more than once This year the Snapshot of Diversity includes data that distinguishes unique patients from all patient encounters (ie total volume) When reporting unique patients if a patient was seen in the same setting multiple times only their first encounter is included However if a patient was seen in two different settings on separate occasions both encounters are included (eg once as an inpatient and once as an outpatient) In subsequent sections the analyses reflect all patient encounters unless otherwise specified
LANGUAGE PREFERENCE AND INTERPRETER SERVICES
In addition to race and ethnicity language preference is another important demographic characteristic to consider when describing the diversity of the hospital patient population AHC is committed to providing high quality care to all patients in the language in which they prefer to communicate including sign language in addition to spoken language Effective patient-provider communication is essential to providing patient-centered care and is necessary for patient safety AHC continues to provide various language service options for the limited English proficient (LEP) population that we serve These options include on-site full-time Spanish interpreters Qualified Bilingual Staff on-call contracted interpreters video remote interpreting for the Deaf and hard-of-hearing and a telephone interpretation service that provides foreign language interpretation in more than 180 different languages seven days a week 24 hours a day In Language Preference and Interpreter Services for the two acute-care hospitals we describe the patient population by preferred language For all entities we describe the usage of over-the-phone interpretation for the past year
12 | About the 2013 Health Equity Report
Within Language Preference and Interpreter Services data related to the patientrsquos preferred language were obtained from patient electronic medical records For some patients data on preferred language was unknown andor missing this is reflected in the tables and figures There are numerous encounters that are not reported here (ie with full-time interpreters and Qualified Bilingual Staff) however we are working to document the use of these services at our hospitals and other entities All data pertaining to the use of over-the-phone interpretation were obtained from the vendor that provides this service to all of AHC
IN-DEPTH HOSPITAL SETTING HEALTH INSURANCE AND PRIMARY DIAGNOSES
For WAH and SGAH the In-Depth sections provide a detailed look at the hospital settings in which patients were seen (inpatient outpatient and emergency department) primary diagnoses and primary health insurance coverage stratified by raceethnicity For ABH the In-Depth section includes data on health insurance as well as primary patient diagnoses Specialty Care sections (AHCS and ARHM) include health insurance data and primary diagnoses (AHCS only) For all entities data on the setting diagnoses and insurance were obtained from patient electronic medical records
Any of the hospital settings described above may be an appropriate place to seek care we make no assumptions or conclusions regarding the appropriateness of any encounter based on this data However higher rates of emergency department utilization may be associated with lack of a primary care physician or medical home or being uninsured or underinsured21 By examining these characteristics over time patterns may emerge that illuminate racialethnic differences in both healthcare-seeking behaviors and access
Note For ease of reporting a basic five level categorization scheme was developed to identify the patientrsquos primary health insurance coverage The categories include Self-Pay (uninsured or underinsured) Medicaid Private Insurance Medicare and All Others This scheme differs from the data requirements used for state reporting to the Maryland Health Services Cost Review Commission (HSCRC) Private insurance for example includes managed care organizations health maintenance organizations (HMOs) and commercial payers which differs from the HSCRC data reporting requirements Therefore the data reported here will not align with the data reported to HSCRC
INPATIENT QUALITY MEASURES
For WAH and SGAH in the Inpatient Quality section we describe the overall scores for inpatient quality core measures pneumonia heart failure acute myocardial infarction and surgical care A total of 50 measures were collected at both SGAH and WAH ranging in scores from 9143 percent to 100 percent The data shown represents the overall summation of all patients and measures within each of the core areas at the hospital For example the pneumonia care data represents the summation of six individual measures related to the quality of care for patients with pneumonia The data is presented this way because of the overall high scores achieved within and across each of the measurement groups This also did not allow for statistical calculations of differences between racial and ethnic groups The inpatient quality measures were abstracted from the Quantros platform used by AHC for core measure reporting
For ABH the quality measures are from the Hospital-Based Inpatient Psychiatric Servicersquos (HBIPS) Core Measure Set which consists of seven measures to assess quality of care for patients discharged from free-standing psychiatric hospitals and acute-care hospitals with psychiatric units Information on five of the seven measures are presented and stratified by race
Looking ahead to 2014 the Maryland Health Care Commission (MHCC) will be adopting an expanded hospital quality data collection policy This change will serve to ldquoexpand Marylandrsquos system for monitoring and public reporting on hospital performance and qualityrdquo and increase alignment with the Centers for Medicare and Medicaidrsquos (CMS) hospital quality program22 With this expansion there appears a trend that seems to be shifting focus from inpatient to outpatient measures
About the 2013 Health Equity Report | 13
In recent years a significant amount of change has occurred around inpatient measures Among the core measurement groups described in this section many of the measures have been retired leaving only two each for acute myocardial infarction and pneumonia one for heart failure and seven for surgery to be reported in 2014 While these measures have phased out others have been added In 2013 measures consistent with the CMS Value-Based Purchasing and Meaningful Use Programs were adopted
Outpatient measures to be collected in 2014 fit into three categories claims based imaging efficiency (7) chart abstracted (13) and structural (4) In the chart abstracted category measures focus on acute myocardial infarction and chest pain emergency department throughput stroke and surgical care The structural measures will require hospitals to report whether certain activities are performed such as tracking clinical results between visits and utilizing a safe surgery checklist
HOSPITAL READMISSIONS
One of the provisions in the Affordable Care Act addresses the high rate of readmissions Hospital reimbursements can now be adjusted based on higher than expected readmission rates23 Hospital readmission rates can vary depending on several different factors including income race health condition hospital patient case mix and insurance coverage In some instances a hospital readmission may be appropriate andor unavoidable However lack of post-discharge care coordination disease management severity of illness medical errors or adverse events poor patient adherence to the treatment plan or ineffective communication may result in a readmission that is potentially preventable
Both acute-care hospitals participate in the HSCRC Admission-Readmission Revenue (ARR) program a voluntary revenue constraint program that provides hospitals with a financial incentive to coordinate care and reduce unnecessary readmissions As reported in the HSCRC post-meeting minutes dated April 10 2013 from FY2011 to FY2012 Maryland hospitals reduced readmissions by 67 percent and admissions by 35 percent24 Based on this HSCRC is recommending that all Maryland hospitals not participating in the voluntary program be required to implement the ARRCharge Per Episode (CPE) policy With the understanding that many factors may influence the likelihood of readmission hospitals can collaborate with various community partners and develop innovative programs to reduce potentially preventable hospital readmissions
The Readmissions section presents 30-day all cause readmissions data stratified by raceethnicity The readmission logic used for this analysis followed the HSCRC ARR methodology Under this methodology a readmission takes place when an admission occurs within 30 days of the previous discharge to the same facility The number of discharges included in this analysis excludes zero and one-day stays per HSCRC guidelines and it also excludes readmissions Our data model does not include case mix adjusted data
PATIENT EXPERIENCE RESPONSES TO THE HCAHPS SURVEY
Research shows that a number of factors such as age health literacy or education level health status and raceethnicity or cultural beliefs can affect ratings of care25 Although Latino and African Americans typically provide higher overall ratings of care more information is needed to determine whether differences in ratings stem from actual differences in quality of care or from differences in patient perceptions expectations or response styles26 To further explore this area in this yearrsquos Health Equity report we present responses to selected Hospital Consumer Assessment of Healthcare Providers and Systems (HCAHPS) questions stratified by education level A survey of over one million patients discharged between 2006ndash2007 showed that while health status race and language variables are strong predictors of HCAHPS performance patient education and age contribute moderately to overall patient satisfaction27
In the Patient Experience section we present responses to items about patientsrsquo experiences and satisfaction with care from the HCAHPS stratified by (1) raceethnicity and (2) education level (highest grade or level of school completed) HCAHPS survey data were obtained directly from the HealthStream
14 | About the 2013 Health Equity Report
(HSTM) Insights Online database HealthStream is the vendor that administers this survey This survey is only applicable to inpatients it was administered to a sample of discharged patients and participation was voluntary The percentages in the tables represent the top box score which is the percent of patients who responded positively to composite and individual survey items (ie ldquoAlwaysrdquo ldquoDefinitelyrdquo or ldquoYesrdquo responses) or rated items on a scale from 1 to 10 positively (ie if 10 is the highest rating on a scale of 1 to 10 the percentage of patients who responded either 9 or 10) In the tables the column labeled HSTM contains the top box scores that represent the 50th percentile of national hospitals in the HealthStream database
ADVENTIST BEHAVIORAL HEALTH
In alignment with the theme of the 2013 Center on Health Disparities Annual Fall Conference ldquoPartnering Toward a Healthier Future Addressing Disparities in Behavioral Healthrdquo we devote one section to the issue of mental and behavioral health in the United States highlighting the patients and work of Adventist Behavioral Health (ABH) which has facilities in both Montgomery County and Dorchester County in Maryland The facility in Montgomery County primarily serves patients of all ages from Montgomery Prince Georgersquos and Frederick counties The facility in Dorchester County primarily serves the pediatric population of Dorchester and Wicomico counties Prior to presenting patient data the ABH section begins with background information on mental and behavioral health on national state and local levels Due to the very different populations treated at each location most of the data for ABH are presented by location
ADDITIONAL HIGHLIGHTS
Special highlights in the report include information about federal standards to increase culturally competent care and reduce health disparities the implementation of the Affordable Care Act (ACA) in the state of Maryland efforts to reduce readmissions and improve patient-centered care across the Adventist HealthCare system and AHC hospitalsrsquo community health needs assessment results The report concludes with Next Steps for all hospitals striving to implement a data-driven health equity agenda to achieve patient care that is high-quality and accessible across the state of Maryland
The primary goal of this report is to share demographic clinical and quality information about AHC hospitals and other entities and highlight efforts to improve patient experiences and outcomes in the communities we serve A majority of the information is descriptive and analyses are exploratory detailed discussion and interpretation of findings is beyond the scope of this report Nevertheless we hope the information will be used by our hospital leadership to inform overall strategies and interventions that will have a positive impact on the health of populations
Washington Adventist Hospital
16 | Washington Adventist Hospital
Snapshot of DiversityBoth Table 1 and Figure 1 below show the distribution of all unique patients at Washington Adventist Hospital (WAH) in 2012 by race and ethnicity WAH is located in Takoma Park Maryland
As shown in Table 1 Black patients continue to make up the majority of patients treated at WAH Black patients accounted for approximately 41 percent of WAH patients Hispanic patients accounted for about 32 percent of WAH patients White patients accounted for about 18 percent and Asian patients accounted for 4 percent These percentages are very similar to those described in last yearrsquos report (Note See ldquoAbout the 2013 Health Equity Reportrdquo for details on methodology sources limitations inclusionsexclusions missing data and other information about the data reported here)
TABLE 1 AND FIGURE 1 ALL UNIQUE PATIENTS BY RACEETHNICITY WAH 2012 (N=57546)
RaceEthnicity Percent ()Black 407
Hispanic 315
White 177
Asian 42
Other 32
Unknown 26
Total 999Percentages do not add up to 100 due to rounding All patients are included in computations
Table 2 and Figure 2 below show the racialethnic distribution for all patient encounters at WAH in 2012 In the table and figure below the same patients may be included multiple times In 2012 there were more than 88000 total patient encounters at WAH A majority of the patient encounters is comprised of Black patients (43) and Hispanic patients (29) the distribution is very similar to that in Table 1 and Figure 1 above (unique patients)
TABLE 2 AND FIGURE 2 ALL PATIENT ENCOUNTERS BY RACEETHNICITY WAH 2012 (N=88458)
RaceEthnicity Percent ()Black 433
Hispanic 289
White 183
Asian 42
Other 28
Unknown 25
Total 100
Black 407
Hispanic 315
White 177
Asian 42
Other 32
Unknown 26
Black 433
Hispanic 289
White 183
Asian 42
Other 28
Unknown 25
Washington Adventist Hospital | 17
Language Preference and Interpreter ServicesFigure 3 below shows the distribution of patients at WAH by preferred language in 2012 reflecting all patient encounters English was the most preferred language among patients (826) a slight decrease from what was reported in last yearrsquos report (842) The percentage of patients who preferred to communicate in Spanish increased from 12 percent in 2011 to 139 percent in 2012 The other common languages spoken at WAH include Amharic French Vietnamese and Korean Approximately 19 percent of WAH patients preferred to communicate in these languages
FIGURE 3 ALL PATIENT ENCOUNTERS BY PREFERRED LANGUAGE WAH 2012 (N=88458)
Figure 4 shows the most frequently requested languages for over-the-phone interpretation at WAH More than 9700 calls were made during 2012 exceeding 82000 minutes As seen in Figure 4 the majority of the calls placed were for Spanish language interpretation followed by Vietnamese French and Amharic In addition to the languages highlighted below calls were placed for more than 60 additional languages including Arabic Haitian Creole and Mandarin (All Others 69)
FIGURE 4 OVER-THE-PHONE INTERPRETER USE BY NUMBER OF CALLS WAH 2012
English 826
Spanish 139
Unknown 16
Amharic 04
French 03
Vietnamese 02
Korean 02
All Others 09
Other 19
Spanish 844
Vietnamese 28
French 28
Amharic 19
Korean 12 All Others
69 Other 156
18 | Washington Adventist Hospital
In-DepthHOSPITAL SETTING AND HEALTH INSURANCE
Table 3 shows the hospital settings in which patients were seen at WAH in 2012 by race and ethnicity For comparison the last column of Table 3 is identical to the information given in Table 2 above As in previous years different patterns of utilization emerge for patients of certain racialethnic background We posit that if raceethnicity were not associated with the setting in which a patient is seen the percentages across each row would be similar For example Black patients would represent approximately 43 percent of all inpatient visits 43 percent of all outpatient visits and 43 percent of all emergency department patients As Table 3 shows there are some noteworthy deviations from this expectation For example Hispanic patients represent 29 percent of all patient encounters at WAH yet more than 35 percent of all emergency department visits White patients who account for more than 18 percent of all WAH patient encounters only account for 14 percent of the volume in the emergency department and 23 percent of outpatient visits
TABLE 3 ALL PATIENT ENCOUNTERS BY HOSPITAL SETTING WAH 2012 (N=88458)
RaceEthnicity Inpatient (N=14882)
Outpatient (N=32405)
Emergency Department
(N=41171)
ALL WAH Patients (N=88458)
Black 418 407 458 433
Hispanic 262 220 353 289
White 194 232 140 183
Asian 39 68 23 42
Other 43 36 17 28
Unknown 44 37 09 25
Top WAH inpatient discharge diagnoses by raceethnicityFor inpatients at WAH diagnosis-related groups or DRGs relating to childbirth and delivery are among the top five for all patients regardless of raceethnicity Excluding these DRGs and excluding zero- and one-day stays the two most common inpatient discharge diagnoses for Black patients at WAH were septicemia and disseminated infections (septicemia) and schizophrenia For Hispanic patients the most common diagnoses were major depressive disorder and septicemia for White patients they were bipolar disorder and septicemia and for Asian or Pacific Islander patients they were schizophrenia and heart failure
Figure 5 shows the hospital settings in which patients were seen at WAH in 2012 by raceethnicity Of all the patient encounters with Black patients nearly half (49) occurred in the emergency department which is very close to what we reported last year (48) Figure 5 also shows that Black patients accounted for 16 percent of inpatients similar to what was reported in 2012 For both Asian and White patients the distributions seen in Figure 5 are not significantly different from what has been observed in previous years For both groups emergency department patients accounted for less than 40 percent of their respective totals For all four groups the distributions are fairly similar to what has been observed in previous years shifting only a few percentage points
Washington Adventist Hospital | 19
FIGURE 5 HOSPITAL SETTING FOR ALL PATIENT ENCOUNTERS BY RACEETHNICITY WAH 2012
Table 4 shows health insurance coverage for all 88458 patient encounters at WAH in 2012 Nearly 32 percent of all encounters were paid for by private insurance However the insurance distribution differs depending on the setting For encounters in the emergency department the most common insurer was Medicaid (29) For inpatient encounters the most common insurer was Medicare (32) and for outpatient encounters it was private insurance (37) Table 4 provides context for the data presented in Figures 6 7 and 8 below where the primary insurance coverage for each setting is stratified by patient raceethnicity
Emergency Department
49
Inpatient 16
Outpatient 35
Black Patients (N=38264)
Emergency Department
35
Inpatient 18
Outpatient 47
White Patients (N=16145)
Emergency Department
57 Inpatient
15
Outpatient 28
Hispanic Patients (N=25578)
Emergency Department
26
Inpatient 15
Outpatient 59
Asian Patients (N=3759)
20 | Washington Adventist Hospital
TABLE 4 HEALTH INSURANCE COVERAGE FOR ALL PATIENT ENCOUNTERS WAH 2012 (N=88458)
WAH (All Encounters)
All ED Encounters
All Inpatient Encounters
All Outpatient Encounters
Self-Pay (Uninsured) 153 259 101 41
Medicaid 229 293 291 119
Private Insurance 316 289 266 374
Medicare 218 108 324 309
All Others 84 51 17 157
Total 100 100 999 100
Figure 6 shows the distribution of coverage for all patients treated in the emergency department at WAH in 2012 by raceethnicity in 2012 The largest percentage of uninsured patients (self-pay) were Hispanic (over 35) Also Hispanic patients were least likely to be covered by Medicare in the emergency department (less than 4) The majority of White and Asian patients were covered by private insurance (46 and 43 respectively)
FIGURE 6 HEALTH INSURANCE COVERAGE BY RACEETHNICITY ALL WAH ED VOLUME 2012 (N=41171)
0
10
20
30
40
50
60
70
80
90
100
Hispanic White Black Asian Other Unknown
All OthersMedicarePrivate InsuranceMedicaidSelf-Pay (Uninsured)
Washington Adventist Hospital | 21
Figure 7 shows health insurance coverage by raceethnicity for inpatients at WAH during 2012 White (504) Black (38) and Asian (40) patients were more likely to be covered by Medicare than any other insurer For Hispanic patients Medicaid covered more than half of inpatient hospital stays (51)
FIGURE 7 HEALTH INSURANCE COVERAGE BY RACEETHNICITY ALL WAH INPATIENT VOLUME 2012 (N=14882)
0
10
20
30
40
50
60
70
80
90
100
Hispanic White Black Asian Other Unknown
All OthersMedicarePrivate InsuranceMedicaidSelf-Pay (Uninsured)
22 | Washington Adventist Hospital
Figure 8 shows health insurance coverage for all outpatients treated at WAH in 2012 For White Black and Asian patients less than three percent of outpatients were uninsured Slightly more than 10 percent of Hispanic patients were uninsured Medicaid covered about 18 percent of outpatient visits for Hispanic patients and 13 percent of visits for Black patients this is compared to 4 percent for White patients and 8 percent for Asian patients White (45) Black (39) and Asian (49) patients were more likely to be covered by private insurance
FIGURE 8 HEALTH INSURANCE COVERAGE BY RACEETHNICITY ALL WAH OUTPATIENT VOLUME 2012 (N=32405)
0
10
20
30
40
50
60
70
80
90
100
Hispanic White Black Asian Other Unknown
All OthersMedicarePrivate InsuranceMedicaidSelf-Pay (Uninsured)
Washington Adventist Hospital | 23
Inpatient Quality MeasuresTable 5 shows composite scores of inpatient quality measures for WAH in 2012 A composite score of 96 percent or higher was achieved in each group Because of overall high scores achieved within and across each of the measurement groups differences between racial and ethnic groups were not calculated
TABLE 5 WAH INPATIENT QUALITY MEASURES - 2012
Measurement Group Numerator Denominator PercentagePneumonia Care (PN)1 402 410 98055
Heart Failure (HF)2 1209 1253 96496
Acute Myocardial Infarction (AMI)3 2009 2013 99807
Surgical Care Improvement Project (SCIP)4 5151 5228 98538
1Measure group includes PN-3a PN-3b PN-6 PN-6a PN-6b PN-PACS2Measure group includes HF-1 HF-2 HF-3 HF-PACS3Measure group includes AMI-1 AMI-2 AMI-3 AMI-5 AMI-7a AMI-8a AMI-10 AMI-PACS4Measure group includes SCIP-Card-2 SCIP-Inf-1a SCIP-Inf-1b SCIP-Inf-1c SCIP-Inf-1d SCIP-Inf-1e SCIP-Inf-1f SCIP-Inf-1g SCIP-Inf-1h SCIP-Inf-2a SCIP-Inf-2b SCIP-Inf-2c SCIP-Inf-2d SCIP-Inf-2e SCIP-Inf-2f SCIP-Inf-2g SCIP-Inf-2h SCIP-Inf-3a SCIP-Inf-3b SCIP-Inf-3c SCIP-Inf-3d SCIP-Inf-3e SCIP-Inf-3f SCIP-Inf-3g SCIP-Inf-3h SCIP-Inf-4 SCIP-Inf-6 SCIP-Inf-9 SCIP-PACS SCIP-VTE-1 SCIP-VTE-2 5Percentage range across individual measures for PN 9231-1006Percentage range across individual measures for HF 9887-1007Percentage range across individual measures for AMI 9953-1008Percentage range across individual measures for SCIP 9143-100
In October 2013 WAH was named as a Top Performer on Key Quality Measuresreg by The Joint Commission meaning they achieved at least 95 percent compliance with certain measures for 2012 performance At WAH only three measures were found to have a score lower than 95 percent while 33 were found to have scores of 98 percent and above 22 of which were perfect scores
Pneumonia Care (PN)Among six quality measures the measure with the lowest success rate was initial antibiotic selection for PN in immunocompetent non-intensive care unit (ICU) patients with a percentage of 9688 percent However due to a small sample size the 312 percent rate of failure represents only two patients All remaining measures had a rate of 9718 percent and above including two with a rate of 100 percent
Heart Failure (HF)A total of four quality measures were evaluated for HF Among them discharge instructions were provided to 9349 percent of patients angiotensin converting enzyme inhibitor (ACEI) or angiotensin receptor blockers(ARB) for left ventricular systolic dysfunction (LVSD) were provided to 9889 percent of patients for which it was indicated and patient appropriateness of care compliance was found to have a rate of 9427 percent The fourth measure Evaluation of left ventricular systolic (LVS) function had a perfect completion rate of 100 percent
Acute Myocardial Infarction (AMI)Among the eight AMI measures one was not indicated for any patients and onemdashprimary percutaneous coronary intervention (PCI) received within 90 minutes of hospital arrivalmdashhad a rate of 9697 percent Of the remaining six measures two had a rate of 9951 percent and above while the other four had a rate of 100 percent
24 | Washington Adventist Hospital
Surgical Care Improvement Project (SCIP)Among the four groups of inpatient quality measures SCIP had the largest number of measures with a total of 32 Twenty-one of these measures had a score of at least 985 percent while 15 had a perfect score of 100 percent The measure with the lowest score of 9453 percent was patient appropriateness of care compliance
Washington Adventist Hospital
Washington Adventist Hospital | 25
Hospital ReadmissionsTable 6 below shows the all-cause 30-day readmission percentages for patients at WAH during 2012 Using the methodology described the overall readmission percentage for WAH was 76 percent There were 969 readmissions and 11820 discharges Readmissions for Black patients were the highest of all racialethnic groups (approximately 107) The percentage for White patients was slightly lower (95) Readmissions for all other racialethnic groups were lower than the hospital average (69 for Asian patients and 50 for Hispanic patients)
TABLE 6 ALL CAUSE 30-DAY READMISSIONS BY PATIENT RACEETHNICITY WAH 2012
RaceEthnicity ReadmissionsBlack 107
White 95
Asian 69
Hispanic 50
Other 44
Unknown 23
Total 82
26 | Washington Adventist Hospital
Patient Experience Table 7 below shows the percent of WAH inpatients who responded positively to selected HCAHPS questions (top box scores) by raceethnicity in 2012
Hispanics and Blacks discharged from WAH responded more positively to patient experience items than White patients for most measures However Asians were less likely than other minority groups to report positive experiences compared with Whites Overall ratings of the hospital and likelihood to recommend were more positive for Hispanics and Blacks compared with White and Asian patients Also satisfaction with communication with doctors and nurses was higher for non-White patients compared to Whites Asian patients were less likely to respond positively to items about staff courtesy or communication Most survey respondents seemed satisfied with staff courtesy and written discharge instructions indicating continued commitment to providing excellent care Specifically WAH has implemented nursing campaigns to encourage consistent and meaningful patient interactions which is reflected in more positive ratings in this yearrsquos report Nurses and patient care technicians are required to check in on every patient on an hourly basis (ie hourly rounding) Daily rounding is the responsibility of nursing leadership (eg charge nurses and nurse managers) In addition WAHrsquos leadership is required to round on at least one patient a week in their assigned area at the hospital Regular patient rounding is productive and can shed light on patient concerns or issues such as pain management and needs for personal assistance such as help getting up from bed In 2012 compliance for daily nurse rounding and logging rounding information was 93 percent at WAH
TABLE 7 SELECTED TOP BOX RESPONSES TO HCAHPS QUESTIONS BY RACEETHNICITY WAH 2012 (IN PERCENTS)
All WAH White Patients
Black Patients
Asian Patients
Hispanic Patients HSTM
Likely to recommend 701 64 737 61 736 742Overall rating of hospital 628 574 68 523 648 706
Courtesy of doctors 825 78 871 674 857 879
Doctors listen carefully 767 681 823 714 804 808Clear communication by doctors 734 649 796 581 804 773
Courtesy of nurses 842 793 878 80 83 863
Nurses listen carefully 743 654 794 69 836 779Clear communication by nurses 732 645 781 667 768 761
Talking about help after discharge 803 815 819 737 816 833
Providing written discharge instructions 856 885 855 786 878 883
Percentages averaged across all persons self-identifying as Hispanic or Latino Includes Puerto Ricans Mexicans Mexican-Americans Chicanos Cubans and others Race and ethnicity are not mutually exclusive in this table Therefore if a patient identified himself as both Black and Hispanic his responses are included in both columns
Washington Adventist Hospital | 27
Table 8 below shows the percent of WAH inpatients who responded positively to selected HCAHPS questions (top box scores) stratified by the patientrsquos level of education Results reveal a decrease in satisfaction scores as level of education increases Comparisons between individuals who completed more than four years of college and those who did not graduate from high school reveal a greater than 15 percent difference in the ldquolikelihood to recommendrdquo measure for respondents Because a significant proportion of residents in Maryland (eg Montgomery County) and the DC metropolitan area are highly educated it may be important to understand the relationship between education level and satisfaction with hospital care2829 In the future efforts that address differences in patient experience between patients with different levels of education may be necessary to reach our performance goal of achieving top quartile patient experience
TABLE 8 SELECTED TOP BOX RESPONSES TO HCAHPS QUESTIONS BY EDUCATION LEVEL WAH 2012 (IN PERCENTS)
More than 4
years of college
Graduated from
4-year college
Some college
or earned a 2-year degree
Graduated from high earned a
GED
Some high
school but did
not graduate
Completed the 8th
grade or less
Likely to recommend 736 802 874 859 899 1000
Overall rating of hospital 600 735 779 752 800 833
Courtesy of doctors 651 719 731 755 713 917
Doctors listen carefully 781 805 817 835 863 885Clear communication by doctors 660 786 764 782 815 962
Courtesy of nurses 620 770 733 715 827 885
Nurses listen carefully 789 779 870 745 865 826Clear communication by nurses 910 822 879 848 831 792
Talking about help after discharge 513 628 636 645 763 654
Providing written discharge instructions 622 739 714 698 756 783
Shady Grove Adventist Hospital
Shady Grove Adventist Hospital | 29
Snapshot of DiversityTable 9 and Figure 9 below show the distribution of all unique patients at Shady Grove Adventist Hospital (SGAH) in 2012 by race and ethnicity SGAH patients include those treated at the main hospital in Rockville as well as at the Shady Grove Adventist Emergency Center in Germantown Maryland
With the full implementation of our electronic medical record platform in 2012 we are able distinguish between patients who actively declined to report their race andor ethnicity from those patients for whom the information is unknown for any other reason as seen below in Tables 9 and 10 and Figures 9 and 10 Throughout the remainder of the report the SGAH patients who declined to report their raceethnicity are included in the lsquoUnknownrsquo category Table 9 and Figure 9 show that White patients accounted for nearly 38 percent of all unique patients seen at SGAH in 2012 Hispanic patients accounted for 24 percent of all patients while Black patients accounted for 13 percent and Asian patients for 8 percent (Note See ldquoAbout the 2013 Health Equity Reportrdquo for details on methodology sources limitations inclusionsexclusions missing data and other information about the data reported here)
TABLE 9 AND FIGURE 9 ALL UNIQUE PATIENTS BY RACEETHNICITY SGAH 2012 (N=121729)
RaceEthnicity Percent ()White 377
Hispanic 244
Black 134
Asian 80
Other 42
Declined 12
Unknown 111
Total 100
Table 10 and Figure 10 below show the racialethnic distribution for all patient encounters at SGAH in 2012 In the table and figure below the same patients may be included multiple times The distribution is very similar to the patient distribution seen in Table 9 and Figure 9 above
TABLE 10 AND FIGURE 10 ALL PATIENT ENCOUNTERS BY RACEETHNICITY SGAH 2012 (N=164049)
RaceEthnicity Percent ()White 371
Hispanic 259
Black 146
Asian 74
Other 41
Declined 10
Unknown 99
Total 100
White 377
Hispanic 244
Black 134
Asian 80
Other 42
Declined 12 Unknown
111
White 37
Hispanic 26
Black 15
Asian 7
Other 4 Declined
1 Unknown
10
30 | Shady Grove Adventist Hospital
Language Preference and Interpreter ServicesFigure 11 shows the distribution of patients by preferred language at SGAH in 2012 reflecting all patient encounters English was the most preferred language among patients (90) similar to what was reported in last yearrsquos report The percentage of patients who preferred to communicate in Spanish increased slightly from 4 percent in 2011 to 5 percent in 2012 The other preferred languages at SGAH include Chinese (both Mandarin and Cantonese) Korean French and Farsi Just over two percent of SGAH patients preferred to communicate in these languages
FIGURE 11 ALL PATIENT ENCOUNTERS BY PREFERRED LANGUAGE SGAH 2012 (N=164049)
Figure 12 shows the languages most frequently requested for interpretation by phone at SGAH More than 12000 calls were placed exceeding 113000 minutes As seen in Figure 12 the majority of the calls were for Spanish language interpretation followed by Mandarin Korean and Russian In addition to the languages highlighted below calls were placed for more than 70 additional languages including Arabic Bengali and Hindi (All Others 59)
FIGURE 12 OVER-THE-PHONE INTERPRETER USE BY NUMBER OF CALLS SGAH 2012
English 887
Spanish 50
Unknown 40
Chinese 06 Korean
03
French 02
Farsi 02
Russian 01
All Others 10
Other 24
Spanish 685
Mandarin 85 Korean
44
Russian 42
French 23 Cantonese
23
Vietnamese 20
Farsi 19
All Others 59
Other 144
Shady Grove Adventist Hospital | 31
In-DepthHOSPITAL SETTING AND HEALTH INSURANCE
Table 11 shows the hospital settings where patients were seen at SGAH and the Shady Grove Adventist Emergency Center in 2012 by raceethnicity The last column of Table 11 reflects the same information in Table 10 above As in previous years we observe different patterns of hospital utilization by patients from different racialethnic groups White patients who accounted for 37 percent of all patient volume made up 45 percent of inpatient visits and only 34 percent of emergency department visits Hispanic patients who accounted for 26 percent of total patient volume accounted for about 30 percent of emergency department volume and only 21 percent of inpatient volume Black patients utilized the emergency department at higher rates than Asian patients who were more likely to use inpatient and outpatient services
TABLE 11 ALL PATIENT ENCOUNTERS BY HOSPITAL SETTING SGAH 2012 (N=164049)
RaceEthnicity Inpatient (N=26111)
Outpatient (N=46848)
Emergency Department
(N=91090)
ALL SGAH Patients (N=164049)
White 453 386 340 371
Hispanic 209 212 297 259
Black 126 111 170 146
Asian 109 100 51 74
Other 40 38 42 41
Unknown 62 153 100 109
Top SGAH hospital inpatient discharge diagnoses by raceethnicityFor inpatients at SGAH diagnostic-related groups (DRGs) relating to childbirth and delivery are among the top five for all patients regardless of raceethnicity Excluding these DRGs and excluding zero- and one-day stays the two most common inpatient discharge diagnoses for White patients at SGAH were septicemia and pneumonia For Hispanic patients the two most common were kidneyurinary tract infections and pneumonia For Black patients the most common diagnoses were heart failure and sickle cell anemia crises and for Asian patients they were pneumonia and septicemia
Figure 13 shows the hospital settings in which patients were seen at SGAH in 2012 by raceethnicity For both Black and Hispanic patients the majority of encounters occurred in the emergency department for both groups emergency department visits accounted for more 60 percent of all visits In comparison emergency department visits accounted for approximately half of all visits for White patients For Asian patients emergency department visits accounted for less than 40 percent of all visits Again for all four groups the distributions seen in Figure 13 are very similar to the data presented in last yearrsquos report
32 | Shady Grove Adventist Hospital
FIGURE 13 HOSPITAL SETTING FOR ALL PATIENT ENCOUNTERSBY RACEETHNICITY SGAH 2012
Table 12 shows the primary health insurance coverage for all 164049 patient encounters at SGAH in 2012 Nearly 57 percent of all encounters were paid for by private insurance Private insurance was the dominant insurer for all settings covering the majority of inpatient (57) and outpatient (71) encounters In the emergency department private insurance covered just less than half of the encounters Table 12 provides context for the data presented in Figures 14 15 and 16 where the primary insurance coverage in each setting is stratified by patient raceethnicity
TABLE 12 HEALTH INSURANCE COVERAGE FOR ALL PATIENT ENCOUNTERS SGAH 2012 (N=164049)
SGAH (All Encounters)
All ED Encounters
All Inpatient Encounters
All Outpatient Encounters
Self-Pay (Uninsured) 126 168 67 78
Medicaid 222 267 204 145
Private Insurance 572 498 571 714
Medicare 60 39 153 49All Others 20 27 05 14
Total 100 999 999 100
Emergency Department
64
Inpatient 14
Outpatient 22
Black Patients (N=23960)
Emergency Department
51
Inpatient 19
Outpatient 30
White Patients (N=60868)
Emergency Department
64 Inpatient
13
Outpatient 23
Hispanic Patients (N=42465)
Emergency Department
39
Inpatient 23
Outpatient 38
Asian Patients (N=12218)
Shady Grove Adventist Hospital | 33
Figure 14 shows the distribution of coverage for all patients treated in the emergency department at SGAH in 2012 by raceethnicity Hispanic (20) and Black patients (19) were more likely to be uninsured compared to White or Asian patients (less than 11 for both groups) It is also noteworthy that of all the White patients seen in the emergency department nearly 68 percent were covered by private insurance The private insurance coverage for Asian patients was about 66 percent In comparison the private insurance coverage for Black and Asian patients was approximately 37 percent and 35 percent respectively Similarly Medicaid coverage was similar for Black and Hispanic patients at about 38 percent each however it was about 14 percent for White patients and 17 percent for Asian patients
FIGURE 14 HEALTH INSURANCE COVERAGE BY RACEETHNICITY ALL SGAH ED VOLUME 2012 (N=91090)
0
10
20
30
40
50
60
70
80
90
100
Hispanic White Black Asian Other Unknown
All OthersMedicarePrivate InsuranceMedicaidSelf-Pay (Uninsured)
34 | Shady Grove Adventist Hospital
Figure 15 shows health insurance coverage by raceethnicity for all inpatients at SGAH during 2012 Hispanic White Black and Asian patients were more likely to be covered by private insurance Private insurance coverage was higher than 65 percent for both White and Asian patients and just about 42 percent for both Hispanic and Black patients Medicaid coverage was approximately 35 percent for both Hispanic and Black patients about 18 percent for Asian patients and about 9 percent for White patients Medicare coverage was highest for White patients (19) followed by Black patients (13) Asian patients (12) and Hispanic patients (9) Hispanic patients were most likely to be uninsured (over 11)
FIGURE 15 HEALTH INSURANCE COVERAGE BY RACEETHNICITY ALL SGAH INPATIENT VOLUME 2012 (N=26111)
0
10
20
30
40
50
60
70
80
90
100
Hispanic White Black Asian Other Unknown
All OthersMedicarePrivate InsuranceMedicaidSelf-Pay (Uninsured)
Shady Grove Adventist Hospital | 35
Figure 16 shows the health insurance coverage for all outpatients treated at SGAH in 2012 Similar to inpatients most outpatient visits were covered by private insurance for each group of patients Private insurance coverage ranged from 59 percent for Black patients up to 82 percent for White patients Medicaid coverage was highest for Black patients (about 29)
FIGURE 16 HEALTH INSURANCE COVERAGE BY RACEETHNICITY ALL SGAH OUTPATIENT VOLUME 2012 (N=46848)
0
10
20
30
40
50
60
70
80
90
100
Hispanic White Black Asian Other Unknown
All OthersMedicarePrivate InsuranceMedicaidSelf-Pay (Uninsured)
36 | Shady Grove Adventist Hospital
Inpatient Quality MeasuresTable 13 shows composite scores of inpatient quality measures for SGAH for 2012 A composite score of 96 percent or higher was achieved in each group Because of overall high scores achieved within and across each of the measurement groups differences between racial and ethnic groups were not calculated
TABLE 13 SGAH INPATIENT QUALITY MEASURES - 2012
Measurement Group Numerator Denominator PercentagePneumonia Care (PN)1 598 618 96765
Heart Failure (HF)2 1093 1100 99366
Acute Myocardial Infarction (AMI)3 1290 1292 99857
Surgical Care Improvement Project (SCIP)4 8653 8752 98878
1Measure group includes PN-3a PN-3b PN-6 PN-6a PN-6b PN-PACS2Measure group includes HF-1 HF-2 HF-3 HF-PACS3Measure group includes AMI-1 AMI-2 AMI-3 AMI-5 AMI-7a AMI-8a AMI-10 AMI-PACS4Measure group includes SCIP-Card-2 SCIP-Inf-1a SCIP-Inf-1b SCIP-Inf-1c SCIP-Inf-1d SCIP-Inf-1e SCIP-Inf-1f SCIP-Inf-1g SCIP-Inf-1h SCIP-Inf-2a SCIP-Inf-2b SCIP-Inf-2c SCIP-Inf-2d SCIP-Inf-2e SCIP-Inf-2f SCIP-Inf-2g SCIP-Inf-2h SCIP-Inf-3a SCIP-Inf-3b SCIP-Inf-3c SCIP-Inf-3d SCIP-Inf-3e SCIP-Inf-3f SCIP-Inf-3g SCIP-Inf-3h SCIP-Inf-4 SCIP-Inf-6 SCIP-Inf-9 SCIP-PACS SCIP-VTE-1 SCIP-VTE-2 5Percentage range across individual measures for PN 9231-1006Percentage range across individual measures for HF 9887-1007Percentage range across individual measures for AMI 9953-1008Percentage range across individual measures for SCIP 9143-100
In October 2013 SGAH was named as a Top Performer on Key Quality Measuresreg by The Joint Commission meaning they achieved at least 95 percent compliance with certain measures for 2012 performance At SGAH only two measures were found to have a score lower than 95 percent while 35 were found to have scores of 98 percent and above 13 of which were perfect scores
Pneumonia Care (PN)Among six quality measures the one with the lowest score was blood culture on arrival for intensive care unit (ICU) patients with a score of 923 percent However due to a small sample size the remaining 77 percent represents only two patients Measures of initial antibiotic selection in immunocompetent patients were found to have a score of 9615 percent among 156 non-ICU patients and 100 percent for seven ICU patients
Heart Failure (HF)A total of four quality measures were evaluated for HF Among them discharge instructions were provided to 9887 percent of patients angiotensin converting enzyme inhibitor (ACEI) or angiotensin receptor blockers (ARB) for left ventricular systolic dysfunction (LVSD) scored 992 percent and patient appropriateness of care compliance scored 9914 percent The fourth measure Evaluation of left ventricular systolic (LVS) function had a perfect score of 100 percent
Acute Myocardial Infarction (AMI)Among the eight AMI measures one was not indicated for any patients and twomdashaspirin at arrival and patient appropriateness of care compliancemdashhad a score of 9953 percent and 9963 percent respectively The remaining five measures had a perfect score of 100 percent
Shady Grove Adventist Hospital | 37
Surgical Care Improvement Project (SCIP)Among the four groups of inpatient quality measures SCIP had the largest number of measures with a total of 32 Seven of these measures were not applicable to the patients seen Twenty-one measures had a score of at least 985 percent while six had a perfect score of 100 percent Two of the measures discontinuation of prophylactic antibiotics within 24 hours after hysterectomy and beta blocker given during the perioperative period for those on beta blocker therapy preadmission had the lowest scores of 9143 percent and 9651 percent respectively
Shady Grove Adventist Hospital
38 | Shady Grove Adventist Hospital
Hospital ReadmissionsTable 14 below shows the all-cause 30-day readmission percentages for patients at SGAH during 2012 The overall readmission percentage for SGAH was 62 percent There were 1300 readmissions and 20982 discharges Readmissions for Black patients were the highest of all racialethnic groups (80) The percentage for White patients was lower (72) Readmissions for all other racialethnic groups were lower than the hospital average (42 for Asian patients and 47 for Hispanic patients)
TABLE 14 ALL CAUSE 30-DAY READMISSIONS BY PATIENT RACEETHNICITY SGAH 2012
RaceEthnicity ReadmissionsBlack 80
White 72
Asian 42
Hispanic 47
Other 39
Unknown -
Total 62
Shady Grove Adventist Hospital | 39
Patient ExperienceTable 15 below shows the percent of SGAH inpatients who responded positively to selected HCAHPS questions (top box scores) by raceethnicity in 2012
Hispanics Asians and Blacks discharged from SGAH were more likely to respond positively to the patient experience items than White patients for most measures Overall ratings of the hospital were more positive for non-White patients (particularly Hispanics) compared to White patients More Hispanics and Asians were likely to recommend the hospital than were White patients Also compared to Whites non-White patients were more likely to be satisfied with communication with doctors and nurses These findings are similar to those reported in several studies of racialethnic differences in patientsrsquo experience of care3031 Survey respondents across racial groups seemed particularly satisfied with staff courtesy and written discharge instructions demonstrating commitment to ensuring continuity of care for patients Nursing communication was viewed more favorably among patients responding to this yearrsquos survey compared with last yearrsquos responses
TABLE 15 SELECTED TOP BOX RESPONSES TO HCAHPS QUESTIONS BY RACEETHNICITY SGAH 2012 (IN PERCENTS)
All SGAH Patients
White Patients
Black Patients
Asian Patients
Hispanic Patients HSTM
Likely to recommend 641 597 657 742 783 742Overall rating of hospital 566 546 599 519 718 706
Courtesy of doctors 817 784 842 808 859 879
Doctors listen carefully 738 694 749 788 833 808Clear communication by doctors 708 666 732 771 764 773
Courtesy of nurses 785 739 81 764 843 863
Nurses listen carefully 69 624 739 756 653 779Clear communication by nurses 682 639 732 702 694 761
Talking about help after discharge 792 773 762 817 754 833
Providing written discharge instructions 906 899 903 898 953 883
Percentages averaged across all persons self-identifying as Hispanic or Latino Includes Puerto Ricans Mexicans Mexican-Americans Chicanos Cubans and others Race and ethnicity are not mutually exclusive in this table Therefore if a patient identified himself as both Black and Hispanic his responses are included in both columns
40 | Shady Grove Adventist Hospital
Table 16 below shows the percent of SGAH inpatients who responded positively to the selected HCAHPS questions (top box scores) stratified by the patientrsquos level of education Results reveal a decrease in satisfaction scores as level of education increases Comparisons between individuals who completed more than four years of college and those who did not graduate from high school reveal a greater than 10 percent difference in the ldquolikelihood to recommendrdquo measure for respondents Because a significant proportion of residents in Maryland (eg Montgomery County) and the DC metropolitan area are highly educated it may be important to understand the relationship between education level and satisfaction with hospital care3233 In the future efforts that address differences in patient experience between patients with different levels of education may be necessary to reach our performance goal of achieving top quartile patient experience
TABLE 16 SELECTED TOP BOX RESPONSES TO HCAHPS QUESTIONS BY EDUCATION LEVEL SGAH 2012 (IN PERCENTS)
More than 4 years of
college
Graduated from
4-year college
Some college
or earned a 2-year degree
Graduated from high school or earned a
GED
Some high
school but did
not graduate
Completed the 8th
grade or less
Likely to recommend 746 705 771 830 852 786
Overall rating of hospital 676 565 643 781 800 667
Courtesy of doctors 624 618 672 722 818 867
Doctors listen carefully 791 781 825 837 889 733Clear communication by doctors 715 690 719 763 833 800
Courtesy of nurses 690 684 687 732 778 733
Nurses listen carefully 799 748 777 805 800 667Clear communication by nurses 915 922 894 883 889 786
Talking about help after discharge 531 505 564 623 818 733
Providing written discharge instructions 637 565 633 673 784 786
Shady Grove Adventist Hospital | 41
Office of Minority Health CLAS Standards
In April 2013 the Office of Minority Health of the US Department of Health and Human Services released the Enhanced Culturally and Linguistically Appropriate Services (CLAS) Standards to improve quality eliminate health disparities and advance health equity These standards originally developed in 2000 were updated to reflect growing diversity in the nation and to improve understanding and use of culturally appropriate care at healthcare organizations The revised CLAS standards fall under four categories (1) principal standard (2) governance leadership and workforce (3) communication and language assistance and (4) engagement continuous improvement and accountability
PRINCIPAL STANDARD1) Provide effective equitable understandable and respectful quality care and services that are responsive
to diverse cultural health beliefs and practices preferred languages health literacy and other communication needs
Governance Leadership and Workforce2) Advance and sustain organizational governance and leadership that promotes CLAS and health equity
through policy practices and allocated resources3) Recruit promote and support a culturally and linguistically diverse governance leadership and workforce
that are responsive to the population in the service area4) Educate and train governance leadership and workforce in culturally and linguistically appropriate
policies and practices on an ongoing basis
Communication and Language Assistance5) Offer language assistance to individuals who have limited English proficiency andor other communication
needs at no cost to them to facilitate timely access to all health care and services6) Inform all individuals of the availability of language assistance services clearly and in their preferred
language verbally and in writing7) Ensure the competence of individuals providing language assistance recognizing that the use of
untrained individuals andor minors as interpreters should be avoided8) Provide easy-to-understand print and multimedia materials and signage in the languages commonly
used by the populations in the service area
Engagement Continuous Improvement and Accountability9) Establish culturally and linguistically appropriate goals policies and management accountability and
infuse them throughout the organizationsrsquo planning and operations10) Conduct ongoing assessments of the organizationrsquos CLAS-related activities and integrate CLAS-related
measures into assessment measurement and continuous quality improvement activities11) Collect and maintain accurate and reliable demographic data to monitor and evaluate the impact of
CLAS on health equity and outcomes and to inform service delivery12) Conduct regular assessments of community health assets and needs and use the results to plan and
implement services that respond to the cultural and linguistic diversity of populations in the service area13) Partner with the community to design implement and evaluate policies practices and services to
ensure cultural and linguistic appropriateness14) Create conflict- and grievance-resolution processes that are culturally and linguistically appropriate to
identify prevent and resolve conflicts or complaints15) Communicate the organizationrsquos progress in implementing and sustaining CLAS to all stakeholders
constituents and the general public
For more information about the enhanced CLAS Standards visit httpminorityhealthhhsgovtemplatesbrowseaspxlvl=2amplvlID=15
Adventist Behavioral Health
Adventist Behavioral Health | 43
SPOTLIGHT ON MENTAL HEALTH
Mental health includes emotional psychological and social well-being dealing with how we think and how we feel34 Mental disorders are health conditions that are characterized by alterations in normal cognitive function resulting in a change in mood andor behavior associated with distress andor impaired functioning In any given year one in four adults suffers from a mental health illness in the United States35 One in seventeen live with a serious mental illness such as schizophrenia major depression or bipolar disorder Among children the rates are slightly higher about one in 10 is diagnosed with a serious mental or emotional disorder the most common of which is attention deficit hyperactivity disorder (ADHD) Although an estimated 575 million adults and 96 million children suffer from mental disorders each year in the United States only 362 million Americans account for the $575 billion spent annually on mental health services indicating that many individuals may not be receiving the care they need36 In 2012 approximately 60 percent of adults and nearly half of youth ages 8 to 15 with a mental illness received no mental health services37 The impact of mental illness is far reaching nearly $1932 billion in earnings is lost annually mood disorders such as depression are the third leading cause of hospitalization for youth and adults ages 18 to 44 and suicide is the 10th leading cause of death in the United States
Among Marylandrsquos 56 million residents an estimated 175000 adults and 62000 children live with a serious mental health disorder38 However the proportion of individuals suffering from mental health illness far outweighs the services available Marylandrsquos public mental health system provides services to only 19 percent of adults who live with a serious mental illness Untreated mental illness can have deadly consequences For example in 2006 495 Maryland residents died by suicide which is nearly always the result of untreated or under-treated mental illness
In Montgomery County one in ten residents have been diagnosed with an anxiety disorder a general term used to describe a condition with excessive and unrealistic worrying anxiety and persistent fear3940
About 80 percent of Montgomery County residents report good mental health (ie two or fewer days of poor mental health a month) higher than the state average of 77 percent The level of substance abuse in Montgomery County continues to increase yearly and aligns with the state average In Wicomico County 79 percent of residents report feelings of good mental health41
MENTAL HEALTH DISPARITIES BY RACEETHNICITY
Despite the fact that mental illness is prevalent among racial and ethnic minorities as it is among Whites minorities have less access to and are less likely to use mental health services resulting in a higher proportion of individuals with unmet mental health needs Minority groups are also less likely to seek out mental health counseling and treatment than Whites decreasing their chances of having positive health outcomes Many factors contribute to onersquos overall mental health status including environment financial stability gender and raceethnicity
People are classified as having a serious mental illness if they currently or at any time in the past year had a diagnosable mental behavioral or emotional disorder resulting in substantial impairment in carrying out major life activities43 When stratified by race and ethnicity 53 percent of Whites 37 percent of Blacks and 4 percent of HispanicLatinos suffer from serious mental illnesses These rates of serious mental illness often mirror high rates of illicit drug use and abuse and act as a risk factor for suicide In regards to substance abuse treatment 15 percent of Blacks who needed treatment received it compared to only 7 percent of Hispanics and 2 percent of Asians44 These statistics could be due to barriers such as social stigmas cost of care language mistrust of physicians or poor access to mental health services After age-adjustment Blacks have a suicide rate of 5 per 100000 individuals which is lower than Hispanics (6 per 100000) and nearly half the rate of Whites (125 per 100000)45 The suicide rate for Blacks is 60 percent lower than that of non-Hispanic Whites however the death rate for Black men was almost four times that for Black women in 2009 Asian women have been found to have the highest suicide rates of all women over the age of 65 Among Hispanic girls of high school age suicide attempts were 70 percent higher than
44 | Adventist Behavioral Health
for White girls of the same age in 201146
Blacks have been found to be over-diagnosed with schizophrenia and under-diagnosed with mood disorders While Blacks are less likely to suffer from major depressive disorders they are more likely to rate their depression as severe and disabling47 Blacks are also less likely than Whites to receive mental health treatment at higher income and education levels while Hispanics are less likely to receive mental health treatment than Whites at every income and education level48 According to the Substance Abuse and Mental Health Services Administration poor individuals experience high rates of mental health treatment (158) compared to those who were near poor (128) or those who were not poor (13) underscoring the correlation between poverty and poor mental health49
In 2008 the state of Maryland spent $899 million dollars for mental health services These expenditures allocated to bridge the gap in mental health disparities have risen each year but have continued to fall short of meeting the needs of target populations Marylandrsquos Behavioral Risk Factor Surveillance System showed that minority groups in the state under-utilize mental health services In every age group non-Hispanic Whites are more likely to see a provider for a mental health problem than non-Hispanic Blacks despite having an equal burden Similar to national rates Maryland also reports similar statistics in regards to suicide rates For intentional self-harm 11 percent of Whites compared to 53 percent of Blacks and 91 percent of the overall population report intentionally harming themselves50 In Montgomery County White Medicaid recipients were more likely to receive inpatient outpatient andor professional services for episodic mood disorders (39) than Blacks (35) Hispanics (13) or Asians (58)51 Black Medicaid recipients in the county were more likely to receive support for attention deficit disorder attention deficit hyperactivity disorder and substance abuse than any other racial ethnic group In regards to substance abuse 143 percent of the county residents had reported levels of binge drinking only Whites exceeded the average rate Blacks were more likely to report being current smokers than adults of other racialethnic groups in the county In Wicomico County non-Hispanic Whites were more likely (818) to report positive feelings of mental health than non-Hispanic Blacks (724)52 These rates differ from national statistics This could be the result of changes in social and environmental support experienced by different sub-groups Blacks in Dorchester County experienced the highest rates of emergency department visits because of behavioral health issues (15138 per 100000 individuals) compared with Hispanics (3737 visits per 100000) and Whites (9789 visits per 100000)
ADVENTIST BEHAVIORAL HEALTH
Adventist Behavioral Health (ABH) is the most comprehensive provider of behavioral health services in the National Capital area providing a wide-ranging spectrum of services and treatment options With locations in Montgomery County in Maryland and on the Eastern Shore (ABH-Eastern Shore) of Maryland ABH offers a broad range of services such as acute care residential treatment special education and general education programs chemical dependency programs partial hospitalization programs intensive outpatient services and community-based residential services In addition to a free-standing facility in Rockville services are offered at Washington Adventist Hospital in Takoma Park Services are provided in a variety of settings including hospital-based programs residential treatment centers school programs residential group homes outpatient services and community-based services ABHrsquos inpatient treatment programs provide treatment for a range of mental and behavioral health illnesses including schizophrenia mood disorder post-traumatic stress disorder suicide ideations bipolar disorder and depression
The following tables and figures present more detailed information on patients treated at both the Montgomery County and Dorchester County campuses of ABH in 2012
Adventist Behavioral Health | 45
Snapshot of DiversityThis year patient data from Adventist Behavioral Health (ABH) is included in the Health Equity Report for the first time ABH has facilities in Montgomery County serving patients in Montgomery Prince Georgersquos and Frederick counties (ABH-Rockville) Additionally ABH-Eastern Shore primarily serves the pediatric population of Dorchester and Wicomico counties Due to the very different populations treated at each location most of the data for ABH are presented by location
A total of 3121 unique patients were seen at ABH-Rockville in 2012 Table 17 and Figure 17 below show the distribution of patients by raceethnicity Almost 39 percent of the patients were White and approximately 23 percent of the patients were Black A relatively small percentage of patients identified as Hispanic (7) or Asian (2) In comparison for a relatively large number of patients (collectively almost 30) race was classified as lsquoOtherrsquo or lsquoUnknownrsquo (Note See ldquoAbout the 2013 Health Equity Reportrdquo for details on methodology sources limitations inclusionsexclusions missing data and other information about the data reported here)
TABLE 17 AND FIGURE 17 ALL UNIQUE PATIENTS BY RACEETHNICITY ABH-ROCKVILLE 2012 (N=3121)
RaceEthnicity Percent ()White 386
Black 229
Hispanic 68
Asian 23
Other 125
Unknown 169
Total 100
In 2012 a total of 287 unique patients were seen at ABH-Eastern Shore ABH-Eastern Shore treats children and adolescents only Table 18 and Figure 18 show the racialethnic breakdown of the unique patients treated at ABH-Eastern Shore in 2012 Reflecting the population of the Eastern Shore nearly all of the patients treated at ABH identified as either White (66) or Black (25)
TABLE 18 AND FIGURE 18 ALL UNIQUE PATIENTS BY RACEETHNICITY ABH-EASTERN SHORE 2012 (N=287)
RaceEthnicity Percent ()White 662
Black 251
Hispanic 35
Asian 07
Other 45
Total 100
White 386
Black 229
Hispanic 68
Asian 23
Other 125
Unknown 169
White 662
Black 251
Hispanic 35
Asian 07
Other 45
46 | Adventist Behavioral Health
In addition to the patients seen at ABH-Rockville and ABH-Eastern Shore there were 1688 unique patients classified in their medical record as either a walk-in or call-in and not associated with either location Including these patients there was a combined total of 7635 patient encounters for all of ABH (multiple visits at Rockville and Eastern Shore locations and call-inswalk-ins) in 2012 The racialethnic composition of ABH patients representing all encounters is presented in Table 19 and Figure 19 below As most of the ABH patient volume can be attributed to patients treated at the Rockville location the racialethnic composition seen in Table 19 and Figure 19 is fairly similar to the data seen in Table 17 and Figure 17
TABLE 19 AND FIGURE 19 ALL PATIENT ENCOUNTERS BY RACEETHNICITY ABH 2012 (N=7635)
RaceEthnicity Percent ()White 376
Black 218
Hispanic 63
Asian 18
Other 108
Unknown 218
Total 1001 Due to rounding
White 37
Black 22
Hispanic 6
Asian 2
Other 11
Unknown 22
Adventist Behavioral Health - Rockville Campus
Adventist Behavioral Health | 47
Interpreter ServicesFigure 20 shows the most frequently requested languages for interpretation by phone at ABH-Rockville ABH-Rockville placed more than 240 calls exceeding 4300 minutes The vast majority of the calls were for Spanish language interpretation followed by Korean Mandarin and Farsi In addition to the languages highlighted below calls were placed for four additional languages Urdu Tibetan Vietnamese and German (All Others 20) For ABH-Eastern Shore 14 calls were made during 2012 exceeding 200 minutes All of the calls placed by ABH-Eastern Shore were for Spanish interpretation
FIGURE 20 OVER-THE-PHONE INTERPRETER USE BY NUMBER OF CALLS ABH-ROCKVILLE 2012
Spanish 920
Korean 28
Mandarin 20
Farsi 12 All
Others 20 Other
80
Adventist Behavioral Health - Eastern Shore Campus
48 | Adventist Behavioral Health
In-DepthHEALTH INSURANCE AND PRIMARY DIAGNOSIS
Figure 21 below shows health insurance coverage by raceethnicity for all unique patients seen at ABH-Rockville in 2012 Hispanic Black and Asian patients were covered primarily by Medicaid However the majority of White patients were covered by private insurance Interestingly nearly all of the patients for whom raceethnicity was unknown had no insurance coverage
FIGURE 21 HEALTH INSURANCE COVERAGE BY RACEETHNICITY FOR ALL UNIQUE PATIENTS ABH-ROCKVILLE 2012 (N=3121)
Table 20 below shows health insurance coverage by raceethnicity for all unique patients seen at ABH-Eastern Shore in 2012 As the table shows most of the patients about 67 percent overall were covered by Medicaid Approximately 64 percent of White patients and 75 percent of Black patients had Medicaid as a primary insurer ABH-Eastern Shore treats children and adolescents only therefore Medicare is not a payer
0
10
20
30
40
50
60
70
80
90
100
Hispanic White Black Asian Other Unknown
All OthersPrivateMedicareMedicaidSelf-Pay (Uninsured)
Adventist Behavioral Health | 49
TABLE 20 HEALTH INSURANCE COVERAGE BY RACEETHNICITY FOR ALL UNIQUE PATIENTS ABH-EASTERN SHORE 2012 (N=287)
Hispanic () White () Black () Asian () Other ()
Medicaid 700 642 750 0 769
Private 300 358 250 100 231
Total 100 100 100 100 100
PRIMARY DIAGNOSIS
The Diagnoses tables below show the primary diagnoses of unique patients seen at ABH in 2012 This table shows only the first visit per each unique patient Therefore it is possible that different diagnoses were made for patients with multiple visits in 2012 Also there were often secondary or tertiary diagnoses that are not reflected in the tables below
Table 21 below describes the primary diagnoses for patients treated at ABH-Rockville in 2012 The most common primary diagnosis was lsquoepisodic mood disordersrsquo Mood disorders are characterized by persistent feelings of sadness or fluctuations from extreme happiness to extreme sadness Mood disorders include bipolar episodes and depressive episodes Schizophrenic disorders account for approximately 11 percent of the patients seen For nearly one quarter of patients treated the medical record does not include any information on the primary diagnosis
TABLE 21 PRIMARY DIAGNOSES OF PATIENTS TREATED AT ABH-ROCKVILLE 2012 (N=3121)
Primary Diagnosis Percent ()Schizophrenic Disorders 106
Episodic Mood Disorders 521
Psychosis (Unspecified) 53Alcohol or drug dependence or alcohol or drug abuse (non-dependent) 31
Depressive Disorder not elsewhere classified 55
Other 04
Unknown (No information in medical record) 229
Total 999 ()Due to rounding
Table 22 shows the primary diagnoses for unique patients treated at ABH-Rockville stratified by raceethnicity Black patients were most likely to be diagnosed with a schizophrenic disorder (about 18) compared to 15 percent or less for all other racialethnic groups For all races episodic mood disorders accounted for the majority of the diagnoses Asian patients were most likely to be diagnosed with unspecified psychosis and Hispanic patients were most likely to be diagnosed with depressive disorder (not elsewhere classified) The percentage of patients without a diagnosis recorded in their medical record ranged from about 8 to 10 percent for patients of all races
50 | Adventist Behavioral Health
TABLE 22 PRIMARY DIAGNOSES BY PATIENT RACEETHNICITY ABH-ROCKVILLE 2012 (N=3121)
Hispanic White Black Asian Other UnknownSchizophrenic Disorders 70 110 182 153 110 00
Episodic Mood Disorders 620 660 557 556 665 02
Psychosis (Unspecified) 56 42 91 125 72 00
Alcohol or drug dependence or alcohol or drug abuse (non-dependent)
33 42 46 28 15 00
Depressive Disorder not elsewhere classified
127 62 45 42 92 00
Other 14 04 03 00 05 00
Unknown 80 80 76 97 41 998
Total 100 100 100 100 100 100
Table 23 shows the primary diagnoses for all unique patients treated at ABH-Eastern Shore ABH-Eastern Shore treats children and adolescent patients only The most common diagnosis among the patients was episodic mood disorders (55) The second most common diagnosis was attention deficit hyperactivity disorder (12) For ABH-Eastern Shore patients the diagnoses that are included in lsquoOtherrsquo include the following unspecified psychosis anxiety disorder bulimia and emotional disturbances For two patients there was no diagnosis included in the medical record
TABLE 23 PRIMARY DIAGNOSES OF PATIENTS TREATED AT ABH-EASTERN SHORE 2012 (N=287)
Primary Diagnosis Percent ()Episodic Mood Disorders 551
Adjustment Reactions including PTSD 91
Depressive Disorder not elsewhere classified 101
Disturbance of Conduct not elsewhere classified 49Attention Deficit Disorder (Child) with Hyperactivity or Hyperkinetic syndrome 118
Other 84
Unknown (No information in medical record) 07
Total 1001Due to rounding
Adventist Behavioral Health | 51
Table 24 shows the primary diagnoses for unique patients treated at ABH-Eastern Shore stratified by patient raceethnicity As Table 18 showed above more than 90 percent of the ABH-Eastern Shore patients were White or Black therefore the percentages reported in Table 24 for Hispanic patients (N=10) and Asian patients (N=2) are inflated For both White and Black patients episodic mood disorders were the most common diagnoses Comparatively White patients were more likely to be diagnosed with depressive disorder and Black patients were more likely to be diagnosed with disturbance of conduct
TABLE 24 PRIMARY DIAGNOSES BY PATIENT RACEETHNICITY ABH-EASTERN SHORE 2012 (N=285)
Hispanic White Black Asian OtherEpisodic Mood Disorders 500 534 569 1000 750
Adjustment Reactions including PTSD
300 85 97 00 00
Depressive Disorder not elsewhere classified
200 122 42 00 83
Disturbance of Conduct not elsewhere classified
00 37 97 00 00
ADD (Child) with Hyper-activity or Hyperkinetic syndrome
00 127 111 00 167
Other 00 95 83 00 00
Total 100 100 999 100 100Due to rounding
52 | Adventist Behavioral Health
Selected Quality Measures for Adventist Behavioral Health The Hospital-Based Inpatient Psychiatric Servicersquos (HBIPS) Core Measure Set consists of seven measures to assess quality of care for patients discharged from free-standing psychiatric hospitals and acute-care hospitals with psychiatric units The following five measures are reported by race only in Table 25 (HBIPS 2 and HBIPS 3 which apply to hours in physical restraint and hours in seclusion were not included)
HBIPS 1 ndash Admission screening for violence risk substance use psychological trauma history and patient strengths completed
HBIPS 4 - Patient discharged on multiple antipsychotic medications
HBIPS 5 ndash Patient discharged on multiple antipsychotic medications with appropriate justification
HBIPS 6 ndash Post discharge continuing care plan created
HBIPS 7 ndash Post discharge continuing care plan transmitted to next level of care provider upon discharge
For HBIPS 1 there was nearly 100 percent compliance for all patients For HBIPS 4 and 5 there was more variation between patients from different racial groups For example more than 30 percent of Asian patients were discharged on multiple antipsychotic medications compared to 15 percent of White patients and 2 percent of Black patients However all patients had higher percentages of being discharged on multiple medications with appropriate justification (HBIPS 5) For White Black and Asian patients a post-discharge continuing care plan was created more than 90 percent of the time (HBIPS 6) However that plan was not always transmitted to the next level-of-care provider upon the patientsrsquo discharge (HBIPS 7)
TABLE 25 HBIPS QUALITY MEASURES BY RACE ALL PATIENTS ABH-ROCKVILLE 2012 (IN PERCENTS)
HBIPS 1 HBIPS 4 HBIPS 5 HBIPS 6 HBIPS 7White 999 149 650 907 865
Black 996 16 775 908 867
Asian 100 315 765 929 894
Specialty Care
54 | Specialty Care
Adventist Home Care ServicesSNAPSHOT OF DIVERSITY
Adventist Home Care Services (AHCS) a part of Adventist HealthCare Inc (AHC) offers a variety of programs and services to residents in the Washington DC metropolitan area and suburban Maryland to assist patients while they recuperate from an illness injury or surgical procedure They offer a full range of supportive services to assist with personal care or daily activities Among the services that they provide are nursing (eg cardiac care wound care diabetes management and medication management) rehabilitation (eg physical therapy and occupational therapy) and maternalchild services (eg lactation support phototherapy etc) The services provided allow patients to receive assistance upon discharge from a hospital or even prevent an initial admission to a hospital Many avoidable hospital readmissions are related to a lack of support and resources upon discharge from the hospital5354 With these and other services AHCS plays a vital role in filling these gaps and ensuring a continuum of care for patients With proper discharge planning and access to appropriate medicalclinical support resources patients are more likely to experience positive outcomes which may reduce the need for inpatient care As AHC continues to shift toward a population health approach home care services will provide critical support to address the health needs of people in the communities we serve
Table 26 below shows the patients who received AHCS services in 2012 More than 5700 unique patients received services in 2012 These patients accounted for more than 77035 visits during 2012 Table 25 shows the breakdown of unique AHCS patients by raceethnicity Just more than half of the patients were White (51) and 35 percent were Black Hispanic patients and Asian patients accounted for 7 percent and 6 percent of patients respectively (Note See ldquoAbout the 2013 Health Equity Reportrdquo for details on methodology sources limitations inclusionsexclusions missing data and other information about the data reported here)
TABLE 26 ALL UNIQUE PATIENTS BY RACEETHNICITY AHCS 2012 (N=5736)
RaceEthnicity Percent ()White 508
Black 349
Hispanic 70
Asian 64
Other 07
Unknown 03
Total 1001Due to rounding
PRIMARY DIAGNOSIS AND HEALTH INSURANCE
More than half of AHCS patients were diagnosed as being ldquonot currently sickrdquo or having a ldquoproblem that influenced their health statusrdquo which includes being in a post-procedural state having problems with limbs having motor or sensory problems and receiving dialysis (ICD 9 codes V40-V82) Other prevalent diagnoses included diseases of the circulatory system skin and subcutaneous tissue and musculoskeletal system
Specialty Care | 55
Table 27 shows primary health insurance coverage for unique patients who received AHCS services We are not able to report this information by patient raceethnicity However the data shows that the majority of patients (64) and visits (75) were covered by Medicare Nearly all of the remaining patients were covered by private insurance including health maintenance organizations (HMOs) Less than 4 percent of all patients and 3 percent of all visits were covered by Medicaid or the patient (uninsured) This data suggests that community members without private insurance who are not Medicare eligible may face significant barriers to accessing the services provided by AHCS However it is notable that AHCS had more than 300 charity visits during 2012
TABLE 27 HEALTH INSURANCE COVERAGE FOR ALL UNIQUE PATIENTS AHCS 2012 (N=5736)
Unique Patients ()
Visits () (N=77035)
Medicare 638 747
Medicaid 32 24
PrivateHMO 327 228
Self-Pay (Uninsured) 03 02
Total 100 1001Due to rounding
Of all the visits that AHCS made in 2012 skilled nursing services and physical therapy accounted for the vast majority of services provided to patients (almost 85) The third and fourth most common services were home health aide and occupational therapy services Other services included speechlanguage and medical social work
INTERPRETER SERVICES
Figure 22 shows the languages requested most frequently for interpretation by phone at AHCS AHCS placed more than 280 calls exceeding 3300 minutes As seen in Figure 22 the vast majority of calls placed were for Spanish the second and third most requested languages were Mandarin and Korean In addition to the languages highlighted below calls were placed for seven additional languages including Amharic and Russian (All Others 32)
FIGURE 22 OVER-THE-PHONE INTERPRETER USE BY NUMBER OF CALLS AHCS 2012
Spanish 929
Mandarin 21
Korean 18
All Others 32
Other 71
56 | Specialty Care
Adventist Rehabilitation Hospital of MarylandSNAPSHOT OF DIVERSITY
Adventist Rehabilitation Hospital of Maryland (ARHM) is the first and only acute rehabilitation hospital in Montgomery County offering specialized inpatient and outpatient treatment for persons with functional limitations ARHM primarily serves adults 18 years or older who largely reside in Montgomery County (78) or Prince Georgersquos County (18)
ARHM has two hospital locations a free-standing 55-bed hospital adjacent to SGAH in Rockville and a 32-bed hospital located in WAH in Takoma Park Outpatient services are provided at both the Rockville location and a community-based center in Silver Spring Maryland
ARHM offers comprehensive rehabilitation programs for traumatic brain injuries spinal cord injuries strokes amputations orthopedic injuries and surgeries sports related injuries work-related injuries cardiopulmonary conditions and neurological disorders Currently ARHM is the only acute rehab facility within a five-state region with a Commission on Accreditation Facilities (CARF) accreditation for all four of its specialty programs stroke brain injury spinal cord injury and amputee It was one of the first acute rehabilitation facilities in the nation to earn specialty accreditation for its amputee program Further ARHM was recognized in 2013 by the Maryland Patient Safety Center (MPSC) for its innovative patient safety program to reduce acute-care readmissions and increase patient safety Like AHCrsquos other specialty entities the specialized services provided by ARHM illustrate the organizationrsquos commitment to population-based care and dedication to improve the overall health and well-being of the communities we serve
Approximately 1500 unique inpatients were treated at ARHM in 2012 The stratification of these patients by raceethnicity is illustrated in Table 28 below Data on outpatients are not presented here The majority of inpatients treated at ARHM (about 58) were White The percentage of White patients is nearly double the percentage of Black patients who account for about 30 percent of the patient population Hispanic patients and Asian patients account for nearly 6 and 7 percent of the remaining patients respectively (Note See ldquoAbout the 2013 Health Equity Reportrdquo for details on methodology sources limitations inclusionsexclusions missing data and other information about the data reported here)
TABLE 28 ALL UNIQUE PATIENTS BY RACEETHNICITY ARHM 2012 (N=1571)
RaceEthnicity Percent ()White 575
Black 300
Hispanic 57
Asian 66
OtherUnknown 02
Total 100
Specialty Care | 57
HEALTH INSURANCE
Table 29 below shows health insurance coverage for inpatients seen at ARHM for 2012 Sixty-two (62) percent of inpatients were covered by Medicare while 30 percent had private or commercial insurance Less than 10 percent of inpatients were covered by Medicaid or were uninsured
TABLE 29 HEALTH INSURANCE COVERAGE FOR ALL UNIQUE PATIENTS ARHM 2012 (N=1571)
Percent ()Private Insurance 291
Medicare 619
Medicaid 70
All Others 16
Self-Pay (Uninsured) 04
Total 100
INTERPRETER SERVICES
Figure 23 shows the languages most frequently requested for phone interpretation at ARHM ARHM placed more than 870 calls in 2012 exceeding 14300 minutes Spanish was the most frequently requested language at about 53 percent Mandarin was the second most requested language at almost 25 percent Russian and Farsi were the third and fourth most requested languages respectively In addition to the languages included in Figure 23 calls were placed for an additional 14 languages including Tagalog and Gujarati (All Others 38)
FIGURE 23 OVER-THE-PHONE INTERPRETER USE BY NUMBER OF CALLS ARHM 2012
Spanish 529
Mandarin 248
Russian 49
Farsi 34
Haitian Creole 29
Cantonese 26
Vietnamese 24
Korean 23
All Others 38
Other 174
Affordable Care Act Implementation in the State of Maryland
Maryland Governor Martin OrsquoMalley signed into law the Maryland Health Improvement and Disparities Reduction Act of 2012 to expand access to care reduce chronic illness and promote equity particularly in underserved areas known as Health Enterprise Zones (HEZs) The HEZ initiative was created to reduce racial and ethnic health disparities improve health care access and outcomes in underserved populations and reduce hospital readmissions Five locations in Maryland designated as health enterprise zones in 2013 will receive a range of incentives benefits and grant funding to address disparities MedStar St Maryrsquos Hospital Greater Lexington Park (St Maryrsquos County) Prince Georgersquos County Health Department Capital Heights Dorchester County Health Department Dorchester and Caroline counties Bon Secours Baltimore Health System West Baltimore and Anne Arundel Health System Annapolis For additional information about the HEZ initiative and specific proposals visit httpdhmhmarylandgovhealthenterprisezonesSitePagesUpdatesaspx
Marylandrsquos law to reduce health disparities includes requirements for health care organizations to collect standard categories of race and ethnicity and report efforts to track and reduce disparities In 2013 the Health Services Cost Review Commission of the Maryland Department of Health and Mental Hygiene (HSCRC) provided funding to the Center on Health Disparities at Adventist HealthCare to provide race ethnicity and language data collection training to Maryland hospital staff including patient registrars quality coordinators admission directors and leadership The Center and the Institute for Patient- and Family-Centered Care (IPFCC) in partnership with HSCRC and the Maryland Hospital Association (MHA) held three Train-the-Trainer sessions on how to collect and use patient data and address patientsrsquo concerns at MHA in Elkridge (Central Maryland) Shore Health System The Memorial Hospital at Easton (Eastern Maryland) and Frederick Memorial Hospital in Frederick (Western Maryland) Training sessions such as these serve as a valuable resource to hospital leadership and staff as they strive to be in compliance with data reporting requirements outlined by HSCRC Standardized collection of patient demographic data is important to inform quality improvement efforts address needs of vulnerable populations and ultimately reduce disparities Through the collaborative work of all the partners on this project hospitals across the state are now well-equipped to collect accurate data and provide the highest quality care to all residents of the state of Maryland
Efforts to Reduce Readmissions
60 | Efforts to Reduce Readmissions
BACKGROUND As a part of its strategic plan for 2010ndash2014 Adventist HealthCare (AHC) has employed a strategy of providing population-based care to the communities it serves Through the use of innovative and patient-centered discharge processes and the cultivation of community partnerships AHC has become a leader in its efforts to ensure patient wellness after discharge from its hospitals ldquoNearly one in five Medicare patients discharged from a hospitalmdashapproximately 26 million seniorsmdashis readmitted within 30 days at a cost of over $26 billion every yearrdquo55 While not all readmissions can be predicted or prevented it is estimated that more than $17 billion each year pays for readmissions that are in fact preventable56
Adventist Rehabilitation Hospital of Maryland (ARHM) and AHCrsquos acute-care hospitalsmdashShady Grove Adventist Hospital (SGAH) and Washington Adventist Hospital (WAH)mdashparticipate in the Partnership for Patients a CMS program with goals to improve patient safety and support effective transitions from hospitals to other settings57 Our hospitals are part of Premierrsquos Hospital Engagement Network (HEN) a collaborative of 450 hospitals and the largest CMS-approved HEN in the nation The HEN focuses on multiple areas that affect patient safety including preventable hospital readmissions HEN rates are calculated using the Admission-Readmission Revenue (ARR) method giving credence to Marylandrsquos modernized all-payer rate-setting system for hospital services an unprecedented effort to enhance care for patients improve health care outcomes and control costs across the state58 Participation in the HEN provides significant opportunities to exchange best practices among hospitals across the country to address care and safety for Medicare program participants Because of AHCrsquos commitment to quality and safety and its partnership with Walgreens Premier invited WAH to present their efforts at their annual Breakthroughs Conference in November 2013
A CALL TO ACTION
The need for action around reducing preventable readmissions has recently been reinvigorated with a sense of urgency due to new provisions in the Patient Protection and Affordable Care Act (ACA) The Medicare Readmission Reduction program which went into effect October of 2012 reduced payments up to one percent for hospitals with excess preventable readmission rates related to heart failure acute myocardial infarction and pneumonia59 This deduction will increase to two percent in 2014 and peak at three percent in 2015 while also expanding to conditions including chronic obstructive pulmonary disease and coronary bypass grafting In addition to financial penalties for doing poorly new Medicare policies have been instituted to provide financial rewards to those hospitals that are meeting or exceeding certain quality measures Several of these quality measures focus on discharge practices such as informing patients of symptoms to look out for post-discharge and inquiring if they will have the necessary help and support once they return home60
A high rate of preventable readmissions is often a complex problem stemming from multiple causes and therefore requires a multifaceted approach to remedy Over the past two years WAH has successfully implemented programs to enhance the discharge process for all patients adopted an added focus on high-risk patients and cultivated community partnerships to improve the continuum of care post-discharge Through its efforts WAH has seen a 45 percent reduction in readmissions decreasing from 11 percent in December of 2011 to 65 percent in September of 2013
At the same time SGAH has implemented programs to assist in the post-discharge care of high-risk patients partnering with post-acute care providers and using a disease-specific model to address the most vulnerable patients SGAH has seen a 107 percent reduction in readmissions decreasing from 683 percent in December of 2011 to 576 percent in August of 2013 The hospital continues to work on other disease specific initiatives to reduce readmissions
Efforts to Reduce Readmissions | 61
ARHM was recognized in 2013 by the Maryland Patient Safety Center (MPSC) for its innovative patient safety program to reduce acute-care readmissions and increase patient safety ARHM instituted new processes in the fall of 2010 to decrease the number of patients readmitted to acute-care hospitals by implementing a collaborative clinical review of each patient throughout the transfer process According to the hospitalrsquos medical director the program has resulted in fewer patients returning to acute-care hospitals and more patients being discharged home Nationally their ldquodischarge to homerdquo rates are in the 80th percentile (ie better than 80) of all hospitals in the country
In collaboration with partners Carelink Community Clinic Inc Family Services Inc and WAH Adventist Behavioral Health (ABH) is working to better serve the chronically mentally ill by providing necessary support in the community and expanding outpatient services ABH has increased its outreach to the community using multiple approaches to engage families in the treatment process From family days to providing transportation to treatment centers and using videoconferencing technologies these efforts have increased familiesrsquo access to patients contributed to positive treatment outcomes and reduced the incidence of readmission
OVERVIEW OF PROGRAMS
Enhancing the Discharge Process
Following discharge patients often return home feeling overwhelmed and unsure of next steps In order to simplify the transition AHC has been working to ensure that all discharged hospital patients who need support with follow-up care receive assistance with finding a physician and scheduling a primary care appointment before they leave the hospital For instance ABH is working with payers to establish what are known as ldquobridgerdquo services for individuals who have difficulty scheduling follow-up outpatient care within seven days Through a partnership with Walgreens both WAH and SGAH have been able to ensure that patients can easily fill prescriptions and speak to a pharmacist prior to discharge
The Walgreens Bedside Prescription Delivery Service initiated in June of 2011 is available to all inpatients and includes a follow-up call from the pharmacist within 48ndash72 hours of discharge During the follow-up call the pharmacist is able to answer questions about medications and provide additional patient education Among those patients taking part in this program there has been an increase in medication compliance and as a result improved health status and fewer emergent needs This patient resource has also contributed to reducing readmissions thus helping individuals stay well and complete a prescribed medication course Additional resources for patients are available as needed to assess and support patientsrsquo discharge needs (eg resources to address behavioral health needs outpatient case management and help with transition to adult day care)
Also both WAH and SGAH are enrolled as 340B outpatient pharmacy programs with Walgreens Through this federal program which provides reduced pricing for most drugs money is returning to the hospitals to be applied toward the cost of medication for underserved patients
Adopting an Added Focus on High-Risk Patients
Each patient receiving care at AHC hospitals varies both in their condition and in the resources and support to which they have access In order to ensure that those with more complex conditions and circumstances have the added support they need when they leave the hospital hospital staff (including nurse managers case managers and transition care team members) identify patients at high-risk for readmission and then provide appropriate follow-up care
62 | Efforts to Reduce Readmissions
Patients identified as high-risk (eg non-adherent to recommendations having multiple co-morbidities diagnosed with congestive heart failure or lacking a support system or resources) are able to benefit from multiple programs designed to help navigate the road to recovery SGAH and WAH participate in the WellTransitions Program (in partnership with Walgreens) which provides high-risk patients with three follow-up calls from a pharmacist within 30 days of leaving the hospital During these follow-up calls pharmacists are able to address questions around prescribed hospital medications home medications side effects dosage and any additional health issues the patient may have In addition both hospitalsmdashtogether with Adventist Home Care Services (AHCS)mdashhave developed the Healthy Heart at Home program that focuses on patients with congestive heart failure Pill boxes and scales are provided to patients to help them better manage their disease A cardiac nurse assists patients with education family support nutrition and medication management as well
In 2013 WAH and partner Conifer Health Solutions launched the My Health Placereg program which utilizes the model of a personal healthcare nurse Through this program the transitional care team ensures that all discharged high-risk patients have a scheduled follow-up appointment before leaving the hospital Each of these patients receives a My Health Placereg Passport booklet which includes the name and number of their doctor as well as the date time and location of their follow-up appointment Additional helpful information such as a phone number to call with questions reminders of what to bring to the follow-up appointment the duration of the hospital stay and the procedures that were performed is also included The Passport is available in English Spanish French and Amharic In addition to providing patients with a Passport a member of the care team meets with each patient prior to discharge and conducts three follow-up calls within 30 days of leaving the hospital The care team implements individualized interventions often meeting the needs of patients within one week of discharge Interventions may include support for a spouse or loved one assistance with sub-acute placement referrals to wound care to avoid unnecessary readmission home health services transition to a nursing home or hospice care and arranging transportation
Developing Community Partnerships
AHC fosters partnerships with community members and organizations to improve care transitions for discharged patients A Community Coalition to Improve Care Transitions was initially established as a method for each hospital to begin thinking outside the box to develop care coordination solutions for patients and reduce readmissions The coalition at WAH launched in March of 2013 has since grown into a partnership between 35 different health services throughout the community with a mission to improve the transition of care from hospital to community for residents of the region The partners meet monthly to collaboratively and creatively solve patient challenges with an aim to reduce preventable readmissions at acute-care hospitals by 20 percent over a three year period
At SGAH the coalition to develop and strengthen partnerships among providers serves patients throughout the greater community In May of 2013 the coalition began meeting quarterly with an aim to reduce readmissions by 10 percent over the following 12 months SGAH has several other successful partnerships in place through which they are able to offer patients invaluable resources (eg ranging from transportation to outpatient case management) to improve their health and primary care following discharge
In order to reach those in need of health care before they even come to the emergency department AHC has developed direct partnerships with three local housing facilitiesmdashand a fourth in progressmdashto provide accessible primary care Through these partnerships AHC has increased access to primary care services for elderly and underserved populations who otherwise may have gone without care
Efforts to Reduce Readmissions | 63
FUTURE DIRECTIONS
While it is difficult to determine the impact of programs to reduce readmissions both WAH and SGAH have been successful in achieving an overall reduction in readmission rates over the course of one and a half years Going forward AHC will continue to grow its readmission reduction initiatives and community partnerships while also expanding its focus to outpatient care Beginning in 2014 efforts will be put in place at WAH to address the needs of individuals who pay frequent visits to the emergency department One such program will assist patients with becoming better advocates for their own health Individuals at high risk for emergency department visits or for not following through with doctor appointments will be matched with volunteer health coaches These coaches will be available to accompany patients to their doctor appointments
Looking forward for SGAH greater emphasis will be put on addressing needs of uninsured and homeless patients Potential efforts include a partnership with the Montgomery County Agency on Aging to increase medical beds and funding for uninsured and homeless patients needed for short-term rehabilitation or continued treatment Additionally Shady Grove would like to obtain funding for increased community case management to assist with medication refills physician follow-up and compliance with treatments for homeless county residents
Conclusion and Next Steps
Conclusion and Next Steps | 65
Conclusion and Next Steps The Institute for Healthcare Improvementrsquos Triple Aim for improving the US healthcare system focuses on improving patient experience reducing costs for the population and improving the health of the community61 Meeting these strategic aims to achieve health equity requires targeted efforts that ldquoeliminate potentially avoidable differences or disparities in health between socially advantaged and disadvantaged groupsrdquo62
The 2013 Adventist HealthCare Health Equity Report presents a comprehensive snapshot of the patient populationsmdashstratified by race ethnicity and preferred languagemdashthat received care at Washington Adventist Hospital (WAH) and Shady Grove Adventist Hospital (SGAH) in 2012 In addition we include data from specialty care entities Adventist Behavioral Health Adventist Rehabilitation Hospital of Maryland and Adventist Home Care Services The report presents patient demographics and information about hospital readmissions quality measures primary diagnoses patient experiences with care and use of interpreter services for different populations receiving care at Adventist HealthCare hospitals and other entities
At the end of last yearrsquos Health Equity Report we offered a set of recommendations for hospitals and healthcare systems to improve quality of care and outcomes
1 Improve patient demographic data collection and increase transparency by reporting hospital performance data by race ethnicity and language preference data
2 Monitor differences in quality of care and healthcare outcomes to inform hospitalsrsquo strategic goals develop community outreach programs and target quality improvement efforts
3 Implement data-driven interventions to improve healthcare quality and outcomes
4 Promote the provision of culturally competent patient-centered care
This yearrsquos report highlights specific initiatives at Adventist HealthCare (AHC) to connect mission-driven strategies with quality and patient experience transitions in care and partnerships to improve outcomes for people and communities AHC has implemented various strategies to identify and monitor differences in health status that lead to inequalities in care among minority populations (Recommendations 2-3) In the summer of 2013 the Center on Health Disparities partnered with the Institute for Patient- and Family-Centered Care Maryland Hospital Association and the Health Services Cost Review Commission (HSCRC) to provide raceethnicity and language data collection training to Maryland hospitals in order to ensure accurate data collection and compliance with state data reporting requirements (Recommendations 1 4) Hospitals equipped with the knowledge and resources to collect use and monitor standardized patient demographic data are able to implement data-driven interventions that align with identified community health needs and enhance community benefit reporting Along with information from this report and findings from needs assessments AHC will be able to assess its progress at addressing disparities and community health needs and promoting culturally competent care (Recommendations 2 4) AHCrsquos community health needs assessment reports and implementation plans for its hospitals and other entities will be publicly available by the end of this year and early next year Next steps will include rolling out initiatives to address the needs and concerns of individuals and populations in the healthcare systemrsquos service areas (Recommendation 3)
Hospitals are embracing the idea of better managing ldquotransitions of carerdquo and ensuring that patients experience a smooth transition from inpatient to outpatient care Population-based care and access to care are important strategic goals for Adventist HealthCarersquos hospitals these goals are informed by community input and quality improvement efforts focused on improving the health of people in our communities (Recommendation 2) Specifically collaborative population-based initiatives such as the Community Coalitions to Improve Care Transitions patient and family engagement and patient safety programs have been effective at improving outcomes and reducing preventable hospital readmissions (Recommendation 4)
66 | Conclusion and Next Steps
In our last report we stated that effective patient-provider communication is essential to providing high-quality patient-centered care and is necessary for patient safety Patient experience data collected from patients who speak a language other than English is an important part of providing population-based care and demonstrates compliance with national standards for effective communication in health care In the third quarter of 2013 WAH began conducting patient experience surveys with limited English-proficient patients in response to the growing proportion of Hispanic patients being served there Patient-provider communication is a key factor in perceived experience of care Also patient-centered culturally appropriate discharge instructions are critical tools that help patients understand next steps for follow-up care upon leaving the hospital which factors into our ability to provide the best care possible (Recommendation 4) Next steps might include analysis of patient experience data in specific departments implementing culturally competent population-based initiatives
Information beyond race and ethnicity are important indicators to measure to ensure that patientsrsquo needs are met (Recommendations 1ndash3) Key indicators of interest might include age gender sexual orientation income education insurance status religion health status and disability status In some cases it may be necessary to survey specific samples of people from different populations using various methods (ie using online surveys vs paper or phone surveys) to assess perceptions of organizational cultural competence or the effectiveness of programs and initiatives (eg interpreter services)
In conclusion achieving health equity will require shifting the focus beyond access and health care delivery to quality and appropriateness of care as well as addressing disparities and numerous factors that play a role in shaping population health outcomes We encourage leadership in our hospitals and other healthcare organizations to use valuable hospital data and information about community needs to shift their focus to population health health equity and healthcare quality improvement
References
68 | References
References1 Braveman P (2006) Health disparities and
health equity Concepts and measurement Annual Review of Public Health 27(1) 167ndash194
2 Kindig D (2007) Understanding Population Health Madison Blackwell Publishing
3 Kindig D amp Stoddart G (2003) What is population health American Journal of Public Health 380ndash383
4 Center on Health Disparities 2010 Progress Report Partnering Toward a Healthier Future Social Determinants of Health Adventist HealthCare Inc Rockville MD
5 Office of Minority Health and Health Disparities (2012) Maryland Chartbook of Minority Health and Health Disparities Data 2012 Third edition Maryland Department of Health and Mental Hygiene Retrieved from httpdhmhmarylandgovmhhdSitePagesHealth20Equity20Dataaspx
6 Whitehead M (1992) The concepts and principles of equity in health International Journal of Health Services 22(3) 429ndash445
7 Institute of Medicine (2003) Unequal treatment Confronting racial and ethnic disparities in health care Washington DC The National Academies Press
8 Agency for Healthcare Research and Quality (2012) National Healthcare Disparities Report (13-0003) US Department of Health amp Human Services Retrieved from wwwahrqgovresearchfindingsnhqrdrindexhtml
9 May E L (2013) Population health management Defining the providerrsquos role Healthcare Executive 20ndash29
10 Stoto M A (2013) Population health in the Affordable Care Act era Academy Health 1ndash6
11 Center on Health Disparities 2011 Progress Report Partnering toward a healthier future Health disparities in the era of reform implementation Adventist HealthCare Inc Rockville MD
12 Ibid 113 US Department of Health and Human
Services (2011) Health equity amp disparities National Partnership for Action to End Health Disparities Retrieved from httpminorityhealthhhsgovnpatemplatesbrowseaspxlvl=1amplvlid=34
14 Ibid 6
15 Morrissey J (2012) 10 facts about population health Trustee 10ndash14
16 Managing population health The role of the hospital Health Research amp Educational Trust Chicago April 2012 Retrieved from wwwhpoeorg
17 Ibid 1618 Centers for Disease Control and Prevention
Chronic diseases The power to prevent the call to control At a glance 2009 US Department of Health amp Human Services Retrieved from httpwwwcdcgovchronicdiseaseresourcespublicationsaagchronichtm
19 Institute of Medicine (2013) Population health implications of the Affordable Care Act Workshop summary Washington DC The National Academies Press
20 Goldberg A (2013) It matters how we define health care equity Commentary Institute of Medicine Washington DC Retrieved from httpwwwiomeduHomeGlobalPerspectives2013DefineHealthCareEquityaspx
21 Center on Health Disparities 2012 Progress Report Partnering toward a healthier future Adventist HealthCare Health Equity Report Adventist HealthCare Inc Rockville MD
22 Hasnain-Wynia R Kang R Landrum M B Vogeli C Baker D amp Weissman J (2010) Racial and ethnic disparities within and between hospitals for inpatient quality of care An examination of patient-level Hospital Quality Alliance measures Journal of Health Care for the Poor and Underserved 21(2) 629ndash648
23 Centers for Medicare amp Medicaid Services (2013) Readmissions Reduction Program Retrieved from httpwwwcmsgovMedicare Medicare-Fee- for -Serv ice-PaymentAcuteInpatientPPSReadmissions-Reduction-Programhtml
24 Health Services Cost Review Commission Post-meeting Documents from the 497th Meeting of the Health Services Cost Review Commission May 1 2013 Maryland Department of Health and Mental Hygiene Retrieved from httpwwwhscrcstatemdusdocumentsCommissionMeeting201305-01hscrc-post-comm-meet-docs2013-05-01pdf
References | 69
25 Young GJ Meterko M amp Desai KR (2000) Patient satisfaction with hospital care Effects of demographic and institutional characteristics Medical Care 38(3) 325ndash334
26 Murray-Garciacutea J Selby J Schmittdiel J Grumbach K amp Quesenberry C (2000) Racial and ethnic differences in a patient survey Patientsrsquo values ratings and reports regarding physician primary care performance in a large health maintenance organization Medical Care 38(3) 300ndash310
27 Elliott M Lehrman W Goldstein E Hambarsoomian K Beckett M Giordano L (2010) Do hospitals rank differently on HCAHPS for different patient subgroups Medical Care Research and Review 67(1) 56ndash73 Retrieved from httpmcrsagepubcomcontent67156
28 Sauter M Hess A (2012) Americarsquos best (and worst) educated states Fox Report Retrieved from httpwwwfoxbusinesscompersonal-finance20121015americas-best-and-worst-educated-states
29 Kurtzleben D (2013) The 10 most educated US cities US News Retrieved from httpwwwusnewscomnewsbest-citiesslideshowsthe-10-most-educated-us-cities9
30 Ibid 2731 Goldstein E Elliott MN Lehrman
WG Hambarsoomian K Giordano LA (2010) Racialethnic differences in patientsrsquo perceptions of inpatient care using the HCAHPS survey Medical Care Research and Review 67(1) 74ndash92
32 Ibid 2833 Ibid 2934 US Department of Health amp Human
Services What is mental health Retrieved from MentalHealthgov website httpwwwmentalhealthgovbasicswhat-is-mental-healthindexhtml
35 The National Alliance on Mental Illness (2013 March) Mental illness facts and numbers Retrieved from httpwwwnamiorgfactsheetsmentalillness_factsheetpdf
36 National Institute of Mental Health (2006) Mental healthcare cost data for all Americans Retrieved from httpwwwnimhnihgovstatistics4COST_AM2006shtml
37 Ibid 35
38 National Alliance on Mental Illness State Advocacy 2010 State statistics Maryland Retrieved from httpwwwnamiorgContentManagementContentDisplaycfmContentFileID=93498
39 Anxiety amp Stress Center PC Generalized anxiety disorder (GAD) Retrieved from httpanxiety-stresscentercomanxietygeneralized-anxiety-disorder
40 Maryland Behavioral Risk Factor Surveillance System 2009 Montgomery County Behavioral Health Profile httpwwwmarylandbrfssorgcgi-binbrokerexe
41 Peninsula Regional Medical Center (2011) Creating healthy communities Community Dashboard Indicators for Wicomico County Retrieved from httpwwwpeninsulaorgbodycfmid=627ampoTopId=627
42 National Institute on Minority Health and Health Disparities Health disparities ndash mental health National Institutes of Health Retrieved from httpwwwnimhdnihgovhdFactSheetasp
43 Substance Abuse and Mental Health Services Administration (2010) Results from the 2009 National Survey on Drug Use and Health Volume I Summary of National Findings (Office of Applied Studies NSDUH Series H-38A HHS Publication No SMA 10-4586Findings)
44 National Alliance on Mental Illness (2005) Eliminating disparities in mental health An overview Arlington VA Retrieved from httpwwwnamiorgContentNavigationMenuF ind_Suppor t Mul t icu l tura l_Suppor t Sharing_Hope1DisparitiesOverviewpdf
45 Substance Abuse and Mental Health Services Administration (2012) Mental health United States 2010 HHS Publication No (SMA) 12-4681 Rockville MD Retrieved from httpwwwsamhsagovdata2k12MHUS2010MHUS-2010pdf
46 Office of Minority Health (2013) Mental health datastatistics US Department of Health amp Human Services Retrieved from httpwwwminorityhealthhhsgovtemplatesbrowseaspxlvl=3amplvlid=539
70 | References
47 Williams D R Jackson J Gonzaacutelez H M Neighbors H Nesse R Abelson J M amp Sweetman J (2007) Prevalence and distribution of major depressive disorder in African Americans Caribbean Blacks and Non-Hispanic Whites Archives of General Psychiatry 64(3) 305ndash315
48 Ibid 4449 Ibid 4550 Maryland Department of Health and Mental
Hygiene Vital Statistics Administration (2011) Maryland vital statistics annual report 2011 Retrieved from httpdhmhmarylandgovvsaDocuments11annualpdf
51 Ibid 4352 Ibid 4453 Van Walraven C Seth R Austin P amp
Laupacis A (2002) Effect of discharge summary availability during post-discharge visits on hospital readmission Journal of General Internal Medicine 17(3) 186ndash192
54 Nelson E Maruish M amp Axler J (2000) Effects of discharge planning and compliance with outpatient appointments on readmission rates Psychiatric Services 51(7) 885ndash889
55 Centers for Medicare amp Medicaid Services Community-based care transitions program Retrieved from httpinnovationcmsgovinitiativesCCTPindexhtml
56 Lavizzo-Mourey R (2013) In the revolving door A report on US hospital readmissions Retrieved from httpwwwrwjforgcontentdamfarmreportsreports2013rwjf404178
57 Premier Inc (2013) Partnership for Patients Retrieved from httpswwwpremierinccomsafetytopicsHAIHAI-Partnership-for-patientsjsp
58 Maryland Department of Health and Mental Hygiene (2013) DHMH posts revised proposal for modernization of MDrsquos all-payer hospital system for comment Retrieved from httpdhmhmarylandgovnewsroom1PagesDHMH-Posts-Revised-Proposal-for-Modernization-of-MDrsquos-All-Payer-Hospital-System-for-Commentaspx
59 Ibid 2360 Burton R (2012) Improving care transitions
(Policy Brief 9-13) Retrieved from httpwwwhealthaffairsorghealthpolicybriefsbriefphpbrief_id=76
61 Institute for Healthcare Improvement (2013) The IHI triple aim Retrieved from httpwwwihiorgofferingsInitiativesTripleAimPagesdefaultaspx
62 Ibid 1
References | 71
AcknowledgmentsThis report is the result of collaborative efforts among Adventist HealthCare staff and interns across the health system A great deal of gratitude is given to the members of the report planning committee for their valuable contributions to the report Joy Gill Robert Wells Peter Mbugua Arumani Manisundaram Marcos Pesquera Deidre Washington and Marilyn Lynk Debra Illig Joy Gill and Khyati Mehta helped with interpreting quality performance data and shared information on system-wide efforts to improve patient quality and safety Robert Wells and Daymara Hernandez provided detailed hospital performance data as well as data on readmissions Peter Mbugua helped with gaining access to and conducting analysis of patience experience data and described ongoing hospital initiatives to improve patient experience of care Mairene Win Pam Woynicz Caterina Pangilinan Dawn Chriss Lynette Godhard Barbara Toops and Clarencia Stephen provided assistance with gathering entity specific data information on patient demographics various process and outcome metrics and best practices to improve health care outcomes Judith Kurtis and Jo Cimino provided detailed information about efforts to reduce readmission rates through community-based initiatives and partnerships to improve care transitions Cindy Glass and Danielle Lewald assisted with editing and facilitated efforts to format and print the report for publication and dissemination
Special thanks goes to the Center for Health Equity and Wellness staff who have worked tirelessly to improve the way data are collected monitored stored retrieved and reported throughout the Adventist HealthCare system Our gratitude goes to Dr Deidre Washington for her tremendous efforts at data gathering analysis interpretation and writing and for managing contributions to the report Tiffany Capeles provided creative leadership and perseverance in the design and production of the report Talya Frelick and Eme Martin shared valuable information especially on language services and needs assessment findings and provided unending support in the development of the report Graduate interns Christopher Smith and Gina Maxham worked diligently and independently to prepare sections on patient experience quality performance and readmission reduction efforts Research Assistant Nadine Monforte along with undergraduate interns Michele Troutman Akash Syngal and Guofan Li provided assistance with background information references and data analysis Last but not least Marcos Pesquera and Dr Marilyn Lynk provided continuous leadership and encouragement in the development of this informative report leveraging stakeholders at AHC reviewing drafts and managing planning and production through the year
Adventist HealthCare Center for Health Equity and Wellness820 West Diamond Avenue bull Suite 400 bull Gaithersburg MD 20878 bull 301-315-3677
httpwwwadventisthealthcarecomdisparities
Washington Adventist Hospital
16 | Washington Adventist Hospital
Snapshot of DiversityBoth Table 1 and Figure 1 below show the distribution of all unique patients at Washington Adventist Hospital (WAH) in 2012 by race and ethnicity WAH is located in Takoma Park Maryland
As shown in Table 1 Black patients continue to make up the majority of patients treated at WAH Black patients accounted for approximately 41 percent of WAH patients Hispanic patients accounted for about 32 percent of WAH patients White patients accounted for about 18 percent and Asian patients accounted for 4 percent These percentages are very similar to those described in last yearrsquos report (Note See ldquoAbout the 2013 Health Equity Reportrdquo for details on methodology sources limitations inclusionsexclusions missing data and other information about the data reported here)
TABLE 1 AND FIGURE 1 ALL UNIQUE PATIENTS BY RACEETHNICITY WAH 2012 (N=57546)
RaceEthnicity Percent ()Black 407
Hispanic 315
White 177
Asian 42
Other 32
Unknown 26
Total 999Percentages do not add up to 100 due to rounding All patients are included in computations
Table 2 and Figure 2 below show the racialethnic distribution for all patient encounters at WAH in 2012 In the table and figure below the same patients may be included multiple times In 2012 there were more than 88000 total patient encounters at WAH A majority of the patient encounters is comprised of Black patients (43) and Hispanic patients (29) the distribution is very similar to that in Table 1 and Figure 1 above (unique patients)
TABLE 2 AND FIGURE 2 ALL PATIENT ENCOUNTERS BY RACEETHNICITY WAH 2012 (N=88458)
RaceEthnicity Percent ()Black 433
Hispanic 289
White 183
Asian 42
Other 28
Unknown 25
Total 100
Black 407
Hispanic 315
White 177
Asian 42
Other 32
Unknown 26
Black 433
Hispanic 289
White 183
Asian 42
Other 28
Unknown 25
Washington Adventist Hospital | 17
Language Preference and Interpreter ServicesFigure 3 below shows the distribution of patients at WAH by preferred language in 2012 reflecting all patient encounters English was the most preferred language among patients (826) a slight decrease from what was reported in last yearrsquos report (842) The percentage of patients who preferred to communicate in Spanish increased from 12 percent in 2011 to 139 percent in 2012 The other common languages spoken at WAH include Amharic French Vietnamese and Korean Approximately 19 percent of WAH patients preferred to communicate in these languages
FIGURE 3 ALL PATIENT ENCOUNTERS BY PREFERRED LANGUAGE WAH 2012 (N=88458)
Figure 4 shows the most frequently requested languages for over-the-phone interpretation at WAH More than 9700 calls were made during 2012 exceeding 82000 minutes As seen in Figure 4 the majority of the calls placed were for Spanish language interpretation followed by Vietnamese French and Amharic In addition to the languages highlighted below calls were placed for more than 60 additional languages including Arabic Haitian Creole and Mandarin (All Others 69)
FIGURE 4 OVER-THE-PHONE INTERPRETER USE BY NUMBER OF CALLS WAH 2012
English 826
Spanish 139
Unknown 16
Amharic 04
French 03
Vietnamese 02
Korean 02
All Others 09
Other 19
Spanish 844
Vietnamese 28
French 28
Amharic 19
Korean 12 All Others
69 Other 156
18 | Washington Adventist Hospital
In-DepthHOSPITAL SETTING AND HEALTH INSURANCE
Table 3 shows the hospital settings in which patients were seen at WAH in 2012 by race and ethnicity For comparison the last column of Table 3 is identical to the information given in Table 2 above As in previous years different patterns of utilization emerge for patients of certain racialethnic background We posit that if raceethnicity were not associated with the setting in which a patient is seen the percentages across each row would be similar For example Black patients would represent approximately 43 percent of all inpatient visits 43 percent of all outpatient visits and 43 percent of all emergency department patients As Table 3 shows there are some noteworthy deviations from this expectation For example Hispanic patients represent 29 percent of all patient encounters at WAH yet more than 35 percent of all emergency department visits White patients who account for more than 18 percent of all WAH patient encounters only account for 14 percent of the volume in the emergency department and 23 percent of outpatient visits
TABLE 3 ALL PATIENT ENCOUNTERS BY HOSPITAL SETTING WAH 2012 (N=88458)
RaceEthnicity Inpatient (N=14882)
Outpatient (N=32405)
Emergency Department
(N=41171)
ALL WAH Patients (N=88458)
Black 418 407 458 433
Hispanic 262 220 353 289
White 194 232 140 183
Asian 39 68 23 42
Other 43 36 17 28
Unknown 44 37 09 25
Top WAH inpatient discharge diagnoses by raceethnicityFor inpatients at WAH diagnosis-related groups or DRGs relating to childbirth and delivery are among the top five for all patients regardless of raceethnicity Excluding these DRGs and excluding zero- and one-day stays the two most common inpatient discharge diagnoses for Black patients at WAH were septicemia and disseminated infections (septicemia) and schizophrenia For Hispanic patients the most common diagnoses were major depressive disorder and septicemia for White patients they were bipolar disorder and septicemia and for Asian or Pacific Islander patients they were schizophrenia and heart failure
Figure 5 shows the hospital settings in which patients were seen at WAH in 2012 by raceethnicity Of all the patient encounters with Black patients nearly half (49) occurred in the emergency department which is very close to what we reported last year (48) Figure 5 also shows that Black patients accounted for 16 percent of inpatients similar to what was reported in 2012 For both Asian and White patients the distributions seen in Figure 5 are not significantly different from what has been observed in previous years For both groups emergency department patients accounted for less than 40 percent of their respective totals For all four groups the distributions are fairly similar to what has been observed in previous years shifting only a few percentage points
Washington Adventist Hospital | 19
FIGURE 5 HOSPITAL SETTING FOR ALL PATIENT ENCOUNTERS BY RACEETHNICITY WAH 2012
Table 4 shows health insurance coverage for all 88458 patient encounters at WAH in 2012 Nearly 32 percent of all encounters were paid for by private insurance However the insurance distribution differs depending on the setting For encounters in the emergency department the most common insurer was Medicaid (29) For inpatient encounters the most common insurer was Medicare (32) and for outpatient encounters it was private insurance (37) Table 4 provides context for the data presented in Figures 6 7 and 8 below where the primary insurance coverage for each setting is stratified by patient raceethnicity
Emergency Department
49
Inpatient 16
Outpatient 35
Black Patients (N=38264)
Emergency Department
35
Inpatient 18
Outpatient 47
White Patients (N=16145)
Emergency Department
57 Inpatient
15
Outpatient 28
Hispanic Patients (N=25578)
Emergency Department
26
Inpatient 15
Outpatient 59
Asian Patients (N=3759)
20 | Washington Adventist Hospital
TABLE 4 HEALTH INSURANCE COVERAGE FOR ALL PATIENT ENCOUNTERS WAH 2012 (N=88458)
WAH (All Encounters)
All ED Encounters
All Inpatient Encounters
All Outpatient Encounters
Self-Pay (Uninsured) 153 259 101 41
Medicaid 229 293 291 119
Private Insurance 316 289 266 374
Medicare 218 108 324 309
All Others 84 51 17 157
Total 100 100 999 100
Figure 6 shows the distribution of coverage for all patients treated in the emergency department at WAH in 2012 by raceethnicity in 2012 The largest percentage of uninsured patients (self-pay) were Hispanic (over 35) Also Hispanic patients were least likely to be covered by Medicare in the emergency department (less than 4) The majority of White and Asian patients were covered by private insurance (46 and 43 respectively)
FIGURE 6 HEALTH INSURANCE COVERAGE BY RACEETHNICITY ALL WAH ED VOLUME 2012 (N=41171)
0
10
20
30
40
50
60
70
80
90
100
Hispanic White Black Asian Other Unknown
All OthersMedicarePrivate InsuranceMedicaidSelf-Pay (Uninsured)
Washington Adventist Hospital | 21
Figure 7 shows health insurance coverage by raceethnicity for inpatients at WAH during 2012 White (504) Black (38) and Asian (40) patients were more likely to be covered by Medicare than any other insurer For Hispanic patients Medicaid covered more than half of inpatient hospital stays (51)
FIGURE 7 HEALTH INSURANCE COVERAGE BY RACEETHNICITY ALL WAH INPATIENT VOLUME 2012 (N=14882)
0
10
20
30
40
50
60
70
80
90
100
Hispanic White Black Asian Other Unknown
All OthersMedicarePrivate InsuranceMedicaidSelf-Pay (Uninsured)
22 | Washington Adventist Hospital
Figure 8 shows health insurance coverage for all outpatients treated at WAH in 2012 For White Black and Asian patients less than three percent of outpatients were uninsured Slightly more than 10 percent of Hispanic patients were uninsured Medicaid covered about 18 percent of outpatient visits for Hispanic patients and 13 percent of visits for Black patients this is compared to 4 percent for White patients and 8 percent for Asian patients White (45) Black (39) and Asian (49) patients were more likely to be covered by private insurance
FIGURE 8 HEALTH INSURANCE COVERAGE BY RACEETHNICITY ALL WAH OUTPATIENT VOLUME 2012 (N=32405)
0
10
20
30
40
50
60
70
80
90
100
Hispanic White Black Asian Other Unknown
All OthersMedicarePrivate InsuranceMedicaidSelf-Pay (Uninsured)
Washington Adventist Hospital | 23
Inpatient Quality MeasuresTable 5 shows composite scores of inpatient quality measures for WAH in 2012 A composite score of 96 percent or higher was achieved in each group Because of overall high scores achieved within and across each of the measurement groups differences between racial and ethnic groups were not calculated
TABLE 5 WAH INPATIENT QUALITY MEASURES - 2012
Measurement Group Numerator Denominator PercentagePneumonia Care (PN)1 402 410 98055
Heart Failure (HF)2 1209 1253 96496
Acute Myocardial Infarction (AMI)3 2009 2013 99807
Surgical Care Improvement Project (SCIP)4 5151 5228 98538
1Measure group includes PN-3a PN-3b PN-6 PN-6a PN-6b PN-PACS2Measure group includes HF-1 HF-2 HF-3 HF-PACS3Measure group includes AMI-1 AMI-2 AMI-3 AMI-5 AMI-7a AMI-8a AMI-10 AMI-PACS4Measure group includes SCIP-Card-2 SCIP-Inf-1a SCIP-Inf-1b SCIP-Inf-1c SCIP-Inf-1d SCIP-Inf-1e SCIP-Inf-1f SCIP-Inf-1g SCIP-Inf-1h SCIP-Inf-2a SCIP-Inf-2b SCIP-Inf-2c SCIP-Inf-2d SCIP-Inf-2e SCIP-Inf-2f SCIP-Inf-2g SCIP-Inf-2h SCIP-Inf-3a SCIP-Inf-3b SCIP-Inf-3c SCIP-Inf-3d SCIP-Inf-3e SCIP-Inf-3f SCIP-Inf-3g SCIP-Inf-3h SCIP-Inf-4 SCIP-Inf-6 SCIP-Inf-9 SCIP-PACS SCIP-VTE-1 SCIP-VTE-2 5Percentage range across individual measures for PN 9231-1006Percentage range across individual measures for HF 9887-1007Percentage range across individual measures for AMI 9953-1008Percentage range across individual measures for SCIP 9143-100
In October 2013 WAH was named as a Top Performer on Key Quality Measuresreg by The Joint Commission meaning they achieved at least 95 percent compliance with certain measures for 2012 performance At WAH only three measures were found to have a score lower than 95 percent while 33 were found to have scores of 98 percent and above 22 of which were perfect scores
Pneumonia Care (PN)Among six quality measures the measure with the lowest success rate was initial antibiotic selection for PN in immunocompetent non-intensive care unit (ICU) patients with a percentage of 9688 percent However due to a small sample size the 312 percent rate of failure represents only two patients All remaining measures had a rate of 9718 percent and above including two with a rate of 100 percent
Heart Failure (HF)A total of four quality measures were evaluated for HF Among them discharge instructions were provided to 9349 percent of patients angiotensin converting enzyme inhibitor (ACEI) or angiotensin receptor blockers(ARB) for left ventricular systolic dysfunction (LVSD) were provided to 9889 percent of patients for which it was indicated and patient appropriateness of care compliance was found to have a rate of 9427 percent The fourth measure Evaluation of left ventricular systolic (LVS) function had a perfect completion rate of 100 percent
Acute Myocardial Infarction (AMI)Among the eight AMI measures one was not indicated for any patients and onemdashprimary percutaneous coronary intervention (PCI) received within 90 minutes of hospital arrivalmdashhad a rate of 9697 percent Of the remaining six measures two had a rate of 9951 percent and above while the other four had a rate of 100 percent
24 | Washington Adventist Hospital
Surgical Care Improvement Project (SCIP)Among the four groups of inpatient quality measures SCIP had the largest number of measures with a total of 32 Twenty-one of these measures had a score of at least 985 percent while 15 had a perfect score of 100 percent The measure with the lowest score of 9453 percent was patient appropriateness of care compliance
Washington Adventist Hospital
Washington Adventist Hospital | 25
Hospital ReadmissionsTable 6 below shows the all-cause 30-day readmission percentages for patients at WAH during 2012 Using the methodology described the overall readmission percentage for WAH was 76 percent There were 969 readmissions and 11820 discharges Readmissions for Black patients were the highest of all racialethnic groups (approximately 107) The percentage for White patients was slightly lower (95) Readmissions for all other racialethnic groups were lower than the hospital average (69 for Asian patients and 50 for Hispanic patients)
TABLE 6 ALL CAUSE 30-DAY READMISSIONS BY PATIENT RACEETHNICITY WAH 2012
RaceEthnicity ReadmissionsBlack 107
White 95
Asian 69
Hispanic 50
Other 44
Unknown 23
Total 82
26 | Washington Adventist Hospital
Patient Experience Table 7 below shows the percent of WAH inpatients who responded positively to selected HCAHPS questions (top box scores) by raceethnicity in 2012
Hispanics and Blacks discharged from WAH responded more positively to patient experience items than White patients for most measures However Asians were less likely than other minority groups to report positive experiences compared with Whites Overall ratings of the hospital and likelihood to recommend were more positive for Hispanics and Blacks compared with White and Asian patients Also satisfaction with communication with doctors and nurses was higher for non-White patients compared to Whites Asian patients were less likely to respond positively to items about staff courtesy or communication Most survey respondents seemed satisfied with staff courtesy and written discharge instructions indicating continued commitment to providing excellent care Specifically WAH has implemented nursing campaigns to encourage consistent and meaningful patient interactions which is reflected in more positive ratings in this yearrsquos report Nurses and patient care technicians are required to check in on every patient on an hourly basis (ie hourly rounding) Daily rounding is the responsibility of nursing leadership (eg charge nurses and nurse managers) In addition WAHrsquos leadership is required to round on at least one patient a week in their assigned area at the hospital Regular patient rounding is productive and can shed light on patient concerns or issues such as pain management and needs for personal assistance such as help getting up from bed In 2012 compliance for daily nurse rounding and logging rounding information was 93 percent at WAH
TABLE 7 SELECTED TOP BOX RESPONSES TO HCAHPS QUESTIONS BY RACEETHNICITY WAH 2012 (IN PERCENTS)
All WAH White Patients
Black Patients
Asian Patients
Hispanic Patients HSTM
Likely to recommend 701 64 737 61 736 742Overall rating of hospital 628 574 68 523 648 706
Courtesy of doctors 825 78 871 674 857 879
Doctors listen carefully 767 681 823 714 804 808Clear communication by doctors 734 649 796 581 804 773
Courtesy of nurses 842 793 878 80 83 863
Nurses listen carefully 743 654 794 69 836 779Clear communication by nurses 732 645 781 667 768 761
Talking about help after discharge 803 815 819 737 816 833
Providing written discharge instructions 856 885 855 786 878 883
Percentages averaged across all persons self-identifying as Hispanic or Latino Includes Puerto Ricans Mexicans Mexican-Americans Chicanos Cubans and others Race and ethnicity are not mutually exclusive in this table Therefore if a patient identified himself as both Black and Hispanic his responses are included in both columns
Washington Adventist Hospital | 27
Table 8 below shows the percent of WAH inpatients who responded positively to selected HCAHPS questions (top box scores) stratified by the patientrsquos level of education Results reveal a decrease in satisfaction scores as level of education increases Comparisons between individuals who completed more than four years of college and those who did not graduate from high school reveal a greater than 15 percent difference in the ldquolikelihood to recommendrdquo measure for respondents Because a significant proportion of residents in Maryland (eg Montgomery County) and the DC metropolitan area are highly educated it may be important to understand the relationship between education level and satisfaction with hospital care2829 In the future efforts that address differences in patient experience between patients with different levels of education may be necessary to reach our performance goal of achieving top quartile patient experience
TABLE 8 SELECTED TOP BOX RESPONSES TO HCAHPS QUESTIONS BY EDUCATION LEVEL WAH 2012 (IN PERCENTS)
More than 4
years of college
Graduated from
4-year college
Some college
or earned a 2-year degree
Graduated from high earned a
GED
Some high
school but did
not graduate
Completed the 8th
grade or less
Likely to recommend 736 802 874 859 899 1000
Overall rating of hospital 600 735 779 752 800 833
Courtesy of doctors 651 719 731 755 713 917
Doctors listen carefully 781 805 817 835 863 885Clear communication by doctors 660 786 764 782 815 962
Courtesy of nurses 620 770 733 715 827 885
Nurses listen carefully 789 779 870 745 865 826Clear communication by nurses 910 822 879 848 831 792
Talking about help after discharge 513 628 636 645 763 654
Providing written discharge instructions 622 739 714 698 756 783
Shady Grove Adventist Hospital
Shady Grove Adventist Hospital | 29
Snapshot of DiversityTable 9 and Figure 9 below show the distribution of all unique patients at Shady Grove Adventist Hospital (SGAH) in 2012 by race and ethnicity SGAH patients include those treated at the main hospital in Rockville as well as at the Shady Grove Adventist Emergency Center in Germantown Maryland
With the full implementation of our electronic medical record platform in 2012 we are able distinguish between patients who actively declined to report their race andor ethnicity from those patients for whom the information is unknown for any other reason as seen below in Tables 9 and 10 and Figures 9 and 10 Throughout the remainder of the report the SGAH patients who declined to report their raceethnicity are included in the lsquoUnknownrsquo category Table 9 and Figure 9 show that White patients accounted for nearly 38 percent of all unique patients seen at SGAH in 2012 Hispanic patients accounted for 24 percent of all patients while Black patients accounted for 13 percent and Asian patients for 8 percent (Note See ldquoAbout the 2013 Health Equity Reportrdquo for details on methodology sources limitations inclusionsexclusions missing data and other information about the data reported here)
TABLE 9 AND FIGURE 9 ALL UNIQUE PATIENTS BY RACEETHNICITY SGAH 2012 (N=121729)
RaceEthnicity Percent ()White 377
Hispanic 244
Black 134
Asian 80
Other 42
Declined 12
Unknown 111
Total 100
Table 10 and Figure 10 below show the racialethnic distribution for all patient encounters at SGAH in 2012 In the table and figure below the same patients may be included multiple times The distribution is very similar to the patient distribution seen in Table 9 and Figure 9 above
TABLE 10 AND FIGURE 10 ALL PATIENT ENCOUNTERS BY RACEETHNICITY SGAH 2012 (N=164049)
RaceEthnicity Percent ()White 371
Hispanic 259
Black 146
Asian 74
Other 41
Declined 10
Unknown 99
Total 100
White 377
Hispanic 244
Black 134
Asian 80
Other 42
Declined 12 Unknown
111
White 37
Hispanic 26
Black 15
Asian 7
Other 4 Declined
1 Unknown
10
30 | Shady Grove Adventist Hospital
Language Preference and Interpreter ServicesFigure 11 shows the distribution of patients by preferred language at SGAH in 2012 reflecting all patient encounters English was the most preferred language among patients (90) similar to what was reported in last yearrsquos report The percentage of patients who preferred to communicate in Spanish increased slightly from 4 percent in 2011 to 5 percent in 2012 The other preferred languages at SGAH include Chinese (both Mandarin and Cantonese) Korean French and Farsi Just over two percent of SGAH patients preferred to communicate in these languages
FIGURE 11 ALL PATIENT ENCOUNTERS BY PREFERRED LANGUAGE SGAH 2012 (N=164049)
Figure 12 shows the languages most frequently requested for interpretation by phone at SGAH More than 12000 calls were placed exceeding 113000 minutes As seen in Figure 12 the majority of the calls were for Spanish language interpretation followed by Mandarin Korean and Russian In addition to the languages highlighted below calls were placed for more than 70 additional languages including Arabic Bengali and Hindi (All Others 59)
FIGURE 12 OVER-THE-PHONE INTERPRETER USE BY NUMBER OF CALLS SGAH 2012
English 887
Spanish 50
Unknown 40
Chinese 06 Korean
03
French 02
Farsi 02
Russian 01
All Others 10
Other 24
Spanish 685
Mandarin 85 Korean
44
Russian 42
French 23 Cantonese
23
Vietnamese 20
Farsi 19
All Others 59
Other 144
Shady Grove Adventist Hospital | 31
In-DepthHOSPITAL SETTING AND HEALTH INSURANCE
Table 11 shows the hospital settings where patients were seen at SGAH and the Shady Grove Adventist Emergency Center in 2012 by raceethnicity The last column of Table 11 reflects the same information in Table 10 above As in previous years we observe different patterns of hospital utilization by patients from different racialethnic groups White patients who accounted for 37 percent of all patient volume made up 45 percent of inpatient visits and only 34 percent of emergency department visits Hispanic patients who accounted for 26 percent of total patient volume accounted for about 30 percent of emergency department volume and only 21 percent of inpatient volume Black patients utilized the emergency department at higher rates than Asian patients who were more likely to use inpatient and outpatient services
TABLE 11 ALL PATIENT ENCOUNTERS BY HOSPITAL SETTING SGAH 2012 (N=164049)
RaceEthnicity Inpatient (N=26111)
Outpatient (N=46848)
Emergency Department
(N=91090)
ALL SGAH Patients (N=164049)
White 453 386 340 371
Hispanic 209 212 297 259
Black 126 111 170 146
Asian 109 100 51 74
Other 40 38 42 41
Unknown 62 153 100 109
Top SGAH hospital inpatient discharge diagnoses by raceethnicityFor inpatients at SGAH diagnostic-related groups (DRGs) relating to childbirth and delivery are among the top five for all patients regardless of raceethnicity Excluding these DRGs and excluding zero- and one-day stays the two most common inpatient discharge diagnoses for White patients at SGAH were septicemia and pneumonia For Hispanic patients the two most common were kidneyurinary tract infections and pneumonia For Black patients the most common diagnoses were heart failure and sickle cell anemia crises and for Asian patients they were pneumonia and septicemia
Figure 13 shows the hospital settings in which patients were seen at SGAH in 2012 by raceethnicity For both Black and Hispanic patients the majority of encounters occurred in the emergency department for both groups emergency department visits accounted for more 60 percent of all visits In comparison emergency department visits accounted for approximately half of all visits for White patients For Asian patients emergency department visits accounted for less than 40 percent of all visits Again for all four groups the distributions seen in Figure 13 are very similar to the data presented in last yearrsquos report
32 | Shady Grove Adventist Hospital
FIGURE 13 HOSPITAL SETTING FOR ALL PATIENT ENCOUNTERSBY RACEETHNICITY SGAH 2012
Table 12 shows the primary health insurance coverage for all 164049 patient encounters at SGAH in 2012 Nearly 57 percent of all encounters were paid for by private insurance Private insurance was the dominant insurer for all settings covering the majority of inpatient (57) and outpatient (71) encounters In the emergency department private insurance covered just less than half of the encounters Table 12 provides context for the data presented in Figures 14 15 and 16 where the primary insurance coverage in each setting is stratified by patient raceethnicity
TABLE 12 HEALTH INSURANCE COVERAGE FOR ALL PATIENT ENCOUNTERS SGAH 2012 (N=164049)
SGAH (All Encounters)
All ED Encounters
All Inpatient Encounters
All Outpatient Encounters
Self-Pay (Uninsured) 126 168 67 78
Medicaid 222 267 204 145
Private Insurance 572 498 571 714
Medicare 60 39 153 49All Others 20 27 05 14
Total 100 999 999 100
Emergency Department
64
Inpatient 14
Outpatient 22
Black Patients (N=23960)
Emergency Department
51
Inpatient 19
Outpatient 30
White Patients (N=60868)
Emergency Department
64 Inpatient
13
Outpatient 23
Hispanic Patients (N=42465)
Emergency Department
39
Inpatient 23
Outpatient 38
Asian Patients (N=12218)
Shady Grove Adventist Hospital | 33
Figure 14 shows the distribution of coverage for all patients treated in the emergency department at SGAH in 2012 by raceethnicity Hispanic (20) and Black patients (19) were more likely to be uninsured compared to White or Asian patients (less than 11 for both groups) It is also noteworthy that of all the White patients seen in the emergency department nearly 68 percent were covered by private insurance The private insurance coverage for Asian patients was about 66 percent In comparison the private insurance coverage for Black and Asian patients was approximately 37 percent and 35 percent respectively Similarly Medicaid coverage was similar for Black and Hispanic patients at about 38 percent each however it was about 14 percent for White patients and 17 percent for Asian patients
FIGURE 14 HEALTH INSURANCE COVERAGE BY RACEETHNICITY ALL SGAH ED VOLUME 2012 (N=91090)
0
10
20
30
40
50
60
70
80
90
100
Hispanic White Black Asian Other Unknown
All OthersMedicarePrivate InsuranceMedicaidSelf-Pay (Uninsured)
34 | Shady Grove Adventist Hospital
Figure 15 shows health insurance coverage by raceethnicity for all inpatients at SGAH during 2012 Hispanic White Black and Asian patients were more likely to be covered by private insurance Private insurance coverage was higher than 65 percent for both White and Asian patients and just about 42 percent for both Hispanic and Black patients Medicaid coverage was approximately 35 percent for both Hispanic and Black patients about 18 percent for Asian patients and about 9 percent for White patients Medicare coverage was highest for White patients (19) followed by Black patients (13) Asian patients (12) and Hispanic patients (9) Hispanic patients were most likely to be uninsured (over 11)
FIGURE 15 HEALTH INSURANCE COVERAGE BY RACEETHNICITY ALL SGAH INPATIENT VOLUME 2012 (N=26111)
0
10
20
30
40
50
60
70
80
90
100
Hispanic White Black Asian Other Unknown
All OthersMedicarePrivate InsuranceMedicaidSelf-Pay (Uninsured)
Shady Grove Adventist Hospital | 35
Figure 16 shows the health insurance coverage for all outpatients treated at SGAH in 2012 Similar to inpatients most outpatient visits were covered by private insurance for each group of patients Private insurance coverage ranged from 59 percent for Black patients up to 82 percent for White patients Medicaid coverage was highest for Black patients (about 29)
FIGURE 16 HEALTH INSURANCE COVERAGE BY RACEETHNICITY ALL SGAH OUTPATIENT VOLUME 2012 (N=46848)
0
10
20
30
40
50
60
70
80
90
100
Hispanic White Black Asian Other Unknown
All OthersMedicarePrivate InsuranceMedicaidSelf-Pay (Uninsured)
36 | Shady Grove Adventist Hospital
Inpatient Quality MeasuresTable 13 shows composite scores of inpatient quality measures for SGAH for 2012 A composite score of 96 percent or higher was achieved in each group Because of overall high scores achieved within and across each of the measurement groups differences between racial and ethnic groups were not calculated
TABLE 13 SGAH INPATIENT QUALITY MEASURES - 2012
Measurement Group Numerator Denominator PercentagePneumonia Care (PN)1 598 618 96765
Heart Failure (HF)2 1093 1100 99366
Acute Myocardial Infarction (AMI)3 1290 1292 99857
Surgical Care Improvement Project (SCIP)4 8653 8752 98878
1Measure group includes PN-3a PN-3b PN-6 PN-6a PN-6b PN-PACS2Measure group includes HF-1 HF-2 HF-3 HF-PACS3Measure group includes AMI-1 AMI-2 AMI-3 AMI-5 AMI-7a AMI-8a AMI-10 AMI-PACS4Measure group includes SCIP-Card-2 SCIP-Inf-1a SCIP-Inf-1b SCIP-Inf-1c SCIP-Inf-1d SCIP-Inf-1e SCIP-Inf-1f SCIP-Inf-1g SCIP-Inf-1h SCIP-Inf-2a SCIP-Inf-2b SCIP-Inf-2c SCIP-Inf-2d SCIP-Inf-2e SCIP-Inf-2f SCIP-Inf-2g SCIP-Inf-2h SCIP-Inf-3a SCIP-Inf-3b SCIP-Inf-3c SCIP-Inf-3d SCIP-Inf-3e SCIP-Inf-3f SCIP-Inf-3g SCIP-Inf-3h SCIP-Inf-4 SCIP-Inf-6 SCIP-Inf-9 SCIP-PACS SCIP-VTE-1 SCIP-VTE-2 5Percentage range across individual measures for PN 9231-1006Percentage range across individual measures for HF 9887-1007Percentage range across individual measures for AMI 9953-1008Percentage range across individual measures for SCIP 9143-100
In October 2013 SGAH was named as a Top Performer on Key Quality Measuresreg by The Joint Commission meaning they achieved at least 95 percent compliance with certain measures for 2012 performance At SGAH only two measures were found to have a score lower than 95 percent while 35 were found to have scores of 98 percent and above 13 of which were perfect scores
Pneumonia Care (PN)Among six quality measures the one with the lowest score was blood culture on arrival for intensive care unit (ICU) patients with a score of 923 percent However due to a small sample size the remaining 77 percent represents only two patients Measures of initial antibiotic selection in immunocompetent patients were found to have a score of 9615 percent among 156 non-ICU patients and 100 percent for seven ICU patients
Heart Failure (HF)A total of four quality measures were evaluated for HF Among them discharge instructions were provided to 9887 percent of patients angiotensin converting enzyme inhibitor (ACEI) or angiotensin receptor blockers (ARB) for left ventricular systolic dysfunction (LVSD) scored 992 percent and patient appropriateness of care compliance scored 9914 percent The fourth measure Evaluation of left ventricular systolic (LVS) function had a perfect score of 100 percent
Acute Myocardial Infarction (AMI)Among the eight AMI measures one was not indicated for any patients and twomdashaspirin at arrival and patient appropriateness of care compliancemdashhad a score of 9953 percent and 9963 percent respectively The remaining five measures had a perfect score of 100 percent
Shady Grove Adventist Hospital | 37
Surgical Care Improvement Project (SCIP)Among the four groups of inpatient quality measures SCIP had the largest number of measures with a total of 32 Seven of these measures were not applicable to the patients seen Twenty-one measures had a score of at least 985 percent while six had a perfect score of 100 percent Two of the measures discontinuation of prophylactic antibiotics within 24 hours after hysterectomy and beta blocker given during the perioperative period for those on beta blocker therapy preadmission had the lowest scores of 9143 percent and 9651 percent respectively
Shady Grove Adventist Hospital
38 | Shady Grove Adventist Hospital
Hospital ReadmissionsTable 14 below shows the all-cause 30-day readmission percentages for patients at SGAH during 2012 The overall readmission percentage for SGAH was 62 percent There were 1300 readmissions and 20982 discharges Readmissions for Black patients were the highest of all racialethnic groups (80) The percentage for White patients was lower (72) Readmissions for all other racialethnic groups were lower than the hospital average (42 for Asian patients and 47 for Hispanic patients)
TABLE 14 ALL CAUSE 30-DAY READMISSIONS BY PATIENT RACEETHNICITY SGAH 2012
RaceEthnicity ReadmissionsBlack 80
White 72
Asian 42
Hispanic 47
Other 39
Unknown -
Total 62
Shady Grove Adventist Hospital | 39
Patient ExperienceTable 15 below shows the percent of SGAH inpatients who responded positively to selected HCAHPS questions (top box scores) by raceethnicity in 2012
Hispanics Asians and Blacks discharged from SGAH were more likely to respond positively to the patient experience items than White patients for most measures Overall ratings of the hospital were more positive for non-White patients (particularly Hispanics) compared to White patients More Hispanics and Asians were likely to recommend the hospital than were White patients Also compared to Whites non-White patients were more likely to be satisfied with communication with doctors and nurses These findings are similar to those reported in several studies of racialethnic differences in patientsrsquo experience of care3031 Survey respondents across racial groups seemed particularly satisfied with staff courtesy and written discharge instructions demonstrating commitment to ensuring continuity of care for patients Nursing communication was viewed more favorably among patients responding to this yearrsquos survey compared with last yearrsquos responses
TABLE 15 SELECTED TOP BOX RESPONSES TO HCAHPS QUESTIONS BY RACEETHNICITY SGAH 2012 (IN PERCENTS)
All SGAH Patients
White Patients
Black Patients
Asian Patients
Hispanic Patients HSTM
Likely to recommend 641 597 657 742 783 742Overall rating of hospital 566 546 599 519 718 706
Courtesy of doctors 817 784 842 808 859 879
Doctors listen carefully 738 694 749 788 833 808Clear communication by doctors 708 666 732 771 764 773
Courtesy of nurses 785 739 81 764 843 863
Nurses listen carefully 69 624 739 756 653 779Clear communication by nurses 682 639 732 702 694 761
Talking about help after discharge 792 773 762 817 754 833
Providing written discharge instructions 906 899 903 898 953 883
Percentages averaged across all persons self-identifying as Hispanic or Latino Includes Puerto Ricans Mexicans Mexican-Americans Chicanos Cubans and others Race and ethnicity are not mutually exclusive in this table Therefore if a patient identified himself as both Black and Hispanic his responses are included in both columns
40 | Shady Grove Adventist Hospital
Table 16 below shows the percent of SGAH inpatients who responded positively to the selected HCAHPS questions (top box scores) stratified by the patientrsquos level of education Results reveal a decrease in satisfaction scores as level of education increases Comparisons between individuals who completed more than four years of college and those who did not graduate from high school reveal a greater than 10 percent difference in the ldquolikelihood to recommendrdquo measure for respondents Because a significant proportion of residents in Maryland (eg Montgomery County) and the DC metropolitan area are highly educated it may be important to understand the relationship between education level and satisfaction with hospital care3233 In the future efforts that address differences in patient experience between patients with different levels of education may be necessary to reach our performance goal of achieving top quartile patient experience
TABLE 16 SELECTED TOP BOX RESPONSES TO HCAHPS QUESTIONS BY EDUCATION LEVEL SGAH 2012 (IN PERCENTS)
More than 4 years of
college
Graduated from
4-year college
Some college
or earned a 2-year degree
Graduated from high school or earned a
GED
Some high
school but did
not graduate
Completed the 8th
grade or less
Likely to recommend 746 705 771 830 852 786
Overall rating of hospital 676 565 643 781 800 667
Courtesy of doctors 624 618 672 722 818 867
Doctors listen carefully 791 781 825 837 889 733Clear communication by doctors 715 690 719 763 833 800
Courtesy of nurses 690 684 687 732 778 733
Nurses listen carefully 799 748 777 805 800 667Clear communication by nurses 915 922 894 883 889 786
Talking about help after discharge 531 505 564 623 818 733
Providing written discharge instructions 637 565 633 673 784 786
Shady Grove Adventist Hospital | 41
Office of Minority Health CLAS Standards
In April 2013 the Office of Minority Health of the US Department of Health and Human Services released the Enhanced Culturally and Linguistically Appropriate Services (CLAS) Standards to improve quality eliminate health disparities and advance health equity These standards originally developed in 2000 were updated to reflect growing diversity in the nation and to improve understanding and use of culturally appropriate care at healthcare organizations The revised CLAS standards fall under four categories (1) principal standard (2) governance leadership and workforce (3) communication and language assistance and (4) engagement continuous improvement and accountability
PRINCIPAL STANDARD1) Provide effective equitable understandable and respectful quality care and services that are responsive
to diverse cultural health beliefs and practices preferred languages health literacy and other communication needs
Governance Leadership and Workforce2) Advance and sustain organizational governance and leadership that promotes CLAS and health equity
through policy practices and allocated resources3) Recruit promote and support a culturally and linguistically diverse governance leadership and workforce
that are responsive to the population in the service area4) Educate and train governance leadership and workforce in culturally and linguistically appropriate
policies and practices on an ongoing basis
Communication and Language Assistance5) Offer language assistance to individuals who have limited English proficiency andor other communication
needs at no cost to them to facilitate timely access to all health care and services6) Inform all individuals of the availability of language assistance services clearly and in their preferred
language verbally and in writing7) Ensure the competence of individuals providing language assistance recognizing that the use of
untrained individuals andor minors as interpreters should be avoided8) Provide easy-to-understand print and multimedia materials and signage in the languages commonly
used by the populations in the service area
Engagement Continuous Improvement and Accountability9) Establish culturally and linguistically appropriate goals policies and management accountability and
infuse them throughout the organizationsrsquo planning and operations10) Conduct ongoing assessments of the organizationrsquos CLAS-related activities and integrate CLAS-related
measures into assessment measurement and continuous quality improvement activities11) Collect and maintain accurate and reliable demographic data to monitor and evaluate the impact of
CLAS on health equity and outcomes and to inform service delivery12) Conduct regular assessments of community health assets and needs and use the results to plan and
implement services that respond to the cultural and linguistic diversity of populations in the service area13) Partner with the community to design implement and evaluate policies practices and services to
ensure cultural and linguistic appropriateness14) Create conflict- and grievance-resolution processes that are culturally and linguistically appropriate to
identify prevent and resolve conflicts or complaints15) Communicate the organizationrsquos progress in implementing and sustaining CLAS to all stakeholders
constituents and the general public
For more information about the enhanced CLAS Standards visit httpminorityhealthhhsgovtemplatesbrowseaspxlvl=2amplvlID=15
Adventist Behavioral Health
Adventist Behavioral Health | 43
SPOTLIGHT ON MENTAL HEALTH
Mental health includes emotional psychological and social well-being dealing with how we think and how we feel34 Mental disorders are health conditions that are characterized by alterations in normal cognitive function resulting in a change in mood andor behavior associated with distress andor impaired functioning In any given year one in four adults suffers from a mental health illness in the United States35 One in seventeen live with a serious mental illness such as schizophrenia major depression or bipolar disorder Among children the rates are slightly higher about one in 10 is diagnosed with a serious mental or emotional disorder the most common of which is attention deficit hyperactivity disorder (ADHD) Although an estimated 575 million adults and 96 million children suffer from mental disorders each year in the United States only 362 million Americans account for the $575 billion spent annually on mental health services indicating that many individuals may not be receiving the care they need36 In 2012 approximately 60 percent of adults and nearly half of youth ages 8 to 15 with a mental illness received no mental health services37 The impact of mental illness is far reaching nearly $1932 billion in earnings is lost annually mood disorders such as depression are the third leading cause of hospitalization for youth and adults ages 18 to 44 and suicide is the 10th leading cause of death in the United States
Among Marylandrsquos 56 million residents an estimated 175000 adults and 62000 children live with a serious mental health disorder38 However the proportion of individuals suffering from mental health illness far outweighs the services available Marylandrsquos public mental health system provides services to only 19 percent of adults who live with a serious mental illness Untreated mental illness can have deadly consequences For example in 2006 495 Maryland residents died by suicide which is nearly always the result of untreated or under-treated mental illness
In Montgomery County one in ten residents have been diagnosed with an anxiety disorder a general term used to describe a condition with excessive and unrealistic worrying anxiety and persistent fear3940
About 80 percent of Montgomery County residents report good mental health (ie two or fewer days of poor mental health a month) higher than the state average of 77 percent The level of substance abuse in Montgomery County continues to increase yearly and aligns with the state average In Wicomico County 79 percent of residents report feelings of good mental health41
MENTAL HEALTH DISPARITIES BY RACEETHNICITY
Despite the fact that mental illness is prevalent among racial and ethnic minorities as it is among Whites minorities have less access to and are less likely to use mental health services resulting in a higher proportion of individuals with unmet mental health needs Minority groups are also less likely to seek out mental health counseling and treatment than Whites decreasing their chances of having positive health outcomes Many factors contribute to onersquos overall mental health status including environment financial stability gender and raceethnicity
People are classified as having a serious mental illness if they currently or at any time in the past year had a diagnosable mental behavioral or emotional disorder resulting in substantial impairment in carrying out major life activities43 When stratified by race and ethnicity 53 percent of Whites 37 percent of Blacks and 4 percent of HispanicLatinos suffer from serious mental illnesses These rates of serious mental illness often mirror high rates of illicit drug use and abuse and act as a risk factor for suicide In regards to substance abuse treatment 15 percent of Blacks who needed treatment received it compared to only 7 percent of Hispanics and 2 percent of Asians44 These statistics could be due to barriers such as social stigmas cost of care language mistrust of physicians or poor access to mental health services After age-adjustment Blacks have a suicide rate of 5 per 100000 individuals which is lower than Hispanics (6 per 100000) and nearly half the rate of Whites (125 per 100000)45 The suicide rate for Blacks is 60 percent lower than that of non-Hispanic Whites however the death rate for Black men was almost four times that for Black women in 2009 Asian women have been found to have the highest suicide rates of all women over the age of 65 Among Hispanic girls of high school age suicide attempts were 70 percent higher than
44 | Adventist Behavioral Health
for White girls of the same age in 201146
Blacks have been found to be over-diagnosed with schizophrenia and under-diagnosed with mood disorders While Blacks are less likely to suffer from major depressive disorders they are more likely to rate their depression as severe and disabling47 Blacks are also less likely than Whites to receive mental health treatment at higher income and education levels while Hispanics are less likely to receive mental health treatment than Whites at every income and education level48 According to the Substance Abuse and Mental Health Services Administration poor individuals experience high rates of mental health treatment (158) compared to those who were near poor (128) or those who were not poor (13) underscoring the correlation between poverty and poor mental health49
In 2008 the state of Maryland spent $899 million dollars for mental health services These expenditures allocated to bridge the gap in mental health disparities have risen each year but have continued to fall short of meeting the needs of target populations Marylandrsquos Behavioral Risk Factor Surveillance System showed that minority groups in the state under-utilize mental health services In every age group non-Hispanic Whites are more likely to see a provider for a mental health problem than non-Hispanic Blacks despite having an equal burden Similar to national rates Maryland also reports similar statistics in regards to suicide rates For intentional self-harm 11 percent of Whites compared to 53 percent of Blacks and 91 percent of the overall population report intentionally harming themselves50 In Montgomery County White Medicaid recipients were more likely to receive inpatient outpatient andor professional services for episodic mood disorders (39) than Blacks (35) Hispanics (13) or Asians (58)51 Black Medicaid recipients in the county were more likely to receive support for attention deficit disorder attention deficit hyperactivity disorder and substance abuse than any other racial ethnic group In regards to substance abuse 143 percent of the county residents had reported levels of binge drinking only Whites exceeded the average rate Blacks were more likely to report being current smokers than adults of other racialethnic groups in the county In Wicomico County non-Hispanic Whites were more likely (818) to report positive feelings of mental health than non-Hispanic Blacks (724)52 These rates differ from national statistics This could be the result of changes in social and environmental support experienced by different sub-groups Blacks in Dorchester County experienced the highest rates of emergency department visits because of behavioral health issues (15138 per 100000 individuals) compared with Hispanics (3737 visits per 100000) and Whites (9789 visits per 100000)
ADVENTIST BEHAVIORAL HEALTH
Adventist Behavioral Health (ABH) is the most comprehensive provider of behavioral health services in the National Capital area providing a wide-ranging spectrum of services and treatment options With locations in Montgomery County in Maryland and on the Eastern Shore (ABH-Eastern Shore) of Maryland ABH offers a broad range of services such as acute care residential treatment special education and general education programs chemical dependency programs partial hospitalization programs intensive outpatient services and community-based residential services In addition to a free-standing facility in Rockville services are offered at Washington Adventist Hospital in Takoma Park Services are provided in a variety of settings including hospital-based programs residential treatment centers school programs residential group homes outpatient services and community-based services ABHrsquos inpatient treatment programs provide treatment for a range of mental and behavioral health illnesses including schizophrenia mood disorder post-traumatic stress disorder suicide ideations bipolar disorder and depression
The following tables and figures present more detailed information on patients treated at both the Montgomery County and Dorchester County campuses of ABH in 2012
Adventist Behavioral Health | 45
Snapshot of DiversityThis year patient data from Adventist Behavioral Health (ABH) is included in the Health Equity Report for the first time ABH has facilities in Montgomery County serving patients in Montgomery Prince Georgersquos and Frederick counties (ABH-Rockville) Additionally ABH-Eastern Shore primarily serves the pediatric population of Dorchester and Wicomico counties Due to the very different populations treated at each location most of the data for ABH are presented by location
A total of 3121 unique patients were seen at ABH-Rockville in 2012 Table 17 and Figure 17 below show the distribution of patients by raceethnicity Almost 39 percent of the patients were White and approximately 23 percent of the patients were Black A relatively small percentage of patients identified as Hispanic (7) or Asian (2) In comparison for a relatively large number of patients (collectively almost 30) race was classified as lsquoOtherrsquo or lsquoUnknownrsquo (Note See ldquoAbout the 2013 Health Equity Reportrdquo for details on methodology sources limitations inclusionsexclusions missing data and other information about the data reported here)
TABLE 17 AND FIGURE 17 ALL UNIQUE PATIENTS BY RACEETHNICITY ABH-ROCKVILLE 2012 (N=3121)
RaceEthnicity Percent ()White 386
Black 229
Hispanic 68
Asian 23
Other 125
Unknown 169
Total 100
In 2012 a total of 287 unique patients were seen at ABH-Eastern Shore ABH-Eastern Shore treats children and adolescents only Table 18 and Figure 18 show the racialethnic breakdown of the unique patients treated at ABH-Eastern Shore in 2012 Reflecting the population of the Eastern Shore nearly all of the patients treated at ABH identified as either White (66) or Black (25)
TABLE 18 AND FIGURE 18 ALL UNIQUE PATIENTS BY RACEETHNICITY ABH-EASTERN SHORE 2012 (N=287)
RaceEthnicity Percent ()White 662
Black 251
Hispanic 35
Asian 07
Other 45
Total 100
White 386
Black 229
Hispanic 68
Asian 23
Other 125
Unknown 169
White 662
Black 251
Hispanic 35
Asian 07
Other 45
46 | Adventist Behavioral Health
In addition to the patients seen at ABH-Rockville and ABH-Eastern Shore there were 1688 unique patients classified in their medical record as either a walk-in or call-in and not associated with either location Including these patients there was a combined total of 7635 patient encounters for all of ABH (multiple visits at Rockville and Eastern Shore locations and call-inswalk-ins) in 2012 The racialethnic composition of ABH patients representing all encounters is presented in Table 19 and Figure 19 below As most of the ABH patient volume can be attributed to patients treated at the Rockville location the racialethnic composition seen in Table 19 and Figure 19 is fairly similar to the data seen in Table 17 and Figure 17
TABLE 19 AND FIGURE 19 ALL PATIENT ENCOUNTERS BY RACEETHNICITY ABH 2012 (N=7635)
RaceEthnicity Percent ()White 376
Black 218
Hispanic 63
Asian 18
Other 108
Unknown 218
Total 1001 Due to rounding
White 37
Black 22
Hispanic 6
Asian 2
Other 11
Unknown 22
Adventist Behavioral Health - Rockville Campus
Adventist Behavioral Health | 47
Interpreter ServicesFigure 20 shows the most frequently requested languages for interpretation by phone at ABH-Rockville ABH-Rockville placed more than 240 calls exceeding 4300 minutes The vast majority of the calls were for Spanish language interpretation followed by Korean Mandarin and Farsi In addition to the languages highlighted below calls were placed for four additional languages Urdu Tibetan Vietnamese and German (All Others 20) For ABH-Eastern Shore 14 calls were made during 2012 exceeding 200 minutes All of the calls placed by ABH-Eastern Shore were for Spanish interpretation
FIGURE 20 OVER-THE-PHONE INTERPRETER USE BY NUMBER OF CALLS ABH-ROCKVILLE 2012
Spanish 920
Korean 28
Mandarin 20
Farsi 12 All
Others 20 Other
80
Adventist Behavioral Health - Eastern Shore Campus
48 | Adventist Behavioral Health
In-DepthHEALTH INSURANCE AND PRIMARY DIAGNOSIS
Figure 21 below shows health insurance coverage by raceethnicity for all unique patients seen at ABH-Rockville in 2012 Hispanic Black and Asian patients were covered primarily by Medicaid However the majority of White patients were covered by private insurance Interestingly nearly all of the patients for whom raceethnicity was unknown had no insurance coverage
FIGURE 21 HEALTH INSURANCE COVERAGE BY RACEETHNICITY FOR ALL UNIQUE PATIENTS ABH-ROCKVILLE 2012 (N=3121)
Table 20 below shows health insurance coverage by raceethnicity for all unique patients seen at ABH-Eastern Shore in 2012 As the table shows most of the patients about 67 percent overall were covered by Medicaid Approximately 64 percent of White patients and 75 percent of Black patients had Medicaid as a primary insurer ABH-Eastern Shore treats children and adolescents only therefore Medicare is not a payer
0
10
20
30
40
50
60
70
80
90
100
Hispanic White Black Asian Other Unknown
All OthersPrivateMedicareMedicaidSelf-Pay (Uninsured)
Adventist Behavioral Health | 49
TABLE 20 HEALTH INSURANCE COVERAGE BY RACEETHNICITY FOR ALL UNIQUE PATIENTS ABH-EASTERN SHORE 2012 (N=287)
Hispanic () White () Black () Asian () Other ()
Medicaid 700 642 750 0 769
Private 300 358 250 100 231
Total 100 100 100 100 100
PRIMARY DIAGNOSIS
The Diagnoses tables below show the primary diagnoses of unique patients seen at ABH in 2012 This table shows only the first visit per each unique patient Therefore it is possible that different diagnoses were made for patients with multiple visits in 2012 Also there were often secondary or tertiary diagnoses that are not reflected in the tables below
Table 21 below describes the primary diagnoses for patients treated at ABH-Rockville in 2012 The most common primary diagnosis was lsquoepisodic mood disordersrsquo Mood disorders are characterized by persistent feelings of sadness or fluctuations from extreme happiness to extreme sadness Mood disorders include bipolar episodes and depressive episodes Schizophrenic disorders account for approximately 11 percent of the patients seen For nearly one quarter of patients treated the medical record does not include any information on the primary diagnosis
TABLE 21 PRIMARY DIAGNOSES OF PATIENTS TREATED AT ABH-ROCKVILLE 2012 (N=3121)
Primary Diagnosis Percent ()Schizophrenic Disorders 106
Episodic Mood Disorders 521
Psychosis (Unspecified) 53Alcohol or drug dependence or alcohol or drug abuse (non-dependent) 31
Depressive Disorder not elsewhere classified 55
Other 04
Unknown (No information in medical record) 229
Total 999 ()Due to rounding
Table 22 shows the primary diagnoses for unique patients treated at ABH-Rockville stratified by raceethnicity Black patients were most likely to be diagnosed with a schizophrenic disorder (about 18) compared to 15 percent or less for all other racialethnic groups For all races episodic mood disorders accounted for the majority of the diagnoses Asian patients were most likely to be diagnosed with unspecified psychosis and Hispanic patients were most likely to be diagnosed with depressive disorder (not elsewhere classified) The percentage of patients without a diagnosis recorded in their medical record ranged from about 8 to 10 percent for patients of all races
50 | Adventist Behavioral Health
TABLE 22 PRIMARY DIAGNOSES BY PATIENT RACEETHNICITY ABH-ROCKVILLE 2012 (N=3121)
Hispanic White Black Asian Other UnknownSchizophrenic Disorders 70 110 182 153 110 00
Episodic Mood Disorders 620 660 557 556 665 02
Psychosis (Unspecified) 56 42 91 125 72 00
Alcohol or drug dependence or alcohol or drug abuse (non-dependent)
33 42 46 28 15 00
Depressive Disorder not elsewhere classified
127 62 45 42 92 00
Other 14 04 03 00 05 00
Unknown 80 80 76 97 41 998
Total 100 100 100 100 100 100
Table 23 shows the primary diagnoses for all unique patients treated at ABH-Eastern Shore ABH-Eastern Shore treats children and adolescent patients only The most common diagnosis among the patients was episodic mood disorders (55) The second most common diagnosis was attention deficit hyperactivity disorder (12) For ABH-Eastern Shore patients the diagnoses that are included in lsquoOtherrsquo include the following unspecified psychosis anxiety disorder bulimia and emotional disturbances For two patients there was no diagnosis included in the medical record
TABLE 23 PRIMARY DIAGNOSES OF PATIENTS TREATED AT ABH-EASTERN SHORE 2012 (N=287)
Primary Diagnosis Percent ()Episodic Mood Disorders 551
Adjustment Reactions including PTSD 91
Depressive Disorder not elsewhere classified 101
Disturbance of Conduct not elsewhere classified 49Attention Deficit Disorder (Child) with Hyperactivity or Hyperkinetic syndrome 118
Other 84
Unknown (No information in medical record) 07
Total 1001Due to rounding
Adventist Behavioral Health | 51
Table 24 shows the primary diagnoses for unique patients treated at ABH-Eastern Shore stratified by patient raceethnicity As Table 18 showed above more than 90 percent of the ABH-Eastern Shore patients were White or Black therefore the percentages reported in Table 24 for Hispanic patients (N=10) and Asian patients (N=2) are inflated For both White and Black patients episodic mood disorders were the most common diagnoses Comparatively White patients were more likely to be diagnosed with depressive disorder and Black patients were more likely to be diagnosed with disturbance of conduct
TABLE 24 PRIMARY DIAGNOSES BY PATIENT RACEETHNICITY ABH-EASTERN SHORE 2012 (N=285)
Hispanic White Black Asian OtherEpisodic Mood Disorders 500 534 569 1000 750
Adjustment Reactions including PTSD
300 85 97 00 00
Depressive Disorder not elsewhere classified
200 122 42 00 83
Disturbance of Conduct not elsewhere classified
00 37 97 00 00
ADD (Child) with Hyper-activity or Hyperkinetic syndrome
00 127 111 00 167
Other 00 95 83 00 00
Total 100 100 999 100 100Due to rounding
52 | Adventist Behavioral Health
Selected Quality Measures for Adventist Behavioral Health The Hospital-Based Inpatient Psychiatric Servicersquos (HBIPS) Core Measure Set consists of seven measures to assess quality of care for patients discharged from free-standing psychiatric hospitals and acute-care hospitals with psychiatric units The following five measures are reported by race only in Table 25 (HBIPS 2 and HBIPS 3 which apply to hours in physical restraint and hours in seclusion were not included)
HBIPS 1 ndash Admission screening for violence risk substance use psychological trauma history and patient strengths completed
HBIPS 4 - Patient discharged on multiple antipsychotic medications
HBIPS 5 ndash Patient discharged on multiple antipsychotic medications with appropriate justification
HBIPS 6 ndash Post discharge continuing care plan created
HBIPS 7 ndash Post discharge continuing care plan transmitted to next level of care provider upon discharge
For HBIPS 1 there was nearly 100 percent compliance for all patients For HBIPS 4 and 5 there was more variation between patients from different racial groups For example more than 30 percent of Asian patients were discharged on multiple antipsychotic medications compared to 15 percent of White patients and 2 percent of Black patients However all patients had higher percentages of being discharged on multiple medications with appropriate justification (HBIPS 5) For White Black and Asian patients a post-discharge continuing care plan was created more than 90 percent of the time (HBIPS 6) However that plan was not always transmitted to the next level-of-care provider upon the patientsrsquo discharge (HBIPS 7)
TABLE 25 HBIPS QUALITY MEASURES BY RACE ALL PATIENTS ABH-ROCKVILLE 2012 (IN PERCENTS)
HBIPS 1 HBIPS 4 HBIPS 5 HBIPS 6 HBIPS 7White 999 149 650 907 865
Black 996 16 775 908 867
Asian 100 315 765 929 894
Specialty Care
54 | Specialty Care
Adventist Home Care ServicesSNAPSHOT OF DIVERSITY
Adventist Home Care Services (AHCS) a part of Adventist HealthCare Inc (AHC) offers a variety of programs and services to residents in the Washington DC metropolitan area and suburban Maryland to assist patients while they recuperate from an illness injury or surgical procedure They offer a full range of supportive services to assist with personal care or daily activities Among the services that they provide are nursing (eg cardiac care wound care diabetes management and medication management) rehabilitation (eg physical therapy and occupational therapy) and maternalchild services (eg lactation support phototherapy etc) The services provided allow patients to receive assistance upon discharge from a hospital or even prevent an initial admission to a hospital Many avoidable hospital readmissions are related to a lack of support and resources upon discharge from the hospital5354 With these and other services AHCS plays a vital role in filling these gaps and ensuring a continuum of care for patients With proper discharge planning and access to appropriate medicalclinical support resources patients are more likely to experience positive outcomes which may reduce the need for inpatient care As AHC continues to shift toward a population health approach home care services will provide critical support to address the health needs of people in the communities we serve
Table 26 below shows the patients who received AHCS services in 2012 More than 5700 unique patients received services in 2012 These patients accounted for more than 77035 visits during 2012 Table 25 shows the breakdown of unique AHCS patients by raceethnicity Just more than half of the patients were White (51) and 35 percent were Black Hispanic patients and Asian patients accounted for 7 percent and 6 percent of patients respectively (Note See ldquoAbout the 2013 Health Equity Reportrdquo for details on methodology sources limitations inclusionsexclusions missing data and other information about the data reported here)
TABLE 26 ALL UNIQUE PATIENTS BY RACEETHNICITY AHCS 2012 (N=5736)
RaceEthnicity Percent ()White 508
Black 349
Hispanic 70
Asian 64
Other 07
Unknown 03
Total 1001Due to rounding
PRIMARY DIAGNOSIS AND HEALTH INSURANCE
More than half of AHCS patients were diagnosed as being ldquonot currently sickrdquo or having a ldquoproblem that influenced their health statusrdquo which includes being in a post-procedural state having problems with limbs having motor or sensory problems and receiving dialysis (ICD 9 codes V40-V82) Other prevalent diagnoses included diseases of the circulatory system skin and subcutaneous tissue and musculoskeletal system
Specialty Care | 55
Table 27 shows primary health insurance coverage for unique patients who received AHCS services We are not able to report this information by patient raceethnicity However the data shows that the majority of patients (64) and visits (75) were covered by Medicare Nearly all of the remaining patients were covered by private insurance including health maintenance organizations (HMOs) Less than 4 percent of all patients and 3 percent of all visits were covered by Medicaid or the patient (uninsured) This data suggests that community members without private insurance who are not Medicare eligible may face significant barriers to accessing the services provided by AHCS However it is notable that AHCS had more than 300 charity visits during 2012
TABLE 27 HEALTH INSURANCE COVERAGE FOR ALL UNIQUE PATIENTS AHCS 2012 (N=5736)
Unique Patients ()
Visits () (N=77035)
Medicare 638 747
Medicaid 32 24
PrivateHMO 327 228
Self-Pay (Uninsured) 03 02
Total 100 1001Due to rounding
Of all the visits that AHCS made in 2012 skilled nursing services and physical therapy accounted for the vast majority of services provided to patients (almost 85) The third and fourth most common services were home health aide and occupational therapy services Other services included speechlanguage and medical social work
INTERPRETER SERVICES
Figure 22 shows the languages requested most frequently for interpretation by phone at AHCS AHCS placed more than 280 calls exceeding 3300 minutes As seen in Figure 22 the vast majority of calls placed were for Spanish the second and third most requested languages were Mandarin and Korean In addition to the languages highlighted below calls were placed for seven additional languages including Amharic and Russian (All Others 32)
FIGURE 22 OVER-THE-PHONE INTERPRETER USE BY NUMBER OF CALLS AHCS 2012
Spanish 929
Mandarin 21
Korean 18
All Others 32
Other 71
56 | Specialty Care
Adventist Rehabilitation Hospital of MarylandSNAPSHOT OF DIVERSITY
Adventist Rehabilitation Hospital of Maryland (ARHM) is the first and only acute rehabilitation hospital in Montgomery County offering specialized inpatient and outpatient treatment for persons with functional limitations ARHM primarily serves adults 18 years or older who largely reside in Montgomery County (78) or Prince Georgersquos County (18)
ARHM has two hospital locations a free-standing 55-bed hospital adjacent to SGAH in Rockville and a 32-bed hospital located in WAH in Takoma Park Outpatient services are provided at both the Rockville location and a community-based center in Silver Spring Maryland
ARHM offers comprehensive rehabilitation programs for traumatic brain injuries spinal cord injuries strokes amputations orthopedic injuries and surgeries sports related injuries work-related injuries cardiopulmonary conditions and neurological disorders Currently ARHM is the only acute rehab facility within a five-state region with a Commission on Accreditation Facilities (CARF) accreditation for all four of its specialty programs stroke brain injury spinal cord injury and amputee It was one of the first acute rehabilitation facilities in the nation to earn specialty accreditation for its amputee program Further ARHM was recognized in 2013 by the Maryland Patient Safety Center (MPSC) for its innovative patient safety program to reduce acute-care readmissions and increase patient safety Like AHCrsquos other specialty entities the specialized services provided by ARHM illustrate the organizationrsquos commitment to population-based care and dedication to improve the overall health and well-being of the communities we serve
Approximately 1500 unique inpatients were treated at ARHM in 2012 The stratification of these patients by raceethnicity is illustrated in Table 28 below Data on outpatients are not presented here The majority of inpatients treated at ARHM (about 58) were White The percentage of White patients is nearly double the percentage of Black patients who account for about 30 percent of the patient population Hispanic patients and Asian patients account for nearly 6 and 7 percent of the remaining patients respectively (Note See ldquoAbout the 2013 Health Equity Reportrdquo for details on methodology sources limitations inclusionsexclusions missing data and other information about the data reported here)
TABLE 28 ALL UNIQUE PATIENTS BY RACEETHNICITY ARHM 2012 (N=1571)
RaceEthnicity Percent ()White 575
Black 300
Hispanic 57
Asian 66
OtherUnknown 02
Total 100
Specialty Care | 57
HEALTH INSURANCE
Table 29 below shows health insurance coverage for inpatients seen at ARHM for 2012 Sixty-two (62) percent of inpatients were covered by Medicare while 30 percent had private or commercial insurance Less than 10 percent of inpatients were covered by Medicaid or were uninsured
TABLE 29 HEALTH INSURANCE COVERAGE FOR ALL UNIQUE PATIENTS ARHM 2012 (N=1571)
Percent ()Private Insurance 291
Medicare 619
Medicaid 70
All Others 16
Self-Pay (Uninsured) 04
Total 100
INTERPRETER SERVICES
Figure 23 shows the languages most frequently requested for phone interpretation at ARHM ARHM placed more than 870 calls in 2012 exceeding 14300 minutes Spanish was the most frequently requested language at about 53 percent Mandarin was the second most requested language at almost 25 percent Russian and Farsi were the third and fourth most requested languages respectively In addition to the languages included in Figure 23 calls were placed for an additional 14 languages including Tagalog and Gujarati (All Others 38)
FIGURE 23 OVER-THE-PHONE INTERPRETER USE BY NUMBER OF CALLS ARHM 2012
Spanish 529
Mandarin 248
Russian 49
Farsi 34
Haitian Creole 29
Cantonese 26
Vietnamese 24
Korean 23
All Others 38
Other 174
Affordable Care Act Implementation in the State of Maryland
Maryland Governor Martin OrsquoMalley signed into law the Maryland Health Improvement and Disparities Reduction Act of 2012 to expand access to care reduce chronic illness and promote equity particularly in underserved areas known as Health Enterprise Zones (HEZs) The HEZ initiative was created to reduce racial and ethnic health disparities improve health care access and outcomes in underserved populations and reduce hospital readmissions Five locations in Maryland designated as health enterprise zones in 2013 will receive a range of incentives benefits and grant funding to address disparities MedStar St Maryrsquos Hospital Greater Lexington Park (St Maryrsquos County) Prince Georgersquos County Health Department Capital Heights Dorchester County Health Department Dorchester and Caroline counties Bon Secours Baltimore Health System West Baltimore and Anne Arundel Health System Annapolis For additional information about the HEZ initiative and specific proposals visit httpdhmhmarylandgovhealthenterprisezonesSitePagesUpdatesaspx
Marylandrsquos law to reduce health disparities includes requirements for health care organizations to collect standard categories of race and ethnicity and report efforts to track and reduce disparities In 2013 the Health Services Cost Review Commission of the Maryland Department of Health and Mental Hygiene (HSCRC) provided funding to the Center on Health Disparities at Adventist HealthCare to provide race ethnicity and language data collection training to Maryland hospital staff including patient registrars quality coordinators admission directors and leadership The Center and the Institute for Patient- and Family-Centered Care (IPFCC) in partnership with HSCRC and the Maryland Hospital Association (MHA) held three Train-the-Trainer sessions on how to collect and use patient data and address patientsrsquo concerns at MHA in Elkridge (Central Maryland) Shore Health System The Memorial Hospital at Easton (Eastern Maryland) and Frederick Memorial Hospital in Frederick (Western Maryland) Training sessions such as these serve as a valuable resource to hospital leadership and staff as they strive to be in compliance with data reporting requirements outlined by HSCRC Standardized collection of patient demographic data is important to inform quality improvement efforts address needs of vulnerable populations and ultimately reduce disparities Through the collaborative work of all the partners on this project hospitals across the state are now well-equipped to collect accurate data and provide the highest quality care to all residents of the state of Maryland
Efforts to Reduce Readmissions
60 | Efforts to Reduce Readmissions
BACKGROUND As a part of its strategic plan for 2010ndash2014 Adventist HealthCare (AHC) has employed a strategy of providing population-based care to the communities it serves Through the use of innovative and patient-centered discharge processes and the cultivation of community partnerships AHC has become a leader in its efforts to ensure patient wellness after discharge from its hospitals ldquoNearly one in five Medicare patients discharged from a hospitalmdashapproximately 26 million seniorsmdashis readmitted within 30 days at a cost of over $26 billion every yearrdquo55 While not all readmissions can be predicted or prevented it is estimated that more than $17 billion each year pays for readmissions that are in fact preventable56
Adventist Rehabilitation Hospital of Maryland (ARHM) and AHCrsquos acute-care hospitalsmdashShady Grove Adventist Hospital (SGAH) and Washington Adventist Hospital (WAH)mdashparticipate in the Partnership for Patients a CMS program with goals to improve patient safety and support effective transitions from hospitals to other settings57 Our hospitals are part of Premierrsquos Hospital Engagement Network (HEN) a collaborative of 450 hospitals and the largest CMS-approved HEN in the nation The HEN focuses on multiple areas that affect patient safety including preventable hospital readmissions HEN rates are calculated using the Admission-Readmission Revenue (ARR) method giving credence to Marylandrsquos modernized all-payer rate-setting system for hospital services an unprecedented effort to enhance care for patients improve health care outcomes and control costs across the state58 Participation in the HEN provides significant opportunities to exchange best practices among hospitals across the country to address care and safety for Medicare program participants Because of AHCrsquos commitment to quality and safety and its partnership with Walgreens Premier invited WAH to present their efforts at their annual Breakthroughs Conference in November 2013
A CALL TO ACTION
The need for action around reducing preventable readmissions has recently been reinvigorated with a sense of urgency due to new provisions in the Patient Protection and Affordable Care Act (ACA) The Medicare Readmission Reduction program which went into effect October of 2012 reduced payments up to one percent for hospitals with excess preventable readmission rates related to heart failure acute myocardial infarction and pneumonia59 This deduction will increase to two percent in 2014 and peak at three percent in 2015 while also expanding to conditions including chronic obstructive pulmonary disease and coronary bypass grafting In addition to financial penalties for doing poorly new Medicare policies have been instituted to provide financial rewards to those hospitals that are meeting or exceeding certain quality measures Several of these quality measures focus on discharge practices such as informing patients of symptoms to look out for post-discharge and inquiring if they will have the necessary help and support once they return home60
A high rate of preventable readmissions is often a complex problem stemming from multiple causes and therefore requires a multifaceted approach to remedy Over the past two years WAH has successfully implemented programs to enhance the discharge process for all patients adopted an added focus on high-risk patients and cultivated community partnerships to improve the continuum of care post-discharge Through its efforts WAH has seen a 45 percent reduction in readmissions decreasing from 11 percent in December of 2011 to 65 percent in September of 2013
At the same time SGAH has implemented programs to assist in the post-discharge care of high-risk patients partnering with post-acute care providers and using a disease-specific model to address the most vulnerable patients SGAH has seen a 107 percent reduction in readmissions decreasing from 683 percent in December of 2011 to 576 percent in August of 2013 The hospital continues to work on other disease specific initiatives to reduce readmissions
Efforts to Reduce Readmissions | 61
ARHM was recognized in 2013 by the Maryland Patient Safety Center (MPSC) for its innovative patient safety program to reduce acute-care readmissions and increase patient safety ARHM instituted new processes in the fall of 2010 to decrease the number of patients readmitted to acute-care hospitals by implementing a collaborative clinical review of each patient throughout the transfer process According to the hospitalrsquos medical director the program has resulted in fewer patients returning to acute-care hospitals and more patients being discharged home Nationally their ldquodischarge to homerdquo rates are in the 80th percentile (ie better than 80) of all hospitals in the country
In collaboration with partners Carelink Community Clinic Inc Family Services Inc and WAH Adventist Behavioral Health (ABH) is working to better serve the chronically mentally ill by providing necessary support in the community and expanding outpatient services ABH has increased its outreach to the community using multiple approaches to engage families in the treatment process From family days to providing transportation to treatment centers and using videoconferencing technologies these efforts have increased familiesrsquo access to patients contributed to positive treatment outcomes and reduced the incidence of readmission
OVERVIEW OF PROGRAMS
Enhancing the Discharge Process
Following discharge patients often return home feeling overwhelmed and unsure of next steps In order to simplify the transition AHC has been working to ensure that all discharged hospital patients who need support with follow-up care receive assistance with finding a physician and scheduling a primary care appointment before they leave the hospital For instance ABH is working with payers to establish what are known as ldquobridgerdquo services for individuals who have difficulty scheduling follow-up outpatient care within seven days Through a partnership with Walgreens both WAH and SGAH have been able to ensure that patients can easily fill prescriptions and speak to a pharmacist prior to discharge
The Walgreens Bedside Prescription Delivery Service initiated in June of 2011 is available to all inpatients and includes a follow-up call from the pharmacist within 48ndash72 hours of discharge During the follow-up call the pharmacist is able to answer questions about medications and provide additional patient education Among those patients taking part in this program there has been an increase in medication compliance and as a result improved health status and fewer emergent needs This patient resource has also contributed to reducing readmissions thus helping individuals stay well and complete a prescribed medication course Additional resources for patients are available as needed to assess and support patientsrsquo discharge needs (eg resources to address behavioral health needs outpatient case management and help with transition to adult day care)
Also both WAH and SGAH are enrolled as 340B outpatient pharmacy programs with Walgreens Through this federal program which provides reduced pricing for most drugs money is returning to the hospitals to be applied toward the cost of medication for underserved patients
Adopting an Added Focus on High-Risk Patients
Each patient receiving care at AHC hospitals varies both in their condition and in the resources and support to which they have access In order to ensure that those with more complex conditions and circumstances have the added support they need when they leave the hospital hospital staff (including nurse managers case managers and transition care team members) identify patients at high-risk for readmission and then provide appropriate follow-up care
62 | Efforts to Reduce Readmissions
Patients identified as high-risk (eg non-adherent to recommendations having multiple co-morbidities diagnosed with congestive heart failure or lacking a support system or resources) are able to benefit from multiple programs designed to help navigate the road to recovery SGAH and WAH participate in the WellTransitions Program (in partnership with Walgreens) which provides high-risk patients with three follow-up calls from a pharmacist within 30 days of leaving the hospital During these follow-up calls pharmacists are able to address questions around prescribed hospital medications home medications side effects dosage and any additional health issues the patient may have In addition both hospitalsmdashtogether with Adventist Home Care Services (AHCS)mdashhave developed the Healthy Heart at Home program that focuses on patients with congestive heart failure Pill boxes and scales are provided to patients to help them better manage their disease A cardiac nurse assists patients with education family support nutrition and medication management as well
In 2013 WAH and partner Conifer Health Solutions launched the My Health Placereg program which utilizes the model of a personal healthcare nurse Through this program the transitional care team ensures that all discharged high-risk patients have a scheduled follow-up appointment before leaving the hospital Each of these patients receives a My Health Placereg Passport booklet which includes the name and number of their doctor as well as the date time and location of their follow-up appointment Additional helpful information such as a phone number to call with questions reminders of what to bring to the follow-up appointment the duration of the hospital stay and the procedures that were performed is also included The Passport is available in English Spanish French and Amharic In addition to providing patients with a Passport a member of the care team meets with each patient prior to discharge and conducts three follow-up calls within 30 days of leaving the hospital The care team implements individualized interventions often meeting the needs of patients within one week of discharge Interventions may include support for a spouse or loved one assistance with sub-acute placement referrals to wound care to avoid unnecessary readmission home health services transition to a nursing home or hospice care and arranging transportation
Developing Community Partnerships
AHC fosters partnerships with community members and organizations to improve care transitions for discharged patients A Community Coalition to Improve Care Transitions was initially established as a method for each hospital to begin thinking outside the box to develop care coordination solutions for patients and reduce readmissions The coalition at WAH launched in March of 2013 has since grown into a partnership between 35 different health services throughout the community with a mission to improve the transition of care from hospital to community for residents of the region The partners meet monthly to collaboratively and creatively solve patient challenges with an aim to reduce preventable readmissions at acute-care hospitals by 20 percent over a three year period
At SGAH the coalition to develop and strengthen partnerships among providers serves patients throughout the greater community In May of 2013 the coalition began meeting quarterly with an aim to reduce readmissions by 10 percent over the following 12 months SGAH has several other successful partnerships in place through which they are able to offer patients invaluable resources (eg ranging from transportation to outpatient case management) to improve their health and primary care following discharge
In order to reach those in need of health care before they even come to the emergency department AHC has developed direct partnerships with three local housing facilitiesmdashand a fourth in progressmdashto provide accessible primary care Through these partnerships AHC has increased access to primary care services for elderly and underserved populations who otherwise may have gone without care
Efforts to Reduce Readmissions | 63
FUTURE DIRECTIONS
While it is difficult to determine the impact of programs to reduce readmissions both WAH and SGAH have been successful in achieving an overall reduction in readmission rates over the course of one and a half years Going forward AHC will continue to grow its readmission reduction initiatives and community partnerships while also expanding its focus to outpatient care Beginning in 2014 efforts will be put in place at WAH to address the needs of individuals who pay frequent visits to the emergency department One such program will assist patients with becoming better advocates for their own health Individuals at high risk for emergency department visits or for not following through with doctor appointments will be matched with volunteer health coaches These coaches will be available to accompany patients to their doctor appointments
Looking forward for SGAH greater emphasis will be put on addressing needs of uninsured and homeless patients Potential efforts include a partnership with the Montgomery County Agency on Aging to increase medical beds and funding for uninsured and homeless patients needed for short-term rehabilitation or continued treatment Additionally Shady Grove would like to obtain funding for increased community case management to assist with medication refills physician follow-up and compliance with treatments for homeless county residents
Conclusion and Next Steps
Conclusion and Next Steps | 65
Conclusion and Next Steps The Institute for Healthcare Improvementrsquos Triple Aim for improving the US healthcare system focuses on improving patient experience reducing costs for the population and improving the health of the community61 Meeting these strategic aims to achieve health equity requires targeted efforts that ldquoeliminate potentially avoidable differences or disparities in health between socially advantaged and disadvantaged groupsrdquo62
The 2013 Adventist HealthCare Health Equity Report presents a comprehensive snapshot of the patient populationsmdashstratified by race ethnicity and preferred languagemdashthat received care at Washington Adventist Hospital (WAH) and Shady Grove Adventist Hospital (SGAH) in 2012 In addition we include data from specialty care entities Adventist Behavioral Health Adventist Rehabilitation Hospital of Maryland and Adventist Home Care Services The report presents patient demographics and information about hospital readmissions quality measures primary diagnoses patient experiences with care and use of interpreter services for different populations receiving care at Adventist HealthCare hospitals and other entities
At the end of last yearrsquos Health Equity Report we offered a set of recommendations for hospitals and healthcare systems to improve quality of care and outcomes
1 Improve patient demographic data collection and increase transparency by reporting hospital performance data by race ethnicity and language preference data
2 Monitor differences in quality of care and healthcare outcomes to inform hospitalsrsquo strategic goals develop community outreach programs and target quality improvement efforts
3 Implement data-driven interventions to improve healthcare quality and outcomes
4 Promote the provision of culturally competent patient-centered care
This yearrsquos report highlights specific initiatives at Adventist HealthCare (AHC) to connect mission-driven strategies with quality and patient experience transitions in care and partnerships to improve outcomes for people and communities AHC has implemented various strategies to identify and monitor differences in health status that lead to inequalities in care among minority populations (Recommendations 2-3) In the summer of 2013 the Center on Health Disparities partnered with the Institute for Patient- and Family-Centered Care Maryland Hospital Association and the Health Services Cost Review Commission (HSCRC) to provide raceethnicity and language data collection training to Maryland hospitals in order to ensure accurate data collection and compliance with state data reporting requirements (Recommendations 1 4) Hospitals equipped with the knowledge and resources to collect use and monitor standardized patient demographic data are able to implement data-driven interventions that align with identified community health needs and enhance community benefit reporting Along with information from this report and findings from needs assessments AHC will be able to assess its progress at addressing disparities and community health needs and promoting culturally competent care (Recommendations 2 4) AHCrsquos community health needs assessment reports and implementation plans for its hospitals and other entities will be publicly available by the end of this year and early next year Next steps will include rolling out initiatives to address the needs and concerns of individuals and populations in the healthcare systemrsquos service areas (Recommendation 3)
Hospitals are embracing the idea of better managing ldquotransitions of carerdquo and ensuring that patients experience a smooth transition from inpatient to outpatient care Population-based care and access to care are important strategic goals for Adventist HealthCarersquos hospitals these goals are informed by community input and quality improvement efforts focused on improving the health of people in our communities (Recommendation 2) Specifically collaborative population-based initiatives such as the Community Coalitions to Improve Care Transitions patient and family engagement and patient safety programs have been effective at improving outcomes and reducing preventable hospital readmissions (Recommendation 4)
66 | Conclusion and Next Steps
In our last report we stated that effective patient-provider communication is essential to providing high-quality patient-centered care and is necessary for patient safety Patient experience data collected from patients who speak a language other than English is an important part of providing population-based care and demonstrates compliance with national standards for effective communication in health care In the third quarter of 2013 WAH began conducting patient experience surveys with limited English-proficient patients in response to the growing proportion of Hispanic patients being served there Patient-provider communication is a key factor in perceived experience of care Also patient-centered culturally appropriate discharge instructions are critical tools that help patients understand next steps for follow-up care upon leaving the hospital which factors into our ability to provide the best care possible (Recommendation 4) Next steps might include analysis of patient experience data in specific departments implementing culturally competent population-based initiatives
Information beyond race and ethnicity are important indicators to measure to ensure that patientsrsquo needs are met (Recommendations 1ndash3) Key indicators of interest might include age gender sexual orientation income education insurance status religion health status and disability status In some cases it may be necessary to survey specific samples of people from different populations using various methods (ie using online surveys vs paper or phone surveys) to assess perceptions of organizational cultural competence or the effectiveness of programs and initiatives (eg interpreter services)
In conclusion achieving health equity will require shifting the focus beyond access and health care delivery to quality and appropriateness of care as well as addressing disparities and numerous factors that play a role in shaping population health outcomes We encourage leadership in our hospitals and other healthcare organizations to use valuable hospital data and information about community needs to shift their focus to population health health equity and healthcare quality improvement
References
68 | References
References1 Braveman P (2006) Health disparities and
health equity Concepts and measurement Annual Review of Public Health 27(1) 167ndash194
2 Kindig D (2007) Understanding Population Health Madison Blackwell Publishing
3 Kindig D amp Stoddart G (2003) What is population health American Journal of Public Health 380ndash383
4 Center on Health Disparities 2010 Progress Report Partnering Toward a Healthier Future Social Determinants of Health Adventist HealthCare Inc Rockville MD
5 Office of Minority Health and Health Disparities (2012) Maryland Chartbook of Minority Health and Health Disparities Data 2012 Third edition Maryland Department of Health and Mental Hygiene Retrieved from httpdhmhmarylandgovmhhdSitePagesHealth20Equity20Dataaspx
6 Whitehead M (1992) The concepts and principles of equity in health International Journal of Health Services 22(3) 429ndash445
7 Institute of Medicine (2003) Unequal treatment Confronting racial and ethnic disparities in health care Washington DC The National Academies Press
8 Agency for Healthcare Research and Quality (2012) National Healthcare Disparities Report (13-0003) US Department of Health amp Human Services Retrieved from wwwahrqgovresearchfindingsnhqrdrindexhtml
9 May E L (2013) Population health management Defining the providerrsquos role Healthcare Executive 20ndash29
10 Stoto M A (2013) Population health in the Affordable Care Act era Academy Health 1ndash6
11 Center on Health Disparities 2011 Progress Report Partnering toward a healthier future Health disparities in the era of reform implementation Adventist HealthCare Inc Rockville MD
12 Ibid 113 US Department of Health and Human
Services (2011) Health equity amp disparities National Partnership for Action to End Health Disparities Retrieved from httpminorityhealthhhsgovnpatemplatesbrowseaspxlvl=1amplvlid=34
14 Ibid 6
15 Morrissey J (2012) 10 facts about population health Trustee 10ndash14
16 Managing population health The role of the hospital Health Research amp Educational Trust Chicago April 2012 Retrieved from wwwhpoeorg
17 Ibid 1618 Centers for Disease Control and Prevention
Chronic diseases The power to prevent the call to control At a glance 2009 US Department of Health amp Human Services Retrieved from httpwwwcdcgovchronicdiseaseresourcespublicationsaagchronichtm
19 Institute of Medicine (2013) Population health implications of the Affordable Care Act Workshop summary Washington DC The National Academies Press
20 Goldberg A (2013) It matters how we define health care equity Commentary Institute of Medicine Washington DC Retrieved from httpwwwiomeduHomeGlobalPerspectives2013DefineHealthCareEquityaspx
21 Center on Health Disparities 2012 Progress Report Partnering toward a healthier future Adventist HealthCare Health Equity Report Adventist HealthCare Inc Rockville MD
22 Hasnain-Wynia R Kang R Landrum M B Vogeli C Baker D amp Weissman J (2010) Racial and ethnic disparities within and between hospitals for inpatient quality of care An examination of patient-level Hospital Quality Alliance measures Journal of Health Care for the Poor and Underserved 21(2) 629ndash648
23 Centers for Medicare amp Medicaid Services (2013) Readmissions Reduction Program Retrieved from httpwwwcmsgovMedicare Medicare-Fee- for -Serv ice-PaymentAcuteInpatientPPSReadmissions-Reduction-Programhtml
24 Health Services Cost Review Commission Post-meeting Documents from the 497th Meeting of the Health Services Cost Review Commission May 1 2013 Maryland Department of Health and Mental Hygiene Retrieved from httpwwwhscrcstatemdusdocumentsCommissionMeeting201305-01hscrc-post-comm-meet-docs2013-05-01pdf
References | 69
25 Young GJ Meterko M amp Desai KR (2000) Patient satisfaction with hospital care Effects of demographic and institutional characteristics Medical Care 38(3) 325ndash334
26 Murray-Garciacutea J Selby J Schmittdiel J Grumbach K amp Quesenberry C (2000) Racial and ethnic differences in a patient survey Patientsrsquo values ratings and reports regarding physician primary care performance in a large health maintenance organization Medical Care 38(3) 300ndash310
27 Elliott M Lehrman W Goldstein E Hambarsoomian K Beckett M Giordano L (2010) Do hospitals rank differently on HCAHPS for different patient subgroups Medical Care Research and Review 67(1) 56ndash73 Retrieved from httpmcrsagepubcomcontent67156
28 Sauter M Hess A (2012) Americarsquos best (and worst) educated states Fox Report Retrieved from httpwwwfoxbusinesscompersonal-finance20121015americas-best-and-worst-educated-states
29 Kurtzleben D (2013) The 10 most educated US cities US News Retrieved from httpwwwusnewscomnewsbest-citiesslideshowsthe-10-most-educated-us-cities9
30 Ibid 2731 Goldstein E Elliott MN Lehrman
WG Hambarsoomian K Giordano LA (2010) Racialethnic differences in patientsrsquo perceptions of inpatient care using the HCAHPS survey Medical Care Research and Review 67(1) 74ndash92
32 Ibid 2833 Ibid 2934 US Department of Health amp Human
Services What is mental health Retrieved from MentalHealthgov website httpwwwmentalhealthgovbasicswhat-is-mental-healthindexhtml
35 The National Alliance on Mental Illness (2013 March) Mental illness facts and numbers Retrieved from httpwwwnamiorgfactsheetsmentalillness_factsheetpdf
36 National Institute of Mental Health (2006) Mental healthcare cost data for all Americans Retrieved from httpwwwnimhnihgovstatistics4COST_AM2006shtml
37 Ibid 35
38 National Alliance on Mental Illness State Advocacy 2010 State statistics Maryland Retrieved from httpwwwnamiorgContentManagementContentDisplaycfmContentFileID=93498
39 Anxiety amp Stress Center PC Generalized anxiety disorder (GAD) Retrieved from httpanxiety-stresscentercomanxietygeneralized-anxiety-disorder
40 Maryland Behavioral Risk Factor Surveillance System 2009 Montgomery County Behavioral Health Profile httpwwwmarylandbrfssorgcgi-binbrokerexe
41 Peninsula Regional Medical Center (2011) Creating healthy communities Community Dashboard Indicators for Wicomico County Retrieved from httpwwwpeninsulaorgbodycfmid=627ampoTopId=627
42 National Institute on Minority Health and Health Disparities Health disparities ndash mental health National Institutes of Health Retrieved from httpwwwnimhdnihgovhdFactSheetasp
43 Substance Abuse and Mental Health Services Administration (2010) Results from the 2009 National Survey on Drug Use and Health Volume I Summary of National Findings (Office of Applied Studies NSDUH Series H-38A HHS Publication No SMA 10-4586Findings)
44 National Alliance on Mental Illness (2005) Eliminating disparities in mental health An overview Arlington VA Retrieved from httpwwwnamiorgContentNavigationMenuF ind_Suppor t Mul t icu l tura l_Suppor t Sharing_Hope1DisparitiesOverviewpdf
45 Substance Abuse and Mental Health Services Administration (2012) Mental health United States 2010 HHS Publication No (SMA) 12-4681 Rockville MD Retrieved from httpwwwsamhsagovdata2k12MHUS2010MHUS-2010pdf
46 Office of Minority Health (2013) Mental health datastatistics US Department of Health amp Human Services Retrieved from httpwwwminorityhealthhhsgovtemplatesbrowseaspxlvl=3amplvlid=539
70 | References
47 Williams D R Jackson J Gonzaacutelez H M Neighbors H Nesse R Abelson J M amp Sweetman J (2007) Prevalence and distribution of major depressive disorder in African Americans Caribbean Blacks and Non-Hispanic Whites Archives of General Psychiatry 64(3) 305ndash315
48 Ibid 4449 Ibid 4550 Maryland Department of Health and Mental
Hygiene Vital Statistics Administration (2011) Maryland vital statistics annual report 2011 Retrieved from httpdhmhmarylandgovvsaDocuments11annualpdf
51 Ibid 4352 Ibid 4453 Van Walraven C Seth R Austin P amp
Laupacis A (2002) Effect of discharge summary availability during post-discharge visits on hospital readmission Journal of General Internal Medicine 17(3) 186ndash192
54 Nelson E Maruish M amp Axler J (2000) Effects of discharge planning and compliance with outpatient appointments on readmission rates Psychiatric Services 51(7) 885ndash889
55 Centers for Medicare amp Medicaid Services Community-based care transitions program Retrieved from httpinnovationcmsgovinitiativesCCTPindexhtml
56 Lavizzo-Mourey R (2013) In the revolving door A report on US hospital readmissions Retrieved from httpwwwrwjforgcontentdamfarmreportsreports2013rwjf404178
57 Premier Inc (2013) Partnership for Patients Retrieved from httpswwwpremierinccomsafetytopicsHAIHAI-Partnership-for-patientsjsp
58 Maryland Department of Health and Mental Hygiene (2013) DHMH posts revised proposal for modernization of MDrsquos all-payer hospital system for comment Retrieved from httpdhmhmarylandgovnewsroom1PagesDHMH-Posts-Revised-Proposal-for-Modernization-of-MDrsquos-All-Payer-Hospital-System-for-Commentaspx
59 Ibid 2360 Burton R (2012) Improving care transitions
(Policy Brief 9-13) Retrieved from httpwwwhealthaffairsorghealthpolicybriefsbriefphpbrief_id=76
61 Institute for Healthcare Improvement (2013) The IHI triple aim Retrieved from httpwwwihiorgofferingsInitiativesTripleAimPagesdefaultaspx
62 Ibid 1
References | 71
AcknowledgmentsThis report is the result of collaborative efforts among Adventist HealthCare staff and interns across the health system A great deal of gratitude is given to the members of the report planning committee for their valuable contributions to the report Joy Gill Robert Wells Peter Mbugua Arumani Manisundaram Marcos Pesquera Deidre Washington and Marilyn Lynk Debra Illig Joy Gill and Khyati Mehta helped with interpreting quality performance data and shared information on system-wide efforts to improve patient quality and safety Robert Wells and Daymara Hernandez provided detailed hospital performance data as well as data on readmissions Peter Mbugua helped with gaining access to and conducting analysis of patience experience data and described ongoing hospital initiatives to improve patient experience of care Mairene Win Pam Woynicz Caterina Pangilinan Dawn Chriss Lynette Godhard Barbara Toops and Clarencia Stephen provided assistance with gathering entity specific data information on patient demographics various process and outcome metrics and best practices to improve health care outcomes Judith Kurtis and Jo Cimino provided detailed information about efforts to reduce readmission rates through community-based initiatives and partnerships to improve care transitions Cindy Glass and Danielle Lewald assisted with editing and facilitated efforts to format and print the report for publication and dissemination
Special thanks goes to the Center for Health Equity and Wellness staff who have worked tirelessly to improve the way data are collected monitored stored retrieved and reported throughout the Adventist HealthCare system Our gratitude goes to Dr Deidre Washington for her tremendous efforts at data gathering analysis interpretation and writing and for managing contributions to the report Tiffany Capeles provided creative leadership and perseverance in the design and production of the report Talya Frelick and Eme Martin shared valuable information especially on language services and needs assessment findings and provided unending support in the development of the report Graduate interns Christopher Smith and Gina Maxham worked diligently and independently to prepare sections on patient experience quality performance and readmission reduction efforts Research Assistant Nadine Monforte along with undergraduate interns Michele Troutman Akash Syngal and Guofan Li provided assistance with background information references and data analysis Last but not least Marcos Pesquera and Dr Marilyn Lynk provided continuous leadership and encouragement in the development of this informative report leveraging stakeholders at AHC reviewing drafts and managing planning and production through the year
Adventist HealthCare Center for Health Equity and Wellness820 West Diamond Avenue bull Suite 400 bull Gaithersburg MD 20878 bull 301-315-3677
httpwwwadventisthealthcarecomdisparities