Embed Size (px)
Citation preview

Partnership for Urban South
Hampshire Strategic Flood Risk Assessment Final Report
December 2007

Left Blank for double sided print

Strategic Flood Risk Assessment Final Report
71-DG-053.doc Final
Note
This document has been produced by ATKINS for the Partnership for Urban South Hampshire solely for the purpose of the Strategic Flood Risk Assessment.
It may not be used by any person for any other purpose other than that specified without the express written permission of ATKINS. Any liability arising out of use by a third party of this document for purposes not wholly connected with the above shall be the responsibility of that party who shall indemnify ATKINS against all claims costs damages and losses arising out of such use.
Atkins Limited
Document History
JOB NUMBER: 5049258 DOCUMENT REF: 5049258/71/DG/053
2 Final IJ/TA KP RL RL 21/12/07
1 Draft for Client Review IJ/KP/TA TA RL RL 04/09/07
Originated Checked Reviewed Authorised Date
Revision Purpose Description

Strategic Flood Risk Assessment Final Report
71-DG-053.doc Final
Contents Section Page
Glossary of Terms i
Acknowledgements ii
Copyright Notice ii
Executive Summary iii
1 Introduction 1 1.1 Partnership for Urban South Hampshire 1 1.2 Background 1 1.3 Role and Objectives 2 1.4 Structure of the SFRA 5
2 Planning Policy and Frameworks 7 2.1 National Planning Policy 7 2.2 Regional Planning Policy 8 2.3 Other Polices and Guidance 9
3 Guiding Principles 11 3.1 Sustainable Land Use 11
4 Outputs of the SFRA 14 4.1 Introduction 14 4.2 Mapping Datasets 14 4.3 Delivery of the SFRA Output Packages 37 4.4 SFRA Deliverables 37 4.5 Website User Guide 38 4.6 Application of the Sequential Test and Exception Test 40 4.7 Appraisal of Draft South East Plan 41
5 Flood Risk Management 43 5.1 Introduction 43 5.2 Managing Risk 43
6 Conclusions and Recommendations 49 6.1 Introduction 49 6.2 Conclusions 49 6.3 Recommendations 50
7 References 53
Appendix A: Data Sources & Limitations
Appendix B: Technical Methodology

Strategic Flood Risk Assessment Final Report
71-DG-053.doc Final
Appendix C: Local Authority Guidance Notes
Appendix D: Technical Note on Future Defence Standards
Appendix E: Environment Agency Extreme Water levels
List of Tables
Table 1: Sequential Test Categories 12 Table 2: Flood Risk Vulnerability Classification (Ref 2: PPS25) 12 Table 3: The SFRA Flood Zones 17 Table 4: Definition of Undefended Flood Hazard Index as displayed on Map Set 1B (see also
Ref. 11 - Table 3.2) 18 Table 5: Summary of Mitigation Measures (Source of Text PPS25 Practice Guide) 45 Table 6: PUSH sub-region LiDAR coverage by Local Planning Authority 57 Table 7: 1 in 200 year tidal levels 59 Table 8: 1 in 1000 year tidal levels 59 Table 9: 1 in 20 year tidal levels 60 Table 10: 1 in 50 year tidal levels 60 Table 11: 1 in 100 year tidal levels 61 Table 12: Sources and quality of defence information within the PUSH region 62 Table 13: Social Flood Vulnerability Index 63 Table 14: Indicative Investment Indices based on defence height 64 Table 15: Velocity estimates based on distance from the coastline or river 68 Table 16: Undefended Flood Hazard 68 Table 17: Index for Assessing Danger to People from Defence Breaching 69 Table 18: CCO Wave Heights 1991-2002 71 Table 19: Bedrock Permeability Classification 72 Table 20: Superficial Deposits Permeability Classification 73 Table 21: Potential Sources of Overland Flow Index 74 Table 22: Combined Undefended Flood Hazard and SFVI 74 Table 23: Combined Danger to People from Breaching and SFVI 74 List of Figures Figure 1: PUSH sub-region iii Figure 2: Hierarchy of Planning and Flood Risk Assessment 2 Figure 3: The Sequential Test 11 Figure 4: Example Map Set 1A Output 17 Figure 5: Example Map Set 1B Output 19 Figure 6: Example Map Set 1C Output 21 Figure 7: Example Map Set 1D Output 23 Figure 8: Example Map Set 1E Output (2115 shown) 24 Figure 9: Example Map Set 1F-1 Output 26 Figure 10: Example Map Set 1F-2 Output 27 Figure 11: Example Map Set 1F-3 Output 28 Figure 12: Example Map Set 1F-4 Output 29
Strategic Flood Risk Assessment Final Report
71-DG-053.doc Final
Figure 13: Example Map Set 1F-4 Output 30 Figure 14: Example Map Set 2A Output 32 Figure 15: Example Map Set 2B Output 33 Figure 16: Example Map Set 3A Output 35 Figure 17: Example Map Set 3B Output 36 Figure 18: PUSH website default view 39 Figure 19: Principles of web-based mapping system 40

Left Blank for double sided print
Strategic Flood Risk Assessment Final Report
71-DG-053.doc i Final
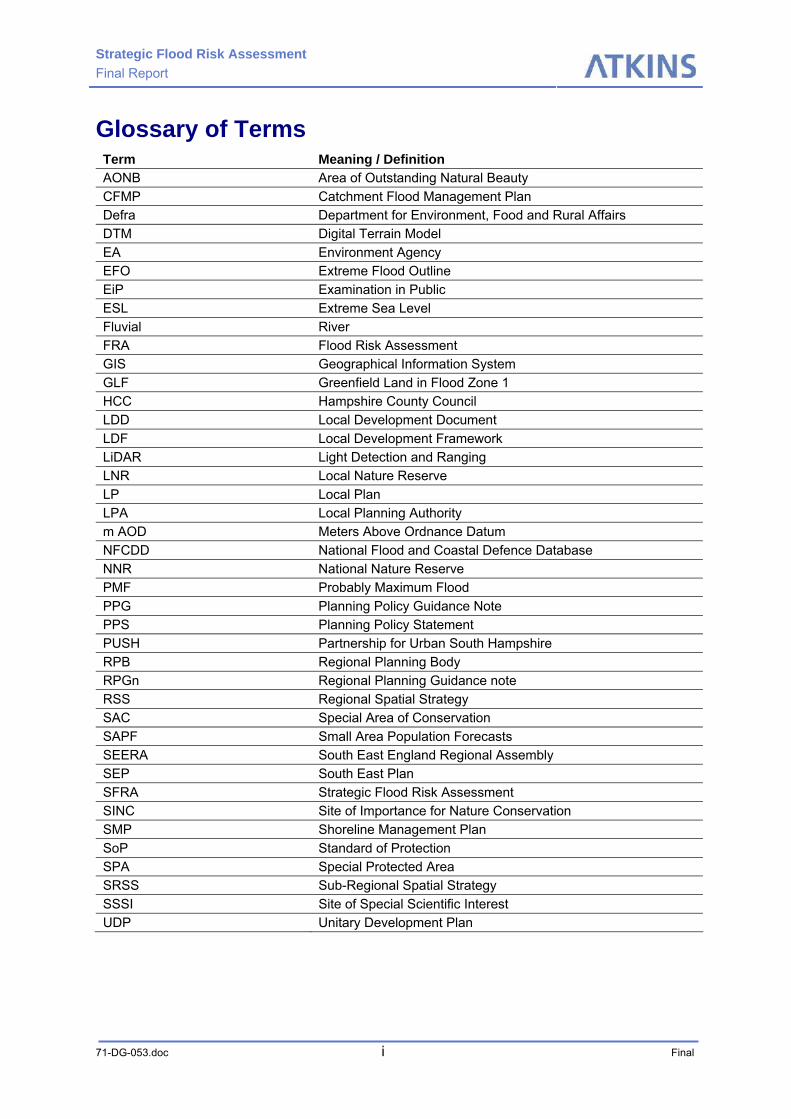
Glossary of Terms Term Meaning / Definition AONB Area of Outstanding Natural Beauty CFMP Catchment Flood Management Plan Defra Department for Environment, Food and Rural Affairs DTM Digital Terrain Model EA Environment Agency EFO Extreme Flood Outline EiP Examination in Public ESL Extreme Sea Level Fluvial River FRA Flood Risk Assessment GIS Geographical Information System GLF Greenfield Land in Flood Zone 1 HCC Hampshire County Council LDD Local Development Document LDF Local Development Framework LiDAR Light Detection and Ranging LNR Local Nature Reserve LP Local Plan LPA Local Planning Authority m AOD Meters Above Ordnance Datum NFCDD National Flood and Coastal Defence Database NNR National Nature Reserve PMF Probably Maximum Flood PPG Planning Policy Guidance Note PPS Planning Policy Statement PUSH Partnership for Urban South Hampshire RPB Regional Planning Body RPGn Regional Planning Guidance note RSS Regional Spatial Strategy SAC Special Area of Conservation SAPF Small Area Population Forecasts SEERA South East England Regional Assembly SEP South East Plan SFRA Strategic Flood Risk Assessment SINC Site of Importance for Nature Conservation SMP Shoreline Management Plan SoP Standard of Protection SPA Special Protected Area SRSS Sub-Regional Spatial Strategy SSSI Site of Special Scientific Interest UDP Unitary Development Plan
Strategic Flood Risk Assessment Final Report
71-DG-053.doc ii Final
Acknowledgements This Strategic Flood Risk Assessment has been produced for the Partnership for Urban South Hampshire. As a strategic study covering a large geographical area, the project has required significant inputs from the following organisations:
• East Hampshire District Council • Eastleigh Borough Council • Fareham Borough Council • Gosport Borough Council • Havant Borough Council • New Forest District Council • Portsmouth City Council • Southampton City Council • Test Valley Borough Council • Winchester City Council • Hampshire County Council • The Environment Agency • Department for Communities and Local Government • Southern Water • Portsmouth Water • British Geological Survey • Standing Conference on Problems Associated with the Coastline (SCOPAC) • Channel Coastal Observatory
Copyright Notice This Strategic Flood Risk Assessment has incorporated data from a variety of sources. Necessary copyright information has been shown on all deliverables including the PUSH SFRA website. Specific copyright information is repeated below for reference:
All background mapping is reproduced from Ordnance Survey material with the permission of Ordnance Survey on behalf of the Controller of Her Majesty's Stationery Office © Crown copyright. Unauthorised reproduction infringes Crown copyright and may lead to prosecution or civil proceedings. HCC 100019180 2007
Geology data is reproduced from the British Geological Survey Map data at the original scale of 1:50,000 Licence 2002/108A British Geological Survey. © NERC
Wave energy map was produced by the University of Portsmouth for SCOPAC.
Surface water flooding incidents have been provided by Southern Water for information purposes only. They represent relatively low-level flooding incidents affecting only a small number of properties at each location. It is important to note that many of the areas shown as flooded may have been subject to flood alleviation schemes depending on available funding.

Strategic Flood Risk Assessment Final Report
71-DG-053.doc iii Final
Executive Summary Introduction
Urban South Hampshire is a strategic growth area as identified in the draft South East Plan (SEP) prepared by the South East England Regional Assembly (SEERA). The draft SEP has initially allocated Urban South Hampshire with a growth target of 80,000 new homes and 59,000 new jobs by 2026.
The submission of the draft SEP in 2006 has highlighted the need for a Sub-Regional Spatial Strategy (SRSS) to support the projected growth figures. To support the SRSS and inform the Examination in Public (EiP) of the SEP, a number of sub-regional assessments were required.
In November 2006, the 10 Local Planning Authorities (LPAs) and Hampshire County Council (see Figure 1), which make up the Partnership for Urban South Hampshire (PUSH) commissioned Atkins to undertake the sub-regional Strategic Flood Risk Assessment (SFRA). The timing of the EiP in late January meant that the programme for the SFRA was divided into two stages.
Figure 1: PUSH sub-region
Stage 1 of the SFRA was comprised of a data collection and scoping stage, as well as a high-level statistical analysis of flood risk in the sub-region. The objective of the statistical analysis was to assess the feasibility of the PUSH housing allocation at both the sub-regional and LPA level, and to provide comment on the flood risk implications of the initial PUSH housing allocation for discussion at the EiP. The methodology and findings of the statistical analysis are fully documented in the separate Statistics Report (Ref. 1).
Strategic Flood Risk Assessment Final Report
71-DG-053.doc iv Final
Stage 2 of the SFRA involved the production and delivery of a full SFRA which includes key mapping outputs and guidance to assist Planners and Flood Risk Managers meet their housing and development targets set out in the draft SEP whilst avoiding flood risk and demonstrating compliance with PPS25.
This document is the final SFRA report, which summarises the background and policy for the development of SFRAs, the guiding principles for undertaking a SFRA, the outputs of the SFRA and strategic flood risk management guidance for the LPA. Appendix C to this report contains individual Guidance Documents for each of the LPA which have been developed to assist local authority planners and the Environment Agency when allocating future development sites in line with PPS25 and when specifying the requirements for and assessing the compliance of site specific FRAs. The content of the Guidance Documents for each LPA is bespoke to the types of flood risks present within each administrative boundary.
The Guidance Documents aim to promote the use of the SFRA and its deliverables by:
• Summarising the key findings of the SFRA, tailored for the specific flood risks found in each Local Planning Authority area.
• Relating planning policy (PPS25) to specific SFRA information and data. • Providing guidance on the requirements of site-specific FRAs.
SFRA Mapping Outputs
The SFRA has collated and analysed a considerable volume of flood risk information for the PUSH sub-region. The mapping outputs have been delivered in three groups, each of which are designed to be used by all or some of the key LPA and Environment Agency end users. These are designed to contain a manageable amount of information that fits together as a coherent ‘package’. They have been termed ‘Output Packages’ and are described in the table below.
In order to facilitate the dissemination of the Output Packages described above, an online web-mapping system was set up at the following web address:
http://tfmapguide.atkinsglobal.com/mapguide/PUSH_SFRA/
The website is currently security protected. Full access details have been provided to the PUSH Steering Group. At the time of writing, options for permanent hosting of the data are being assessed in consultation with the Steering Group.

Strategic Flood Risk Assessment Final Report
71-DG-053.doc v Final
No. ‘Theme’ of Package
Key Users Purpose Mapping Information
Provided
1 PPS25 Sequential Test and Relevant Supporting Information
LPA Planners
LPA/EA Flood Risk Managers
EA Development Control
Inform application of the Sequential Test and Exception Test.
Help to identify relative flood hazards / dangers to existing development.
Help guide development to areas with lowest probability of flooding and lowest flood hazard / danger.
Flood Zones
Flood Hazard/Danger
Areas Benefiting from Defences
Other forms of flooding
Impact of climate change on Flood Zones
2 Social Vulnerability of and Flood Hazard / Danger to Existing Development
LPA Planners
LPA/EA Flood Risk Managers
EA Development Control
Identify critical areas where vulnerability and hazard / danger are high.
Help inform assessments of the sustainability of existing development.
Help identify and prioritise asset management and improvements.
Social Vulnerability Maps
Maps combining Social Vulnerability and Flood Hazard / Danger
3 Appropriate Defence Standards and Levels of Investment
LPA/EA Flood Risk Managers
Help identify shortfalls in existing defences in providing appropriate standards of defence, now and in the future.
Help identify indicative levels of investment required to provide the appropriate standards, now and in the future.
Defence Standards Shortfall Maps
Investment Level Indices Maps
Impact of climate change on these maps
SFRA Output Packages
Important Note on Outputs
The report contains a detailed description of the proposed SFRA outputs and presents the methodologies used to estimate the key flooding indices that are displayed on the mapping outputs. These indices include flood hazard, flood danger, social vulnerability to flooding, and some outputs combine these indices together.
The report contains technical descriptions of the analyses required to calculate these indices. To understand what these indices represent and fully appreciate their usefulness, technical experience and understanding of flood processes is required.
It is recognised that this understanding will not be held by all users of the SFRA outputs. In order to assist readers of the document who are less familiar with the terminologies and analyses described, the following simplified definitions of the key indices are provided:
• Flood Hazard: For the purpose of the PUSH SFRA, this is defined as a numerical value that indicates whether the hazard to people during a flood event is low or high. It is a function of the speed and depth of the flood water, where speed is assumed based on the distance from the source of the flooding.
Strategic Flood Risk Assessment Final Report
71-DG-053.doc vi Final
• Flood Danger: For the purpose of the PUSH SFRA, this is defined as a numerical value that indicates whether the danger to people during a flood event is low or high. It differs from flood hazard in that it refers to the danger to people from flooding due to failure of flood defences. It is therefore a function of the depth of the flood water and the distance from the flood defence line.
• Social Vulnerability to Flooding: This index identifies the degree of vulnerability of people experiencing the flooding. It identifies elderly people, ill or infirm people, lone parents and financially deprived households as having high social vulnerability to flooding.
The purpose of mapping the indices described above is not to identify the numerical value of the indices, but to identify where the indices are highest and lowest throughout a flood risk area. The numerical values and method of calculation are not as important as the variability of the hazard/danger/vulnerability throughout the flood risk area.
Conclusions
The following key conclusions were drawn from the study:
• The PUSH sub-region is exposed to flood risk from a number of sources. Flooding from the sea, due to extreme tides, is the predominant source of flood risk to the sub-region’s most populated areas on low lying coastlines in Portsmouth, Southampton, Gosport, Havant, Fareham, Eastleigh and the New Forest. All of the PUSH LPAs contain areas at risk of flooding from rivers and watercourses, with the Rivers Test, Itchen, Hamble, Meon, Wallington, Hermitage Stream and Lavant Stream passing through existing developed areas. In addition, the coastal frontages of Portsea and Hayling Island have experienced flooding caused by wave overtopping; a number of areas in Winchester, Test Valley and East Hampshire have been affected by groundwater flooding; and flooding due to excessive overland flow has caused significant problems in East Hampshire in the past.
• The sub-region is protected from flooding from the sea by defences along the majority of its coastal frontages. The level of protection afforded by the defences along each frontage varies considerably, with areas such as Portsea Island, parts of Gosport and Southampton, and Hayling Island generally defended to a higher level than other frontages in the sub-region. There are no significant flood defences on rivers in the sub-region, although localised flood protection measures such as bank protection and maintenance of structures provide benefits in terms of flood risk in a number of locations.
• Climate change poses a significant risk to the sub-region. Predicted sea-level rise over the coming century will reduce the level of protection provided by most of the sub-region’s flood defences and result in the inundation of larger areas by extreme tidal floods. In addition, increasing severity of storm events is predicted to result in an increase in river flood flows, which will subsequently increase the risk of flooding from rivers.
• The statistical analysis undertaken during Stage 1 of the SFRA concluded that the draft SEP housing target of 80,000 new dwellings in the PUSH sub-region by 2026 is feasible, with regard to flood risk, when assessed at the sub-regional level. However, when assessed at the LPA area scale, some of the housing targets may not be feasible due to the extent of the Flood Zones 2 and 3 within some LPA areas. In particular, the administrative areas of Portsmouth, Southampton and Gosport are significantly constrained by the extent of Flood Zones 2 and 3. Consideration may need to be given to revising the distribution

Strategic Flood Risk Assessment Final Report
71-DG-053.doc vii Final
of dwellings across the LPA areas to ensure that the individual LPA housing targets are feasible in terms of flood risk constraints.
Recommendations
The following recommendations are made with respect to the use of the SFRA outputs and improving and maintaining the knowledge base:
• It is recommended that the Environment Agency and LPAs give due consideration to the implications of climate change for flood risk across the sub-region. The SFRA outputs should be used to assess the sustainability of raising existing defences to contend with rising sea levels in a number of areas, particularly where the residual risks of flooding may remain unacceptably high.
• The SFRA outputs should be used to inform a review of existing defence standards and to assist in identifying potentially higher standards that may be more appropriate in light of climate change forecasts. However, the SFRA outputs alone cannot inform such an assessment, as it should include consideration of wider social and economic factors.
• The SFRA has assessed flood risk across the sub-region at a strategic level. The outputs and findings of the SFRA are therefore sufficiently detailed to inform strategic decision making in relation to spatial planning. The outputs and findings of the SFRA should therefore not preclude the need for detailed site specific flood risk assessments to accompany planning applications for proposed developments.
• The flood hazard data produced for the SFRA have been generated using technical methods appropriate to a strategic level study. This data may be suitable for assessing flood risk at the site specific scale for sites with a low risk of flooding; however this should be agreed in consultation with the Environment Agency. The data may not be sufficiently accurate or detailed for site specific assessments in higher risk areas where techniques such as hydrodynamic modelling may be required to refine the understanding of flood risk.
• The assessment of indicative defence standards is based on a simple comparison of defence crest level against extreme sea levels. Site specific or more detailed assessments that are required to consider the function of defences should obtain and consider further data on defence type, condition, residual life and appropriate failure scenarios, in consultation with the Environment Agency.
• Where gaps in coastal defence asset information have been identified, local ground levels have been used to represent the crest level of the defence. Improvements to the defence database should be made to standardise the data entries and categories and to make the information consistent across the sub-region.
• Modelling information to define the fluvial functional floodplain (Flood Zone 3b) is currently only available for the Wallington Stream and the Tadburn Lake Stream. For the remainder of the main rivers, the SFRA has assumed that the functional floodplain is the whole of the high probability flood area (Flood Zone 3). This is a conservative approach that should be updated in the future when modelling information becomes available.
• There are no consistent estimates across the sub-region for how climate change may increase the areas at risk of fluvial flooding. The SFRA has assumed that by 2025, increases in flows in the river will mean that Flood Zone 3 will extend to cover the area defined by Flood Zone 2. Again, this is a conservative approach

Strategic Flood Risk Assessment Final Report
71-DG-053.doc viii Final
that should be updated in the future when more detailed information becomes available.
• This SFRA has provided a snapshot of flood risk issues throughout the PUSH sub-region using flood risk, climate change and flood defence asset information available in 2007. The datasets used in this assessment are likely to be updated, expanded or revised in the future. We therefore recommend that the SFRA is considered to be a live study that is reviewed and updated at appropriate intervals to account for new information, so that it can continue to provide a sound basis for future spatial planning decisions. Currently, there is no guidance on the appropriate frequency of updates to SFRAs. We would therefore recommend that updates are undertaken following significant revisions to key flood risk datasets and policy guidance or, as a minimum, every 3 to 5 years.
• The SFRA has highlighted the range and extent of information held by the LPA, the Environment Agency and the Water Companies. It recommended that a partnering approach between these Stakeholders should be adopted for the future development and improvement of flood risk and flood defence asset information. Furthermore, a partnering approach to strategic flood risk management can help to ensure that sustainable development is delivered across the sub-region.

Strategic Flood Risk Assessment Final Report
71-DG-053.doc 1 Final
1 Introduction
1.1 Partnership for Urban South Hampshire
The Partnership for Urban South Hampshire (PUSH), a voluntary working group consisting of 101 Hampshire local authorities and the County Council, was created to develop a Sub Regional Spatial Strategy (SRSS) to support the South East Plan (SEP). PUSH was formed in response to the requirement of the South East England Regional Assembly (SEERA) that all counties in South East England produce a ‘20 year plan’. PUSH aims to promote economic growth while delivering sustainable communities in the sub-region. One of the key objectives of PUSH is to bring economic growth to the sub region which will involve the delivery of 4,000 new homes a year for the next 20 years.
For future development in the sub-region to be considered sustainable, consideration of the impacts of flood risk is required. The PUSH sub-region contains perhaps some of the most vulnerable communities in England in terms of flood risk. Covering almost 600 km² in area, the south Hampshire sub-region includes 270 km of tidally-influenced coastline, along which is situated key urban areas of Southampton, Portsmouth, Gosport, Fareham and Havant. The proximity of large parts of these communities to the extensive coastline puts them at risk of flooding from the sea, with predicted sea level rise due to climate change and post-glacial rebound likely to increase these risks in future. In addition, the sub-region contains approximately 350 km of designated ‘Main River’ and associated fluvial floodplain, including the Rivers Test, Itchen, Hamble, Meon and Wallington, and extensive areas of chalk geology that are susceptible to groundwater flooding. Flood risk is, therefore, an important consideration for all parts of the sub-region.
Given the pressing need for consideration of flood risk in planning for sustainable development in the sub-region, Atkins was commissioned by PUSH to undertake a sub-regional Strategic Flood Risk Assessment (SFRA). This document forms the final report-based deliverable of the SFRA.
1.2 Background
The planning process is driven by legislation and policy at national, regional, local and site specific levels. In 2004, at a national level, the Planning and Compulsory Purchase Act came into existence and initiated major changes to the regional and local planning processes. Regional Planning Bodies (RPB) are required to replace their Regional Planning Guidance Notes (RPGn) with Regional Spatial Strategies (RSS) and Local Planning Authorities (LPA) have been tasked with replacing their Unitary Development Plans (UDPs) and Local Plans (LPs) with Local Development Frameworks (LDFs). As part of this process, at a local level, LPAs need to prepare a suite of Local Development Documents (LDDs).
SEERA considers urban south Hampshire to be a significant future growth area and as such requires planning consideration at a sub-regional level. Consequently, 10 of the LPAs which make up urban south Hampshire formed a partnership (PUSH) to
1 East Hampshire District Council, Eastleigh Borough Council, Fareham Borough Council, Gosport Borough Council, Hampshire County Council, Havant Borough Council, New Forest District Council, Portsmouth City Council, Southampton City Council, Test Valley Borough Council and Winchester City Council.

Strategic Flood Risk Assessment Final Report
71-DG-053.doc 2 Final
prepare a SRSS to support the SEP. To inform the SRSS, and in particular to assess the feasibility of the housing figures allocated to the area by the SEERA, PUSH commissioned a sub-regional assessment of flood risk in line with Planning Policy Statement 25 (PPS25, Ref 2). Figure 2 illustrates how a sub-regional SFRA fits into the planning hierarchy.
Increasing level of detail
Figure 2: Hierarchy of Planning and Flood Risk Assessment
Stage 1 of the SFRA provided a regional appraisal of flood risk across the PUSH region which was used to inform the Examination in Public (EiP) of the SEP.
Stage 2 of the SFRA provides a local authority level of assessment. The PUSH SFRA encompasses a SFRA for each of the LPAs under the banner of one study.
1.3 Role and Objectives
1.3.1 Planning Policy Objectives for SFRAs
The role of a SFRA is clearly defined in PPS25 as an assessment that is intended to inform the suite of LDDs, feed into the sustainability appraisal and inform the site allocation process in relation to flood risk. The need for LPAs to prepare SFRAs is outlined in PPS25 and the generic objectives in the policy state that a SFRA should;
• Be developed in consultation with the Environment Agency. • Provide the information needed by LPAs to apply the sequential approach to site
allocations.

Strategic Flood Risk Assessment Final Report
71-DG-053.doc 3 Final
• Refine information on the probability of flooding, taking other sources of flooding and the impacts of climate change into account.
• Determine the variations in flood risk from all sources of flooding across and from their area.
• Consider the impact of the flood risk management infrastructure on the frequency, impact, speed of onset, depth and velocity of flooding within the Flood Zones considering a range of flood risk management maintenance scenarios.
• Consider the beneficial effects of flood risk management infrastructure in generally reducing the extent and severity of flooding when compared to the Flood Zones on the Flood Map.
In addition the draft Practice Guide (Ref 3), which supports PPS25, states that a SFRA will also allow LPAs to;
• Prepare appropriate policies for the management of flood risk within the LDDs. • Inform the sustainability appraisal so that flood risk is taken account of when
considering options and in the preparation of strategic land use policies. • Identify the level of detail required for site-specific FRAs in particular locations,
and • Determine the acceptability of flood risk in relation to emergency planning
capability.
1.3.2 Aims of the Project Steering Group
A Project Steering Group has been set up to provide direction to the SFRA. In the Project Brief the Steering Group clearly identified the aims of the PUSH SFRA to be as follows:
To enable LPAs:
• To make informed decisions regarding the impact of emerging growth proposals in the South Hampshire SRSS.
• To make informed decisions on the allocation of land for development in their LDFs.
• To inform the consideration of these matters in the EiP for the SEP. • To guide the production of individual FRAs by developers as part of the
development control process.
This will be achieved by:
• Identifying the extent of all potential flood risk within the plan area both for the present day and allowing for the potential effects of climate change over the next 100 years.
• Identifying the potential impact of development, particularly the PUSH growth areas, on flood risk.
• Identifying viable mitigation measures to reduce flood risk and advise on sustainable funding of the appropriate measures, including the identification of costs and the scale of the measures required.
• Identifying the impact of increased surface water run-off on receiving watercourses.

Strategic Flood Risk Assessment Final Report
71-DG-053.doc 4 Final
• Delivering net positive benefit across the sub-region in terms of reducing flood risk.
• Widely disseminating the findings of the SFRA study to the LPA Planners and Flood Risk Managers.
The following section identifies how the aims of the Steering Group will be met by the PUSH SFRA.
1.3.3 Specific Objectives of the PUSH SFRA
The specific objectives of the PUSH SFRA have been based on the aims of the Steering Group and identified through consultation with the LPAs and a review of the flood risk information available across the whole sub-region. The following key objectives have been identified for this study:
Stage 1
• Consider the impacts of existing and future flood risk and assess the feasibility of delivering 80,000 houses across the PUSH sub-region, and the individual LPA housing allocations.
• Review all flood risk information, at the appropriate level of detail, to refine the understanding of flood risk in each LPA area, to identify appropriate outputs from the SFRA to meet the aims of the Steering Group and to develop the methodologies required to deliver these outputs.
Stage 2 • Present existing flood risk information to assist LPAs in applying the Sequential
Test for the PUSH housing allocations and other types of future development. • Generate additional flood risk information to improve the understanding of
climate change impacts on flood risk within the PUSH sub-region. • Generate additional flood risk information to assist the LPAs in applying the
Exception Test within Flood Zones 2 & 3, which will enable them to identify the variation in flood hazard within the zones.
• Collate, interpret and present available information relating to other forms of flooding within the PUSH sub-region to inform the spatial planning process.
• Deliver a dataset which can inform an assessment of the sustainability of existing communities that are at risk of flooding by:
− Generating additional information to assist the LPAs in identifying the flooding hazard and the social vulnerability of existing development in Flood Zone 3.
− Collating, interpreting and presenting available information relating to existing flood defences, in order to indicate at a high level the current shortfalls in the level of protection provided by flood defences and identify indicative levels of investment required to protect areas against the extreme flood events that define the Flood Zones.
• Produce guidance notes to assist the LPAs and the Environment Agency identify the requirements and check the compliance of FRAs submitted in support of planning applications for individual development sites.
• To provide a comprehensive dataset for flood risk that is easily accessible to those with an interest in flood risk within the PUSH sub-region.

Strategic Flood Risk Assessment Final Report
71-DG-053.doc 5 Final
1.4 Structure of the SFRA
Stage 2 of the SFRA is made up of three key deliverables: The Final Report, SFRA Output Packages and Guidance Notes for each LPA.
1.4.1 Final SFRA Report
This document comprises the final SFRA report and includes the following:
• Interpretative summary of the Stage 2 outputs and main findings of the technical analyses.
• Instructions on how to use and interpret the outputs. • A review of the quality of the data used in the analyses. • A review of the limitations and appropriate use of the outputs. • Documentation of any refinements and amendments to the technical methods
presented in the Stage 1 Report and documentation of additional methods developed during Stage 2.
• High level conclusions of the analyses relevant to: • Feasibility of the SEP housing allocations. • Levels of investment required to maintain and/or provide defences that
protect against the extreme flood events that define the Flood Zones, taking account of climate change impacts.
• Sustainability of existing development.
1.4.2 SFRA Output
In order to focus the outputs on the key objectives of the SFRA, the mapping output from Stage 2 has been provided in three packages, each of which may be useful to all or some of the key LPA and Environment Agency end users and which contain a manageable amount of information that fits together as a coherent ‘package’. These ‘Output Packages’ are described further in Chapter 4.
The outputs from the SFRA will primarily be used by the following LPA and Environment Agency staff:
• LPA Planners in allocating sites for new development and assessing strategies for redevelopment of brownfield sites in the flood zones to manage and/or reduce flood risk.
• Environment Agency Development Control Officers in assessing FRAs for new development sites and assessing the risk to existing development in the flood zones.
• LPA and Environment Agency Flood Risk Managers in identifying key areas at risk to prioritise monitoring/maintenance/mitigation programmes, identify investment needs and assess sustainability of existing mitigation measures.
The outputs should also be useful to:
• Emergency planners in identifying areas of high flood hazard and vulnerability, which can inform the development of emergency response and evacuation plans.

Strategic Flood Risk Assessment Final Report
71-DG-053.doc 6 Final
• Water companies in identifying constraints on and impacts of drainage infrastructure for new development.
• Utility companies in identifying suitable locations for new infrastructure and assessing the vulnerability of existing infrastructure located in the Flood Zones.
1.4.3 Guidance Documents
Guidance documents are provided in Appendix C to assist the LPAs and the Environment Agency allocating development in line with PPS25 and in specifying the requirements for and assessing the compliance of site specific FRAs. The content of the guidance documents for each LPA is defined by the nature and characteristics of flood risk present within each administrative boundary.
The guidance documents aim to promote the use of the SFRA and its deliverables by:
• Summarising the key findings of the SFRA, tailored for the specific flood risks found in each Local Planning Authority area.
• Relating planning policy (PPS25) to specific SFRA information and data. • Providing guidance on the requirements of site-specific FRAs.

Strategic Flood Risk Assessment Final Report
71-DG-053.doc 7 Final
2 Planning Policy and Frameworks
2.1 National Planning Policy
National Planning Policy plays a key role in shaping the direction in which RPBs and LPAs prepare their RSSs and LDFs. The key Planning Policy Statement (PPS) which has been instrumental in bringing forward SFRAs is Planning Policy Statement 25: Development and Flood Risk (PPS25). Other key PPS which have influenced the scope of this SFRA include PPS1 (Ref. 4, Delivering Sustainable Development) and PPS3 (Ref. 5, Housing). The key principles promoted by these PPS are described in the following sections.
2.1.1 PPS1 Delivering Sustainable Development
PPS1 sets out the Government’s aims and objectives for delivering sustainable development, for current and future generations. One of the key principles set out in PPS1 is to ensure that sustainability is considered for the lifetime of new development by taking due account of the physical environment and the impacts of climate change.
The key to delivering sustainable development is centred around planning and design. PPS1 encourages LPAs to consider all aspects of the physical environment when identifying land for development. In particular, when preparing development plans, LPAs should identify the potential impacts that natural hazards may pose to new development and as far as possible, avoid development in areas at risk of flooding and sea level rise. Should development in areas of flood risk be required to meet the wider objectives of sustainable development, PPS1 supports the design of new development which accommodates natural hazards and the impacts of climate change to ensure the develop is safe, sustainable, durable and adaptable.
2.1.2 PPS3 Housing
PPS3 sets out the national planning policy framework for delivering the Government’s housing objectives. The policies set out in PPS3 should be taken into account by LPAs and RPBs in the preparation of the LDDs and RSSs. PPS3 encourages LPAs to take account of the constraints of the physical environment and natural hazards, such as flooding, when identifying broad locations for housing development.
PPS3 also states that a key objective of LPA should be to continue to make effective use of land by re-using sites that have been previously developed. In addition the policy states that the national annual target is that at least 60% of new housing is provided on previously developed land. However, the policy also recognises that LPAs and RPBs will need to consider sustainability issues for some sites as they may not be suitable for housing. A key example of where sustainability of previously developed land may need further consideration is where land is vulnerable to flood risk.

Strategic Flood Risk Assessment Final Report
71-DG-053.doc 8 Final
2.1.3 PPS25 Development and Flood Risk
PPS25 sets out the Government’s polices for development and flood risk. The statement was released in December 2006 and replaces the former Planning Policy Guidance Note 25 (PPG25, Ref. 6).
The aims of PPS25 are to ensure that flood risk is taken into account at all stages in the planning process to avoid inappropriate development in areas at risk of flooding, and to direct development away from areas at highest risk. Where new development is, exceptionally, necessary in such areas, policy aims to make it safe without increasing flood risk elsewhere and where possible, reducing flood risk overall.
PPS25 includes the same guiding principles in PPG25, however, notably it introduces:
• A more strategic planning approach to managing flood risk. • Stronger guidance on Flood Risk Assessments, at all stages of the planning
hierarchy. • A clarified Sequential Test. • A new Exception Test, to account for instances where large developed areas
have extensive areas within Flood Zones 2 and 3 and where a blanket ban on development would cause extensive social and economic blight.
• Clearer guidance on how to assess the impacts of climate change.
In February 2007, the Department for Communities and Local Government published a ‘Living Draft’ of a Practice Guide Companion to PPS25 (Ref. 3) which provides advice on the practical implementation of the policies described in PPS25, in a manner which is suitable for those who play a general role in the planning process.
This SFRA has been informed at all stages by the policies described in PPS25 and the guidance offered in the Practice Guide Companion. When using the SFRA, it is important that users are aware of the definition of the term ‘flood risk’. Flood risk is the product of flood probability and flood consequence. In this study, the probability of flooding is assumed based on the Flood Zones provided by the Environment Agency Flood Map and as detailed in PPS25. In general, the deliverables of the SFRA provide further information on the consequences of flooding, thereby increasing the quality of information on actual flood risk.
2.2 Regional Planning Policy
2.2.1 Draft South East Plan
The draft South East Plan (SEP) (Ref. 7) was submitted to Government by the South East of England Regional Assembly (SEERA) in March 2006. The SEP provides a framework for the sustainable development of the South East to 2026 and outlines responses to the key challenges that face the region in terms of economy, housing transport and the environment.
Policy NRM3 of the draft South East Plan states that the sequential approach to development in flood risk areas, as set out in PPS25 will be followed and that inappropriate development should not be allocated or permitted in the following areas unless there is over-riding need and absence of suitable alternatives.
Strategic Flood Risk Assessment Final Report
71-DG-053.doc 9 Final
o Zones 2 and 3 of the floodplain
o Areas with a history of groundwater flooding, or
o In areas where development would increase flood risk elsewhere.
The SEP defines sub-regions for economic growth, one of which is the South Hampshire (PUSH) sub-region. As part of the SEP, it is proposed that 80,000 new dwellings be provided in the PUSH sub-region by 2026.
The draft SEP went through a process of Examination in Public during November 2006 – March 2007. The findings of the examination have recently been published and the revised plan is due to be released in early 2008.
2.2.2 Sub-Regional Spatial Strategy
A key objective of PUSH is to prepare a Sub-Regional Spatial Strategy (SRSS) to set out how the local authorities, which make up PUSH, can deliver the economic growth and development targets set out in the draft SEP. The website set up by PUSH states that;
“the strategy will consider cross-boundary issues and will focus on the economy and economic growth in the region, as well as housing, transport and the environment.”
The SFRA will feed into the SRSS by providing information from which to test the feasibility of the economic growth, housing and development targets as part of the environment and sustainability assessment.
2.3 Other Polices and Guidance
2.3.1 Making Space for Water
The Government’s Making Space for Water (Ref. 8) strategy sets out Government policy with regard to planning for flood and coastal erosion risk management in England. Recognising that there are large overlaps between the various responsible bodies in each facet of flood risk management, the strategy sets out the requirements for a holistic approach to the planning and management of flood risks. A key aim is to give the Environment Agency a greater overall strategic role in flood risk management. Land use planning is an important component of the strategy, with the avoidance of future risks often having the potential to remove the need for costly protection measures. SFRAs fulfil a key role within the Government’s strategy, by informing the allocation of future development such that flood risk is at best avoided but at least mitigated early on in the planning process. The PUSH SFRA has been carried out under the continued guidance of local Environment Agency Development Control and Flood Risk specialists, ensuring that the Environment Agency were able to carry out their high level role in line with Making Space for Water.
2.3.2 Water Framework Directive
The Water Framework Directive (Ref. 9) is a European Union Directive which sets out a framework for improving the quality of all water bodies by fostering an integrated approach to water management. Its transposition to UK law requires the preparation of River Basin Management Plans to take into account all aspects of

Strategic Flood Risk Assessment Final Report
71-DG-053.doc 10 Final
water management including flood risk. Strategic planning to avoid flood risk should go hand in hand with planning to accommodate water management. Flood risk alleviation measures such as Sustainable Drainage Systems (SUDS) offer the chance to improve the quality of surface water returned to rivers and it is envisaged that avoidance of flood risk areas when allocating new development will reduce the impact of new development on those sensitive areas located close to water bodies. The PUSH SFRA provides outputs that can facilitate assessments of the impact of new development on the surface water runoff regime and identification of appropriate measures to manage these impacts.

Strategic Flood Risk Assessment Final Report
71-DG-053.doc 11 Final
3 Guiding Principles This chapter sets out the key principles that influence the consideration of flood risk in the planning process. These principles have been used to identify the scope of the PUSH SFRA and how it will help to inform planning decisions in the allocation of land for development and managing flood risk in the sub-region.
3.1 Sustainable Land Use
PPS3 promotes the sustainable use of land and states that the key objective for LPAs should be to continue to make effective use of land by re-using land that has been previously developed. The document sets out the national annual target that at least 60% of new housing should be provided on previously developed land.
This is a key guiding principle in the spatial planning process and should be applied in conjunction with the aims of PPS1 and PPS25, which require LPAs to deliver sustainable development that avoids flood risk, to avoid inappropriate development in areas at risk and to direct development away from areas at highest risk.
The nature of the PUSH sub-region is such that LPAs may need to consider additional development and regeneration in existing urban centres that may be partially within or near to flood risk areas. The SFRA outputs should therefore assist the LPAs with meeting the objectives of PPS1, PPS3 and PPS25.
3.1.1 Risk-Based Approach and the Sequential Test
PPS25 provides a Sequential Test to enable LPAs to apply a risk-based approach to site allocations within their authority boundary. The Sequential Test can be described as a linear decision process for identifying the probability of flooding for a given site, ignoring the presence of defences. The test classifies sites into one of four flood risk zones based on the annual probability of flooding as illustrated in Figure 3.
Flood Zone 1 Low Probability
Flood Zone 2 Medium Probability
Flood Zone 3 High Probability
Flood Zone 3a High Probability
Flood Zone 3b Functional Floodplain
Figure 3: The Sequential Test
The details relating to the categories defined in the above chart are provided in Table 1.

Strategic Flood Risk Assessment Final Report
71-DG-053.doc 12 Final
Flood Zone Annual probability of flooding Flood Zone 1: Low Probability
< 1 in 1,000 (<0.1%).
Flood Zone 2: Medium Probability
Between 1 in 1,000 (0.1%) and 1 in 100 (1%) for river flooding, 1 in 200 (0.5%) for flooding from the sea.
Flood Zone 3a: High Probability
> 1 in 100 (>1%) for river flooding and > 1 in 200 (>0.5%) for flooding from the sea.
Flood Zone 3b: Functional Floodplain
Land that: • would flood with an annual probability of 1 in 20 (5 per cent) or greater in any year, or at another probability to be agreed between the LPA and the Environment Agency (Environment Agency), or • is designed to flood in an extreme (0.1 per cent) flood, or at another probability to be agreed between the LPA and the EA.
Table 1: Sequential Test Categories
The Sequential Test gives preference to locating new developments, wherever possible in Flood Zone 1. By applying the Sequential Test, LPAs should demonstrate that there are no reasonably available sites within Flood Zone 1 before considering site allocations within Flood Zones 2 and 3. When applying the Sequential Test, the flood vulnerability of the proposed development should also be taken into account during the decision process. PPS25 provides guidance on assessing the vulnerability of land uses in relation to flood risk and classifies new developments into one of five categories:
• Essential Infrastructure • Water Compatible • Less Vulnerable • More Vulnerable • Highly Vulnerable
Examples of land uses classified under each of the above categories are defined in PPS25. The suitability of each land use category within each of the Flood Zones identified is detailed in Table 2.
Essential Infrastructure
Water Compatible
Highly Vulnerable
More Vulnerable
Less Vulnerable
Zone 1
Zone 2 Exception Test required
Zone 3a Exception Test required Exception Test
required
Zone 3b Exception Test required
Table 2: Flood Risk Vulnerability Classification (Ref 2: PPS25)2
Key: Development is appropriate, subject to demonstrating the Sequential Test Development should not be permitted.
2 This table does not show: the application of the Sequential Test which guides development to FZ1 first, then FZ2, and then FZ3; FRA requirements; or the policy aims for each Flood Zone.

Strategic Flood Risk Assessment Final Report
71-DG-053.doc 13 Final
The outputs from the PUSH SFRA should therefore:
• Assist the LPAs in applying the Sequential Test as part of the spatial planning process; and
• Assist the LPAs and Environment Agency in assessing whether individual sites satisfy the Sequential Test at the site allocation level.
3.1.2 The Exception Test
PPS25 recognises that in some instances, allocations within Flood Zones 2 and 3 are necessary, to fulfil wider sustainability objectives or to avoid economic or social blight of an urban area. In such instances, a site may qualify for development if the criteria of the ‘Exception Test’ can be fulfilled.
There are three elements to the Exception Test, all of which must be fulfilled:
a) It must be demonstrated that the development provides wider sustainability benefits to the community that outweigh flood risk, informed by a SFRA where one has been prepared. If the DPD has reached the ‘submission’ stage – see Figure 4 of PPS12: Local Development Frameworks – the benefits of the development should contribute to the Core Strategy’s Sustainability Appraisal;
b) The development should be on developable previously-developed land or, if it is not on previously developed land, that there are no reasonable alternative sites on developable previously-developed land; and
c) A FRA must demonstrate that the development will be safe, without increasing flood risk elsewhere, and, where possible, will reduce flood risk overall.
The key element of the Exception Test which relates to the assessment of flood risk is c) ‘demonstration that the development will be safe’. To determine if a development is safe it is necessary to understand the nature of the flood risk and the likely flooding hazard.
The outputs from the PUSH SFRA should therefore:
• Assist the LPAs in applying the Exception Test as part of the spatial planning process;
• Assist the LPAs and Environment Agency in advising developers on how to apply the Exception Test for an individual development site; and
• Assist the LPAs and Environment Agency in assessing whether the Exception Test has been applied appropriately in FRAs for individual development sites.

Strategic Flood Risk Assessment Final Report
71-DG-053.doc 14 Final
4 Outputs of the SFRA
4.1 Introduction
The SFRA has been conducted in a staged approach as described in Section 1.3.3.
Stage 1 formed an inception phase for the main study, reviewed all available data, identified appropriate outputs and set out the technical methodologies to deliver these outputs. This work was documented in the Stage 1 Report (Ref. 10). Stage 1 also incorporated a high level statistical analysis of flood risk, including an assessment of the SEP housing allocation to the PUSH sub-region of 80,000 new dwellings by 2026. The methodologies and findings of the statistical analysis are reported in a separate stand alone document (Ref 1), and the findings are summarised in Section 4.7 at the end of this chapter.
Stage 2, the main phase of the SFRA, included production of the SFRA mapping datasets which form the main deliverable for the study and will be used by LPAs and the Environment Agency in informing the planning process. These datasets are described in the following section. Stage 2 also included development of Guidance Documents for each LPA area to provide an overview of the flood risk issues in each area, to assist in the use and interpretation of the mapping datasets and to provide guidance on the production of site specific FRAs in each area. These Guidance Documents are provided in Appendix C and described briefly in Section 4.5. A further output of Stage 2 was the production of a technical note on standards of protection. This technical note is provided in Appendix D and its findings are discussed in Chapter 6.
4.2 Mapping Datasets
The SFRA has collated and analysed a considerable volume of flood risk information for the PUSH sub-region. The mapping deliverables have been delivered in three groups, each of which are designed to be used by all or some of the key LPA and Environment Agency end users. These are designed to contain a manageable amount of information that fits together as a coherent ‘package’. They have been termed ‘Output Packages’ and are described below.
• Output Package 1: PPS25 Sequential test and Relevant Supporting information • Output Package 2: Social Vulnerability of and Flood Hazard/Danger to Existing
Development • Output Package 3: Defences Levels and Associated Investment Indices
The outputs from the SFRA will primarily be used by the following LPA and Environment Agency staff:
• LPA Planners in allocating sites for new development and assessing strategies for redevelopment of brownfield sites in the Flood Zones to manage and/or reduce flood risk.
• Environment Agency Development Control Officers in assessing FRAs for new development sites and assessing the risk to existing development in the Flood Zones.

Strategic Flood Risk Assessment Final Report
71-DG-053.doc 15 Final
• LPA and Environment Agency Flood Risk Managers in identifying key areas at risk to prioritise monitoring/maintenance/mitigation programmes, identify investment needs and assess sustainability of existing mitigation measures.
The following sections describe the function of each output package and provide guidance on how to interpret the information. In order to keep the SFRA document as user-friendly as possible for users without a technical background in flood risk management, descriptions of the technical methodologies used to derive each Map Set in the Output Packages have been omitted here, but are provided in Appendix B.
4.2.1 Output Package 1
Output Package 1 is intended to assist in the application of the Sequential test, by providing information to guide decisions on location of future development in relation to areas of flood risk and, more specifically, the Flood Zones. The key applications of Output Package 1 are:
• For all users involved in the spatial allocation of new development, i.e. LPA Planners, LPA/Environment Agency Flood Risk Managers and Environment Agency Development Control Officers.
• Provides information to assist LPA Planners and Environment Agency Development Control in assessing or preparing specifications for site specific FRAs.
• Provides information to assist LPA Planners and Environment Agency Development Control in checking compliance of site specific FRAs with PPS25.
• Provides information to assist LPA Planners in allocating land for future development, in accordance with the PPS25 Sequential Test.
• If there is development pressure in Flood Zones 2 & 3, can assist in applying the Exception Test within this zone: • Provides information to help identify areas of lowest and highest flood
hazard/danger. • Can help guide development to areas with lowest probability of flooding and
lowest flood hazard/danger, or, if no other option is available, to areas of medium to high probability and low hazard/danger.
4.2.1.1 Map Set 1A – Flood Zones
The Flood Zones represent the most important dataset in applying the policies described in PPS25, as they define which areas fall within each category in terms of the probability of flooding. For the SFRA, the Flood Zones have been provided by the Environment Agency. The Environment Agency publishes updated Flood Zones regularly on its ‘Flood Map’, which is available online. The latest version of the Environment Agency ‘Flood Map’ was used to provide the spatial extent of Flood Zones 1, 2 and 3 specified in PPS25.
The Environment Agency also holds information which differentiates Flood Zone 3 into those areas where flooding occurs due to fluvial (river) processes, tidal process or both, where specific modelling is available to inform such a categorisation. The Environment Agency has provided all of the information to define the Flood Zones for the purpose of the SFRA and the study has maintained the Environment Agency’s distinction between sources of flooding that define the Flood Zones.
Strategic Flood Risk Assessment Final Report
71-DG-053.doc 16 Final
Further data is also available for the fluvial Flood Zone 3, which identifies those areas that have a higher probability of flooding (i.e. those sites that would flood with an annual probability of 1 in 20 (5%) or greater in any year) and where water has to be stored in times of flooding. This zone is referred to as the Functional Floodplain and is labelled as Flood Zone 3b.
The following points are important to note in relation to the Flood Zones presented in Map Set 1A:
• For this SFRA, the Environment Agency has provided data, where available, to inform the designation of fluvial Flood Zone 3b, defined in PPS25 as ‘the functional floodplain’. This represents the area of fluvial Flood Zone 3 that is at highest probability of flooding and is therefore a key area that should be avoided when considering the location of new development. This breakdown of Flood Zone 3 is a relatively new definition in Planning Policy and the Environment Agency is currently undertaking a programme of work to define fluvial Flood Zone 3b across the PUSH sub-region. The Environment Agency has provided information on the fluvial Flood Zone 3b where available, and accompanying guidance on the assumptions to be adopted in the absence of this information. This study has adopted the assumption recommended by the Environment Agency that ‘all areas within fluvial Flood Zone 3 should be considered as Zone 3b (Functional Floodplain) unless or until appropriate data is available to demonstrate that it can be considered as falling within Zone 3a (high probability)’. This assumption is also supported by the draft Practice Guide that accompanies PPS25. Where Flood Zone 3 is referred to later in this document without the suffix ‘a’ or ‘b’, it should be taken to mean the entirety of Flood Zone 3 as defined in the Flood Map, including all areas at risk of flooding with a probability of 1% (1 in 100 years) or greater.
• Due to the strategic nature of the study and the relatively large scale of the study area in which there are diverse sources of flood risk to consider, no hydrological or hydrodynamic modelling has been undertaken to attempt to improve, refine or update the existing Flood Zones held by the Environment Agency.
Map Set 1A will be useful to planners and developers to ensure proposed developments are located appropriately within the Flood Zones. The map set will be used by the Environment Agency to confirm that the Sequential Test has been satisfied. Table 3 shows the colours used to represent each of the Flood Zones in Map Set 1A and Figure 4 shows an example view of the map set.

Strategic Flood Risk Assessment Final Report
71-DG-053.doc 17 Final
Flood Zone Description (annual probability of flooding) Key
Flood Zone 1 Low probability of flooding (< 0.1% or 1 in 1000) N/A
Flood Zone 2
Medium probability of flooding - tidal (0.5% or 1 in 200 - 0.1% or 1 in 1000)
Medium probability of flooding - fluvial (1% or 1 in 100 - 0.1% or 1 in 1000)
High probability of flooding - tidal (> 0.5% or 1 in 200)
High probability of flooding - fluvial (> 1% or 1 in 100) Flood Zone 3a
High probability of flooding – fluvial and tidal combined where available (> 0.5% or 1 in 200)
Flood Zone 3b The functional floodplain (> 5% or 1 in 20 where applicable see Appendix B)
(Fluvial Flooding only)
Table 3: The SFRA Flood Zones
Figure 4: Example Map Set 1A Output

Strategic Flood Risk Assessment Final Report
71-DG-053.doc 18 Final
4.2.1.2 Map Set 1B – Undefended Flood Hazard
Application of the ‘Sequential Approach’ should not stop once development has been assigned to one of the Flood Zones. Development should also be sequentially allocated within each Flood Zone to steer new development to areas with the lowest probability and/or hazard. The Flood Zones (Map Set 1A) show the areas at risk for a flood of a given probability without the presence of defences. In order to allow development to be sequentially allocated within each flood zone, a measure of the variable flood hazard within the zone is required.
Map Set 1B provides a breakdown of Flood Zones 2 and 3 in terms of the hazard posed by flooding within the zones, without consideration of the mitigating effect of existing flood defences. The hazard index provided in this map set is a function of the velocity and depth of flood water, and has been estimated using appropriate assumptions and methods identified in best practice guidance, in particular the Defra/Environment Agency Flood and Coastal Defence R&D Document: Flood Risk to People (FD2321, Ref. 11).
The index within each Flood Zone is estimated based on the flood conditions that define that Flood Zone, i.e.
• Within Flood Zone 3 the index is based on the potential flood depths that could occur during a 1 in 100/200 year event.
• Within Flood Zone 2 the index is based on the potential flood depths that could occur during a 1 in 1,000 year event.
For both Flood Zones 2 and 3 the index has been estimated using appropriate assumptions about potential flood velocity based on the distance from the source of the flooding, i.e. the river bank or coastline.
The Undefended Flood Hazard index as displayed on Map Set 1B is defined in Table 4.
Classification Description
Low Caution “Flood zone with shallow flowing water or deep standing water”
Moderate Dangerous for some (i.e. children) “Danger: Flood Zone with deep or fast flowing water”
High Dangerous for most people “Danger: Flood zone with deep fast flowing water”
Very High Dangerous for all “Extreme danger: Flood zone with deep fast flowing water”
Table 4: Definition of Undefended Flood Hazard Index as displayed on Map Set 1B (see also Ref. 11 - Table 3.2)
As a planning tool, Map Set 1B can be used to facilitate the sequential approach within Flood Zones 2 and 3 (where it has been proven necessary by application of the Sequential and Exception Tests). It provides an extra level of detail in addition to the Flood Zones themselves, quickly allowing identification of those areas where a flood of equal probability may have vastly different consequences for those affected depending on their location. It is a relative index and allows a high-level assessment of the flood risk to sites within the same Flood Zone relative to one another.

Strategic Flood Risk Assessment Final Report
71-DG-053.doc 19 Final
The undefended flood hazard information has been derived at an appropriate level of detail to allow LPAs to allocate sites for development. The hazard data has not, however, been calculated using modelling or other detailed numerical methods and is therefore not appropriate for identifying design parameters as part of site specific FRAs. It is recommended that FRAs for sites located within the flood hazard zones should still undertake a quantitative assessment of flood hazard based on more detailed assessments of defence standards, defence failure scenarios and overland conveyance of flood flows.
Since, Map Set 1B is an ‘undefended’ index, is provided for both Fluvial and Tidal flooding. Full details of the technical method used to develop Map Set 1B are provided in Appendix B and an example view of the Map Set is provided in Figure 5.
Figure 5: Example Map Set 1B Output
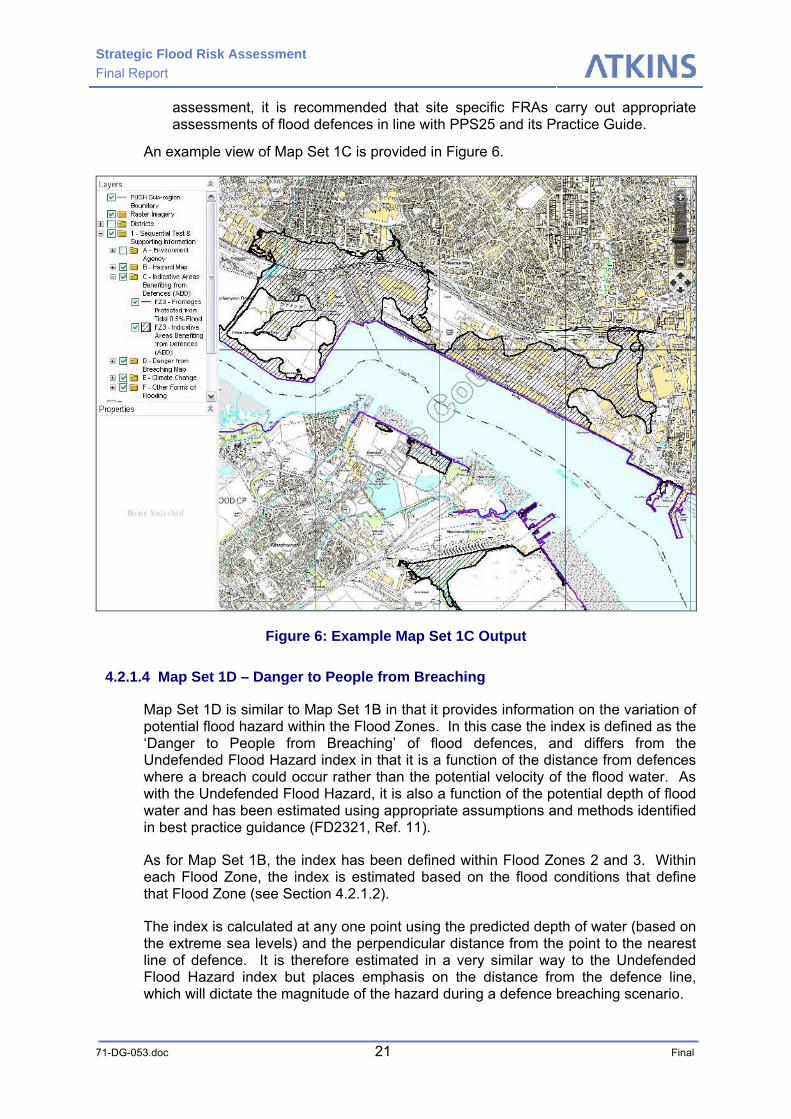
4.2.1.3 Map Set 1C – Indicative Areas Benefiting from Defences
Areas Benefiting from Defences (ABDs) are an important concept in flood risk management. They are formally defined by the Environment Agency and are an important component of the national Flood Map. When relating to PPS25 and the Flood Map, ABDs relate directly to only one of the Flood Zones, Flood Zone 3. An area is defined as an ABD if the defences in place provide protection from the flood event that defines Flood Zone 3. In reality, many defences offer some degree of protection but are unlikely to prevent all flooding shown in Flood Zone 3. As such, Environment Agency guidelines (Ref. 12) state that ABDs must be created using hydraulic models of river and coastal systems and be generated using the flood outlines from defended and undefended versions of the same model.

Strategic Flood Risk Assessment Final Report
71-DG-053.doc 20 Final
ABDs are a relatively new output from Flood Mapping Studies and are being delivered in Hampshire by the Environment Agency’s ongoing Strategic Flood Risk Mapping programme. Currently, as in many other regions of the UK, there are no finalised ABDs available to feed into the PUSH SFRA. The delivery of ABDs is an ongoing process for the Environment Agency and data for the PUSH region may become available in the future. Such data could then be incorporated into the PUSH SFRA during future updates.
In the absence of this data, however, the PUSH SFRA has attempted to define what are termed ‘Indicative Areas Benefiting from Defences’ along coastal frontages by comparing the 1 in 200 year extreme sea level with defence level data to identify areas that may be defended against this event. This is a high level assessment which is not completed in the same manner as the ABDs delivered by the Environment Agency. Therefore, in Map Set 1C the Indicative ABDs represent areas that are currently shown to be within Flood Zone 3 but which are protected by defences that may prevent flooding of the areas during a 1 in 200 year surge tide.
Only those areas where defences are consistently higher than the present-day 1 in 200 year extreme sea level across an entire flooded frontage are considered as Indicative ABDs. Coastal defences which have crest levels equal to or higher than the 1 in 200 year extreme sea level are indicated in Map Set 1C as purple lines. It should be noted that other areas may potentially be classified as ABDs if more detailed assessments of the defences, which is beyond the scope of this SFRA, are carried out. It is accepted that this high-level method does not take into account the benefit provided by all defences in the PUSH sub-region.
The following points are also important to note when reviewing Map Set 1C:
• There are no large scale flood defences on rivers that protect against the magnitude of event that defines fluvial Flood Zone 3, hence Map Set 1C is only provided for tidal areas.
• The method for identifying Indicative ABDs is based solely on the crest level of the defences, generally obtained from survey data and therefore assumed to represent the as constructed top level of the defence structure. The assessment does not take into account defence type and any freeboard allowance that has been made in the design of the defences, as this data was not available consistently across the sub-region.
• An area can only be classed as an ‘Indicative ABD’ if the whole length of the defence frontage that surrounds an area of the flood zone is equal to or above the 1 in 200 year (0.5%) extreme sea level. Due to the strategic nature of this assessment, if small lengths of defences fall below that level, the area behind the defence cannot be classed as an ‘Indicative ABD’, even if in reality it is likely that the defences provide some degree of protection. A key example of this is along the Southsea frontage of Portsmouth, where small lengths of the defences which are below a 1 in 200 year level, prevent the area behind the defences being classified as an ‘Indicative ABD’.
• The assessment does not take into account the wave overtopping risk, where the defence crest level may be higher than the predicted extreme sea level but a risk of wave overtopping of the defences remains during a storm surge. This type of flooding is considered separately in Section 4.2.1.6.
• This Map Set indicates areas where existing defences may provide a level of protection such that the actual probability of flooding is lower than that suggested by the Flood Zones. However, given the limitations of this strategic level
Strategic Flood Risk Assessment Final Report
71-DG-053.doc 21 Final
assessment, it is recommended that site specific FRAs carry out appropriate assessments of flood defences in line with PPS25 and its Practice Guide.
An example view of Map Set 1C is provided in Figure 6.
Figure 6: Example Map Set 1C Output
4.2.1.4 Map Set 1D – Danger to People from Breaching
Map Set 1D is similar to Map Set 1B in that it provides information on the variation of potential flood hazard within the Flood Zones. In this case the index is defined as the ‘Danger to People from Breaching’ of flood defences, and differs from the Undefended Flood Hazard index in that it is a function of the distance from defences where a breach could occur rather than the potential velocity of the flood water. As with the Undefended Flood Hazard, it is also a function of the potential depth of flood water and has been estimated using appropriate assumptions and methods identified in best practice guidance (FD2321, Ref. 11).
As for Map Set 1B, the index has been defined within Flood Zones 2 and 3. Within each Flood Zone, the index is estimated based on the flood conditions that define that Flood Zone (see Section 4.2.1.2).
The index is calculated at any one point using the predicted depth of water (based on the extreme sea levels) and the perpendicular distance from the point to the nearest line of defence. It is therefore estimated in a very similar way to the Undefended Flood Hazard index but places emphasis on the distance from the defence line, which will dictate the magnitude of the hazard during a defence breaching scenario.
Strategic Flood Risk Assessment Final Report
71-DG-053.doc 22 Final
The following points are important to note when reviewing Map Set 1D:
• This index was not calculated for river flooding, as there are no existing river defences that provide a level of protection against events of comparable magnitude to those that define the Flood Zones. The index is therefore irrelevant in river floodplains within the sub-region as the defences in these locations would either be bypassed or overtopped by a considerable margin during an extreme flood, and any localised effects of a defence breach during the event would be insignificant when compared with the larger scale flooding processes behind the bypassed defences.
• Only the potential hazard due to breaching is estimated and the assessment does not consider the probability of occurrence, nor does it identify the most likely locations for a breach. The findings of this assessment should be used as an initial guide and useful information to identify where more detailed breach assessments may be required.
• For those areas that are currently protected by flood defences against the extreme sea levels which define Flood Zones 2 and 3, as shown in Map Set 1C (Indicative ABDs), this Map Set provides a more relevant representation of the flood hazard than Map Set 1B (Undefended Flood Hazard). For the majority of areas, however, where defences would already be overwhelmed by an extreme flood, the undefended flood hazard (Map 1B) is the more relevant indicator.
• For completeness, the Danger to People from Breaching index has been estimated for all coastal areas within Flood Zones 2 and 3, regardless of the standard of protection afforded by the defences/natural ground. Where the standard of protection is lower than that required to defend against the extreme floods that define the Flood Zones, Map Set 1D shows the index with hatching. This identifies where the index is not appropriate as the defences would be overtopped before the peak of the surge tide is reached, however the information is considered useful to planners and developers in understanding the likely residual risks that may remain if they were to invest in defending an area to a 1 in 200 year (Flood Zone 3) or 1 in 1000 year (Flood Zone 2) standard.
An example view of Map Set 1D is provided in Figure 7.

Strategic Flood Risk Assessment Final Report
71-DG-053.doc 23 Final
Existing defences lower than 1 in 200
year sea level
Existing defences higher than 1 in 200
year sea level
Figure 7: Example Map Set 1D Output
4.2.1.5 Map 1E – Climate Change Flood Outlines
PPS25 and its practice guide recognise the effects of climate change as important factors in decisions regarding new development and flood risk. In order to allow consideration of the effects of climate change, Map Set 1E shows revised outlines for Flood Zones 2 and 3 for a number of years over the next century. The outlines were produced for 2025, 2055, 2085 and 2115. This is in line with recent Defra guidance on climate change, which provided allowances for sea level rise to 2025, 2055, 2085 and 2115 and indicative sensitivity ranges for increased river flows due to climate change from 2025 onwards.
In tidal areas, these climate change outlines were derived by projecting the Environment Agency extreme sea levels inland using a methodology defined by the Environment Agency, (see Appendix B for further details).
At the time of this study there was no consistent data available across the sub-region to represent climate change outlines for the fluvial flood zones. This data is currently being developed as part of the Environment Agency’s flood risk mapping programme and will be available in the future. Therefore, for the purpose of this study and based on Environment Agency guidance, this SFRA has assumed that the present day Flood Zone 2 (medium probability) becomes Flood Zone 3 (high probability) by 2025. This is a conservative assumption which should be tested by site specific FRAs, where required. This also means that there is no data available to estimate Flood Zone 2 from present day onwards. Therefore, the fluvial climate change outline

Strategic Flood Risk Assessment Final Report
71-DG-053.doc 24 Final
shown in Map Set 1E only shows Flood Zone 3 (see Appendix B for further details). An example view of Map Set 1E is provided in Figure 8.
Figure 8: Example Map Set 1E Output (2115 shown)
This Map Set allows consideration of whether or not an area that is currently not located within Flood Zone 2 or 3 will be likely to be within Flood Zone 2 or 3 in future, given the predicted impacts of climate change. Although planning decisions are taken using the present day Flood Zones, PPS25 states that flood risk should be considered throughout the lifetime of a development. In certain areas, climate change may mean that the flood zones may encroach upon areas that would otherwise be considered suitable for development. This may be an important issue for LPA planners. At the sub-regional scale, the climate change outlines can be used to show which areas of the sub-region are most vulnerable to rising sea levels, indicated as those areas where there is greater variation between each climate change outline from 2025 to 2115.
4.2.1.6 Map Set 1F – Other Sources of Flooding
PPS25 is clear in highlighting the importance of flooding from other sources other than extreme tides or river levels. Regarding other sources of flooding, the PPS25 Practice Guide states (Section 3.10, p.68):
“Information regarding the probability of other forms of flooding may not always be available and in many situations, the physical processes which may lead to flooding may be poorly understood. If information is available, it is likely that this will be measured and stored in ways that are quite different to river flow and tidal data used to generate the Flood Zones. In many cases this will preclude the accurate

Strategic Flood Risk Assessment Final Report
71-DG-053.doc 25 Final
mapping of flood risk probability from other sources within Regional Flood Risk Assessments (RFRAs) and SFRAs, however expert judgement can be used to identify those areas in which flood risk from other sources of flooding is likely to be higher. The sequential approach may then be applied in an effort to steer new development away from higher risk areas.”
Map Set 1F is designed to provide LPA planners and other users with information about these other forms of flooding. Where available, historic data recorded from previous flood events, has been provided as part of this Map Set. Elsewhere, high level assessments have been carried out on the physical characteristics (e.g. geology) which may give rise to other sources of flooding such that areas of potential risk can be highlighted.
The Map Set is subdivided into sections based on each of the ‘other sources’ of flooding experienced in the PUSH sub-region.
Wave Energy (1F-1)
Map Set 1F-1 addresses the issue of flood risk from potential wave overtopping as a result of coastline exposure to wave energy. This type of flood risk is determined by prevailing wind conditions, the orientation and geography of the coastal frontage and bathymetry, making it considerably more complex than an assessment of tidal flooding. Map Set 1F-1 presents a classification of predicted wave energy, developed by Portsmouth University for the south coast of England. The frontages in the PUSH sub-region are classified as being exposed to low or medium wave energies. This allows users to assess whether sites for development are likely to be affected by wave overtopping during severe storms. It is recommended that development on sites adjacent to ‘medium wave energy’ coastal frontages take into account the potential risk of wave overtopping, carrying out site specific assessments of wave overtopping risk.
In addition to the wave energy information, where data is available Map Set 1F-1 also indicates areas where flooding has occurred due to wave overtopping (mainly for Portsmouth and Hayling Island). This observed flooding information will allow development to be steered away from areas which have a known history of flooding from wave overtopping. An example view of Map Set 1F-1 is provided in Figure 9.
The information presented in Map Set 1F-1 should be used to supplement the knowledge base for sequentially testing site allocations and to identify those sites were more detailed assessments of wave overtopping will be required at the planning application stage.
In most instances the risk of flooding for sites located near the coastline will be defined by the Flood Zones, however there are some locations across the study area where historical incidents of flooding caused by wave overtopping have occurred on sites outside the Flood Zones (a key example of this is Hayling Island). Map Set 1F-1 is therefore intended to prompt planners and developers to consider the risks of wave overtopping for all sites located near the coastline.

Strategic Flood Risk Assessment Final Report
71-DG-053.doc 26 Final
Historic flood outline due to wave overtopping
‘Low’ wave energy frontage
‘Medium’ wave energy frontage
Figure 9: Example Map Set 1F-1 Output
Groundwater Flooding (1F-2)
Map set 1F-2 provides information regarding the potential risk of groundwater flooding in the PUSH region, by analysing the spatial variation of permeability across the PUSH district. Groundwater flooding is a complex phenomenon which occurs with great spatial and temporal variability. As such it is difficult to define precise risk areas at a sub-regional scale. By referring to the geological structure of the sub-region, however, it has been possible to ascertain that most incidents of groundwater flooding have occurred along the northern boundary of the sub-region in East Hampshire, Winchester, Eastleigh and Test Valley where highly permeable geological formations meet formations with lower permeability. These historic incidents of groundwater flooding have been shown where available. It is therefore possible to recommend that groundwater flooding is considered in development planning in those areas along the northern border of the sub-region where this geological pattern occurs. An example view of this Map Set is shown in Figure 10.

Strategic Flood Risk Assessment Final Report
71-DG-053.doc 27 Final
Geological Permeability
Historic groundwater flooding outline
Figure 10: Example Map Set 1F-2 Output
Impact of Land Use Change on Surface Water Runoff (1F-3)
The PPS25 Practice Guide summaries policy regarding surface water runoff as follows (Section 2.47, p.54):
“Both the rates and volumes of run-off from new developments should be no greater than the rates prior to the proposed development, unless specific off-site arrangements are made which result in the same net effect”
Assessment of surface water runoff in this way is usually undertaken at the site specific level. Identification of those areas where changes in land use could potentially increase surface water runoff rates and volumes can strategically aid spatial planning in avoiding areas where significant mitigation of surface water runoff following development may be required. In this regard, Map Set 1F-3 provides an index to inform users of the potential impacts of land use changes on the local surface water runoff regime. Based on a geological assessment of surface permeability at the sub-regional scale, the index shows the relative impact of developing on Greenfield areas based on the change in runoff rates before and after development.
In principle, developing in existing highly permeable areas will have the highest impact on surface water runoff regimes, as a high proportion of rainfall would have previously been able to infiltrate into the ground. This index does not assume that in these ‘high impact’ areas, excess surface water runoff from development will be difficult to mitigate, as highly permeable areas are often better suited to the implementation of SUDS, which will cope better with potentially high amounts of

Strategic Flood Risk Assessment Final Report
71-DG-053.doc 28 Final
surface water to be mitigated (see Chapter 5). However, the specific nature of planned development may influence the type of drainage systems to be implemented, and Map Set 1F-3 provides a high level relative assessment of the magnitude of surface water mitigation required and allows planners to compare sites with one another with regard to surface water runoff mitigation measures.
The areas covered by diagonal hatching represent existing developed areas, where a change in land use is unlikely to significantly affect the existing surface water runoff rates and volumes. An example of this Map Set is shown in Figure 11.
Existing developed
areas
Figure 11: Example Map Set 1F-3 Output
This index has been produced following a high level assessment across the PUSH sub-region and would therefore need to be assessed in more detail when undertaking site specific FRAs. Site specific FRAs should carefully consider the impact of development on the local surface water runoff regime, and should investigate SUDS options to manage surface water.
It is recognised that the opposite definition of the impact could be used, i.e. that the impact of developing on impermeable land is higher than on permeable land as there is less scope to use SUDS or other measures to attenuate the runoff and the existing collection system therefore must accommodate a higher rate of runoff. However, this definition would reflect the impact on the surface water collection system rather than on the existing runoff regime. It is considered that the definition proposed above is more useful to planners and developers in considering sites for development as the areas where the impact is indicated to be high are consistent with areas where increased mitigation measures would be required to maintain the existing Greenfield rate of runoff.

Strategic Flood Risk Assessment Final Report
71-DG-053.doc 29 Final
Potential Sources of Overland Flow (1F-4)
Map Set 1F-4 shows the variation in the potential source of overland flow across the PUSH sub-region. The assessment has taken account of slope, surface geology and whether or not existing development is present. The areas shown in red and orange relate to areas of very high and high potential for generating overland flow. Notably, the urban areas are indicated as red or orange due to the high runoff potential from urban land uses.
The map can be used to identify areas which have a high to very high potential for generating overland flow. It is important to note that this index does not show the locations where overland flow may pass through or pond and it is not implied that those areas with a low potential for generating overland flow also have a low risk of suffering from flooding due to overland flow. The assessment of flow routes outside of river systems is a complex and detailed process, and such an assessment across the entire PUSH sub-region was beyond the scope of the SFRA. This Map Set provides a high-level sub-regional assessment of the relative potential of areas to generate overland flow, and as such can be used to ensure that sensitive or vulnerable development is not located ‘downstream’ of areas which may result in high overland flow during intense rainstorms. It may also be of use to those wishing to refine study areas for more detailed assessments of overland flow for other purposes.
FRAs for sites that are found to be within or in the vicinity of these areas, especially if the local topography places the site at a lower elevation than the surrounding land and hence downstream of the source, should consider the impacts and management of flooding due to overland flow. An example view of the Map Set is shown in Figure 12.
Figure 12: Example Map Set 1F-4 Output
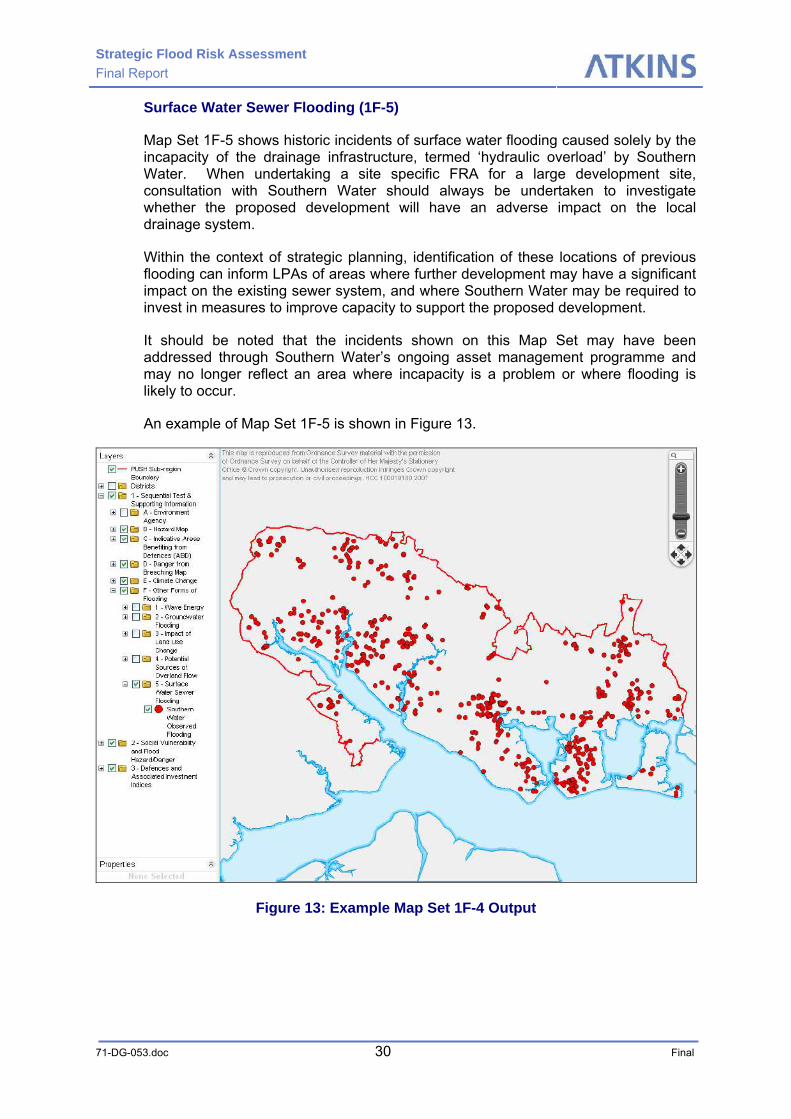
Strategic Flood Risk Assessment Final Report
71-DG-053.doc 30 Final
Surface Water Sewer Flooding (1F-5)
Map Set 1F-5 shows historic incidents of surface water flooding caused solely by the incapacity of the drainage infrastructure, termed ‘hydraulic overload’ by Southern Water. When undertaking a site specific FRA for a large development site, consultation with Southern Water should always be undertaken to investigate whether the proposed development will have an adverse impact on the local drainage system.
Within the context of strategic planning, identification of these locations of previous flooding can inform LPAs of areas where further development may have a significant impact on the existing sewer system, and where Southern Water may be required to invest in measures to improve capacity to support the proposed development.
It should be noted that the incidents shown on this Map Set may have been addressed through Southern Water’s ongoing asset management programme and may no longer reflect an area where incapacity is a problem or where flooding is likely to occur.
An example of Map Set 1F-5 is shown in Figure 13.
Figure 13: Example Map Set 1F-4 Output

Strategic Flood Risk Assessment Final Report
71-DG-053.doc 31 Final
4.2.2 Output Package 2
Output Package 2 focuses on existing development, providing information on the vulnerability of existing populations to flooding. It also indicates areas where the combination of vulnerability and hazard combine to increase the overall consequences of flooding. The key applications of Output Package 2 are:
• For all users interested in the consequences of flooding for existing development, i.e. LPA Planners, LPA/Environment Agency Flood Risk Managers and Environment Agency Development Control Officers/Emergency Planners.
• Identifies the Social Flood Vulnerability classification of existing development in Flood Zones 2 and 3.
• Identifies areas where the combination of undefended hazard/danger from breaching and vulnerability is lowest and highest within Flood Zones 2 & 3, refining information on the consequences of flooding.
• For spatial planning purposes, can raise important questions and inform high level decisions on whether to increase protection to or retreat from areas within Flood Zone 3 where hazard/danger and vulnerable populations are high.
• For asset management and investment planning purposes, can help identify where maintenance/improvement of existing defences or investigation into new mitigation measures should be focussed to reduce risk to existing developed areas within Flood Zone 3.
4.2.2.1 Map Set 2A – Social Flood Vulnerability Index
The aim of the Social Food Vulnerability Index (SFVI) is to identify communities that are more vulnerable to the adverse health and social effects associated with floods. The SFVI was created by the Flood Hazard Research Centre (FHRC) at Middlesex University. It is a composite, additive index based on four demographic variables that were selected following a review of flood impact studies. The four variables selected were:
• People aged 75 and over • People suffering from a long-term limiting illness • Lone parent households • Financially deprived households
The SFVI was populated using 2001 census data for Output Areas (OAs), the smallest unit of census geography. These OAs displayed in Map Set 2A were designed to have similar population sizes and to be as socially homogenous as possible, based on household tenure and dwelling type.
Flood Zone 2 has also been highlighted as part of Map Set 2A, to show where vulnerable communities coincide with areas of flood risk. An example of Map Set 2A is shown in Figure 14.

Strategic Flood Risk Assessment Final Report
71-DG-053.doc 32 Final
Very high vulnerability
Extent of Flood Zone 2
Figure 14: Example Map Set 2A Output
4.2.2.2 Map Set 2B – Social Vulnerability and Undefended Flood Hazard
Map Set 2B is the product of the undefended flood hazard (Map Set 1B) and SFVI (Map Set 2A) shown as one single dataset. The undefended flood hazard rating (low to very high) was combined with the vulnerability rating (very low to very high) to produce a single index that combines undefended flood hazard and social vulnerability. This effectively highlights the areas within Flood Zones 2 and 3 where both undefended flood hazard and social vulnerability are high, rather than areas where just the hazard is high. As such, it is not recommended for use when assessing new development, rather it should be used when addressing flood risk issues relating to existing development.
This Map Set provides LPAs and the Environment Agency with information that gives a better indication of the true consequences of flooding. It can be used to suggest where monitoring, maintenance, new mitigation measures and relocation strategies should be focused to protect the most vulnerable populations. Figure 15 shows an example of Map Set 2B, which for comparison is shown in the same location as Figure 14.
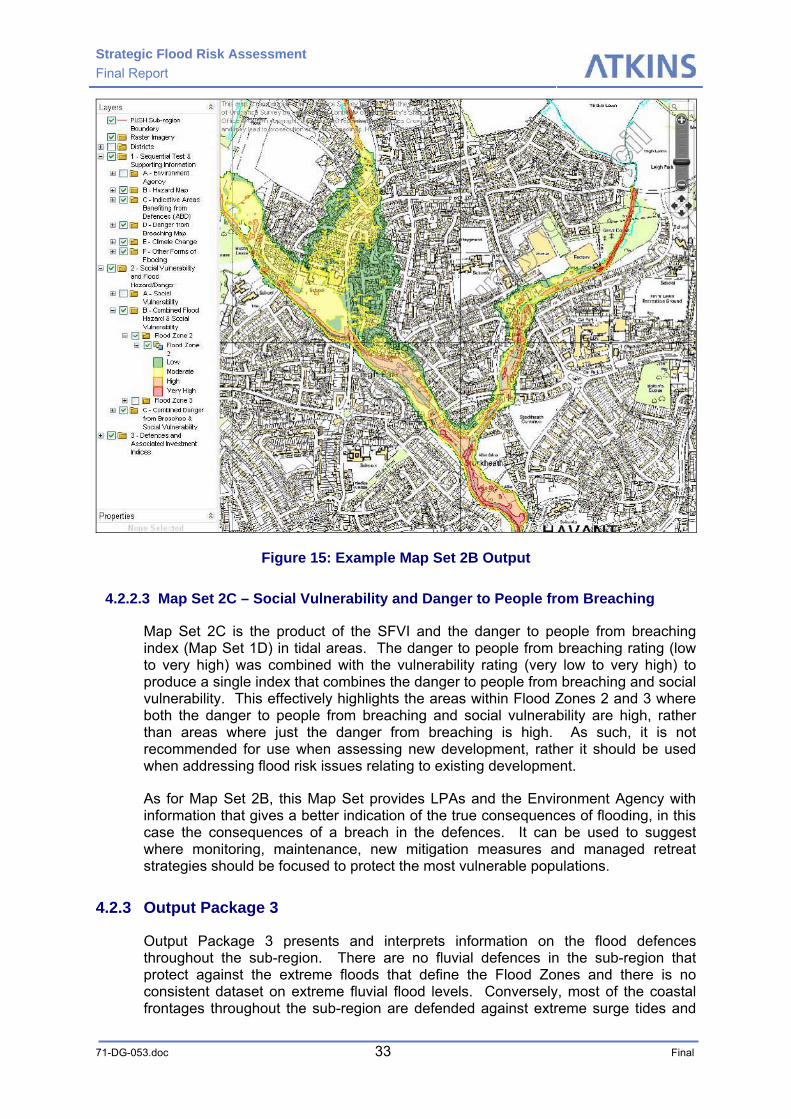
Strategic Flood Risk Assessment Final Report
71-DG-053.doc 33 Final
Figure 15: Example Map Set 2B Output
4.2.2.3 Map Set 2C – Social Vulnerability and Danger to People from Breaching
Map Set 2C is the product of the SFVI and the danger to people from breaching index (Map Set 1D) in tidal areas. The danger to people from breaching rating (low to very high) was combined with the vulnerability rating (very low to very high) to produce a single index that combines the danger to people from breaching and social vulnerability. This effectively highlights the areas within Flood Zones 2 and 3 where both the danger to people from breaching and social vulnerability are high, rather than areas where just the danger from breaching is high. As such, it is not recommended for use when assessing new development, rather it should be used when addressing flood risk issues relating to existing development.
As for Map Set 2B, this Map Set provides LPAs and the Environment Agency with information that gives a better indication of the true consequences of flooding, in this case the consequences of a breach in the defences. It can be used to suggest where monitoring, maintenance, new mitigation measures and managed retreat strategies should be focused to protect the most vulnerable populations.
4.2.3 Output Package 3
Output Package 3 presents and interprets information on the flood defences throughout the sub-region. There are no fluvial defences in the sub-region that protect against the extreme floods that define the Flood Zones and there is no consistent dataset on extreme fluvial flood levels. Conversely, most of the coastal frontages throughout the sub-region are defended against extreme surge tides and

Strategic Flood Risk Assessment Final Report
71-DG-053.doc 34 Final
the Environment Agency has provided a consistent dataset of extreme sea levels for present day and future tidal flooding scenarios. As such this Output Package is concerned solely with flood defences that protect from flooding from the sea.
The SFRA has collated flood defence information from a variety of sources and produced a comparison of the defence crest levels against extreme sea levels for all coastal frontages in the sub-region. The Map Sets in this Output Package are based on this assessment and the main applications of the Output Package are:
• Likely to be most useful to Flood Risk Managers either in the Environment Agency or LPAs.
• Identifies the existing levels of protection afforded by defences for present day and future sea levels.
• Provides indicative information on the level of investment required to raise defences to levels which afford protection from extreme tides, where required.
• Can help inform decisions on the sustainability of existing development protected by defences in light of potential sea level rise due to climate change.
The definition of a defence (a man made structure that protects against flooding) can be broken down further as follows:
1. Formal Defences: Structures that directly limit the spread of flooding and are maintained by their owner primarily because of this function.
2. Defacto defences: Structures that perform the same basic function as formal defences, in that they directly limit the spread of flood water, but in their case flood defence is a secondary or indirect purpose (e.g. road embankments).
The nature of the PUSH region is such that large stretches of the coastline are protected by natural land. Hence for the study a third type of defence can be defined:
3. Natural Ground: Levels of the natural ground could present a topographical feature or be at a height higher than the extreme sea levels hence providing protection against flooding to land behind.
4.2.3.1 Map Set 3A – Present Day Indicative Defence Crest Levels
Map 3A graphically illustrates the defence crest level in relation to the present day extreme sea levels. The index is termed ‘indicative defence crest level’ and it represents the equivalent tidal return period of the defences in terms of still water surge tide levels. The term ‘indicative’ is used to highlight that the assessment is based solely on a comparison of the crest level with extreme sea levels and does not take account of the following:
• Defence type. • Defence age, condition and residual life. • Freeboard allowance built into the design of the defences. • The potential for wave overtopping of the defences.
Therefore, Map Set 3A should be viewed as a starting point in the assessment of defence standards rather than as a highly accurate or reliable dataset. More detailed

Strategic Flood Risk Assessment Final Report
71-DG-053.doc 35 Final
assessments of defence standards should be undertaken as part of site specific FRAs which should take account of the factors listed above.
The map can be used by the Environment Agency and LPAs to identify the existing crest levels for defences within their authority boundary. The methodology of this assessment is described in detail in Appendix B. The dataset is split between those crest levels which are based on Formal or Defacto man-made defences (full lines) and those which are based on natural ground levels (dashed lines), as shown in the example view in Figure 16.
Natural ground providing protection Man-made structures
providing protection
Figure 16: Example Map Set 3A Output
4.2.3.2 Map Set 3B – Indicative Investment Indices (Present day)
Flood Zone 3 shows areas that have a high probability of flooding which, in tidal areas, is relative to a 1 in 200 year extreme sea level. Many of the defences along the sub-region’s coastline are at a height below this extreme sea level. An indicative investment index, from low to high, has been estimated for the defence lines based on the potential cost required to raise defence levels above the 1 in 200 extreme sea levels. This index allows LPA and Environment Agency Flood Risk Managers to ascertain at a strategic level the relative expense of improving defences in one area relative to another, based on the deficiencies in crest level compared to the present day extreme sea levels.
The investment index is based on the draft Environment Agency unit cost database currently being developed by Arup. Full details of the methodology behind the
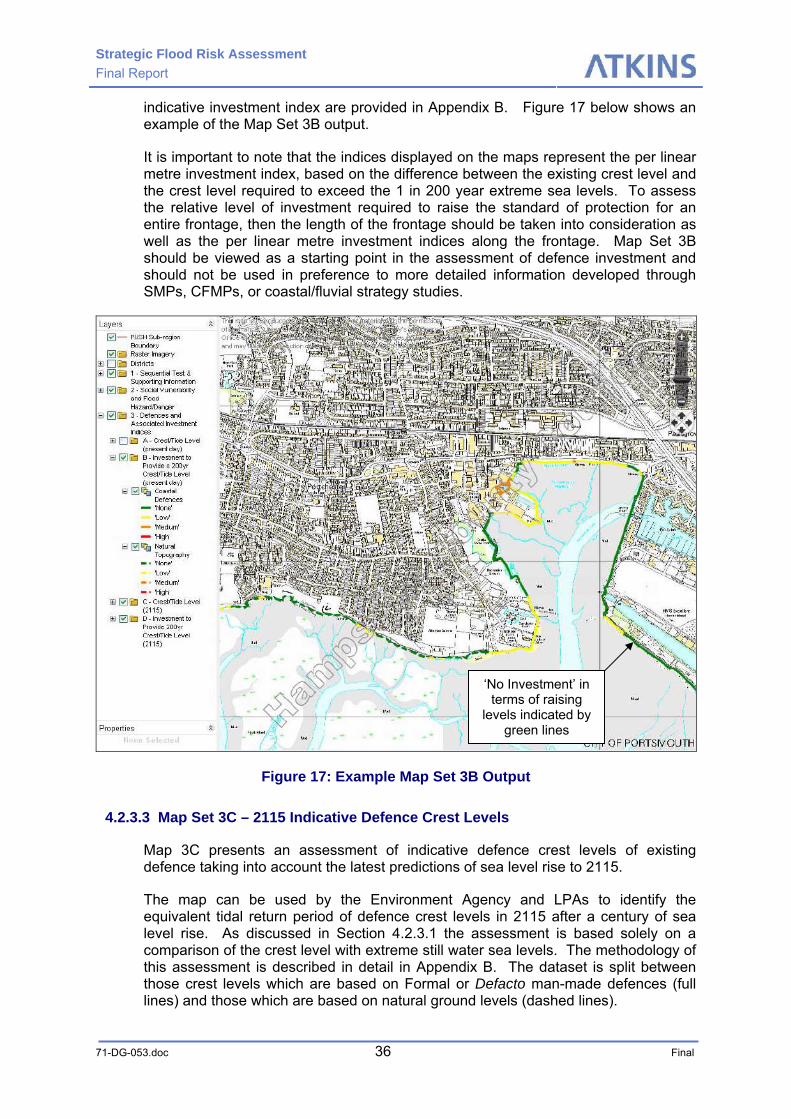
Strategic Flood Risk Assessment Final Report
71-DG-053.doc 36 Final
indicative investment index are provided in Appendix B. Figure 17 below shows an example of the Map Set 3B output.
It is important to note that the indices displayed on the maps represent the per linear metre investment index, based on the difference between the existing crest level and the crest level required to exceed the 1 in 200 year extreme sea levels. To assess the relative level of investment required to raise the standard of protection for an entire frontage, then the length of the frontage should be taken into consideration as well as the per linear metre investment indices along the frontage. Map Set 3B should be viewed as a starting point in the assessment of defence investment and should not be used in preference to more detailed information developed through SMPs, CFMPs, or coastal/fluvial strategy studies.
‘No Investment’ in terms of raising
levels indicated by green lines
Figure 17: Example Map Set 3B Output
4.2.3.3 Map Set 3C – 2115 Indicative Defence Crest Levels
Map 3C presents an assessment of indicative defence crest levels of existing defence taking into account the latest predictions of sea level rise to 2115.
The map can be used by the Environment Agency and LPAs to identify the equivalent tidal return period of defence crest levels in 2115 after a century of sea level rise. As discussed in Section 4.2.3.1 the assessment is based solely on a comparison of the crest level with extreme still water sea levels. The methodology of this assessment is described in detail in Appendix B. The dataset is split between those crest levels which are based on Formal or Defacto man-made defences (full lines) and those which are based on natural ground levels (dashed lines).

Strategic Flood Risk Assessment Final Report
71-DG-053.doc 37 Final
4.2.3.4 Map Set 3D – Indicative Investment Indices (2115)
Map Set 3D shows the indicative investment index described in Map Set 3B, but based on sea levels for 2115. This index allows LPA and Environment Agency Flood Risk Managers to assess how investment needs will increase with rising sea levels. The direct comparison of Map Sets 3A with 3C or 3B with 3D illustrates the pressure that the coastal frontages of the PUSH sub-region will be under as sea levels rise.
4.3 Delivery of the SFRA Output Packages
In order to facilitate the dissemination of the Output Packages described above, an online web-mapping system was set up at the following web address:
http://tfmapguide.atkinsglobal.com/mapguide/PUSH_SFRA/
The website is currently security protected. Full access details have been provided to the PUSH Steering Group.
This method of presenting the SFRA deliverables has the following benefits over traditional print / document based delivery:
• Works like a GIS system allowing quick and easy viewing of data, with background mapping and the ability to layer datasets on top of one another.
• No software installation is required, allowing the site to be accessed by users working in different computing environments.
• Large amounts of data can be viewed at all scales without the need for large numbers of individual hard copy or electronic maps.
• Allows data updates to be carried out without reproducing final hard copy deliverables.
• Allows targeted printing of areas of interest.
All of the above benefits help to reduce end-user time inputs required to extract useful information from the SFRA.
The PUSH Steering Group have indicated that they would like to maintain the website (with certain improvements) as a longer-term vehicle for the distribution of the SFRA deliverables. Suitable arrangements will be investigated by the PUSH Steering Group following final delivery of this report and all data.
All datasets which make up the output packages will be provided electronically with this final report on a number of DVDs, in suitable GIS formats which will allow the PUSH Authorities to incorporate the datasets into their own GIS systems.
4.4 SFRA Deliverables
The following deliverables are provided as part of the SFRA:
Web-based map system
• Output Package 1: PPS25 Sequential test and Relevant Supporting information • Output Package 2: Social Vulnerability of and Flood Hazard/Danger to Existing
Development

Strategic Flood Risk Assessment Final Report
71-DG-053.doc 38 Final
• Output Package 3: Current and Future Defence Standards and Associated Investment Indices
• Electronic (.pdf) versions of the SFRA Reports and documents for Stage 1, the Stage 1 Statistical Analysis and Stage 2 (this report).
DVD accompanying this report
• GIS layers of all data shown Output Packages 1-3, provided in (i) MapInfo .tab format, (ii) ArcGIS .shp format and (iii) MapInfo .mif format. One of these three readily-interchangeable formats should be compatible with the GIS-software used at each local authority.
• Spreadsheet containing PUSH SFRA Defence Data used in the production of Output Package 3.
• Electronic (.pdf) versions of the SFRA Reports and documents for Stage 1, the Stage 1 Statistical Analysis and Stage 2 (this report).
4.5 Website User Guide
The PUSH SFRA web-based map system contains a large amount of information and is set up to allow users to view this information at varying scales dependent on their requirements. The map system operates like a Geographic Information System (GIS) to such an extent that those with knowledge or experience of GIS systems and software should find it relatively easy-to-use. This brings a number of advantages, such as the ability to overlay the flood risk information on Ordnance Survey mapping, to overlay multiple data layers in a single ‘view’ and to readily change the position of the viewing window whilst continuing to browse data. In order to allow users with little or no GIS experience to become familiar with using the site, the following section lists a number of useful tips on using the site:
• Upon login, the website is displayed as in Figure 18, with the data layers outlined in the left hand panel, and the map screen in the centre showing the default view of the PUSH sub-region and the district boundaries.

Strategic Flood Risk Assessment Final Report
71-DG-053.doc 39 Final
Map Screen
Data Layers
Help Topics
Figure 18: PUSH website default view
• A help panel is shown in the lower right corner, providing guidance in using the MapGuide system upon which the website is based.
• The zoom tools allow the user to view the information at different scales. As the view is magnified, more detailed background mapping is shown.
• At any time, it is possible to return to the default view, by either (i) pressing the initial map view button , which keeps the current data layers shown, or (ii) pressing the internet browser ‘refresh button’ which will start over with the default view and data layers shown in Figure 18.
• Data layers can be added and removed from the view at any time by expanding the Output Packages by clicking on the adjacent plus signs and selecting the tick boxes of the required layers.
• The data layers on the website are arranged in a hierarchy that reflects the ‘Output Packages’ detailed in the SFRA. In order to view a data layer on screen, each checkbox in the hierarchy must be ticked (see Figure 19)
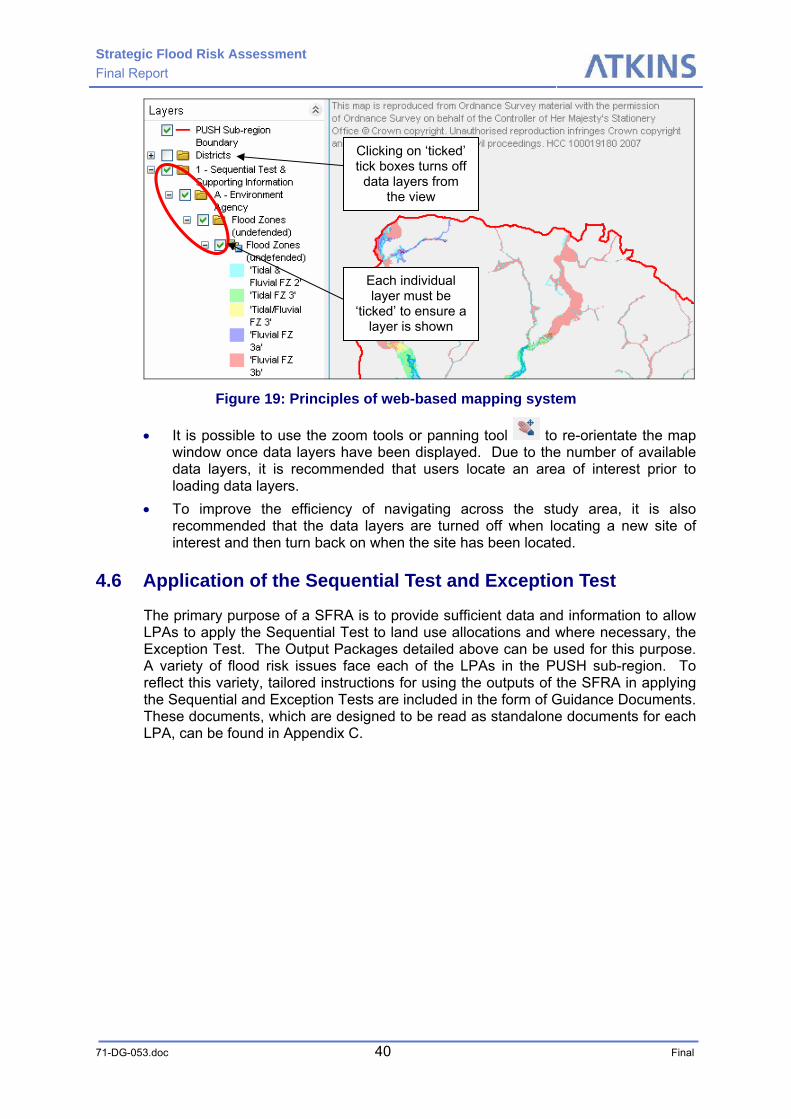
Strategic Flood Risk Assessment Final Report
71-DG-053.doc 40 Final
Each individual layer must be
‘ticked’ to ensure a layer is shown
Clicking on ‘ticked’ tick boxes turns off
data layers from the view
Figure 19: Principles of web-based mapping system
• It is possible to use the zoom tools or panning tool to re-orientate the map window once data layers have been displayed. Due to the number of available data layers, it is recommended that users locate an area of interest prior to loading data layers.
• To improve the efficiency of navigating across the study area, it is also recommended that the data layers are turned off when locating a new site of interest and then turn back on when the site has been located.
4.6 Application of the Sequential Test and Exception Test
The primary purpose of a SFRA is to provide sufficient data and information to allow LPAs to apply the Sequential Test to land use allocations and where necessary, the Exception Test. The Output Packages detailed above can be used for this purpose. A variety of flood risk issues face each of the LPAs in the PUSH sub-region. To reflect this variety, tailored instructions for using the outputs of the SFRA in applying the Sequential and Exception Tests are included in the form of Guidance Documents. These documents, which are designed to be read as standalone documents for each LPA, can be found in Appendix C.

Strategic Flood Risk Assessment Final Report
71-DG-053.doc 41 Final
4.7 Appraisal of Draft South East Plan
This SFRA has also carried out a high level assessment of the South East Plan’s proposed housing allocation to the PUSH sub-region of 80,000 new dwellings to 2026. Full details of this analysis are included in the Statistical Analysis Report (Ref. 1). The main findings are repeated below:
4.7.1 The PUSH Sub-Region
At a sub-regional level, when assessing the feasibility of allocating 80,000 houses within the PUSH sub-region as a whole (without considering the individual LPA percentage breakdown), the following conclusions can be made:
• The PUSH housing target of 80,000 new homes for the sub-region by 2026 is feasible, in terms of flood risk, due to the capacity of Flood Zone 1 in both the existing urban area and the Greenfield area. Assuming that all allocated Greenfield development will occur in Flood Zone 1 and without re-allocating the urban dwellings, approximately 90% of the total allocation would be located in Flood Zone 1.
• Due to the amount of ‘Greenfield Land in Flood Zone 1 (Outside Areas of Environmental Designation)’, there should be no pressure to locate any of the Greenfield allocation within Flood Zones 2 or 3. The Greenfield allocation can therefore satisfy the PPS25 Sequential Test.
• Due to the high urban capacity allocation and the extent of Flood Zones 2 and 3 within the existing urban area, there is potential for urban development pressure in these zones. However, the analysis has shown that the amount of Greenfield Land in Flood Zone 1 is sufficient to accommodate additional dwellings that may need to be re-allocated from the urban area to the Greenfield to avoid development pressure on Flood Zone 3. The urban capacity allocation may therefore need to be reduced, with re-assignment of a small proportion of the allocation (i.e. approximately 8%) to the Greenfield land, in order to satisfy the PPS25 Sequential Test.
• If current flood defence / mitigation measures are unsustainable and managed relocation strategies for existing populations at risk need to be considered, there is sufficient Greenfield Land in Flood Zone 1 to accommodate the number of existing dwellings within urban Flood Zone 3.
• The above conclusions remain valid when the effect of sea level rise to 2055 and 2115 is taken into account.
4.7.2 Individual LPA Areas
At a local level, when assessing the feasibility of the individual LPA allocations the following conclusions can be made:
• The conclusions drawn for the PUSH sub-region are also valid when considering the individual housing allocations for the following LPAs:
• East Hampshire District Council (part) • Eastleigh Borough Council • Fareham Borough Council • Havant Borough Council • New Forest District Council (part)

Strategic Flood Risk Assessment Final Report
71-DG-053.doc 42 Final
• Test Valley Borough Council (part) • Winchester City Council (part)
• The sub-region conclusions are also generally valid for Gosport Borough Council, however, the amount of Greenfield Land in Flood Zone 1 for this LPA may not be sufficient to relocate existing dwellings in Flood Zone 3. For this LPA, a managed relocation strategy for existing populations at risk may need to involve relocation to neighbouring LPAs.
• For Portsmouth and Southampton City Councils, the key conclusions are that the allocations may not be feasible and that consideration should be given to reducing the allocations to these LPAs for the following reasons:
• The existing urban area in Flood Zones 1 and 2 may not have sufficient capacity to accommodate the entire urban allocation, putting development pressure on urban Flood Zone 3.
• There may not be sufficient Greenfield Land in Flood Zone 1 to accommodate the proportion of the urban allocation that may need to be re-allocated to the Greenfield, and also to accommodate existing dwellings in Flood Zone 3 that may need to be relocated if existing flood defence / mitigation measures are unsustainable.
These conclusions suggest that only Gosport Borough Council and Portsmouth and Southampton City Councils should have a need to apply the Exception Test in allocation new development in Flood Zones 2 and 3. The other LPAs are unlikely to be able to prove that the Sequential Test has been passed for developments in Flood Zones 2 and 3, except for windfall development sites and development for economic and social regeneration of areas that are already at risk of flooding.
Strategic Flood Risk Assessment Final Report
71-DG-053.doc 43 Final
5 Flood Risk Management
5.1 Introduction
This chapter provides general guidance on flood risk management and mitigation. The information can assist LPAs when considering new sites for development or redevelopment of existing sites in areas with medium to high probability of flooding.
5.2 Managing Risk
In the first instance, the primary aim of Strategic Flood Risk Management is to avoid new development in areas of flood risk. The mapping outputs of this SFRA will help the LPAs achieve this aim when planning for the future of new development within their authority.
There are however, some areas of the PUSH sub-region where avoidance of flood risk areas may not always be achievable or where a policy of avoidance may prevent the economic and social regeneration of existing developments. In such instances, to meet the wider aims of sustainable development, land uses of appropriate vulnerability to flood risk may need to be located in areas at risk to flooding. In these circumstances careful consideration needs to be given to incorporating appropriate mitigation measures for managing and reducing the risk of flooding to the development. Approval of developments which include such measures should only be accepted providing the development passes the Sequential and Exception Tests and is consistent with the wider sustainability policies of the LPA.
The objectives of flood risk mitigation measures are to:
• Reduce the probability of flooding to a development and consequently reduce the associate hazard to people occupying the development.
• Minimise the impact and damage that flood water may cause to a development and thus enable a faster recovery following a flood event.
• Ensure no adverse impacts resulting in increased flood risk to neighbouring sites.
• Wherever possible seek to provide an overall benefit to flood risk for neighbouring sites.
• Be adaptable to future climate change scenarios
Consideration of mitigation measures can take place at a number of stages of the development process, these include;
• The Master Planning Stage • The Outline Design Stage • The Detailed and Internal Design Stage
Table 5 summaries the types of mitigation measures, their limitations and the stage of the development process when they should be considered. If the whole of the development site cannot be located away from areas of flood risk, ‘zoning’ of the development site should always be considered as the first mitigation measure. Only if ‘zoning’ of the site layout cannot fully mitigate the risk of flooding, should the
SF
trategic Flood Risk Assessment inal Report
71-DG-053.doc 44 Final
remaining mitigation measures be considered. SUDS however, should always be considered for every new development site.

Strategic Flood Risk Assessment Final Report Table 5: Summary of Mitigation Measures (Source of Text PPS25 Practice Guide)
Mitigation Option
Description Examples Development Stage
Limitations
Site Zoning/ Layout
The sequential approach can be applied within development site boundaries to locate the most vulnerable elements of the development in the areas of lowest risk.
Locating flood-compatible development, such as areas of open space and car parking in areas at higher risk and reserving lower risk areas for more vulnerable land use types such as housing.
Master Planning Stage
The spatial planning of developments sites may not always be achievable in line with a sequential approach for urban Brownfield sites where the location of existing development and access routes can prevent zoning of development land use in line with flood risk probability.
Modification of Ground Levels
The probability of flooding can be mitigated through the modification of ground levels to raise developments above the flood level or at least reduce the depth of predicted flood water.
Land raising parts of a development sites using material, either from other parts of the site or imported to the site from other locations.
Master Planning and Outline Design Stage
Raising ground levels may not be viable if existing buildings or access routes at ground level need to be maintained. Care is needed to avoid the formation of islands which would become isolated in flood conditions and to ensure there is safe access. Unless the development is located in an area which is subject to coastal flooding and which serves no flood storage or conveyance function, land raising must be accompanied by compensatory provision of flood storage either on or off-site. This option can prove costly if large volumes of material need to be moved or if fill material needs to be imported to the site from other locations.
Flood Walls & Embankments
Construction of engineered defences/embankments to prevent flood water entering a development site.
Sheet pile walls, earth embankments, sea walls with wave return, revetments.
Master Planning and Outline Design Stage
New defences for developments should only be considered if fully funded and maintained by the developer and if the residual risk behind the development is appropriate to the land use proposed. Unless the development is located in an area which is subject to coastal flooding and which serves no flood storage or conveyance function, compensatory flood storage should be provided if new flood defences have been provided to allow development. Flood defence mitigation options can be costly and will require ongoing investment for maintenance. Developers proposing defences should also ensure that the defences can adapt to future climate change scenarios to maintain the minimum standard of protection required by PPS25 for the life time of the development.
Flood Storage The provision of upstream flood storage, either on or off the line of a river or watercourse, may be an effective measure to manage water levels at and downstream of a development site.
Flood storage reservoirs, controlled washlands, flood storage wetlands. Such options can also provide ecological and habitat benefits.
Master Planning and Outline Design Stage
Such options can involve significant land take which will need to be secured by the developer. If operational controls are required for such options consideration needs to be given to how this will be managed over the lifetime of the development. The longer term maintenance of the flood storage options will also need to be addressed from both a funding and operational perspective.
Building Design
Buildings can be designed such that the ground floor comprises flood compatible uses which are resilient to flood water and the associated damage caused. Residential and other people intensive uses are then located on the first floor upwards. Single-storey residential development and basements should not be considered in flood risk areas as such developments are generally more vulnerable to flood damage and occupants do not have the opportunity to retreat to higher floor levels.
Water compatible uses for the ground floor can include open plan public spaces, car parking and or utility areas. Provision of private garages or other enclosed private spaces should be avoided due to possible vehicle damage, pollution from stored materials and a reduction in flow conveyance.
Detailed Design Stage
Where developments incorporate open space beneath the occupied level, measures such as legal agreements need to be in place to prevent inappropriate use or alteration of the ground floor that would impede flood conveyance or reduce flood storage. Safe access to higher ground, above the flood level, should be made available for people to evacuate all buildings where the habitable level is raised above the flood level. In areas of high flood flow velocity buildings should be structurally designed to withstand the expected water pressures, potential debris impacts and erosion which may occur during a flood event.
Temporary, Demountable or Operational Defences
Flood defences which require human intervention to ensure successful operation during a flood event.
Flood barriers and gates Detailed Design Stage
These measures are unlikely to be suitable as the only mitigation measure as it is not usually appropriate to design a new development to rely on demountable or temporary flood defences to manage flood risk, unless such measures are proposed solely to manage residual flood risk to individual properties. For water-compatible and less vulnerable land uses, such measures may be appropriate where temporary disruption is acceptable and appropriate flood warning to activate the defences is provided.
Flood Resilience
External and internal building design, fixtures and fittings which ensure that the building can be quickly returned to use after a flood.
Raising electrical sockets above the predicted flood level. Wet proofing wall and floor furnishings using materials such as tiles and paint. More advice on appropriate measures can be found in ‘Preparing for Floods’, 2003, ODPM and Development (Ref. 13) and ‘Flood Risk: A Guide for the Construction Industry (C624)’ 2004, CIRIA (Ref. 14).
Detailed and Internal Design Stage
Such measures are unlikely to be suitable as the only mitigation measure to manage flood risk, but they may be suitable where • disruption to water-compatible and less vulnerable uses is acceptable and appropriate flood warning is provided. • there are instances where the use of an existing building is to be changed and it can be demonstrated that no other measure is practicable.
SUDS A sequence of management practices and control structures, designed to drain water in a more sustainable manner than some conventional techniques. Typically these are used to attenuate run-off from development sites.
There are a number of engineered and landscape vegetated types of SUDS options. Examples of these are provided in the Guidance Documents which append this report. More detailed guidance and advice can also be found ‘The SUDS Manual’ CIRIA (C697) (Ref. 15)
Outline and Detailed Design Stage
Issues which require early consideration when proposing SUDS include; Land Take: is there sufficient land available for the options proposed? Adoption and Maintenance: Who will fund, own and maintain the systems once installed, for the operational lifetime? This issue can often be secured through a planning condition for simple schemes or through a Section 106 agreement.
71-DG-053.doc 45 Final

Left Blank for double sided print
Strategic Flood Risk Assessment Final Report
71-DG-053.doc 47 Final
Further useful guidance documents which can be referenced when considering mitigation measures include:
• Flood resilient and resistant construction – guidance for new build, Department for Communities and Local Government (forthcoming 2007) (Ref. 16)
• Appendix A3 in CIRIA C624 Development and flood risk – guidance for the construction industry (Ref. 14)
• Development and Flood Risk: A Practice Guide Companion to PPS25, (2007), Communities and Local Government. (Ref. 3)
It is important to note that mitigation measures are only effective up to the magnitude of the flood event for which they are designed. If the design flood event is exceeded, then mitigation measures may not be effective. Exceedance of the design flood is an important consideration when employing mitigation measures for new development sites. Therefore, in some instances a combination of mitigation measures may need to be considered for a site. For example, flood resilience options should normally be included for all developments where significant mitigation measures have been included. This will provide the added benefit of ensuring a building can be quickly returned to use after an extreme flood event.
5.2.1 Funding
Where proposed developments include the provision of new flood mitigation measures, these should generally be funded on the whole by the developer. Developers proposing new mitigation measures which solely benefit new development should not call on public resources as a means of funding.
LPAs may wish to consider entering into an agreement under Section 106 of the Town and Country Planning Act 199031 to ensure that the developer carries out the necessary works and that future maintenance commitments are met. They may also apply planning conditions which would require completion of the necessary works before the rest of the development can proceed.
Where the mitigation measures proposed provide benefit to the wider community, or where the proposed works include upgrade or replacement of existing defences or flood alleviation schemes, it may be reasonable for the developer to contribute a proportion of the funding in partnership with the operating authority responsible for the existing works.
Further guidance on developer contribution for flood mitigation measure can be found in Annex G of PPS25.
5.2.2 Emergency Planning
Emergency planning for extreme flood events is a key consideration for new developments which, having passed the Sequential and Exceptions Tests, are located in areas of flood risk. When preparing planning applications for such developments, developers should consult with the Environment Agency, emergency services and local resilience forums when developing emergency and evacuation plans. The outputs of the SFRA will provide a useful information base from which to initially consider viable routes for safe evacuation during flood events. At the site specific level, a more detailed appraisal of proposed evacuation routes may be required to confirm that the route is safe for the lifetime of the development.
Strategic Flood Risk Assessment Final Report
71-DG-053.doc 48 Final
A key part of emergency planning also involves raising public awareness to the potential risks and providing comprehensive information regarding flood warning and evacuation routes for members of the public to follow during extreme flood events. Both developers and LPAs should give particular consideration to communication flood warnings and advice to people with impaired hearing and/or sight and with restricted mobility.
LPAs can also use the outputs from this SFRA to facilitate the development of emergency planning policies for existing developments at risk within their local authority. Map Sets 1A, 1B, 1C, 1D and 1E are particularly useful when considering the feasibility and sustainability of key access routes within their administrative boundaries and across neighbouring boundaries.
5.2.2.1 Flood Warning
Although LPAs are responsible for developing emergency plans for their individual authorities, the work undertaken by the Environment Agency in relation to flood warning is a key element which should be integrated into the process of developing such plans.
The Environment Agency’s National Flood Warning Centre is currently responsible for co-ordinating and issuing flood warnings via ‘Floodline’. The Environment Agency is however, developing a range of integrated catchment flood forecasting models in Southern Region for catchments which contain Flood Warning Areas. The main objective of this modelling is to improve the prediction of water levels at designated forecasting points and to assist in the process of issuing flood warnings. Coastal forecasting is also undertaken by the Environment Agency based on the Storm Tide Forecasting Service (STFS) outputs, supplemented by locally applicable procedures based on observations and forecasts of wind speed, wind direction, wave conditions, tidal levels etc where available.
Consideration should be given to the estimated lead times which can be provided when developing strategies for emergency evacuation and response to flood events.

Strategic Flood Risk Assessment Final Report
71-DG-053.doc 49 Final
6 Conclusions and Recommendations
6.1 Introduction
The purpose of an SFRA is to provide a flood risk dataset to inform strategic decisions on spatial planning rather than to interpret the data and draw conclusions on managing flood risk. There are however, some key conclusions and recommendations that can be drawn from the process of developing this SFRA, and these are summarised in this chapter.
6.2 Conclusions
6.2.1 Feasibility of PUSH Housing Target
• The statistical analysis undertaken during Stage 1 of the SFRA concluded that the draft SEP housing target of 80,000 new dwellings in the PUSH sub-region by 2026 is feasible, with regard to flood risk, when assessed at the sub-regional level. This is due to the amount of Greenfield land available in Flood Zone 1.
• However, when assessed at the LPA area scale, some of the housing targets may not be feasible due to the extent of the Flood Zones 2 and 3 within some LPA areas. In particular, the administrative areas of Portsmouth, Southampton and Gosport are significantly constrained by the extent of Flood Zones 2 and 3.
• The large scale of the development required to meet the SEP objectives may result in pressure to locate new development within Flood Zones 2 and 3 for some LPA areas. To avoid or relieve this pressure, consideration may need to be given to revising the distribution of dwellings across the LPA areas to ensure that the individual LPA housing targets are feasible in terms of flood risk constraints.
6.2.2 Flood Risk
The Guidance Documents provided in Appendix C provide an overview of flood risk issues specific to each LPA. Across the sub-region the following broad conclusions can be drawn:
• The sub-region is exposed to flood risk from a number of sources. Flooding from the sea, due to extreme tides, is the predominant source of flood risk, due to the location of some of the sub-region’s most populated areas on low lying coastlines in Portsmouth, Southampton, Gosport, Havant, Fareham, Eastleigh and the New Forest. All of the PUSH LPAs contain areas at risk of flooding from rivers and watercourses, with the Rivers Test, Itchen, Hamble, Meon, Wallington, Hermitage Stream and Lavant Stream passing through existing developed areas. In addition, the coastal frontages of Portsea and Hayling Island have experienced flooding caused by wave overtopping; a number of areas in Winchester, Test Valley and East Hampshire have been affected by groundwater flooding; and flooding due to excessive overland flow has caused significant problems in East Hampshire in the past.
• The sub-region is protected from flooding from the sea by defences along the majority of its coastal frontages. The level of protection afforded by the defences along each frontage varies considerably, with areas such as Portsea Island,

Strategic Flood Risk Assessment Final Report
71-DG-053.doc 50 Final
parts of Gosport and Southampton, and Hayling Island generally defended to a higher level than other frontages in the sub-region. There are no significant flood defences on rivers in the sub-region, although localised flood protection measures such as bank protection and maintenance of structures provide benefits in terms of flood risk in a number of locations.
• Climate change poses a significant risk to the sub-region. Predicted sea-level rise over the coming century will reduce the level of protection provided by most of the sub-region’s flood defences and result in the inundation of larger areas by extreme tidal floods. In addition, increasing severity of storm events is predicted to result in an increase in river flood flows, which will subsequently increase the risk of flooding from rivers.
• The SFRA has assessed the sub-region’s coastal flood defences based on the level of protection they provide. The SFRA has stopped short, however, of recommending what is an ‘appropriate’ standard of protection for the sub-region, or for individual LPA areas within the sub-region. During Stage 2 of the SFRA a review of standards of protection was undertaken based on a variety of guidance documents, policy and European best practice in an attempt to identify suitably appropriate standards that may be considered for the sub-region. This review is summarised in the Technical Note provided in Appendix D. It was concluded that appropriate standards of protection should be identified through a comprehensive review of social and economic factors and agreement from the LPAs, Central Government and the Environment Agency and is therefore beyond the scope of this SFRA. However, the SFRA has delivered a dataset that can assist in this assessment by presenting information on current and future indicative standards, the scale of the potential flood hazards and the social vulnerability of the areas at risk.
6.3 Recommendations
6.3.1 General
It is recommended that the Environment Agency and all Local Authorities in the PUSH sub-region give due consideration to the implications of climate change on flood risk across the sub-region. This SFRA provides a number of datasets that indicate, at a high level, the vulnerability of land to rising sea levels, the vulnerability of communities to flood risk and the levels of investment required to maintain defences to protect from flooding from the sea following predicted sea level rise. The SFRA outputs should be used to assess the sustainability of raising existing defences to contend with rising sea levels in a number of areas, particularly where the residual risks of flooding may remain unacceptably high. Such assessments are outside the scope of this SFRA, but the data collated and the high-level datasets produced should provide a sound basis for further studies in this area.
The SFRA outputs should be used to inform a review of existing defence standards and to assist in identifying potentially higher standards that may be more appropriate in light of climate change forecasts. However, the SFRA outputs alone cannot inform such an assessment, as it should include consideration of wider social and economic factors.

Strategic Flood Risk Assessment Final Report
71-DG-053.doc 51 Final
6.3.2 Use of Data
The following recommendations relate to the use of the data collected and developed as part of this SFRA:
• It is recommended that the outputs of this SFRA be used by both LPA and the Environment Agency to test the suitability of new development in line with the PPS25 Sequential and Exception Tests.
• It is also recommended that the findings of the SFRA be used to guide LPAs when developing polices for the LDF to ensure that future development within the sub-region is sustainable in relation to flood risk and the impacts of future climate change. Incorporating appropriate flood risk policies into the forthcoming LDFs will give the LPAs greater scope to ensure that the provision and maintenance of flood management infrastructure can be secured as planning conditions for new development sites.
• The SFRA has assessed flood risk across the sub-region at a strategic level. The outputs and findings of the SFRA are therefore sufficiently detailed to inform strategic decision making in relation to spatial planning. The outputs and findings of the SFRA should therefore not preclude the need for detailed site specific flood risk assessments to accompany planning applications for proposed developments. Guidance on the content of detailed site specific FRAs for areas within each LPA is provided in the Guidance Documents, Appendix C.
• Although the primary objective of an SFRA is to inform spatial planning, the outputs of the SFRA can also be used for a number of other purposes. It is recommended that SFRA outputs are also used by the following stakeholders:
• Emergency planners in identifying areas of high flood hazard and vulnerability, which can inform the development of emergency response and evacuation plans.
• Water companies in identifying constraints on and impacts of drainage infrastructure for new development.
• Utility companies in identifying suitable locations for new infrastructure and assessing the vulnerability of existing infrastructure located in the Flood Zones.
• The flood hazard data produced for the SFRA have been generated using technical methods appropriate to a strategic level study. This data may be suitable for assessing flood risk at the site specific scale for sites with a low risk of flooding; however this should be agreed in consultation with the Environment Agency. The data may not be sufficiently accurate or detailed for site specific assessments in higher risk areas where techniques such as hydrodynamic modelling may be required to refine the understanding of flood risk.
• The assessment of indicative defence standards is based on a simple comparison of defence crest level against extreme sea levels. Site specific or more detailed assessments that are required to consider the function of defences should obtain and consider further data on defence type, condition, residual life and appropriate failure scenarios, in consultation with the Environment Agency.
6.3.3 Improving the Knowledge Base
Appendix A and B of this report summarise the data, limitations and methodologies used when developing the SFRA. The key limitations of the SFRA, and where the

Strategic Flood Risk Assessment Final Report
71-DG-053.doc 52 Final
LPAs and Environment Agency may wish to consider improvements to the datasets, include:
• Where gaps in coastal defence asset information have been identified, local ground levels, extracted from a DEM (based predominantly on LiDAR data), have been used to represent the crest level of the defence. Improvements to the defence database should be made to standardise the data entries and categories and to make the information consistent across the sub-region..
• Modelling information to define the fluvial functional floodplain (Flood Zone 3b) is currently only available for the Wallington Stream and the Tadburn Lake Stream. For the remainder of the main rivers, the SFRA has assumed that the functional floodplain is the whole of the high probability flood area (Flood Zone 3). This is a conservative approach that can be updated in the future when modelling information becomes available.
• There are no consistent estimates across the sub-region for how climate change may increase the areas at risk of fluvial flooding. The SFRA has assumed that by 2025, increases in flows in the river will mean that Flood Zone 3 will extend to cover the area defined by Flood Zone 2.
The assumptions and decisions made when addressing the limitations summarised above, have been based on a conservative approach and discussed and agreed with the Environment Agency. Where the above limitations have the potential to effect spatial planning decisions, it is recommended that more detailed information is sought by either the LPA or prospective developer.
The SRFA study has collated and developed an extensive amount of flood risk and flood defence asset information for the sub-region. The amount of data collection and processing undertaken for this study has previously never been carried out for the sub-region. It is therefore recommended that the mapping outputs and raw data files delivered as part of this SFRA are the first stage in developing a comprehensive sub-regional database.
6.3.4 Maintaining the Knowledge Base
This SFRA has provided a snapshot of flood risk issues throughout the PUSH sub-region using flood risk, climate change and flood defence asset information available in 2007. The datasets used in this assessment are likely to be updated, expanded or revised in the future. We therefore recommend that the SFRA is considered to be a live study that is reviewed and updated at appropriate intervals to account for new information, so that it can continue to provide a sound basis for future spatial planning decisions. Currently, there is no guidance on the appropriate frequency for updating SFRAs. We would therefore recommend that updates are undertaken following significant revisions to key flood risk datasets and policy guidance or, as a minimum, every 3 to 5 years.
The SFRA has highlighted the range and extent of information held between the LPA, the Environment Agency and the Water Companies. It recommended that a partnering approach between these Stakeholders should be adopted for the future development and improvement of flood risk and flood defence asset information. Furthermore, a partnering approach to strategic flood risk management can help to ensure that sustainable development is delivered across the sub-region.
Strategic Flood Risk Assessment Final Report
71-DG-053.doc 53 Final
7 References 1. Partnership for Urban South Hampshire Strategic Flood Risk Assessment
Statistics Report, 2007, Atkins
2. Planning Policy Statement 25: Development and Flood Risk, 2006, Communities and Local Government
3. Development and Flood Risk: A Practice Guide Companion to PPS25, ‘Living Draft’, 2007, Communities and Local Government
4. Planning Policy Statement 1: Delivering Sustainable Development, 2005, Office of the Deputy Prime Minister
5. Planning Policy Statement 3: Housing, 2006, Communities and Local Government
6. Planning Policy Guidance Note 25: Development and Flood Risk, 2001, Superseded, Office of the Deputy Prime Minister
7. Draft South East Plan, 2006, South East England Regional Assembly 8. Making Space for Water (Government response to consultation), 2005,
Department for Environment, Food and Rural Affairs 9. Directive 2000/60/EC of The European Parliament and of The Council (‘The
Water Framework Directive’), 2000, Official Journal of the European Communities
10. Partnership for Urban South Hampshire Strategic Flood Risk Assessment Stage 1 Report, 2007, Atkins
11. Flood Risks to People: Guidance Document, Phase 2 FD2321/TR1 & 2, 2006, Department of Food and Rural Affairs and the Environment Agency, Flood and Coastal Defence R & D Programme
12. Guidance for Identification of Areas Benefiting from Flood Defences and Producing the Flood Map, 2005, Environment Agency
13. Preparing for Floods, 2003, Office of the Deputy Prime Minister 14. Development and flood risk - guidance for the construction industry (C624),
2004, The Construction Industry Research and Information Association 15. The SUDS manual (C697), 2007, The Construction Industry Research and
Information Association 16. Flood resilient and resistant construction – guidance for new build, forthcoming
in 2007, Communities and Local Government 17. Extreme Sea Levels, Kent, Sussex, Hampshire and Isle of Wight, JBA
Consulting, 2001 and subsequent updates in 2002 and 2004. 18. SCOPAC: A Critique of the Past - A Strategy for the Future, 1999, Portsmouth
University (Maps available at www.scopac.org).

Left Blank for double sided print

Strategic Flood Risk Assessment Final Report
71-DG-053.doc Final
Appendix A: DATA SOURCES & LIMITATIONS

Left Blank for double sided print
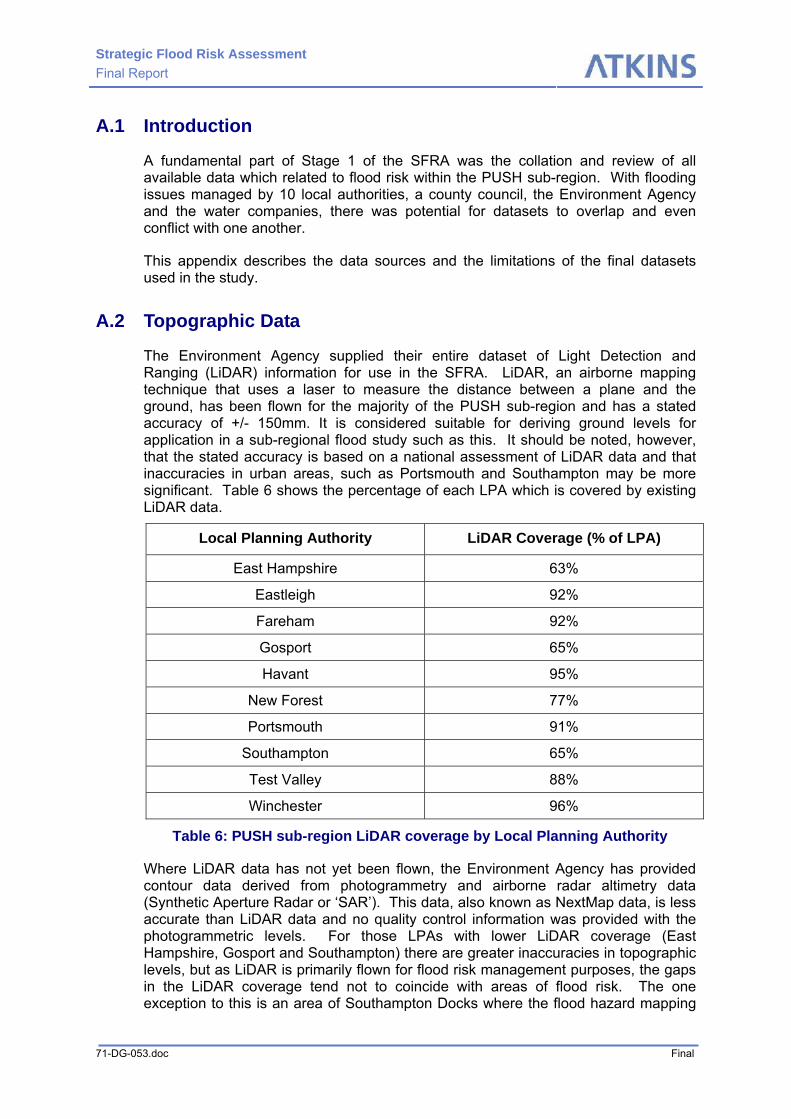
Strategic Flood Risk Assessment Final Report
71-DG-053.doc Final
A.1 Introduction
A fundamental part of Stage 1 of the SFRA was the collation and review of all available data which related to flood risk within the PUSH sub-region. With flooding issues managed by 10 local authorities, a county council, the Environment Agency and the water companies, there was potential for datasets to overlap and even conflict with one another.
This appendix describes the data sources and the limitations of the final datasets used in the study.
A.2 Topographic Data
The Environment Agency supplied their entire dataset of Light Detection and Ranging (LiDAR) information for use in the SFRA. LiDAR, an airborne mapping technique that uses a laser to measure the distance between a plane and the ground, has been flown for the majority of the PUSH sub-region and has a stated accuracy of +/- 150mm. It is considered suitable for deriving ground levels for application in a sub-regional flood study such as this. It should be noted, however, that the stated accuracy is based on a national assessment of LiDAR data and that inaccuracies in urban areas, such as Portsmouth and Southampton may be more significant. Table 6 shows the percentage of each LPA which is covered by existing LiDAR data.
Local Planning Authority LiDAR Coverage (% of LPA)
East Hampshire 63%
Eastleigh 92%
Fareham 92%
Gosport 65%
Havant 95%
New Forest 77%
Portsmouth 91%
Southampton 65%
Test Valley 88%
Winchester 96%
Table 6: PUSH sub-region LiDAR coverage by Local Planning Authority
Where LiDAR data has not yet been flown, the Environment Agency has provided contour data derived from photogrammetry and airborne radar altimetry data (Synthetic Aperture Radar or ‘SAR’). This data, also known as NextMap data, is less accurate than LiDAR data and no quality control information was provided with the photogrammetric levels. For those LPAs with lower LiDAR coverage (East Hampshire, Gosport and Southampton) there are greater inaccuracies in topographic levels, but as LiDAR is primarily flown for flood risk management purposes, the gaps in the LiDAR coverage tend not to coincide with areas of flood risk. The one exception to this is an area of Southampton Docks where the flood hazard mapping

Strategic Flood Risk Assessment Final Report
71-DG-053.doc Final
(Map Sets 1B and 1D) show a significant change in the topographic data which has come about due to gaps in the LiDAR data being filled with less accurate Next Map/Photogrammetry data. As such, it was possible to create a continuous topographic dataset, a ‘Digital Terrain Model’ (DTM), which could be used to estimate ground levels at any point in the PUSH sub-region. This DTM is referred to throughout this report as the ‘PUSH topographic grid’.
A.3 Flood History
A detailed review of the flood history of the PUSH sub-region was undertaken. This review fed into the development of methodologies used in the generation of the SFRA Output Packages and the flood risk overviews presented in the Guidance Documents (see Appendix C). Sources of historic flood incidents were:
• Environment Agency GIS data showing historic observed flooding by source in the sub-region.
• Environment Agency Winter 2000/01 Flood Reports for Hampshire • Southern Water Flooding Incidents (Hydraulic Overload) 1996-2006 • Consultation discussions with flood risk engineers from each LPA, Hampshire
County Council and the Environment Agency as part of Stage 1. • All available CFMPs / SMPs / Coastal Strategies.
A.4 Flood Risk Data
A.4.1 Flood Outlines
The Environment Agency made available the latest versions of their Flood Map (dated September 2006 then March 2007) throughout the SFRA. No changes were made to the Flood Map in the PUSH sub-region during the production of the SFRA.
Additional flood outlines were provided to facilitate the production of a Flood Zone 3b extent in a number of areas:
• River Wallington 1 in 25 year flood outline • Tadburn Lake Stream (draft) 1 in 25 year flood outline • River Test (Romsey) observed flood outline 2000/01 • River Meon observed flood outline 2000/01
A.4.2 Extreme Water Levels
Extreme still water tide levels were provided by the Environment Agency for the SFRA as provided in Appendix E. The Environment Agency used the following method to generate the extreme sea levels, based on the JBA Extreme Sea Levels Report December 2004 (Ref. 17):
• The 2000 base levels at analysed sites (not interpolated) were backdated to 1990 by removing the 6mm/yr climate change allowance (now superseded)
• The revised 1990 tide levels were then interpolated for intermediate sites

Strategic Flood Risk Assessment Final Report
71-DG-053.doc Final
• The revised Defra sea level rise allowances were then added to these interpolated 1990 tide levels, producing a level for each epoch in the Defra guidance (2010, 2025, 2055, 2085 and 2115)
The Environment Agency provided these levels for the 1 in 200 year and 1 in 1000 year return period tides. Atkins then used the same method to generate more frequent return period levels. The tables below list the full set of extreme tide levels used in the study. Table 7 and Table 8 list the tidal levels for 1 in 200 year and 1 in 1000 year events used for almost all analyses in the SFRA. The remaining tables list the tide levels for the lower return period events which were required to assess the degree of protection offered by the sub-region’s coastal defences.
Note: Levels in mAOD to the nearest 0.1m
1990 (baseline)
2010 (1990 + 80mm
2025 (1990 + 140mm)
2055 (2025 + 255mm)
2085 (2055 + 360mm)
2115 (2085 + 450mm)
Calshot 2.9 3.0 3.0 3.3 3.7 4.1
Southampton 3.0 3.1 3.1 3.4 3.8 4.2
Lee-on-the Solent 3.0 3.1 3.1 3.4 3.8 4.2
Portsmouth Harbour 3.1 3.2 3.2 3.5 3.9 4.3
Langstone Harbour 3.2 3.3 3.3 3.6 4.0 4.4
Chichester Harbour 3.3 3.4 3.4 3.7 4.1 4.5
Table 7: 1 in 200 year tidal levels
Note: Levels in mAOD to the nearest 0.1m
1990 (baseline)
2010 (1990 + 80mm
2025 (1990 + 140mm)
2055 (2025 + 255mm)
2085 (2055 + 360mm)
2115 (2085 + 450mm)
Calshot 3.1 3.2 3.2 3.5 3.9 4.3
Southampton 3.2 3.3 3.3 3.6 4.0 4.4
Lee-on-the Solent 3.2 3.3 3.3 3.6 4.0 4.4
Portsmouth Harbour 3.3 3.4 3.4 3.7 4.1 4.5
Langstone Harbour 3.4 3.5 3.5 3.8 4.2 4.6
Chichester Harbour 3.5 3.6 3.6 3.9 4.3 4.7
Table 8: 1 in 1000 year tidal levels
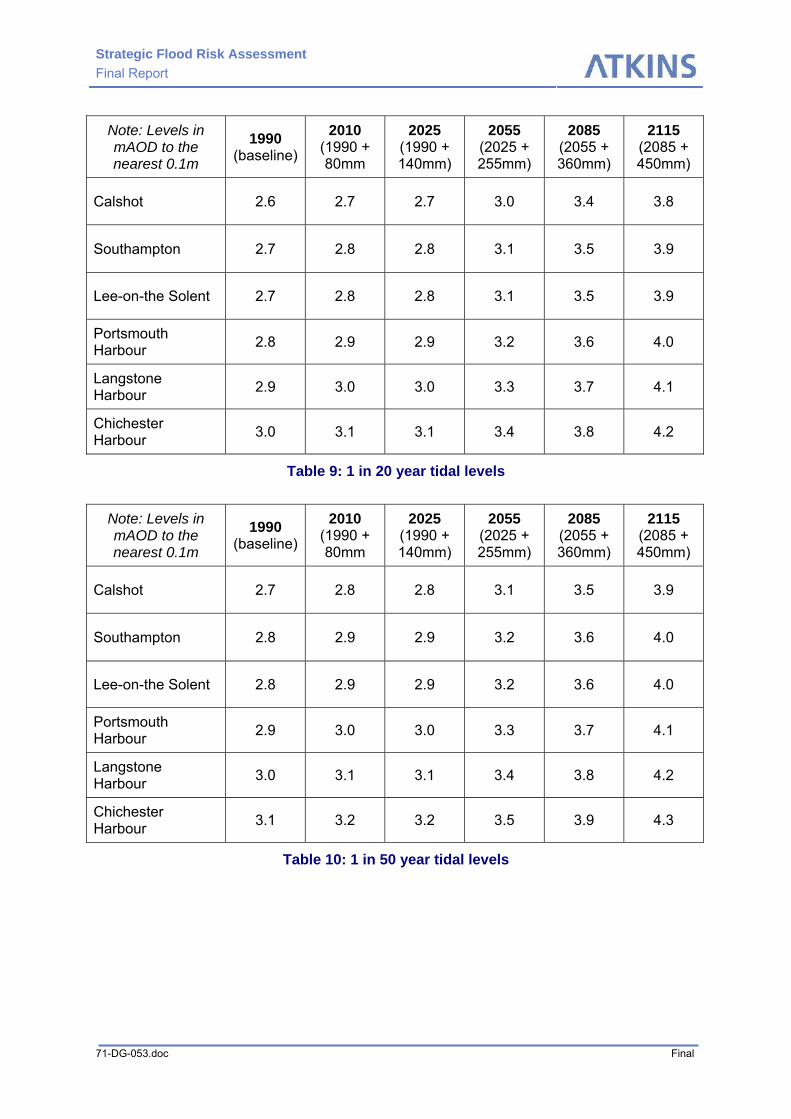
Strategic Flood Risk Assessment Final Report
71-DG-053.doc Final
Note: Levels in mAOD to the nearest 0.1m
1990 (baseline)
2010 (1990 + 80mm
2025 (1990 + 140mm)
2055 (2025 + 255mm)
2085 (2055 + 360mm)
2115 (2085 + 450mm)
Calshot 2.6 2.7 2.7 3.0 3.4 3.8
Southampton 2.7 2.8 2.8 3.1 3.5 3.9
Lee-on-the Solent 2.7 2.8 2.8 3.1 3.5 3.9
Portsmouth Harbour 2.8 2.9 2.9 3.2 3.6 4.0
Langstone Harbour 2.9 3.0 3.0 3.3 3.7 4.1
Chichester Harbour 3.0 3.1 3.1 3.4 3.8 4.2
Table 9: 1 in 20 year tidal levels
Note: Levels in mAOD to the nearest 0.1m
1990 (baseline)
2010 (1990 + 80mm
2025 (1990 + 140mm)
2055 (2025 + 255mm)
2085 (2055 + 360mm)
2115 (2085 + 450mm)
Calshot 2.7 2.8 2.8 3.1 3.5 3.9
Southampton 2.8 2.9 2.9 3.2 3.6 4.0
Lee-on-the Solent 2.8 2.9 2.9 3.2 3.6 4.0
Portsmouth Harbour 2.9 3.0 3.0 3.3 3.7 4.1
Langstone Harbour 3.0 3.1 3.1 3.4 3.8 4.2
Chichester Harbour 3.1 3.2 3.2 3.5 3.9 4.3
Table 10: 1 in 50 year tidal levels
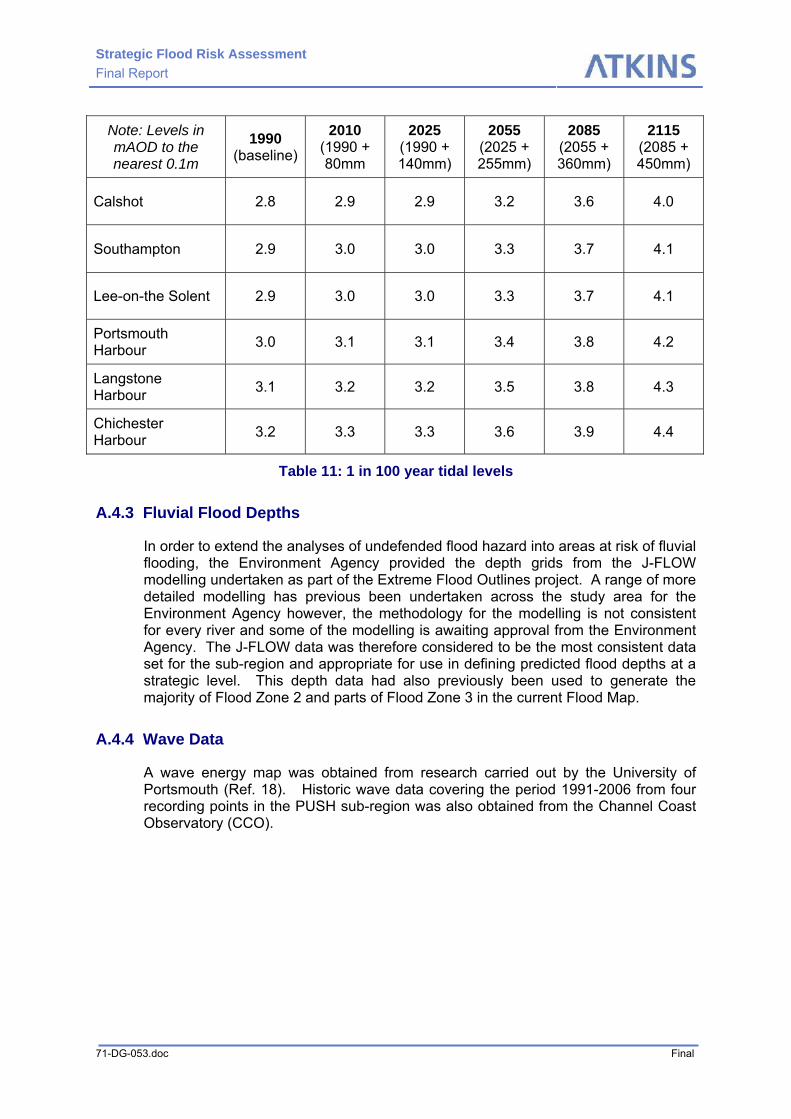
Strategic Flood Risk Assessment Final Report
71-DG-053.doc Final
Note: Levels in mAOD to the nearest 0.1m
1990 (baseline)
2010 (1990 + 80mm
2025 (1990 + 140mm)
2055 (2025 + 255mm)
2085 (2055 + 360mm)
2115 (2085 + 450mm)
Calshot 2.8 2.9 2.9 3.2 3.6 4.0
Southampton 2.9 3.0 3.0 3.3 3.7 4.1
Lee-on-the Solent 2.9 3.0 3.0 3.3 3.7 4.1
Portsmouth Harbour 3.0 3.1 3.1 3.4 3.8 4.2
Langstone Harbour 3.1 3.2 3.2 3.5 3.8 4.3
Chichester Harbour 3.2 3.3 3.3 3.6 3.9 4.4
Table 11: 1 in 100 year tidal levels
A.4.3 Fluvial Flood Depths
In order to extend the analyses of undefended flood hazard into areas at risk of fluvial flooding, the Environment Agency provided the depth grids from the J-FLOW modelling undertaken as part of the Extreme Flood Outlines project. A range of more detailed modelling has previous been undertaken across the study area for the Environment Agency however, the methodology for the modelling is not consistent for every river and some of the modelling is awaiting approval from the Environment Agency. The J-FLOW data was therefore considered to be the most consistent data set for the sub-region and appropriate for use in defining predicted flood depths at a strategic level. This depth data had also previously been used to generate the majority of Flood Zone 2 and parts of Flood Zone 3 in the current Flood Map.
A.4.4 Wave Data
A wave energy map was obtained from research carried out by the University of Portsmouth (Ref. 18). Historic wave data covering the period 1991-2006 from four recording points in the PUSH sub-region was also obtained from the Channel Coast Observatory (CCO).

Strategic Flood Risk Assessment Final Report
71-DG-053.doc Final
A.5 Flood Defence Data
Information on crest levels of flood defences was used to identify the indicative standard of protection afforded by the defences. Defence information is stored in a variety of locations. The main sources of information and the quality of this information are outlined in Table 12.
Detail Data Available Quality
Environment Agency
Defence information from the Environment Agency.
Location of defences & crest levels.
The quality of information is not recorded. Lack of coverage of the entire sub-region.
MoD
Coastal MoD sites are located in Gosport and Portsmouth. Due to the sensitive nature of these sites, information is not stored in standard databases.
Location of defences & crest levels.
The quality of information is not recorded. Data is the most up to date available.
Channel Coastal
Observatory
The data management and regional coordination centre for the Southeast Regional Coastal Monitoring Programme.
Location of defences & crest levels.
The quality of Information not recorded. Data is the most up to date available.
Individual council data
In some circumstances Local Authorities hold their own asset data base surveys.
Havant BC: Location of defence, crest level, condition, residual life and type Portsmouth CC: Location of defence, crest level, condition, residual life and type.
Comprehensive high quality data sets.
Reports
Defence information can be extracted from reports e.g. coastal protection schemes and coastal strategies.
Location of defences & crest levels (where available). Some reports also contain some information relating to defence condition.
Defence locations were digitised where grid references were stated or subjectively digitised where grid reference information not available. The availability and quality of defence data varied between each report/strategy.
Table 12: Sources and quality of defence information within the PUSH region
A detailed analysis of the available defence information was undertaken and a definitive dataset compiled using the most recent, up to date and reliable data. Unreliable information has been excluded.
Where there are no formal defences, it was possible that natural ground levels or topographic features provided a degree of protection. Using the PUSH topographical grid, spot heights of the ground were extracted along reaches where there was no

Strategic Flood Risk Assessment Final Report
71-DG-053.doc Final
defence data available. Spot levels are taken at the highest point adjacent to the coastline.
The coastal defence dataset generated as part of this SFRA is provided alongside the other mapping deliverables in a spreadsheet format.
A.6 Geology
British Geological Survey 1:50,000 scale data for solid and drift geology was obtained from Hampshire County Council using a complimentary licence for the duration of the PUSH SFRA.
A.7 Social Vulnerability Index
Social Vulnerability data was collected from the Modelling Decision Support Framework (MDSF) Database. The Social Flood Vulnerability Index (SFVI) was created in 2002 by the Flood Hazard Research Centre at Middlesex University as part of the Catchment Flood Management Planning initiative. The aim of the SFVI is to identify communities that are more vulnerable to the adverse health and social effects associated with floods. The SFVI is a composite, additive index based on four demographic variables which include:
• People aged 75 and over • People suffering from a long-term limiting illness • Lone parent households • Financially deprived households
There are 5 levels of social vulnerability as detailed in Table 13.
Social Flood Vulnerability Index Level of Vulnerability
1 Very Low 2 Low 3 Average 4 High 5 Very High
Table 13: Social Flood Vulnerability Index
SFVI data was available for the entire PUSH sub-region and has not been altered for the SFRA.
A.8 Defence Investment Information
The defence investment index presented in Output Package 3 is based on a draft database of capital unit costs being developed by Arup based on scheme out-turns for the Environment Agency.
The unit cost database is based on the assumption that the key factor in calculating the investment index is the difference in height between the desired level of defence and the actual level of defence. As the Unit Cost Database is in

Strategic Flood Risk Assessment Final Report
71-DG-053.doc Final
draft format for consultation, the approximate investment values are not given, and an investment index is stated based on Table 14.
Height Band Average of wall types ≤ 0 None
0 - 1.2m Low 1.2 - 2.1m Medium 2.1 - 5.3m High
>5.3m Very High
Table 14: Indicative Investment Indices based on defence height

Strategic Flood Risk Assessment Final Report
71-DG-053.doc Final
Appendix B: TECHNICAL METHODOLOGY

Left Blank for double sided print

Strategic Flood Risk Assessment Final Report
71-DG-053.doc Final
B.1 Introduction
The technical methodologies used to generate data for the PUSH SFRA Output Packages have been undertaken in line with Defra guidelines, best practice guidance and were subject to review by the Environment Agency and the PUSH Steering Group. This appendix describes the detail of the methods used to generate each of those Output Packages which involved manipulation of existing datasets or production of new data sets.
B.2 Output Package 1
B.2.1 Map Set 1A: Flood Zones
The latest version of the Environment Agency ‘Flood Map’ and supplementary data were used to provide the spatial extent of all four Flood Zones specified in PPS25 (Flood Zones 1, 2, 3a and 3b).
The Flood Map breaks down the Flood Zones further in terms of source of flooding, differentiating between those areas where flooding occurs due to fluvial (river) processes, tidal process or both, where specific modelling is available to inform such a categorisation. The SFRA has maintained the Environment Agency designation of the Flood Zones in this way. The Flood Map does not differentiate between Flood Zones 3a and 3b, however. For this SFRA, the Environment Agency has provided limited data to inform the designation of Flood Zone 3b.
Flood Zone 3b, the functional floodplain, is land where water has to flow or be stored in times of flood. This includes flow conveyance routes and flood storage areas. These areas are primarily important in fluvial floodplains as the loss of these areas results in the displacement of flood water to areas that may otherwise not flood. This definition of Flood Zone 3b is not relevant to coastal floodplains as reduction in flood storage in these areas would not cause water to be displaced elsewhere. The PPS25 Practice Guide states that Flood Zone 3b should be defined by the 1 in 20 year fluvial flood outline.
In the absence of full modelled 1 in 20 year outlines The Environment Agency recommended the following method for designating Flood Zone 3b:
• River Wallington and Tadburn Lake Stream, Romsey: Flood Zone 3b is defined by modelled 1 in 25 year fluvial flood extents. This is in the absence of modelled 1 in 20 year flood outlines in line with the recommendations in the PPS25 Practice Guide.
• River Test at Romsey and the River Meon: Flood Zone 3b is defined by observed historic flood extents provided by the Environment Agency. No information was provided as to the likely return period of these observed flood events.
• For all other main rivers: Flood Zone 3b is defined as the entire extent of Flood Zone 3 provided in the Environment Agency Flood Map. This recommendation by the Environment Agency was made based on section 3.17 of the PPS25 Practice Guide which states: “All areas within Zone 3 should be considered as Zone 3b (Functional Floodplain) unless, or until, an appropriate FRA shows to the satisfaction of the
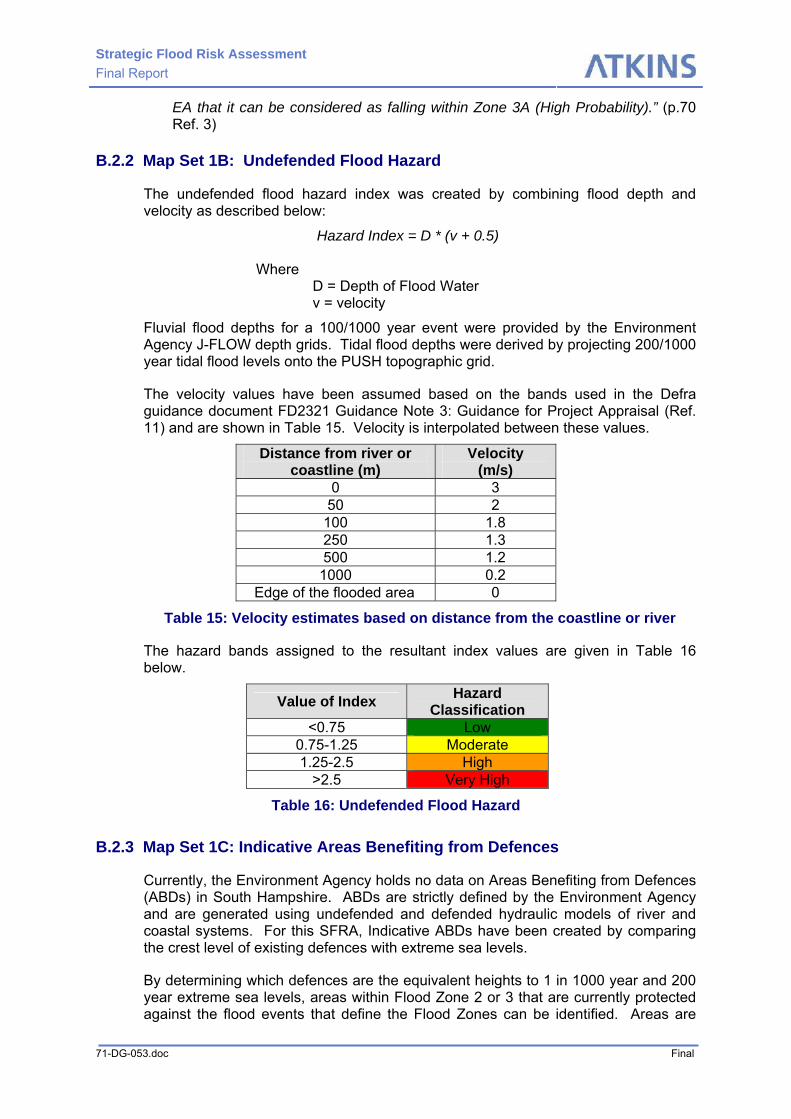
Strategic Flood Risk Assessment Final Report
71-DG-053.doc Final
EA that it can be considered as falling within Zone 3A (High Probability).” (p.70 Ref. 3)
B.2.2 Map Set 1B: Undefended Flood Hazard
The undefended flood hazard index was created by combining flood depth and velocity as described below:
Hazard Index = D * (v + 0.5)
Where D = Depth of Flood Water v = velocity
Fluvial flood depths for a 100/1000 year event were provided by the Environment Agency J-FLOW depth grids. Tidal flood depths were derived by projecting 200/1000 year tidal flood levels onto the PUSH topographic grid.
The velocity values have been assumed based on the bands used in the Defra guidance document FD2321 Guidance Note 3: Guidance for Project Appraisal (Ref. 11) and are shown in Table 15. Velocity is interpolated between these values.
Distance from river or coastline (m)
Velocity (m/s)
0 3 50 2
100 1.8 250 1.3 500 1.2
1000 0.2 Edge of the flooded area 0
Table 15: Velocity estimates based on distance from the coastline or river
The hazard bands assigned to the resultant index values are given in Table 16 below.
Value of Index Hazard Classification
<0.75 Low 0.75-1.25 Moderate 1.25-2.5 High
>2.5 Very High
Table 16: Undefended Flood Hazard
B.2.3 Map Set 1C: Indicative Areas Benefiting from Defences
Currently, the Environment Agency holds no data on Areas Benefiting from Defences (ABDs) in South Hampshire. ABDs are strictly defined by the Environment Agency and are generated using undefended and defended hydraulic models of river and coastal systems. For this SFRA, Indicative ABDs have been created by comparing the crest level of existing defences with extreme sea levels.
By determining which defences are the equivalent heights to 1 in 1000 year and 200 year extreme sea levels, areas within Flood Zone 2 or 3 that are currently protected against the flood events that define the Flood Zones can be identified. Areas are

Strategic Flood Risk Assessment Final Report
71-DG-053.doc Final
only displayed if the entire frontage of a connected cell of flood water as displayed in the undefended Environment Agency Flood Zone flood maps are protected to these standards. If there is a single element or point of the defence line where the defences are lower than the 1 in 200 year extreme sea levels, the cell is not shown as an Indicative ABD, although it is recognised that in such cases, a more detailed assessment may identify further areas that benefit from the defences. It is important to note that the Indicative ABDs highlight those areas which are defended from extreme sea levels that define the Flood Zones. They do not imply that areas behind defences that have not been identified as indicative ABDs do not benefit from defences to some degree.
This method takes no account or wave overtopping or a freeboard allowance. There are no large scale flood defences on rivers which protect against extreme, i.e. 1 in 100 to 1,000 year, fluvial flooding, hence Indicative ABDs have only been shown for tidal areas.
B.2.4 Map Set 1D: Defended Danger to People from Breaching
The methodology for identifying the danger from breaching behind existing defences has been adapted from the method described in ‘Flood Risk Assessment Guidance for New Development, Phase 2 R&D Technical report’ FD2320 (Ref 8). Given the size of the PUSH sub-region and the extent of flood defences within the sub-region, the assessment has been undertaken at a sub-regional scale. This level of assessment is synonymous with the ‘Simple’ approach identified by FD2320. The simple approach identifies the consequence of breaching and does not assess the probability of occurrence. The findings of this assessment should be used as an initial guide and useful information to inform LPAs of where a more detailed approach is required.
Since the data collated for defences in the PUSH region did not identify any fluvial defences which provide a standard of protection equal to or above the magnitude of event that defines Flood Zone 3 (i.e. 1 in 100 years), the breaching hazard assessment has not been completed for fluvial flood defences.
The breach hazard assessment assumes that there is a continuous breach in the coastal defences and determines the danger to people as a consequence of a breach according to the depth of water at different perpendicular distances from the defence line. The fundamental principle is that the closer to the defence, the higher the danger to people for a specific depth of flood water.
The categorisation of the depths of water relating to the proximity to the defence is detailed in Table 17, which also indicates how the methodology for assessing the level of danger as a result of a breach described in FD2320 has been simplified.
Water level above ground level (m) Distance from
Breach (m) Danger to some Danger to most Danger to all
0 -100 0-0.5 0.5-1 1-6 100 - 250 0-1 1-2 2-6 250 - 500 0.5-1 1-2 2-6 500 -1000 0.5-2 2-3 3-6
1000 -1500 1-2 2-4 4-6
Table 17: Index for Assessing Danger to People from Defence Breaching

Strategic Flood Risk Assessment Final Report
71-DG-053.doc Final
Where the ‘danger’ is further defined as follows (Ref 8: FD2320):
• Danger for some – includes children, the elderly and the infirm. • Danger for most – includes the general public • Danger for all – includes emergency services
B.2.5 Map Set 1E: Climate Change Outlines
Climate change outlines were produced for four time horizons: 2025, 2055, 2085 and 2115. These time horizons were selected by the PUSH steering group to coincide with the latest climate change guidance relating to sea level rise and increasing river flow in PPS25 (Ref. 2).
Tidal climate change outlines were generated by applying the extreme water levels (which are detailed in A.4.2 and provided in full in Appendix E: ) to the PUSH sub-region topographic grid (detailed in A.2). The methodology used to create the tidal outlines was specified by the Environment Agency and detailed as follows:
• A water surface grid was created for the PUSH sub-region by applying the extreme water levels to sea level polygons provided by the Environment Agency.
• The topographic grid was subtracted from the water surface grid, resulting in a flood depth grid, where positive values denote a flooded area.
• The flood depth grid was reclassified, to produce a polygon layer of ‘flooded’ and ‘non-flooded’ areas. This layer was updated with the area of each individual polygon.
• Following current Environment Agency Flood Mapping policy, dry or ‘non-flooded’ polygons with areas less than 200m² were set as flooded. Conversely, flooded polygons with areas less than 5m² were removed and not shown as flooded.
It was not possible to create fluvial climate change outlines in a similar manner and no suitable dataset existed to represent the effects of the stated 20% increase in fluvial flood flows predicted to result from climate change. The Environment Agency stated that the climate change Flood Zone 3 (the 1 in 100 year flood extent) should be represented by the present day Flood Zone 2 (the 1 in 1000 year flood extent). This approach meant that it was not possible to define a climate change fluvial Flood Zone 2. It should be noted that although this is a broad generalisation, it represents the best available approximation of the effects of climate change on fluvial flood flows in the absence of suitable climate change modelling for the fluvial catchments in South Hampshire.
B.2.6 Map Set 1F: Other Sources of Flooding
B.2.6.1 1F-1: Wave Overtopping
Map Set 1F-1 was based on the wave energy map for the Solent produced by Portsmouth University (Ref. 18). No changes were made to this dataset, but its findings were verified by using wave height data from the Channel Coast Observatory (CCO) at four locations along the PUSH sub-region coastal frontage from 1991-2002. Table 18 lists the maximum and average wave heights recorded at these four locations. In common with the wave energy map, Gilkicker Point and Lee-on-the-Solent, located on frontages classified as experiencing ‘moderate wave

Strategic Flood Risk Assessment Final Report
71-DG-053.doc Final
energy’, recorded higher maximum and average wave heights than Netley and Hamble Point, which are located on ‘low water energy’ frontages.
Location Maximum Wave Height (m) Average Wave Height (m)
Netley 0.96 0.17
Hamble Point 0.88 0.16
Gilkicker Point 2.58 0.29
Lee-on-the-Solent 1.42 0.26
Table 18: CCO Wave Heights 1991-2002
B.2.6.2 1F-2: Groundwater Flooding
The Environment Agency provided a GIS layer showing locations of previous groundwater flooding incidents in the sub-region. This layer provided further evidence that most incidents of groundwater flooding occurred near to the boundary of the chalk formations which underlie much of Hampshire to the north of the PUSH sub-region. To further illustrate this, the British Geological Survey (BGS) 1:50,000 bedrock geology data was classified for the PUSH sub-region based on the relative permeability of each rock type. This meant that the PUSH sub-region was subdivided almost equally between the following permeability classifications: low, moderate and high. Table 19 lists the permeability classification for each bedrock type found in the sub-region. Map Set 1F-2 presents this bedrock permeability classification and can be used to conclude that development adjacent to the highly permeable geology in the north of the sub-region should take account of the potential risk of groundwater flooding.

Strategic Flood Risk Assessment Final Report
71-DG-053.doc Final
Bedrock Formation Relative Permeability
Barton Clay Low
Becton/Chama Sand Moderate
Bognor Sand Moderate
Durley Sand Moderate
Earnley Sand Moderate
Headon Formation Low
London Clay Low
Lambeth Group Moderate
Lewes Nodular Chalk High
Marsh Farm Formation Low
Newhaven Chalk High
Nursling Sand Low
Portsdown Chalk High
Portsmouth Sand Moderate
Seaford Chalk High
Selsey Sand Moderate
Spetisbury Chalk High
Tarrant Chalk High
Whitecliff Sand High
Wittering Formation Moderate
Table 19: Bedrock Permeability Classification
B.2.6.3 1F-3: Impact of Land Use Change on Surface Water Runoff
In order to allow for the contribution of existing surface permeability to the assessment of current rates of surface water runoff, the BGS superficial geology data was also classified into low, moderate and high permeability classes, based on their relative permeability in the sub-region. This was then combined with the classified bedrock geology, such that where notable superficial deposits where not present, the bedrock geology permeability classification was used. It is important to note that this high-level analysis did not take into account the effects of the permeability of bedrock geology beneath superficial deposits where they existed. Table 20 below lists the superficial geology permeability classification for each type of superficial deposit found in the PUSH sub-region.

Strategic Flood Risk Assessment Final Report
71-DG-053.doc Final
Superficial Deposits Relative Permeability
Peat Low
Alluvium Low
Blown sand Moderate
Channel-fill deposits High
Clay-with-flints Low
Head Low
Raised beach deposits Moderate
Raised marine deposits Moderate
Storm beach deposits High
Beach deposits Low
Tidal flat deposits Low
River terrace deposits Medium / High (depending on composition)
Tufa Moderate
Table 20: Superficial Deposits Permeability Classification
Existing developed areas, where a change in land use is unlikely to significantly affect the surface water runoff regime, are shown as hatched in Map Set 1F-3. The resultant index shows the relative impact of developing on Greenfield areas based on the change in runoff rates before and after development.
B.2.6.4 1F-4: Potential Sources of Overland Flow
Map Set 1F-4 was designed to indicate the variation in potential sources of overland flow in the PUSH sub-region. Three components were used:
• Surface Permeability Index (developed as part of 1F-3 above) • Existing Developed Area Layer • Assessment of topographic slope
The surface permeability index from 1F-3 was reversed to take account of runoff from the land surface and was updated to include the existing developed areas, which were given a new classification, very high. The assessment of topographic slope was carried out on the PUSH topographic grid at a 50m resolution. Relative to the sub-region, the topography was divided into three equally sized classes, designated as having low, moderate and high slopes values. The two indices were combined to form a ‘Potential Sources of Overland Flow Index’ based on the table below.
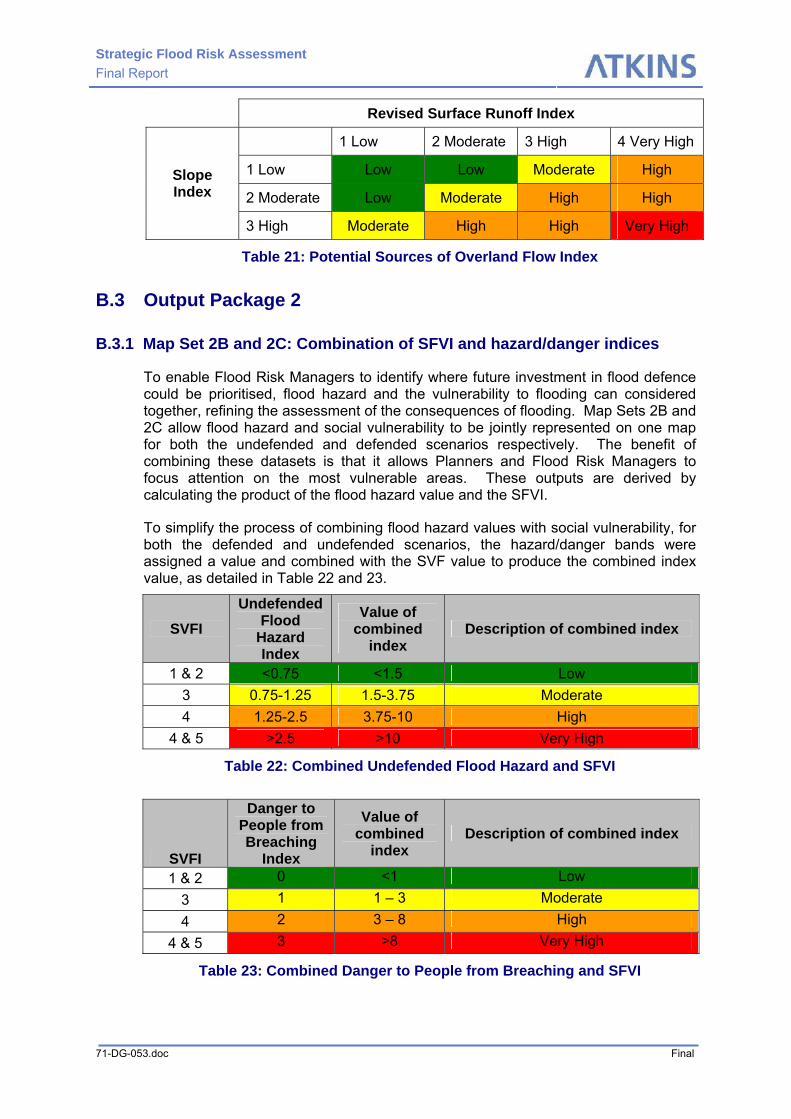
Strategic Flood Risk Assessment Final Report
71-DG-053.doc Final
Revised Surface Runoff Index
1 Low 2 Moderate 3 High 4 Very High
1 Low Low Low Moderate High
2 Moderate Low Moderate High High Slope Index
3 High Moderate High High Very High
Table 21: Potential Sources of Overland Flow Index
B.3 Output Package 2
B.3.1 Map Set 2B and 2C: Combination of SFVI and hazard/danger indices
To enable Flood Risk Managers to identify where future investment in flood defence could be prioritised, flood hazard and the vulnerability to flooding can considered together, refining the assessment of the consequences of flooding. Map Sets 2B and 2C allow flood hazard and social vulnerability to be jointly represented on one map for both the undefended and defended scenarios respectively. The benefit of combining these datasets is that it allows Planners and Flood Risk Managers to focus attention on the most vulnerable areas. These outputs are derived by calculating the product of the flood hazard value and the SFVI.
To simplify the process of combining flood hazard values with social vulnerability, for both the defended and undefended scenarios, the hazard/danger bands were assigned a value and combined with the SVF value to produce the combined index value, as detailed in Table 22 and 23.
SVFI Undefended
Flood Hazard Index
Value of combined
index Description of combined index
1 & 2 <0.75 <1.5 Low 3 0.75-1.25 1.5-3.75 Moderate 4 1.25-2.5 3.75-10 High
4 & 5 >2.5 >10 Very High
Table 22: Combined Undefended Flood Hazard and SFVI
SVFI
Danger to People from Breaching
Index
Value of combined
index Description of combined index
1 & 2 0 <1 Low 3 1 1 – 3 Moderate 4 2 3 – 8 High
4 & 5 3 >8 Very High
Table 23: Combined Danger to People from Breaching and SFVI

Strategic Flood Risk Assessment Final Report
71-DG-053.doc Final
B.4 Output Package 3
B.4.1 Map Set 3A and 3C: Present Day Defence Crest Levels
The equivalent tidal return period of the existing defence crest levels was calculated for the coastline of the PUSH sub-region by comparing the crest level of the defence/natural ground to the range of extreme sea level return periods for both 2010 and 2115, provided by the Environment Agency’s (See Appendix A). Each length of defence or natural ground defence was then allocated an equivalent surge tide return period.
The assessment was based solely on a comparison of the crest/natural ground level with extreme sea levels and does not take account of the following:
• Defence type. • Defence age, condition and residual life. • Freeboard allowance built into the design of the defences. • The potential for wave overtopping of the defences.
The assessment therefore, does not provided information on the standard of service provided by existing defences.
B.4.2 Map Set 3B and 3D: Investment indices to provide protection to a 1 in 200 year level
The difference between the actual defence crest level 1 in 200 year extreme sea levels for 2010 (present day) and 2115 was used to calculate the investment index. The shortfall is categorised based on the developing unit cost database detailed in Appendix A. The unit cost database is based on the assumption that the key factor in calculating the investment index is the difference in height between the desired level of defence and the actual level of defence.

Left Blank for double sided print

Strategic Flood Risk Assessment Final Report
71-DG-053.doc Final
Appendix C: LOCAL AUTHORITY GUIDANCE NOTES

Left Blank for double sided print

Strategic Flood Risk Assessment Final Report
71-DG-053.doc Final
Appendix D: TECHNICAL NOTE ON FUTURE DEFENCE STANDARDS

Left Blank for double sided print
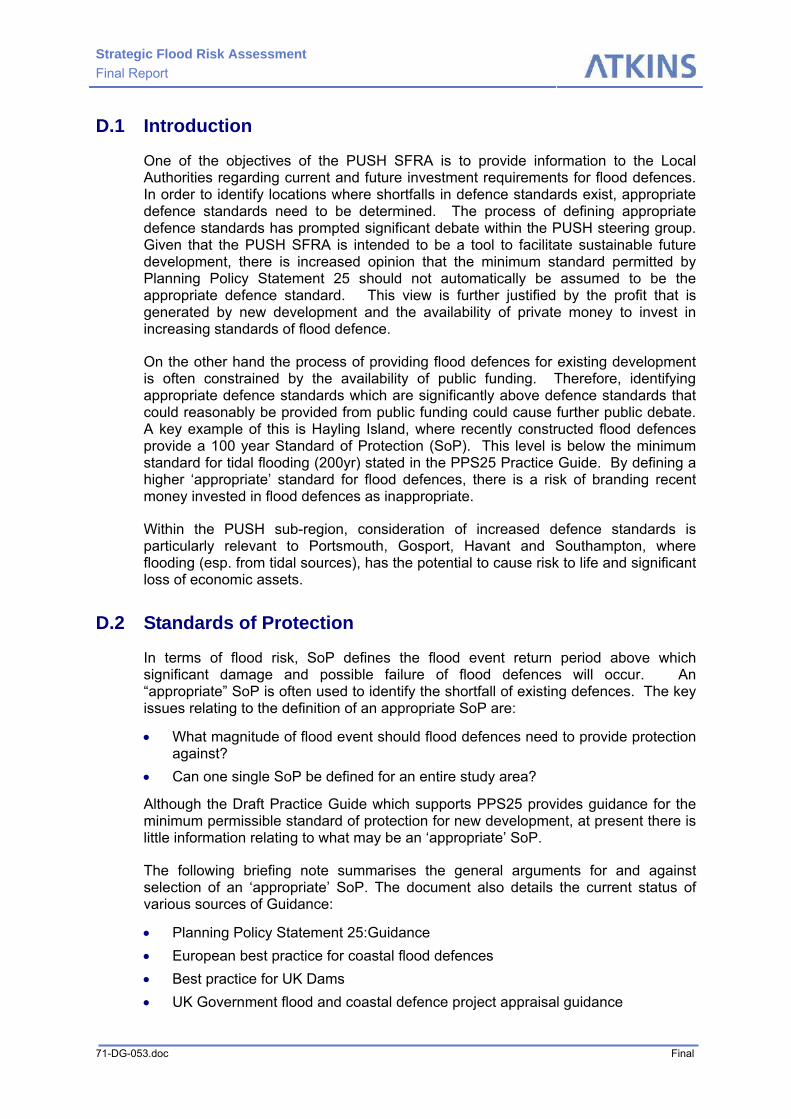
Strategic Flood Risk Assessment Final Report
71-DG-053.doc Final
D.1 Introduction
One of the objectives of the PUSH SFRA is to provide information to the Local Authorities regarding current and future investment requirements for flood defences. In order to identify locations where shortfalls in defence standards exist, appropriate defence standards need to be determined. The process of defining appropriate defence standards has prompted significant debate within the PUSH steering group. Given that the PUSH SFRA is intended to be a tool to facilitate sustainable future development, there is increased opinion that the minimum standard permitted by Planning Policy Statement 25 should not automatically be assumed to be the appropriate defence standard. This view is further justified by the profit that is generated by new development and the availability of private money to invest in increasing standards of flood defence.
On the other hand the process of providing flood defences for existing development is often constrained by the availability of public funding. Therefore, identifying appropriate defence standards which are significantly above defence standards that could reasonably be provided from public funding could cause further public debate. A key example of this is Hayling Island, where recently constructed flood defences provide a 100 year Standard of Protection (SoP). This level is below the minimum standard for tidal flooding (200yr) stated in the PPS25 Practice Guide. By defining a higher ‘appropriate’ standard for flood defences, there is a risk of branding recent money invested in flood defences as inappropriate.
Within the PUSH sub-region, consideration of increased defence standards is particularly relevant to Portsmouth, Gosport, Havant and Southampton, where flooding (esp. from tidal sources), has the potential to cause risk to life and significant loss of economic assets.
D.2 Standards of Protection
In terms of flood risk, SoP defines the flood event return period above which significant damage and possible failure of flood defences will occur. An “appropriate” SoP is often used to identify the shortfall of existing defences. The key issues relating to the definition of an appropriate SoP are:
• What magnitude of flood event should flood defences need to provide protection against?
• Can one single SoP be defined for an entire study area?
Although the Draft Practice Guide which supports PPS25 provides guidance for the minimum permissible standard of protection for new development, at present there is little information relating to what may be an ‘appropriate’ SoP.
The following briefing note summarises the general arguments for and against selection of an ‘appropriate’ SoP. The document also details the current status of various sources of Guidance:
• Planning Policy Statement 25:Guidance • European best practice for coastal flood defences • Best practice for UK Dams • UK Government flood and coastal defence project appraisal guidance

Strategic Flood Risk Assessment Final Report
71-DG-053.doc Final
• Association of British Insurers guidelines on acceptable standards • South West Regional Assembly (SWRA) SFRA Guidance Note. To our
knowledge, no guidelines are available from the South East England Regional Assembly (SEERA).
• Information regarding ‘appropriate’ standards of protection identified in recently published SFRAs, where available.
• Current Environment Agency Guidance
D.3 The basis for an ‘appropriate’ Standard of Protection
Arguments for one single SoP
• A standardised approach SoP to flood defences across the PUSH region. • Allows easy identification of areas of ‘shortfall’. • Sets a clear policy for all involved • Increases public confidence in flood defences
Arguments against one single SoP
The different vulnerability of land and people behind defences mean different SoPs may be required e.g. a sparsely populated agricultural site will warrant a lower SoP than a densely populated urban area. Determining factors include:
• Different land uses behind defence • Different number of people and population density • Different economic impact of inundation • Single SoP takes little account of value for money • Can lead to out-of-date or inappropriate safety levels if not refined regularly • Variable decisions based on economic efficiency can be flexible and adapt to a
changing environment.
D.4 Planning Policy Statement 25: Development and Flood Risk
The draft Practice Guide which supports PPS25 states that the minimum acceptable standard of protection for new developments should be:
• 100 years (1% annual probability) for fluvial flooding • 200 years (0.5% annual probability) for coastal flooding
including allowances for climate change.
The guidance also states that wherever a greatly increased standard of protection can be achieved at little extra cost, then such opportunities should always be taken.
D.5 Standard of Protection in other European countries
Table 1 below presents information on available international standards. Countries neighbouring the North Sea have set up a coastal management team to monitor their flood risk. They are preparing for a transition to a risk based flood protection scheme.
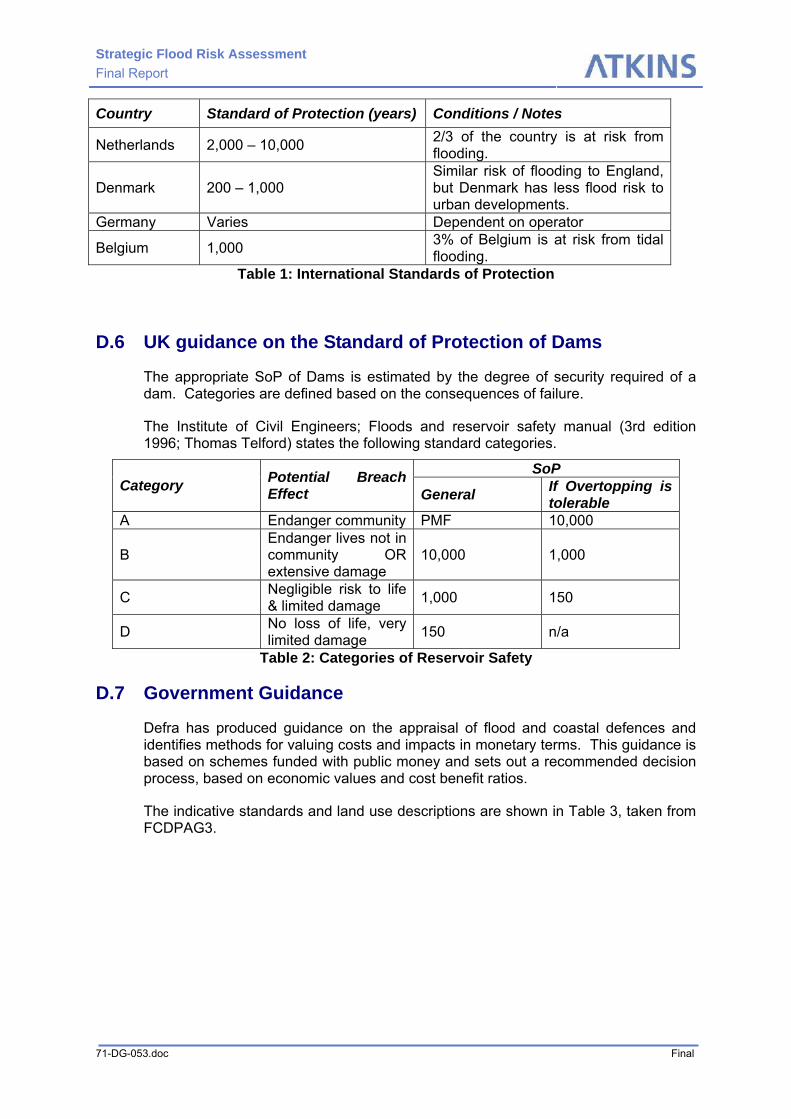
Strategic Flood Risk Assessment Final Report
71-DG-053.doc Final
Country Standard of Protection (years) Conditions / Notes
Netherlands 2,000 – 10,000 2/3 of the country is at risk from flooding.
Denmark 200 – 1,000 Similar risk of flooding to England, but Denmark has less flood risk to urban developments.
Germany Varies Dependent on operator
Belgium 1,000 3% of Belgium is at risk from tidal flooding.
Table 1: International Standards of Protection
D.6 UK guidance on the Standard of Protection of Dams
The appropriate SoP of Dams is estimated by the degree of security required of a dam. Categories are defined based on the consequences of failure.
The Institute of Civil Engineers; Floods and reservoir safety manual (3rd edition 1996; Thomas Telford) states the following standard categories.
SoP Category Potential Breach
Effect General If Overtopping is tolerable
A Endanger community PMF 10,000
B Endanger lives not in community OR extensive damage
10,000 1,000
C Negligible risk to life & limited damage 1,000 150
D No loss of life, very limited damage 150 n/a
Table 2: Categories of Reservoir Safety
D.7 Government Guidance
Defra has produced guidance on the appraisal of flood and coastal defences and identifies methods for valuing costs and impacts in monetary terms. This guidance is based on schemes funded with public money and sets out a recommended decision process, based on economic values and cost benefit ratios.
The indicative standards and land use descriptions are shown in Table 3, taken from FCDPAG3.

Strategic Flood Risk Assessment Final Report
71-DG-053.doc Final
Table 3: Indicative standards from FCDPAG3 (MAFF, 1999)
D.8 Insurance
The Association of British Insurers (ABI) submitted a ‘Flooding in London - A London Assembly Scrutiny Report Follow Up Review’ in 2004.
The report states that:
“the minimum level of protection that would enable insurers to offer cover at normal terms for residential properties is a 0.5 % annual probability of flooding (200 years), after taking climate change into account.”
Furthermore, the ABI have also undertaken a research study, Coastal Flood Risk – Thinking for Tomorrow, Acting for Today (2006). The study uses an insurance catastrophe model to examine the effects of a rise in sea levels on flood risk and assesses the need for further spending on coastal flood defences in eastern England. The study used the following SoP assumptions which were based on the highest (“World Markets”) flood protection targets used in the Foresight Future Flooding study. The standards included:
• Rural areas defended to a minimum 1:50 year Standard of Protection (SoP); • Small towns defended to a minimum 1:200 year SoP; • Larger towns defended to a minimum 1:500 year SoP; • Strategically important areas such as the Thames Estuary defended to
1:10,000 year SoP.

Strategic Flood Risk Assessment Final Report
71-DG-053.doc Final
D.9 South West Regional Assembly- SFRA Guidance Note
As part of the South West Regional Flood Risk Assessment, a guidance note for undertaking SFRAs was prepared.
Although there is no description of what an ‘appropriate’ standard of defence is, the SFRA guidance note states that the “extent and cost of works required to raise the flood defence standard to 1% (100 year)” should be calculated. The guidance note does not differentiate between coastal and fluvial flood defence standards.
D.10 Standard of Protections for London & the South East
Thames Barrier & Associated Gates
When the Thames Barrier was designed, it was considered that the consequences of tidal flooding to London had sufficient risks to life and significant risks of economic losses, that the Barrier should be designed to provide a 1000 year SoP, up to the year 2030.
Kent Thameside SFRA
Within Kent Thameside, the level of protection provided by the Thames Tidal Defences is generally very high at 1 in 1000 years. The guidance notes that support the Kent Thameside SFRA states:
‘The level of defence that is required for a particular area is generally commensurate with the risk associated with the defence being overwhelmed. It is the responsibility of those proposing development to demonstrate, by undertaking an appropriate assessment to show that the development will be acceptably safe, in terms of flood risk, throughout its lifetime.‘
Thames Gateway South Essex SFRA
An ‘appropriate’ standard of protection was not recommended in the Thames Gateway South Essex SFRA. However, existing defences, as a standard, provide protection up to a 1 in 1000 year event.
D.11 Environment Agency Advice
In the majority of cases across England, the Environment Agency requires residential developments to be protected to a minimum standard of 1 in 100 years from fluvial flooding and 1 in 200 years from tidal flooding. It is Environment Agency policy to encourage new development that manages current residual risks through the incorporation of a suite of measures within the design of the site, and discourage a sole reliance on primary defences to manage flood risk.
D.12 Summary
The transparency of the decisions process for adopting an ‘appropriate’ standard of protection needs to be reasoned and based on sound guidance. In the absence of time in which to fully consider these issues and agree a way forward, we would recommend that the SFRA takes a simple planning approach to identifying flood defence shortfalls. This being to avoid using the word ‘appropriate’ and undertake

Strategic Flood Risk Assessment Final Report
71-DG-053.doc Final
the investment assessment based on the minimum standards required for new development under PPS25 (i.e. 100 yr fluvial, 200yr coastal). Ultimately, the SFRA is a tool to facilitate the local planning process, so keeping the approach simple and consistent with the PPS25, will provide the least amount of ambiguity and scope for misinterpretation.
Whilst we have undertaken this review and provided the Steering Group with our recommendations for this element of the SFRA, we recognise that the final decision regarding the appropriate SoP for the investment assessment lies with the Local Authorities.
Strategic Flood Risk Assessment Final Report
71-DG-053.doc Final
Appendix E: ENVIRONMENT AGENCY EXTREME WATER LEVELS

Left Blank for double sided print

!(
!(
!(
!(
!(
!(
!(
8 9
7
15
1113
14
5
110
12
6
10
zone7
zone6
zone9
zone8
zone5zone4
Soton
zone13
zone11
zone16zone15
zone14
zone12zone10
Calshot
Portmouth
Lymington
Location of Analysed Tide Level Stations and Interpolated Zones
±Notes: Distance between tidal zone nodesequates to 100mm difference in tide level.
Date: 01/06/2007Prepared by Flood Risk MappingAnd Data Management Team(Tony Burch and Stefan Laeger)
LegendLocation Station
Interpolated node!( primary sea level recorder station!( projected primary sea level recorder station
Line of interpolationTidal Zones

Left Blank for double sided print

Col 1 Col 1a Col.2 Col.2a Col.3 Col.4 Col.5 Col.5A Col 6 Col. 7 Col. 8 Col. 9 Col. 10
Location Tidal Zone Km Km
at 2000
from
Table 4
(2)
at 2000
from
Appx. B
(3)
at 1990
adjusted
from Appx.
B (4)
1990
BASELINE
(Col. 5 to 1
decimal place)
2010
(1990 +80mm)
2025 (1990
+ 140mm)
2055
(2025 + 255mm)
2085
(2055 +
360mm)
2115
(2085 +
450mm)
Bournemouth 1 0.00 2.0 1.96 1.90 1.9 2.0 2.0 2.3 2.7 3.1
Southbourne 2 4.50 2.0 2.1 2.1 2.4 2.7 3.2
Hengisbury Head 3 9.00 2.1 2.1 2.2 2.5 2.8 3.3
Barton on Sea 4 13.50 2.2 2.2 2.3 2.5 2.9 3.4
Milford on Sea 5 18.00 2.2 2.3 2.4 2.6 3.0 3.4
Hurst Castle 6 22.50 2.3 2.4 2.5 2.7 3.1 3.5
Lymington 7 27.00 0.00 n/a 2.50 2.44 2.4 2.5 2.5 2.8 3.2 3.6
Thornes Beach 8 4.50 2.5 2.6 2.7 2.9 3.3 3.7
Needs Ore Point 9 9.00 2.7 2.7 2.8 3.0 3.4 3.9
Stansore Point 10 13.50 2.8 2.9 2.9 3.2 3.5 4.0
Calshot 11 0.00 18.00 3.0 2.96 2.90 2.9 3.0 3.0 3.3 3.7 4.1
Lee on Solent/Gosport 12 7.50 3.0 3.1 3.1 3.4 3.8 4.2
Portsmouth (harbour) 13 15.00 0.00 3.1 3.13 3.07 3.1 3.2 3.2 3.5 3.9 4.3
Langstone Harbour 14 4.25 3.2 3.3 3.3 3.6 4.0 4.4
Chister Harbour 15 8.50 3.3 3.4 3.4 3.7 4.1 4.5
West Wittering 16 12.75 3.4 3.5 3.5 3.8 4.2 4.6
Bracklesham 17 17.00 3.5 3.6 3.6 3.9 4.3 4.7
West Selsy Bill 18 21.25 3.6 3.7 3.7 4.0 4.4 4.8
East Selsy Bill 19 25.50 3.7 3.8 3.8 4.1 4.5 4.9
Pagham 20 29.75 3.8 3.9 3.9 4.2 4.6 5.0
Bognor Regis 21 34.00 3.9 4.0 4.0 4.3 4.7 5.1
Middleton on Sea 22 38.25 4.0 4.1 4.1 4.4 4.8 5.2
Littlehampton 23 42.50 4.1 4.12 4.06 4.1 4.2 4.2 4.5 4.9 5.3
Southampton 110 3.0 3.03 2.97 3.0 3.1 3.1 3.4 3.8 4.2
Prepared by Flood Risk Mapping and Data Management (Tony Burch and Stefan Laeger)
Date: 01 June 2007
200 year tidal level for Analysed Sites (in grey) and intermediate tidal zones
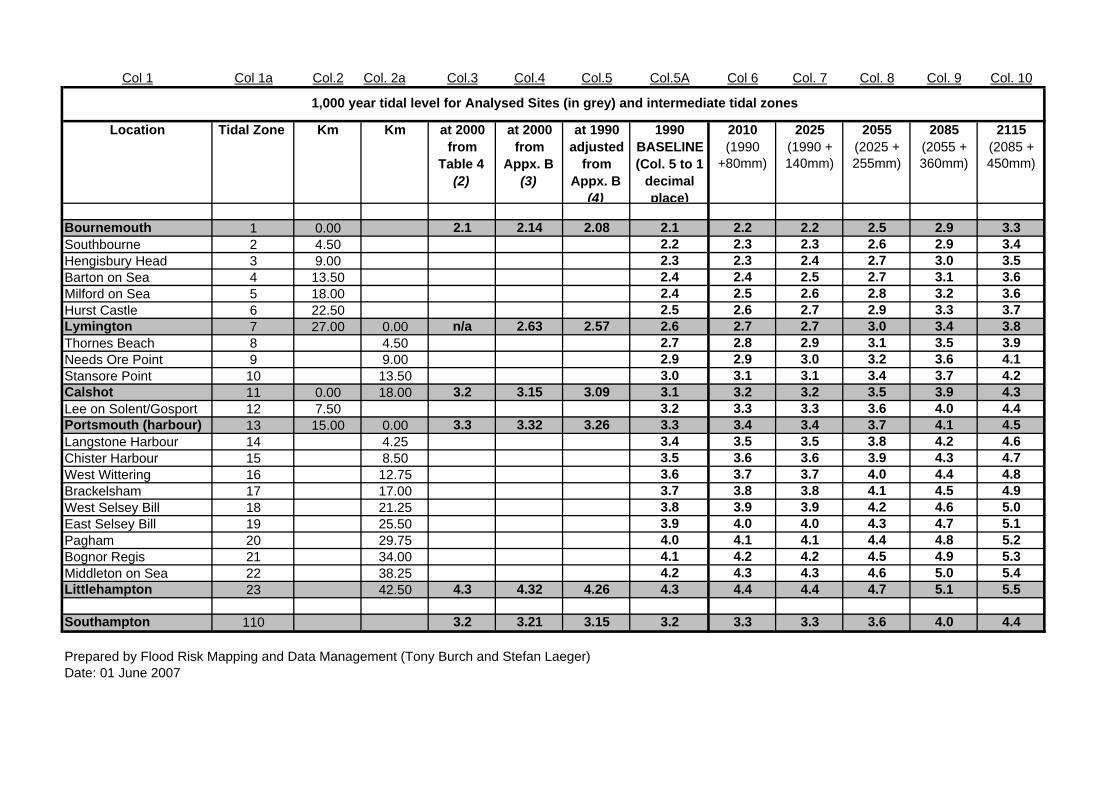
Col 1 Col 1a Col.2 Col. 2a Col.3 Col.4 Col.5 Col.5A Col 6 Col. 7 Col. 8 Col. 9 Col. 10
Location Tidal Zone Km Km at 2000
from
Table 4
(2)
at 2000
from
Appx. B
(3)
at 1990
adjusted
from
Appx. B
(4)
1990
BASELINE
(Col. 5 to 1
decimal
place)
2010
(1990
+80mm)
2025
(1990 +
140mm)
2055
(2025 +
255mm)
2085
(2055 +
360mm)
2115
(2085 +
450mm)
Bournemouth 1 0.00 2.1 2.14 2.08 2.1 2.2 2.2 2.5 2.9 3.3
Southbourne 2 4.50 2.2 2.3 2.3 2.6 2.9 3.4
Hengisbury Head 3 9.00 2.3 2.3 2.4 2.7 3.0 3.5
Barton on Sea 4 13.50 2.4 2.4 2.5 2.7 3.1 3.6
Milford on Sea 5 18.00 2.4 2.5 2.6 2.8 3.2 3.6
Hurst Castle 6 22.50 2.5 2.6 2.7 2.9 3.3 3.7
Lymington 7 27.00 0.00 n/a 2.63 2.57 2.6 2.7 2.7 3.0 3.4 3.8
Thornes Beach 8 4.50 2.7 2.8 2.9 3.1 3.5 3.9
Needs Ore Point 9 9.00 2.9 2.9 3.0 3.2 3.6 4.1
Stansore Point 10 13.50 3.0 3.1 3.1 3.4 3.7 4.2
Calshot 11 0.00 18.00 3.2 3.15 3.09 3.1 3.2 3.2 3.5 3.9 4.3
Lee on Solent/Gosport 12 7.50 3.2 3.3 3.3 3.6 4.0 4.4
Portsmouth (harbour) 13 15.00 0.00 3.3 3.32 3.26 3.3 3.4 3.4 3.7 4.1 4.5
Langstone Harbour 14 4.25 3.4 3.5 3.5 3.8 4.2 4.6
Chister Harbour 15 8.50 3.5 3.6 3.6 3.9 4.3 4.7
West Wittering 16 12.75 3.6 3.7 3.7 4.0 4.4 4.8
Brackelsham 17 17.00 3.7 3.8 3.8 4.1 4.5 4.9
West Selsey Bill 18 21.25 3.8 3.9 3.9 4.2 4.6 5.0
East Selsey Bill 19 25.50 3.9 4.0 4.0 4.3 4.7 5.1
Pagham 20 29.75 4.0 4.1 4.1 4.4 4.8 5.2
Bognor Regis 21 34.00 4.1 4.2 4.2 4.5 4.9 5.3
Middleton on Sea 22 38.25 4.2 4.3 4.3 4.6 5.0 5.4
Littlehampton 23 42.50 4.3 4.32 4.26 4.3 4.4 4.4 4.7 5.1 5.5
Southampton 110 3.2 3.21 3.15 3.2 3.3 3.3 3.6 4.0 4.4
Prepared by Flood Risk Mapping and Data Management (Tony Burch and Stefan Laeger)
Date: 01 June 2007
1,000 year tidal level for Analysed Sites (in grey) and intermediate tidal zones

Atkins is an international Design, Engineering & Management Consultancy. Our clients choose Atkins to plan, design and enable their major projects across a wide range of disciplines both in the UK and overseas. We are the largest engineering consultancy in the UK and the largest multi-disciplinary consultancy in Europe. Our unrivalled reputation rests on the skills of the 15,000 specialists within the organisation. Our clients are varied and include governments, local and regional authorities, funding agencies and commercial and industrial enterprises. We help our clients to realise their objectives by developing and delivering practical solutions, adding value to their businesses through the application of our experience, innovative thinking and state-of-the-art technology.
WS Atkins Plc Woodcote Grove Ashley Road Epsom Surrey KT18 5BW Telephone number: +44 (0) 1372 726140 Fax number: +44 (0) 1372 740055 Email: [email protected] Web address: www.atkinsglobal.com