Embed Size (px)
Citation preview

Pasadena Water and Power
Adopt Ten-Year Energy Efficiency and Demand Reduction Goals
Environmental Advisory CommissionItem 5A
April 13, 2021

Pasadena Water and Power
Recommendation
• Recommend the City Council Adopt Ten-Year Energy Efficiency Goals for PWP Programs> 11,720 MWh per year energy savings; and > 1.8 MW per year demand reduction
• The recommended goals support the CAP> Strategy 2: Energy Efficiency and Conservation measures
• Proposed action is not subject to the California Environmental Quality Act (CEQA).> Establishment of energy efficiency goals does not involve
any commitment to projects that may result in a potentially significant physical impact on the environment.
2
Pasadena Water and Power
Background
• California Law Requires Utilities’ > POU Governing boards (City Council) to adopt 10-year
Energy Efficiency (EE) & Demand Reduction (DR) goals every 4 years
> To acquire cost-effective, reliable/feasible EE and DR prior to other resources
> To report EE savings, expenditures, and cumulative progress to the California Energy Commission (CEC) annually
• Current EE Goals Were Adopted in 2017> New goals must be adopted before the end of FY2021
3
Pasadena Water and Power
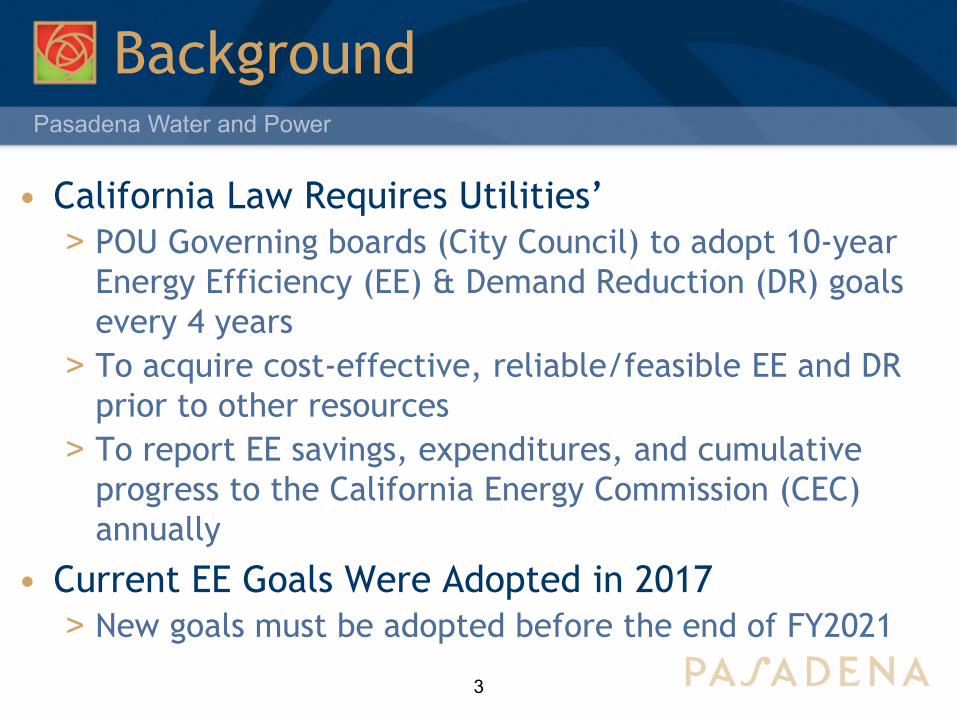
Goal Setting Process
• California Municipal Utilities Association (CMUA)> Coordinates development and reporting of EE goals and
annual progress for its 45 members that provide electric services
• For the 2021 Goal Adoption Cycle> CMUA retained GDS Associates (GDS) to help determine
the ten-year EE market potential for FY 2022-2031 > GDS utilizes a variety of industry wide tools and best
practices to determine the EE potential for each participating electric utility
> GDS and PWP produced a customized model with results that were deemed appropriate for PWP’s service territory
4

Pasadena Water and Power
Developing the EE Model
• “Technical Potential” for EE The Possible> Determined based on a universal database of energy
efficiency measures that could be applied to a utility > Maximum possible energy savings without economic or
other considerations• “Economic Potential” for EE Cost Effective
> Determined by selecting the measures that cost less to implement than their corresponding avoided costs
• “Market Potential” for EE Effective & Feasible> Considers other utility-specific factors such as penetration
of existing measures, customer participation, economic conditions and other relevant factors
5

Pasadena Water and Power
Avoided Cost for EE Model
• Avoided Cost is a Utility’s Incremental Cost to Procure and Deliver Electric Energy
• Avoided Cost Model (ACM)> The ACM is used by the state’s Investor Owned Utilities
(IOU) to determine hourly avoided costs
• ACM Was Customized for PWP> GDS worked closely with PWP staff to determine
appropriate initial parameters/inputs for the ACM> PWP customized inputs to reflect the current/forecast
resource portfolio and projected market prices> Applied PWP’s social cost of carbon from the 2018 IRP
6

Pasadena Water and Power
Annual Energy Efficiency Goals
• Prior 13,500 MWh & 2.3 MW Per Year EE & DR Goal> Adopted by City Council in 2017 for FY2018-2027> Included savings from statewide codes and standards
• Recommended 11,720 MWh & 1.8 MW Per Year EE & DR Goal> Goal is savings from PWP programs only> Equal to ten-year average incremental market potential W/O C&S> Effective July 1, 2021 (FY2022) until next goal adoption> Program goal + C&S savings = 19,524 MWh/yr ~45% higher than prior goal
7
Energy Efficiency Target PWP Program Savings Goal
Codes & Standards
TotalSavings
Adopted 2017 Goal, Incl. C&S
Energy Savings (MWh/yr) 11,720 7,804 19,524 13,500
Demand Reduction (MW/yr) 1.8 1.7 3.5 2.3

Pasadena Water and Power
Energy Efficiency Model Results
• Cumulative market potential for energy savings (MWh/year)• 133,400 MWh/yr reduction in FY2031• ~11.3% of Forecast Gross Retail Sales Volume (net sales + EE savings)
8
Pasadena Water and Power
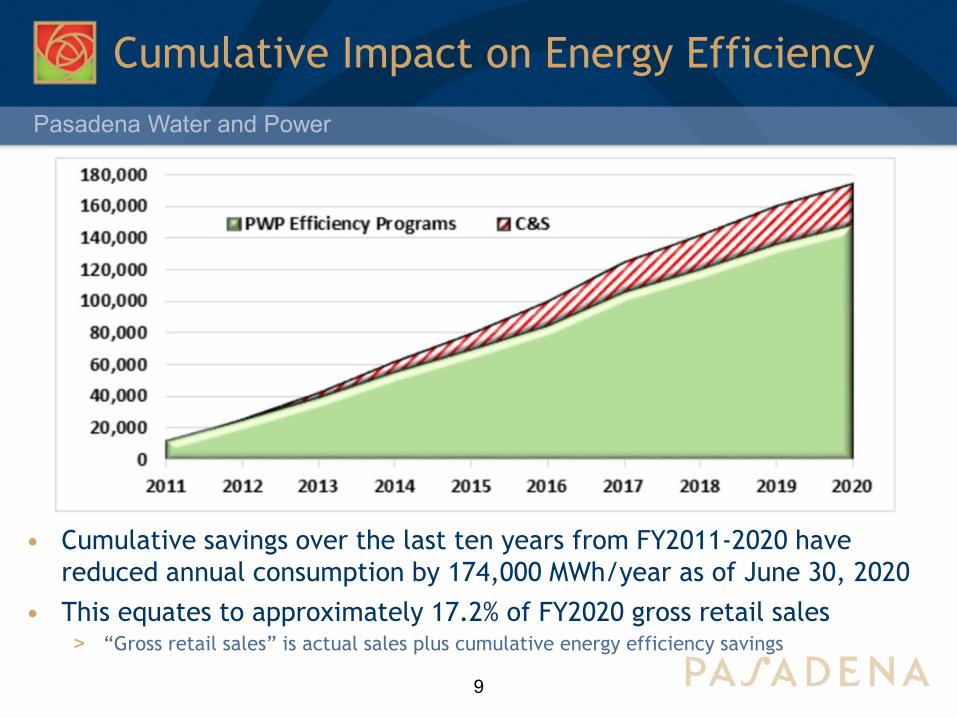
Cumulative Impact on Energy Efficiency
• Cumulative savings over the last ten years from FY2011-2020 have reduced annual consumption by 174,000 MWh/year as of June 30, 2020
• This equates to approximately 17.2% of FY2020 gross retail sales> “Gross retail sales” is actual sales plus cumulative energy efficiency savings
9

Pasadena Water and Power
Impact of Energy Efficiency & Customer-Owned Generation on Electric Sales
• PWP experienced a net 22% decline in actual retail electric sales • Creates funding gaps for infrastructure investment• Applies upward pressure on rates
10

Pasadena Water and Power
Legislative Requirements
• Requires POU to acquire all cost effective, reliable/feasible energy efficiency and demand response prior to other energy supply resources
Senate Bill 1037(2005)
• Requires that POU governing bodies adopt ten-year energy efficiency & demand reduction goals every 3 years, starting in 2007
Assembly Bill 2021 (2006)
• Changed the adoption timeline to every 4 years, starting in 2013
Assembly Bill 2227 (2012)
• Directs the CEC to achieve an overall doubling of efficiency across all energy sectors through “cost effective...and...feasible” means
Senate Bill 350(2017)
11

Pasadena Water and Power
Public Benefits Charge
• Public Benefit Charge (PBC)> Volumetric rate applied to metered electricity usage> Rate is currently $0.00685/kWh> Generates ~$6.9 million/year in revenue> $3.43 per month for customer using 500 kWh/month
• PBC Fund> PBC revenues and interest retained in PBC Fund> PBC Fund only used for specific purposes authorized Under Public Utilities Code 385(a); and, By the City Council
12

Pasadena Water and Power
Public Benefits Fund Use
Cost-effective energy efficiency incentives
Beneficial electrification incentives
Renewable Resources incentives
Low-income rate assistance
Research, Development and Demonstration (RD&D)
13

Pasadena Water and Power
Public Benefits Budget
• ~$3 million Per Year EE Program Budget to Achieve Recommended Goals> Current PBC revenue is sufficient for all PBC programs
at current spending levels> If rate assistance or electrification programs require
funding increases, the PBC rate may need to be revised to generate sufficient funding
14
Annual Cost ($000/yr) FY2016 FY2017 FY2018 FY2019 FY2020
Residential Programs $782 $854 $1,727 $1,935 $1,664
Non-Residential $2,008 $3,766 $1,267 $1,099 $1,080
Total Program Cost $2,790 $4,620 $2,994 $3,034 $2,744

Pasadena Water and Power
Backup Slides Follow
•Questions & Comments
15