Embed Size (px)
Citation preview

EYE ON THE MARKET • ENERGY OUTLOOK 2018
Pascal’s Wager
Pascal’s Wager argues that belief makes more sense than disbelief when the worst outcome is a total loss. If so, supporting renewable energy makes sense even without knowing the true impact of greenhouse gas emissions on sea levels. However, energy transitions are gradual rather than sudden, defying the expectations of futurists. This year, we examine some timely examples: why climate goals can’t be reached by simply decarbonizing electricity with wind and solar power; why natural gas will still be the fuel of the 21st century; the wide range of electric vehicle forecasts after last decade’s misfires; the high-voltage transmission bottleneck in the U.S.; and how a group of academics thoroughly dismantled one peer’s highly publicized and dreamlike vision of a renewable energy future. As a result, we also look at sea level rise, coastal exposures and flood mitigation infrastructure, which might be needed just in case. We conclude with the intersection between food, energy, urbanization and proposed changes to the U.S. Electoral College.
J.P. MORGAN ASSET MANAGEMENT
1
INVESTMENT PRODUCTS ARE: ● NOT FDIC INSURED ● NOT A DEPOSIT OR OTHER OBLIGATION
OF, OR GUARANTEED BY, JPMORGAN CHASE BANK, N.A. OR ANY OF ITS AFFILIATES ● SUBJECT
TO INVESTMENT RISKS, INCLUDING POSSIBLE LOSS OF THE PRINCIPAL AMOUNT INVESTED
First, a comment on Trumpism and markets. For investors, Trumpism looks like a combination of Ronald Reagan (deregulation, tax cuts), GW Bush (large fiscal deficits, conservative court appointments), Andrew Jackson (loyalty-based political patronage, laissez-faire economics), Herbert Hoover (protectionist tariffs, deportation of undocumented immigrants via the Mexican Repatriation of the early 1930’s) and John F. Kennedy (singling out companies for attack as JFK did to US Steel in 1962, triggering a collapse in investor confidence and a 20% bear market). Other aspects of Trumpism, such as a first-year turnover rate of senior officials equal to the turnover rate of the prior four Presidents combined, have no modern parallel. For more details, please see this accompanying brief note.
The market-friendly aspects of Trumpism were delivered in 2017; this year, investors have to deal with the rest. The US corporate sector is in good shape when looking at strong profits growth, high profit margins and rising stock buybacks, but falling valuations justifiably reflect concerns about what comes next from the White House, as well as a Fed that may double the Fed Funds rate to 3.5% by the end of 2019. I still expect positive single digit equity returns this year as offsetting forces work their way through markets, but the range of uncertainty around that figure has widened a lot over the last month.
For the last seven years, we have written an annual energy paper that covers 5 topics of interest to us and to many of our clients. Vaclav Smil at the University of Manitoba has served as our technical advisor since its inception, and his insights and guidance have been invaluable to us. This year, our topics include examples of how energy transitions are gradual rather than sudden, defying the expectations of futurists:
Why climate goals can’t be reached by simply decarbonizing electricity with wind and solar power
Why natural gas will still be the fuel of the 21st century
The wide range of electric vehicle forecasts after last decade’s misfire
The high voltage transmission bottleneck in the US
How a dream team of researchers thoroughly dismantled Mark Jacobson’s highly publicized vision of a 100% renewable grid
As a result, we also look at sea level rise, coastal exposures and flood mitigation infrastructure, which might be needed just in case. We conclude with the US Electoral College, which is under siege again, but best left just the way it is for reasons related to food, energy, urbanization and national security.
Michael Cembalest JP Morgan Asset Management
2
Pascal’s Wager
Executive Summary
Impressive wind and solar power milestones have been reached in the last few years: ongoing declines in capital costs, power auction prices well below 10 cents per kWh, rising wind capacity factors and rising capacity additions which in 2016 exceeded non-renewable new capacity for the 4
th year in a row. These
trends, shown in chart form on page 7, are the by-product of scale, innovation and plenty of subsidies.
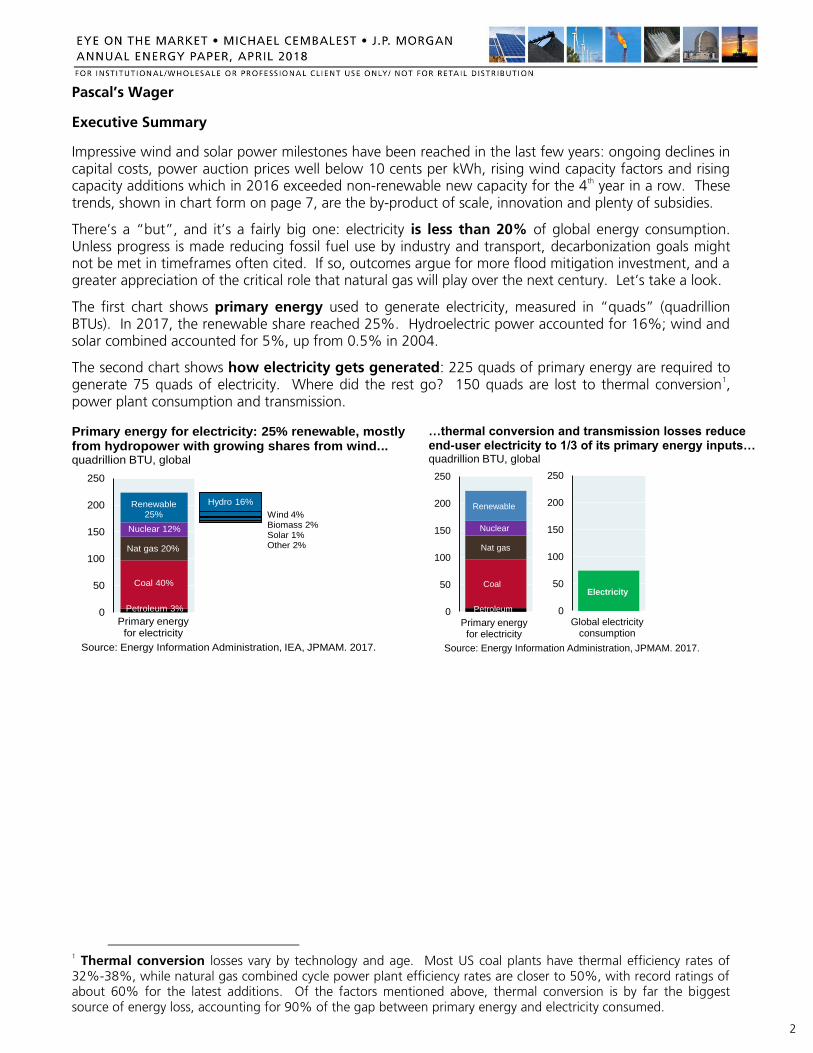
There’s a “but”, and it’s a fairly big one: electricity is less than 20% of global energy consumption. Unless progress is made reducing fossil fuel use by industry and transport, decarbonization goals might not be met in timeframes often cited. If so, outcomes argue for more flood mitigation investment, and a greater appreciation of the critical role that natural gas will play over the next century. Let’s take a look.
The first chart shows primary energy used to generate electricity, measured in “quads” (quadrillion BTUs). In 2017, the renewable share reached 25%. Hydroelectric power accounted for 16%; wind and solar combined accounted for 5%, up from 0.5% in 2004.
The second chart shows how electricity gets generated: 225 quads of primary energy are required to generate 75 quads of electricity. Where did the rest go? 150 quads are lost to thermal conversion
1,
power plant consumption and transmission.
1 Thermal conversion losses vary by technology and age. Most US coal plants have thermal efficiency rates of 32%-38%, while natural gas combined cycle power plant efficiency rates are closer to 50%, with record ratings of about 60% for the latest additions. Of the factors mentioned above, thermal conversion is by far the biggest source of energy loss, accounting for 90% of the gap between primary energy and electricity consumed.
0
50
100
150
200
250
Primary energy for electricity: 25% renewable, mostly from hydropower with growing shares from wind...quadrillion BTU, global
Source: Energy Information Administration, IEA, JPMAM. 2017.
Primary energyfor electricity
Renewable 25%
Nuclear 12%
Coal 40%
Nat gas 20%
Petroleum 3%
Hydro 16%
Wind 4% Biomass 2% Solar 1%Other 2%
…thermal conversion and transmission losses reduce end-user electricity to 1/3 of its primary energy inputs…quadrillion BTU, global
Source: Energy Information Administration, JPMAM. 2017.
Petroleum
Coal
Nat gas
Renewable
Nuclear
0
50
100
150
200
250
Primary energyfor electricity
0
50
100
150
200
250
Global electricity consumption
Electricity
3
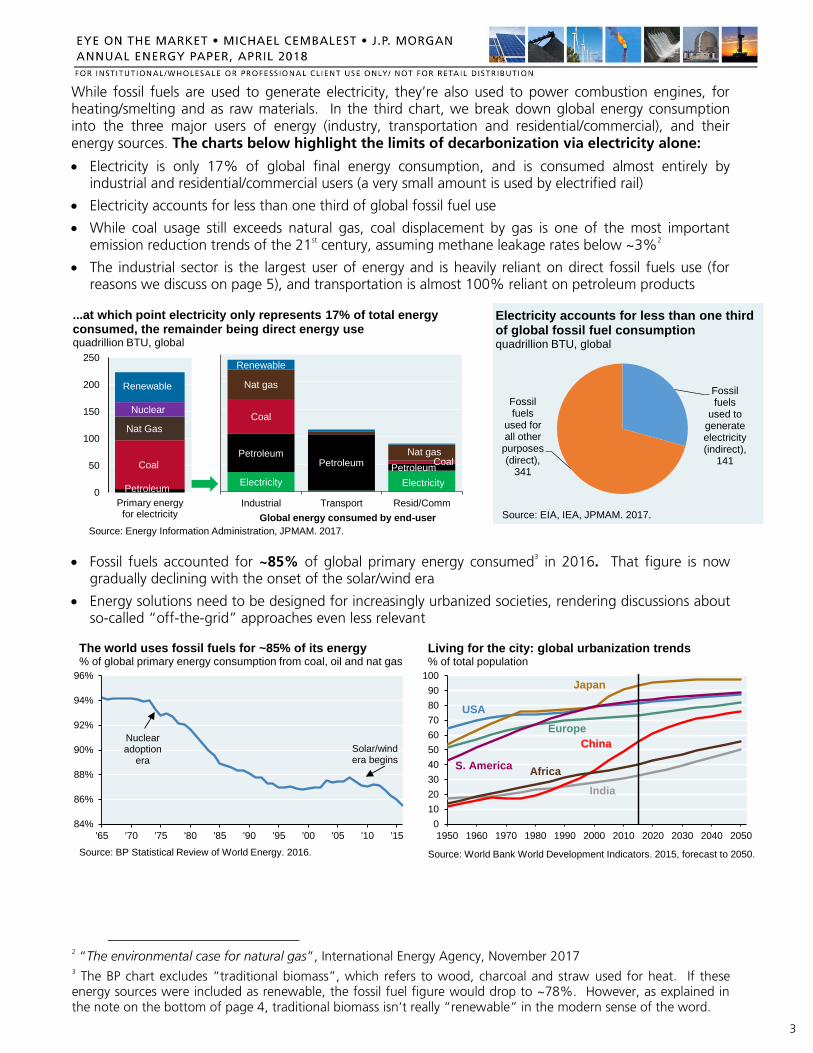
While fossil fuels are used to generate electricity, they’re also used to power combustion engines, for heating/smelting and as raw materials. In the third chart, we break down global energy consumption into the three major users of energy (industry, transportation and residential/commercial), and their energy sources. The charts below highlight the limits of decarbonization via electricity alone:
Electricity is only 17% of global final energy consumption, and is consumed almost entirely by industrial and residential/commercial users (a very small amount is used by electrified rail)
Electricity accounts for less than one third of global fossil fuel use
While coal usage still exceeds natural gas, coal displacement by gas is one of the most important emission reduction trends of the 21
st century, assuming methane leakage rates below ~3%
2
The industrial sector is the largest user of energy and is heavily reliant on direct fossil fuels use (for reasons we discuss on page 5), and transportation is almost 100% reliant on petroleum products
Fossil fuels accounted for ~85% of global primary energy consumed3 in 2016. That figure is now
gradually declining with the onset of the solar/wind era
Energy solutions need to be designed for increasingly urbanized societies, rendering discussions about so-called “off-the-grid” approaches even less relevant
2 “The environmental case for natural gas”, International Energy Agency, November 2017
3 The BP chart excludes “traditional biomass”, which refers to wood, charcoal and straw used for heat. If these energy sources were included as renewable, the fossil fuel figure would drop to ~78%. However, as explained in the note on the bottom of page 4, traditional biomass isn’t really “renewable” in the modern sense of the word.
Electricity Electricity
PetroleumPetroleum
Petroleum
Coal
Coal
Nat gas
Nat gas
Renewable
Industrial Transport Resid/Comm
...at which point electricity only represents 17% of total energy consumed, the remainder being direct energy use quadrillion BTU, global
Source: Energy Information Administration, JPMAM. 2017.
Global energy consumed by end-user
Petroleum
Coal
Nat Gas
Renewable
Nuclear
0
50
100
150
200
250
Primary energyfor electricity
84%
86%
88%
90%
92%
94%
96%
'65 '70 '75 '80 '85 '90 '95 '00 '05 '10 '15
Source: BP Statistical Review of World Energy. 2016.
The world uses fossil fuels for ~85% of its energy% of global primary energy consumption from coal, oil and nat gas
Nuclearadoption
era
Solar/windera begins
0
10
20
30
40
50
60
70
80
90
100
1950 1960 1970 1980 1990 2000 2010 2020 2030 2040 2050
Source: World Bank World Development Indicators. 2015, forecast to 2050.
Living for the city: global urbanization trends% of total population
China
India
Japan
USA
Europe
S. AmericaAfrica
Fossil fuels
used to generate electricity (indirect),
141
Fossil fuels
used for all other
purposes (direct),
341
Electricity accounts for less than one third of global fossil fuel consumptionquadrillion BTU, global
Source: EIA, IEA, JPMAM. 2017.
4
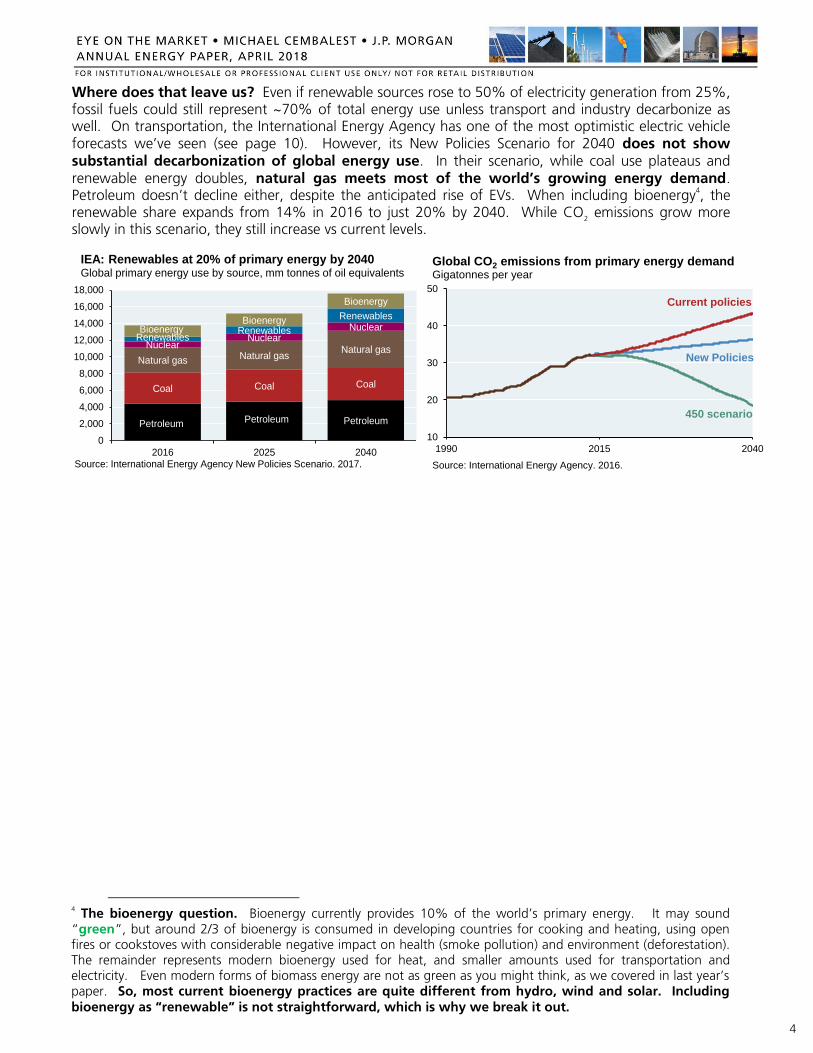
Where does that leave us? Even if renewable sources rose to 50% of electricity generation from 25%, fossil fuels could still represent ~70% of total energy use unless transport and industry decarbonize as well. On transportation, the International Energy Agency has one of the most optimistic electric vehicle forecasts we’ve seen (see page 10). However, its New Policies Scenario for 2040 does not show substantial decarbonization of global energy use. In their scenario, while coal use plateaus and renewable energy doubles, natural gas meets most of the world’s growing energy demand. Petroleum doesn’t decline either, despite the anticipated rise of EVs. When including bioenergy
4, the
renewable share expands from 14% in 2016 to just 20% by 2040. While CO2 emissions grow more
slowly in this scenario, they still increase vs current levels.
4 The bioenergy question. Bioenergy currently provides 10% of the world’s primary energy. It may sound “green”, but around 2/3 of bioenergy is consumed in developing countries for cooking and heating, using open fires or cookstoves with considerable negative impact on health (smoke pollution) and environment (deforestation). The remainder represents modern bioenergy used for heat, and smaller amounts used for transportation and electricity. Even modern forms of biomass energy are not as green as you might think, as we covered in last year’s paper. So, most current bioenergy practices are quite different from hydro, wind and solar. Including bioenergy as “renewable” is not straightforward, which is why we break it out.
Petroleum Petroleum Petroleum
Coal Coal Coal
Natural gas Natural gasNatural gasNuclear
NuclearNuclear
RenewablesRenewables
Renewables
BioenergyBioenergy
Bioenergy
0
2,000
4,000
6,000
8,000
10,000
12,000
14,000
16,000
18,000
2016 2025 2040
IEA: Renewables at 20% of primary energy by 2040Global primary energy use by source, mm tonnes of oil equivalents
Source: International Energy Agency New Policies Scenario. 2017.
10
20
30
40
50
1990 2015 2040
Source: International Energy Agency. 2016.
Global CO2 emissions from primary energy demand Gigatonnes per year
New Policies
450 scenario
Current policies
5
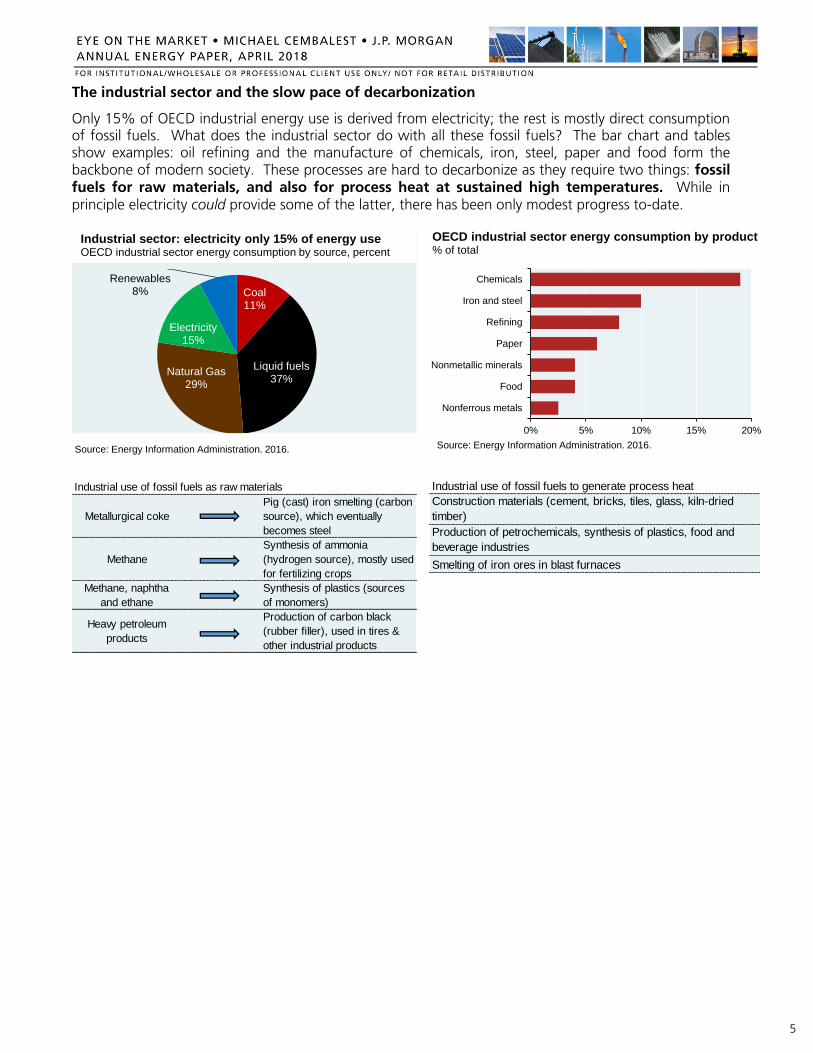
The industrial sector and the slow pace of decarbonization
Only 15% of OECD industrial energy use is derived from electricity; the rest is mostly direct consumption of fossil fuels. What does the industrial sector do with all these fossil fuels? The bar chart and tables show examples: oil refining and the manufacture of chemicals, iron, steel, paper and food form the backbone of modern society. These processes are hard to decarbonize as they require two things: fossil fuels for raw materials, and also for process heat at sustained high temperatures. While in principle electricity could provide some of the latter, there has been only modest progress to-date.
Coal11%
Liquid fuels37%
Natural Gas29%
Electricity15%
Renewables8%
Source: Energy Information Administration. 2016.
Industrial sector: electricity only 15% of energy useOECD industrial sector energy consumption by source, percent
0% 5% 10% 15% 20%
Nonferrous metals
Food
Nonmetallic minerals
Paper
Refining
Iron and steel
Chemicals
Source: Energy Information Administration. 2016.
OECD industrial sector energy consumption by product % of total
Industrial use of fossil fuels as raw materials
Metallurgical coke
Pig (cast) iron smelting (carbon
source), which eventually
becomes steel
Methane
Synthesis of ammonia
(hydrogen source), mostly used
for fertilizing crops
Methane, naphtha
and ethane
Synthesis of plastics (sources
of monomers)
Heavy petroleum
products
Production of carbon black
(rubber filler), used in tires &
other industrial products
Industrial use of fossil fuels to generate process heat
Construction materials (cement, bricks, tiles, glass, kiln-dried
timber)
Production of petrochemicals, synthesis of plastics, food and
beverage industries
Smelting of iron ores in blast furnaces
6
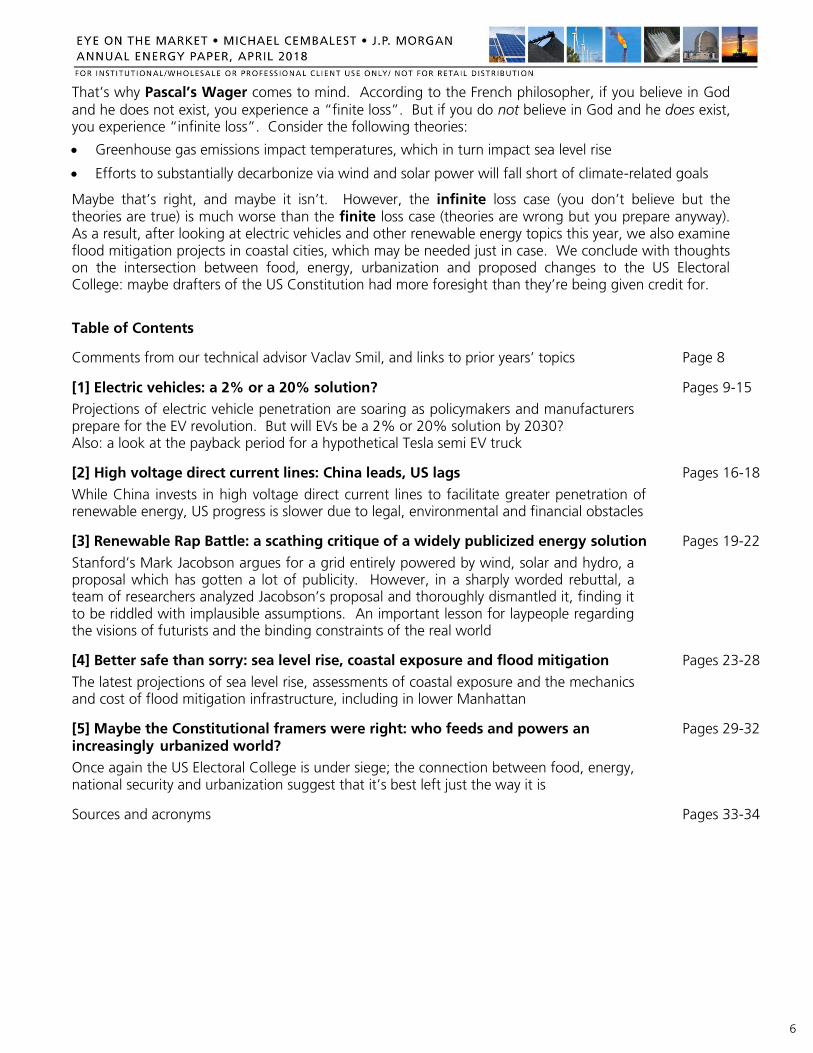
That’s why Pascal’s Wager comes to mind. According to the French philosopher, if you believe in God and he does not exist, you experience a “finite loss”. But if you do not believe in God and he does exist, you experience “infinite loss”. Consider the following theories:
Greenhouse gas emissions impact temperatures, which in turn impact sea level rise
Efforts to substantially decarbonize via wind and solar power will fall short of climate-related goals
Maybe that’s right, and maybe it isn’t. However, the infinite loss case (you don’t believe but the theories are true) is much worse than the finite loss case (theories are wrong but you prepare anyway). As a result, after looking at electric vehicles and other renewable energy topics this year, we also examine flood mitigation projects in coastal cities, which may be needed just in case. We conclude with thoughts on the intersection between food, energy, urbanization and proposed changes to the US Electoral College: maybe drafters of the US Constitution had more foresight than they’re being given credit for.
Table of Contents
Comments from our technical advisor Vaclav Smil, and links to prior years’ topics Page 8
[1] Electric vehicles: a 2% or a 20% solution? Pages 9-15
Projections of electric vehicle penetration are soaring as policymakers and manufacturers prepare for the EV revolution. But will EVs be a 2% or 20% solution by 2030? Also: a look at the payback period for a hypothetical Tesla semi EV truck
[2] High voltage direct current lines: China leads, US lags Pages 16-18
While China invests in high voltage direct current lines to facilitate greater penetration of renewable energy, US progress is slower due to legal, environmental and financial obstacles
[3] Renewable Rap Battle: a scathing critique of a widely publicized energy solution Pages 19-22
Stanford’s Mark Jacobson argues for a grid entirely powered by wind, solar and hydro, a proposal which has gotten a lot of publicity. However, in a sharply worded rebuttal, a team of researchers analyzed Jacobson’s proposal and thoroughly dismantled it, finding it to be riddled with implausible assumptions. An important lesson for laypeople regarding the visions of futurists and the binding constraints of the real world
[4] Better safe than sorry: sea level rise, coastal exposure and flood mitigation Pages 23-28
The latest projections of sea level rise, assessments of coastal exposure and the mechanics and cost of flood mitigation infrastructure, including in lower Manhattan
[5] Maybe the Constitutional framers were right: who feeds and powers an Pages 29-32 increasingly urbanized world?
Once again the US Electoral College is under siege; the connection between food, energy, national security and urbanization suggest that it’s best left just the way it is
Sources and acronyms Pages 33-34
7
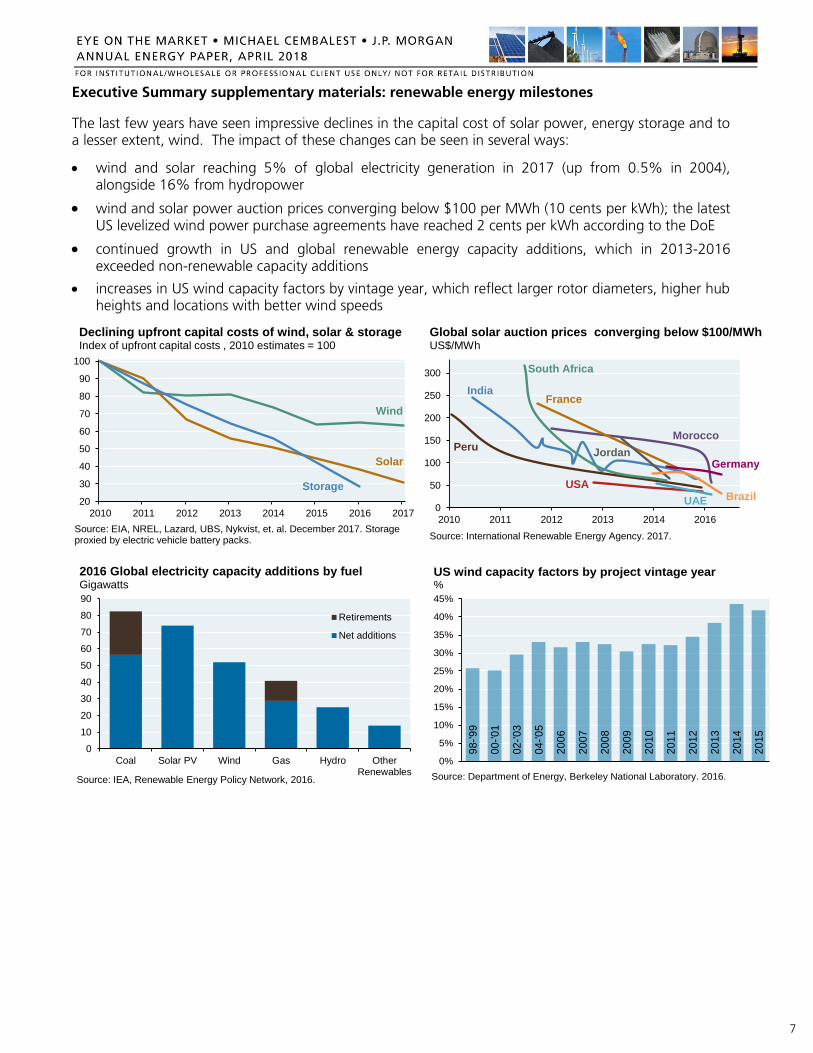
Executive Summary supplementary materials: renewable energy milestones
The last few years have seen impressive declines in the capital cost of solar power, energy storage and to a lesser extent, wind. The impact of these changes can be seen in several ways:
wind and solar reaching 5% of global electricity generation in 2017 (up from 0.5% in 2004), alongside 16% from hydropower
wind and solar power auction prices converging below $100 per MWh (10 cents per kWh); the latest US levelized wind power purchase agreements have reached 2 cents per kWh according to the DoE
continued growth in US and global renewable energy capacity additions, which in 2013-2016 exceeded non-renewable capacity additions
increases in US wind capacity factors by vintage year, which reflect larger rotor diameters, higher hub heights and locations with better wind speeds
20
30
40
50
60
70
80
90
100
2010 2011 2012 2013 2014 2015 2016 2017
Source: EIA, NREL, Lazard, UBS, Nykvist, et. al. December 2017. Storage proxied by electric vehicle battery packs.
Declining upfront capital costs of wind, solar & storageIndex of upfront capital costs , 2010 estimates = 100
Storage
Wind
Solar
0
50
100
150
200
250
300
2010 2011 2012 2013 2014 2016
Source: International Renewable Energy Agency. 2017.
Global solar auction prices converging below $100/MWh US$/MWh
Peru
India
South Africa
France
Morocco
USA
Jordan
UAE
Germany
Brazil
0
10
20
30
40
50
60
70
80
90
Coal Solar PV Wind Gas Hydro OtherRenewables
Retirements
Net additions
Source: IEA, Renewable Energy Policy Network, 2016.
2016 Global electricity capacity additions by fuelGigawatts
98
-'9
9
00
-'0
1
02
-'0
3
04
-'0
5
20
06
20
07
20
08
20
09
20
10
20
11
20
12
20
13
20
14
20
15
0%
5%
10%
15%
20%
25%
30%
35%
40%
45%
Source: Department of Energy, Berkeley National Laboratory. 2016.
US wind capacity factors by project vintage year%

8
Why all the focus on decarbonization?
I asked Vaclav to articulate for our clients why decarbonization is an important initiative. His response is useful context for both those who are convinced by consensus views on climate science, and also for those who are still on the fence:
“Underlying all of the recent moves toward renewable energy is the conviction that such a transition should be accelerated in order to avoid some of the worst consequences of rapid anthropogenic global warming. Combustion of fossil fuels is the single largest contributor to man-made emissions of CO
2 which, in turn, is the most important greenhouse gas released by
human activities. While our computer models are not good enough to offer reliable predictions of many possible environmental, health, economic and political effects of global warming by 2050 (and even less so by 2100), we know that energy transitions are inherently protracted affairs and hence, acting as risk minimizers, we should proceed with the decarbonization of our overwhelmingly carbon-based electricity supply – but we must also appraise the real costs of this shift. This report is a small contribution toward that goal.”
Acknowledgements: our technical advisor Vaclav Smil
As always, our energy Eye on the Market was overseen by Vaclav Smil, Distinguished Professor Emeritus in the Faculty of Environment at the University of Manitoba and a Fellow of the Royal Society of Canada. His inter-disciplinary research includes studies of energy systems (resources, conversions, and impacts), environmental change (particularly global biogeochemical cycles), and the history of technical advances and interactions among energy, environment, food, economy, and population. He is the author of 40 books (the latest ones, Energy Transitions and Energy and Civilization were published last year) and more than 400 papers on these subjects and has lectured widely in North America, Europe, and Asia. In 2010, Foreign Policy magazine listed him among the 100 most influential global thinkers. In 2015, he received the OPEC award for research, and is described by Bill Gates as his favorite author.
Select topics from prior Eye on the Market energy editions (hyperlinks)
Cost/emissions tradeoffs of high-renewable grids (2017)
Hydraulic fracturing (2017)
Forest biomass (2017)
College campus energy use (2017)
Distributed solar power and billing changes (2016)
US hydropower capacity (2016)
Nuclear power (2014 and 2015)
35
NOT FOR RETAIL DISTRIBUTION: This communication has been prepared exclusively for institutional, wholesale, professional clients and qualified investors only, as defined by local laws and regulations. This material is for information purposes only. The views, opinions, estimates and strategies expressed herein constitutes Michael Cembalest’s judgment based on current market conditions and are subject to change without notice, and may differ from those expressed by other areas of J.P. Morgan. This information in no way constitutes J.P. Morgan Research and should not be treated as such. We believe the information contained in this material to be reliable and have sought to take reasonable care in its preparation; however, we do not represent or warrant its accuracy, reliability or completeness, or accept any liability for any loss or damage (whether direct or indirect) arising out of the use of all or any part of this material. We do not make any representation or warranty with regard to any computations, graphs, tables, diagrams or commentary in this material which are provided for illustration/reference purposes only. We assume no duty to update any information in this material in the event that such information changes. Any projected results and risks are based solely on hypothetical examples cited, and actual results and risks will vary depending on specific circumstances. Forward looking statements should not be considered as guarantees or predictions of future events. Investors may get back less than they invested, and past performance is not a reliable indicator of future results. There may be different or additional factors which are not reflected in this material, but which may impact on a client’s portfolio or investment decision. The information contained in this material is intended as general market commentary and should not be relied upon in isolation for the purpose of making an investment decision. Nothing in this document shall be construed as giving rise to any duty of care owed to, or advisory relationship with, you or any third party. Nothing in this document is intended to constitute a representation that any investment strategy or product is suitable for you. You should consider carefully whether any products and strategies discussed are suitable for your needs, and to obtain additional information prior to making an investment decision. Nothing in this document shall be regarded as an offer, solicitation, recommendation or advice (whether financial, accounting, legal, tax or other) given by J.P. Morgan and/or its officers or employees, irrespective of whether or not such communication was given at your request. J.P. Morgan and its affiliates and employees do not provide tax, legal or accounting advice. You should consult your own tax, legal and accounting advisors before engaging in any financial transactions. J.P. Morgan Asset Management is the brand for the asset management business of JPMorgan Chase & Co. and its affiliates worldwide. This communication is issued by the following entities: in the United Kingdom by JPMorgan Asset Management (UK) Limited, which is authorized and regulated by the Financial Conduct Authority; in other European jurisdictions by JPMorgan Asset Management (Europe) S.à r.l.; in Hong Kong by JF Asset Management Limited, or JPMorgan Funds (Asia) Limited, or JPMorgan Asset Management Real Assets (Asia) Limited; in Singapore by JPMorgan Asset Management (Singapore) Limited (Co. Reg. No. 197601586K), or JPMorgan Asset Management Real Assets (Singapore) Pte Ltd (Co. Reg. No. 201120355E); in Taiwan by JPMorgan Asset Management (Taiwan) Limited; in Japan by JPMorgan Asset Management (Japan) Limited which is a member of the Investment Trusts Association, Japan, the Japan Investment Advisers Association, Type II Financial Instruments Firms Association and the Japan Securities Dealers Association and is regulated by the Financial Services Agency (registration number “Kanto Local Finance Bureau (Financial Instruments Firm) No. 330”); in Australia to wholesale clients only as defined in section 761A and 761G of the Corporations Act 2001 (Cth) by JPMorgan Asset Management (Australia) Limited (ABN 55143832080) (AFSL 376919); in Brazil by Banco J.P. Morgan S.A.; in Canada for institutional clients’ use only by JPMorgan Asset Management (Canada) Inc., which is a registered Portfolio Manager and Exempt Market Dealer in all Canadian provinces and territories except the Yukon and is also registered as an Investment Fund Manager in British Columbia, Ontario, Quebec and Newfoundland and Labrador. This communication is issued in the United States by J.P. Morgan Investment Management Inc., which is regulated by the Securities and Exchange Commission.
In APAC, distribution is for Hong Kong, Taiwan, Japan and Singapore. For all other countries in APAC, to intended recipients only. This material should not be duplicated or redistributed without our permission. © 2018 JPMorgan Chase & Co. All rights reserved.


![3 Pappus’, Desargues’ and Pascal’s Theoremsmath2.uncc.edu/~frothe/3181alleuclid1_3.pdfIn Hilbert’s foundations [22], this theorem is named after Pascal. Pascal’s Pascal’s](https://img.pdfslide.net/doc/110x75/5ac266c87f8b9a1c768dea9e/3-pappus-desargues-and-pascals-frothe3181alleuclid13pdfin-hilberts.jpg)