Embed Size (px)
Citation preview

HAL Id: hal-02117590https://hal.archives-ouvertes.fr/hal-02117590
Submitted on 3 Jun 2019
HAL is a multi-disciplinary open accessarchive for the deposit and dissemination of sci-entific research documents, whether they are pub-lished or not. The documents may come fromteaching and research institutions in France orabroad, or from public or private research centers.
L’archive ouverte pluridisciplinaire HAL, estdestinée au dépôt et à la diffusion de documentsscientifiques de niveau recherche, publiés ou non,émanant des établissements d’enseignement et derecherche français ou étrangers, des laboratoirespublics ou privés.
Paschen’s Law in Extreme Pressure and TemperatureConditions
Giacomo Galli, Hassen Hamrita, C. Jammes, Michael Kirkpatrick, EmmanuelOdic, Philippe Dessante, Philippe Molinié
To cite this version:Giacomo Galli, Hassen Hamrita, C. Jammes, Michael Kirkpatrick, Emmanuel Odic, et al.. Paschen’sLaw in Extreme Pressure and Temperature Conditions. IEEE Transactions on Plasma Science, Insti-tute of Electrical and Electronics Engineers, 2019, 47 (3), pp.1641-1647. �10.1109/TPS.2019.2896352�.�hal-02117590�

1
Abstract— Paschen’s law gives the inception voltage for an
electrical discharge as a function of the product of gas pressure
and the gap distance between two infinite planar electrodes. It is
known that deviations from Paschen’s law occur when
temperature is increased.
Historically two theoretical corrections, the Peek and Dumbar
corrections, are proposed to predict the deviation from Paschen’s
law by increasing temperature.
To carry out an experimental investigation on the deviation
from Paschen’s law by increasing temperature a customized
system was designed which can operate at temperatures up to
400°C and at pressure up to 1MPa, calculated at room
temperature; with an inter-electrode distance between 100µm and
6.6mm and with an error on the inter-electrode distance
measurement of 20µm.
In this article, firstly, the results from the experimental
investigation on the deviation from Paschen’s law at temperature
up to 400°C are presented. The results are then compared with
theoretical corrections, and finally a theory to explain the results
is proposed and discussed.
Index Terms—Paschen’s law, argon, high temperature, high
pressure.
I. INTRODUCTION
aschen’s law gives the inception voltage for an electrical
discharge in a gas as a function of the product of the gas
pressure and the gap distance between two infinite planar
electrodes.
The current and possible future construction of the ITER and
DEMO fusion reactors, as well as the construction of sodium-
cooled IVth generation nuclear reactors will necessitate the use
of high temperature fission chambers [1] (HTFC) to detect
neutrons in the high temperature zones of these installations [2-
10]. Multiple uses are envisaged such as reactor power control
and fuel cladding failure detection [11-12].To operate in–core,
the HTFC will have to operate under high irradiation, up to
1010 n/cm².s and to withstand the high operating temperatures,
up to 650°C, of the sodium-cooled fast reactors and, up to
1000°C, of the fusion reactors.
Submitted on 29 September, 2017. Work supported by the CEA, the French
Alternative Energies and Atomic Energy Commission.
G. Galli is with the CEA, LIST, Sensors and Electronic Architectures
Laboratory, Gif/Yvette, France and with the GeePs | Group of electrical
engineering - Paris, UMR CNRS 8507, CentraleSupélec, Univ. Paris-Sud,
Université Paris-Saclay, Sorbonne Universités, UPMC Univ Paris 06, 3 & 11
rue Joliot-Curie, Plateau de Moulon 91192 Gif-sur-Yvette CEDEX, France
After years of study [7-10], it is now known that an electrical
signal, here referred to as a partial discharge or PD, more or less
similar to the signal resulting from neutron interactions, is
generated in fission chambers at temperatures above 400 °C.
This unwanted signal poses challenges, especially during
reactor start-up when the PD signal count may be on the same
order of magnitude as the neutron signal count [10].
Previous work on fission chambers [9] has focused attention
on the possible implication of a solid insulator in the process
leading to the creation of the unknown signal (PD). The present
study considers the simplified case of a sphere-sphere geometry
without any solid insulator in order to validate assumptions
made in that previous work about PD activity at high
temperature and pressure, and to generally enlarge the scope of
the results to other fields of research.
Because of these challenges, an investigation, presented in
this paper, on the effects of temperature on Paschen’s law has
been conducted. A brief summary of Paschen’s law is described
in Section II. The experimental chamber used in this work and
the rest of the experimental setup are described in Section III.
All results on Paschen’s law in extreme pressure and
temperature conditions are presented in section IV. The
discussion of results with a proposed theory are presented in
section V. The conclusion and the future work are presented in
section VI.
II. NOTIONS OF PASCHEN’S LAW THEORY
Electrical discharges are initiated when a seed electron is
accelerated by an imposed electric field, acquiring energy
superior to the ionization energy of the gas atoms/molecules,
leading to an electron avalanche. Sources of seed electrons
include cosmic rays, photo-ionization, etc.
The schema shown in figure 1 describes the basic process of
an electrical discharge in a plane-to-plane geometry. Assuming
H. Hamrita is with the CEA, LIST, Sensors and Electronic Architectures
Laboratory, Gif/Yvette, France.
C. Jammes is with the CEA, DEN, DER, Instrumentation, Sensors and
Dosimetry Laboratory, Cadarache, Saint-Paul-lez-Durance, France.
M.J. Kirkpatrick, E. Odic, Ph. Dessante and Ph. Molinie are with the GeePs
| Group of electrical engineering - Paris, UMR CNRS 8507, CentraleSupélec,
Univ. Paris-Sud, Université Paris-Saclay, Sorbonne Universités, UPMC Univ
Paris 06, 3 & 11 rue Joliot-Curie, Plateau de Moulon 91192 Gif-sur-Yvette
CEDEX, France.
Paschen’s law in extreme pressure and
temperature conditions
G. GALLI, H. HAMRITA, C. JAMMES, M.J. KIRKPATRICK, E. ODIC, Ph. DESSANTE, Ph.
MOLINIE
P

2
the presence of a seed electron, the conditions which will lead
to an electron avalanche are described by Paschen’s Law (1):
𝑉 = 𝐴 ∙ 𝑃 ∙ 𝑑 ∙1
ln(𝑃 ∙ 𝑑 ∙ 𝐵) − ln (ln (1 +1𝛾
)) (1)
𝐴 =𝜀𝑖 ∙ 𝜎
𝑘𝐵𝑇 (2)
𝐵 =𝜎
𝑘𝐵𝑇 (3)
Where P is the filling gas pressure, d is the inter-electrode
distance, γ is the secondary emission coefficient (the yield of
electrons from positive ion impact on the cathode which is
normally on the order of 10-4-10-2), 𝜀𝑖 is the ionization potential,
𝜎 is the ionization cross section and T the gas temperature in
kelvin.
Figure 1 shows the Paschen curve for argon; the product of
the gas pressure and the inter-electrode distance in the abscissa
and the discharge inception voltage in the ordinate. The
discharge voltage passes by a minimum value on the order of a
few hundred volts, depending on gas type.
Paschen’s law is derived for the case of infinite planar
electrodes, in other words, for the case of a homogeneous
electric field.
Fig. 1. Paschen curve for room temperature argon, calculated using the
equations 1-3 and the values in table 2.
A. Temperature corrections
Two temperature corrections exist in the literature, known as
the Peek and Dunbar corrections [13-14]. Both of these
corrections use the ideal gas law to modify the Paschen curve.
In the Peek correction, the voltage is adjusted by a factor 𝑇0
𝑇,
lowering the curve for elevated temperatures. The Dunbar
correction adjusts the pressure by a factor 𝑇
𝑇0, moving the curve
to the right for elevated temperatures. Thus the Dunbar
correction is simply the application of equations (2,3), while the
Peek correction is more empirical in nature. The Dunbar
correction may then be thought of as using the density instead
of the pressure in the ordinate for the Paschen curve. Figure 2
compares the resulting curves calculated according to the two
corrections at 400°C with the standard Paschen curve at 20°C.
As seen in the figure, the two corrections have more or less the
same effect of lowering the prediction for breakdown voltage at
high values of Pd (on the right of the figure). These adjustments,
may be understood as taking into account the fact that
Paschen’s law is formulated based on a mean free path for
electron-neutral collisions. The mean free path for collisions is
inversely proportional to the gas density, 𝑃/𝑘𝐵𝑇. In an open
system at constant pressure, in which gas is free to expand, the
gas density will decrease as a function of temperature. For a
closed system like the one used in this work, it is therefore
convenient to plot the Paschen curve as a function of gas density
as opposed to the usual pressure. Plotted in terms of density, the
uncorrected and Dunbar curves shown in Figure 2 would be
seen to coincide. Therefore, for the case of a closed volume, any
effect of the temperature on the breakdown voltage should
appear if the data are plotted as a function of the density.
Fig. 2. Comparison of the Peek and Dunbar corrections of Paschen's law at
400°C, with the standard Paschen’s curve at room temperature.
III. EXPERIMENTAL SETUP
Figure 3 shows a 3D drawing of the experimental chamber
designed to test Paschen’s law at high temperature and pressure.
The cylindrical experimental chamber includes a gas inlet and
outlet to purge the chamber and to fill the chamber with the
chosen gas and two spherical electrodes in order to minimize
the edge effects of the electric field and better control the inter-
electrode distance. The electrodes are insulated from the
chamber body by two ceramic insulators, allowing the
electrodes to be polarized at voltages up to 20 kV. A micrometer
screw gauge is used to adjust the inter-electrode distance.
Table 1 shows the parameters of the experimental chamber
including the diameter and length, the roughness of the
spherical electrodes and the electrodes diameter, and the
constraints on the maximum pressure, inter-electrode distance,
temperature and power supply voltage, of the experimental
chamber which were specified by the fission chamber designer
and then checked in the laboratory.

3
TABLE 1
EXPERIMENTAL CHAMBER: PARAMETERS AND CONSTRAINTS
Parameters
Chamber
diameter
Chamber
length
Electrodes
diameter
Electrode
roughness
Electrode
material
75 mm 234 mm 1.6 cm ~3µm Stainless
Steel
Constraints
Pmax dmax dmin Vmax Tmax
40 bar 6.6 mm 0.050 mm 30 kV 650°C
Fig. 3. 3D drawings of the experimental chamber design to test Paschen’s law
at high temperature and pressure.
Fig. 4. Electrical schema used on Paschen's experience.
The electrode without the micrometer screw gauge in the
experimental chamber was polarized by a high voltage power
supply with a 100 MΩ protection resistance in series, to limit
the current to avoid high currents after breakdown. The applied
voltage as well as the voltage drop due to electrical discharges
between the electrodes were measured using a Tektronix P6015
high voltage probe (V), connected as shown in figure 4. The
discharge current (A) was measured using a Tektronix CT-1
current probe connected between the electrode with micrometer
screw gauge and ground.
A. Paschen’s curve as a function of the density of the gas
Fig. 5. Paschen's curve at room temperature in Pd view and in Nd view for
argon.
As discussed above, because the experiments were
performed in a closed gas volume, it was decided to plot the
results of the Paschen curve not as a function of gas pressure
but rather as a function of gas density, which will be constant
no matter the temperature. To carry out this change of variable
we have used the ideal gas law according to the formula:

4
𝑁 =𝑃
𝑘𝐵𝑇 (4)
Figure 5 shows the Paschen’s curves in Pd view and in Nd
view where the numerical labels on the lower x-axis were
transposed to those on the upper x-axis using the formula 4.
From this point of the article all our results will be shown in the
Nd view.
Paschen’s law is formulated for the case where the electric
field is homogeneous. To evaluate the homogeneity of the
electric field in the chosen geometry for the tests, a simulation
using finite elements (COMSOL) has been carried out, and is
shown in figures 6 and 7.
Figure 6 shows the result, with 616 µm inter-electrode
distance and 1.6 cm sphere diameter while figure 7 shows a
zoom of figure 6 which better shows the distribution of the
electric field.
B. Simulation of electric field in Sphere-Sphere geometry
Fig. 6. Simulation of electric field, through a finite elements, in sphere-sphere
geometry, with 616µm inter-electrode distance and 1.6cm sphere diameter.
Fig. 7. Zoom of figure 6, between ±1mm in y-axis and from zero to 2mm on
x-axis.
Figure 7 shows how the electric field between the electrodes is
uniform axially on the center line of the spheres (between 0 and
0.0005m radius vertical variation is less than 2%). This
calculation and the fact that the experimental conditions are on
the right-hand side of the Paschen curve should imply that the
observed PDs were created in the shortest path region and thus
in a homogeneous electric field.
C. Change in inter-electrode distance due to material
expansion caused by temperature variation
After some tests it was clear that it was necessary to take into
account the expansion of the materials in the experimental
chamber due to the temperature change. The expansion was
found to significantly affect the inter-electrode distance. To
solve this challenge, calculations were made based on linear
expansion of the various components making up the chamber.
To verify these calculations, the following test was made: the
inter-electrode distance was adjusted to a known value at room
temperature. The experimental chamber was then placed in a
climate-controlled device which could cool the chamber down
as low as -50°C and contact between the electrodes was
measured using a multimeter.
Figure 8 shows the variation of the inter-electrode distance
as a function of the temperature variation calculated based on
the chamber geometry and materials (blue line), and the
experimental tests for contact of the electrodes when cooling
the chamber (red points). The tests may be seen to verify the
calculation. The calculation of the inter-electrode distance
variation with temperature will therefore be used in the
following section to correct the inter-electrode distance.
Fig. 8. Variation of inter-electrode distance as a function of the temperature
variation calculated using a model, based on the linear expansion taking into
account the complete geometry of the experimental chamber as well as the
different materials involved, (blue line) and the experimental points obtained
through laboratory tests (red circles).
5
IV. PASCHEN’S LAW TEMPERATURE EFFECTS: RESULTS AND
EXPERIMENTAL UNCERTAINTIES
Fig. 9. Paschen's curve for argon at room temperature (blue line) and
experimental points on Paschen's curve obtained by varying the gas density in
the experimental chamber at room temperature with two inter-electrode
distances.
Using the tube furnace as seen in the schema in figure 4, the
temperature of the chamber was adjusted and measured by two
thermocouples, one placed in contact with the chamber exterior
and the other inside the furnace itself. The applied voltage was
then increased until detection of a discharge via the current and
voltage measurements. Each experimental point was obtained
several times, so that for each point, the experimental
uncertainty could be calculated, which will also be shown in
figure 11 and table 3.
Firstly, the points on Paschen’s curve were obtained at room
temperature in order to test the experimental chamber and to
have some room temperature reference points.
TABLE 2
PARAMETERS OF PASCHEN’S LAW FOR ARGON [15] [16] [17]
𝜺𝒊 𝝈 𝑻 𝜸
2.524 ∙ 10−18𝐽 3 ∙ 10−20𝑚2 298 𝐾 2.5 ∙ 10−2
Figure 9 shows the theoretical Paschen curve calculated
according to equation 1, using the values in table 2. Also shown
are two series of experimental points, at room temperature,
obtained for two different inter-electrode distances with the
experimental chamber and two series of experimental points
found in the literature [18-19].
Figure 9 shows also that the experimental points from this
work in addition to experimental points found in the literature
deviate slightly from the theoretical Paschen’s curve because,
especially for argon, the theoretical Paschen’s curve is a good
but not perfect approximation of reality. In this specific case
then, in the used formula (eq. 1), the secondary emission
coefficient (𝛾) is an approximation of the real one, because it
takes into account only the positive ion impact on the cathode.
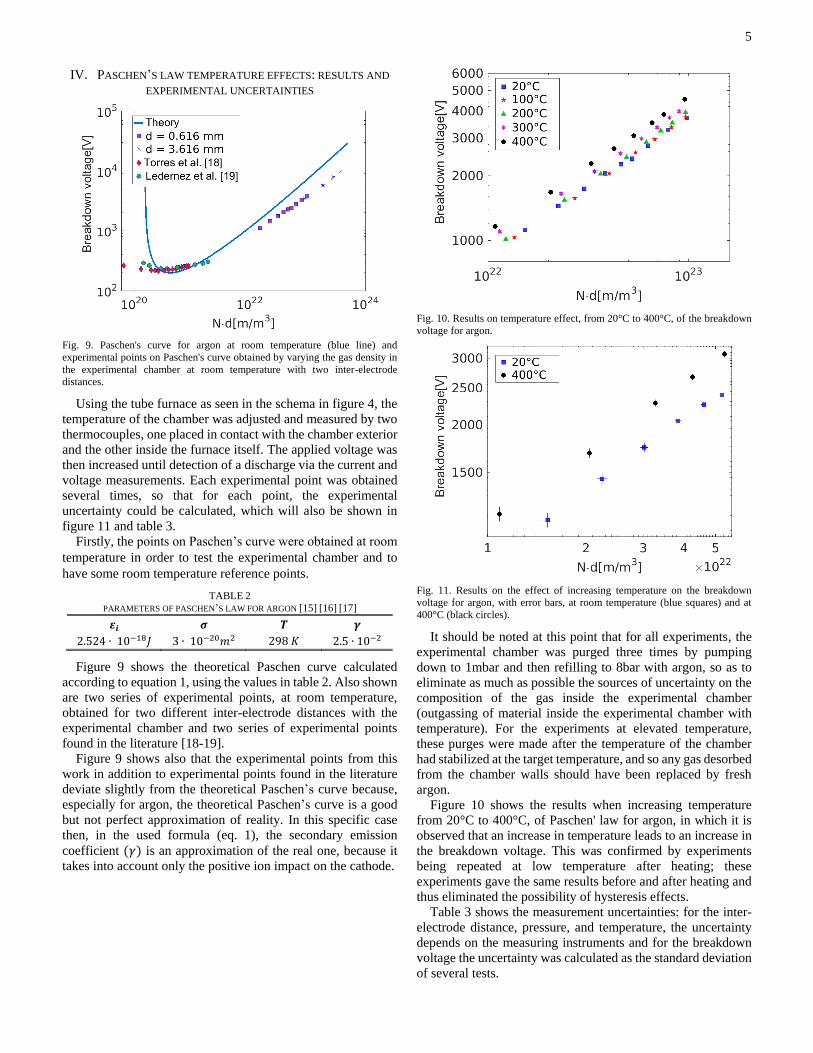
Fig. 10. Results on temperature effect, from 20°C to 400°C, of the breakdown
voltage for argon.
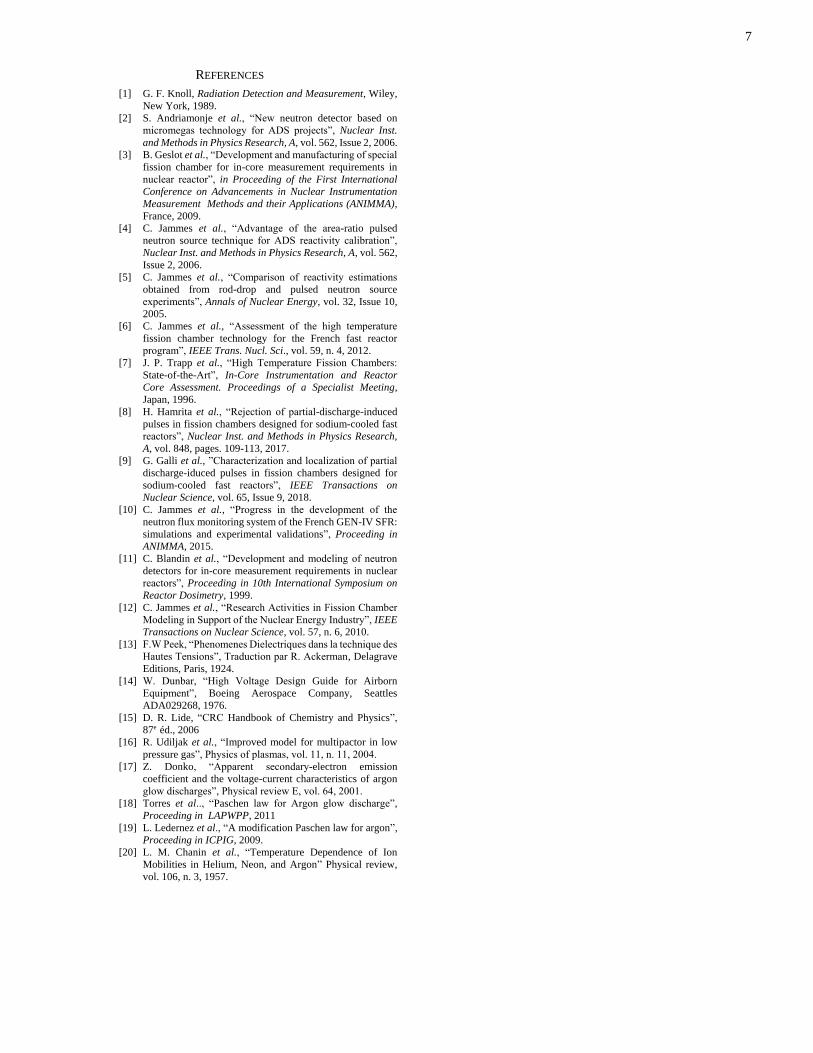
Fig. 11. Results on the effect of increasing temperature on the breakdown
voltage for argon, with error bars, at room temperature (blue squares) and at
400°C (black circles).
It should be noted at this point that for all experiments, the
experimental chamber was purged three times by pumping
down to 1mbar and then refilling to 8bar with argon, so as to
eliminate as much as possible the sources of uncertainty on the
composition of the gas inside the experimental chamber
(outgassing of material inside the experimental chamber with
temperature). For the experiments at elevated temperature,
these purges were made after the temperature of the chamber
had stabilized at the target temperature, and so any gas desorbed
from the chamber walls should have been replaced by fresh
argon.
Figure 10 shows the results when increasing temperature
from 20°C to 400°C, of Paschen' law for argon, in which it is
observed that an increase in temperature leads to an increase in
the breakdown voltage. This was confirmed by experiments
being repeated at low temperature after heating; these
experiments gave the same results before and after heating and
thus eliminated the possibility of hysteresis effects.
Table 3 shows the measurement uncertainties: for the inter-
electrode distance, pressure, and temperature, the uncertainty
depends on the measuring instruments and for the breakdown
voltage the uncertainty was calculated as the standard deviation
of several tests.

6
Figure 11 shows some of the same data from Figure 10 while
zooming in and adding the error bars, calculated starting from
the uncertainty values listed in Table 3.
TABLE 3
EXPERIMENTAL CHAMBER: PARAMETERS AND CONSTRAINTS
𝑻 ≤ 𝟐𝟓℃
d [µm] V [Volt] T [K] P [mbar]
±10 ±50 ±1 ±50
𝑻 > 𝟐𝟓℃
d [µm] V [Volt] T [K] P [mbar]
±25 ±50 ±1 ±50
V. DISCUSSION OF RESULTS WITH PROPOSED THEORY
Fig. 12. Histograms of full width at half maximum, at 20°C (blue) and at 650°C
(red), of the pulses created by a fission chamber, filled with argon at 3.5 bar.
The Dunbar and Peek corrections, both intended for use in
the situation of a gas which is free to expand, logically give a
decrease of breakdown voltage for an increase in temperature,
due to the gas density decrease. The experiments in this work
indicate that, at constant gas density, an increase in temperature
leads to an increase in breakdown voltage.
To explain this result, it is proposed that the Maxwell
distribution and corresponding drift velocity is shifted
downward for increasing temperatures, which is true for argon
ions in the argon itself [20]. Figure 13 shows a given Maxwell
distribution of the free electrons velocities and drift velocity;
the population of energetic electrons which are involved in
ionization and therefore to breakdown. If the distribution shifts
to the left as shown in Figure 13, the critical density of free
energetic electrons may be insufficient to initiate a detectable
breakdown, and therefore a higher applied voltage will be
needed to observe breakdown. But when we increase the
temperature we know, using the fission chamber experiences
results in figure 12, drift velocity shifts to smaller values and
the velocity distribution is modified accordingly, in this way we
can imagine that the density of electrons responsible for the
avalanche (𝑛𝐴) decreases enough to extinguish the
phenomenon of discharge, therefore the only way to re-ignite
the discharge phenomenon is an increasing in the voltage power
supply in way to restore the required value of the electron
density responsible for the avalanche.
There are many examples in the literature of how the drift
velocity of free electrons decreases with increasing temperature
in solid insulators, but the analogy to a gas is not trivial. In order
to investigate this idea, a fission chamber [1] was used, filled
with argon at 3.5 bar, in which full width at half maximum
(FWHM) of the pulses is inversely proportional to the drift
velocity of the free electrons in the gas. In the experiment pulses
were recorded using one fission chamber irradiated by the same
neutron flux at 20°C and at 650°C, and the FWHM of each
pulse was calculated in order to get information on the variation
of FWHM as a function of temperature.
Figure 12 shows the histograms of FWHM, at 20°C and at
650°C, of the pulses created by the same fission chamber, filled
with argon at 3.5 bar. Figure 12 shows also how increasing
temperature leads to an increase of the mean FWHM; this
indicates a decrease of the drift velocity of free electrons.
This phenomenon can be explained (drawing a parallel with
the temperature effects on the drift velocity of the electrodes in
a conductor) by the following reasoning: in a closed gas
volume, the mean free path of electrons is constant but the
average time between collisions decreases with increasing
temperature and this increased collision frequency causes the
decrease of the drift velocity of free electrons.
Fig. 13. Schema of Maxwell distribution of free electrons in gas with details
with regards to the drift velocity and the density of free electrons responsible
for the avalanche.
VI. CONCLUSION AND FUTURE WORK
In this article results were presented on the effect of
temperature Paschen’s law for argon, in a closed gas volume. It
was observed that breakdown increases with increasing
temperature at a fixed gas density. A theory, supported by
experimental results, has been proposed to explain this
phenomenon.
Future work will consider other values for the inter-electrode
distance as well as different electrode geometries, which will be
tested also in the presence of a ceramic insulators, to look for
the effects of temperature on a triple point, metal-gas-solid
insulator. Finally, different gases as well as gas mixtures, such
as argon plus nitrogen, because of their wide use in the nuclear
sensor industry, will be tested.
7
REFERENCES
[1] G. F. Knoll, Radiation Detection and Measurement, Wiley,
New York, 1989.
[2] S. Andriamonje et al., “New neutron detector based on
micromegas technology for ADS projects”, Nuclear Inst.
and Methods in Physics Research, A, vol. 562, Issue 2, 2006.
[3] B. Geslot et al., “Development and manufacturing of special
fission chamber for in-core measurement requirements in
nuclear reactor”, in Proceeding of the First International
Conference on Advancements in Nuclear Instrumentation
Measurement Methods and their Applications (ANIMMA),
France, 2009.
[4] C. Jammes et al., “Advantage of the area-ratio pulsed
neutron source technique for ADS reactivity calibration”,
Nuclear Inst. and Methods in Physics Research, A, vol. 562,
Issue 2, 2006.
[5] C. Jammes et al., “Comparison of reactivity estimations
obtained from rod-drop and pulsed neutron source
experiments”, Annals of Nuclear Energy, vol. 32, Issue 10,
2005.
[6] C. Jammes et al., “Assessment of the high temperature
fission chamber technology for the French fast reactor
program”, IEEE Trans. Nucl. Sci., vol. 59, n. 4, 2012.
[7] J. P. Trapp et al., “High Temperature Fission Chambers:
State-of-the-Art”, In-Core Instrumentation and Reactor
Core Assessment. Proceedings of a Specialist Meeting,
Japan, 1996.
[8] H. Hamrita et al., “Rejection of partial-discharge-induced
pulses in fission chambers designed for sodium-cooled fast
reactors”, Nuclear Inst. and Methods in Physics Research,
A, vol. 848, pages. 109-113, 2017.
[9] G. Galli et al., ”Characterization and localization of partial
discharge-iduced pulses in fission chambers designed for
sodium-cooled fast reactors”, IEEE Transactions on
Nuclear Science, vol. 65, Issue 9, 2018.
[10] C. Jammes et al., “Progress in the development of the
neutron flux monitoring system of the French GEN-IV SFR:
simulations and experimental validations”, Proceeding in
ANIMMA, 2015.
[11] C. Blandin et al., “Development and modeling of neutron
detectors for in-core measurement requirements in nuclear
reactors”, Proceeding in 10th International Symposium on
Reactor Dosimetry, 1999.
[12] C. Jammes et al., “Research Activities in Fission Chamber
Modeling in Support of the Nuclear Energy Industry”, IEEE
Transactions on Nuclear Science, vol. 57, n. 6, 2010.
[13] F.W Peek, “Phenomenes Dielectriques dans la technique des
Hautes Tensions”, Traduction par R. Ackerman, Delagrave
Editions, Paris, 1924.
[14] W. Dunbar, “High Voltage Design Guide for Airborn
Equipment”, Boeing Aerospace Company, Seattles
ADA029268, 1976.
[15] D. R. Lide, “CRC Handbook of Chemistry and Physics”,
87e éd., 2006
[16] R. Udiljak et al., “Improved model for multipactor in low
pressure gas”, Physics of plasmas, vol. 11, n. 11, 2004.
[17] Z. Donko, “Apparent secondary-electron emission
coefficient and the voltage-current characteristics of argon
glow discharges”, Physical review E, vol. 64, 2001.
[18] Torres et al.., “Paschen law for Argon glow discharge”,
Proceeding in LAPWPP, 2011
[19] L. Ledernez et al., “A modification Paschen law for argon”,
Proceeding in ICPIG, 2009.
[20] L. M. Chanin et al., “Temperature Dependence of Ion
Mobilities in Helium, Neon, and Argon” Physical review,
vol. 106, n. 3, 1957.