Embed Size (px)
Citation preview

Project Number: SEV-CAS1
Passive Flow Control in a Highly-Loaded Compressor Cascade
A Major Qualifying Project Report:
Submitted to the Faculty of
WORCESTER POLYTECHNIC INSTITUTE
in partial fulfillment of the requirements for the
Degree of Bachelor of Science
By
Alexander Meyer-Lorentson, Bridget Stevens, and Lane Thornton
3/5/2011
Advisor: Professor Simon Evans
Certain materials are included under the fair use exemption of the U.S. Copyright Law and have been
prepared according to the fair use guidelines and are restricted from further use.

i
Executive Summary
Increasing the loading of compressor stages is one of the main areas of research in the gas turbine
industry. The use of highly loaded blades allows a greater pressure rise per stage, allowing the number
of stages for a given overall pressure ratio to be decreased, which ultimately reduces weight and cost.
The drawback of these blades, however, is that they are prone to suction side boundary layer
separation, which greatly reduces compressor efficiency. Numerous flow control techniques have been
investigated for delaying or eliminating this separation, including suction surface suction and blowing.
Most experimentation in this field has been conducted using active control methods where air is piped
into the system from an external source. This project, however, centers on the use of a passive blowing
technique to create vortices which will mix high momentum fluid from the free stream in the boundary
layer, re-energizing it and delaying boundary layer separation. A linear compressor cascade rig was
designed and built for the purpose of carrying out experiments to determine the effectiveness of these
passive jets.
The design process included the modification of an existing highly loaded blade profile to move both the
suction peak and boundary layer separation point closer together. From data generated by analysis of
the new blade profile, jet hole locations were chosen in order to maximize the effectiveness of the jets.
Models of potential internal blade structures were also created, allowing the internal geometry to be
chosen. The rig itself was designed to be used with an existing blower-type wind tunnel and to hold the
blades at the correct angle of incidence. Other considerations included access to the interior of the rig
for experimental set-up and data collection and room for the future addition of a rotating bar apparatus
to simulate wakes experienced by real compressor blades.

ii
Acknowledgements
The completion of this project would not have been possible without contributions from a large number
of people:
First and foremost, we would like to thank our advisor, Professor Simon Evans, for his advice,
experience, and guidance throughout the project. From our preliminary research to our final design
and construction, he provided answers to our questions and always kept us on the right track.
We would also like to thank Neil Whitehouse. Particularly during the fabrication phase of the
project, his knowledge, experience, and willingness to help us at all hours of the day and night were
invaluable. There are few people in the world willing to give a group of undergraduates working
through the night his phone number and permission to call him and we are very fortunate that Neil
is one of them.
Our project does not exist in a vacuum, but rather with a blower-type wind tunnel. Without
contributions by Evan Morrison, M. Kashif Azeem, and Dan Nahill, our project would be useless.
Without them, there would be no wind tunnel, no blades, and no pressure traverses, rending our
project a useless pile of acrylic, plywood, aluminum, and tooling board.
We would also like to thank the other members of the aerospace engineering faculty and the
aerospace engineering class of 2011. Their support and probing questions throughout our
presentations helped us clarify our explanations and improve our presentation skills.
In addition, contributions from Gerry Berry, Barbara Furhman, Victor Mott, Kevin Stevens, and
Candi Thornton made the process of purchasing and machining our materials much easier.
Finally, we would like to thank our parents, Carl Lorentson and Elizabeth Meyer, Kevin and Laura
Stevens, and Ed and Candi Thornton for providing support and sympathetic ears whenever we
complained about the difficulties of experimental aerodynamics.

iii
Authorship
The timely completion of this project depended on equal contributions from all group members:
Alexander Meyer-Lorentson, Bridget Stevens, and Lane Thornton.

iv
Table of Contents
Passive Flow Control in a Highly-Loaded Compressor Cascade .................................................................. ii
Acknowledgements ................................................................................................................................... ii
Authorship ................................................................................................................................................. iii
Table of Contents ..................................................................................................................................... iv
Table of Figures ........................................................................................................................................... vi
1 Introduction ..................................................................................................................................... 1
1.1 Objectives ........................................................................................................................................ 2
2 Literature Review ............................................................................................................................. 3
2.1 Compressors in Gas Turbines ........................................................................................................... 3
2.2 Compressor Cascades ...................................................................................................................... 4
2.3 Highly Loaded Blades ....................................................................................................................... 7
2.4 Flow Control ..................................................................................................................................... 8
2.4.1 Active Flow Control .......................................................................................................................... 8
2.4.2 Passive Flow Control ........................................................................................................................ 9
3 Design............................................................................................................................................. 10
3.1 Requirements ................................................................................................................................. 10
3.2 Constraints ..................................................................................................................................... 11
3.3 Blade Profile Design ....................................................................................................................... 12
3.3.1 Sizing .............................................................................................................................................. 12
3.3.2 CFD Modeling ................................................................................................................................. 12
3.4 Jet Hole Design ............................................................................................................................... 13
3.4.1 Black Box Model ............................................................................................................................. 14
3.4.2 Internal models .............................................................................................................................. 16
3.5 Rig Design ....................................................................................................................................... 18

v
3.6 Challenges ...................................................................................................................................... 20
4 Future Work ................................................................................................................................... 21
4.1 Commissioning ............................................................................................................................... 21
4.2 Experimentation ............................................................................................................................ 21
4.3 Rotating Bar Rig ............................................................................................................................. 22
5 Conclusion ...................................................................................................................................... 23
6 References ..................................................................................................................................... 24
APPENDIX: A MISES Flow Condition File ............................................................................................... 26
APPENDIX: B MISES Blade File .............................................................................................................. 27

vi
Table of Figures
Figure 1: Sketch of Compressor Cascade Rig ................................................................................................ 5
Figure 2: Original Blade ............................................................................................................................... 12
Figure 3: Thickened Trailing Edge ............................................................................................................... 12
Figure 4: Unmodified Cp Distribution ......................................................................................................... 13
Figure 5: Modified Cp Distribution ............................................................................................................. 13
Figure 6: Example of "Black Box" model output ......................................................................................... 14
Figure 7: Channel Internal Geometry ......................................................................................................... 16
Figure 8: Plenum Internal Geometry .......................................................................................................... 16
Figure 9: Compressor Cascade Rig .............................................................................................................. 19
Figure 10: Rotating Bar Rig ......................................................................................................................... 22

1
1 Introduction
Compressor stage loading is a main driver of the gas turbine industry. Of particular interest is the use of
highly loaded blades to improve compressor stage loading, and decrease cost. Highly loaded blades
generate a higher pressure rise than conventional blades, allowing a greater stage pressure rise without
adding extra blades. Since fewer stages need to be installed to yield the same overall pressure ratio,
decreasing part count, manufacturing cost is reduced. Additionally, fewer stages result in decreases in
weight and size, allowing performance improvements to be made in the aircraft. However, highly
loaded blades are susceptible to boundary layer separation from the suction surface. This separation
decreases the efficiency of the compressor, negating the benefits of the highly loaded design. Flow
control aims to delay or prevent this separation, thereby retaining the benefits associated with a highly
loaded blade.
There are two types of flow control: active and passive. Active flow control is boundary layer separation
control that requires actuation or other energy input where passive flow control does not require any
energy input into the system. The most commonly studied control method for use in compressors is
active blowing of air onto the blade [1]. Active blowing delays boundary layer separation by adding
momentum to the flow. This method of flow control requires piping to bring pressurized air from other
sections of the engine. The losses associated with bleeding this pressurized air have a negative effect on
engine performance.
Consequently, investigation of passive flow control techniques that do not require air bleeds is of great
interest to the gas turbine industry. This report describes the use of channels, running from the
pressure to the suction surface of highly loaded blades, to create a series of jets on the suction surface.
These jets, driven by the pressure difference between the blade surfaces, will add momentum to the
boundary layer, reenergizing and reattaching the flow. This technique aims to provide the same control
as powered jets without the added cost and losses associated with bleeding air from other sections of
the engine.

2
1.1 Objectives
The goal of this project was to design and construct a linear compressor cascade to test the
effectiveness of passive flow control in delaying boundary layer separation on the suction side of highly
loaded compressor blades. The project consisted of four essential objectives. These objectives were:
To design a linear cascade rig for flow control testing
To create an experimental facility that was easy to use
To design and manufacture highly loaded blades complete with jet holes for passive flow control
To prepare the cascade for experiments to investigate the effectiveness of passive flow control on
highly-loaded blades.

3
2 Literature Review
In order to understand the techniques used in the design and construction of a linear compressor
cascade, as well as the methodology used to carry out passive flow control experiments, it was
necessary to examine previous research conducted on flow control in compressor cascades. This
chapter provides a brief overview of gas turbine compressors, compressor cascades, the benefits of
highly loaded blades, and methods of flow control used in compressors.
2.1 Compressors in Gas Turbines
The purpose of a compressor in a gas turbine is to increase the stagnation pressure in the fluid before it
enters the combustor. There are two types of compressors; centrifugal and axial. Centrifugal
compressors deliver a higher pressure rise per stage than axial compressors and typically occupy a
smaller space; however, centrifugal compressors operate at a significantly lower efficiency than axial
compressors. Due to their higher efficiency, axial compressors are more widely used in gas turbines for
propulsion and power generation than centrifugal compressors. Axial compressors utilize rows of
rotating blades alternating with rows of stationary blades. A set of rotating and stationary blades is
called a stage. The rotating blades increase the stagnation pressure while the static blades reduce the
swirl velocity. The total pressure rise through a stage is limited by boundary layer separation. Boundary
layer separation in one blade row can cause the engine to stall.
One of the major drivers in the design of a gas turbine is specific fuel consumption, especially for
commercial aircraft. In general, specific fuel consumption, the amount of fuel burned per unit of thrust,
decreases with increasing compressor pressure ratio. For applications where low fuel consumption is of
primary importance, high compressor pressure ratios are used. High pressure rises come with a cost;
compressors with high pressure ratios require more stages, increasing weight and cost. They also
require a larger turbine to drive them, further increasing weight and cost, and reducing power available
for thrust. Another important parameter which directly effects the specific fuel consumption is the
compressor efficiency. Compressor efficiency has a large effect on the overall thermal efficiency of the
gas turbine and also on the ideal compressor pressure ratio, which needs to be taken into account
during the compressor design process. Lower efficiencies per stage lead to a lower pressure rise, which
lowers thermal efficiency. Increasing the efficiency of each stage of the compressor motivates much of
the research done in compressor cascades and on flow control.

4
2.2 Compressor Cascades
Although there are numerical methods to calculate flow parameters through a blade row, blade
performance is typically determined experimentally through cascade testing [2]. Linear compressor
cascade testing serves as the first experimental test of new blade designs for compressors by simulating
blade-to-blade interactions and two-dimensional flow through a compressor blade row. After a design is
tested in a linear cascade, additional tests are performed which more closely simulate compressor
conditions, including tests to simulate wake shedding from upstream blade rows and other secondary
flows found in compressors as well as testing in annular cascades to simulate the three-dimensional
nature of the flow in a real compressor. Cascade flow is defined as the 2-D flow on a surface of constant
radius from the rotational axis of the compressor. For the purpose of analysis, this flow is “unwrapped”
into a linear row of compressor blades. Compressor cascade testing can also give a context with which
losses from secondary flows in the compressor may be estimated.
Compressor cascade rigs generally have three major parts: the wedge, which attaches to the wind
tunnel providing mass flow through the cascade and sets the angle of incidence; the cassette, which
holds the cascade itself; and the section downstream of blade exit, where instruments are used to
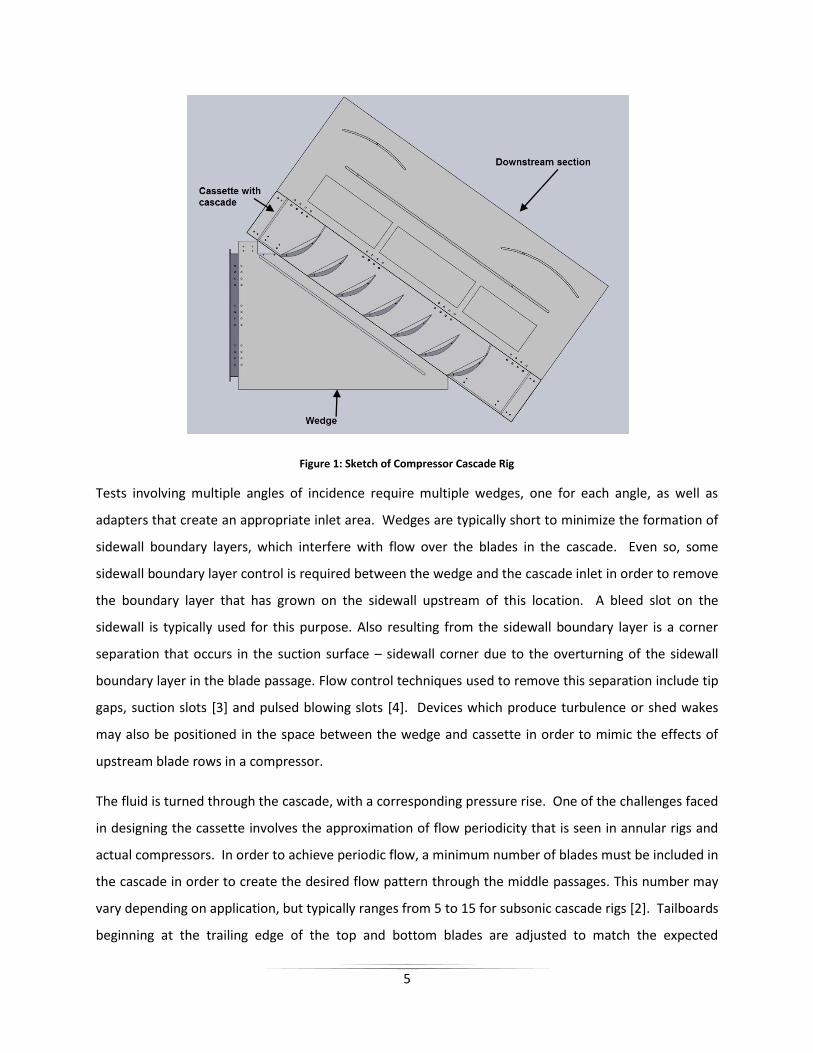
measure blade performance. Figure 1 is a labeled diagram showing the three main parts of the cascade
rig.
5
Figure 1: Sketch of Compressor Cascade Rig
Tests involving multiple angles of incidence require multiple wedges, one for each angle, as well as
adapters that create an appropriate inlet area. Wedges are typically short to minimize the formation of
sidewall boundary layers, which interfere with flow over the blades in the cascade. Even so, some
sidewall boundary layer control is required between the wedge and the cascade inlet in order to remove
the boundary layer that has grown on the sidewall upstream of this location. A bleed slot on the
sidewall is typically used for this purpose. Also resulting from the sidewall boundary layer is a corner
separation that occurs in the suction surface – sidewall corner due to the overturning of the sidewall
boundary layer in the blade passage. Flow control techniques used to remove this separation include tip
gaps, suction slots [3] and pulsed blowing slots [4]. Devices which produce turbulence or shed wakes
may also be positioned in the space between the wedge and cassette in order to mimic the effects of
upstream blade rows in a compressor.
The fluid is turned through the cascade, with a corresponding pressure rise. One of the challenges faced
in designing the cassette involves the approximation of flow periodicity that is seen in annular rigs and
actual compressors. In order to achieve periodic flow, a minimum number of blades must be included in
the cascade in order to create the desired flow pattern through the middle passages. This number may
vary depending on application, but typically ranges from 5 to 15 for subsonic cascade rigs [2]. Tailboards
beginning at the trailing edge of the top and bottom blades are adjusted to match the expected

6
streamline from the blade and are used to induce periodic flow through the middle channels. In
addition to the need for periodic flow, the size and number of blades in the cascade affect the
experimenter’s ability to take accurate and useful measurements. Although it is desirable to have a
large number of blades in the cascade, blade size decreases as the number of blades increases in order
to preserve the design solidity. Preserving the design Reynolds number becomes more difficult because
the wind tunnel must operate at a higher velocity [2]. The difficulty of taking accurate pressure
measurements also increases as blades become smaller as there is less room for instrumentation.
The section downstream of blade exit, which is a fairly large, open section of the rig, is where pressure
probe transverses are performed and data is taken. As previously mentioned, suction slots are
sometimes used to remove sidewall boundary layers that have developed in the wedge. The section
downstream of the blades terminates at a mesh screen which allows the pressure inside the rig to be
higher than atmospheric pressure, driving the air out of the suction slots and removing the boundary
layer.

7
2.3 Highly Loaded Blades
The weight and cost of a gas turbine compressor depends in part on the number of blade rows. This
number is set by the pressure rise per stage and the overall compressor pressure ratio stipulated by the
engine design. Fewer stages leads to smaller, lighter, and cheaper engines. Engines with fewer stages,
however, require more work from each rotating blade row. The stagnation pressure rise for a perfect
fluid turned through a given angle is given by Equation (1) [2]:
(1)
Where and refer to radial and axial components of the fluid velocity, respectively, and refers to
the rotational speed of the blades. Equation (1) shows that a higher turning angle through the blade
row, represented by the change in , produces a higher stagnation pressure rise. A blade can therefore
do more work on the fluid by operating as close as possible to the condition for which its suction surface
separates. Operating in this condition, however, carries additional risks and a safety margin must be
maintained to prevent blade stall [1]. The diffusion factor is another measure of blade loading, and is
given by Equation (2) [2]:
(2)
Where and refer to the exit and inlet velocities and refers to the solidity of the blade row. In
general, increasing diffusion factor beyond a limiting value determined by chord and Reynolds number
induces boundary layer separation with accompanying stagnation pressure losses [2,5]. Compressor
efficiency is also reduced by operation close to stall, as boundary layer losses increase. Boundary layer
control can delay separation, allowing the blade to operate closer to its uncontrolled separation
condition, achieving a higher diffusion factor, higher turning angle, higher blade loading and, therefore,
higher pressure rise per stage.

8
2.4 Flow Control
Flow control is broadly defined as any technique used to change the behavior of a larger flow without
acting on a similarly large scale [6]. The desired behavior changes include delay of boundary layer
separation, boundary layer mixing, and wake management [7]. Flow separation greatly increases drag, a
problem first described by Prandtl, as referenced by Gad-el-Hak [6]. There are two types of flow control,
active and passive. In compressors, active flow control is the most widely researched and requires that
energy be added to the system. In contrast, passive flow control does not require additional energy
input.
2.4.1 Active Flow Control
Several methods of active flow control are described in the literature: suction, jet injection, wall heat
transfer, moving walls, and vortex generators. Suction, first used by Prandtl to delay boundary layer
separation on a cylinder, involves the removal of low momentum fluid near the wall. Experiments, such
as that done by Shuang et al, have shown that the optimal location for suction is near the separation
point [1]. Jet injection is another popular method for controlling boundary layer separation. Steady or
unsteady jets of fluid are injected into the boundary layer in order to add momentum to the low
momentum fluid to re-energize the flow, delaying boundary layer separation. This method is most
effective when the blowing is done just upstream of the separation point and the blowing is tangential
to the flow direction. Tangential blowing allows the momentum increase to affect the flow further down
the blade.
Wall heat transfer seeks to change the properties of the fluid in contact with the surface. In the case of
gases, if the fluid near the body surface is cooled, density increases and viscosity decreases, resulting in
higher speed and momentum. The higher momentum flow near the surface is more resistant to
boundary layer separation [6]. This method, while suited to flow control on the wings of cryogenically
fueled aircraft, is not suited for use in turbo-machinery because of the need for a large heat sink. Using
moving walls to control boundary layer separation slows the growth of the boundary layer by reducing
motion relative to the surface and adding momentum to the fluid. Rotating cylinders are generally used.
However, like heat transfer, they are better suited to aircraft wings than to turbomachinery [6]. Finally,
vortex generation is a technique where vortices are induced on the surface in order to mix the high
momentum free stream fluid with the low momentum fluid in the boundary layer. This is usually done
with jets pitched and skewed to the surface. This mixing increases the momentum near the surface,
delaying separation [8]. Active flow control techniques require energy or pressurized air from other

9
parts of the engine, reducing the overall performance of the engine. This makes passive flow control an
attractive option for delaying boundary layer separation.
2.4.2 Passive Flow Control
In some cases, passive flow control techniques resemble certain methods for active flow control without
actuation or external driving. These techniques include jet injection driven by pressure differences on
the suction and pressure surfaces of a blade or airfoil and passive vortex generation [9]. Jet injection, or
passive blowing, is used to increase the momentum of the slowly moving fluid near the surface of the
airfoil or blade. The jet velocity is limited by the maximum achievable pressure difference on the two
surfaces of the body, and, like active blowing, is usually in a direction tangent to the flow in order to
maximize the effect of momentum increase. Passive vortex generator jets, like active vortex generator
jets, are jets which operate at an angle to the flow over the surface and generate vortices that mix the
low momentum boundary layer with the high momentum free stream in order to delay boundary layer
separation. Like stream-wise jet injection, these vortex generator jets are limited by the pressure
differences achieved by the pressure and suction sides of the body. Vortex generator tabs are another
passive technique used to induce vortices to mix higher momentum fluid into the boundary layer [10].
These tabs have very high angles of attack and induce vortices which increase boundary layer
momentum without actuation or mass injection from another area of the engine. One disadvantage of
passive flow control is that it cannot be disengaged when not necessary or detrimental to performance.

10
3 Design
In order to perform experiments to investigate the effectiveness of passive flow control on highly-
loaded blades, an experimental rig was designed and built. The design process consisted of determining
the profile of a highly-loaded blade to be tested, modeling the flow characteristics of jet-holes in the
blade, designing a rig with which experiments could be conducted, and determining the necessary
instrumentation for data capture during experimentation.
3.1 Requirements
In order to simulate flow conditions typical of a compressor stage, the cascade had to meet some
essential design requirements:
The Reynolds Number was fixed at 5x10⁵ in order to produce similar flow properties to those
expected in an early stage compressor blade row.
The solidity (chord divided by blade spacing) was set to 1.3, according to the original stage design
supplied.
Table 1 summarizes the design of the blade row. The baseline blade was designed as part of a highly
loaded stage by M. Kashif Azeem, a graduate student in the Department of Mechanical Engineering
at WPI. The profile required modification to extend the suction peak closer to the boundary layer
separation on the suction surface.
Reynolds Number 500,000
Blade Inlet Flow Angle 54.4°
Blade Outlet Flow Angle 0°
Solidity 1.35
Stagger Angle 27.3°
Table 1: Design Requirements
Along with the required blade parameters, the cascade rig had its own set of requirements. It had to be
designed to position the blades correctly in the flow, as well as to hold the instrumentation necessary to
gather data.
The pressure probe used to gather data was to be held one chord downstream of the blades. This
instrumentation requirement set the minimum length for the section downstream of the blade
trailing edges.

11
Upstream bleed slots parallel to the leading edge plane were required to remove the sidewall
boundary layers, creating a clean flow at the entrance to the blade row.
The rig had to be equipped with suction slots on the floor and ceiling approximately 50% chord
upstream of the cassette to remove boundary layers on the floor and ceiling of the flow passage
entering the blade row.
The cascade was also designed with future research in mind. The team had to ensure that the rig
was versatile enough for the addition of a rotating bar rig, which will be added in the future. This
requirement played a large role in the selection of the frame materials and the frame design;
necessitating a flexible arrangement to accommodate the future rig.
3.2 Constraints
Along with the design requirements, this project was also constrained by the following:
Geometry of the existing wind tunnel: The compressor cascade was designed to attach to a blower
type wind tunnel in the WPI Gas Turbine Research Laboratory. The cascade had to fit to the wind
tunnel exit, which limited the span of the blade to a maximum of 17” and the vertical extent of the
cascade to 28”.
Machinability: When the blade and the rig frame were designed, it was necessary to design parts
that could be easily machined in order to be able to build a stable cascade.
Budget: When exploring the options for materials, the team had to restrict quality choices to those
necessary for a successful experiment in order to stay within budget.
Time: The team had a deadline which limited the scope of the project.
12
3.3 Blade Profile Design
The intent of this project is to study the effect of passive flow control on a highly-loaded compressor
blade. Following the design requirements and constraints, blade sizing was completed to determine the
chord and the aspect ratio to be used. In order to produce the appropriate separation for control, the
team determined a blade profile that would generate a specific pressure distribution across the surface
using MISES, a 2-D CFD package.
3.3.1 Sizing
The blade size, defined by the chord, was determined using the blade inlet flow angle, angle of
incidence, solidity, Reynolds Number, and achievable free stream velocities, as detailed in Table 1. The
chord was calculated using the Reynolds Number, air velocity, and viscosity as shown in Equation (3).
Once the chord length was determined to be 10.77”, the aspect ratio of 1.57 was calculated. This is
expected to be large enough that end wall boundary layers will not affect flow over the blades.
(3)
3.3.2 CFD Modeling
To model the airflow over the blade row, the team used the CFD package MISES version 2.63. The MISES
package includes programs for grid generation, flow analysis, and plotting based on user defined flow
conditions and blade coordinates. There is also an interface that allows the user to set specific design
conditions such as the desired pressure distribution [12].
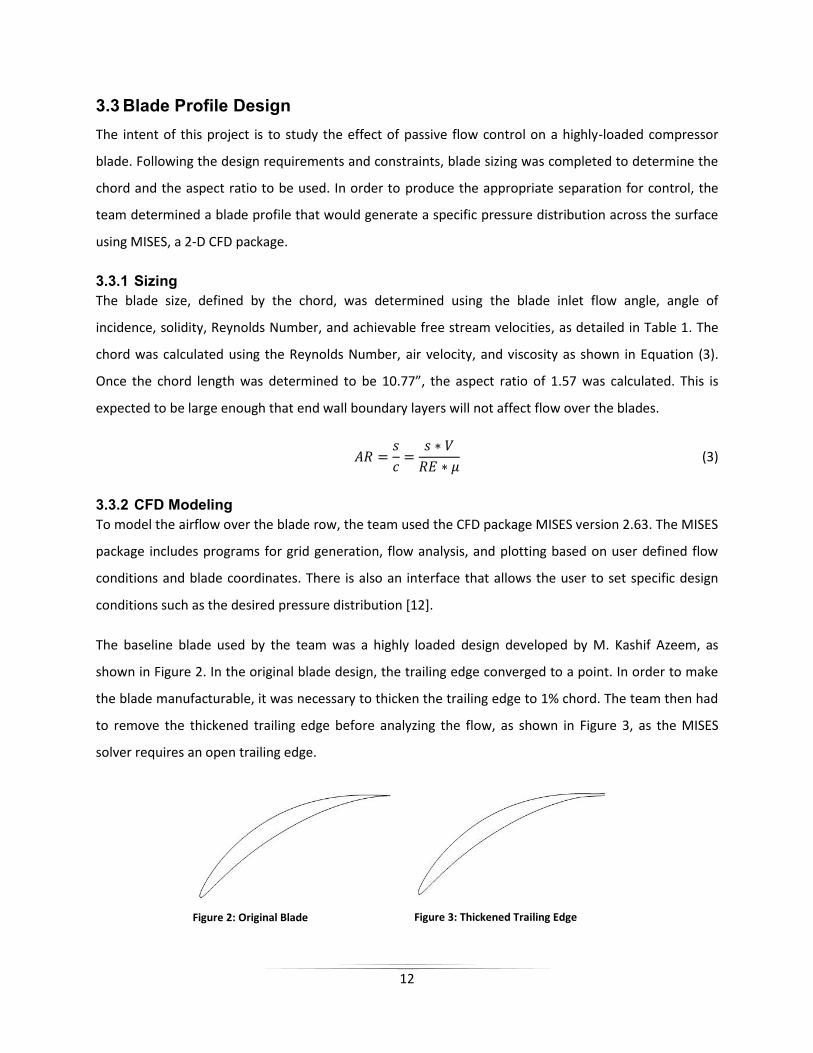
The baseline blade used by the team was a highly loaded design developed by M. Kashif Azeem, as
shown in Figure 2. In the original blade design, the trailing edge converged to a point. In order to make
the blade manufacturable, it was necessary to thicken the trailing edge to 1% chord. The team then had
to remove the thickened trailing edge before analyzing the flow, as shown in Figure 3, as the MISES
solver requires an open trailing edge.
Figure 2: Original Blade
Figure 3: Thickened Trailing Edge

13
Research has shown that jet holes located as close as possible to the separation point are most effective
in controlling separation [1]. The interactive design program within MISES was used to create a blade
geometry that would generate the desired pressure distribution such that the suction peak occurred as
close to the separation point as possible. The original blade design, shown in Figure 4, had the suction
peak at about 10% chord. By modifying the camber line slightly, as shown in Figure 5, the suction peak
was moved back to 25% chord, allowing the potential for a passive jet driven by pressure difference
across the blade to be located closer to the separation point.
Figure 4: Unmodified Cp Distribution
Figure 5: Modified Cp Distribution
The flow conditions used simulate the flow in the compressor of a gas turbine engine. The design
Reynolds Number is set to 5x10⁵, typical of an early stage compressor blade row. The inlet flow angle
was set to 54.4° and the outlet metal angle was set to 0°. The flow input file used in the MISES design
and analysis is included in Appendix A, while the blade geometry file is included in Appendix B.
3.4 Jet Hole Design
In order to design the jet holes, a number of models were created using MATLAB. Data was taken from
the simulations done in the MISES CFD package and each model provided data pertaining to one aspect
of the blades which, in turn, was necessary to make decisions regarding jet hole entrance and exit
locations and the internal design of the blade.

14
3.4.1 Black Box Model
The first model that was created was the “black box” model, which provided the information necessary
to choose the location of the entrance and exit holes. For this purpose, a model was created that would
output contour maps of jet velocity ratio - the jet velocity divided by the free stream velocity
and the injected momentum coefficient ( ), which compares the momentum of the jets to
the momentum of the inlet flow. is defined in Equation (4).
(4)
As the model ignored the internal workings of the blade, a discharge coefficient ( ) was used as an
input to account for losses associated with the internal geometry of the blade. Figure 6 is an example of
the output of the model, for . The result is a contour plot giving the ratio of jet velocity to
free stream velocity on the left and the injected momentum coefficient on the right. In both graphs, the
x axis gives the location of the entrance hole and the y axis gives the location of the exit hole.
Figure 6: Example of "Black Box" model output
With the information provided by the “black box” model, as well as the location of the boundary layer
separation, the entrance and exit hole locations were chosen.

15
In the black-box model the effect of the entrance hole location on both velocity ratio and injected
momentum coefficient is a function of pressure side pressure only. Figure 6 shows that velocity ratio
and injected momentum coefficient are both maximized for the entrance hole located at 80% chord,
which corresponds to the maximum pressure side pressure (see Figure 5). The pressure spike at the
leading edge was neglected due to machining limitations. The same result applies to other discharge
coefficients, not shown. The optimal location for the exit hole is a function of suction side pressure, free
stream velocity, as well as separation location, since the jet must be near the boundary layer separation
point to be effective in controlling separation. The maximum jet velocity ratio occurs for an exit hole
between 10% and 30% of chord. However, since the suction surface separation occurs at 65% chord (see
Figure 5), the exit hole was located at 55% chord.

16
3.4.2 Internal models
Once the location of the jet holes was determined, the next step was to choose the internal structure of
the blade that would minimize losses, leading to higher jet velocity and injected momentum coefficient.
Two internal structures were modeled: two straight channels meeting in the center of the blade, as
shown in Figure 7; and an internal structure featuring a plenum, as shown in Figure 8. Although the
internal structure of a blade including a plenum is more complicated and blades including a plenum are
more difficult to manufacture, it was hoped that the losses associated with this structure would be
lower than in the channel model.
Figure 7: Channel Internal Geometry
Figure 8: Plenum Internal Geometry
Both models used the following formula, a modified form of Bernoulli’s incompressible flow equation, to
determine the jet velocity:
(5)
In this equation, and refer to the pressure and suction side pressures, refers to the air density,
and and are dimensionless constants associated with the losses due to flow through contractions
and bends respectively. Appropriate values for and were chosen for each model based on the
geometry of either the channel or the plenum. The jet velocity determined by this formula was then
divided by the ideal jet velocity to determine a discharge coefficient.
A sketch of the geometry of the blade revealed that due to the selection of jet hole locations, to be
described in Section 3.4.1, a large angle turn would be required for the channel option. The losses
associated with this large angle turn were assumed to be similar to the losses experienced by a flow that
turns 180°. The value of was then set to equal 1.5 [13]. is determined using Equation (5):

17
(6)
Where and are the cross sectional areas upstream and downstream of the contraction,
respectively. In the model, is assumed to be much larger than and was then set to 0.4.
In order to model the losses associated with the plenum, was again determined to equal 0.4 to
account for losses associated with the contraction of the flow from the free stream through the
entrance hole into the plenum. Although the flow experiences another contraction through the exit
hole, these losses were neglected because the interior corners of the exit holes would be machined to
provide a smoother transition to the smaller cross-sectional area, greatly reducing these losses. In
addition, was set to 0 because no significant turns were required for this internal geometry.
The internal models confirmed that there would, in fact, be a higher jet velocity associated with the
plenum option. The discharge coefficient for the plenum was found to be 0.85 while the discharge
coefficient for the channel was calculated to be 0.59. Because the discharge coefficient was so much
higher for the plenum internal structure, indicating that the jet velocity and injected momentum
coefficients would be much better, it was determined that the plenum’s superior performance justified
the extra complexity it will add to the blade design.
With the design described, the expected velocity ratio and injected momentum coefficient are 0.7 and
0.12%, respectively.
18
3.5 Rig Design
The linear compressor cascade was designed for use with an existing blower type wind tunnel located in
the WPI Gas Turbines Research Laboratory. A wedge was constructed to connect the wind tunnel exit to
the cascade while maintaining the correct angle of incidence. Bleed slots were installed upstream of the
blade row, between the wedge and the cassette, facilitating removal of boundary layers developed on
the walls of the wind tunnel.
The experimental plan required the use of flow visualization and instrumentation, both on the blades
and downstream of the blade row. Flow visualization on the blades required access panels built into the
cassette so that the blades could be marked with dyed oil for the visualization. These panels consisted
of removable panels of Perspex located just downstream of the blades. With the panels removed, the
blades could be reached and prepared for data collection. Instrumentation downstream of the blade
row consisted of pressure readings taken across the exit flow. Measurements were taken approximately
one chord downstream of the blade row. A slot was cut in the sidewall of the section downstream of
the blades, approximately 1.5 chords downstream to allow access for the pressure probe mount. The
slot was lined with brushes to minimize air leakage.
In order to allow future modifications to the cascade the region of the cassette adjacent to the blades
was left unobstructed. Tip gaps were used in order to control corner separations in the suction surface
– sidewall corners of the blades while leaving the region of the cassette nearest to the blades
unobstructed. The gaps did not require plumbing running from the blades or any extra modification of
the sidewalls, which might have interfered with flow visualization. The tip gaps were sized according to
the recommendations of Evans [3].
In addition to corner separation control implemented within the cassette, endwall boundary layers
upstream of the blade row were removed by bleed slots cut in the side walls as well as the floor and
ceiling of the cascade rig. Since the pressure upstream of the rig is lower than atmospheric with the rig
exhausting to atmosphere, a mesh screen was installed at the cascade exit. This screen caused a loss in
stagnation pressure across it; pressurizing the rig and allowing a passive bleed of the endwall boundary
layers.
The rig frame was designed to provide a rigid support structure for the rig without obstructing
instrumentation and to allow future modifications. The frame was placed at least six inches from the
side walls of the rig to provide for the future installation of a moving bar wake generator. Support

19
members were not placed in front of the cassette or downstream section of the rig so as not to interfere
with flow visualization and pressure measurements.
The entire rig was designed using SolidWorks 2010 at the WPI Gas Turbine Research Lab. The frame was
constructed of extruded Aluminum provided by Air Inc. The blades were constructed using tooling
board supplied by General Plastics and were manufactured at the WPI Washburn Shops. A complete
CAD model of the cascade rig is shown in Figure 9.
Figure 9: Compressor Cascade Rig

20
3.6 Challenges
Throughout its execution, the limited time frame was the greatest challenge in completing this project.
Initial goals included commissioning and experimentation, but it was decided that the focus of the
project should be the construction of the rig.
Throughout the blade and jet hole design process, both of which relied heavily on the use of the MISES
CFD package, there was a great deal of confusion around the data output by the program. Because
MISES was originally intended to be an in-house code, the manual was difficult to understand and in
some cases, the normalizing parameters weren’t always clear. Despite this difficulty, the necessary data
was found and this data allowed both the modification of the blade profile as well as the simulation of
passively induced jets. The process of calculating the loss coefficient for both internal geometries was
complicated by a lack of similar research done in this area for compressor blades. Eventually this
problem was solved using techniques from a textbook on chemical engineering.
Both the type and size of the materials used to build the rig proved to be challenging. Machining the
acrylic sections that comprised the section downstream of the cassette was beyond the capabilities of
the WPI machine shop and these pieces were machined elsewhere. Choosing a material for the blades
that was easy to machine, paintable, and also capable of having lasers passed over it was difficult.
Tooling board was eventually chosen. Tooling board has all of the desired properties, but was expensive
and difficult to find. Due to the size of our blades, the necessary pieces of tooling board were very near
the limits of the CNC machine used to machine them, which made placing and fixturing the pieces
difficult. In one case, a vice used to hold the blade made contact with a sheet metal guard on the CNC
machine and bent it. Another, incorrect fixturing resulted in the destruction of a blade.

21
4 Future Work
The construction of the linear compressor cascade described in this report represents the first step
towards evaluating the effectiveness of passive jets in controlling boundary layer separation on the
simulated compressor blades. The next tasks include commissioning the rig by establishing periodic
behavior in the blade row, gathering data on both controlled and uncontrolled blades using pressure
traverses and hot-wire anemometers, and modifying the rig to include a rotating bar apparatus to
simulate the wakes generated in real compressors by upstream blade rows.
4.1 Commissioning
Due to the difference between the linear nature of the rig and the actual arrangement of blades in a
compressor, it is necessary to simulate the behavior of the real blades by establishing periodicity in the
middle four passages prior to any experimentation. This involves determining both the pressure losses
associated with each blade as well as the exit flow angle without control. Once these parameters have
been determined with a mid-span pressure traverse, two methods are typically used to modify the flow
until the exit flow angles and pressure losses due to the middle three blades are uniform. The first
method, used by Evans [3], involves modifying upstream bleed slots and will not be used in this rig. The
other method involves setting the tailboards to an appropriate angle to guide the flow exiting the blade
channels. If necessary, the upper tailboard may be perforated to remove any separation occurring on
the tailboard.
4.2 Experimentation
Once periodicity has been established in the uncontrolled case, both mid-span and span-wise pressure
traverses will be performed for the controlled and uncontrolled cases. Differences in pressure losses
will then be calculated, giving an initial indication of the effectiveness of the passive jets in delaying the
boundary layer separation. Once the linear traverses have been performed and analyzed, area traverses
will also be performed within the entire area defined by the capabilities of the traverse gears. This will
allow for more rigorous analysis of three-dimensional effects of the passive jets on the boundary layer.
This is important as the jets are both discrete and angled and will likely not have the same effect on the
boundary layer on every part of the blade span.
In addition to pressure traverses, hot-wire anemometers will be used to measure boundary layer
thickness and other parameters related to the flow over the blades. The hot-wire anemometers will

22
also be used to measure the actual jet velocity. The data from both of these tests will be used to verify
the theoretical data from the MISES analysis and the jet hole model.
4.3 Rotating Bar Rig
Once sufficient testing has been completed with the rig and blades in their current configuration, the
entire rig will be modified to include a rotating bar apparatus similar to the one shown in Figure 10 [14].
This modification is necessary because the airflow into the rig is steady, without turbulence or other
unsteady effects typical of the flow in gas turbines. The bars will be run on belts running around large
wheels driven by a motor that will create wakes more closely simulating the unsteady nature of the flow
incident on real compressor blades. Care was taken during the design process to allow room for this
modification.
Figure 10: Rotating Bar Rig

23
5 Conclusion
The over-arching goals of this project were the design and construction of a linear compressor cascade.
Although commission and experimentation turned out to be outside the scope of the project given time
constraints, these tasks will be carried out either through guided graduate research or through
undergraduate independent study. The design of the cascade rig was completed, however, as was the
entire process of machining and construction. This design process included the modification of a
compressor blade profile, the design of jet holes, the selection of internal blade geometry, and the
design of the rig itself.
The work represented by this report represents the first step in the process towards fully exploring the
effectiveness of passive vortex generator jets in reenergizing the boundary layer over compressor
blades, thereby delaying separation and increasing the effectiveness of each blade in increasing the
pressure through a stage. It is anticipated that this report will serve as a reference for future students
continuing this project, especially the 2011-2012 MQP group.

24
6 References
[1] Shuang, G., Shaowen, C., Yanping, S., Yufei, S., Fu, C. (2010). Boundary layer suction on aerodynamic
performance in a high-load compressor cascade. Chinese Journal of Aeronautics, Vol. 23, No. 2, pp. 179-
186.
[2] Oates, G. (1997). Aerothermodynamics of Gas Turbine and Rocket Propulsion. Third Edition. Reston,
VA: AIAA, Inc.
[3] Evans, S. (2009). Flow control in compressors. Doctoral Thesis, University of Cambridge.
[4] Lord, W. K., MacMartin, D. G., Tillman, T.G. (2000). Flow control opportunities in gas turbine
engines." Fluids 2000, pp. 1-16.
[5] Yang, Z., Huo-xing, L., Zheng-ping, Z., Jian, Y. (2010). Boundary layer separation control on a highly-
loaded, low-solidity compressor cascade. Journal of Thermal Science, Vol 19, No. 2, pp. 97-104.
[6] Gad-el-Hak, M. (2000). Flow Control- Passive, Active and Reactive Flow Management. Cambridge, UK:
The Press Syndicate of the University of Cambridge.
[7] Hecklau, M., Wiederhold, O., Zander, V., King, R., Nitsche, W. (2010). Active separation control with
pulsed jets in a critically loaded compressor cascade. 5th Flow Control Conference, pp. 1-15.
[8] Evans, S., Hodson, H., Hynes, T., Wakelam, C., Hiller, S. (2010). Controlling separation on a simulated
compressor blade using vortex-generator jets. Journal of Propulsion and Power, Vol 26, No. 4, pp. 1-15.
[9] Himmel, C., Howard, H. (2009). Passive air jets for loss reductions in high lift low pressure turbines.
International Society for Air Breathing Engines, pp. 1-10.
[10] Carletti, M., Rogers, C., Parekh, D. (1996). Parametric study of jet mixing enhancement by vortex
generators, tabs, and deflector plates. 1996 Fluids Engineering Division Conference, Vol. 2, pp. 303-312.
[11] Loughery, R., Horn., R. A. (1971). Single stage experimental evaluation of boundary layer blowing
and bleed techniques for high lift stator blades. NASA CR-54573.
[12] Drela, M., Youngren, H. (2008). A User’s Guide to MISES 2.63. MIT Aerospace Computational Design
Laboratory.

25
[13] McCabe, W. L., Smith, J. C., Harriott, P. (2005). Unit Operations of Chemical Engineering. New York:
McGraw Hill.
[14] Hilgenfeld, L., Pfitzner, M. (2004). Unsteady Boundary Layer Development Due to Wake Passing
Effects on a Highly Loaded Linear Compressor Cascade. Journal of Turbomachinery, Vol 126, pp. 493-
500.

26
APPENDIX: A MISES Flow Condition File

27
APPENDIX: B MISES Blade File
GS09
1.400 0.2208 1.200 0.8000 0.7400
0.8880000 0.4621000
0.8819715 0.4621567
0.8769597 0.4619329
0.8725332 0.4620389
0.8684767 0.4619076
0.8643804 0.4617370
0.8597540 0.4617238
0.8540388 0.4615493
0.8467826 0.4613269
0.8380532 0.4614112
0.8282431 0.4617381
0.8171290 0.4620374
0.8050459 0.4622376
0.7926121 0.4623550
0.7800486 0.4623842
0.7674850 0.4622990
0.7549047 0.4620648
0.7423233 0.4617175
0.7297778 0.4612874
0.7172792 0.4607068
0.7048323 0.4599535
0.6923597 0.4590653
0.6798600 0.4580617
0.6674152 0.4569444
0.6550126 0.4556714
0.6426223 0.4542349
0.6302417 0.4526873
0.6178740 0.4510182
0.6055293 0.4491885
0.5932125 0.4472372
0.5809453 0.4451873
0.5687309 0.4429714
0.5565602 0.4405836
0.5443857 0.4380817
0.5321941 0.4354642
0.5200526 0.4327249
0.5079687 0.4298670
0.4959093 0.4269345
0.4839044 0.4238740
0.4719818 0.4206807
0.4600910 0.4173014
0.4481890 0.4137624
0.4363337 0.4101053
0.4245677 0.4062719
0.4129191 0.4022337
0.4013573 0.3980275
0.3898506 0.3936317
0.3784103 0.3890002
0.3670245 0.3841503
0.3557177 0.3791219
0.3445321 0.3738736
0.3335053 0.3683897
0.3226506 0.3627214
0.3121234 0.3569650
0.3017553 0.3510059
0.2915217 0.3448410
0.2814047 0.3384898

28
0.2714121 0.3319428
0.2615550 0.3251886
0.2518195 0.3182412
0.2421664 0.3110948
0.2326167 0.3037643
0.2232203 0.2962869
0.2139775 0.2886640
0.2048876 0.2808981
0.1959049 0.2729548
0.1870042 0.2648366
0.1782267 0.2566108
0.1695986 0.2482815
0.1611415 0.2398522
0.1528189 0.2313139
0.1445889 0.2226416
0.1364629 0.2138429
0.1284451 0.2049255
0.1205297 0.1959006
0.1127268 0.1867856
0.1050825 0.1776464
0.9758654E-01 0.1684478
0.9016881E-01 0.1591384
0.8285434E-01 0.1497260
0.7560906E-01 0.1402623
0.6853859E-01 0.1307431
0.6167346E-01 0.1211995
0.5501664E-01 0.1117647
0.4877912E-01 0.1024146
0.4263245E-01
0.9319848E-01
0.3673612E-01
0.8394867E-01
0.3112528E-01
0.7478715E-01
0.2584682E-01
0.6589820E-01
0.2093436E-01
0.5718107E-01
0.1633075E-01
0.4866680E-01
0.1231044E-01
0.4084271E-01
0.9114643E-02
0.3421726E-01
0.6727966E-02
0.2886273E-01
0.4950071E-02
0.2461518E-01
0.3536342E-02
0.2121410E-01
0.2586199E-02
0.1833059E-01
0.1703905E-02
0.1586475E-01
0.1022154E-02
0.1359391E-01
0.5252257E-03
0.1140538E-01
0.1437266E-03
0.9258652E-02
-0.8476865E-06
0.7117199E-02
0.1276679E-03
0.4980092E-02
0.5939918E-03
0.2804987E-02
0.2061451E-02
0.9814228E-03
0.4398563E-02
0.2984219E-04

29
0.7061608E-02
0.3134859E-03
0.9345236E-02
0.1147769E-02
0.1165372E-01
0.2232341E-02
0.1403246E-01
0.3687207E-02
0.1668377E-01
0.5536969E-02
0.2001769E-01
0.8221789E-02
0.2488177E-01
0.1228816E-01
0.3383294E-01
0.2034394E-01
0.4734310E-01
0.3292053E-01
0.8001604E-01
0.6412437E-01
0.1836203 0.1562410
0.3339091 0.2642938
0.4981815 0.3548381
0.6478376 0.4146385
0.7461697 0.4412990
0.7676818 0.4456989
0.7801187 0.4467144
0.7882261 0.4474152
0.7945191 0.4479522
0.7993942 0.4483357
0.8035583 0.4486735
0.8073572 0.4489631
0.8109137 0.4492931
0.8143204 0.4495223
0.8177283 0.4497536
0.8212797 0.4499269
0.8250030 0.4501350
0.8288411 0.4503939
0.8326278 0.4505817
0.8360791 0.4507543
0.8390214 0.4509011
0.8414855 0.4510160
0.8435790 0.4511644
0.8454358 0.4511862
0.8471261 0.4513065
0.8487273 0.4512871
0.8502619 0.4514043
0.8517700 0.4514779
0.8532825 0.4514947
0.8548118 0.4515823
0.8563836 0.4516051
0.8579908 0.4515991
0.8596672 0.4517103
0.8614353 0.4517388
0.8633561 0.4518247
0.8654642 0.4517726
0.8677781 0.4519303
0.8703893 0.4518730
0.8734011 0.4520697
0.8769979 0.4519623
0.8816267 0.4521787
0.8890000 0.4521000