Embed Size (px)
Citation preview

Pasta & SustainabilityLuca F. Ruini
IstanbulOctober 25th 2013
HSE & Energy Director - BCFN Expert
2
THE GLOBAL PARADOXES ON FOOD AND NUTRITION
Source: BCFN elaboration based on OECD/FAO 2011; WHO 2010; GLOBAL FOOTPRINT NETWORK 2012

BCFN Sustainable Diets
CSR Targets& Projects
Sustainable DurumWheat Cultivation
Barilla EPDProcess System

4www.barillacfn.com

A Sustainable Diet Proposal in line with the Mediterranean Diet
2010 2011 2012 2013
BCFN Double Pyramid Papers

Starting point:Mediterranean Diet Nutrition Pyramid
Source: Ministry for Health of Italy Source: Oldways (www.oldwayspt.org)

Life Cycle Assessment Footprints
Global m2 per kg or Litre of food
Litre per kg or Litre of food
gCO2-eq per kg or Litre of food
Carbon Footprint
Water Footprint
Ecological Footprint
Ecological Footprint

Environmental Pyramid: Water Footprint

Environmental Pyramid : Carbon Footprint

Environmental Pyramid : Ecological Footprint

2013 BCFN Double Pyramid for ADULTS

LCA Chef Tool developed

Environmental impact of different dietary habit
- 1/3


And.. is a sustainable Dietmore expensive?
Normally not!


Barilla Environmental Product Declaration (EPD) Process
System
1. Quick, Simple and Reliable analysis
2. Verified and Certified Results

Life Cycle Assessment Footprints
Global m2 per kg or Litre of food
Litre per kg or Litre of food
gCO2-eq per kg or Litre of food
Carbon Footprint
Water Footprint
Ecological Footprint

THE LCA EVALUATES A COMPLEX MODEL
LCA model of the pasta production and contribution to CO2 emissions
DURUMWHEAT
CULTIVATION
PRODUCT TRANSPORT
PASTAPLANTS
PACKAGINGMATERIALS
MILL PROCESS
NATURAL GASEXTRACTION
DURUMWHEAT SOIL
MANAGEMENT
Durum wheatcrop
FERTILIZERPRODUCTION
Barilla EPD Process System

Durum wheat pasta Lifecycle Assessment (LCA)


Supply Chain Actions driven by LCA : Pasta example
FROM LCA TO ENVIRONMENTAL ACTIONS


Barilla Packaging Waste Labeling system
Paper
Plastic
Glass
Not YET recyclable!
Metal

Sustainable
High Quality Durum Wheat
Cultivation Project

1) Identify in the different area sustainable alternative cropping
systems for the cultivation of durum wheat;
2) Analyze and evaluate the characteristics of cropping systems
identified;
3) Validate the alternative cropping systems with in-field
experimentations
4) Integrate the Barilla’s Cultivation Disciplinary (Decalogue)
5) Use a web based Farmers Decision Supporting System (DSS)
AIM OF THE PROJECT ABOUT DURUM WHEAT PROJECT
Sustainable Durum Wheat Cultivation

29
29
INDICATORS USED
Durum wheat cultivation
• CARBON FOOTPRINT: it represents the total amount of greenhouse gases (GHG) produced
to directly and indirectly support human activities, usually expressed in equivalent tons of CO2 with
the relative indicator, commonly called “global warming potential”.
• WATER FOOTPRINT: it measures the water consumption of a system in terms of water
volumes consumed because of the processes, the irrigation, the natural evaporation by plants and/or
that polluted, per unit of time.
• ECOLOGICAL FOOTPRINT: is a measure of how much biologically productive land and
water an individual, population or activity requires to produce all the resources it consumes and to
absorb the waste it generates using prevailing technology and resource management practices. It is
measured in global hectares (gha).
• ECONOMICS INDICATORS: represented by the direct costs of cultivation (cultivation
operations + technical tools), the gross marketable production (GPS), updated to the price lists of 17
November 2009, and the gross income (GI), i.e. the difference between direct costs of cultivation and
GPS. (In the GPS are not considered coupled and uncoupled aid )
• NITROGEN INDEX: measurement of nitrogen availability determined by the previous crop
residue, by the contribution of chemical fertilizers and the time required to biologically degrade the
organic substance of the preceding crop;
• DON INDEX: this index expresses the cultivation safety aspects related to the possibility of
reducing pathology occurrence due to the deoxynivalenol mycotoxin (DON).

Lombardia, Veneto and Friuli(PLV)
Cultivation
Maize Maize (3 years) – Durum wheat
Diversified Soybean – Durum wheat – Millet - Maize
Emilia Romagna (RER) Cultivation
Cereals Maize – Durum wheat – Millet - Wheat
Industrial Soybean – Durum wheat- Maize – Wheat
Horticultural Tomato – Durum wheat - Maize – Wheat
Marche and Toscana Cultivation
Cereals Durum wheat (3 years) – Millet
Proteic Proteic pea (2 years) - Durum wheat (2 years)
Alfa alfa Alfa alfa (3 years) – Durum wheat
Industrial Rapeseed – Durum wheat – Sunflower – Durum wheat
Crop System analysed
Tillage Sowing Fertilization Pesticides HarvestingYield
System Boundaries
VariablesPuglia, Basilicata and Sicilia Cultivation
One crop Durum wheat (4 years)
Fodder Durum wheat (2 years) – Oat and vetch (2 years)
Horticultural Tomato – Durum wheat - Tomato – Durum wheat
Check pea Chick pea (2 years) – Durum wheat (2 years)
CROP SYSTEM ANALYSIS
Durum wheat cultivation
• Crop system: species used within the croprotations
• Agricultural “in-field” activities• Fertilizers use• Regional climatic situation

31
INDICATORS USED
Durum wheat cultivation
• CARBON FOOTPRINT: it represents the total amount of greenhouse gases (GHG) produced
to directly and indirectly support human activities, usually expressed in equivalent tons of CO2 with
the relative indicator, commonly called “global warming potential”.
• WATER FOOTPRINT: it measures the water consumption of a system in terms of water
volumes consumed because of the processes, the irrigation, the natural evaporation by plants and/or
that polluted, per unit of time.
• ECOLOGICAL FOOTPRINT: is a measure of how much biologically productive land and
water an individual, population or activity requires to produce all the resources it consumes and to
absorb the waste it generates using prevailing technology and resource management practices. It is
measured in global hectares (gha).
• ECONOMICS INDICATORS: represented by the direct costs of cultivation (cultivation
operations + technical tools), the gross marketable production (GPS), updated to the price lists of 17
November 2009, and the gross income (GI), i.e. the difference between direct costs of cultivation and
GPS. (In the GPS are not considered coupled and uncoupled aid )
• NITROGEN INDEX: measurement of nitrogen availability determined by the previous crop
residue, by the contribution of chemical fertilizers and the time required to biologically degrade the
organic substance of the preceding crop;
• DON INDEX: this index expresses the cultivation safety aspects related to the possibility of
reducing pathology occurrence due to the deoxynivalenol mycotoxin (DON).

32
Sustainable Durum wheat cultivation
Carbon footprint (tCO2/t grains)
0,00
0,10
0,20
0,30
0,40
0,50
0,60
0,70
0,80
Cerea
licolo
Fora
ggio
Indust
riale
Prote
ico
Cerea
licolo
Indust
riale
Ort
icolo
indu
stria
le
Indust
riale
Mai
dicolo
Cerea
licolo
Fora
ggio
Ort
icolo
indu
stria
le
Prote
ico
Carbon Footprint (t CO2/t granella)
Marche/Toscana Emilia Romagna Puglia/Basilicata/Sicilia
PianuraLombardo Veneto.
Carbon Footprint (t Co2 / t durum wheat semolina)
- 310 kg Co2 / t
Marche/Toscana Emilia Romagna Puglia/Basilicata/Sicilia
PianuraLombardo Veneto.
0,0
20,0
40,0
60,0
80,0
100,0
120,0
140,0
160,0
180,0
Cere
alico
lo
Fora
ggio
Indu
stria
le
Prot
eico
Cere
alico
lo
Indu
stria
le
Ortico
loin
dust
riale
Indu
stria
le
Maidi
colo
Cere
alico
lo
Fora
ggio
Ortico
loin
dust
riale
Prot
eico
Reddito lordo (€/t)Net Income (€ / t durum wheat semolina)> 100 € / t

33
Durum wheat cultivation
Carbon footprint (tCO2/t grains)
Nitrogen Index (kg of grains/kg of N)
0,00
0,10
0,20
0,30
0,40
0,50
0,60
0,70
0,80
Cerea
licolo
Fora
ggio
Indust
riale
Prote
ico
Cerea
licolo
Indust
riale
Ort
icolo
indu
stria
le
Indust
riale
Mai
dicolo
Cerea
licolo
Fora
ggio
Ort
icolo
indu
stria
le
Prote
ico
Carbon Footprint (t CO2/t granella)
0,0
10,0
20,0
30,0
40,0
50,0
60,0
70,0
Cerea
licolo
Fora
ggio
Indu
stria
le
Prote
ico
Cere
alicolo
Indust
riale
Ortico
loin
dust
riale
Indust
riale
Maidic
olo
Cerea
licolo
Fora
ggio
Ortico
loin
dust
riale
Prote
ico
Efficienza utilizzo azoto (kg granella/kg azoto)
Marche/Toscana Emilia Romagna Puglia/Basilicata/Sicilia
PianuraLombardo Veneto.
Carbon Footprint (t Co2 / t durum wheat semolina)
Nitrogen Indicator (kg durum wheat semolina/ kg N)
- 310 kg Co2 / t

34
Italian Farmers Handbook
Adopting old-well known (but not still applied)
agricultural practice
is good for farmers, soil & environment !
DSS
35
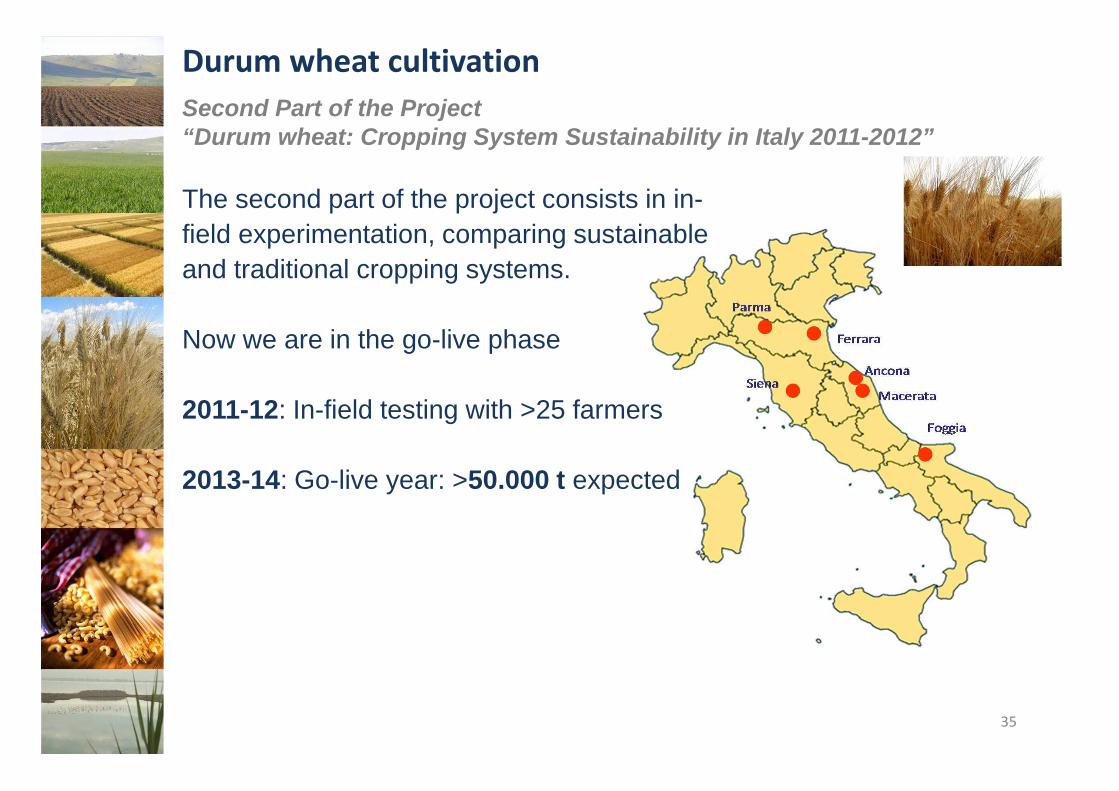
Second Part of the Project“Durum wheat: Cropping System Sustainability in Italy 2011-2012”
Durum wheat cultivation
The second part of the project consists in in-
field experimentation, comparing sustainable
and traditional cropping systems.
Now we are in the go-live phase
2011-12: In-field testing with >25 farmers
2013-14: Go-live year: >50.000 t expected

Barilla Sustainable Farming Project
2011 2012 2013 2014
Farmers test 25 100 500
Durum 10kt 50kt
-36% Co2eq- 100 €/ha
Study resultsconfirmed
Country Cereal Technical Partner
Italy Durum wheat Horta
Germany Soft wheat LFL - Bavarian State Research Center for Agriculture
Greece Durum wheat University of Thessaly
France Soft wheat, durum wheat Axereal
Turkey Durum wheat Harran University
Sweden Rye Lantmannen
Canada Durum wheat CWB
USA Durum wheat Sustainability Consortium (tbc)
Durum Wheat in Italy
2013 www projects

37
Turkish Durum Wheat Sustainable Project
Already doneIn cooperation of Harran University already collected
data and information about the most common agro-
tecniques utilized in South East Turkish Area.
Next steps1. In cooperation Harran University to identify more
sustainable agro-tecniques and organizing
experimental fields.
2. Cooperation with the local Agrogov Farmers
Association (S. Urfa)
3. Arrange experimental trial involving several farms in
the region.

Action:Sourcing of 20.000 t of durumwheat from South Italy cultivationwith proper field rotation thanfrom US
AlamoSouth West USA
AureoMiddle Italy
Aureo Durum Wheat: from US Desert to Italy without blue waterlit
er/k
g
Green Water:Evapotraspiration
Blue Water:Irrigation
AureoMiddle Italy
AlamoSouth-west USA - 35 million m3 Blue Water
-1.000 t of CO2 eq (duetransports)

Aureo Durum Wheat 35 million m3 blue water saved (2011)
39
Total Water Footprintreduction: 50 litresper kg of Durum
Wheat
848 litres of Blue Watersaved per kg of Aureo
wheat cultivated in MiddleItaly

Pasta & SustainabilityMed Diet sustainable consumption
Sustainable costPasta Sustainable production
Sustainable Durum Wheat cultivationLonger shelf life, lower food waste