Embed Size (px)
Citation preview

Progress and Achievement Test (PAT)
Reading Comprehension 2016
Achievement Results with Student Performance being compared to National Norms
With
Indicative National Standard Results for Year 6, 7 and 8
And
Equivalent End of Year Performances for Years 4,5,6,7 and 8

Waikanae School Reading Comprehension Progress and Achievement Test Analysis February 2016 Page 2
About this Assessment
• PAT Reading Comprehension Stanines enable a student’s achievement to be compared against National Norms. They also enable teachers and parents
to compare student performance across cohort groups.
• Stanines and their associated test scores have been scaled and ‘normed’ to fit the ‘Bell Curve of Normal Distribution’.
• This test became available in its current form to schools in 2008.
• This test assesses a student’s level of reading comprehension. This is the seventh time that this test has been used at Waikanae School and it provides excellent
insights into the next steps for learning and teaching.
• As the NZCER have supplied the Scaled Score match to National Standards we are able provide the Indicative National Standards grades of Well Below, Below, At,
and Above for Years 6 to 8. This has been treated as an end of year (EOY) summative assessment for 2015 due to the fact that students still have 10 months of
learning to undertake in their relevant Year Group.
• As a result of these NZCER Scaled Score Matches we are also able to supply Comparisons to Equivalent Year Group End of Year Performance. It is important to note
with this graphs that students still have 10 months of learning to get to the appropriate Year Level Performance
N.B. NZCER = New Zealand Council for Educational Research (The developers of this assessment tool)

Waikanae School Reading Comprehension Progress and Achievement Test Analysis February 2016 Page 3
Description of Ethnic Groupings
Category
Number of
Students in Test
Group
Percentage of Test
Group Description Notes
Asian 12 6% All students identified upon enrolment as
Asian
Maori 46 16% All students identified upon enrolment as
Maori
MELAA 4 1% All students identified upon enrolment as
Middle Eastern , Latin American or, American
New Zealand
European 198 71%
All students identified upon enrolment as New
Zealand European
Other 12 4% Any other category
Pacific Peoples 7 2%
This category includes all students identified
upon enrolment as being Samoan, Fijian, Cook
Island Maori or Other Pacific Peoples
5 of these students are English Language
Learners.
All 275 100% All students tested from Year 4 to Year 8

Waikanae School Reading Comprehension Progress and Achievement Test Analysis February 2016 Page 4
Achievement Summary
1. Overall performance across the school is above National Norms. We have 65% of our students at or above Stanine 5. (Norm =60%). This performance is
5% above the National Norm.
2. This year our overall performance trends up over the five year groups, beginning at 54% in Year 4 and finishing at 61% by year 8.
3. The Year 6 and Year 7 Cohorts are a real area of strength with 73% and 79% of students at or above Stanine 5 (Norm =60%).
4. In comparison to National Norms our ‘tail’ remains very small. The tail being the 17% students with Stanine Result 1, 2, or 3 (Norm= 23%). This
performance is 6% better than the National Norm.
5. In 2014 Maori Performance dropped below National Norms. This trend has plateaued in through 2015 and 2016. We have 57% of our Maori students
at or above Stanine 5 (Norm =60%). This performance is 2% below the National Norm for all ethnicities. Interestingly 22% of this group are in Stanine 3
This student group will feature in our School Targets for 2016 (see 2016 Charter). Hopefully their achievement will rise in 2015-16 as a result of this.
6. Pacific Peoples are well below National Norms with only 28% of students at or above Stanine 5 (Norm =60%) This performance is 32% below the
National Norm.
It is important to note that this group contains only 7 students or 3% of the test population. 5 of the students are English Language Learners who are
‘Well Below’ in reading. Staff and management are well aware of this issue and are taking all practical steps to lift the achievement of these students to
a level commensurate with others.
Interventions include:
• individualised tutoring for oral language and reading
• Use of Lexia programme
• Use of differentiated learning task and class groupings and programmes etc.
• ELLP used to guide assessment practices and next learning steps
• This student group will feature in our School Targets for 2016 (see 2016 Charter)
7. Indicative National Standards results show that 85% of students in Year 6, 7 and 8 are ‘At or Above the Standard’ when the results are interpreted as
summative assessment for 2015. See page 23.

Waikanae School Reading Comprehension Progress and Achievement Test Analysis February 2016 Page 5
8. Results over time remain consistent for the ‘All’. The down ward shift in results for Maori seen last year continues. There has been a drop in performance
for Pacific Peoples when compared to 2014 results. However the numbers in this cohort are so small that we must read too much into this improvement.
See page 12.
9. All cohorts have made pleasing progress from one year to the next. See Equivalent Year Group Graphs on pages 18-22.

Waikanae School Reading Comprehension Progress and Achievement Test Analysis February 2016 Page 6
Stanine 1 Stanine 2 Stanine 3 Stanine 4 Stanine 5 Stanine 6 Stanine 7 Stanine 8 Stanine 9
Norm 4% 7% 12% 17% 20% 17% 12% 7% 4%
Performance 2% 5% 10% 18% 15% 21% 17% 8% 4%
0%
5%
10%
15%
20%
25%
Pe
rce
nta
ge
of
Stu
de
nt
Co
ho
rtPAT Reading Comprehension for All
February 2016 Stanine Comparisons to National Norms

Waikanae School Reading Comprehension Progress and Achievement Test Analysis February 2016 Page 7
Year 4 Year 5 Year 6 Year 7 Year 8 All
Norm 60% 60% 60% 60% 60% 60%
Performance 54% 54% 73% 79% 61% 65%
0%
10%
20%
30%
40%
50%
60%
70%
80%
90%
Pe
rce
nta
ge
of
Stu
de
nt
Co
ho
rtPAT Reading Comprehension by Year Group
February 2016 Comparison to National Norms
Percentage of Students at or Above Stanine 5

Waikanae School Reading Comprehension Progress and Achievement Test Analysis February 2016 Page 8
Asian Maori MELAA NZ Euro Other Pacific Peoples All
Norm 60% 60% 60% 60% 60% 60% 60%
Performance 100% 57% 100% 66% 75% 28% 65%
0%
20%
40%
60%
80%
100%
120%
Pe
rce
nta
ge
of
Stu
de
nt
Co
ho
rtPAT Reading Comprehension by Ethnicity
February 2016 Comparison to National Norms
Percentage of Students at or Above Stanine 5

Waikanae School Reading Comprehension Progress and Achievement Test Analysis February 2016 Page 9
Stanine 1 Stanine 2 Stanine 3 Stanine 4 Stanine 5 Stanine 6 Stanine 7 Stanine 8 Stanine 9
Norm 4% 7% 12% 17% 20% 17% 12% 7% 4%
Performance 2% 2% 22% 17% 11% 17% 15% 13% 0%
0%
5%
10%
15%
20%
25%
Pe
rce
nta
ge
of
Stu
de
nt
Co
ho
rtPAT Reading Comprehension by Maori
February 2016 Stanine Comparisons to National Norms

Waikanae School Reading Comprehension Progress and Achievement Test Analysis February 2016 Page 10
Stanine 1 Stanine 2 Stanine 3 Stanine 4 Stanine 5 Stanine 6 Stanine 7 Stanine 8 Stanine 9
Norm 4% 7% 12% 17% 20% 17% 12% 7% 4%
Performance 0% 29% 0% 43% 0% 14% 0% 0% 14%
0%
5%
10%
15%
20%
25%
30%
35%
40%
45%
50%
Pe
rce
nta
ge
of
Stu
de
nt
Co
ho
rtPAT Reading Comprehension by Pacific Peoples
February 2016 Stanine Comparisons to National Norms

Waikanae School Reading Comprehension Progress and Achievement Test Analysis February 2016 Page 11
Stanine 1 Stanine 2 Stanine 3 Stanine 4 Stanine 5 Stanine 6 Stanine 7 Stanine 8 Stanine 9
Norm 4% 7% 12% 17% 20% 17% 12% 7% 4%
Performance Girls 0% 2% 9% 14% 19% 19% 23% 8% 5%
Performance Boys 2% 3% 10% 18% 17% 20% 19% 7% 4%
0%
5%
10%
15%
20%
25%
Pe
rce
nta
ge
of
Stu
de
nt
Co
ho
rtPAT Reading Comprehension by Gender
February 2016 Stanine Comparisons to National Norms

Waikanae School Reading Comprehension Progress and Achievement Test Analysis February 2016 Page 12
2012 2013 2014 2015 2016
Norm 60% 60% 60% 60% 60%
All 67% 72% 70% 71% 65%
Maori 69% 73% 57% 58% 57%
Pacific Peoples 35% 40% 27% 43% 28%
0%
10%
20%
30%
40%
50%
60%
70%
80%
Pe
rce
nta
ge
of
Stu
de
nt
Co
ho
rtPAT Reading Comprehension Over Time
2012, 2013, 2014, 2015 and 2016 Comparison to National Norms
Percentage of Students at or Above Stanine 5
Waikanae School Reading Comprehension Progress and Achievement Test Analysis February 2016 Page 13
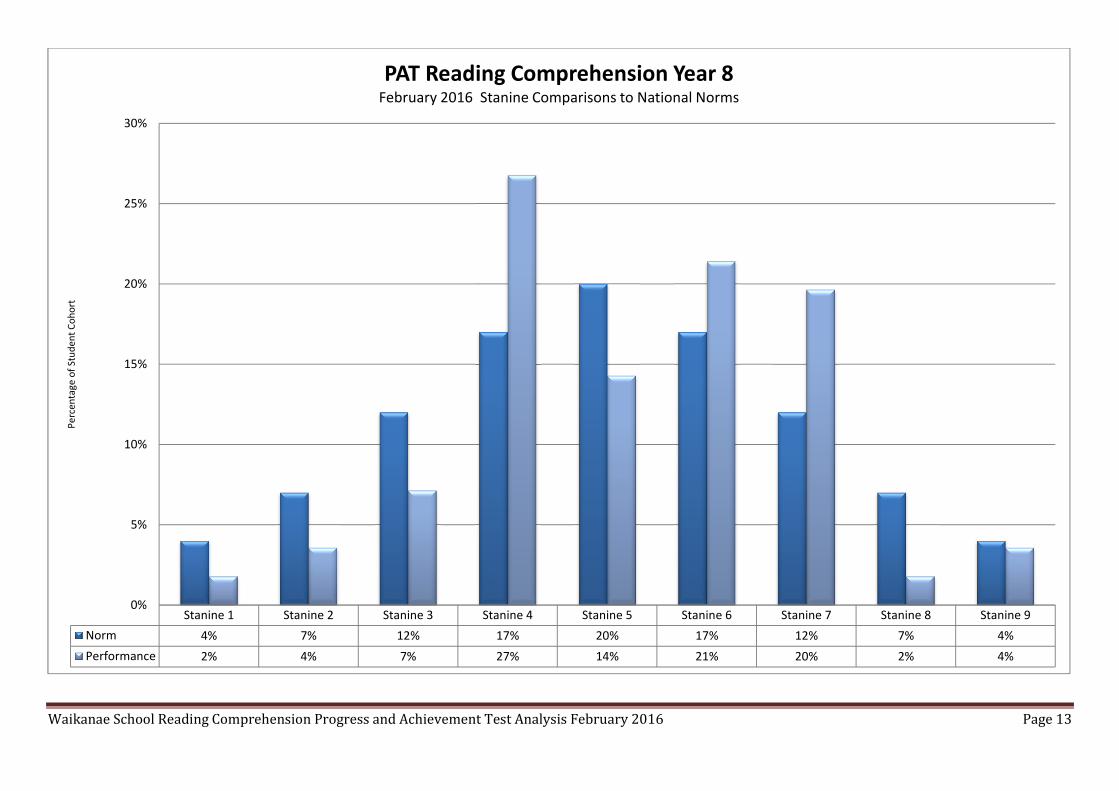
Stanine 1 Stanine 2 Stanine 3 Stanine 4 Stanine 5 Stanine 6 Stanine 7 Stanine 8 Stanine 9
Norm 4% 7% 12% 17% 20% 17% 12% 7% 4%
Performance 2% 4% 7% 27% 14% 21% 20% 2% 4%
0%
5%
10%
15%
20%
25%
30%
Pe
rce
nta
ge
of
Stu
de
nt
Co
ho
rtPAT Reading Comprehension Year 8
February 2016 Stanine Comparisons to National Norms

Waikanae School Reading Comprehension Progress and Achievement Test Analysis February 2016 Page 14
Stanine 1 Stanine 2 Stanine 3 Stanine 4 Stanine 5 Stanine 6 Stanine 7 Stanine 8 Stanine 9
Norm 4% 7% 12% 17% 20% 17% 12% 7% 4%
Performance 5% 4% 2% 11% 14% 29% 18% 11% 7%
0%
5%
10%
15%
20%
25%
30%
Pe
rce
nta
ge
of
Stu
de
nt
Co
ho
rtPAT Reading Comprehension Year 7
February 2016 Stanine Comparisons to National Norms

Waikanae School Reading Comprehension Progress and Achievement Test Analysis February 2016 Page 15
Stanine 1 Stanine 2 Stanine 3 Stanine 4 Stanine 5 Stanine 6 Stanine 7 Stanine 8 Stanine 9
Norm 4% 7% 12% 17% 20% 17% 12% 7% 4%
Performance 1% 3% 11% 11% 14% 28% 14% 13% 4%
0%
5%
10%
15%
20%
25%
30%
Pe
rce
nta
ge
of
Stu
de
nt
Co
ho
rtPAT Reading Comprehension Year 6
February 2016 Stanine Comparisons to National Norms

Waikanae School Reading Comprehension Progress and Achievement Test Analysis February 2016 Page 16
Stanine 1 Stanine 2 Stanine 3 Stanine 4 Stanine 5 Stanine 6 Stanine 7 Stanine 8 Stanine 9
Norm 4% 7% 12% 17% 20% 17% 12% 7% 4%
Performance 0% 11% 17% 17% 17% 11% 20% 7% 0%
0%
5%
10%
15%
20%
25%
Pe
rce
nta
ge
of
Stu
de
nt
Co
ho
rtPAT Reading Comprehension Year 5
February 2016 Stanine Comparisons to National Norms
Waikanae School Reading Comprehension Progress and Achievement Test Analysis February 2016 Page 17
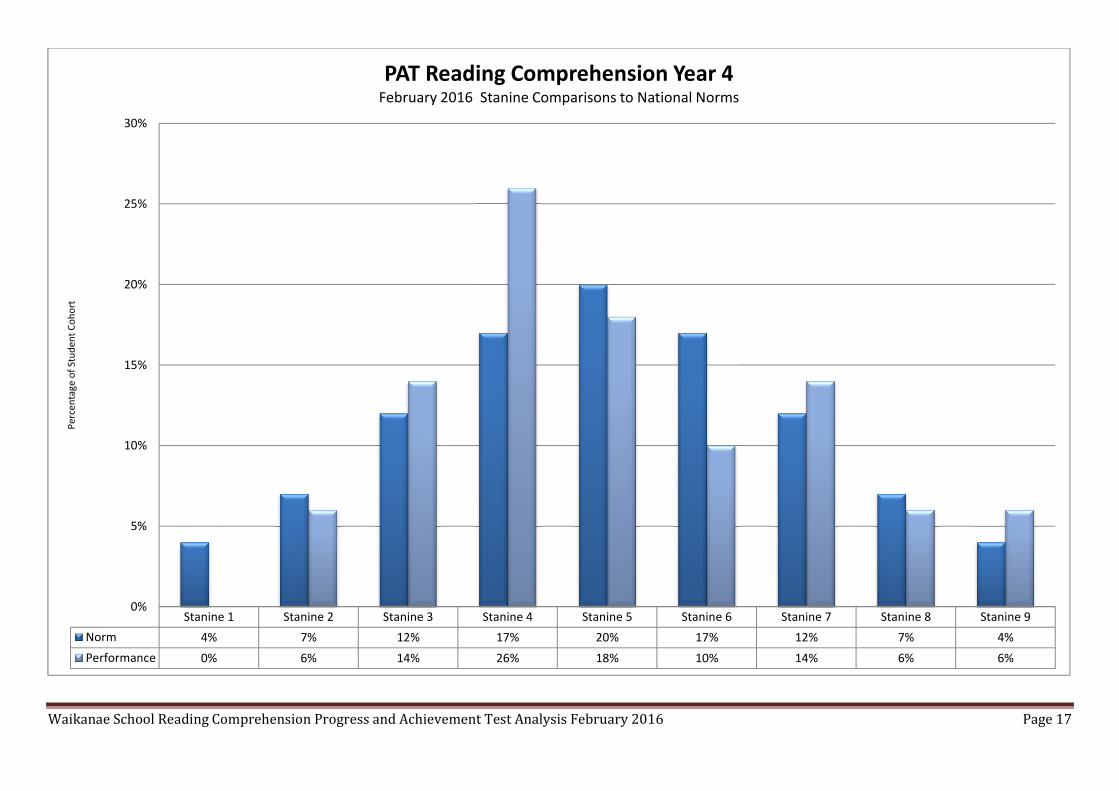
Stanine 1 Stanine 2 Stanine 3 Stanine 4 Stanine 5 Stanine 6 Stanine 7 Stanine 8 Stanine 9
Norm 4% 7% 12% 17% 20% 17% 12% 7% 4%
Performance 0% 6% 14% 26% 18% 10% 14% 6% 6%
0%
5%
10%
15%
20%
25%
30%
Pe
rce
nta
ge
of
Stu
de
nt
Co
ho
rtPAT Reading Comprehension Year 4
February 2016 Stanine Comparisons to National Norms

Waikanae School Reading Comprehension Progress and Achievement Test Analysis February 2016 Page 18
EYG 3 and Below Year 4 EYG 5 EYG 6 EYG 7 EYG 8 EYG 9 EYG 10 and above
2013 16% 16% 29% 22% 10% 4% 2% 0%
2014 7% 4% 24% 26% 24% 6% 7% 2%
2015 0% 2% 11% 13% 25% 21% 21% 8%
2016 0% 0% 5% 13% 25% 20% 32% 5%
0%
5%
10%
15%
20%
25%
30%
35%
Pe
rce
nta
ge
of
Stu
de
nt
Co
ho
rtPAT Reading Comprehension Year 8 Cohort 2016
Comparisons to the Equivalent Year Group Performance for 2013, 2014, 2015 and 2016

Waikanae School Reading Comprehension Progress and Achievement Test Analysis February 2016 Page 19
EYG 3 and Below Year 4 EYG 5 EYG 6 EYG 7 EYG 8 EYG 9 EYG 10 and above
2013 31% 13% 37% 6% 8% 2% 4% 0%
2014 16% 12% 35% 20% 16% 0% 0% 2%
2015 0% 6% 24% 37% 16% 6% 10% 2%
2016 5% 4% 4% 13% 34% 18% 18% 5%
0%
5%
10%
15%
20%
25%
30%
35%
40%
Pe
rce
nta
ge
of
Stu
de
nt
Co
ho
rtPAT Reading Comprehension Year 7 Cohort 2016
Comparisons to the Equivalent Year Group Performance for 2013, 2014, 2015 and 2016

Waikanae School Reading Comprehension Progress and Achievement Test Analysis February 2016 Page 20
EYG 3 and Below Year 4 EYG 5 EYG 6 EYG 7 EYG 8 EYG 9 EYG 10 and above
2104 52% 9% 14% 11% 3% 8% 3% 0%
2015 20% 16% 25% 28% 8% 2% 2% 0%
2016 4% 11% 18% 35% 14% 7% 8% 1%
0%
10%
20%
30%
40%
50%
60%
Pe
rce
nta
ge
of
Stu
de
nt
Co
ho
rtPAT Reading Comprehension Year 6 Cohort 20165
Comparisons to the Equivalent Year Group Performance for 2014, 2015 and 2016

Waikanae School Reading Comprehension Progress and Achievement Test Analysis February 2016 Page 21
EYG 3 and Below Year 4 EYG 5 EYG 6 EYG 7 EYG 8 EYG 9 EYG 10 and above
2015 51% 14% 23% 9% 2% 0% 0% 0%
2016 35% 17% 20% 22% 7% 0% 0% 0%
0%
10%
20%
30%
40%
50%
60%
Pe
rce
nta
ge
of
Stu
de
nt
Co
ho
rtPAT Reading Comprehension Year 5 Cohort 2016
Comparisons to the Equivalent Year Group Performance for 2015 and 2016
Waikanae School Reading Comprehension Progress and Achievement Test Analysis February 2016 Page 22
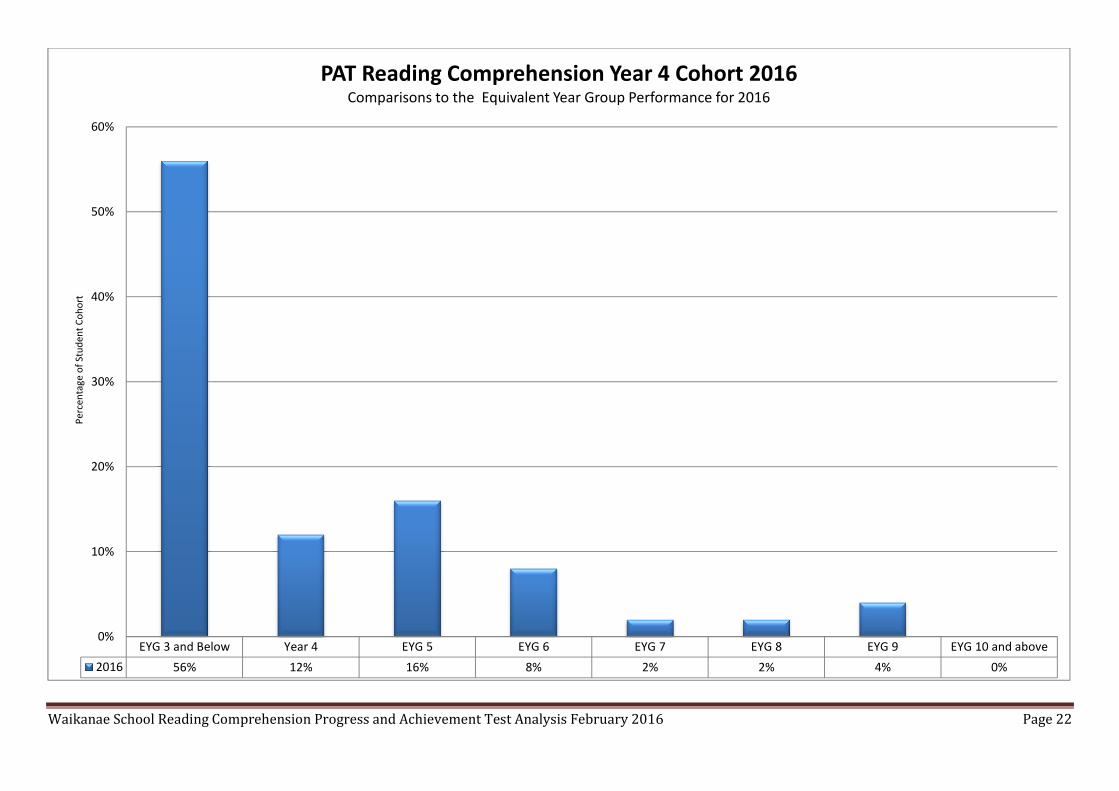
EYG 3 and Below Year 4 EYG 5 EYG 6 EYG 7 EYG 8 EYG 9 EYG 10 and above
2016 56% 12% 16% 8% 2% 2% 4% 0%
0%
10%
20%
30%
40%
50%
60%
Pe
rce
nta
ge
of
Stu
de
nt
Co
ho
rtPAT Reading Comprehension Year 4 Cohort 2016
Comparisons to the Equivalent Year Group Performance for 2016

Waikanae School Reading Comprehension Progress and Achievement Test Analysis February 2016 Page 23
Well Below Below At Above
Year 6 4% 11% 18% 66%
Year 7 9% 4% 13% 75%
Year 8 5% 13% 25% 57%
All 6% 9% 19% 66%
0%
10%
20%
30%
40%
50%
60%
70%
80%
Pe
rce
nta
ge
of
Stu
de
nt
Co
ho
rtPAT Reading Comprehension by Year
Indicative Performance against the National Standards as an
EOY Summative for 2015 for Year 6, 7, and 8 Students only

Waikanae School Reading Comprehension Progress and Achievement Test Analysis February 2016 Page 24
Well Below Below At Above
Boys 2% 8% 23% 67%
Girls 1% 14% 11% 73%
0%
10%
20%
30%
40%
50%
60%
70%
80%
Pe
rce
nta
ge
of
Stu
de
nt
Co
ho
rtPAT Reading Comprehension by GenderIndicative Performance against the National Standards as an
EOY Summative for 2015 for Year 6, 7, and 8 Students only

Waikanae School Reading Comprehension Progress and Achievement Test Analysis February 2016 Page 25
All Asian Maori MELAA NZ Euro Other Pacific Peoples
Well Below 6% 0% 8% 0% 5% 0% 40%
Below 9% 0% 23% 0% 7% 14% 0%
At 19% 22% 8% 0% 22% 0% 20%
Above 66% 78% 62% 100% 66% 86% 40%
0%
20%
40%
60%
80%
100%
120%
Pe
rce
nta
ge
of
Stu
de
nt
Co
ho
rtPAT Reading Comprehension by EthnicityIndicative Performance against the National Standards as an
EOY Summative for 2015 for Year 6, 7, and 8 Students only