Embed Size (px)
Citation preview

PAT Target Achievement: Strategies and Practices
CenPEEP, NTPC
EEC Conference31st August, 2015

2
Energy import is major drag on India’s Current Account Deficit contributingalmost 40% of total import. Therefore, to meet GDP growth rate & energysecurity for sustainable future both power generation & uses have to be moreenergy efficient.
Energy Efficiency Imperative For County’s Economic Health

3
Today 45 GW*
Coal Gas Nuclear Hydro Renewables
2032~ 128 GW
Capacity under construction: ~23,000 MW
85%
13% 2%
* Includes 800 MW Hydro & 110 MW Solar Capacity
NTPC – Powering India’s Growth
4
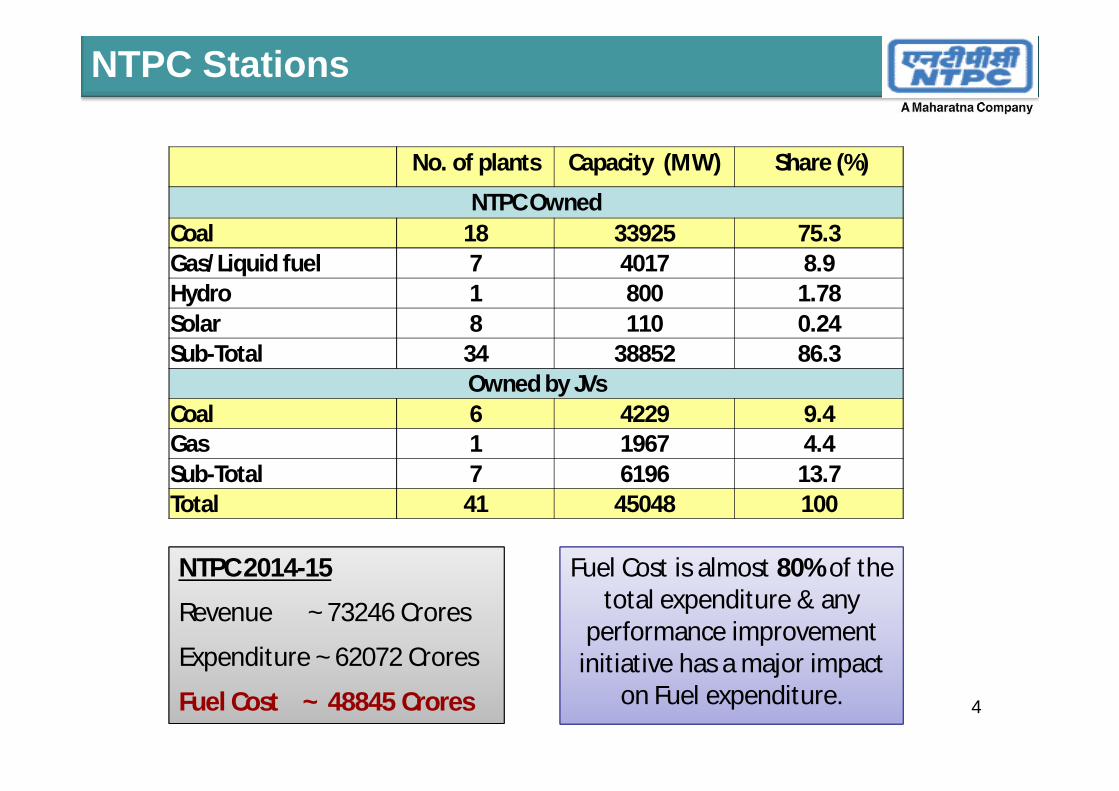
No. of plants Capacity (MW) Share (%)
NTPC Owned Coal 18 33925 75.3Gas/Liquid fuel 7 4017 8.9Hydro 1 800 1.78Solar 8 110 0.24Sub-Total 34 38852 86.3
Owned by JVsCoal 6 4229 9.4Gas 1 1967 4.4Sub-Total 7 6196 13.7Total 41 45048 100
NTPC 2014-15
Revenue ~ 73246 Crores
Expenditure ~ 62072 Crores
Fuel Cost ~ 48845 Crores
Fuel Cost is almost 80% of the total expenditure & any
performance improvement initiative has a major impact
on Fuel expenditure.
NTPC Stations

5
Typical Financial Implications for 200 & 500 MW Units
200 MW Unit
500 MW unit
100 MW GasAPM / RLNG
10 kcal GHR Improvement Rs 1.7 Cr Rs 4.1 Cr
Rs 1.3 Cr /Rs 4.4 Cr
0.1 % APC Rs 0.4 Cr Rs 1.1 Cr Rs 0.15 Cr
10 Kcal NHR Improvement Rs 1.5 Cr Rs 3.8 Cr
Rs 1.15 Cr / Rs 4.25 Cr.
Performance improvement - key to meet the challenges in the changed business scenario, new environment regulations and stringent regulatory regime
PAT targets: an additional market mechanism to give more focus on performance
Performance Enhancement - Financial Impact

SN STATIONS Design HRkcal/kWh
Net Des HR with Act APC
Baseline NHR
% NHR dev Target for NHR Reduction (kcal/kWh)
1 Sipat 2289 2422 2491 2.8 7
2 Singrauli 2312 2488 2577 3.6 9
3 Kahalgaon 2321 2516 2614 3.9 9
4 Unchahar 2302 2502 2596 3.7 10
5 Korba 2279 2425 2526 4.1 11
6 Vindhyachal 2270 2422 2532 4.6 11
7 Talcher K 2242 2374 2492 5 12
8 Rihand 2232 2387 2512 5.2 21
9 Ramagundam 2250 2390 2520 5.4 22
10 Simhadri 2228 2358 2490 5.6 22
11 Dadri 2272 2453 2580 5.2 22
12 Farakka 2293 2467 2597 5.3 22
13 Tanda 2256 2895 3083 6.5 32
14 Badarpur 2500 2731 2988 9.98 46
15 Talcher-Th 2587 2880 3196 10.98 666
PAT Targets (Net Heat Rate): Coal Stations

Stations
Baseline NHR
(kcal/kWh) Design NHR% NHR
deviation
Target NHR (kcal/kWh)
PAT Target for NHR
Reduction (kcal/kWh)
Gandhar 2075 2041 1.6 2072 3
Dadri Gas 2037 1975 3.1 2031 6
Kayamkulam 1994 1931 3.3 1988 6
Kawas 2070 1986 4.2 2062 8
Anta 2091 1994 4.8 2081 10
Faridabad 2001 1895 5.6 1983 18
Auraiya 2190 2028 8 2163 27
7
PAT Targets (Net Heat Rate): Gas Stations
Capacity wise NTPC is 23% of Indian Power Sector, in PAT target it is 10% of Power Sector.
8
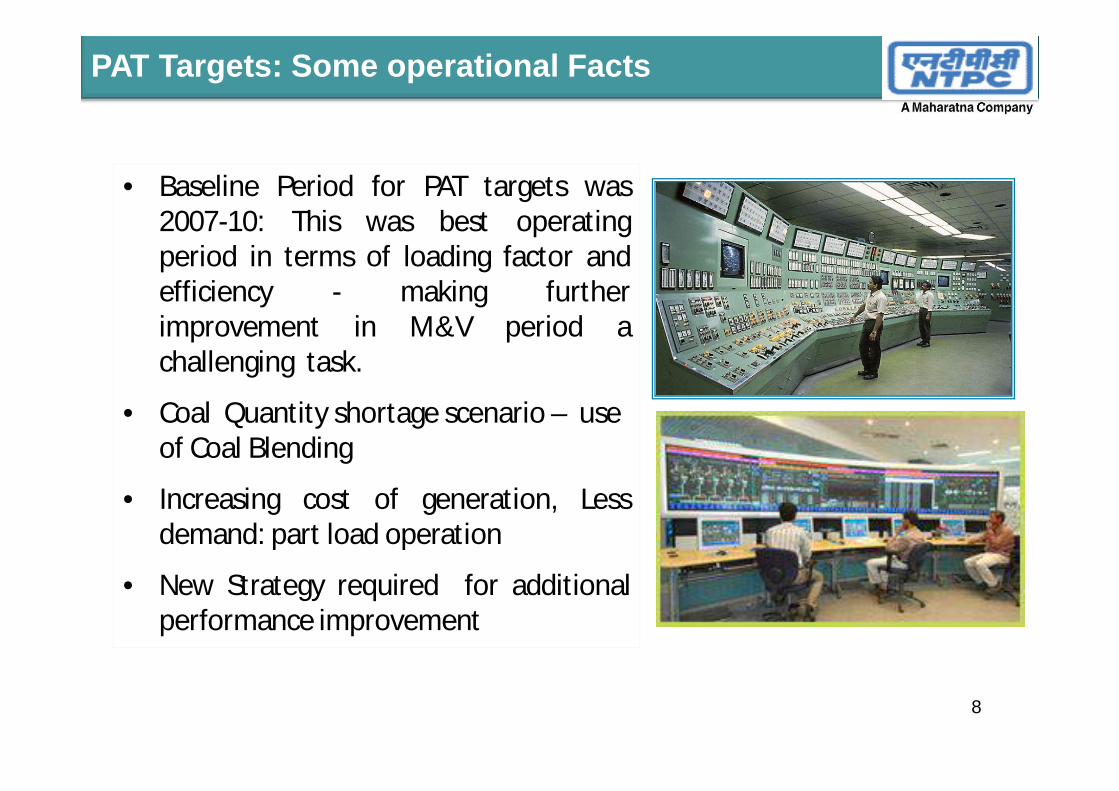
• Baseline Period for PAT targets was2007-10: This was best operatingperiod in terms of loading factor andefficiency - making furtherimprovement in M&V period achallenging task.
• Coal Quantity shortage scenario – use of Coal Blending
• Increasing cost of generation, Lessdemand: part load operation
• New Strategy required for additionalperformance improvement
PAT Targets: Some operational Facts

9
• Develop comprehensive Plan forHR and APC improvement andexecute.
a high level Committee atCorporate Centre formed, toexamine various options toachieve target and makecomprehensive recommendations
Regularly sensitizing the stationsfor PAT targets & facilitating instructured data organization forM&V
PAT Targets Achievement: NTPC Approach
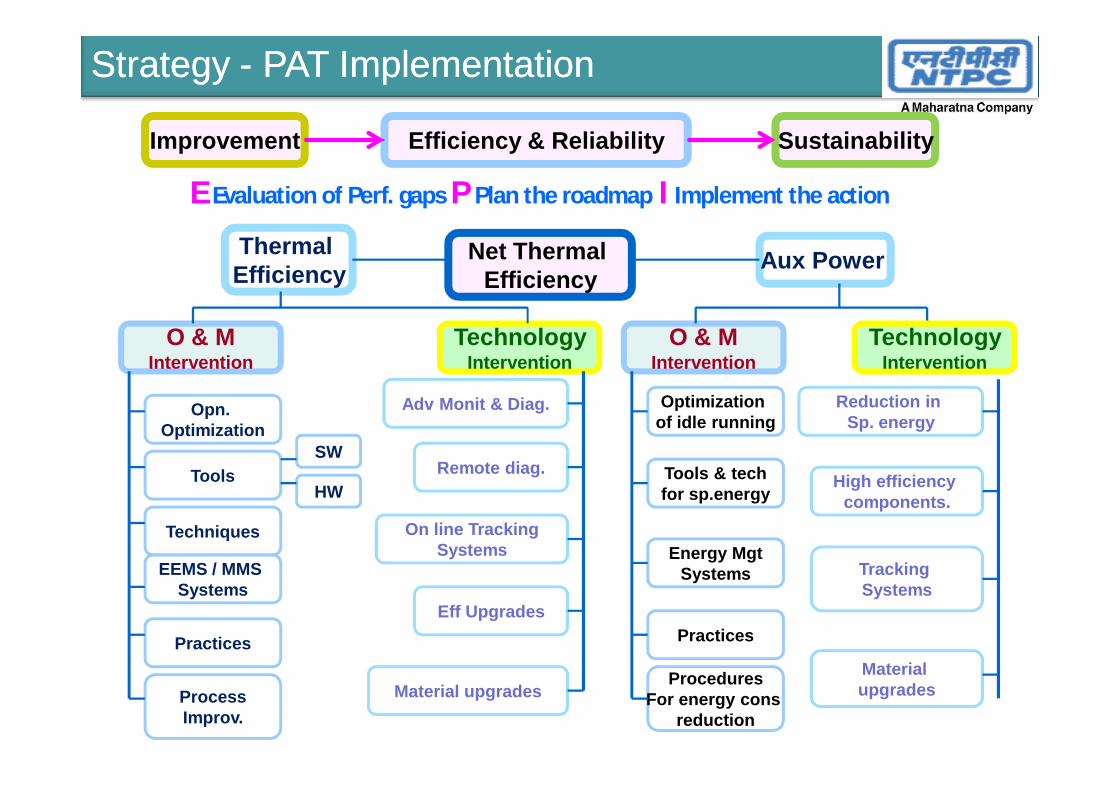
E Evaluation of Perf. gaps P Plan the roadmap I Implement the action
Improvement Sustainability
Thermal Efficiency
Aux Power
O & MIntervention
TechnologyIntervention
Adv Monit & Diag.
Practices
Opn. Optimization
Tools
Techniques
EEMS / MMS Systems
Remote diag.
On line Tracking Systems
Eff Upgrades
Material upgradesProcessImprov.
SW
HW
Efficiency & Reliability
Net Thermal Efficiency
O & MIntervention
Practices
Optimization of idle running
Tools & techfor sp.energy
Energy MgtSystems
ProceduresFor energy cons
reduction
TechnologyIntervention
Reduction in Sp. energy
High efficiency components.
Tracking Systems
Material upgrades
Strategy Strategy -- PAT ImplementationPAT Implementation
• Net heat rate (NHR) action plan developed for each stationsegregated into 2-categories:
• Actions without additional investment that can beimplemented under O&M
• Actions with additional investment
• R&M activity (Midlife and Mega R&M) having positive impact onAPC & Heat rate improvement identified
11
PAT Implementation : NTPC Approach

• Improvement in loading factor• Operational Optimization (listing in separate slide)• Condenser loss reduction –
• Restoration of COLTS, regular & effective operation of COLTS
• Installation of additional screens at the intake channel for removal of debris;
• Regular and opportunity cleaning of condenser• Air ingress reduction in FG ducts & AH tube replacement• Turbine-Replacement of turbine internals (seals, etc.) in
COH as required based on efficiency degradations / gap analysis.
• Turbine- replacement of LP casing
Summary of actions without additional investments
12
PAT Implementation: NTPC Approach
• Cooling Tower (O&M): revamping wherever necessary• Installation of Wind Ventilators Fans in TG Roof• FW temp at inlet to Economiser: HPH to be kept in service • MS pressure restoration• Conversion of FRS from DP control to scoop control• Replacement of BFP recirculation valves (single stage to multi
stage)• Modification of mills by hi-chrome liners to enhance capacity • FG duct internals modification using CFD modeling with the
help of NETRA and CenPEEP• Improvement of coal quality• Installation and use of Online Energy monitoring system for
finding potential gap areas for better monitoring & reduction of APC.
Summary of actions without additional investments (contd.)
13
PAT Implementation: NTPC Approach
• Optimization of operations:All Stations to continue efforts for the following:• Optimization of number of mills operation• Cooling tower performance optimization• Ash water ratio optimization• Improvement of CHP utilization factor• Non-cycle makeup water reduction• Plant compressor operation optimization• Maximization of TDBFP running• Optimization of operation of HFO pump houseAny other action based on local requirement and unit design
• APC reduction : 0.1% is equivalent to about 3 kcal/kwh in NHR.• VFD applications for 9 type of equipments identified• Additionally, pump coatings, debris removal, and use high efficiency
motors, etc. 14
PAT Implementation: NTPC Approach

• Installation of VFD in selected HT & LT drives • Polymer coating in CW pumps • CT: Additional CT cells and VFD in CT for gas station• Additional measures for arresting dust ingress in CT• Turbine-Procurement of new turbine rotor ( at one of the Stations)• Installation/Revival of Condenser on line tube cleaning system (COTCS) • Mill Capacity enhancement • Boiler Reheater material upgrade to avoid overheating and reduce RH
spray • Replacement of existing motors with energy efficient motors • Replacement of all FG ducts and hot PA ducts expansion joints, APH
modified seals, heat transfer elements profile & material • Condition based BFP cartridge replacement with Energy efficient cartridge• Installation of debris removal system
Summary of actions with additional Investments
15
PAT Implementation: NTPC Approach
Summary of actions with additional Investments (contd.)• Up gradation of one set of Ash Slurry pumps at one of the Stations• Boiler modification including
a) RH modification - area increase, material up gradation from T91/T22 to TP 347H,
b) SH criss-cross modificationc) replacement of AH baskets by BHEL
• Replacement of SAPH CE baskets with DU baskets. • Replacement of existing lighting lamps with T5 lamps• Replacement of boiler insulation & refractory • Replacement & modification of flue gas ducts & guide vanes based on
CFD modeling • Replacement of HP heaters • Replacement of existing BFP re-circulating valves with inconel type re-
circulating valves• Retrofitting of 24 sector APH in existing 12 sector APH to reduce the seal
leakage • CT fills replacement in applicable cases 16
PAT Implementation: NTPC Approach

17
• Focus on Systems & procedures
• Enablers to be institutionalised
• Energy Efficiency Management System (EEMS)• Maintenance management System• Outage Management & Planning System• Audits – Insulation, APC, Water, Lighting System• Training & awareness programs• Guidelines & Checklists• Simulation & modelling tools
Systemic approach is essential for sustained & continual improvements
Systems Approach – Continuous Improvements

18
1. Draft Power Consumption (43%)2. Milling Power consumption (18%)3. Pump power consumption (30%)
1. High loss category (40-80 kcal)• Condenser & Cooling Tower • Dry Flue Gas Loss • HP/IP Turbine
2. Medium loss category (20-40 kcal)• RH Spray • Unaccountable (LPT Efficiency, Hi Energy
drain passing, Insulation loss )
3. Low loss category (<20 kcal)• Unburnt Carbon Loss• MS & HRH Temperature deviations• Feed water Temperature deviations500 MW unit
43%
9%24%
18%
6%0%
Draft power
CEP Power
CW Power
Mill power
CT Power
ESP
Typical Major Loss Area(in %)
DFG22%
RH8%
HPT+IPT21%
Cond15%
CT8%
Unacc26% DFG
RH
HPT+IPT
Cond
CT
Unacc
Heat Rate & APC - Coal fired plants
19
• Real time monitoring of aberrations of critical parameters
• Monitoring of unit startups & shut downs
• Strategic operation of efficient units at higher loading factor
• Focus on make up and cycle isolation
• Improvements through effective overhauls
• Opportunity utilization for cleaning of condensers & Air heaters
• Chemical dosing in CW system to improve CW quality
• APC monitoring during startups, shut down & idle running
• APC optimization – Energy Management System
Improvement through O&M Practices
20
Implementation of Structured APC Reduction Program in all Stations
• Optimization of no of CW pumps & CT fans in service as per weather conditions and unit load
• Optimization of No. of mills in service as per coal quality and unit load
• Sliding Pressure operation
• Excess air optimization
• Optimization of no of HT / LT drives in service at part load
• Unit startup with one series of drives only
• Optimization in CHP and AHP areas
• Merit order operation
APC Reduction Program

21
Planning & Execution of Overhauls - for sustained efficient & reliable operation
• Overhaul Preparedness
• Pre OH Surveys & performance tests • Identification of defects and activities in Engg. declaration• Work scope finalization - inputs from Repeat work Order analysis, gap
analysis, Energy audits, OEM recommendations etc.• 24 months monitoring cycle for Spares, consumables & contracts
• Skilled quality manpower & contractors• Activity Protocols - Check lists for Pre & Post Inspections• Quantification of benefits - Cost benefit analysis• Optimization of overhaul duration and intervals - Learning from previous OH,
Operational & performance parameters, equipment condition, loss recovery pattern
Quality Overhauls for performance improvements
22
• Meeting PAT target: a challenge under changed Business Scenario – Coalshortages, coal imports & blending need, low generation schedules, part loadoperation
• NTPC committed to meet PAT target• Strategies: Blend of operational optimization, identification and implementation
of various heat rate and APC improvement activities: specific to each NTPCstation
• Focus both on system, initiatives and timely implementation• Joint and collaborative working with BEE for implementation of judicious
normalization scheme for factors beyond the control of NTPC• New innovative measures specific to each station required for any further
improvement
• Power utilities need to develop appropriate strategies to continually improveperformance under changing business environment
Conclusion

2323
THANKS