Embed Size (px)
Citation preview

T h e n e w e ngl a nd j o u r na l o f m e dic i n e
n engl j med 370;13 nejm.org march 27, 2014 1209
original article
Patches of Disorganization in the Neocortex of Children with Autism
Rich Stoner, Ph.D., Maggie L. Chow, Ph.D., Maureen P. Boyle, Ph.D., Susan M. Sunkin, Ph.D., Peter R. Mouton, Ph.D., Subhojit Roy, M.D., Ph.D.,
Anthony Wynshaw-Boris, M.D., Ph.D., Sophia A. Colamarino, Ph.D., Ed S. Lein, Ph.D., and Eric Courchesne, Ph.D.
From the University of California, San Di-ego, Autism Center of Excellence (R.S., M.L.C., M.P.B., E.C.), and the Departments of Neuroscience (R.S., M.L.C., M.P.B., S.R., E.C.) and Pathology (S.R.), Univer-sity of California, San Diego, School of Medicine, La Jolla; Allen Institute for Brain Science, Seattle (M.P.B., S.M.S., E.S.L.); the Department of Pathology and Cell Biology, University of South Florida School of Medicine and Alzheimer’s Insti-tute and Research Center, Tampa (P.R.M.); the Department of Genetics and Genome Sciences, Case Western Reserve University School of Medicine, Cleveland (A.W.-B.); and the Department of Psychiatry and Behavioral Sciences, Stanford University School of Medicine, Palo Alto, CA (S.A.C.). Address reprint requests to Dr. Cour chesne at the Autism Center of Excellence, De-partment of Neuroscience, University of California, San Diego, School of Medi-cine, 8110 La Jolla Shores Dr., La Jolla, CA 92037, or at [email protected].
Drs. Stoner, Chow, and Boyle and Drs. Lein and Courchesne contributed equally to this article.
N Engl J Med 2014;370:1209-19.DOI: 10.1056/NEJMoa1307491Copyright © 2014 Massachusetts Medical Society.
A BS TR AC T
Background
Autism involves early brain overgrowth and dysfunction, which is most strongly evident in the prefrontal cortex. As assessed on pathological analysis, an excess of neurons in the prefrontal cortex among children with autism signals a disturbance in prenatal development and may be concomitant with abnormal cell type and laminar development.
Methods
To systematically examine neocortical architecture during the early years after the onset of autism, we used RNA in situ hybridization with a panel of layer- and cell-type–specific molecular markers to phenotype cortical microstructure. We assayed markers for neurons and glia, along with genes that have been implicated in the risk of autism, in prefrontal, temporal, and occipital neocortical tissue from post-mortem samples obtained from children with autism and unaffected children between the ages of 2 and 15 years.
Results
We observed focal patches of abnormal laminar cytoarchitecture and cortical dis-organization of neurons, but not glia, in prefrontal and temporal cortical tissue from 10 of 11 children with autism and from 1 of 11 unaffected children. We ob-served heterogeneity between cases with respect to cell types that were most abnor-mal in the patches and the layers that were most affected by the pathological features. No cortical layer was uniformly spared, with the clearest signs of abnormal expres-sion in layers 4 and 5. Three-dimensional reconstruction of layer markers confirmed the focal geometry and size of patches.
Conclusions
In this small, explorative study, we found focal disruption of cortical laminar architecture in the cortexes of a majority of young children with autism. Our data support a probable dysregulation of layer formation and layer-specific neuronal differentiation at prenatal developmental stages. (Funded by the Simons Founda-tion and others.)
The New England Journal of Medicine Downloaded from nejm.org at PRINCETON UNIVERSITY on March 27, 2014. For personal use only. No other uses without permission.
Copyright © 2014 Massachusetts Medical Society. All rights reserved.
T h e n e w e ngl a nd j o u r na l o f m e dic i n e
n engl j med 370;13 nejm.org march 27, 20141210
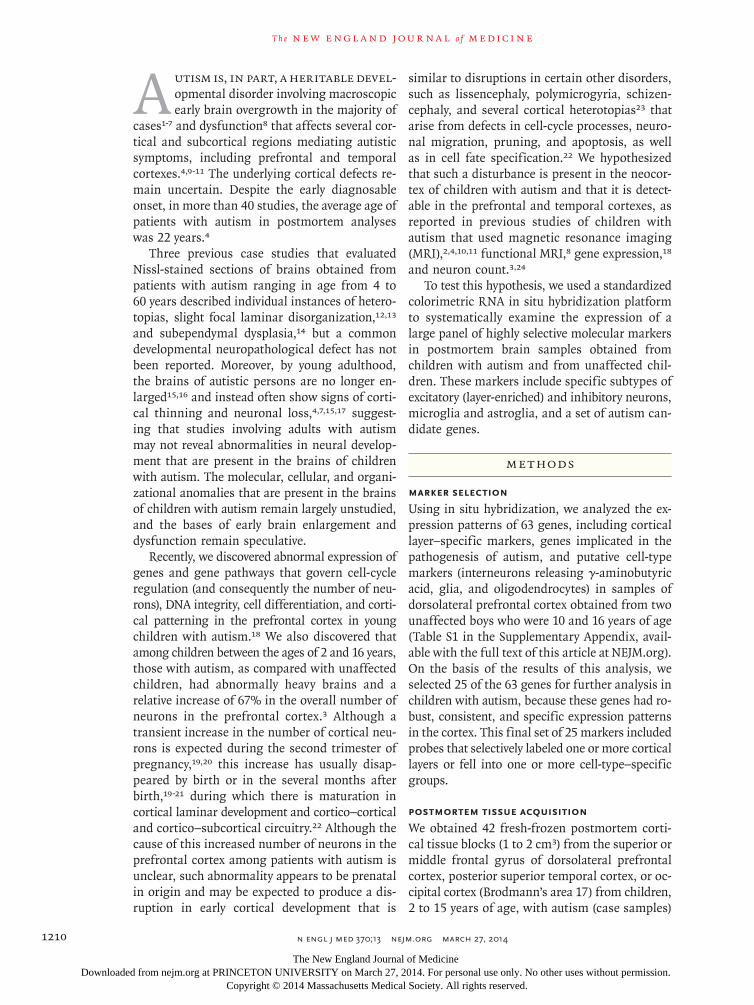
A utism is, in part, a heritable devel-opmental disorder involving macroscopic early brain overgrowth in the majority of
cases1-7 and dysfunction8 that affects several cor-tical and subcortical regions mediating autistic symptoms, including prefrontal and temporal cortexes.4,9-11 The underlying cortical defects re-main uncertain. Despite the early diagnosable onset, in more than 40 studies, the average age of patients with autism in postmortem analyses was 22 years.4
Three previous case studies that evaluated Nissl-stained sections of brains obtained from patients with autism ranging in age from 4 to 60 years described individual instances of hetero-topias, slight focal laminar disorganization,12,13 and subependymal dysplasia,14 but a common developmental neuropathological defect has not been reported. Moreover, by young adulthood, the brains of autistic persons are no longer en-larged15,16 and instead often show signs of corti-cal thinning and neuronal loss,4,7,15,17 suggest-ing that studies involving adults with autism may not reveal abnormalities in neural develop-ment that are present in the brains of children with autism. The molecular, cellular, and organi-zational anomalies that are present in the brains of children with autism remain largely unstudied, and the bases of early brain enlargement and dysfunction remain speculative.
Recently, we discovered abnormal expression of genes and gene pathways that govern cell-cycle regulation (and consequently the number of neu-rons), DNA integrity, cell differentiation, and corti-cal patterning in the prefrontal cortex in young children with autism.18 We also discovered that among children between the ages of 2 and 16 years, those with autism, as compared with unaffected children, had abnormally heavy brains and a relative increase of 67% in the overall number of neurons in the prefrontal cortex.3 Although a transient increase in the number of cortical neu-rons is expected during the second trimester of pregnancy,19,20 this increase has usually disap-peared by birth or in the several months after birth,19-21 during which there is maturation in cortical laminar development and cortico–cortical and cortico–subcortical circuitry.22 Although the cause of this increased number of neurons in the prefrontal cortex among patients with autism is unclear, such abnormality appears to be prenatal in origin and may be expected to produce a dis-ruption in early cortical development that is
similar to disruptions in certain other disorders, such as lissencephaly, polymicrogyria, schizen-cephaly, and several cortical heterotopias23 that arise from defects in cell-cycle processes, neuro-nal migration, pruning, and apoptosis, as well as in cell fate specification.22 We hypothesized that such a disturbance is present in the neocor-tex of children with autism and that it is detect-able in the prefrontal and temporal cortexes, as reported in previous studies of children with autism that used magnetic resonance imaging (MRI),2,4,10,11 functional MRI,8 gene expression,18 and neuron count.3,24
To test this hypothesis, we used a standardized colorimetric RNA in situ hybridization platform to systematically examine the expression of a large panel of highly selective molecular markers in postmortem brain samples obtained from children with autism and from unaffected chil-dren. These markers include specific subtypes of excitatory (layer-enriched) and inhibitory neurons, microglia and astroglia, and a set of autism can-didate genes.
Me thods
Marker Selection
Using in situ hybridization, we analyzed the ex-pression patterns of 63 genes, including cortical layer–specific markers, genes implicated in the pathogenesis of autism, and putative cell-type markers (interneurons releasing γ-aminobutyric acid, glia, and oligodendrocytes) in samples of dorsolateral prefrontal cortex obtained from two unaffected boys who were 10 and 16 years of age (Table S1 in the Supplementary Appendix, avail-able with the full text of this article at NEJM.org). On the basis of the results of this analysis, we selected 25 of the 63 genes for further analysis in children with autism, because these genes had ro-bust, consistent, and specific expression patterns in the cortex. This final set of 25 markers included probes that selectively labeled one or more cortical layers or fell into one or more cell-type–specific groups.
Postmortem Tissue Acquisition
We obtained 42 fresh-frozen postmortem corti-cal tissue blocks (1 to 2 cm3) from the superior or middle frontal gyrus of dorsolateral prefrontal cortex, posterior superior temporal cortex, or oc-cipital cortex (Brodmann’s area 17) from children, 2 to 15 years of age, with autism (case samples)
The New England Journal of Medicine Downloaded from nejm.org at PRINCETON UNIVERSITY on March 27, 2014. For personal use only. No other uses without permission.
Copyright © 2014 Massachusetts Medical Society. All rights reserved.

Disorganization in the neocortex of Children with Autism
n engl j med 370;13 nejm.org march 27, 2014 1211
or without autism (control samples) (Table 1, and Table S2 in the Supplementary Appendix, with details including cause of death). There was no preselection for either case or control samples with specific clinical endophenotypes. Selected case samples represented nearly the entirety of tissue suitable for study at the Brain and Tissue Bank for Developmental Disorders at the Nation-al Institute of Child Health and Human Develop-ment and the Harvard Brain Tissue Resource Center (see the Supplementary Appendix for a further description of exclusionary criteria). Samples that passed quality-control measures in-cluded 22 blocks of dorsolateral prefrontal cortex (from eight boys and three girls in each group), 5 blocks of posterior superior temporal cortex (2 case samples from boys and 3 control sam-ples from boys), and 6 blocks of occipital cortex (3 case samples from boys and 3 control samples from boys) (mean [±SD] RNA integrity number, 7.10±1.74 for case samples; 7.04±1.71 for control samples) (Fig. 1A).
Marker-Based Phenotyping
Study IEach sample of dorsolateral prefrontal cortex (8 case samples and 8 control samples from boys) was serially cryosectioned (20-μm thick-ness) in a plane of section containing all corti-cal layers (Fig. 1B). Sections were grouped into 10 series of 30 sections per series; 24 sections were labeled with the use of markers for in situ hybridization, 2 sections were Nissl-stained for gross anatomic and cellular cytoarchitectural analysis, and 4 sections were left unstained for future use. We modified the methods for auto-mated high-throughput in situ hybridization and acquisition of whole-slide digital imaging for processing postmortem samples of young hu-man postnatal fresh-frozen brain tissue.25
Study IIWe serially sectioned each block and used in situ hybridization to label samples of dorsolateral prefrontal cortex from the 3 case samples and 3 control samples from girls, plus tissue from temporal cortex from boys (2 case samples and 3 control samples) and occipital cortex from boys (3 case samples and 3 control samples) to assay the expression of five genes: CALB1, RORB, PCP4, PDE1A, and NEFL. These genes represent a subset of the genes that showed robust changes in the case samples from boys that were ana-
lyzed in study I. (See the Methods section in the Supplementary Appendix for further details re-garding the gene selection.)
Rating of Marker Expression
We scored all data obtained by in situ hybridiza-tion for each gene on each specimen using a 3-point scale: 0 for normal, 1 for mild abnormal-ity, and 2 for severe abnormality. A specimen was considered to be abnormal if we identified at least one of the following three criteria in three or more adjacent sections: the intensity of gene expression appeared to be reduced or disrupted, as compared with that in controls; gene expres-sion was abnormal owing to a qualitative change in the number of labeled cells, as compared with the number in adjacent areas; or the pattern of gene expression that was specific to the cell type
Table 1. Clinical Data on the 11 Patients with Autism in the Study.*
Patient No. Age Sex
Score on Autism Diagnostic Interview–Revised
Intellectual Disability†
Social Communication
Restrictive and
Repetitive
yr
12 2 M 14 9 (NV) 6 No
13 4 F 26 13 (NV) 3 Yes
14 5 M NA NA NA Yes
15 5 F 24 20 (V) 7 Yes
16 7 M 22 18 (V) 8 Yes
17 8 M 19 14 (NV) 4 No
18 8 M NA NA NA Yes
19 8 M 24 10 (NV) 10 Yes
20 9 M 24 20 (V) 6 No
21 14 M 22 14 (NV) 8 Yes
22 15 F 22 21 (V) 5 No
* To meet the diagnostic classification of autism, the patient must have met cutoff scores in each of three areas of the Autism Diagnostic Interview–Revised (Western Psychological Services): the Qualitative Abnormalities in Reciprocal So cial Inter action section (with a cutoff score of 10), the Quali-tative Abnormalities in Commu nication portion (with a cutoff score of 7), and the Restricted, Repetitive, and Stereo typed Patterns of Behavior section (with a cutoff score of 3). All patients met or exceeded cutoffs for a diagnostic classification of autism on the basis of this instrument, except for Patients 14 and 18, for whom no scores were available (NA). The diagnosis of autism in these patients was verified by brain banks and confirmed by a review of re-cords by a research psychologist independent of the brain banks. Additional diagnostic details regarding the patients with autism (listed here) and the controls (Patients 1 to 11) are provided in Table S2 in the Supplementary Appendix. NV denotes nonverbal, and V verbal.
† Intellectual disability status was determined on the basis of available standard-ized IQ scores for Patients 12 through 16 and of a review of available patient records without a standardized IQ measure for Patients 17 through 22.
The New England Journal of Medicine Downloaded from nejm.org at PRINCETON UNIVERSITY on March 27, 2014. For personal use only. No other uses without permission.
Copyright © 2014 Massachusetts Medical Society. All rights reserved.

T h e n e w e ngl a nd j o u r na l o f m e dic i n e
n engl j med 370;13 nejm.org march 27, 20141212
C Labeling in Adult and Child Control Samples
D Patchlike Feature in Autism (Patient 20) E False-Color Composite of Multiple Markers
F Detailed View of Panel E Inset
A Location of Samples B Sectioning and Labeling
Nissl
Nissl
CALB1
CALB1
RORB
RORB
PCP4
PCP4
CTGF
Adult
Child
Dorsolateral prefrontal cortex
Posterior superiortemporal cortex
Occipital cortex
Control: 8M/3FCase: 8M/3F
Control: 3MCase: 2M Control: 3M
Case: 3M
30 sections10 series
1-cm slab
1-cm3 block
ISH
Nissl
2
1
3
4
5
6
wm
2
1
3
4
5
6
wm
2
1
3
4
5
6
wm
2
1
3
4
5
6
wm
2
1
3
4
5
6
wm
2
1
3
4
5
6
wm
2
1
3
4
5
6
wm
2
1
3
4
5
6
wm
1 mm
1 mm
21
345
6
wm
21
3
45
6
wm
21
3
45
6
wm
21
345
6
wm
21
345
6
6b
wm
Overlay
5.6
mm
11.0 mm
5.8 mm
Layer 2/3 CALB1
Layer 5 PCP4Layer 6/6b CTGF
Layer 3/4/5 RORB
21
3
4
5
6
wm
The New England Journal of Medicine Downloaded from nejm.org at PRINCETON UNIVERSITY on March 27, 2014. For personal use only. No other uses without permission.
Copyright © 2014 Massachusetts Medical Society. All rights reserved.
Disorganization in the neocortex of Children with Autism
n engl j med 370;13 nejm.org march 27, 2014 1213
or layer appeared to be abnormal, as compared with controls. One investigator examined and scored all sections in every case, and a second investigator at a different location, who was un-aware of the scores of the first investigator, inde-pendently examined and scored all sections. The two sets of scores were then compared and eval-uated for the degree of concordance. (Details re-garding scoring are provided in the Methods sec-tion in the Supplementary Appendix.)
Expression Overlay and Three-Dimensional Reconstruction
To visualize coregistered regions of abnormal ex-pression across genes, multicolor overlays were created by thresholding and manually registering and compositing series of images on in situ hy-
bridization with the use of Adobe Photoshop CS5 (Adobe Systems). Pseudoexpression density rep-resentations were created for each image on in situ hybridization and aligned to form an inter-polated image volume. The image volumes were rendered in a molecular visualization tool (UCSF Chimera26) to capture the full three-dimensional microstructure of cortical layering within the tis-sue block.
R esult s
Expression Analyses
To provide an initial description of the disease in the cortex of children with autism, we conducted in situ expression analyses, using an exploratory design that made use of sparse sampling across a wide range of areas within the dorsolateral pre-frontal cortex, posterior superior temporal cortex, and occipital cortex of children with and children without autism.
Laminar Expression Profiles in Control Cortex
Laminar expression patterns that were examined in the 11 samples from unaffected children ap-peared to be similar to those in unaffected adults, as described previously27 (Fig. 1C), with one ex-ception. A sample from a 9-year-old unaffected girl (Patient 6) showed a focal abnormality: a patchlike region (6 mm in length) of reduced la-beling of multiple markers in layers 3, 4, and 5 of dorsolateral prefrontal cortex (Fig. S2 in the Sup-plementary Appendix).
Aberrant Laminar Expression Patterns
Focal regions of reduced expression or unusual patterns of markers on in situ hybridization were identified in 10 of 11 case samples by independent raters (86% interrater concordance for detection and 75% agreement on specific level of severity for 181 ratings) (Fig. 2). These regions, hereafter referred to as patches, were identified by the presence of patchlike abnormalities ranging from 5 to 7 mm in length in one or more independent markers, adjacent to regions of apparently unaf-fected cortex (i.e., cortex that appeared to be very similar to that of unaffected children). The presen-tation of aberrant labeling extended through mul-tiple sections and most often involved a local reduc-tion in the expression of a subset of cellular markers. In samples obtained from 3 of the 11 children with autism, we observed areas containing in-
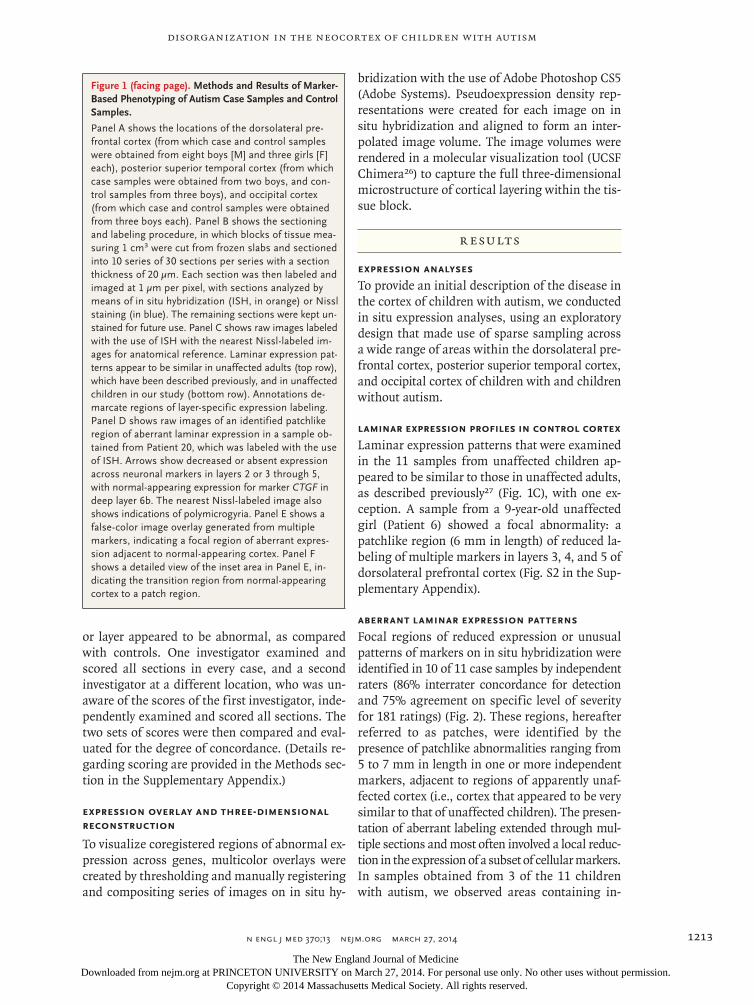
Figure 1 (facing page). Methods and Results of Marker-Based Phenotyping of Autism Case Samples and Control Samples.
Panel A shows the locations of the dorsolateral pre-frontal cortex (from which case and control samples were obtained from eight boys [M] and three girls [F] each), posterior superior temporal cortex (from which case samples were obtained from two boys, and con-trol samples from three boys), and occipital cortex (from which case and control samples were obtained from three boys each). Panel B shows the sectioning and labeling procedure, in which blocks of tissue mea-suring 1 cm3 were cut from frozen slabs and sectioned into 10 series of 30 sections per series with a section thickness of 20 μm. Each section was then labeled and imaged at 1 μm per pixel, with sections analyzed by means of in situ hybridization (ISH, in orange) or Nissl staining (in blue). The remaining sections were kept un-stained for future use. Panel C shows raw images labeled with the use of ISH with the nearest Nissl-labeled im-ages for anatomical reference. Laminar expression pat-terns appear to be similar in unaffected adults (top row), which have been described previously, and in unaffected children in our study (bottom row). Annotations de-marcate regions of layer-specific expression labeling. Panel D shows raw images of an identified patchlike region of aberrant laminar expression in a sample ob-tained from Patient 20, which was labeled with the use of ISH. Arrows show decreased or absent expression across neuronal markers in layers 2 or 3 through 5, with normal-appearing expression for marker CTGF in deep layer 6b. The nearest Nissl-labeled image also shows indications of polymicrogyria. Panel E shows a false-color image overlay generated from multiple markers, indicating a focal region of aberrant expres-sion adjacent to normal-appearing cortex. Panel F shows a detailed view of the inset area in Panel E, in-dicating the transition region from normal-appearing cortex to a patch region.
The New England Journal of Medicine Downloaded from nejm.org at PRINCETON UNIVERSITY on March 27, 2014. For personal use only. No other uses without permission.
Copyright © 2014 Massachusetts Medical Society. All rights reserved.

T h e n e w e ngl a nd j o u r na l o f m e dic i n e
n engl j med 370;13 nejm.org march 27, 20141214
creased density of labeled cells immediately adja-cent to patch regions (data not shown).
We identified the majority of patches using markers specific for layers 4 and 5. However, no two patches were identical in presentation. Patches within one case sample had a similar
pattern of labeling. We observed heterogeneity between case samples with respect to the layers and the cell types that were most abnormal. Samples obtained from a 9-year-old boy with autism (Patient 20) showed the clearest presen-tation of a patch phenotype, with reduced ex-
Mar
ker
NDNFCXCL14RELNCALB2CALB1MFGE8PVALBRORBVAT1LMBPPCP4PDE1ASYNPRNTNG2FOXP2CTGFNEFLCNTNAP2NRXN1PRKCB1VIPSSTGAD1AIF1SLC1A2
111223345555556
6b
111
2,32,33
2–63–55
5,65
5,65
5,66
6/6b
Lam
ina
Spec
ifici
ty
Prim
ary
Exci
tato
ryIn
tern
euro
nA
utis
mG
lial
Stud
y I
Stud
y II
F C
ontr
ol*
M a
utis
mF
autis
mM
aut
ism
F au
tism
Tota
l
Pref
ront
al
Tem
pora
l
Occ
ipita
l
Tota
l
Pref
ront
al
Tem
pora
l
Occ
ipita
l
M a
utis
m**
M a
utis
mM
aut
ism
M a
utis
mM
aut
ism
M a
utis
m**
*F
autis
mM
aut
ism
**M
aut
ism
M a
utis
m**
M a
utis
mM
aut
ism
Severe Mild or Severe6 12 13 14 15 16 17 18 19 20 21 22 16 19 16 17 19
Diagnosis
PatientNo.
Region Prefrontal
Lamina Cell Type
Tempor
al
Occipita
l
Percent Affected
NA
100500
Independent Anatomist RatingSeverely affectedMildly affectedUnaffectedNA
Total
Total
Severe
Mild or Severe
LaminaExcitatoryInhibitoryAutismGlia
LaminaExcitatoryInhibitoryAutismGlia
* ** *** ** **
Figure 2. Comprehensive View of Identified Expression Abnormalities.
The left panel shows the genetic markers and their classification: laminar layer, cell type, and whether the data are from study I (in which dorsolateral prefrontal cortex from boys was assayed) or study II (in which the expression of a subset of genes was evaluated in both sexes and additional regions). The middle panel shows expression abnormalities as identified by an aggregate decision by two independent in-vestigators after initial examination, according to the brain region. The intensity of the blue color indicates the affected level. The charts below and to the right of the investigators’ ratings show the proportion of markers that were examined that fell into one of two catego-ries of severity (severe or either mild or severe), according to the cell type (below) and brain location (at right). More intense red color indicates greater severity. A single asterisk indicates Patient 6, a 9-year-old unaffected girl who was the only control in whom a patch was identified. Double asterisks indicate Patient 16, a 7-year-old boy with autism in whom investigators found no patch in the dorsolateral prefrontal cortex but a clear patch in the posterior superior temporal cortex. Triple asterisks indicate Patient 21, a 14-year-old boy with autism in whom no patch was identified.
The New England Journal of Medicine Downloaded from nejm.org at PRINCETON UNIVERSITY on March 27, 2014. For personal use only. No other uses without permission.
Copyright © 2014 Massachusetts Medical Society. All rights reserved.

Disorganization in the neocortex of Children with Autism
n engl j med 370;13 nejm.org march 27, 2014 1215
pression found across multiple independent markers within a 5.8-mm diameter patch of cortex (Fig. 1D, 1E, and 1F).
Patches were identified in both dorsolateral prefrontal cortex (in 10 of 11 case samples) and posterior superior temporal cortex (in 2 of 2 case samples) (Fig. 2). No abnormal expression pat-terns of any markers were identified in the oc-cipital cortex in 3 case samples or in the poste-rior superior temporal cortex or occipital cortex in 3 control samples.
Three-Dimensional Reconstruction of Laminar Defects
To better describe the complete microstructure of the patch phenotype, we performed three-dimensional reconstruction of laminar organi-zation in regions of patches, using four layer-specific markers for four samples of dorsolateral prefrontal cortex (two case samples and two con-trol samples). This method enabled visualization of marker distribution independent of the origi-nal plane of section and confirmed that patch regions of multiple markers were closely aligned. Figure 3 shows the surface reconstruction of cor-tex in a child with autism (Patient 20 from Fig. 1) with a prominent pathological patch spanning several independent markers immediately adja-cent to typical-appearing cortex.
Marker Expression in Patch Regions
A deficit in the expression of markers of excit-atory cortical neurons was the most robust indi-cator of a patch region, although abnormalities were identified in three of the four cell-type–specific groups that were examined (Fig. 2). Markers that were encoded by each of the five autism candidate genes showed mild patch ab-normalities across the majority of case samples that were examined. Most interneuron markers (e.g., PVALB and CALB1) showed mild abnormal-ities, which were inconsistently present within patches across case samples, with a few excep-tions (e.g., GAD1 and VIP) that appeared to be rela-tively unaffected in all case samples that were analyzed.
With one exception (SLC1A2 in Patient 12), glia-specific markers showed the same labeling patterns in case samples and control samples across the different regions of cortex, including tissue that contained patch abnormalities in other markers (Fig. S9 in the Supplementary Appendix). This finding supports the premise that features
of patches cannot be attributed primarily to the global down-regulation of gene expression.
No Reduction in Neuron Density
To determine whether expression abnormalities across multiple genes were due to a reduction in the number of neurons at discrete locations, we performed post hoc blinded stereologic density
C
D
A B
Layer 2/3Layer 3/4/5Layer 4/5Layer 6/6b
Layer 3/4/5 RORB
Layer 3/4/5 RORBLayer 4/5 PCP4Layer 6/6b CTGF
Layer 4/5 PCP4 Layer 6/6b CTGF
Figure 3. Three-Dimensional Reconstruction of a Patch Region in Cortical Microstructure.
Panel A shows a three-dimensional reconstruction of the four markers, as seen on in situ hybridization of samples obtained from Patient 20 (as shown in Fig. 1, Panels D, E, and F). Panel B shows a cross section of the reconstructed struc-ture at the original slice plane for the same four markers. Panel C shows angled renderings of individual layer-specific markers, indicating a focal patch of sub-stantially reduced or absent expression. Panel D shows an angled reconstruc-tion indicating a patch region with an independent, conserved location across several markers. The dashed oval indicates the patch region.
The New England Journal of Medicine Downloaded from nejm.org at PRINCETON UNIVERSITY on March 27, 2014. For personal use only. No other uses without permission.
Copyright © 2014 Massachusetts Medical Society. All rights reserved.

T h e n e w e ngl a nd j o u r na l o f m e dic i n e
n engl j med 370;13 nejm.org march 27, 20141216
measurements using Nissl sections adjacent to sections showing patches in dorsolateral pre-frontal cortex. We measured pan-laminar neuro-nal and glial density across two regions (one con-taining the patch and the other distant to the patch) per sample across a minimum of five Nissl sections that spanned a minimum of 3 mm of cortex. We observed a small but significant in-crease in the average neuronal density in the patch regions in case samples as compared with control samples (P = 0.01 by two-tailed t-test). In case samples, there was a small but nonsignifi-cant increase in the neuronal density in patch regions as compared with the region of adjacent cortex (P = 0.10). On the basis of these results, we infer that regions of focal patches were not the result of a reduced number of neurons (Fig. S8 in the Supplementary Appendix).
Quantitative Validation of Findings
We performed a quantitative reverse-transcriptase–polymerase-chain-reaction (RT-PCR) assay to vali-date the semiquantitative findings on in situ hy-bridization. We examined additional tissue blocks obtained from the four case samples with the most severe patches from study I. In these sam-ples, we further identified one severe patch and one mild patch. Focusing on the case sample with the severe patch, we used laser capture micro-dissection guided by in situ hybridization to iso-late the patch and adjacent regions of interest and used RT-PCR to assay messenger RNA tran-script levels of CALB1. Consistent with the results obtained on in situ hybridization, we observed that the CALB1 signal was greatly decreased (by a mean factor of 11.02±1.51 in three samples) in the isolated patch, as compared with the region of adjacent cortex (Fig. 4).
Discussion
Using a large panel of highly selective markers for specific cell subtypes and a subset of autism candidate genes, we detected discrete pathologi-cal patches of abnormal laminar cytoarchitecture and disorganization in the majority of analyzed samples of prefrontal and temporal cortexes, but not occipital cortex, obtained from the boys and girls with autism who were included in our study. Serial analysis and three-dimensional reconstruc-tion of multiple cellular markers revealed these
regions to be focal patches of abnormal gene ex-pression measuring 5 to 7 mm in length and spanning multiple contiguous neocortical layers. These patches were characterized by a decrease in the number of cells expressing layer- or cell-type–specific markers that are normally present in fully differentiated cortical neurons, as well as decreased expression of certain autism candidate genes.
The presentation of the patches was consis-tent within case samples but varied across cases. No cortical layer was uniformly spared, and the clearest evidence of abnormal expression was found in layers 4 and 5. Reduced marker expres-sion was not due to a reduced number of neu-rons; the identity of the unlabeled neurons in the patches remains to be determined. These neurons may be layer-appropriate neurons that failed to express the marker, neurons in an im-mature or perturbed developmental state, or layer-inappropriate neurons. Our data are con-sistent with an early prenatal origin of autism or at least prenatal processes that may confer a predisposition to autism.
Although our data suggest a novel pathologi-cal mechanism in autism, they do not identify the mechanism. The identified laminar disorga-nization could result from migration defects re-sulting in the failure of cells to reach their tar-geted destination and the accumulation of such cells in nearby regions, as has been seen in mouse models.28 Alternatively, patches could reflect de novo changes early in neurodevelop-mental processes, potentially in gene sequence or epigenetic state, which yield patch regions of affected progenitor cells adjacent to regions of unaffected progenitor cells. To test either model, a targeted analysis across large regions of neo-cortical tissue obtained from children with autism would be required, with detailed comparisons of gene sequence, methylation state, and ex-pression profiles in identified regions with cor-tical patches, as compared with regions without such patches.
Even though we did not preselect for specific clinical endophenotypes, we identified patho-logical cortical patches in 10 of 11 case samples (91%) and in 1 of 11 control samples (9%). Be-cause we sampled only small portions of cortex yet observed focal patches in nearly every case sample, the most parsimonious explanation is
The New England Journal of Medicine Downloaded from nejm.org at PRINCETON UNIVERSITY on March 27, 2014. For personal use only. No other uses without permission.
Copyright © 2014 Massachusetts Medical Society. All rights reserved.

Disorganization in the neocortex of Children with Autism
n engl j med 370;13 nejm.org march 27, 2014 1217
that pathological patches are widespread across prefrontal and temporal cortex in children with autism. Given the well-described phenotypic heterogeneity in autism, the presence of a rela-tively similar pathological feature across cases was unexpected. However, the features that we describe here may explain some of the hetero-geneity of autism: disorganized patches in differ-ent locations could disrupt disparate functional systems in the prefrontal and temporal cortexes and potentially influence symptom expression, response to treatment, and clinical outcome. Within this model, the observation of an appar-ent patch in one control sample also raises the possibility of a subclinical patch phenotype.
We did not observe in the patches obvious abnormalities of marker expression specific to either microglia or astroglia, a finding that shows that the lack of in situ signal was not a nonspecific-tissue or processing artifact affect-ing messenger RNA integrity in general. The post hoc RT-PCR experiment guided by in situ hybridization further confirmed our original finding that patch regions represent areas of quantitative decrease in signal rather than arti-facts from processing.
The strength of the standardized high-throughput colorimetric in situ hybridization used here is the reproducibility of labeling across large gene panels and the sensitivity of the method to label the soma of expressing cells in serial thin-tissue sections. This platform has been used extensively for genomewide mapping of brainwide transcript distributions in mouse brain25 and for targeted analysis in brain tissue obtained from nonhuman primates and from humans (www.brain-map.org). Our study design was informed by the accumulated knowledge of cell-type–specific gene expression and was test-ed to show similar specificity in a subset of genes that, when expressed, selectively label tis-sues in children’s brains. Although in situ hy-bridization is semiquantitative, we were able to identify focal differences in cellular (laminar) distributions and decreased expression levels across cortical regions. We advise caution, how-ever, in defining any nonpatch region as “nor-mative” autism cortex, because previous studies have shown widespread pathological features (e.g., overabundance of neurons) in the prefron-tal cortex of children with autism.3
Although our sample size was small in com-parison with postmortem studies of adult dis-eases, it is as large as or larger than that in most previous postmortem studies of autism. The study was not limited by tissue quality, since frozen blocks obtained from each patient were evaluated and selected for high RNA integrity
Fact
or D
iffer
ence
bet
wee
n Pa
tch
Reg
ion
and
Adj
acen
t Reg
ion
on R
T-PC
R
±1
−5
−3
−7
−9
−11
C Patch
Patch
AdjacentRegion
D Adjacent Region
6 5 4 3 2
E Difference in CALB1 Expression
A Nissl B CALB1
Figure 4. Post Hoc Quantitative Reverse-Transcriptase–Polymerase-Chain-Reaction (RT-PCR) Assay and In Situ Hybridization Validating Patch Region.
In a post hoc experiment, laser-capture microdissection was performed on a frozen tissue block of dorsolateral prefrontal cortex obtained from severely affected patients with autism. Panel A shows a Nissl-stained tissue section indicating the location of a patch (green box) and an adjacent region of in-terest (red box). Panel B shows the corresponding CALB1 image on in situ hybridization, with a region of decreased expression (green box) and adja-cent cortex (red box). Panel C shows a magnified view of the patch region with decreased CALB1 expression. Panel D shows a magnified view of an adjacent region with normal CALB1 expression. The approximate location of cortical layers 2 through 6 are indicated. Panel E shows the difference in expression between the patch region and the adjacent region on RT-PCR assay, indicating the factor reductions in CALB1 expression in the patch region, as compared with the adjacent region. The I bar indicates the stan-dard deviation.
The New England Journal of Medicine Downloaded from nejm.org at PRINCETON UNIVERSITY on March 27, 2014. For personal use only. No other uses without permission.
Copyright © 2014 Massachusetts Medical Society. All rights reserved.

T h e n e w e ngl a nd j o u r na l o f m e dic i n e
n engl j med 370;13 nejm.org march 27, 20141218
numbers before being sectioned and stained on in situ hybridization. Interpretation was not con-founded by other variables of interest: patho-logical cortical patches were present in boys and girls, in high- and low-functioning children, and regardless of the cause of death or postmortem interval. The only two children with autism who had a history of medical complications were those with the least severe patch defects: Patient 21, the only child with autism in whom we did not detect patches, was the only child in our study with a history of severe seizures, and Patient 16, who had in utero exposure to cocaine and hero-in, had the mildest pathological features with respect to patches (Table S2 in the Supplemen-tary Appendix). Otherwise, prenatal and peri-natal developmental histories were unremark-able and did not involve prematurity.
In conclusion, we identified discrete patches of disorganized cortex in the majority of postmor-tem samples obtained from young autistic chil-dren that we examined. These patches occurred in regions mediating the functions that are dis-turbed in autism: social, emotional, communica-tion, and language functions. Such abnormalities may represent a common set of developmental neuropathological features that underlie autism
and probably result from dysregulation of layer formation and layer-specific neuronal differentia-tion at prenatal developmental stages.
Supported by grants from the Simons Foundation (to Drs. Cour-chesne and Wynshaw-Boris), the Peter Emch Family Foundation (to Dr. Cour chesne), Cure Autism Now/Autism Speaks (to Dr. Cour-chesne), the Thursday Club Juniors (to Dr. Courchesne), the Allen Institute for Brain Science (to Drs. Lein, Sunkin, and Boyle), and the University of California, San Diego, Autism Center of Excel-lence (P50-MH081755, to Dr. Courchesne). Tissue for this study was provided by the National Institute of Child Health and Human Development Brain and Tissue Bank for Developmental Disorders (Baltimore) (N01-HD-4-3368 and N01-HD-4-3383), the Brain and Tissue Bank for Developmental Disorders (Miami), Autism Tissue Program (Princeton, NJ), and Harvard Brain Tissue Resource Cen-ter (Belmont, MA).
Disclosure forms provided by the authors are available with the full text of this article at NEJM.org.
We thank all the parents who have supported brain research through the donation of brain tissue from their loved ones; the Allen Institute for Brain Science founders, Paul G. Allen and Jody Allen, for their vision, encouragement, and support; Dr. Ronald Zielke at the National Institute of Child Health and Human De-velopment Brain and Tissue Bank for Developmental Disorders and Dr. Jane Pickett at the Autism Tissue Program for facilita-tion of tissue acquisition; Dr. Joseph Buckwalter, Dr. Cynthia Schu mann, Robert Johnson, and Robert Vigorito for their as-sistance in tissue dissection and collection; Drs. Mark Butt and Jacob Butt for their assistance with stereologic methods; Elaine Shen for her assistance with project management; the entire Atlas production team and the Information Technology team at the Allen Institute for their professional support; and Drs. Karen Pierce and Tiziano Pramparo for their comments on an earlier version of the manuscript.
1. Chawarska K, Campbell D, Chen L, Shic F, Klin A, Chang J. Early generalized overgrowth in boys with autism. Arch Gen Psychiatry 2011;68:1021-31.2. Hazlett HC, Poe MD, Gerig G, et al. Early brain overgrowth in autism associ-ated with an increase in cortical surface area before age 2 years. Arch Gen Psychia-try 2011;68:467-76.3. Courchesne E, Mouton PR, Calhoun ME, et al. Neuron number and size in pre-frontal cortex of children with autism. JAMA 2011;306:2001-10.4. Courchesne E, Pierce K, Schumann CM, et al. Mapping early brain develop-ment in autism. Neuron 2007;56:399-413.5. Sparks BF, Friedman SD, Shaw DW, et al. Brain structural abnormalities in young children with autism spectrum dis-order. Neurology 2002;59:184-92.6. Courchesne E, Carper R, Akshoomoff N. Evidence of brain overgrowth in the first year of life in autism. JAMA 2003; 290:337-44.7. Courchesne E, Karns CM, Davis HR, et al. Unusual brain growth patterns in early life in patients with autistic dis-order: an MRI study. Neurology 2001;57:2 45-54.
8. Redcay E, Courchesne E. Deviant functional magnetic resonance imaging patterns of brain activity to speech in 2-3-year-old children with autism spec-trum disorder. Biol Psychiatry 2008;64: 589-98.9. Murias M, Webb SJ, Greenson J, Daw-son G. Resting state cortical connectivity reflected in EEG coherence in individuals with autism. Biol Psychiatry 2007;62:270-3.10. Carper RA, Moses P, Tigue ZD, Courchesne E. Cerebral lobes in autism: early hyperplasia and abnormal age ef-fects. Neuroimage 2002;16:1038-51.11. Schumann CM, Bloss CS, Barnes CC, et al. Longitudinal magnetic resonance imaging study of cortical development through early childhood in autism. J Neurosci 2010;30:4419-27.12. Bailey A, Luthert P, Dean A, et al. A clinicopathological study of autism. Brain 1998;121:889-905.13. Hutsler JJ, Love T, Zhang H. Histo-logical and magnetic resonance imaging assessment of cortical layering and thick-ness in autism spectrum disorders. Biol Psychiatry 2007;61:449-57.14. Wegiel J, Kuchna I, Nowicki K, et al.
The neuropathology of autism: defects of neurogenesis and neuronal migration, and dysplastic changes. Acta Neuropathol 2010;119:755-70.15. Courchesne E, Campbell K, Solso S. Brain growth across the life span in au-tism: age-specific changes in anatomical pathology. Brain Res 2011;1380:138-45.16. Redcay E, Courchesne E. When is the brain enlarged in autism? A meta-analysis of all brain size reports. Biol Psychiatry 2005;58:1-9.17. Courchesne E, Pierce K. Why the fron-tal cortex in autism might be talking only to itself: local over-connectivity but long-distance disconnection. Curr Opin Neu-robiol 2005;15:225-30.18. Chow ML, Pramparo T, Winn ME, et al. Age-dependent brain gene expression and copy number anomalies in autism suggest distinct pathological processes at young versus mature ages. PLoS Genet 2012;8(3):e1002592.19. Gohlke JM, Griffith WC, Faustman EM. Computational models of neo cortical neu-ronogenesis and programmed cell death in the developing mouse, monkey, and hu-man. Cereb Cortex 2007;17:2433-42.20. Rabinowicz T, de Courten-Myers GM,
References
The New England Journal of Medicine Downloaded from nejm.org at PRINCETON UNIVERSITY on March 27, 2014. For personal use only. No other uses without permission.
Copyright © 2014 Massachusetts Medical Society. All rights reserved.

Disorganization in the neocortex of Children with Autism
n engl j med 370;13 nejm.org march 27, 2014 1219
Petetot JM, Xi G, de los Reyes E. Human cortex development: estimates of neuro-nal numbers indicate major loss late dur-ing gestation. J Neuropathol Exp Neurol 1996;55:320-8.21. Larsen CC, Bonde Larsen K, Bogda-novic N, et al. Total number of cells in the human newborn telencephalic wall. Neu-roscience 2006;139:999-1003.22. Bystron I, Blakemore C, Rakic P. Development of the human cerebral cor-tex: Boulder Committee revisited. Nat Rev Neurosci 2008;9:110-22.
23. Gleeson JG, Walsh CA. Neuronal mi-gration disorders: from genetic diseases to developmental mechanisms. Trends Neurosci 2000;23:352-9.24. Santos M, Uppal N, Butti C, et al. Von Economo neurons in autism: a stereologic study of the frontoinsular cortex in chil-dren. Brain Res 2011;1380:206-17.25. Lein ES, Hawrylycz MJ, Ao N, et al. Genome-wide atlas of gene expression in the adult mouse brain. Nature 2007;445: 168-76.26. Pettersen EF, Goddard TD, Huang CC,
et al. UCSF Chimera — a visualization system for exploratory research and anal-ysis. J Comput Chem 2004;25:1605-12.27. Zeng H, Shen EH, Hohmann JG, et al. Large-scale cellular-resolution gene pro-filing in human neocortex reveals species-specific molecular signatures. Cell 2012; 149:483-96.28. Torii M, Hashimoto-Torii K, Levitt P, Rakic P. Integration of neuronal clones in the radial cortical columns by EphA and ephrin-A signalling. Nature 2009;461:524-8.Copyright © 2014 Massachusetts Medical Society.
Mallard, Trier, Germany Christian Kaes, M.D.
The New England Journal of Medicine Downloaded from nejm.org at PRINCETON UNIVERSITY on March 27, 2014. For personal use only. No other uses without permission.
Copyright © 2014 Massachusetts Medical Society. All rights reserved.