Embed Size (px)
Citation preview
PATCHING OF PCC PAVEMENTS
FIELD EVALUATION OF MATERIALS & CONSTRUCTION TECHNIQUES
Project Number ST -2019-2
Finol Report
Frozi er Porker ond Lee Shoemoker Hi ghwoy Reseorch Center
Auburn Uni versi ty
Sponsored by The Stote of A 1 obomo Hi ghwoy Deportment
Jonuory 1988
The contents of this report reflect the views of the authors who are
responsible for the facts and accuracy of the data presented herein. The
contents do not necessarily reflect the official views or policies of the
State of Alabama Highway Department. This report does not constitute a
standard, specification, or regulation.
i
ACKNOWLEDGEMENTS
The research reported herei n was sponsored by the State of Alabama
Hi ghway Department through a cooperative agreement wi th Auburn
University. The administrative assistance of Messrs. Frank L Holman and
James W. Keith of the State of Alabama Highway Department, was most
helpful in conducting this research. The assistance of Mr. Charles Ponder
and Third Division, District Three maintenance personnel in constructing
\-59 patches is gratefully acknowledged. Likewise, the assistance of
Messrs. Pete McCutchin and James Stephens and Sixth Division, District
Three maintenance personnel in constructing 1-85 patches is gratefully
acknowl edged.
The efforts of Messrs. Ri ck Reckart and Juan Hi nds-Ri co, graduate
research assistants, are acknowledged. The laboratory and field testing
were accompllshed primarily through their efforts.
Master Bui 1 ders, Inc. supp 1 i ed the Pozzo 1 i th 555 accelerator and
Mitchell Fibercon, Inc. provided steel fibers. Type III cement for
1 aboratory studi es was proyi ded by Nat i ona 1 Cement Co. Aggregate and
miscellaneous materials for patch construction were provided by the
Alabama Hi ghway Department.
;;
ABSTRACT
Laboratory and fi e 1 d studi es were conducted to evaluate three rapi d
setting PCC pavement patching materials, the effects of temperature
during patch construction, the effects of anchors on patch performance and
the effects of sawing to outline patch area on patch performance. Patches
were constructed on I-59 in Gadsden and 1-85 in Montgomery.
Mi x desi gn studi es revealed that PCC with and without steel f1 bers
could be produced that provided adequate rapid-setting strength.
Four-hour strengths of these materials were lower thAn the proprietary
materi a 1 Roadpatch but after 5 to 6 hours they provi ded hi gher strengths.
Anchor optimization studies revealed that the ultimate load that
could be resisted by a Simulated patch was linearly proportional to the
amount of steel and that smaller anchor sizes provided better
perf ormance.
Field studies revealed that outlining deteriorated areas with a 1-2.
inch deep sawcut aided in patch area preparation. Vibration of patch
materials was essential for proper consolidation.
Steel fibrous PCC patches performed best. Patches constructed
duri ng warm weather performed better than those constructed duri ng cool
weather. Anchors did not appear to improve patch performance. Sawing
di d not dramat i call y improve patch performance but di d ai din patch
construct ion.
iii
T ABLE OF CONTENTS
I NTRODUCT I ON ........................................................................... .
MIX DESIGN STUDIES................................................................ 3
ANCHOR OPTIMIZATION STUDIES........................................ 16
PATCH CONSTRUCTION........................................................... 25
PATCH PERFORMANCE .......................................... :.................. 42
CONCLUSIONS AND RECOMMENDATIONS........................... 54
REFERENCES................................................................................ 56
iv
LIST OF TABLES
Table 1. Rapid-Setting pee Mix Design Test Results-Gadsden ........................................................................... :..... 6
Table 2. Rapid-Setting pee Mix Design Test Results-Montgomery........................................................................ 8
Table 3. Fibrous pee Mix Design Test Results..................... 9
Table 4. Time-Strength Data....................................................... 13
Table 5. Summary of Results from Anchor Optimization Study..................................................................................... 21
Table 6. Performance Evaluation: I-59 Patches................ 48
Toble 7. Perform once Evoluotion: 1-85 Potches............... 49
Table 8. Performance Evaluation: All Patches.................. 50
v
LIST OF FIGURES
Figure 1. Laboratory Early Strength Development Curves............................................................................................ 14
Fi gure 2. Laboratory Strength Development Curves............................................................................................ 14
Figure 3. Anchor Optimization Tests ................................................. . a. Forms and Shear Connectors In-Place ..................... . b. Test Specimens Around Reaction PedestaL ......... . c. Loading Specimens ........................................................... . d. F ai 1 ed Speci men ................................................................ .
17 17 17 18 18
Figure 4. Typical Load-Deflection Curves (#6 Bar Anchors).. 20
Figure 5. Maximum Load vs Percent Anchor Steel....................... 22
Figure 6.
Figure 7.
Least Square Linear Regressi on Equations ................. .
Patch Construct i on ............................................................... . a. Cracked Are~ Along a JOint.. ..... : ................................. . b. Sawcut (l-2 Deep) Around Fall ed Area ................ . c. Failed Area Outlined with Sawcut.. ......................... . d. Jackhammer Removi ng Damaged Concrete ........... . e. Anchor Installation ........................................................ . f. Joint Filler Installation ............................................... . g. Large Patch Area wi th Anchors Ready
for Concrete ................................................................... . h. Sma11 Patch Area with Anchors Ready
for Concrete ................................................................... . 1. Patch Materi a 1 s Mi xed in Portable Mi xer ................ . j. Completed Patch--Consolidated and
Finished with Conventional Techniques ............ . k. Patches Insulated During Curing to
Accelerate Rate of Hydration ................................. . 1. Tire Damage to Unset Patch ......................................... .
Fi gure 8. I-59 Strength Development Curves ................................ . a. Rapid-Setting PCC ........................................................... . b. Fibrous PCC ......................................................................... . c. Roadpatch ............................................................................. .
Figure 9. 1-85 Strength Development Curves ................................ . a. Rapid-Setting PCC ........................................................... . b. Fibrous PC C ......................................................................... . c. Roadpatch ............................................................................ .
Fi gure 1 O. ~.o~~~~:~~f~ ;~~~f.~.~.~.~.~.:..~.~~.~ .. ~.~.~=~.~.~.~~:::::::::::: b. Fibrous PCC ........................................................................ . c. Roadpatch ............................................................................ .
vi
23
30 30 30 31 31 32 . 32
33
33 34
34
35 35
37 37 37 37
38 38 38 38
39 39 39 39
LIST OF FIGURES {continued)
Figure 11. Comparison of Long-Term Lab and Field Strengths................................................................................ 40
Figure 12.
a. Rapi d-Set t i ng PCC........................................................ 40 b. Fibrous PCC......................... ............................................ 40
Patch Deteri orat i on .......................................................... . a. Initial Cracking and Spa11ing .................................. . b. Worki ng Crack Where Joi nt Not Replaced .......... . c. Partia111atch Remova1--Filled with Asphalt
Mix .................................................................................. . d. Complete Patch Remova1--Filled with
Aspha 1 t Mi x ................................................................. . e. Deterioration Around Periphery of
Unsawed Patch ........................................................... . f. Deteri orat i on Around Peri phery of Sawed
Patch .............................................................................. .
vii
44 44 44
45
45
46
46
I NTRODUCT I ON
Most Portland cement concrete (PCC) pavements in Alabama are on the
interstate system and are concentrated in heavily traveled urban areas.
The older and more heavily travled sections have begun to show the
effects of wear due to weathering and traffic volumes that have often far
exceeded design values. As deterioration develops cracked and spalled
areas must be patched to mai ntal n servl ceabi 1 1 ty: Damage 1 s normall y
lnitially concentrated around joints and can usually be repaired with small
partial depth patches. However, as deterioration progresses, damage
severity lncreases and full depth complete slab replacement also becomes
part of reQui red mai ntenance operations. The research descri bed herei n
examines materials and construction techniques for small partial depth
patches} but the i nf ormat ion re lat i ve to patch materi a1 s wi 11 al so be
applicable for full depth complete slab replacement.
A key reQui rement for any patch 1 s that 1 t be durable and long last 1 ng.
For heavi 1 y traveled roadways, the reQui rement of rapi d construct i bl 1 1 ty
must be added in order to minimize disruptions to traffic flow. For
routine operations this means that the patch must be constructed bet wen
morning and afternoon peak flow periods. This gives total construction
time of less than eight hours whlch translates into even shorter curing
times. Six hours curing time was the target time for development of
strength sufficient to prevent patch damage when opened to traffic. Six
hours was suggested by Ross (1) as reasonable for construction withi n an
eight-hour work shift and was used in earlier laboratory studies (2).
Since the rate of strength gain is a function of temperature, time of
construct i on was also a factor that was cons] dered. The need for
economical yet durable patches that could be rapidly constructed led to
the research described herein.
Research Db j ect i ves
The objectives of the research were 1) to identify patch materials
and construction techniques that would produce economical durable
patches when constructed and cured in one working day, 2) to construct a
seri es of patches under a vari ety of condi t ions and moni tor thei r
perf ormance, and 3) to develop recommendations f or pee pavement patch
construct ion.
Scope of Research
To accomplish the research objectives, a testing plan was developed
that included the construction and monitoring of patches at two locations
(I-59 in Gadsden and 1-85 in Montgomery) with three materials (Roadpatch
II (1), rapi d-sett i ng pee, and rapi d-sett i ng steel fi brous pee). Patches
were constructed during two seasons (hot and cooD, with two anchor
schemes (anchored and unanchored), and with two patch area preparation
techniques (outline sawing and unsawed). Mix design studies were
conducted to develop mixture proportions for the three patch materials
with local coarse and fine aggregate. A series of tests with Simulated
patches were also conducted to optimize ancnor design.
(1) Commercially available patching material marketed by Thoro Systems
Products.
2
MIX DESIGN STUDIES
Design studies w~re conducted to select ingredient proportions for a
rapid setting pee mixture and a rapid-setting pee mixture with steel
fi bers. Manufacturer recommendations were f 0 11 owed for a Roadpatch 11(1)
mixture. The goals of the mix design process were proportions that would
provide adequate strength for construction within an eight-hour workday
while maintaining reasonable cement content (shrinkage controD,
accelerator content (manufacturer recommendations), mixability (in small
portable mixers), workability and finishability.
A laboratory study (2), predecessor to this study, indicated that six
hour compressi ve strength of 2000 psi and greater were possi b 1 e wi th
Roadpatch mixes and pee mixes containing Type III cement and 2% calcium
ch 1 ori de accelerator. These mi xtures had cement contents that were
somewhat hi gher than desi rab 1 e for shri nkage and slumps that were 1 ess
than desirable for mixing in small portable mixers and placing and
finishing by hand. Therefore mixabillty, workability, and finishability·
were prime considerations in mix evaluation criteria. Six hour
compressive strength of approximately 2000 psi was still considered a
desi rab 1 e, although not a contro 11 i ng, target.
Subsequent field patch construction revealed that a four-hour cure
was a more reasonable minimum cure time and that six hours was a
maximum that could be expected in an eight-hour work day. The field
studi es a1 so reveal ed that strengths achi eved wi th 1 ess than si x hours
curing were, with few exceptions, sufficient to prevent ravelling,
abrasion, deformation, and cracking when initially opened to traffic. This
implies that 6 hour 2000 psi compressive strength should not be
consi dered as mi ni mum strength cri teri a. No clues were found poi nt i ng to
3
exactly what the minimum strength criteria should be, but the strengths
achieved appeared adequate.
Materials
Local coarse and fine aggregates were used for mixes in Gadsden and
Montgomery. The coarse aggregate was pea gravel size (3/4" maximum
size -- #78 AHD designation) crushed limestone in Gadsden and river
gravel in Montgomery. This size coarse aggregate produced a fine mix
needed for patching spalled areas with limited depth. This size is also
consi stent wi th recommendations for Roadpatch II and wi th what has
generally been used for steel fibrous concrete (3). Fine aggregate was
natura 1 concrete sand (# 1 00 AHD desi gnat i on) at both 1 ocat] ons.
Type III cement with a "nonchloride" accelerator (ASTM C494, Type C)
was used to increase rate of strength gain. The particular brand
accelerator used was Master Builders, Inc., Pozzolith 555 Accelerator.
Dosage rates were maintained within manufacturer recommended ranges.
No air entraining admixture was used and resulting air contents averaged
about 3%. Steel fibers 3/4" long with 0.01" x 0.022" cross section from
Mitchell Fibercon, Inc. were used in the rapid-setting fibrous mix.
Roadpatch 1\(1) ingredients include a cement-sand grout mixture, 3/8"
long 0.01" diameter steel fibers and an acrylic polymer type latex (Acryl
60) modifer. To these ingredients were added coarse aggregate and water
to produce a rapid-setting patching mixture.
Hi xture Proport i ons-- Rapt d-Set t i ng pee
Results from mix design tests for rapid-setting pec, using Gadsden
4
aggregate, are shown in Table 1. Compressive strength specimens, 4inch
diameter and 8 inch long, were made according to AASHTO T 126 and tested
according to AASHTO T22. Four inch diameter specimens were used to
reduce material requirements. They were cured in their molds by covering
with polyethylene in the laboratory at approximately 70 0 ambient air
temperature. Oi sposab 1 e molds were removed immediately pri or to
testing.
Mixes A 7, A8, and A9 produced reasonable 6-hour strength values
with good workability and finishability. Based on these results the
following proportions for a 1-ft3 batch were used for the warm weather
placements:
~ Warm Weather Gadsden Rapid Setting PCC (1-ft3)
Cement - 33 1 b.
Water - 16 lb.
Coarse' Aggregate
Fi ne Aggregate
Acce 1 erator
- 61 lb.
- 40 lb.
- 5 oz (15 oz/l 00 lb. cement)
For cool weather placements, mix proportions were modified to
compensate for the slower rate of hydration and reduced evaporation rate.
The amount of water was decreased and the accelerator dosage rate was
increased to maximum manufacturer recommendations. The following
proport ions were used:
Cool Weather Gadsden Rapid-Setting PCC (1 ft3)
Cement - 33 1 b
Water - 151b
Coarse Aggregate
Fi ne Aggregate
Accel erator
5
- 61 lb
- 40 lb
- 6.5 oz (20 oz/l 00 1 b cement)
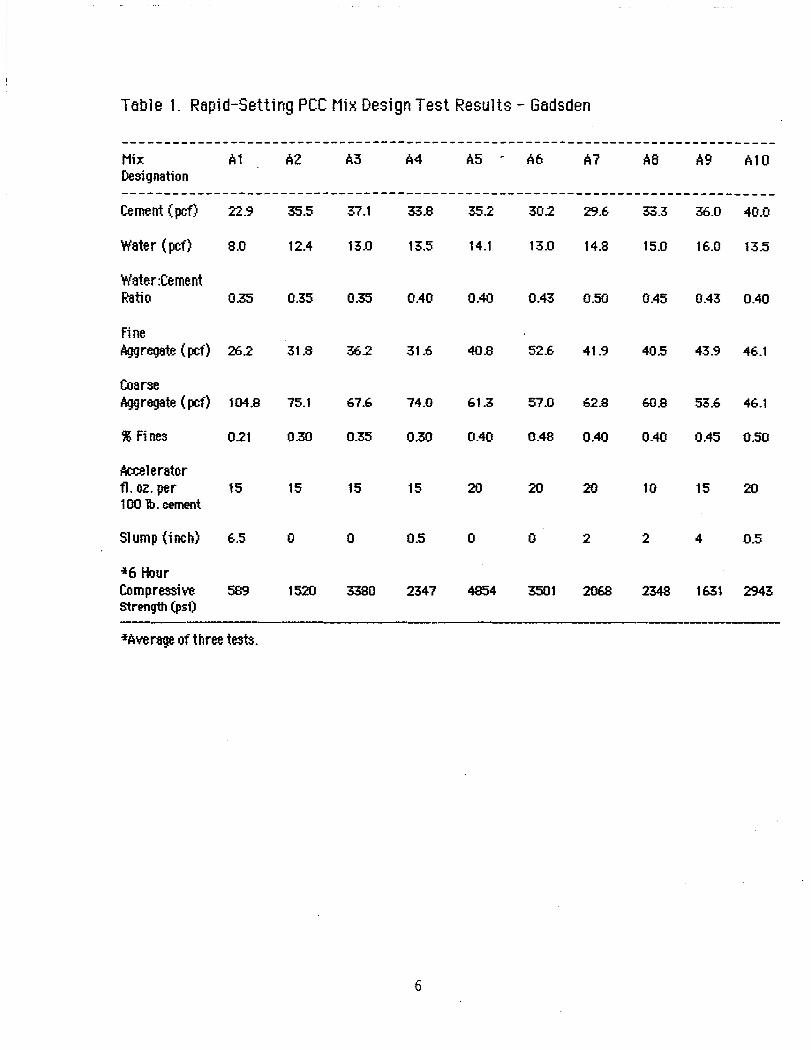
Table 1. Rapid-Setting PCC Mix Design Test Results - Gadsden
------------------------------------------------------------------------------Hix A1 A2 A3 A4 AS ~ A6 A7 A8 A9 A10 Designation ------------------------------------------------------------------------------Cement (pet) 22.9 35.5 37.1 33.8 352 302 29.6 33.3 36.0 40.0
Water (pet) 8.0 12.4 13.0 13.5 14.1 13.0 14.8 15.0 16.0 13.5
Water:Cement Ratio 0.35 0.35 0.35 0.40 0.40 0.43 0.50 0.45 0.43 0.40
fine Aggregate (pef) 262 31.8 36.2 31.6 40.8 52.6 41.9 40.5 43.9 46.1
Coarse Aggregate (pef) 104.8 75.1 67.6 74.0 61.3 57.0 62.8 60.8 53.6 46.1
% fines 021 0.30 0.35 0.30 0.40 0.48 0.40 0.40 0.45 0.50
Accelerator fl. oz. per 15 15 15 15 20 20 20 10 15 20 100 lb. cement
Sl ump (i nch) 6.5 0 0 0.5 0 0 2 2 4 0.5
'*6 Hour Compressive 589 1520 3380 2347 4854 3501 2068 2348 1631 2943 Strength (PSi)
----------------------------'*Average of three tests.
6
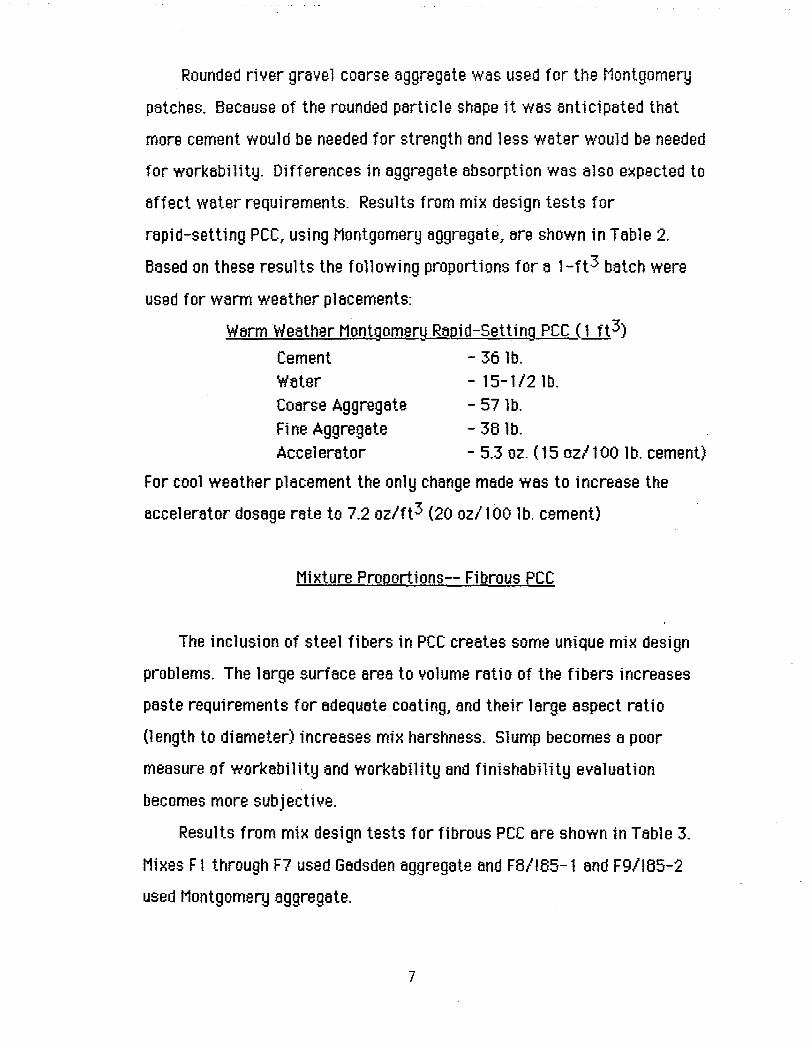
Rounded ri ver gravel coarse aggregate was used for the Montgomery
patches. Because of the rounded particle shape it was anticipated that
more cement would be needed for strength and less water would be needed
for workability. Differences in aggregate absorption was also expected to
affect water requirements. Results from mix design tests for
rapid-setting PCC, using Montgomery aggregate, are shown in Table 2.
Based on these results the following proportions for a l-ft3 batch were
used for warm weather placements:
Warm Weather Montgomery Rapid-Setting PCC (1113)
Cement - 36 lb.
Water - 15-1/2 lb.
Coarse Aggregate - 57 lb.
Fi ne Aggregate - 38 lb.
Acee 1 erator - 5.3 oz. (15 oz/1 00 I b. cement)
For cool weather placement the only change made was to increase the
accelerator dosage rate to 7.2 oz/ft3 (20 oz/l 00 lb. cement)
Mixture Proportions-- Fibrous PCC
The inclusion of steel fibers in PCC creates some unique mix design
problems. The large surface area to volume ratio of the fibers increases
paste requirements for adequate coating, and their large aspect ratio
(length to diameter) increases mix harshness. Slump becomes a poor
measure of workability and workability and finishability evaluation
becomes more subjective.
Results from mix design tests for fibrous PCC are shown in Table 3.
Mixes F 1 through F7 used Gadsden aggregate and F8/185-1 and F9/185-2
used Montgomery aggregate.
7
Table 2. Rapid-Setting PCC Mix Design Test Results - Montgomery
------------------------------------------------------------Mix B1 B2 B3 B4 B5 B6 Designation ------------------------------------------------------------Cement (pet) 33.0 34.4 36.0 38.8 36.0 36.0
Water (pef) 14.8 15.5 15.5 15.5 15.5 15.5
Water:Cement Ratio 0.45 0.45 0.43 0.40 0.43 0.43
fine Aggregate (pet) 39.7 38.5 38.0 37.0 47.4 56.9
Coarse Aggregate (pef) 59.5 57.7 57.0 55.6 47.4 37.9
% Fines 0.40 0.40 0.40 0.40 0.50 0.60
Accelerator fl. oz. per 15 20 15 15 15 15 100 lb. cement
Sl ump (i nch) 0.5 3 3 3
~6 Hour Compressive 1353 1751 2069 1154 1074 875 strength (psi) -------*Average of three tests.
8
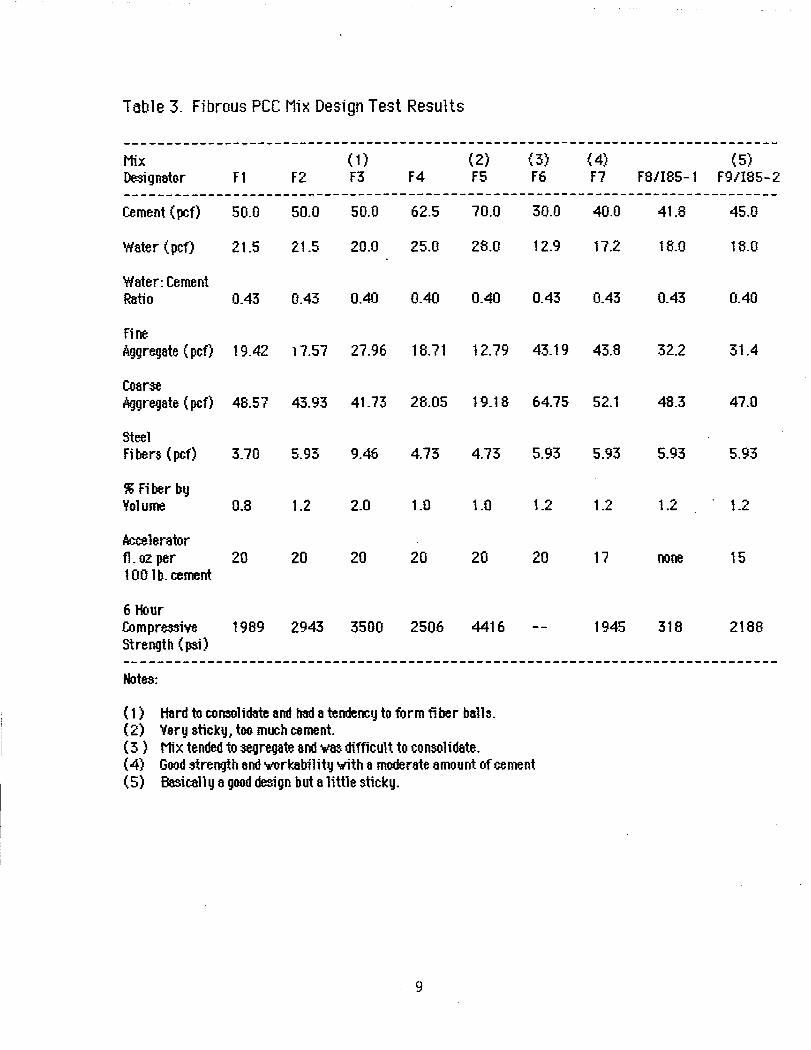
Table 3. Fibrous PCC Mix Design Test Results
------------------------------------------------------------------------------Mix (0 (2) (3) (4) (5) Designator Fl F2 F3 F4 F5 F6 F7 F81I85-1 F91I85-2 ------------------------------------------------------------------------------Cement (pet) 50.0 50.0 50.0 62.5 70.0 30.0 40.0 41.8 45.0
Water (pet) 21.5 21.5 20.0 25.0 28.0 12.9 17.2 18.0 18.0
Water: Cement Ratio OA3 OA3 OAO OAO OAO OA3 OA3 OA3 OAO
fine Aggregate (pet) 19A2 i 7.57 27.96 18.71 12.79 43.19 43.8 32.2 31.4
Coarse Aggregate (pet) 48.57 43.93 41.73 28.05 19.18 64.75 52.1 48.3 47.0
Steel fi bers (pcf) 3.70 5.93 9A6 4.73 4.73 5.93 5.93 5.93 5.93
% Fiber by Volume 0.8 1.2 2.0 1.0 1.0 1.2 1.2 1.2 1.2
Accelerator fl. 02 per 20 20 20 20 20 20 17 none 15 100 1 b. cement
6 Hour Compressive 1989 2943 3500 2506 4416 1945 318 2188 Strength (psi) ------------------------------------------------------------------------------Notes:
(1) Hard to consolidate and had a tendency to form fi ber balls. (2) Very sticky} too much cement. (3 ) Mix tended to segregate and 'w'8S difficult to consolidate. (4) Good strength and 'Workability with a moderate amount of cement (5) Basicall y a good design but a little sticky.
9
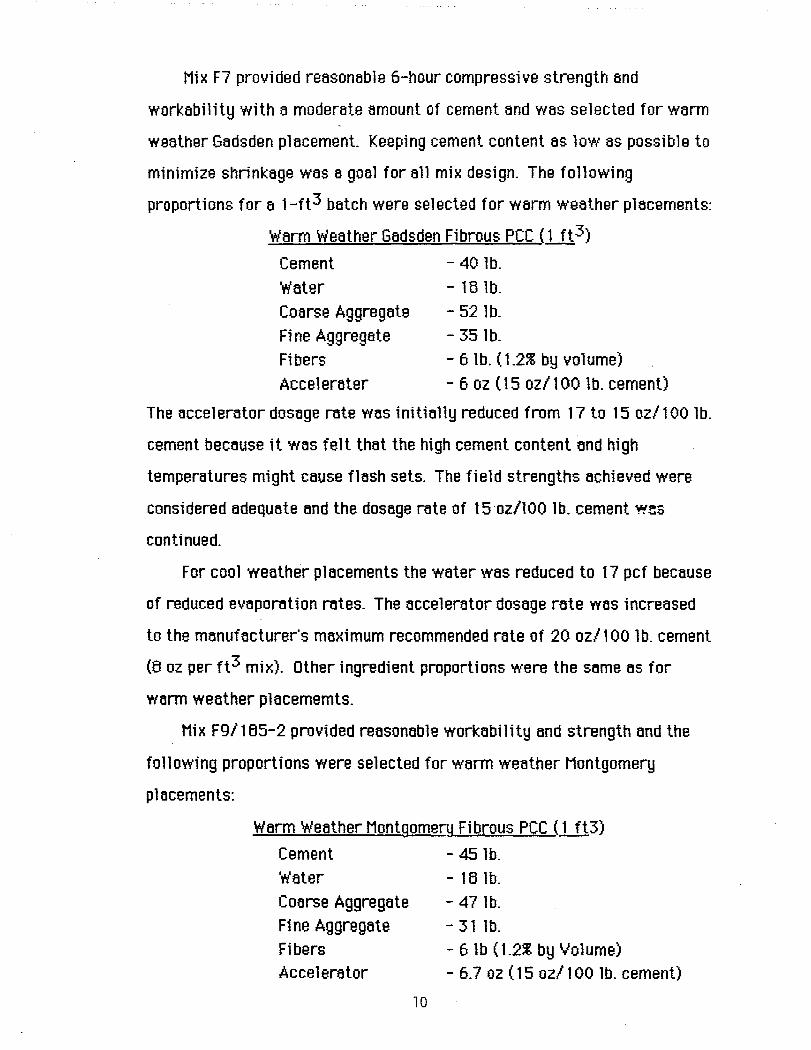
Mix F7 provided reasonable 6-hour compressive strength and
workability with a moderate amount of cement and was selected for warm
weather Gadsden placement. Keeping cement content as low as possible to
minimize shrinkage was a goal for all mix design. The following
proportions for a 1-ft3 batch were selected for warm weather placements:
Warm Weather Gadsden Fibrous pee (1 ft3)
Cement - 40 1 b.
Water - 18 lb.
Coarse Aggregate
Fi ne Aggregate
Fibers
Accelerater
- 52 lb.
- 35 lb. - 6 lb. (1.2% by volume)
- 6 oz (15 oz/l 00 lb. cement)
The accelerator dosage rate was initially reduced from 17 to 15 oz/l 00 lb.
cement because it was felt that the high cement content and high
temperatures might cause flash sets. The field strengths achieved were
considered adequate and the dosage rate of 150z/100 lb. cement was
continued.
For cool weather placements the water was reduced to 17 pcf because
of reduced evaporation rates. The accelerator dosage rate was increased
to the manufacturer's maximum recommended rate of 20 oz/l 00 lb. cement
(6 oz per ft3 mix). Other ingredient proportions were the some as for
warm weather placememts.
Mix F9/185-2 provided reasonable workability and strength and the
following proportions were selected for warm weather Montgomery
placements:
Warm Weather Montgome[Y Fibrous pec ( 1 ft3)
Cement - 45 1 b.
Water - 18 lb.
Coarse Aggregate - 47 lb. Fl ne Aggregate - 3 1 lb. Fibers - 6 1b (1.2% by Volume) Acce 1 en~tor - 6.7 oz (15 oz/l 00 lb. cement)
10
For cool weather placements in Montgomery the only change that was made
was to increase the accelerator dosage rate to 20 oz/l 00 lb. cement (8.8
oz/ft3 mix).
Mixture Proportions-- Road Patch
Roadpatch is provi ded prepackaged in uni ts that produce
approximately 1/2 ft3 of mix when coarse aggregate is added. Each
prepackaged unit contains 50 lb. of cement/fine aggregate mixture and 2
lb. of steel fibers. To these was added 15lb. coarse aggregate as per
recommendat ions f or patches 1 n thi ck or greater. Latex is added wi th
mixing water. Recommended mixing fluid consists of 1 part Acry 60 and 2
parts water.
The Roadpatch mixture was very sensitive to mixing fluid content:
going from -too dry" to -too wet" with the addition of very little mixing
fluid. Therefore, the water was added carefully for each batch and the
following mix proportions reflect a range of mixing fluid:
Roadpatch (Prepackaged Uni n Cement & Fine Aggregate - 50 lb.
Coarse Aggregate - 15 1 b. Fibers - 2 lb.
Water - 9-1/2 to 10-1/2 lb.
Aery 60 - 4-3/4 to 5-1/4 lb.
The above were used in Gadsden and Montgomery for both warm and cool
weather placements. Larger mixing fluid contents were required during
warm weather.
11
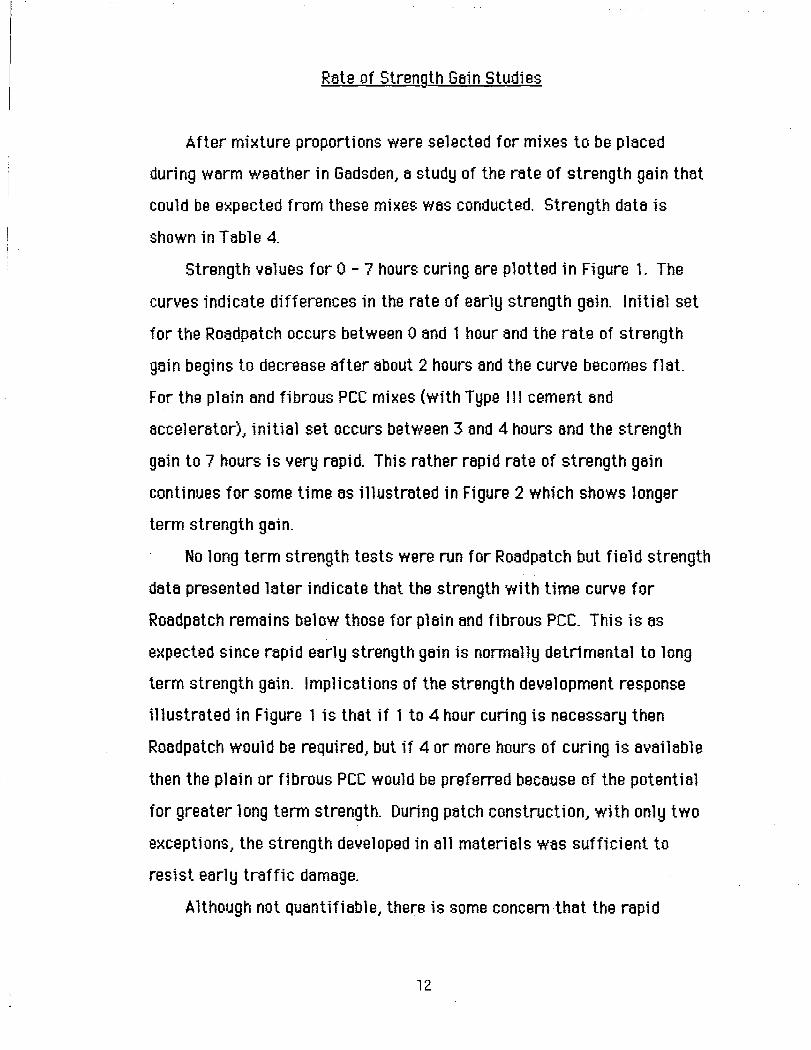
Rate of Strength Gai n Studi es
After mixture proportions were selected for mixes to be placed
during warm weather in Gadsden, a study of the rate of strength gain that
could be expected from these mixes was conducted. Strength data is
shown in Table 4.
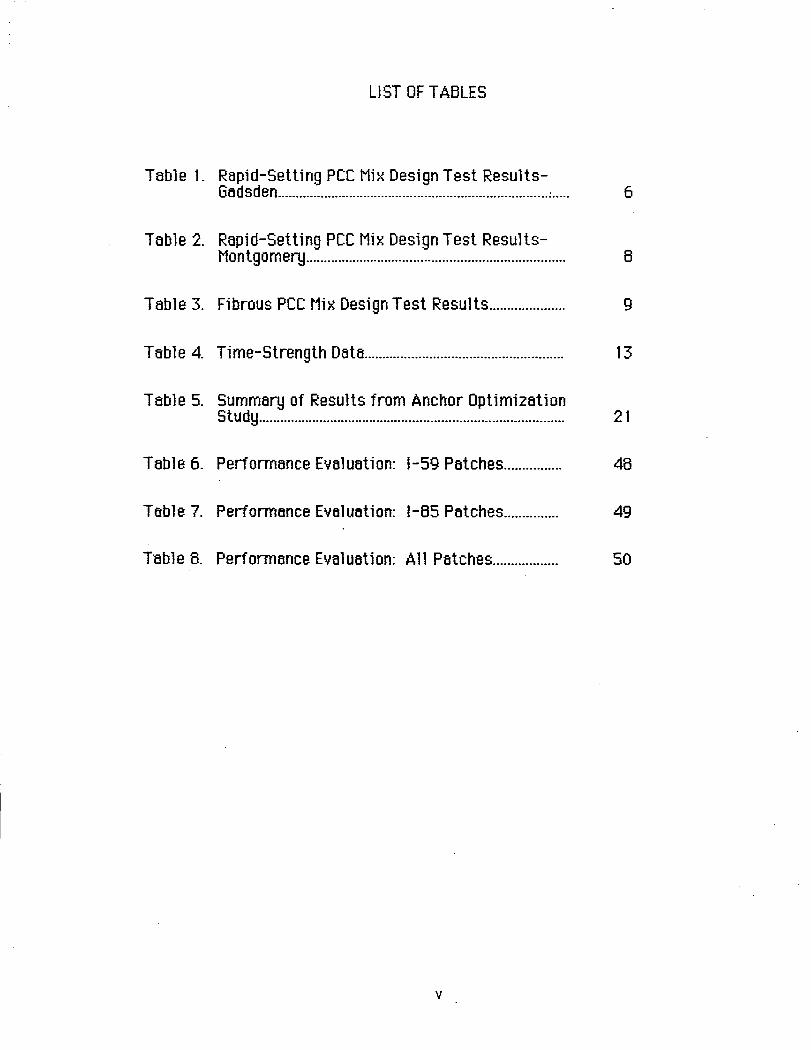
Strength values for 0 - 7 hours curing are plotted in Figure 1. The
curves indicate differences in the rate of early strength gain. Initial set
for the Roadpatch occurs between 0 and 1 hour and the rate of strength
gai n begi ns to decrease after about 2 hours and the curve becomes flat.
For the plain and fibrous pee mixes (with Type II J cement and
acce 1 erator) I i ni t i a1 set occurs bet ween 3 and 4 hours and the strength
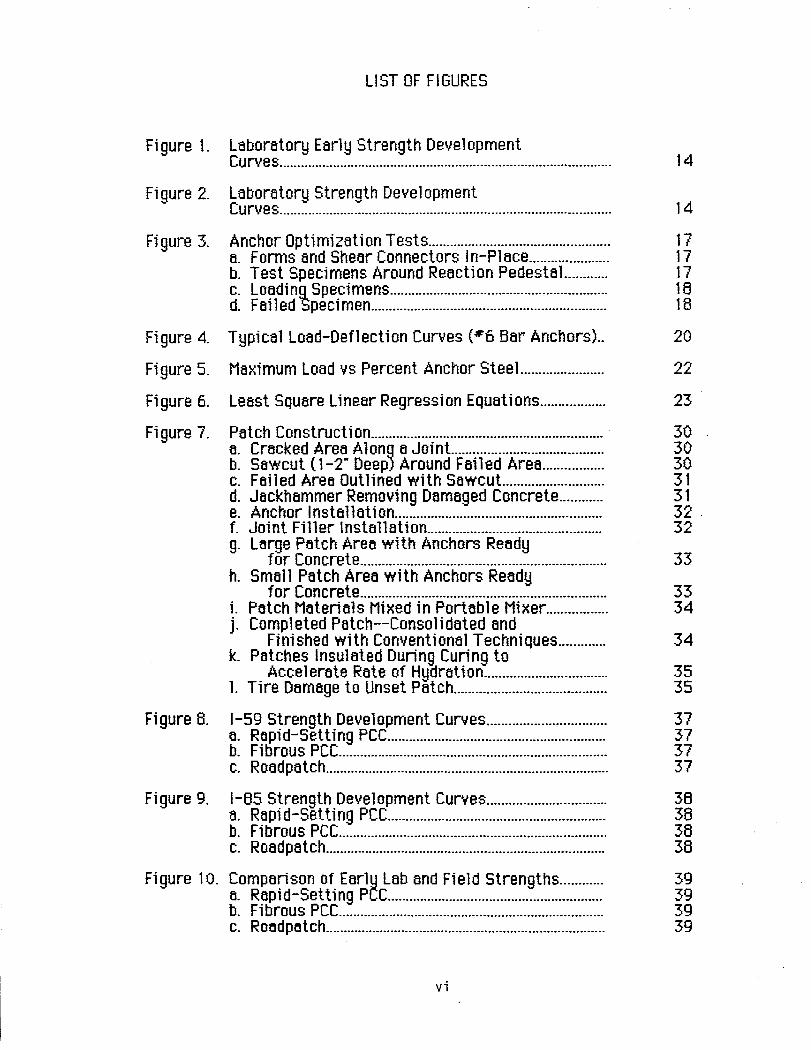
gai n to 7 hours is very rapi d. Thi s rather rapi d rate of strength gai n
continues for some time as illustrated in Figure 2 which shows longer
term strength gai n.
No long term strength tests were run for Roadpatch but field strength
data presented later indicate that the strength with time curve for
Roadpatch remai ns below those for p lai nand fi brous pee. Thi sis as
expected since rapid early strength gain is normally detrimental to long
term strength gain. Implications of the strength development response
illustrated in Figure 1 is that if 1 to 4 hour curing is necessary then
Roadpatch would be required, but if 4 or more hours of curing is available
then the plain or fibrous pee would be preferred because of the potential
for greater long term strength. During patch construction, with only two
exceptions, the strength developed in all materials was sufficient to
resist early traffic damage.
Although not Quantifiable, there is some concern that the rapid
12
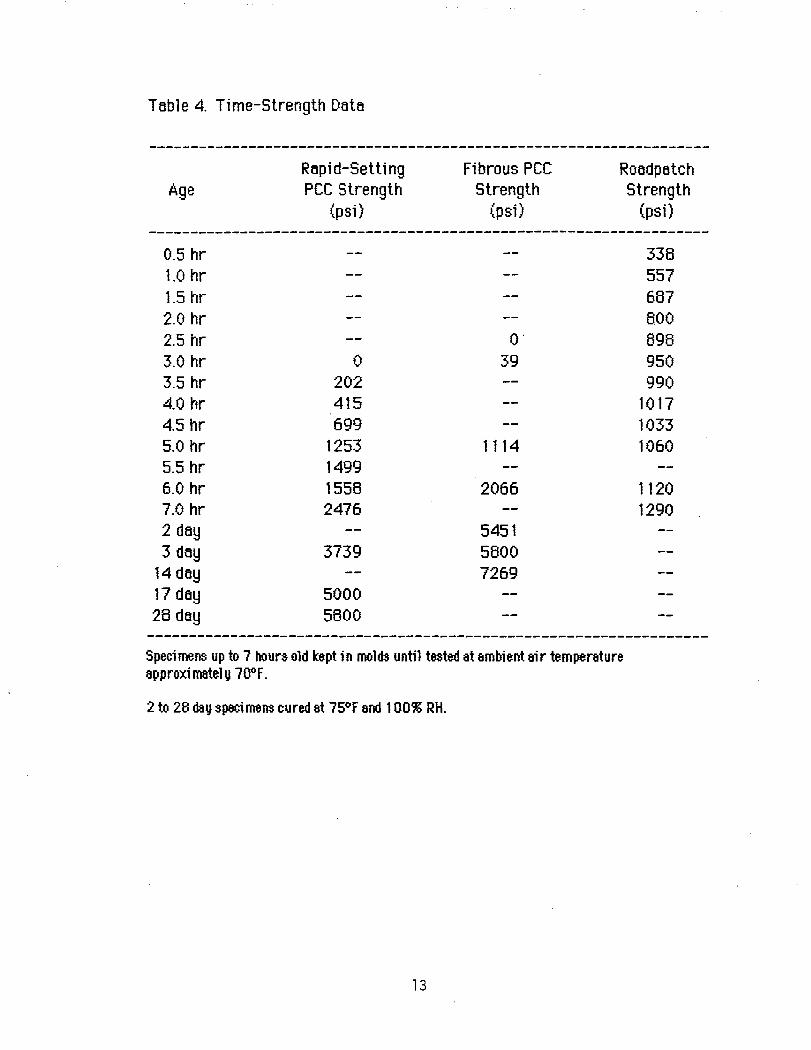
Table 4. Time-Strength Doto
Age
0.5 hr 1.0 hr 1.5 hr 2.0 hr 2.5 hr 3.0 hr 3.5 hr 4.0 hr 4.5 hr 5.0 hr 5.5 hr 6.0 hr 7.0 hr 2 day 3 day
14 doy 17 doy 28 doy
Rapi d-Set t i ng PCC Strength
(psi)
0 202 415 699
1253 1499 1558 2476
3739
5000 5800
Fibrous PCC Strength
(psi)
o· 39
1114
2066
5451 5800 7269
Roodpotch Strength
(psi)
338 557 687 800 898 950 990
1017 1033 1060
1120 1290
Speci mens up to 7 hours old kept in molds until tested at ambient ai r temperature approximately 700F.
2 to 28 day speci mens cured at 75°F and 1 00% RH.
13
2500
o ROADPATCH Vi e::: 2000 D FIBROUS PCC
:c I-
• RAPID-SETTING PCC (!) Z w 1500 a:: I-en W > 1000 1ii en w a:: CL :::E 500 0 u
00 2 4 5 6 7
CURING TIME (HRS)
Figure 1. Laboratory Early Strength Development Curves
8000
7000
/
......... /'
......... ;.0 /'
pP' __ ....-.-P
i= 5000 I -0-
6000
(!) --Z I ../' ~ ./
~ 4000 //
~ I? Vi I I ~ 3000 /
~ 1/ 5 If u 2000
I 1000 I
o 5
o FIBROUS PCC
oRAPID-SETTING PCC
10 15 20 25
CURING TIME IDA YS) 30
Figure 2. Laboratory Strength Develoment Curves
14
hydration and high heat generation of Roadpatch may accentuate shrinkage.
However, the inclusion of the short steel fibers and latex should diminish
this influence.
15
ANCHOR OPTIMIZATION STUDIES
The laboratory study (2) that preceded this study provided some
indication that anchors might improve the resistance of patches to loads.
The primary benefit appeared to be the ability to sustain load after bond
between old and new concrete was broken. This capacity would
theoretically keep a patch in-place after bond is lost. A second benefit
suggested, but not conclusively verified in the earlier study was that bond
strength was enhanced by anchors. Anchor stiffness appeared to be the
key. Bond failure occurs at very low relative movement and anchors must
be able to pick up portions of applied load at low deflections in order to be
effective. However, determination of when bond failure occurs makes
Quantification of this improvement difficult.
A series of tests were conducted to extend the earlier study, and to
develop rUdimentary data that could be used to select the amount, size and
type anchor steel for inclusion in field patches. Blocks of concrete
(18" x 6-1/2" x 5-1/2") with various anchor configurations, were cast on
the surface of an old concrete pavement slab and loaded horizontally as
described in reference 2. Reinforcing bars (#3, #4, and #6) bent into a "U"
shaDe and shear connectors (1/2" and 3/4" di ametert as used in composite
design, were used as anchors. Holes were drilled in the pavement slab and
anchors attached with quick-setting polyester grout. The surface of the
pavement slab was cleaned and lightly scarified prior to placing concrete.
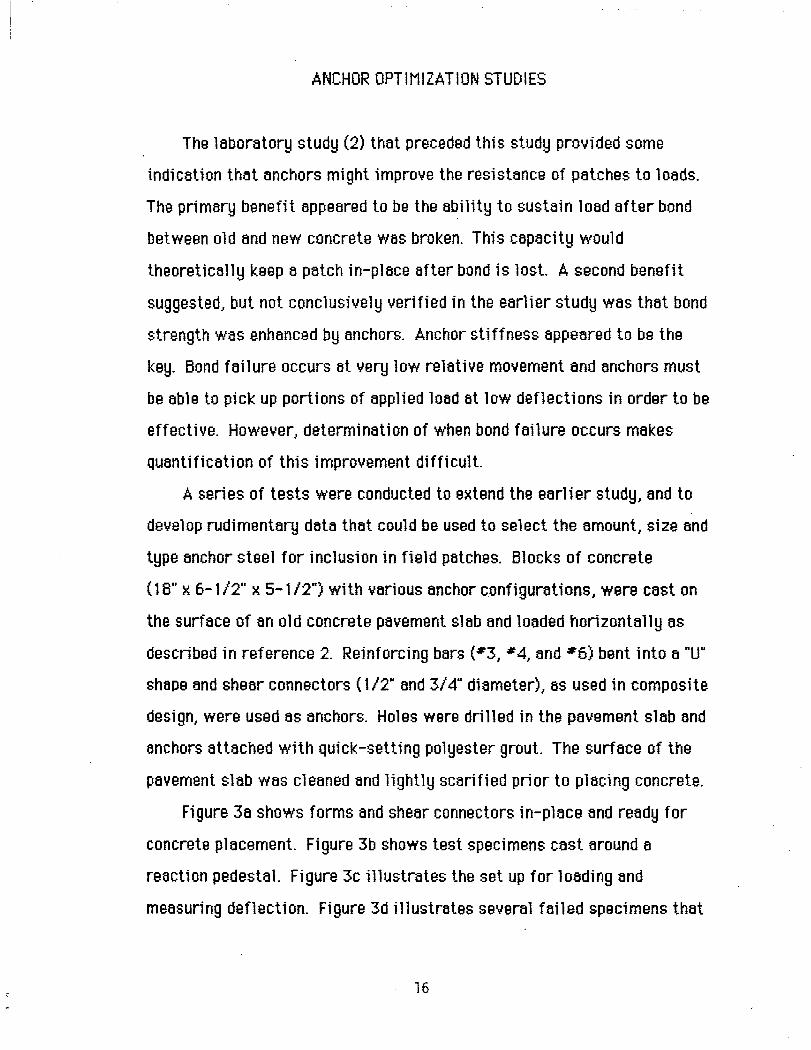
Figure 3a shows forms and shear connectors in-place and ready for
concrete placement. Figure 3b shows test speCimens cast around a
reaction pedestal. Figure 3c illustrates the set up for loading and
measuring deflection. Figure 3d illustrates several failed specimens that
16
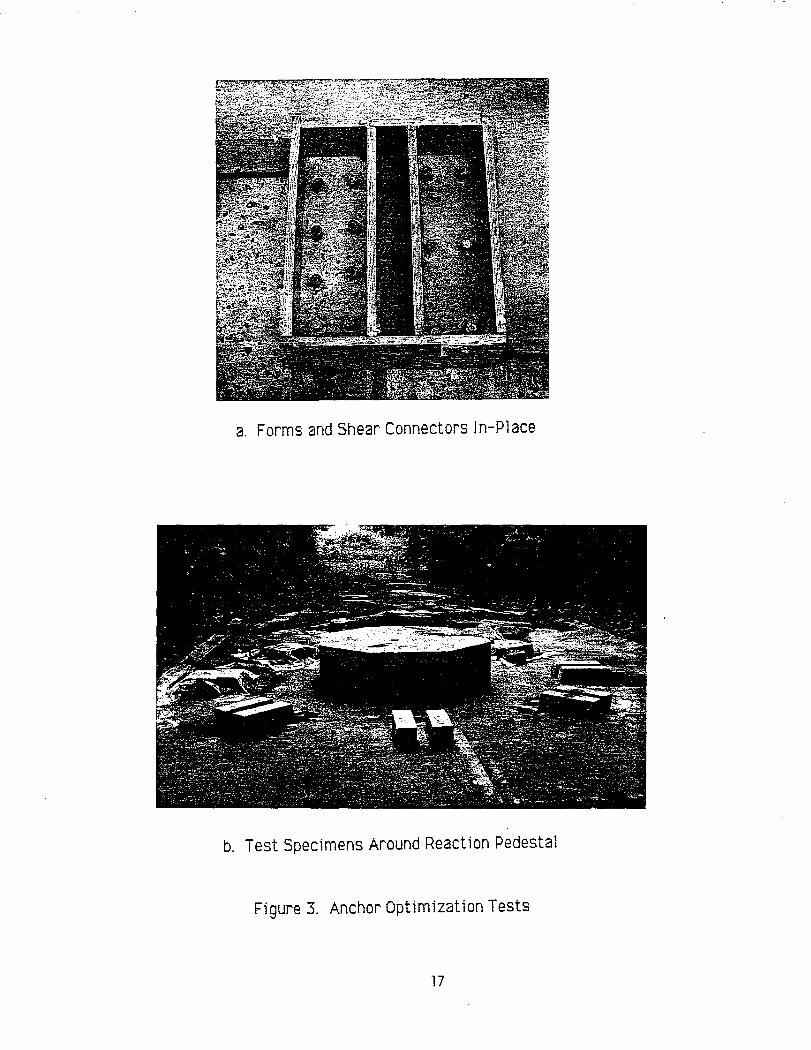
a. Forms and Shear Connectors In-Place
b. Test Specimens Around Reaction Pedestal
Figure 3. Anchor Optimization Tests
17
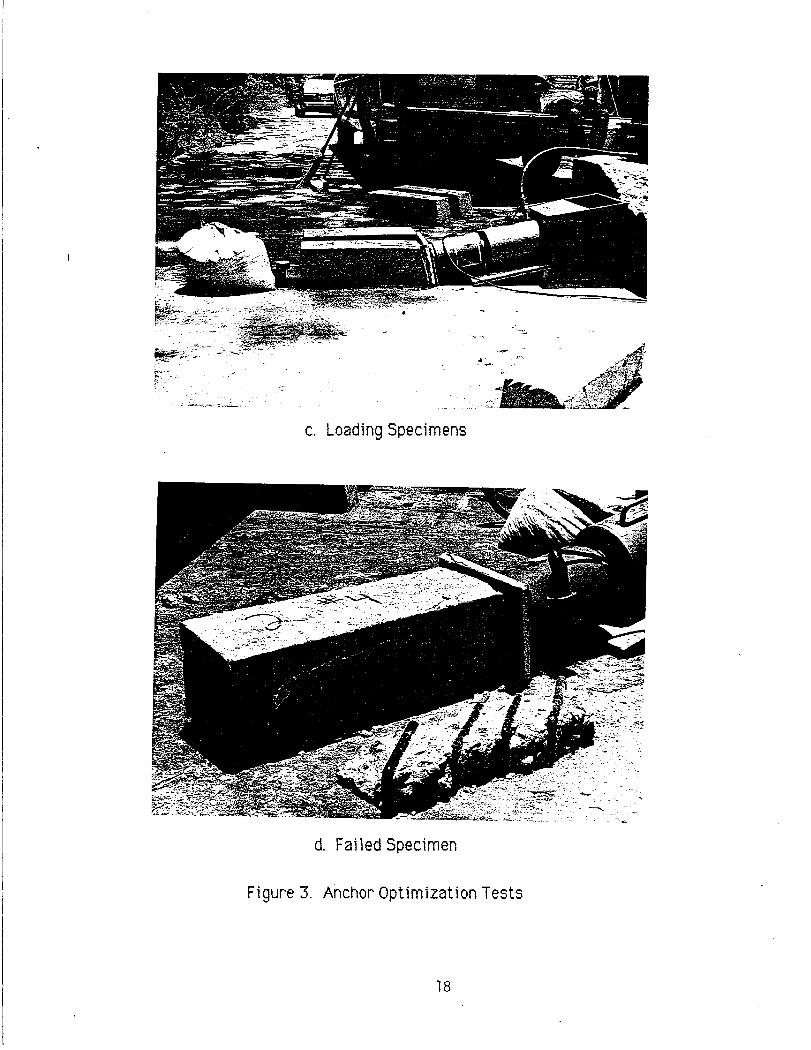
c. Loading Specimens
d. Failed Specimen
Figure 3. Anchor Optimization Tests
18
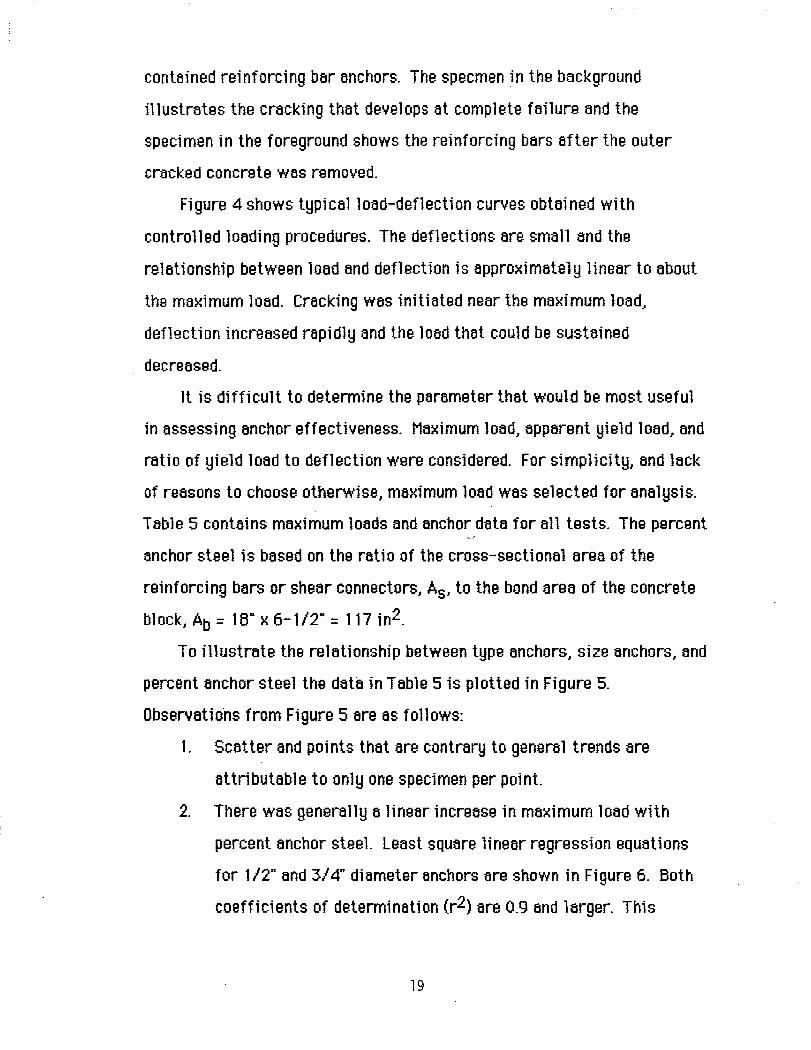
contained reinforcing bar anchors. The specmen in the background
illustrates the cracking that develops at complete failure and the
specimen in the foreground shows the reinforcing bars after the outer
cracked concrete was removed.
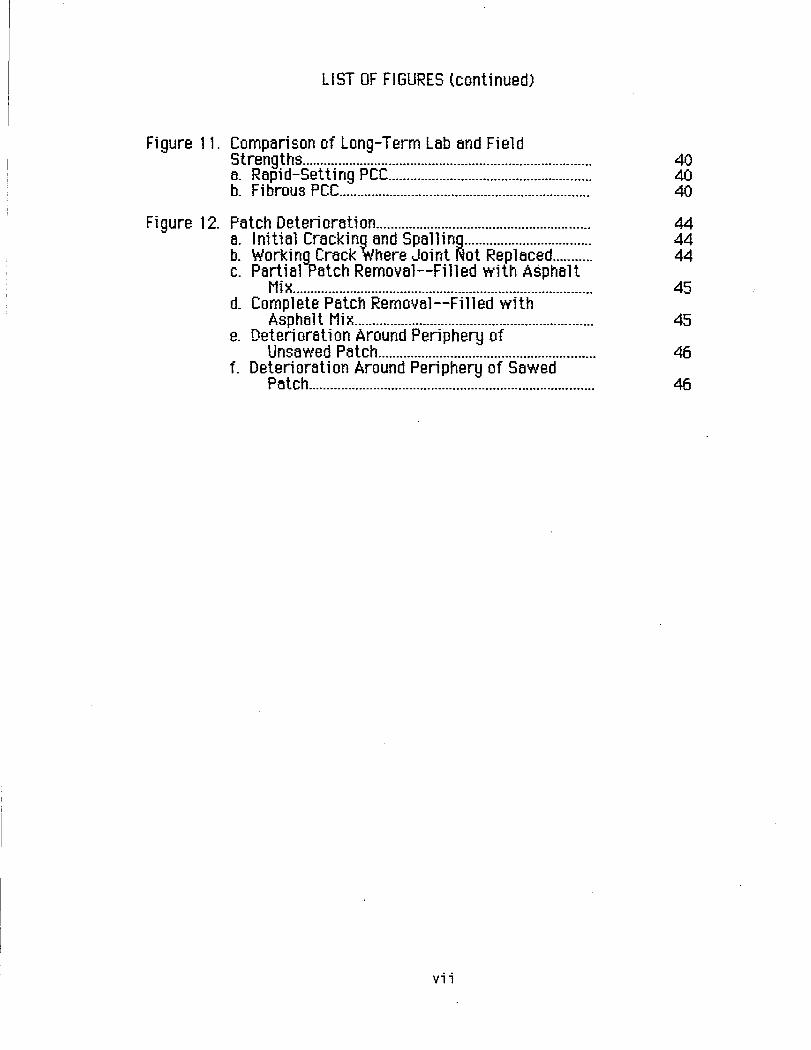
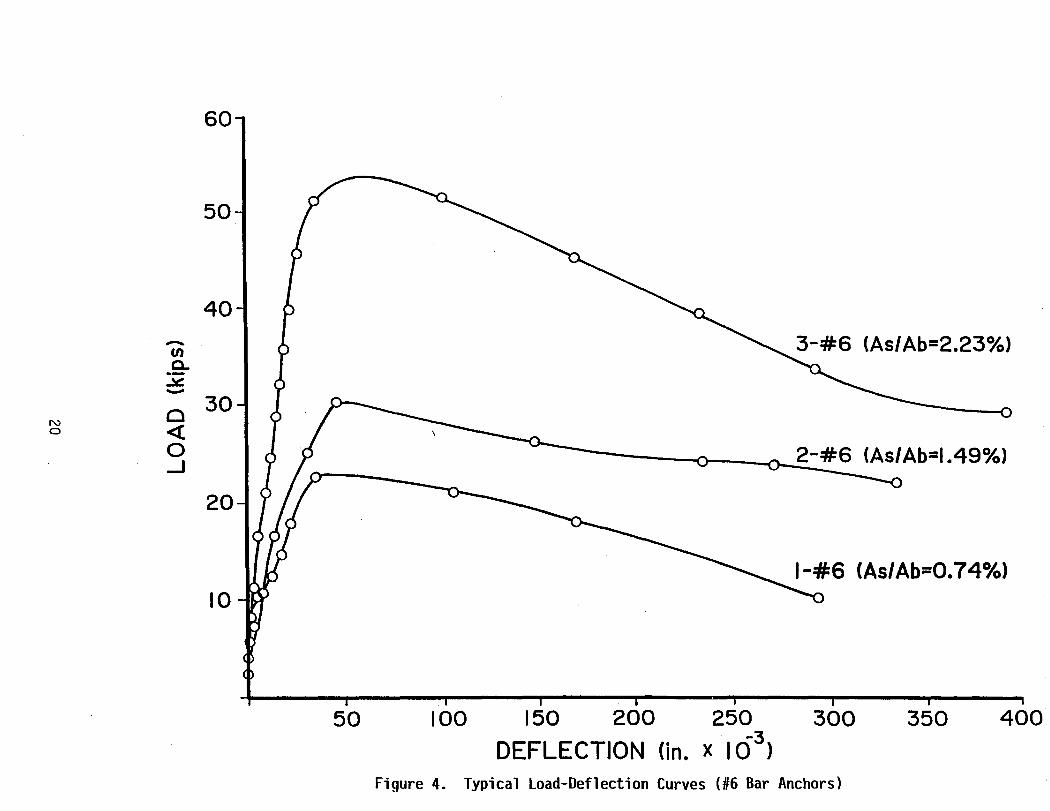
Figure 4 shows typica110ad-deflection curves obtained with
contro 11 ed 1 oadi ng procedures. The defl ect ions are small and the
relationship between load and deflection is approximately linear to about
the maximum load. Cracking was initiated near the maximum load,
deflection increased rapidly and the load that could be sustained
decreased.
It is difficult to determine the parameter that would be most useful
in assessing anchor effectiveness. Maximum load, apparent yield load, and
ratio of yield load to deflection were conSidered. For simplicity, and lack
of reasons to choose otherwise, maximum load was selected for analysis.
Table 5 contains maximum loads and anchor data for all tests. The percent -.-
anchor steel is based on the ratio of the cross-sectional area of the
reinforcing bars or shear connectors, As, to the bond area of the concrete
block, Ab = 18" x 6-1/2" = 117 in2.
To illustrate the relationship between type anchors, size anchors, and
percent anchor steel the data in Table 5 is plotted in Figure 5.
Observations from Figure 5 are as follows:
1. Scatter and points that are contrary to general trends are
attributable to only one specimen per point.
2. There was generally a linear increase in maximum load with
percent anchor stee1. Least square linear regression equations
for 1/2" and 3/4" diameter anchors are shown in Figure 6. Both.
coefficients of determination (r2) are 0.9 and larger. This
19
60
50
40
- I L -~ 3-#6 (As/Ab=2.23%) en a. ~ -
N o 30
a « 0 I 6 )' ~ 2-#6 (Asl Ab=I.49%) (). ...J
20
1-#6 (As/Ab=O.74%) 10
50 100 150 200 250 300 350 400
DEFLECTION (in. x 163)
Figure 4. Typical Load-Deflection Curves (#6 Bar Anchors)
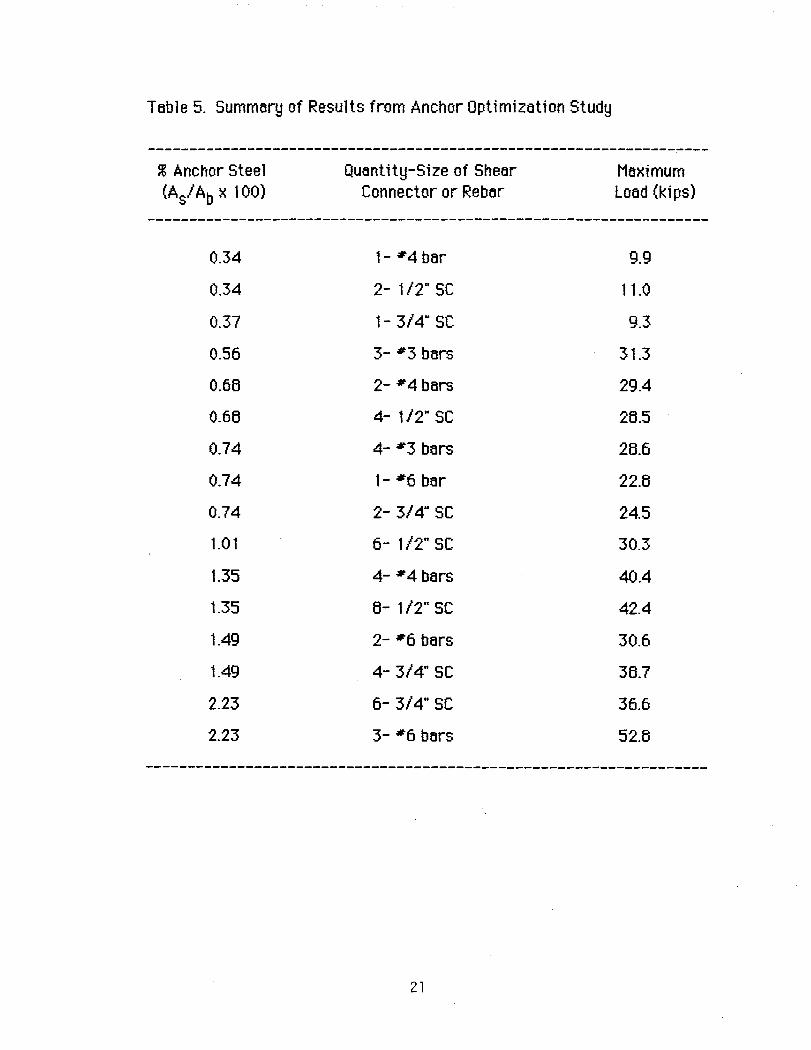
Table 5. Summary of Results from Anchor Optimization Study
% Anchor Steel (As/ Ab x 100)
0.34
0.34
0.37
0.56
0.68
0.68
0.74
0.74
0.74
1.01
1.35
1.35
1.49
1.49
2.23
2.23
Quantity-Size of Shear Connector or Rebar
1- #4 bar
2- 1/2" SC
1- 3/4" SC
3- #3 bars
2- #4 bars
4- 1/2" SC
4- #3 bars
1- #6 bar
2- 3/4" SC
6-1/2"SC
4- #4 bars
8-1/2"SC
2- #6 bars
4- 3/4" SC
6- 3/4" SC
3- #6 bars
21
Maximum Load (kips)
9.9
11.0
9.3
31.3
29.4
28.5
28.6
22.8
24.5
30.3
40.4
42.4
30.6
38.7
36.6
52.8

60
50 !
-U) CL 40 -~ - - --0 / « 0
30 ~ ..J ./
~ / ./
W/' /' ::> ~ Ir' - / x 20 « / ~
/ x #3 bars / 0#4 bars
/0 0/12" SC • #6 bars • 3/4" SC
o------~------------------~~----~ o 0.5 /.0 /.5 2.0 2.5
% ANCHOR STEEL (Asl Ab X 100) Figure 5. Maximum Load vs Percent Anchor Steel
22
60
so
-CJ)
9:: 40 ~ -
10
1/2" Dia. Anchors Load=4.05+28.44 (Asl Abxl 00)r2=0.90
o o
3/4" Dia. Anchors Load=S.03+21.03 (Asl Abxl 00) r2=0.93
o 1/2" Dia. Anchors
03/4" Dia. Anchors
O~----~------~----~------~----~ o O.S 1.0 I.S 2.0 2.5
% ANCHOR STEEL (Asl Abxl 00)
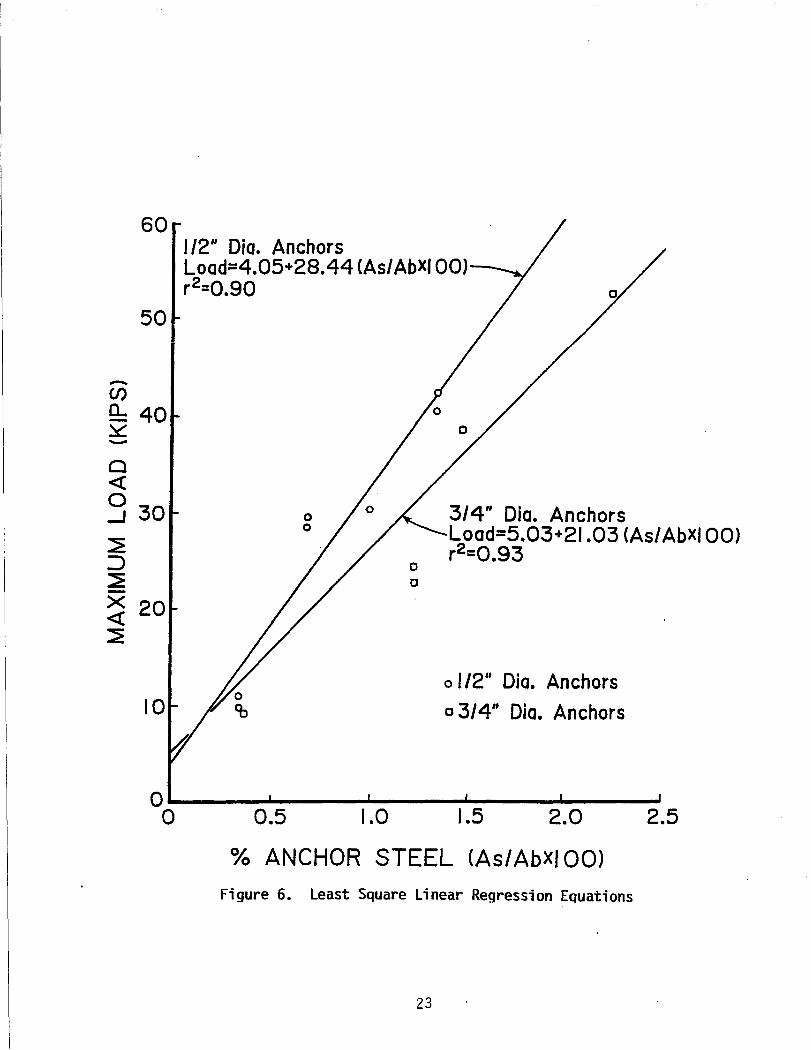
Figure 6. Least Square Linear Regression Equations
23
implies small unassociated variation and a reasonable linear
relationship between load and percent anchor steel.
3. One-half inch diameter shear connectors and reinforcing bars
were more efficient than 3/4" diameter. Two pOints for 3/8"
reinforcing bars strengthens this conclusion.
4. There was no discernible difference between the effectiveness
of reinforcing bars and shear connectors with the same diameter.
Based on these tests, anchors comprised of #4 reinforcing bars were
selected for use in field patches. A target of 0.5% anchor steel was
selected. However, as will be discussed in the following section,
construction considerations prevented achievement of this target. An
average 0.3% steel was placed in anchored patches.
24
PATCH CONSTRUCTION
Gadsden patches were constructed on the southbound lanes of I-59
between the US 431 and 1-759 intersections and on the southbound
entrance ramp from US 431. The pavement was jointed pee that had
required little previous patching. Deteriorated areas where concrete had
been broken out had been filled with asphalt mix. Twenty-one warm
weather patches were constructed on the entrance ramp and the inside
lane during August 6-11, 1986. Maximum daily air temperature ranged
from 90 to 96°F. Twenty-two cool weather patches were constructed on
the outside lane during December 4-18, 1986. Maximum daily air
temperature ranged from 50 - 60°F. Patch size ranged from 1 to 25 sf
plan area with an average of about 6-1/2 sf. The average depth after
shapi ng wi th a jack hammer was about 4 inches. Patches were
constructed by AHD Third Division, District Three maintenance personnel.
Montgomery patches were constructed on the southbound lanes of 1-85
between the Eastern Bypass and Perry Hill Road intersections. The
pavement was jointed pec that had undergone extensive rehabilitation;
including undersealing, side drain installation, slab replacement, patching,
grinding and jOint sealing; several years earlier. Twenty-five warm
weather patches were constructed on the inside lane during October 31,
1986 to November 10, 1986. Maximum daily air temperature ranged from
70 to 80° F. Fourteen cool weather patches were constructed on the
outside lane during February 11-20, 1987. Maximum daily air temperature
ranged from 50 to 65°F. Patch plan area size was smaller than the
Gadsden patches ranging from 1/2 to 15 sf with an average of about 4 sf.
The patch depth, however, was somewhat greater wi th some extendi ng
25
below the welded wire fabric at 5 inch depth. The average depth after
shaping with a jackhammer was 4 to 5 inches. Patches were constructed
by AHD Sixth Division, District Three maintenance personnel.
Construction Technigues
Patches were constructed by AHD district maintenance personnel
with available equipment. As with any maintenance operation, equipment
for traffic control and transportation was necessary. Specific items
required for patch construction included a concrete saw; air compressor,
and jackhammer; generator, impact drill and concrete vibrator; and a
portable concrete mixer.
The multiple photographs in Figure 7 illustrate the construction
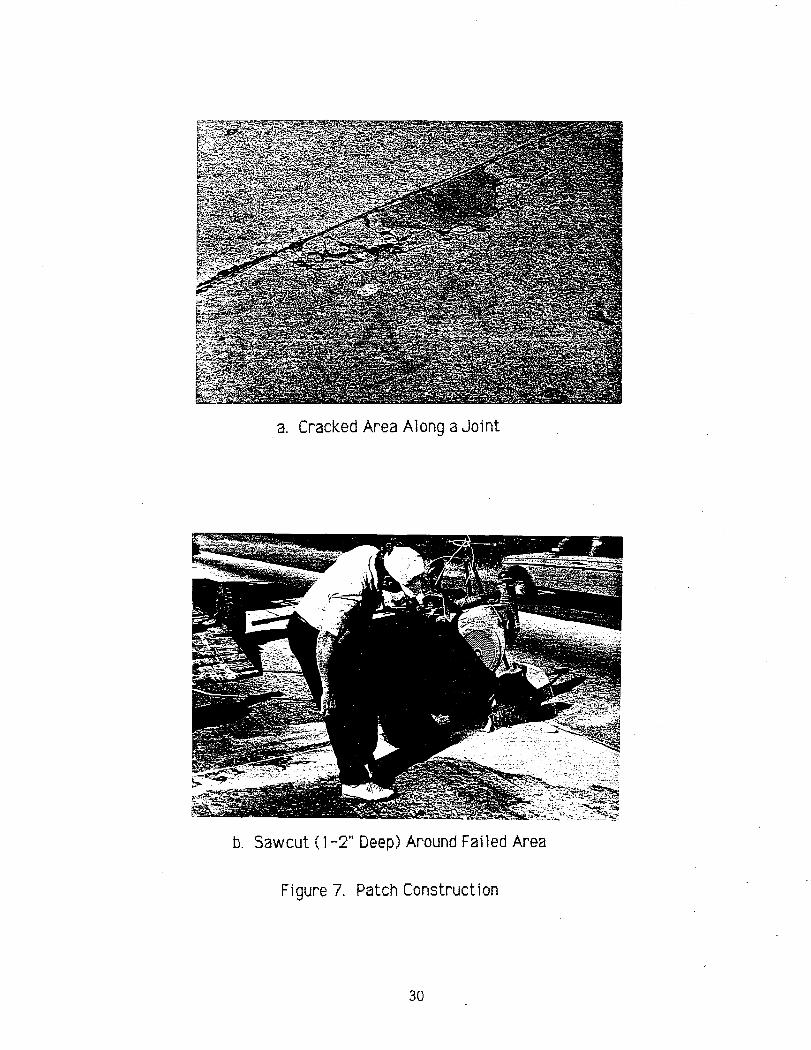
process. Figure 7a illustrates a typical cracked area along a transverse
contraction joint. As mentioned earlier, the deteriorated areas on I-59 in
Gadsden were larger than those on 1-85 in Montgomery. At both locations
deteri orated areas were adjacent to a transverse j oi nts. Some were along
the interior of transverse jOints, as shown in Figure 7a, while others were
at comers along the pavement edge or along longitudinal centerline
contraction jOints. In most cases the deterioration was only on one side
of a transverse joint, but occasionally was on both sides.
On I-59, the deterioration was concentrated on the upstream side of
transverse jOints, while on 1-85 it was more uniformly distributed on both
sides. On I-59, there were several deteriorated areas completely across a
lane. On 1-85, quite a few of the deteriorated areas were adjacent to
previously placed patches or replaced slabs. A few completely replaced
old deteriorated patches. Along 1-85 there were several locations where
26
relief expansion joints with full depth full width slabs on both sides had
been constructed to alleviate buckling problems. Deteriorated areas
associated with these were not patched.
Patch Area Preparation
The first step in the patch construction process was to identify the
area of deteriorated concrete to be removed. In a portion of the patches a
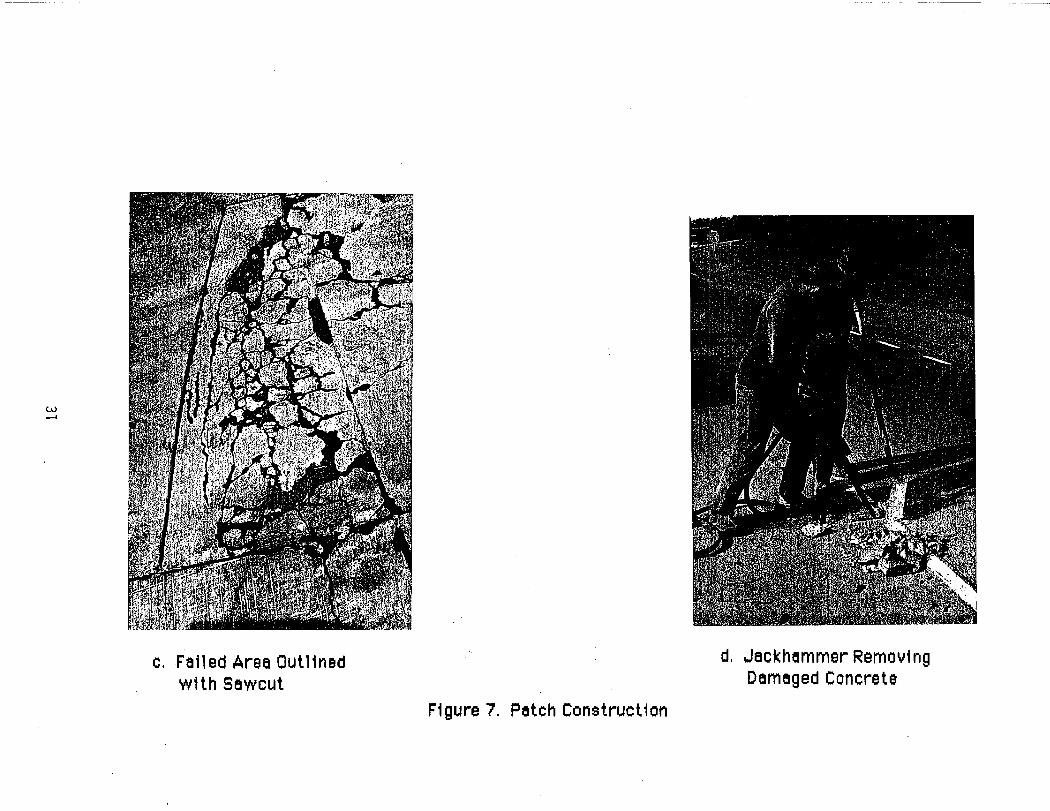
sawcut, 1-2" deep, was made around the area as illustrated in Figure 7b
and c. The sawcut made removal of the deteriorated concrete easier and
gave a more uniform edge patch depth. As will be discussed later, removal
of all damaged concrete is critical to patCh performance. Sawing seems to
increase the likelihood of complete removal.
The next step is the remova.l of damaged concrete with a jack hammer
as illustrated in Figure 7d. The size jackhammer should be kept as small
as possible to prevent cracking of the concrete around the patch area. A
30 1 b. maxi mum si ze is recommended.
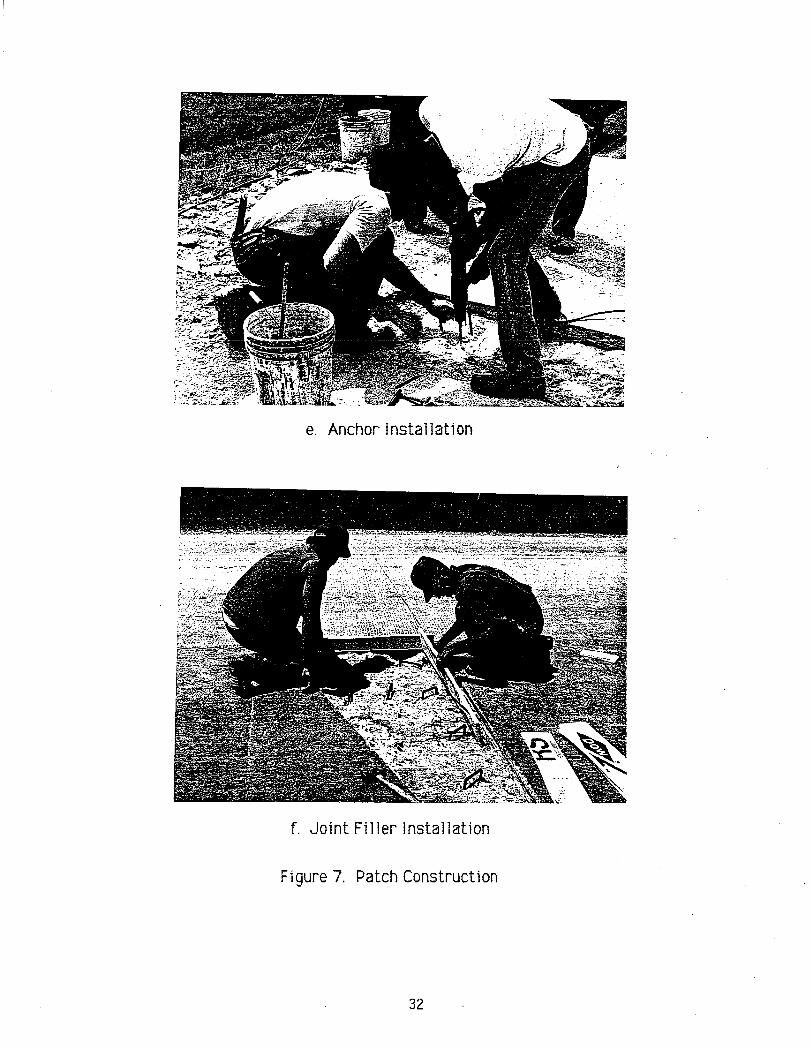
In part of the patches reinforcing bar anchors were installed as
shown in Figure 7e. Holes were drilled in the slab and the anchors fixed
with rapid-setting polyester grout. With the drills available, drilling
slowed the construction process considerably. A larger bar size to reduce
drilling was considered, but because of limited patch depth and cover
requirements, #4 bars were the largest practical size.
Expanded pOlystyrene inSUlation board, 3/4 in. thick, was shaped and
placed along joints as shown in Figure 7f. The soft polystyrene protects
the patch against expansion forces from adjacent slabs and provides a
reservoir for sealant. In several patches where deterioration was on both
sides of a joint no joint was formed in the patch; and, as expected, a crack
matching the joint formed.
27
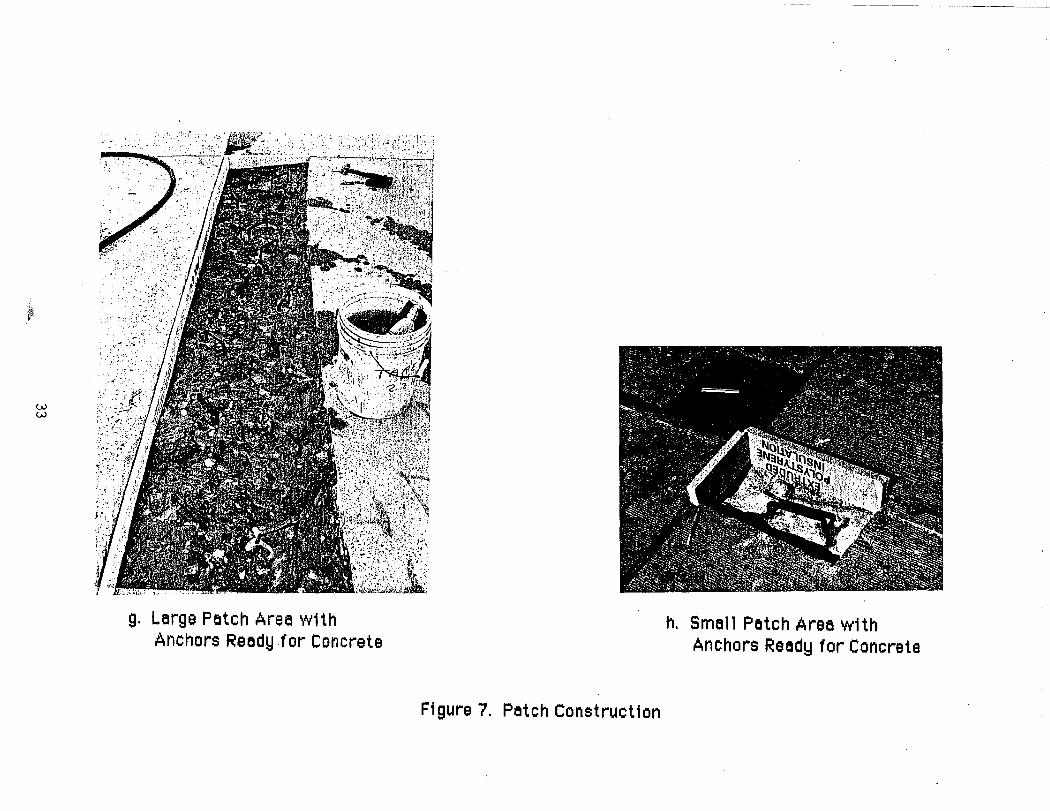
Figure 7g and h show a large (25 sf) full1ane width area on I-59 and a
small (1/2 sf) corner area on 1-85 ready for concrete placement. The
photographs illustrate the diversity in patches. Patch areas were blown
clean wi th compressed €Ii r to remove dust and the si des and bot tom
dampened prior to plaCing patch material to promote bond development.
Patch Material Production
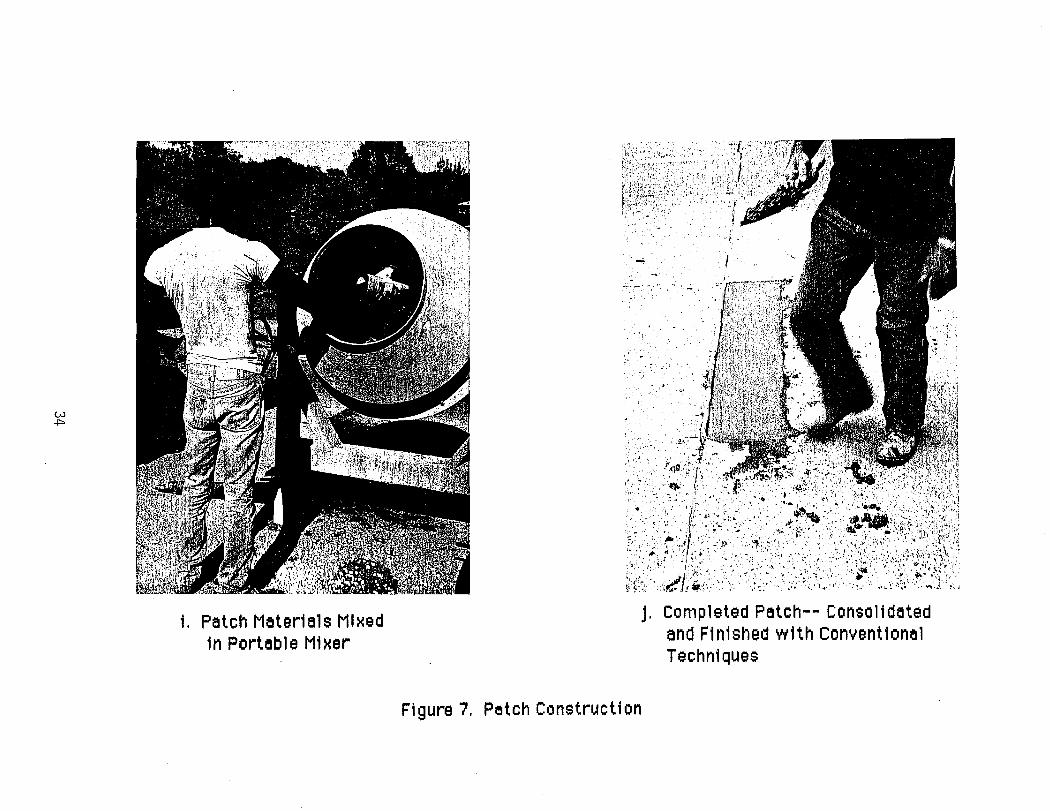
Portable concrete mixers as shown in Figure 7i were used to mix
patch materials. Construction time limitations will likely keep needed
daily volumes and rates of patch material so low that the use of ready mix
will be uneconomical. This will mean that even for routine patching
operations, where only one patch material is used, small portable mixers
will be most practical. Speci a1 care will be reQui red to insure uni form
Quality patch material. The key w1l1 be accurate proportions which can
only be achieved by weighing each ingredient. Water-cement ratio wlll
also be critical to rapid strength gain and the addition of extra water must
be carefully controlled.
Patch Materi al Placement
Figure 7j shows a completed patch. Conventional techniques for
consolidating and finishing the patches were used. None of the patch
materials required any speCial attention. Vibration of the patch material
is necessary to consolidate the material and to insure that all voids are
filled. Vibration also seems to enhance bond development. A small
internal type vibrator was used and appears adequate.
Patch Curing
Patches were initially wet cured by covering with wet burlap,
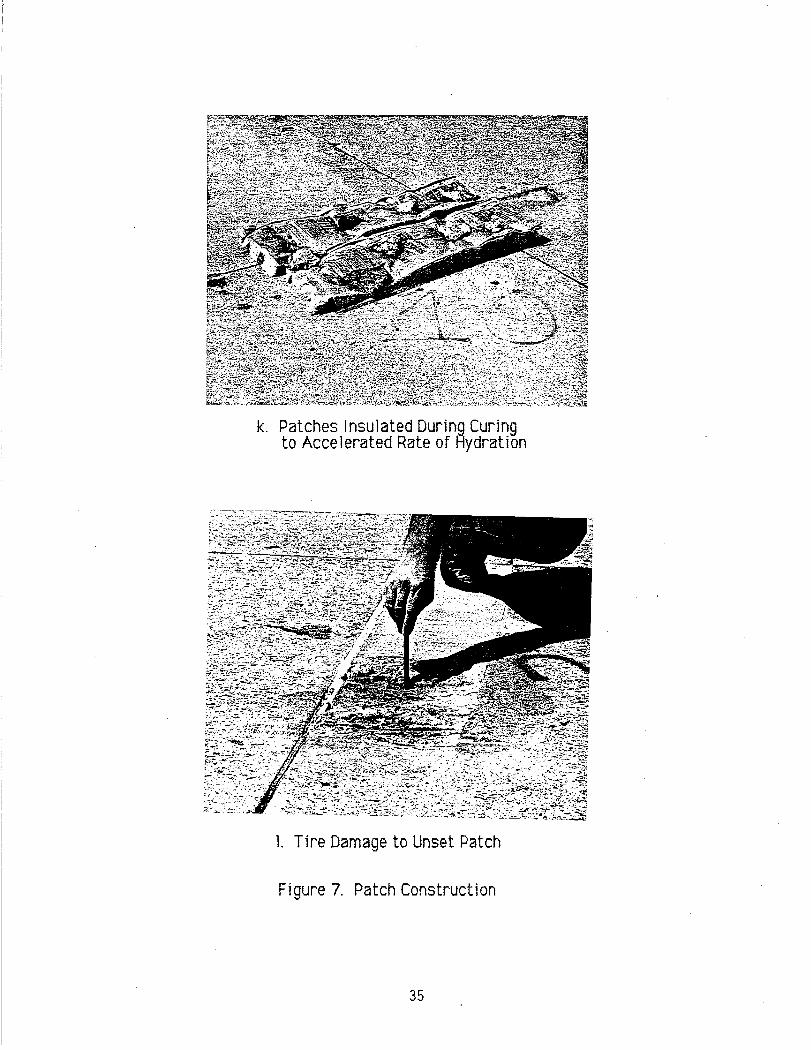
polyethylene sheet and fiberglass insulation mats as shown in Figure 7k.
For warm wather patches, loss of mOisture was critical. For cool weather
patches insulation to prevent heat loss was critical to insure rapid
28
strength gain. Hot mixing water was tried for some of the cool weather
patches to accelerate strength gain. However, the rate of heat loss from
the relatively small patches to the relatively large slab and to the air
during consolidation and finishing was so large that using hot water did
not significantly affect the rate of strength gain. During placement of the
coo 1 weather 1-85 patches, a cover was constructed and a source of heat
provi ded for several of the patches. There was no apparent appreci ab 1 e
increase in the rate of strength gain and the effort required to provide
heat precludes cons] den:lt i on of thi s techni Que as a viable means for
providing rapid early strength gain. After initial curing and prior to
opening to traffic} membrane curing compound was applied to patches.
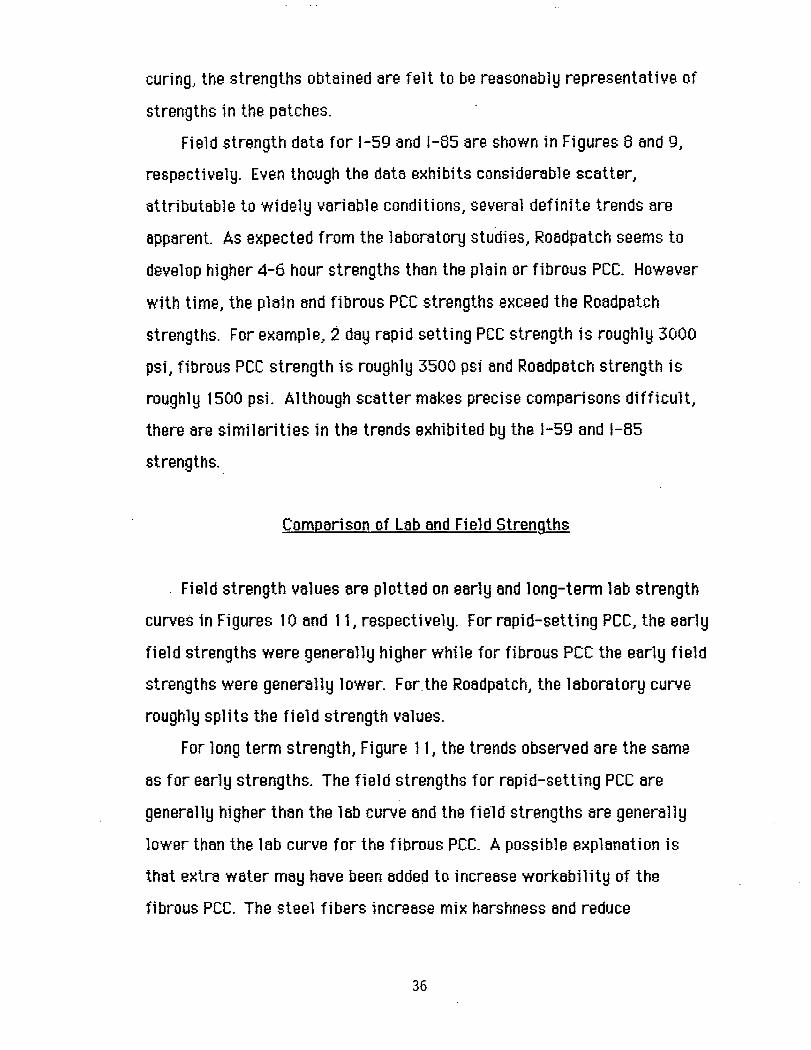
A patch that develops early strength sufficient to resist damage when
opened to traffic is the first priority of patch construction. Certainly}
long term performance is the ultimate goal} but getting and keeping the
patch in place allowing strength to develop is critical. Only two cool
weather patches were damaged immediately after opening to traffic as
illustrated in Figure 71. There was some surface deformation and abrasion
in these patches which were replaced during the next work day.
Field Strength Develop-ment
Four inch diameter} 8 inch long compressive strength speCimens were
made according to AASHTO T23 and tested according to AASHTO T22.
Every effort was made to simulate patch curing conditions Since the early
(4-hr) strength will be very dependent on temperature and possibly sample
disturbance. Samples were kept on the job site as long as possible before
transporting to a laboratory for testing. Despite obvious differences in
29
a. Cracked Area Along a Joint
b. Saw cut (1-2" Deep) Around Failed Area
Figure 7. Patch Construction
30
w
C. Fel1ed Area Outlined with Sewcut
Fi gure 7. Petch Construct 1 on
d. Jackhelmmer Removl ng Delmeged Concrete
e. Anchor Installation
f. Joint Filler Installation
Figure 7. Patch Construction
32
.i
~~
w w
g. Large Petch Area wHh Anchors Reedy ·for Concrete
Fi gure 7. Petch Construct ion
h. Smell Petch Area w1th Anchors Reedy for Concrete
w ..j:::>
1. Patch Mater1als Mixed 1 n Porteb 1 e M1 )(er
"'"
Figure 7. Petch Construction
''''"
, , t.:Jlj!"'S:'
j. Completed Patch-- Conso11 dated and F1n1shed w1th Convent1onel Techniques
k. Patches Insulated During Curing to Accelerated Rate of Rydration
1. Tire Damage to Unset Patch
Figure 7. Patch Construction
35
curing, the strengths obtained are felt to be reasonably representative of
strengths in the patches.
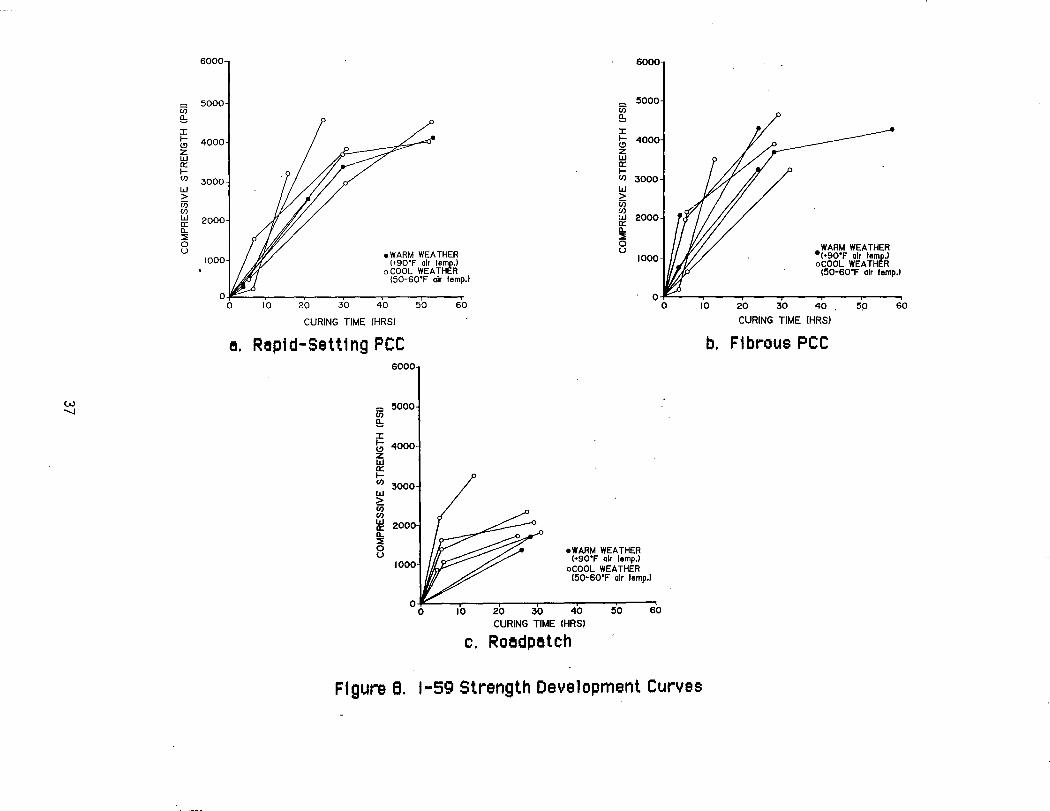
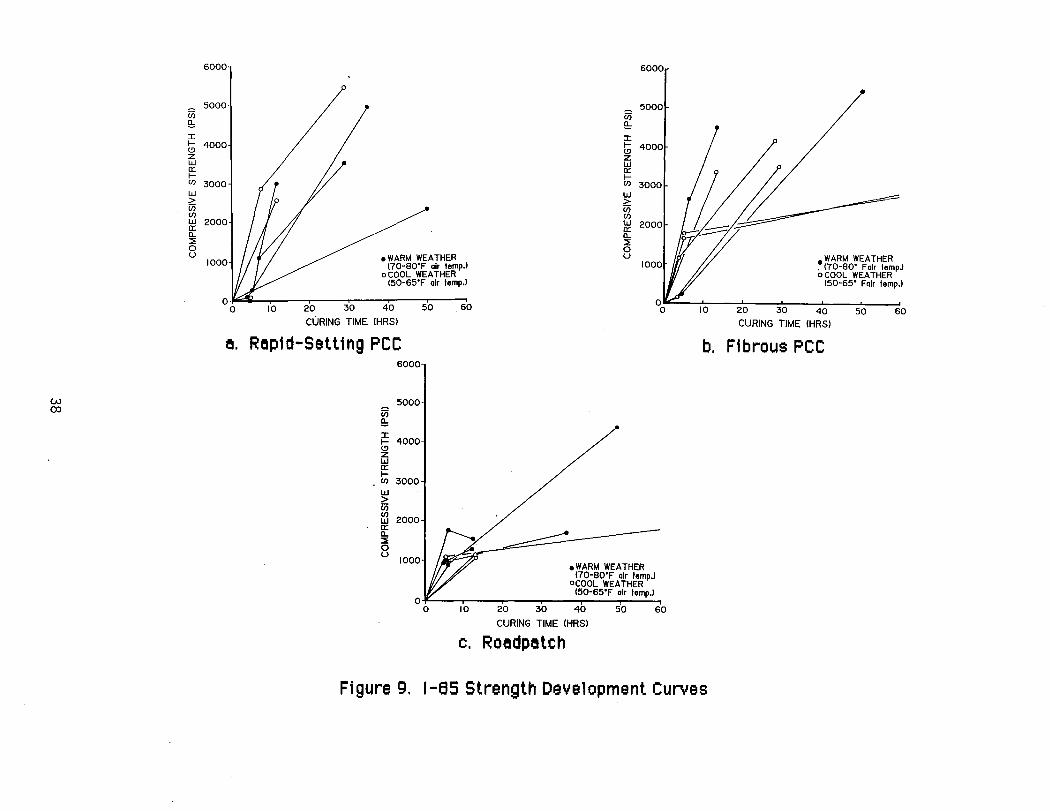
Field strength data for I-59 and 1-85 are shown in Figures 8 and 9,
respectively. Even though the data exhibits considerable scatter,
attributable to widely variable conditions, several definite trends are
apparent. As expected from the laboratory studies, Roadpatch seems to
develop higher 4-6 hour strengths than the plain or fibrous pee. However
with time, the plain and fibrous pee strengths exceed the Roadpatch
strengths. For example, :2 day rapid setting pee strength is roughly 3000
psi, fibrous pee strength is roughly 3500 psi and Roadpatch strength is
roughly 1500 psi. Although scatter makes precise comparisons difficult,
there are si mi lari ties in the trends exhi bi ted by the I-59 and 1-85
strengths.
Comparison of Lab and Field Strengths
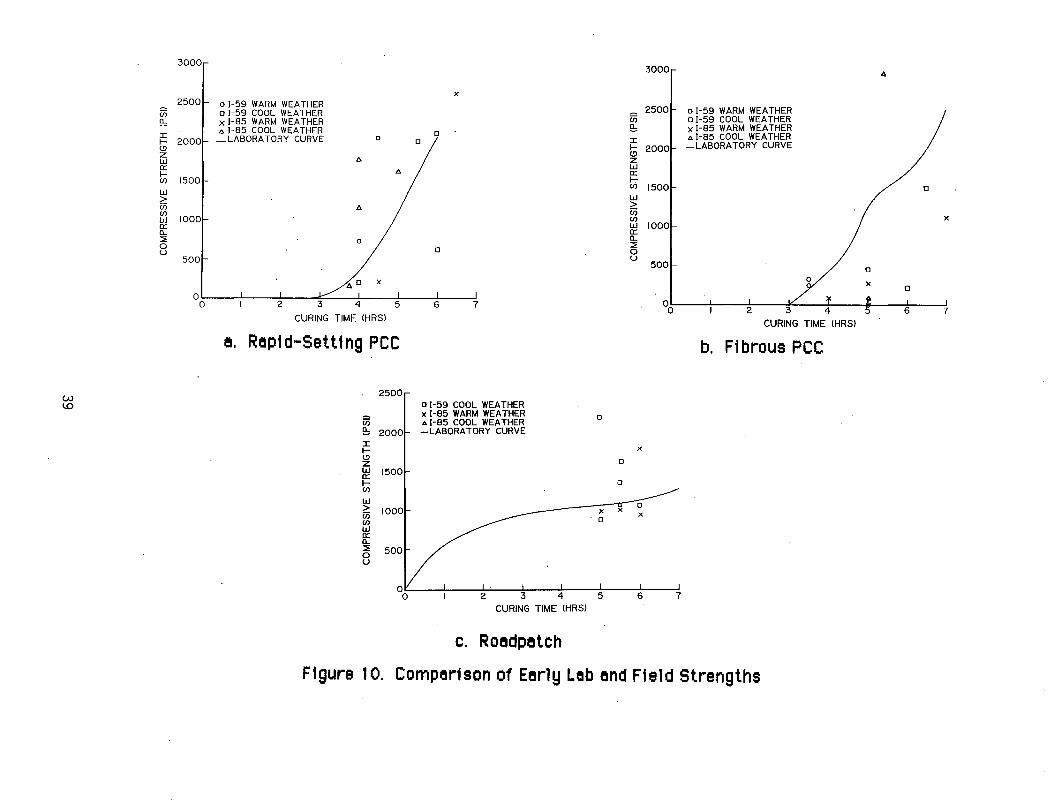
Field strength values are plotted on early and long-term lab strength
curves in Figures 10 and 11, respectively. For rapid-setting pee, the early
field strengths were generally higher whlle for fibrous pee the early field
strengths were generally lower. For.the Roadpatch, the laboratory curve
roughly splits the field strength values.
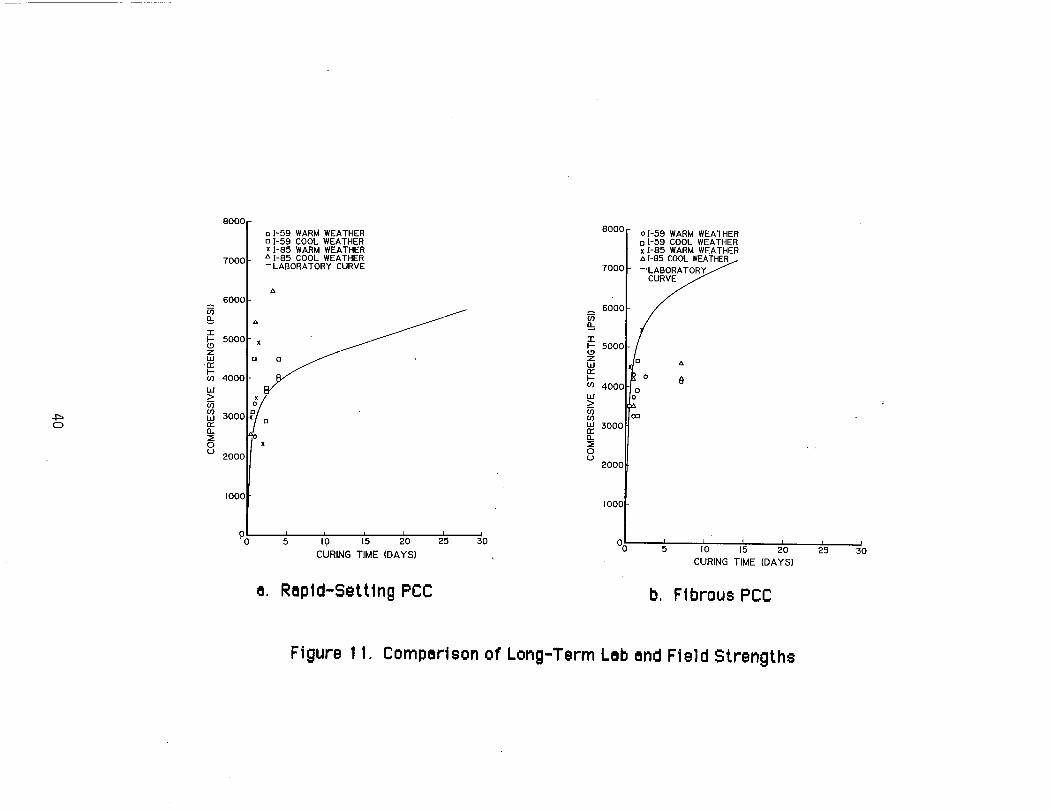
For long term strength, Figure 11, the trends observed are the same
as for early strengths. The field strengths for rapid-setting pee are
generally higher than the lab curve and the field strengths are generally
lower than the lab curve for the fibrous pee. A possible explanation is
that extra water may have been added to increase workabi 1 i ty of the
fibrous pee. The steel fibers increase mix harshness and reduce
36
w -....,J
GOOO
_ 5000 C/)
!!:: J: t; 4000 z W 0:: I-C/)
W > U5 C/) W 0:: a.. ::::;: o u
3000
2000
1000
or=O 10 20 30
_ WARM WEA THER (,90'F air lemp.!
o COOL WEATHER (50-GO'F air lemp.!
40 50 GO
CURING TIME (HRS)
6000
~ 5000
!!:: J: I- 4000 (!) z W 0:: I-C/) 3000 w > U5 (J) !JJ 0::
2000 a.. ~ 0 u
1000
0 0 10
WARM WEATHER -(,90'F air lempJ oCOOL WEATHER
(50-GO'F air lemp.)
20 30 40,50 GO
CURING TIME (HRS)
e. Retp1d-Setttng pce b. F1 brous PCC GOOO
ii1 5000
!!:: J: t; 4000 z W 0:: I-C/) 3000 w ~ C/) C/) W 0:: a.. ~ 0 u
1000
10
.WARM WEATHER (-90'F air lemp.1
oCOOL WEATHER (50-60'F air lemp.)
20 30 40 CURING TIME (HRS)
50 GO
C. Roedpetch
Figure B, I-59 Strength Development Curves
w (Xj
Vi e:: I
6000
5000
I- 4000 l!) Z W 0:: I-en 3000 w > Vi ~ 2000 0:: D... ~ o u
10
• WARM WEATHER (70-80'F aIr temp.)
o COOL WEATHER (50-65'F air temp.)
20 30 40
CURING TIME (HRS) 50 .60
6000
5000 Vi e:: I t; 4000 z W 0:: I-CI)
w > Vi CI) W 0:: D... ~ 0 u
8. R8p1 d-Set t 1 ng pee 6000
5000 Vi e:: i= 4000 l!) z W 0:: I-CI) 3000 w > Ui ~ 2000 0:: D... ~ 0 u
.WARM WEATHER (70-80'F air temp.)
oCOOl WEATHER (50-65'F air temp.)
10 20 30 40 50 60
CURING TIME (HRS)
c. R08dp8tch
10
• WARM WEATHER . (70-80' Fair tempJ o COOL WEATHER
(50-65' Fair temp.)
20 30 40
CURING TIME (HRS) 50 60
b. F1 brous pec
F1 gure 9. 1-85 Strength Development Curves
w ~
U5 e:, :r: I-t!J Z W n:: l-(fJ
w > U5 (fJ w n:: c.. ::;: 0 u
3000.
2500
2000
1500
1000
500
0 1 0
3000
1 A
x
01-59 WARM WEATHER _ 2500[ 0 I-59 WAR" WEATHER o I-59 COOL WEATHER U5 0 I-59 COOL WEATHER X 1-85 WARM WEATHER e:, X 1-85 WARM WEATHER " 1-85 COOL WEATHER 0 " 1-85 COOL WEATHER _ LABORA TORY CURVE 0 0 ~ 2000 _LABORATORY CURVE t!J
6. Z W
A n:: I-(fJ 15001- /' [J
w > 6. U5
~ 1000 x
c.. 0 ::;: 0 0
u 500
1 V [J
x x [J
~[J
I ..I:::::::: I I I 2 3 4 5 6 7 00 2 3 4 5 6 7
CURING TIME (HRS) CURING TIME (HRS)
e. Repl d-Set t I ng PCC b. Fibrous PCC
2500 o I-59 COOL WEATHER x 1-85 WARM WEATHER 0
120o'f .. 1-85 COOL WEATHER -LABORATORY CURVE
x
0 w 1500 n:: l- I 0 (fJ
w 1000r > ~~ U5
(fJ . 0
w n:: c.. ::;: 500 0 u
0 0 2 3 4 5
CURING TIME (HRS)
c. Roedpetch
Figure 10. Comper1son of Eerly Leb end Field Strengths
~ o
8000 o I-59 WARM WEATHER (] I-59 COOL WEATHER x 1-85 WARM WEATHER
70001- "1-85 COOL WEATHER - LABORA TORY CURVE
" 6000 iii !!:: I" J: I-- 5000 (!)"
z W 10 (]
"0::
Iii 4000 w
> f ~3000~(] ::< l' o x u 2000
1000
0' , , , I , ,
·0 5 19 15 20 25 30
CURING TIME (DAYS)
e. R8pid-Setting PCC
iii !!:: J: I-(!) z W 0:: I-en W >
8000
7000
6000
~ 1100 W 3000 0::
~ o u
2000
1000
o I-59 WARM WEATHER (] I-59 COOL WEATHER x 1-85 WARM WEATHER "1-85 COOL WEATHER -LABORA TORY
CURVE
" &
O~ 5 io 15 2'0 25 3'0
CURING TIME (DAYS)
b. Fibrous PCC
Figure 11. Comp8rison of Long-Term Leb end Field Strengths
workabl11ty and, although no extra water was supposed to have been added,
some may have mysteriously appeared. Considering field variability, the
comparisons indicate that desired strengths were aChieved reasonably
well in the field.
41
PATCH PERFORMANCE
Patch performance was monitored visually. In addition, an attempt
was made to use accoustic emissions to assist in this evaluation (4).
Acoust i c emi ssi on techni Ques provi de re 1 at i ve measures of i nterna 1
microcracking and debonding. The basis for using acoustic emissions was
that higher levels of internal microcracking and debonding would be
indicative of higher probabilities of patch fanure. Acoustic emission
surveys were conducted on selected patches at 1/2, 1, 3, and 6 month age.
Based on these surveys, the patch structural condition was evaluated.
These evaluations were compared with the final distress categorizations.
The comparisons indicated poor agreement. Therefore, the patCh
performance evaluation will rely on the visual monitoring.
Visual Monitoring
Performance of the patches were monitored by periodically observing
and documenting their condition. The following summarizes the
observat ion schedul e f or the patches:
I-59 Warm Weather - 4, 8 & 15 month observations
I-59 Cool Weather - 4 & 11 month observations
1-85 Warm Weather
1-85 Cool Weather
- 4, 6 & 11 month observations
- 2 & 7 month observations
The following discussion of deterioration mechanisms is based on these
observat ions and the performance ranki ng and eval uat ions are based on the
final observations for each patch grouping.
Patch Deteri orat ion
Patch deteri orat ion developed in several stages begi nni ng wi th
42
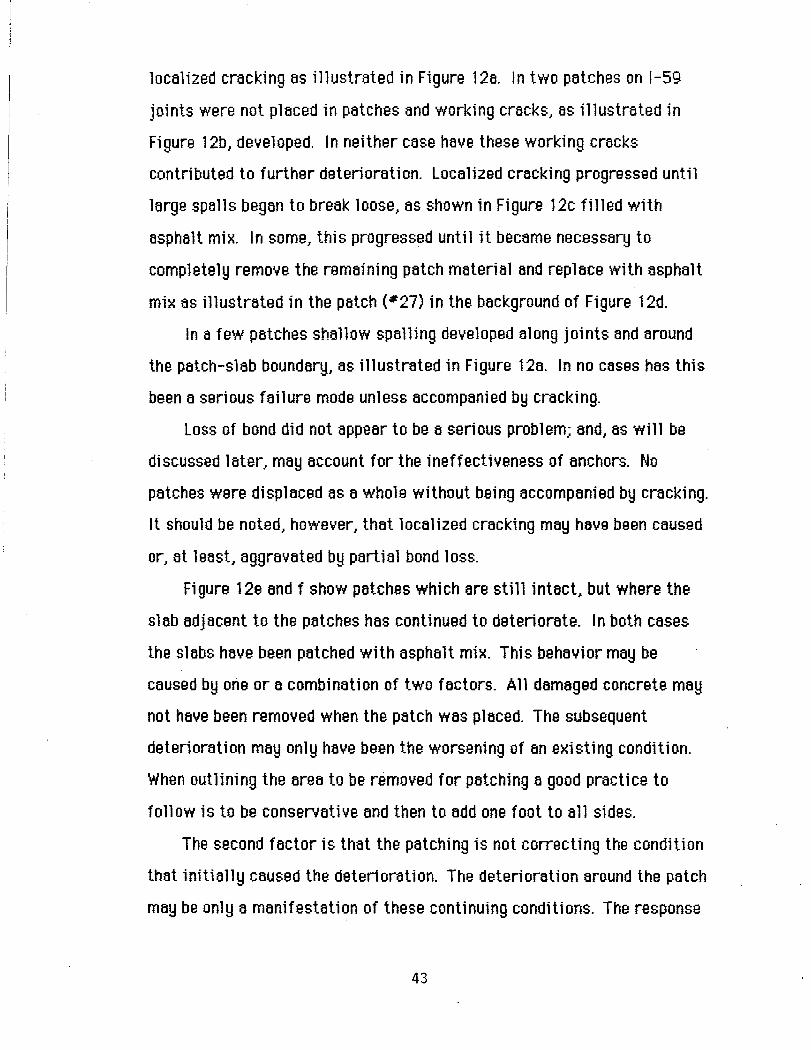
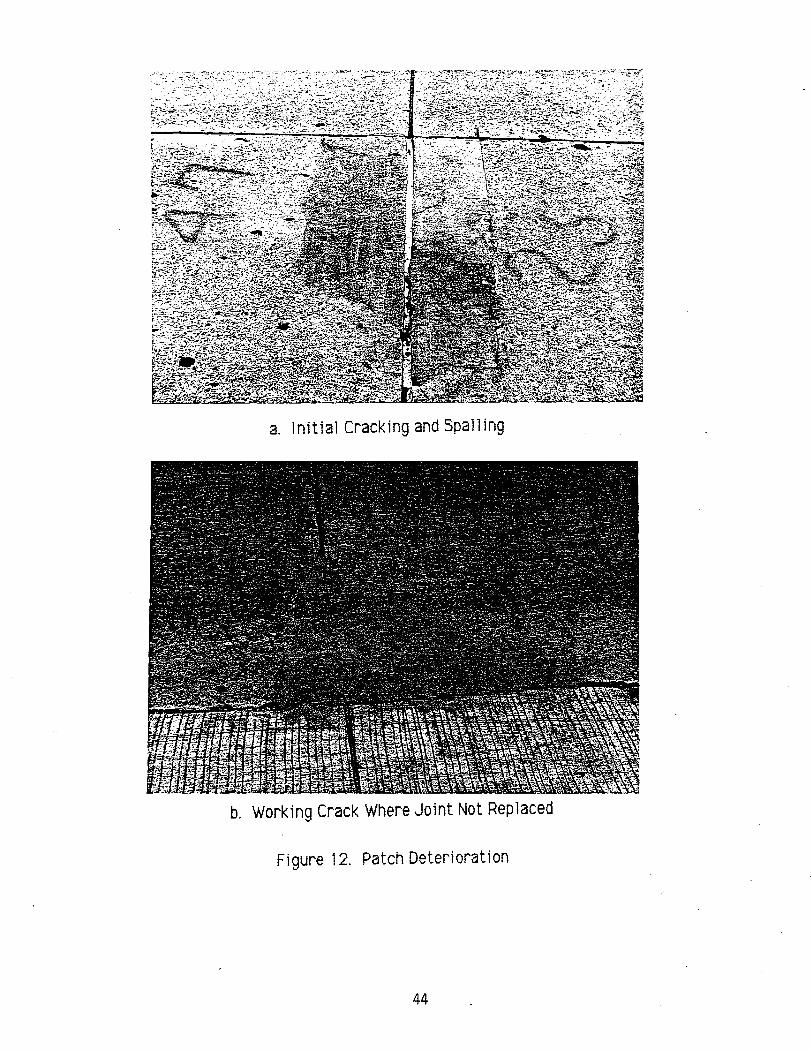
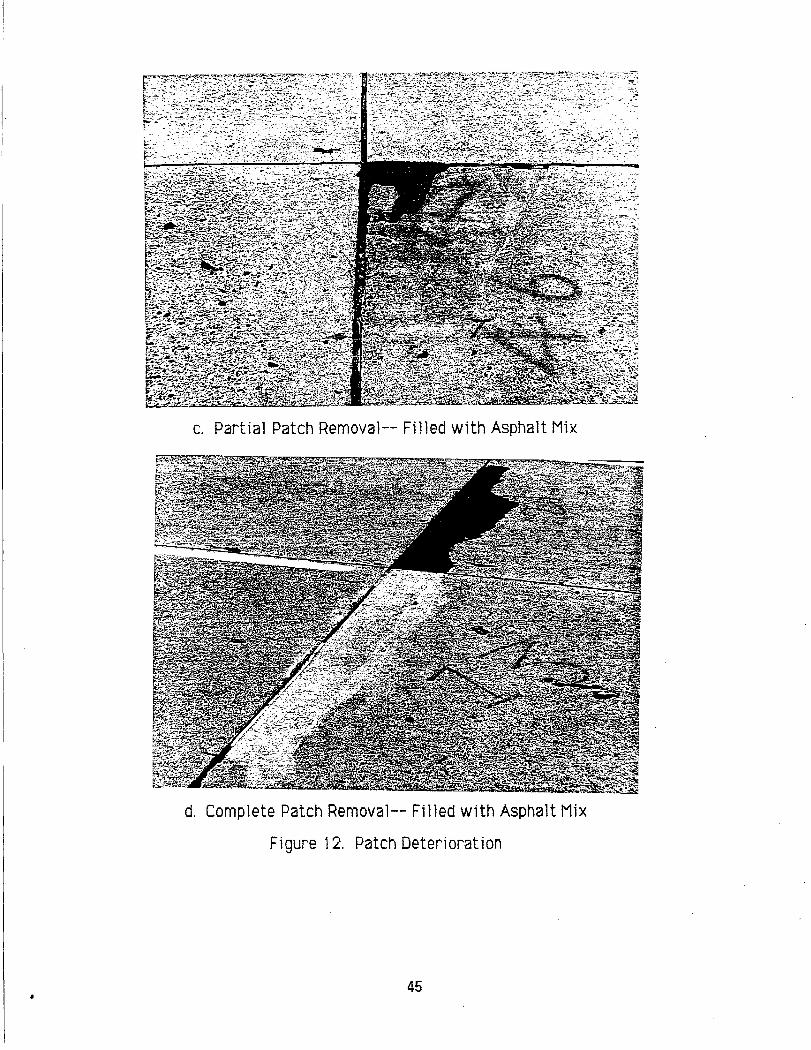
localized cracking as illustrated in Figure 12a. In two patches on I-59
joints were not placed in patches and working cracks, as illustrated in
Fi gure 12b, developed. I n neither case have these worki ng cracks
contributed to further deterioration. Localized cracking progressed until
large spalls began to break loose, as shown in Figure 12c filled with
asphalt mix. In some, this progressed until it became necessary to
completely remove the remaining patch material and replace with asphalt
mix as illustrated in the patch (#27) in the background of Figure 12d.
In a few patches shallow spalling developed along joints and around
the patch-slab boundary, as illustrated in Figure 12a. In no cases has this
been a serious failure mode unless accompanied by cracking.
Loss of bond did not appear to be a serious problem; and, as will be
discussed later, may account for the ineffectiveness of anchors. No
patches were di sp laced as a whole wi thout bei ng accompani ed by cracki ng.
It should be noted, however, that localized cracking may have been caused
or, at least, aggravated by partial bond loss.
Figure 12e and f show patches which are still intact, but where the
slab adjacent to the patches has continued to deteriorate. In both cases
the slabs have been patched with asphalt mix. This behavior may be
caused by one or a combi nat i on of two factors. All damaged concrete may
not have been removed when the patch was placed. The subsequent
deteri orat i on may only have been the worseni ng of an exi st i ng condi t ion.
When out 1 i ni ng the area to be removed for pat chi ng a good practice to
follow is to be conservative and then to add one foot to all sides.
The second factor is that the patching is not correcting the condition
that initially caused the deterioration. The deterioration around the patch
may be only a manifestation of these continuing conditions. The response
43
a. Initial Cracking and Spalling
b. Working Crack Where Joint Not Replaced
Figure 12. Patch Deterioration
44
c. Partial Patch Removal-- Filled with Asphalt Mix
d. Complete Patch Removal-- Filled with Asphalt Mix
Figure 12. Patch Deterioration
45
~-:....,;: ..
. .. - ;:-.-: -~.:.:.:

e. Deterioration Around Periphery of Unsawed Patch
f. Deterioration Around Periphery of Sawed Patch
Figure 12. Patch Deterioration
46
of five cold weather I-59 patches further reinforces this notion. All five
patches (#26-#30) were placed sequentially on the outside lane just
upstream of the intersection with the US 431 entrance ramp. They were
placed in December 1986, were in good condition in April 1987 (4 months)
and completely failed (removed and filled with asphalt mix) during the
summer of 1987. Patch 27 is shown in the background of Figure 12d. A
possible explanation for this behavior is that the ramp entrance may
restrict the cyclic movement of the slabs which may have been the cause
of the initial deterioration along the jOints. As summer temperature
increased, the same restraint and resulting compressive forces may have
caused f ai 1 ure in the patches.
Patch Performance Evaluation
Based on visual observations of the patches during the final survey
they were grouped, according to the amount of distress, into the following
three di stress categori es:
o No distress
o Moderate distress - localized cracking &. light spalling
o Severe distress - severe cracking &. deep spalling requiring
maintenance
Results from the surveys are summarized for the I-59 patches and
1-85 patches in Tables 6 and 7, respectively. The data for all patches is
combined in Table 8.
Compari son of the performance of patches placed duri ng warm and
cool weather reveals better performance for those patches placed during
warm weather. Evidence of this is the larger percentage of warm weather
patches falling into the no distress category and the smaller percentages
falling in the severe distress category. This conclusion is strengthened by
the age of the patches at the final survey. For I-59 the warm weather
47
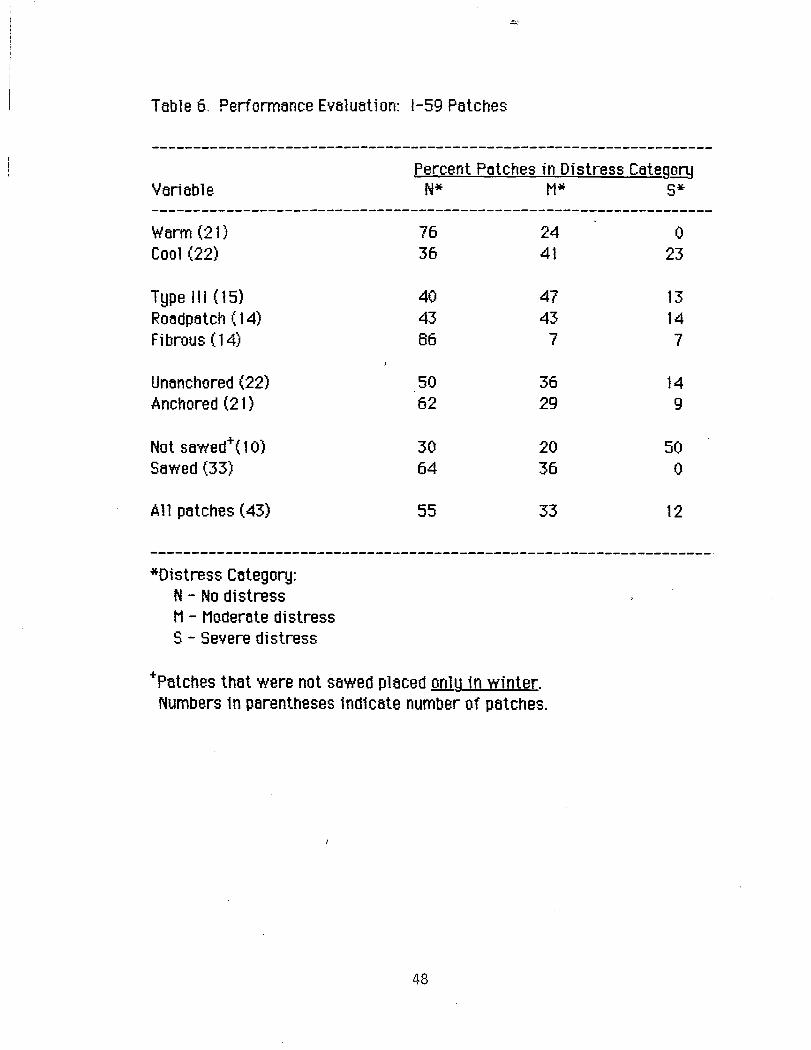
Table 6. Performance Evaluation: I-59 Patches
Percent Patches in Distress CategQIY Variable N* M* S* -------------------------------------------------------------------Warm (21) Cool (22)
Type III (15) Roadpatch (14) Fl brous (14)
Unanchored (22) Anchored (21)
Not sawed+ ( 10) Sawed (33)
A 11 patches (43)
*Olstress Category: N - No di stress M - Moderate distress S - Severe di stress
76 24 36 41
40 47 43 43 86 7
50 36 62 29
30 20 64 36
55 33
+Patches that were not sawed placed only in winter. Numbers in parentheses indicate number of patches.
48
0 23
13 14 7
14 9
50 0
12
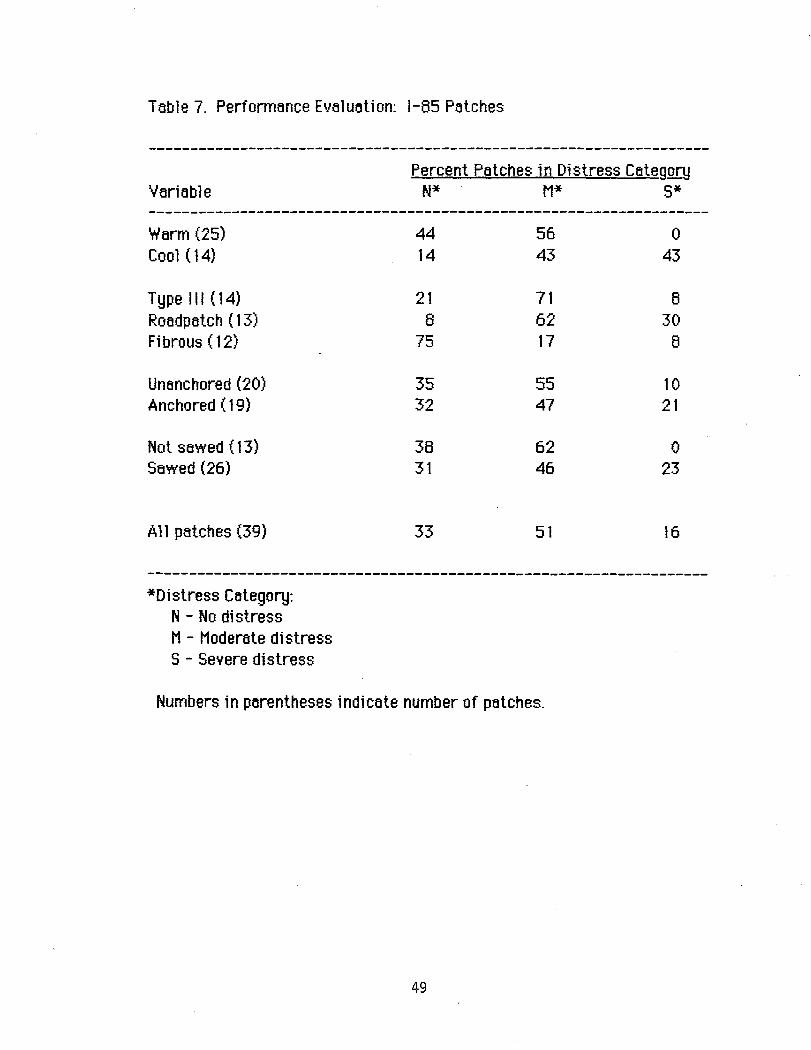
Table 7. Performance Evaluation: 1-85 Patches
Percent Patches in Di stress Categm:y Variable N* M* S* -------------------------------------------------------------------Worm (25) Cool (14)
Type III (14) Roadpatch (13) Fi brous (12)
Unanchored (20) Anchored (19)
Not sowed (13) Sowed (26)
A 11 patches (39)
*Distress Cotegory: N - No di stress M - Moderate di stress S - Severe di stress
44 56 14 43
21 71 8 62
75 17
35 55 32 47
38 62 31 46
33 51
Numbers in porentheses indicote number of potches.
49
0 43
8 30 8
10 21
0 23
16

Table 6. Performance Evaluation: All Patches
Percent Patches in Distress category Variable N* M* S* -------------------------------------------------------------------Warm (46) Cool (36)
Type" I (29) Roadpatch (27) Fi brous (26)
Unanchored (42) Anchored (40)
Not sawed (23) Sawed (59)
A 11 patches (62)
*Distress Category: N - No di stress M - Moderote di stress S - Severe di stress
59 41 27 42
31 59 26 52 61 12
43 45 47 36
34 44 50 40
44 42
Numbers in porentheses i ndi cote number of patches.
50
0 31
10 22
7
12 15
22 10
14
were 15 months old and the cool weather 11 months. For 1-85 the warm
weather were 11 months old and the cool weather 7 months. Improved
performance of warm weather patches can likely be attributed to the more
rapid rate of strength gain which will reduce early damage when opened to
traffic.
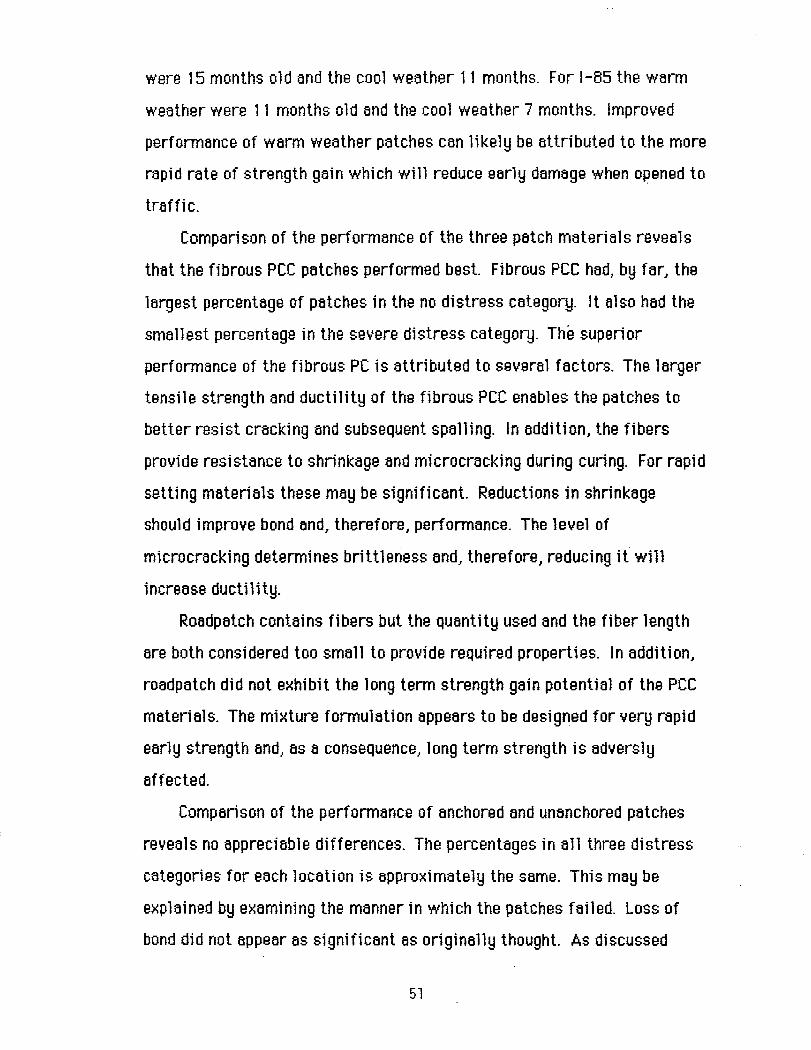
Comparison of the performance of the three patch materials reveals
that the fibrous PCC patches performed best. Fibrous PCC had, by far, the
largest percentage of patches in the no distress category. It also had the
smallest percentage in the severe distress category. The superior
performance of the fibrous PC is attributed to several factors. The larger
tensile strength and ductility of the fibrous PCC enables the patches to
better resist cracking and subsequent spalling. In addition, the fibers
provide resistance to shrinkage and microcracking during curing. For rapid
setting materials these may be significant. Reductions in shrinkage
should improve bond and, therefore, performance. The level of
microcracking determines brittleness and, therefore, reducing it will
increase ductility.
Roadpatch contains fibers but the Quantity used and the fiber length
are both considered too small to provide required properties. In addition,
roadpatch did not exhibit the long term strength gain potential of the pce
materials. The mixture formulation appears to be designed for very rapid
early strength and, as a consequence, long term strength is adversly
affected.
Comparison of the performance of anchored and unanchored patches
reveals no appreciable differences. The percentages in all three distress
categories for each location is approximately the same. This may be
explained by examining the manner in which the patches failed. Loss of
bond did not appear as significant as originally thought. As discussed
51
Asl Ab=O.Oa"O.29%
12
10
~ 8 Z W ::> 6 o W a:: 4 LL.
2
50%
N M S
DISTRESS CATEGORY
Asl Ab~O.30%
12
10 45% 45%
8
6
4
2
N M S
DISTRESS CATEGORY
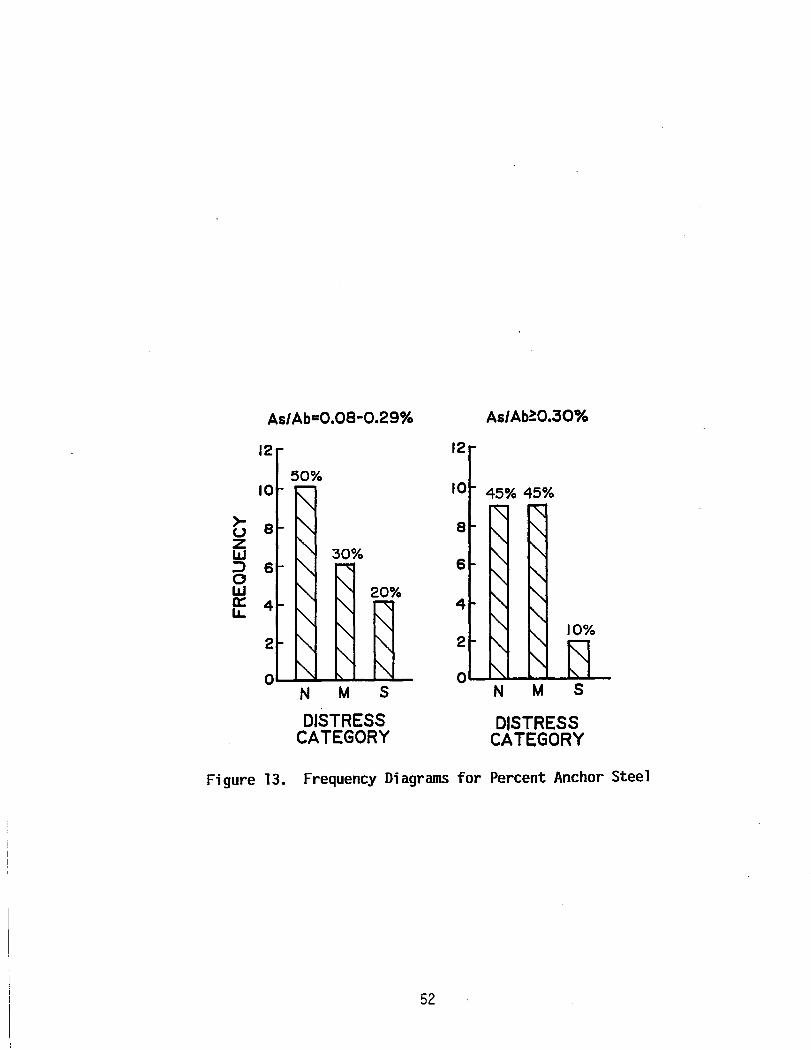
Figure 13. Frequency Diagrams for Percent Anchor Steel
52
earlier, failure appeared to start with localized cracking which progressed
until large pieces or spalls broke loose. Anchors did not decrease the
propensity for this to happen. Because of limited patch depth, resulting in
limited cover, the anchors may have accelerated cracking and breakup for
some patches.
The ineffectiveness of anchors is further demonstrated by examining
the influence of amount of anchor steel on patch performance. Percent
anchor steel to patch bond area varied from 0.1 to 0.6% with an average of
0.3%. Patches were separated into two groups (of 20 patches each) with
percent anchor steel smaller and larger than the average of 0.3%. The
frequency of patches in the three distress categories for each group are
plotted in Figure 13. Although there are differences in frequencies and
percentages, they are often contradictory and are not considered large
enough to conclude that patch performance is improved by i ncreasi ng the
amount of steel.
Compari son of the performance of patches wi th sawed edges wi th
those that were not sawed reveals some contradictory implications. For
I-59 patches, the percentages in the no distress and severe distress·
categories indicate that sawing was benefiCial. For 1-85 patches, the
opposite is indicated. However, when combined, as in Table 8, a moderate
beneficial effect of sawing is indicated. Even if this were not sufficiently
strong justification for sawing, construction considerations make the
effort required worthwhile. As noted earlier, sawing makes damaged
concrete removal easier, provides more uniform patch edge depth, and
reduces damage to sound concrete with the jackhammer when preparing
the patch area.
Comparison of the performance of I-59 and 1-85 patches reveals
better performance for I-59 patches. Three possible reasons for this are
53
1) the greater traffic volume on 1-85, 2) the poorer overall condition of
the 1-85 pavement, and 3) the higher Quality workmanship for the I-59
patches.
Even though the overall experiment design and data analysis may lack
statistical rigor, particularly variable interaction, the conclusions drawn
seem reasonable when combined with patch material properties and patch
deterioration mechanisms. Fibrous PCC placed during warm wather
conditions will provide the best patch performance. A sawcut around the
patch area will improve performance but anchors will probably not.
Placement of patches does not correct the basic condition causing distress
and patch performance will llkely be directly related to the overall
pavement condi t ion.
CONCLUSIONS AND RECOMMENDATIONS
Patch material can be produced using Type III cement and a
nonch 1 ori de accelerator that wi 11 develop strength rapi d1 y enough to allow
patch construction and reopening to traffic in one working day. The
inclusion of 1.2% by volume, 3/4 in. or longer steel fibers will enhance
patch performance. The inclusion of anchors in the patch will not
significantly improve performance. Patches constructed during warm
weather (+ 70°F) will perform better than those constructed during cooler
weather. A saw cut to outline the patch area will aid in construction.
There is some evi dence to i ndi cate that the saw cut may also improve
patch performance.
Fibrous PCC patching mixes should be designed with Type III cement
and a nonch1oride accelerator to achieve a six-hour compressive strength
of approximately 2000 psi. Patches should be constructed when the
54
maximum dally temperature wlll be greater than 70°F. Construction
operations should be scheduled to provide a minimum of 4 hours wet curing
of the patch prior to opening to traffic. The patches should be covered
with insulation to prevent heat loss and speed hydration during wet curing.
A membrane curing compound should be applied prior to opening to traffic.
During patch construction areas of deteriorated concrete should be
identified and outlined with a sawcut 1 to 2 in. deep. The area outlined
with the sawcut should be about 1 ft. larger on all sides than the
deteriorated area. The smallest jackhammer possible should be used to
remove damaged concrete; if possible 30 lb. or less. Patch material should
be consolidated with vibration.
55
REFERENCES
1. Ross, J.E., "Rapid Setting Concrete Patching Study," Research Report No. 84, Louisiana Department of Highways, March 1975.
2. Parker, F., G.E. Ramey, and R.K. Moore, "Evaluation of Rapid Setting Materials and Construction Techniques for Concrete Pavement Patches," Final Report Project No. 930-107, Alabama Highway Department, October 1983.
3. Parker, F., "Steel Fibrous Concrete for Airport Applications," Technical Report S-74-12, U.S. Army Engineer Waterways Experiment Station, November 1974.
4. Hinds-Rico, J.A.B., "Acoustic Emission Monitoring of Concrete Pavement Spall Repairs," Master of Science Thesis, Auburn University, August 1987.
56