Embed Size (px)
Citation preview

Copyright © 2013, 2015, 2016 by Deepak Hegde and Hong Luo
Working papers are in draft form. This working paper is distributed for purposes of comment and discussion only. It may not be reproduced without permission of the copyright holder. Copies of working papers are available from the author.
Patent Publication and the Market for Ideas Deepak Hegde Hong Luo
Working Paper 14-019 February 8, 2016

Patent Publication and the Market for Ideas∗
Deepak Hegde† Hong Luo‡
Abstract
In this paper, we study the effect of invention disclosure through patent publication on the market for
ideas. We do so by analyzing the effects of the American Inventor’s Protection Act of 1999 (AIPA)—
which required US patent applications to be published 18 months after their filing date rather than at
patent grant—on the timing of licensing deals in the biomedical industry. We find that post-AIPA US
patent applications are significantly more likely to be licensed before patent grant and shortly after 18-
month publication. Licensing delays are reduced by about ten months, on average, after AIPA’s enactment.
These findings suggest a hitherto unexplored benefit of the patent system: by requiring inventions to be
published through a credible, standardized, and centralized repository, it mitigates information costs for
buyers and sellers and, thus, facilitates transactions in the market for ideas.
This Version: February 8, 2016
∗The authors are grateful to Luı́s Cabral, Jay Choi, Wesley Cohen, Nancy Gallini, Alfonso Gambardella, Bronwyn Hall, DavidHsu, David Mowery, Bhaven Sampat, Tim Simcoe, Scott Stern, and seminar participants at the Erasmus School of Economics,University of Maryland, George Washington University, Georgia Tech, Harvard Business School, Hong Kong University, KelloggSchool of Management, New York University, University of California, Berkeley, University of Munich, Academy of Managementmeeting, International Industrial Organization Conference, and NBER Summer Institute for helpful comments. We also thank HazelPike and Laurel McMechan for their excellent research assistance. Hegde’s research was funded by a 2013 Kauffman Junior FacultyFellowship.
†New York University-Stern School of Business and USPTO; email: [email protected].‡Harvard Business School; email: [email protected].
1

1 Introduction
An efficient market for ideas can facilitate specialization among innovators, reduce R&D duplication, and
accelerate the commercialization of inventions (Teece (1986); Arora et al. (2001); Gans and Stern (2003)).
However, information frictions pose challenges for the smooth functioning of the market. For example, in-
ventors can be reluctant to disclose private information about their inventions for fear of expropriation (Arrow
(1962)). Scholars have argued that patents, by securing inventors’ property rights, encourage the voluntary
disclosure of proprietary knowledge and facilitate the trade of ideas (e.g., Arora (1995); Merges (2005); Hell-
mann (2007); Elfenbein (2007)).1
In this paper, we study the effects of another key function of patents—the mandatory disclosure of patented
inventions to the public—on the market for ideas. We argue that, apart from challenges associated with
disclosing proprietary information, the market for ideas suffers from a broad set of frictions due to a general
lack of information about buyers, sellers, and inventions (Arora and Gambardella (2010)). Even for inventions
voluntarily disclosed by sellers, potential buyers may find it costly to acquire adequate information about the
inventions and evaluate them against substitutes. We hypothesize that patent publication through a credible,
standardized, and centralized intermediary, such as the patent office, infuses more information into the market
and augments trading opportunities.2 We empirically test this hypothesis, since, given that inventors can
always voluntarily disclose their inventions, it is not immediately apparent that public disclosures through
patent publication have a meaningful impact on real world transactions.
Empirically distinguishing the effect of patent publication from that of the property rights conferred by
patents is hard because the two factors are often tied together. Here, we leverage the enactment of the Ameri-
can Inventor’s Protection Act of 1999 (AIPA) which separated the patent publication and patent grant events.
Historically, US patent applications were published at the time of grant. AIPA generally required inventors
filing for patents at the US Patent and Trademark Office (USPTO) on or after November 29, 2000 to publish
their applications 18 months after they are filed. Because the median patent filed in 2000 took 32.5 months
to be granted, AIPA resulted in pre-grant publication for a majority of applications. We evaluate the im-
pact of AIPA on the timing of licensing—an important variable that determines the rate at which ideas are
commercialized and, thus, the surplus achieved through these transactions.3
1Arora and Gambardella (2010) provide an overview of the literature on the relationship between intellectual property rights andthe market for technologies. A number of studies also examine the inventors’ contracting and disclosure strategies (e.g., Bhattacharyaand Ritter (1983); Gallini and Wright (1990); Anton and Yao (1994, 2002)).
2Lamoreaux and Sokoloff (1996, 2002)) document the role of informational intermediaries (e.g., patent agents and patent lawyers)in the rise of a market for patents in the U.S. in the nineteenth century. Arora and Gambardella (2010) note that patent officesthemselves, along with patent agents and lawyers, can be a focal institution for organizing technology trade.
3A number of studies examine the timing of the sale of ideas. See Jensen and Thursby (2001) on faculty’s choice to disclose
2
We first develop a theoretical framework to clarify AIPA’s effects on the inventor’s decision of when to
license her patent. Before AIPA, an inventor’s choice is either to license immediately after patent application
or to wait until the patent is granted. The inventor chooses the former if earning licensing revenues sooner—
while risking information leakage during the search and negotiation process—outweighs the combined effect
on licensing revenues of patent publication and clarifying patent rights, both of which occurred at patent
grant. We show that, by separating patent publication and patent grant, AIPA has two different effects. First,
for inventors who could benefit sufficiently from public disclosure (due to reduced information frictions,
for example), AIPA provides an additional, viable option of licensing between patent application and grant.
Second, because publication happens sooner, the law makes it less attractive to delay licensing in order to
prolong secrecy.
The above two effects of AIPA both imply that the inventor is less likely to wait until grant after AIPA,
but may have contrasting implications for firms in terms of the total surplus of a transaction: The reduction
in information frictions is likely to enhance the surplus, while increased expropriation risk may reduce the
surplus of the transaction and, eventually, decrease the ex-ante value of patenting and licensing. A distinction
between these two effects is that the former increases the likelihood of licensing immediately after the pub-
lication date, while the latter increases the likelihood of licensing immediately after the application date. We
use this distinction in the resulting change in the licensing timing to empirically disentangle these two effects.
Our sample has 440 licenses of biomedical inventions involving 1,370 patent applications filed between
mid-1995 and 2011. We use two approaches to investigate AIPA’s effects on the timing of licensing. First, we
compare the timing of transactions involving US applications that do not file for equivalent foreign patents
before and after AIPA’s enactment, controlling for observable characteristics of the inventions, the licensing
parties, and the markets. Second, most foreign nations required applications to be published 18 months after
filing even before AIPA, and inventions with US applications which also sought foreign protection were
published by the foreign patent offices 18 months after the filing date of the first related application regardless
of where the first application was filed. This institutional feature allows us to construct a comparison group
using transactions involving foreign applications (applications filed exclusively in foreign jurisdictions and
US applications with foreign equivalents) and investigate AIPA’s effect in a difference-in-differences (DID)
framework to further isolate other factors that might also change during the sample period.
We find that the probability of licensing after patent grant decreases by about twenty percentage points
their inventions at the proof-of-concept versus prototype stage, and its effects on licensing terms; Gans et al. (2008) for the impactof resolving uncertainty over the scope of IP rights; Allain et al. (2013) for impacts of downstream market structure on the stage oflicensing in the biotech industry; and Luo (2014) on the relationship between the sale stage and the seller’s observable experience inthe market for original movie ideas. Our paper is distinct in its focus on the role of patent publication on the timing of ideas’ sales.
3

for post-AIPA US patent applications without corresponding foreign applications. This reduction appears
to be primarily driven by an increase in the likelihood of licensing shortly after the 18-month publication
date. This result is robust to a number of different empirical specifications. The significant 18-month effect
is consistent with our hypothesis that patent publication helps reduce information frictions and benefits at
least some inventors. This interpretation of our results is also corroborated by our findings regarding AIPA’s
heterogeneous effects. Specifically, the effect of 18-month publication is significantly stronger for for-profit
than for non-profit licensors (such as universities, medical schools, and other research institutions), perhaps
because the inventions underlying the latter’s patents are already disclosed in other venues, such as academic
publications and conference presentations. The 18-month effect is also significantly stronger for licensors with
less prior licensing experience—a finding consistent with the hypothesis that the marginal benefit of patent
publication is higher for inventors who lack the reputation or resources to overcome some of the information
frictions (Rosenberg (2002); Long (2002)).
AIPA’s effect on licensing after the application date are mixed: some specifications suggest a significant
increase, while others show no change. Our theory predicts that if the expropriation risk were negligible
to start with, AIPA would reduce the likelihood of licensing after application. Thus, even with the mixed
results, it is reasonable to conclude that expropriation concerns are not negligible and may have a bearing
on the timing of licensing. It is, however, empirically challenging to quantitatively compare the benefits of
disclosure and the costs due to increased expropriation risk, especially because we lack good data on the
pricing of licenses and on the inventors’ decision of whether or not to license given a patent. In theory, the
effect of pre-grant publication on the ex-ante value of licensing and patenting is ambiguous (Aoki and Prusa
(1996); Aoki and Spiegel (2009)). Existing empirical evidence seems to find no significant dampening effect
on patenting post-AIPA (Graham and Hegde (2015)).
Our study contributes a step towards remedying the dearth of research on the effects of invention disclo-
sure, which is considered one of the two main objectives of patent systems (the other being the promotion of
innovation through the award of exclusive rights). In a closely related study, Gans et al. (2008) use the vari-
ation in the time patents take to be granted and show that patent grant increases the hazard rate of licensing
by over 70 percent. This striking increase reveals the salience of market frictions, but because their sam-
ple comprises of only pre-AIPA patents, the increase could be due to patent publication, exclusive rights, or
both. AIPA provides an important context to disentangle the two main functions of patents, and the significant
18-month effect we identify shows that patent publication plays a distinct role in facilitating the trade of ideas.
AIPA is considered one of the most important patent laws enacted in recent decades. Despite the wide
debate over its potential impacts (e.g., Ragusa (1992); Aoki and Prusa (1996), Modigliani et al. (1999);
4
Gallini (2002); Aoki and Spiegel (2009)), empirical assessments of its effects have been scarce (Johnson and
Popp (2003); Graham and Hegde (2015) are exceptions). We evaluate the potential effects of this important
policy change and show that the law significantly reduced licensing delay. While faster licensing does not
necessarily translate to higher welfare, existing evidence seems to suggest that shorter delays could benefit
both licensors and licensees, at least in the biomedical industry. For example, Hegde (2014) suggests that a
one-year delay in licensing can cost the inventor and the developer millions of dollars in forgone revenues.
Budish et al. (2015) show that short effective patent exclusivity reduces private incentives to engage in R&D.
While a complete welfare analysis is beyond the scope of our study, we find that one potential positive impact
of AIPA is to reduce information frictions in the market for ideas, a benefit that appears more important for
smaller inventors. Thus, our findings contribute some evidence to the evaluation of current policy proposals
to restrict pre-grant patent disclosure (e.g., H.R. 5980 at the Congress) that are based on the assumption that
it is privately harmful for small inventors.
Our sample is among a few that hand-collect information on each licensed patent in contracts. Data-
availability challenges result in a small sample size and limit our analysis in certain ways. Compared to the
population of licensing deals in the biomedical industry, our sample licenses tend to involve less-experienced
licensors and licensees, and the licensors are more likely to be non-profit entities. Even though we address
these sampling issues to some extent (e.g., by investigating whether the effects of AIPA are different across
different types of licensors), the limited sample size and potential selection issues should be taken into con-
sideration when interpreting our findings.
The rest of the paper is organized as follows: Section 2 describes the institutional details and presents
a theoretical framework that derives the potential effects of AIPA on inventors’ licensing timing decisions.
Section 3 introduces the sample and describes the empirical methods and the data. Section 4 presents our
empirical analyses and results. Section 5 concludes.
2 Institutional context and predictions
2.1 The American Inventor’s Protection Act (AIPA)
Before AIPA was enacted, patent applications filed in all European countries, Canada, Japan, and Australia
were published 18 months after their earliest application date (called “priority date”) by patent offices in
these countries.4 In contrast, US patent applications were published by the USPTO only upon grant; the
4The priority date of a patent application refers to the filing date of the earliest related application, regardless of where theapplication was filed. For example, if a firm files an application in Germany (unrelated to any other application it has filed before)prior to filing in Canada, publication in Canada occurs 18 months from the filing date in Germany.
5

technical knowledge represented in the patent application, the filing date of the patent application, and even
the inventor’s decision to seek a patent generally remained secret until grant. However, patent applications
filed in the US as well as in foreign nations (that is, US patent applications with foreign equivalents) were
published by the patent offices in these foreign nations 18 months after the priority date.
AIPA sought to harmonize the patent disclosure policy in the US with those in the rest of the world
and generally required inventors filing for patent protection in the US on or after November 29, 2000 to
publish their applications 18 months after their priority date. In order to address concerns that pre-grant
disclosure may expose small firms to expropriation risk, AIPA provided a way to avoid 18-month publication:
Inventors could opt out of 18-month publication by agreeing not to file the application, or its equivalent, in
any foreign country that required 18-month publication. In practice, however, this opt-out provision is rarely
used. Graham and Hegde (2015) show that 4.3 percent of all US applications in the biomedical industry filed
after AIPA’s enactment and granted by 2012 (6.9 percent of the patents that did not have foreign equivalents,
and nearly none of the more-important patents) opted out of 18-month publication.5 Therefore, the rest of our
analysis ignores the opt-out provision.
2.2 Patent publication versus voluntary disclosure
Both before and after AIPA, inventors could voluntarily disclose their inventions and patent applications
through a variety of mechanisms, including postings on their websites, publications, reports in industry and
trade bulletins. If voluntary disclosure under (potential) patent protection can sufficiently alleviate informa-
tional frictions, the effect of pre-grant patent publication by patent offices may be negligible or even negative
due to greater expropriation concerns (Bessen (2005)). Drawing on the work of legal scholars (Rosenberg
(2002); Long (2002); Merges (2005)), we argue that public disclosure through an official, standardized, and
centralized repository may affect market transactions in ways that cannot be achieved through voluntary dis-
closure.
First, the information disclosed in patent applications is arguably more credible than that in voluntary
disclosures because inventors may risk delay or denial of their patent applications by claiming either too
much or too little. In addition, the value of an invention is relative, and the inventor may possess superior
knowledge about prior art or competing substitutes for her invention relative to potential buyers. Under a
voluntary-disclosure regime, even if an inventor discloses her own invention, it may be hard to ensure the
credible disclosure of other related inventions. Publication mandated and regulated by law makes the market
5In our sample, patentees opted out of 18-month publication for less than two percent of the patents. In all such instances, thepatents were not the earliest filed patent that the contract licensed out.
6

more transparent overall and, thus, may reduce information asymmetries regarding the relative merits of an
invention.
Second, patent publication may enlarge the set of licensing opportunities beyond what can be achieved
through voluntary disclosures, which tend to be dispersed and limited in scope. Patent publications notify
the public of new inventions, are systematically catalogued, and are easily searchable through centralized
repositories. Thus, patent publication may reduce the search costs for sellers (by providing better information
about related inventors and, hence, potential buyers); facilitate buyers’ search for potential inventions; and
broaden the set of licensing opportunities between buyers and sellers in ways that are difficult to achieve
through dispersed voluntary disclosures.6
Third, the easy verifiability of disclosure through patent publication permits the owner of the published
application to sue others for infringement and demand royalties for the period between the publication date and
the patent grant date. This recourse, which mitigates expropriation risk (also discussed below), is generally
not available for inventions disclosed through other channels.
Of course, earlier publication reduces the duration of secrecy and, hence, potentially increases the ex-
propriation risk and decreases rivals’ costs of inventing around the patent. These drawbacks may reduce the
incentive to participate in the market for ideas in general, while providing the incentive to engage in transac-
tions sooner, conditioned on participation. However, as noted before, only a very small percentage of patent
applications opt out of 18-month publication even if the patentees could choose to delay publication until
grant (about 50 percent of all US applications do not file for foreign protection). This suggests that the private
benefits of disclosure outweigh its costs for a majority of patentees who have such a choice,
In the following, we develop a simple framework that considers these benefits and costs of public disclo-
sure to understand AIPA’s effects on inventors’ decisions about when to license their inventions.
2.3 AIPA and the timing of licensing
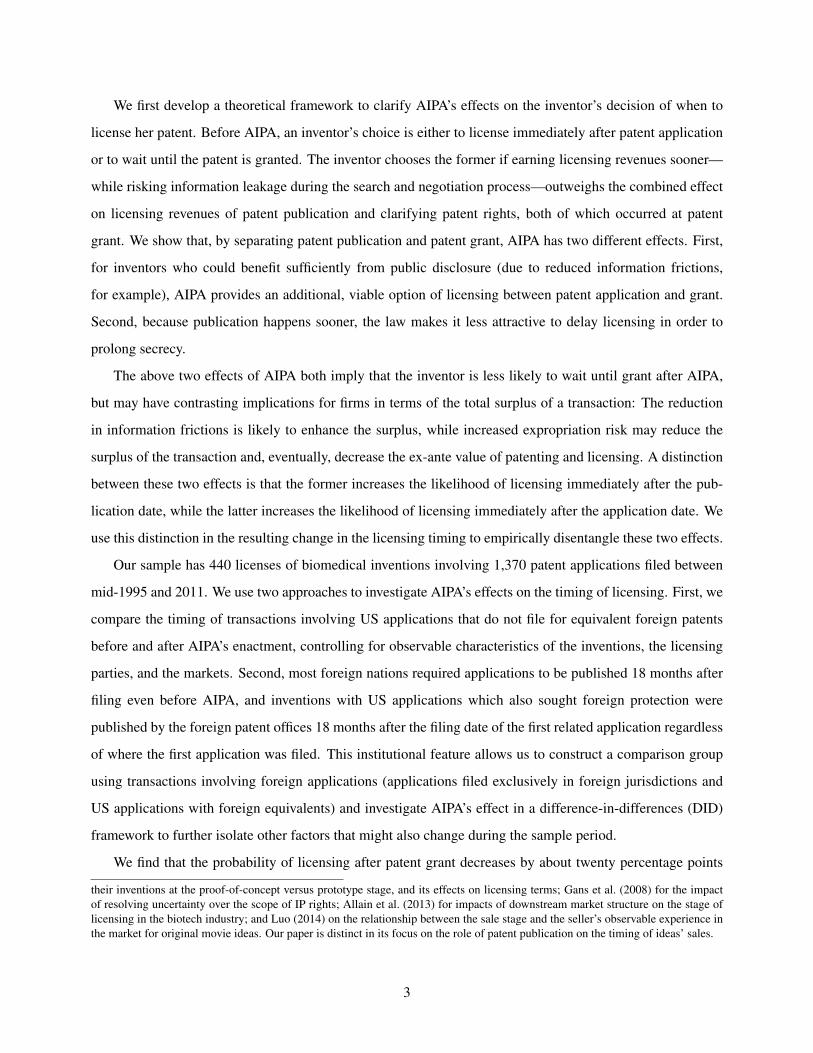
Figure 1 illustrates the sequence of events. Let Ta, Td , Tg, and T denote, respectively, the dates for application,
publication, grant, and patent expiration. Before AIPA, Td = Tg and after AIPA, Td < Tg.7 In terms of the
timing of licensing, before AIPA, the inventor has two options: either license after the application date or wait
until the grant date; after AIPA, however, the inventor has the same two options and an additional one, which
is to license after the publication date. For simplicity, we do not consider transaction costs, such as the time
6Rosenberg (2002) suggests that inventors primarily use “patents as an advertisement for the sale of accompanying know-how.”Long (2002 p 625) argues that inventors acquire patents “to signal information about themselves that would be more expensive to dothrough other means.”
7It is possible that patents are issued before the eighteen-month disclosure date. We consider the more interesting case in the paperbecause AIPA would have no effect in such a scenario.
7

taken to negotiate with licensing partners. Thus, licensing happens immediately after a certain event.
Figure 1: Patenting events before and after AIPA
Patent Application ExpiryGrant & Publication
20 years
Before AIPA (applications filed before November 29, 2000)
After AIPA (applications filed after November 29, 2000)
ExpiryPublicationPatent Application Grant
20 years
In deciding when to license, the seller faces tradeoffs. Licensing early yields revenues for a longer period,
which is important because of limited patent life. However, market frictions may lead some inventors to
delay licensing. For example, though the expectation of receiving legal protection may encourage voluntary
disclosure before patent grant, to avoid being paid at the average valuation, inventors who expect stronger and
broader patents may still want to wait until the uncertainty over the scope of their IP rights is resolved. As
discussed in the previous section, public disclosure through publication may help to credibly convey private
information and to broaden the scope of collaborative opportunities.
We use the following reduced-form parameters to represent the above tradeoffs. Let the per-period base-
line licensing revenue be v, which is the average revenue that the licensor obtains given the observable char-
acteristics, including the fact that the invention is licensed before both events.8 Let d be the effect of public
disclosure on the per-period revenue if the licensor waits until the publication event, and g be the effect of
clarifying IP rights if the licensor waits until the grant event. Note that these effects are deviations from the
average revenue v and, thus, can be positive or negative.
Disclosure is often accompanied by expropriation risk. For example, a potential licensee may obtain
enough information to come up with a successful substitute for the invention. Let the probability of inventing
around be ρ < 1 if the inventor chooses to voluntarily disclose before publication during the process of
searching and negotiating with potential licensees. Let the probability be 1 after publication, which is a
simple way of reflecting a higher expropriation risk of public disclosure. Let ∆ be the expected loss to the
8In a similar setup, Luo (2014) shows that a unique separating equilibrium exists such that better ideas are sold at a later stage. Thebuyer, knowing the seller’s decision threshold, evaluates an idea that is offered for sale at an early stage at the conditional expectedvalue of all possible values below this threshold.
8

inventor in each period, given expropriation.
Refer to Appendix A in the Online Supplementary Appendix for the inventor’s payoffs from licensing at
different times under different disclosure regimes, as well as for the resulting decision rules. Note that we do
not consider the choice between licensing and other outside options. We discuss the potential effects of AIPA
on the overall incentive to license (or to patent in the first place) after reporting the results.
2.4 Empirical implications
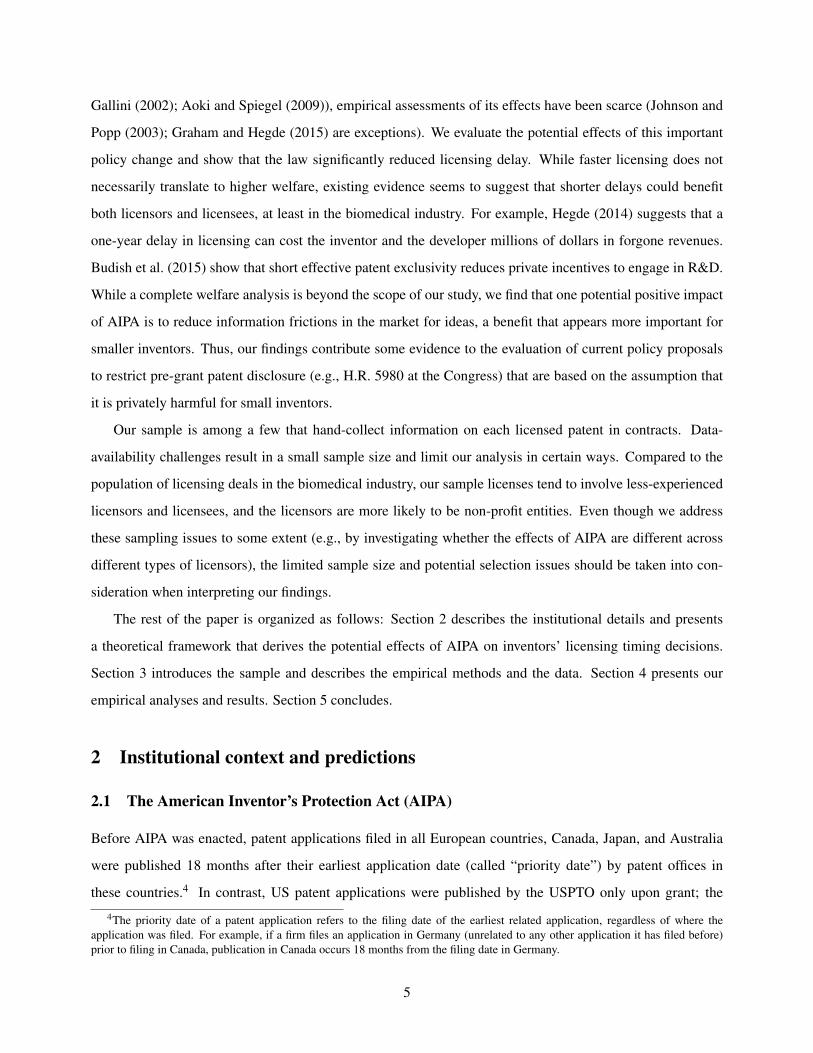
Figure 2 illustrates the decision rules as a function of the effect of public disclosure, d, and the effect of
clarifying IP rights, g. Figure 2a shows that, before AIPA, the inventor licenses the invention immediately after
the application date if the net benefit from earning licensing revenues before grant—while risking information
leakage through the search and negotiation process—is greater than the combined net effect from public
disclosure and the clarification of patent rights for the rest of the protection period—i.e., when vTg −ρ∆Tg >
(d +g)(T −Tg). Otherwise, she waits until patent grant.
Figure 2: Decision rules on licensing timing before and after AIPA
(a) Before AIPA
Grant
Applica,on
d
g
d =vTg − ρ∆Tg
T − Tg− g
(b) After AIPA
Grant
Applica,on
d
g
d =T − Tg
Tg − Tdg − v
Publica,on
d =vTg − ρ∆Tg
T − Tg− g
d =vTg − ρ∆Td
T − Tg− g
d =vTd − ρ∆Td
T − Td
The solid lines in Figure 2b denote the decision rule after AIPA, and the dashed line replicates the decision
rule before AIPA. Comparing the solid and dashed lines shows that AIPA has two effects. First, when publi-
cation conveys benefits beyond what can be achieved through voluntary disclosure (that is, there is a sufficient
density of transactions characterized with high values of d), some inventors who would have waited until the
grant date before AIPA would want to expedite licensing to the publication date as long as the effect of clari-
fying IP rights is relatively low; and some other inventors who would have licensed out their inventions after
the application date before AIPA would want to delay licensing till publication to enjoy its benefits. Second,
9
licensing soon after application is associated with a smaller loss after AIPA than before because the invention
is disclosed to the public at an earlier date with pre-grant publication. The increased expropriation risk makes
some inventors who would have waited until the grant date before AIPA to expedite licensing towards the
application date.
Figure 2b shows that the two effects described above reduce inventors’ incentive to wait until the patent
is granted; that is:
Prediction 1 (likelihood of licensing after grant). Other things being equal, the likelihood of licensing after
the patent grant date decreases after AIPA.
The implications of these two effects for firms can be quite different. Reducing information frictions is
likely to be associated with an increase in the total surplus of a transaction, while the increased expropriation
risk may result in a loss and, eventually, reduce the ex-ante value of licensing and patenting. It is beyond
the scope of this paper to quantitatively compare these two effects. Our goal is more modest: We want to
investigate whether public disclosure brings significant benefits to the licensing parties beyond those of the
voluntary disclosure that had always been available before AIPA. Even though both effects reduce licensing
after grant, the effect from increased expropriation risk pushes licensing towards the application date, while
the effect from reducing informational frictions pushes licensing towards the publication date. Therefore, if
we find that, after AIPA, the likelihood of licensing shortly after 18 months significantly increases, we can
reject the null hypothesis that publication does not bring significant benefits to licensing parties beyond the
voluntary-disclosure regime.9
Prediction 2 (likelihood of licensing after 18 months). If public disclosure benefits inventors, the likelihood
of licensing after 18 months increases after AIPA.
Figure 2b shows that the combination of the two effects discussed above makes AIPA’s effect on the prob-
ability of licensing immediately after the application date ambiguous: It depends on the number of inventions
that are now licensed at publication date rather than application date versus those that are licensed at applica-
tion date rather than at grant. However, if expropriation concerns were small in the market (that is, when ρ∆
is negligible), AIPA would result in little change in the relative downside of licensing before information is
disclosed to the public. Then, the likelihood of licensing immediately after the application date would only
drop after AIPA.
9We may also not find a significant 18-month effect when the publication and the grant dates are sufficiently close. In the data,the average gap between these two dates is a non-trivial 24 months, which amounts to ten percent of the patent term.
10

Finally, we examine the effect of AIPA on the average licensing lag (that is, the difference between the
application date and the license date). Because some inventions are licensed earlier and others later, the overall
effect of AIPA on the licensing lag is also ex-ante indeterminate.
3 Sample, methods, and variables
3.1 Sample construction
Publicly traded companies in the US are required by the Securities and Exchange Commission (SEC) to make
their material transactions public. These transactions are filed by the companies along with their quarterly
and annual reports at the SEC, which in turn publishes the filings on its Electronic Data Gathering, Analysis,
and Retrieval (EDGAR) website. In addition, several state governments require privately-held companies
with employee stock options to publish their material transactions. The license agreements in our sample
are drawn from these disclosures. We obtained the complete texts of the agreements from Deloitte Recap’s
RecapIP, a proprietary product that collates information on agreements in the biopharmaceutical industry.10
We supplemented RecapIP’s data with data from our own search of the SEC’s EDGAR database, which
yielded information on a small number of additional licenses in the medical instruments industry.
We finalized our sample after imposing the following criteria. First, because we focus on licensing agree-
ments, we excluded agreements that governed mainly manufacturing, marketing, supply, distribution, joint
ventures, post-litigation settlements and other activities.11 Second, a license agreement between two parties
may be followed by renegotiations and revisions to the original agreement. Because we are interested in
the initiation of licensing agreements, we discarded agreements that were amendments of original licenses.
Third, we retained those agreements that involved the licensing of at least one identifiable non-provisional
patent application or granted patent (filed either in the US or in a foreign country), thus excluding contracts
in which the identity of the patents was redacted. Because our primary data sources under-sample agree-
ments that involve privately-held companies, foreign companies, and other entities not bound by the SEC’s
reporting requirements, our sample licenses are based mostly on patents filed in the US either with or without
foreign equivalent applications (together, constituting 87.9 percent of the licenses), followed by patents filed
at the World Intellectual Property Organization (Patent Cooperation Treaty applications; 6.1 percent), Euro-
pean Patent Office (2.5 percent), Japan (1.8 percent), Australia (one percent), and Great Britain (less than one
10A number of studies have used Recap data, including Lerner and Merges (1998); Lerner and Malmendier (2010); Wakeman(2012); Allain et al. (2013). Lerner and Merges (1998) describe the database in detail.
11We later use these non-licensing agreements (1) to check whether their frequency over time differs from that of licensing agree-ments, and (2) as an alternative comparison group in a difference-in-differences type of analysis.
11

percent).
We perused each agreement in our sample and assembled information on the following three dates.
(i) License agreement date: This is the date on which the licensor and licensee officially commence their
partnership. The licensee earns the right to use the licensor’s patents, typically in return for an upfront fee, on
or around the agreement date.
(ii) Patent application date: We gathered the identities of every patent and patent application specified in
each contract in our sample. We then matched the patents to the USPTO’s database (for US applications and
patents) and the European Patent Office’s EPSTAT database (which provides information on patent applica-
tions filed at the EPO and at other patent offices across the world) and identified the important dates associated
with each patent. The first application date associated with a patent, the “priority date,” may be different from
the application date found on the cover page of patents because applications can have “parents” (these par-
ent applications are typically abandoned when related applications, or “children,” emerge through procedures
such as continuations, divisionals, and continuations-in-part). Since AIPA’s provisions specify publication 18
months after the priority date, we use the priority date as the actual application date (and, henceforth, use
the term “application date” to refer to the priority date). When the agreements license more than one unique
patent (patents are considered unique if they do not claim the same subject matter in filings across different
countries), we use the application date of the earliest patent application in the license.
(iii) Patent grant date: “Patent grant date” here refers to the day on which a patent office notifies the
applicant of the allowance of her patent and typically precedes the administrative grant date reported on the
cover page of patents by three to four months. Since notification resolves uncertainty about the fate and scope
of pending patent applications, we use this date rather than the administrative grant date in our analysis (and,
henceforth, refer to the allowance notification date as the grant date). For licenses with more than one unique
patent, we use the earliest grant date to characterize the agreement.
A law change stipulated that US patents’ duration is to be 20 years from the application date rather than 17
years from the grant date for applications filed after June 8, 1995. This change may have affected patentees’
licensing timing decision, and we exclude licenses with their earliest US patent applications filed before June
8, 1995 to avoid conflating the effects of AIPA with the effects of this prior patent law change. Thus, our
final sample has 440 licenses, which licensed patent applications filed between mid-1995 and 2011. Eighty
licenses (18.2 percent) specified patent applications without any granted patent (some of these applications
were abandoned and the rest were pending as of end-2013).
12
3.2 Sample selection
Because we have a longer time window to observe licensing events for patent applications in the earlier years,
patents that take longer to be licensed may be underrepresented in the later years of our sample. For the
before-and-after specifications, this truncation could lead us to incorrectly infer that licensing lags are shorter
after AIPA, though it is less of a concern for DID specifications. We address this potential bias by including
specifications that use only licenses based on patents with application dates before Dec 31, 2007 and that were
licensed within six years from the application date (the 72-month sample).12
Patents in our sample are substantially more valuable than an average US patent in the biomedical industry.
In particular, compared to all biomedical patents filed in the US between 1995 and 2010, the US patents in
our sample have, on average, a significantly higher number of forward citations (2.9 vs. 1.2), a higher number
of claims (24.8 vs. 18.8), and a higher number of backward references to non-patent (scientific) literature (6.1
vs. 4.4), and they are issued more quickly (40.2 vs. 45 months). This is not surprising given that valuable
patents are likely to be licensed.
Without good data on whether or not a given patent is licensed or not, we cannot evaluate the effects
of pre-grant publication on the decision of licensing (we discuss this again later in Section 4.4); nor can we
assess how our sample patents compare to the population of patents that are licensed. We can, however, have
a sense of how the licensing parties in our sample compare to all the licensing agreements captured by the
RecapIP database during the same time period. RecapIP is known for its comprehensive coverage of deals
in this industry, a vast majority of which are captured from press releases rather than from SEC disclosed
contracts. These comparisons are summarized in Table 1.
First, the licenses in our sample were disclosed as material by one of the licensing parties (a publicly
listed firm in the US). Panel 1 in Table 1 shows that, compared to licensing agreements without disclosed
contracts, the licensors of licenses for which the contracts are available in the RecapIP database are not
statistically different in their prior licensing experience (as sellers) but are significantly more likely to be non-
profit organizations (such as universities, hospitals and other research institutes). This may be, in part, because
these organizations are more likely to license first to smaller biotech firms, which, in turn, further develop and
license the technologies to larger pharmaceutical companies; and smaller licensees are more likely to disclose
contracts because the deals are more likely to be material relative to their firm size. Consistent with this, the
licensees of licenses with disclosed contracts are significantly less experienced (as buyers).
Second, our sample includes only licenses for which the contracts are not redacted. Panel 2 in Table 1
12We chose 2007 as the cut-off year since most applications filed in this year were either granted or abandoned by end-2013, thelast year of our patent data.
13

shows that, among licenses with disclosed contracts, compared to redacted ones, the licensors of non-redacted
licenses have less prior licensing experience but are equally likely to be non-profit organizations, and the
licensees are also less experienced. Combining the two steps, it seems that our sample licenses tend to
capture less-experienced licensors and licensees and more likely to include technologies licensed out by non-
profit organizations (see Panel 3 of Table 1). We address these sample-selection issues to some extent by
investigating the heterogeneity in the effect of AIPA for different types of licensors. As we show later, the
effect of AIPA on the licensing likelihood shortly after 18 months is stronger for smaller licensors but less
salient for non-profit licensors. Thus, it is not obvious to assign the direction in which our sample bias may
affect the average results.
3.3 Empirical methods
Our empirical strategy exploits the feature that AIPA separates the patent publication date from the grant
date for US applications that are not filed abroad (about 50 percent of the applications filed at the USPTO
between 1995 and 2005 and issued by 2013). Because US applications without foreign equivalents filed
in 2000 took, on average, 43.1 months to be granted (and 42 months to be granted for applications filed
in 2005), there is a significant lag between publication and grant for the average post-AIPA application;
only about ten percent and six percent of the applications filed in 2000 and 2005, respectively, were granted
within 18 months.13 We first analyze licensing timing as a function of this before-and-after variation in the
timing of patent publication for US applications (without corresponding foreign applications), controlling for
characteristics of the inventions and the licensing parties, as well as for the technology classes and markets.
In addition to the before-and-after analysis, we leverage the institutional differences between the US and
the rest of the world to construct a control group that helps to further isolate AIPA’s effects. The control group
includes two types of licenses: (1) licenses of patent applications that are filed only in foreign countries;
and (2) licenses of US applications that are also filed in foreign countries. We believe that the licenses of
patents filed only abroad are better controls because AIPA did not alter their information environment. Prior
to AIPA, US applications with foreign equivalents were published 18 months after the priority date by the
foreign country in which they were filed. Publication in foreign countries is not the same as publication in the
US because of the lack of public records, prior to AIPA, that linked US patent applications to their foreign
country equivalents. The equivalent foreign patent applications may also have been published in foreign
languages, and many US based licensees may only search the USPTO’s patent databases due to resource
13US patent applications (without foreign equivalents) in the biomedical industry took longer to be approved. Average pendencywas 47.1 months and 47.6 months, respectively, in 2000 and 2005 (median pendency was 39.4 months and 48.5 months, respectively).Six percent of the applications in 2000 and four percent of the applications in 2005 were granted before 18 months from application.
14

and time constraints (see, e.g., a comprehensive discussion of these frictions in Ragusa (1992)). Thus, AIPA
may have had a subdued effect on the informational environment of such “international” patents. Combining
licenses based on foreign patents and international patents (US patents with foreign equivalents) provides
us with a sufficient number of observations in our control group for DID estimations. In the regressions,
we include a binary indicator to account for the differences between the two types of control licenses, and
in robustness checks, we also investigate whether the DID estimates of AIPA are sensitive to excluding US
patents with foreign equivalents from the control group.
We emphasize that, in addition to the limited sample size, the control group is also far from ideal. Even
though AIPA did not directly change the publication requirement for patents filed abroad, the US is an im-
portant patenting destination for many foreign firms. Thus, changes in disclosure policies in the US are likely
to have indirectly affected the timing of licensing of foreign patents through their effects on the overall infor-
mational environment and competition in the market for ideas. Due to the data and identification challenges
that studies of licensing face in general, we view different empirical approaches and robustness checks as
complementing each other, and the consistency in the results obtained across different specifications would
add confidence to our overall conclusions.
3.4 Variables
A. Dependent variables
Our analysis explains the timing of patent licensing with respect to the timing of three patenting-related
milestones: patent application, 18-month patent publication, and patent grant. To test Prediction 1, we con-
struct a binary variable that equals one if the licensing event occurs after patent grant. To test Prediction
2, we construct a categorical variable indicating whether the licensing event occurs in one of the following
three windows: (i) sooner than 18 months from the patent application date and before patent grant; (ii) after
18 months since patent application and before patent grant; and (iii) after patent grant. We also construct a
variable measuring the licensing lag, which is the number of months between the patent application date and
the license date.
Panel 1 in Table 2 shows that 17.7 percent of the sample licenses are negotiated before 18 months from
the earliest patent application, 23.6 percent between 18 months and earliest patent grant, and 58.6 percent
after grant. Table 3 shows that the average patent is licensed 48.2 months after application.
B. Independent variables
The variable of interest for the before-and-after specifications is the binary indicator, Post AIPA, which
15
equals one for licenses based on patent applications filed on or after November 29, 2000 (AIPA’s effective
date) and zero for applications filed before this date. For the DID specifications, we create a binary variable,
US patent, which equals one for licenses based on US patent applications without foreign equivalents (i.e.,
the treatment group) and zero for foreign applications and US applications with equivalent foreign applica-
tions. Thus, the interaction term between Post AIPA and US patent is our estimator of interest for the DID
specifications. We also include a binary indicator for US patents with foreign equivalent patents to account
for differences between these two types of control licenses. 22.5 percent of the 440 licenses belong to the
post-AIPA regime, and 52.7 percent of the licenses belong to the treatment group.
We construct control variables related to the characteristics of the license, licensed patents, transaction
parties, and the technological classes and markets (see Table 4 for the summary statistics).
The observed characteristics of the licensing parties include indicators for the licensor’s organizational
type (among the licensors, 68.6 percent are for-profit entities; the rest are non-profit entities); the licensing
parties’ experience levels; and the extent to which they deal with each other. We measure the licensor’s
experience as the number of deals captured by the RecapIP database (all types of deals, including those that
do not contain contracts or identifiable IP information) that the licensor has undertaken as a seller prior to the
focal agreement; the licensee’s experience as the number of deals that the licensee has made as a buyer prior
to the focal agreement; and the relational experience as the number of prior deals that the licensor and the
licensee have transacted before the focal agreement.
The observed characteristics of the license include information on whether or not the invention is licensed
exclusively to the inventor (60 percent of the licenses) and whether the license specifies the transfer of know-
how and, thus, requires ex-post involvement of the licensor in downstream development activities (88 percent
of the licenses).
Pendency is the time taken by the patent office to examine and allow patent applications, which is an
important control because longer pendency may incentivize sooner licensing. For patent applications that are
not yet granted, we use expected pendency, which is the average pendency for granted patents filed in the
same year and technology class. We control for the qualities of licensed patents by including three variables:
(i) three-year forward citations (since some of our post-AIPA patents are granted as late as 2013, we cannot
observe forward citations in a longer time window for a fraction of post-AIPA patents); (ii) the number of
claims; and (iii) the number of references to non-patent prior art. Data on these patent value measures are not
available for the foreign applications and patents in the control group14 or for ungranted applications in the
14EPSTAT, our datasource for information on foreign patents, does not provide readily usable data on these variables; foreignpatents in our sample are also from different countries, and institutional differences among the offices of these countries make itdifficult to compare cross-national data on these variables.
16

treatment group.
Finally, based on the technology class of the focal patent and information provided by RecapIP, we con-
trol for the technological field and the therapeutic market of the licensed invention in each license to capture
systematic differences in licensing strategies. Forty-seven percent of the licenses involve patents belonging to
the “Drugs” category, 13 percent to the “Surgery and Medical Instruments” category, and the rest to miscel-
laneous and unknown classes. We include a set of dummy variables indicating each of the top ten therapeutic
categories. We also create a continuous variable that measures the number of potential buyers based on ther-
apeutic areas. In particular, we count the number of unique companies that have been the licensee for at least
one deal in a particular therapeutic area two years before and two years after the agreement year. Similar to
the experience variables, this measure is constructed based on the complete RecapIP database, not just on our
analysis sample. The large sample mean is driven by the cancer category. For licenses with unknown thera-
peutic areas, we use a dummy variable indicating these licenses and replace the number of potential buyers
with zero.
3.5 Descriptive evidence
We focus on comparing licensing timing before and after AIPA for licenses based on US patents without
foreign equivalents (the treatment group). Prediction 1 states that the likelihood of licensing after patent grant
should decrease after AIPA. Figure 3a plots the density distribution of the difference between the licensing
date and the patent grant date in months. The distribution for pre-AIPA licenses appears similar to the one
presented in Figure 2 of Gans, Hsu, and Stern (2008), showing a jump in the density of licenses following
patent grant. Figure 3a shows that post-AIPA, a much smaller proportion of licenses occur after patent grant.
In fact, 56 percent of the pre-AIPA patent applications are licensed after grant, while, after AIPA, only 28
percent delay until grant (see Panel 2 in Table 2).
Prediction 2 states that if patent publication significantly benefits some inventors beyond voluntary dis-
closure, the likelihood of licensing after 18 months should increase after AIPA. Figure 3b plots the density
distribution of licensing lags (between licensing date and patent application date) for applications before and
after AIPA. Before AIPA, the density of licensing lags appears to be rather uniform from 10 to 50 months
after application and then decreases over time. In contrast, after AIPA, licensing appears to be concentrated
around two periods: (i) shortly after 18 months; and (ii) around 55 months after application date. The “bump”
shortly after the 18-month publication date is unique to the post-AIPA subsample and provides preliminary
evidence for the distinct effect of patent publication.
Figure 3c plots the survivor function of licensing for pre-AIPA and post-AIPA treatment-group patents.
17
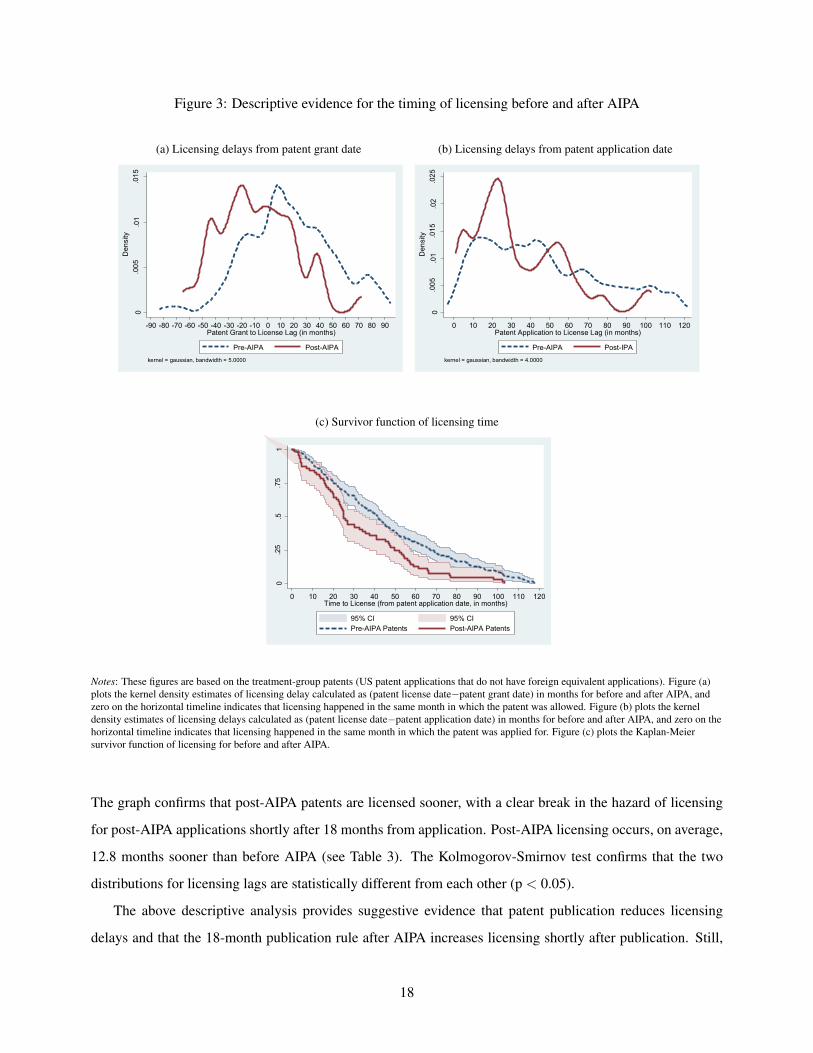
Figure 3: Descriptive evidence for the timing of licensing before and after AIPA
(a) Licensing delays from patent grant date0
.005
.01
.015
Den
sity
-90 -80 -70 -60 -50 -40 -30 -20 -10 0 10 20 30 40 50 60 70 80 90Patent Grant to License Lag (in months)
Pre-AIPA Post-AIPA
kernel = gaussian, bandwidth = 5.0000
(b) Licensing delays from patent application date
0.0
05.0
1.0
15.0
2.0
25D
ensi
ty
0 10 20 30 40 50 60 70 80 90 100 110 120Patent Application to License Lag (in months)
Pre-AIPA Post-IPA
kernel = gaussian, bandwidth = 4.0000
(c) Survivor function of licensing time
0.2
5.5
.75
1
0 10 20 30 40 50 60 70 80 90 100 110 120Time to License (from patent application date, in months)
95% CI 95% CIPre-AIPA Patents Post-AIPA Patents
Notes: These figures are based on the treatment-group patents (US patent applications that do not have foreign equivalent applications). Figure (a)plots the kernel density estimates of licensing delay calculated as (patent license date−patent grant date) in months for before and after AIPA, andzero on the horizontal timeline indicates that licensing happened in the same month in which the patent was allowed. Figure (b) plots the kerneldensity estimates of licensing delays calculated as (patent license date−patent application date) in months for before and after AIPA, and zero on thehorizontal timeline indicates that licensing happened in the same month in which the patent was applied for. Figure (c) plots the Kaplan-Meiersurvivor function of licensing for before and after AIPA.
The graph confirms that post-AIPA patents are licensed sooner, with a clear break in the hazard of licensing
for post-AIPA applications shortly after 18 months from application. Post-AIPA licensing occurs, on average,
12.8 months sooner than before AIPA (see Table 3). The Kolmogorov-Smirnov test confirms that the two
distributions for licensing lags are statistically different from each other (p < 0.05).
The above descriptive analysis provides suggestive evidence that patent publication reduces licensing
delays and that the 18-month publication rule after AIPA increases licensing shortly after publication. Still,
18

the observed patterns could be driven by other factors that may have changed over our study period. For
example, patent pendency—the time required to examine and grant patent applications—increased by nine
months for post-AIPA applications. In the following section, we estimate regressions that control for other
factors that might affect licensing timing and incorporate a number of robustness checks. We also complement
the before-and-after AIPA comparisons with DID specifications that use licenses involving foreign patents as
the control group.
4 Regression results
In this section, we first report the baseline results on AIPA’s effects on the timing of licensing and then on
whether these effects of AIPA are heterogeneous for different types of licensors and inventions. Finally, we
discuss the potential effects of AIPA on the overall rate of licensing and patenting.
4.1 Baseline results
A. AIPA’s effects on the likelihood of licensing after patent grant
Table 5 reports estimates obtained from a Probit regression (marginal effects), in which the dependent
variable equals one if licensing occurs after patent grant and zero otherwise. We report robust standard errors
clustered by therapeutic areas for all license-level regressions in the paper. Columns (1)-(3) report before-
and-after AIPA results using licenses involving only treatment-group patents (US patents without foreign
applications). Column (1) uses these licenses and controls for only the number of patents and patent pendency.
Column (2) uses licenses that take place within six years from application (the 72-month sample) in order to
minimize truncation biases caused by our longer period of observation for pre-AIPA patents to be licensed.
The specification used in Column (2) also brings in additional controls for the characteristics of the license
and the licensing parties, as well as for the market and technology categories. Column (3) further includes
the characteristics of the patents and, thus, uses only granted US patents. The estimated coefficients of Post
AIPA show that post-AIPA inventions are about 20 percentage points less likely to be licensed after grant than
pre-AIPA inventions (the effect is statistically significant at conventional levels).
Columns (4)-(5) in Table 5 present DID results using licenses in both the treatment and the control groups.
The control group includes licenses based on foreign patent applications only and US patent applications with
foreign equivalents. Although the DID strategy should account for truncation bias, we still report the DID
estimates using the 72-month sample in the last column as an additional robustness check. The coefficients
of the interaction term between Post AIPA and US patent are both negative and statistically significant. The
19

magnitudes are also comparable to those of the before-and-after estimates. These results are consistent with
Prediction 1 that after AIPA, inventors are less likely to wait until patent grant to license their inventions.
B. AIPA’s effects on the likelihood of licensing after (18-month) patent publication
Recall that our theoretical framework suggests that inventors are less likely to delay licensing until grant
for two reasons: Some want to expedite licensing to shortly after 18 months because they benefit sufficiently
from the reduction in informational frictions post-publication, and some may want to speed up licensing to
shortly after the application date because sooner (mandatory) publication lowers the relative downside of
information leakage during the search and negotiation process. We are particularly interested in whether the
18-month result is significant because it helps clarify whether public disclosure actively conveys informational
benefits beyond what can be achieved through voluntary disclosure. If the speedup in licensing is entirely
driven by relative expropriation concerns induced by sooner publication, the incentive to license and the value
of patenting may decrease in the long run.
We use two sets of regressions to examine the licensing likelihood in the two earlier licensing windows.
First, we use the multinomial logit (MNL) regression, in which the dependent variable equals one if licensing
takes place before 18 months from application; two if licensing takes place after 18 months but before patent
grant; and three if licensing takes place after grant (the reference outcome). A potentially restrictive assump-
tion of MNL models is Independence of Irrelevant Alternatives (IIA).15 Conceptually, the IIA assumption may
be violated because of the time dependence of licensing likelihood. For example, if licensing after the applica-
tion date is removed from the licensor’s option set, licensors may be disproportionally more likely to choose
licensing after the publication date than after the grant date because, other things being equal, the licensor
would prefer to license sooner. Empirically, the standard Hausman tests cannot reject the null hypothesis that
IIA is a reasonable assumption in our context.16
The second set of regressions essentially examines the density plot in Figure 3b more formally in a re-
gression framework. Specifically, we reorganize the license-level treatment sample into a month-level panel
dataset starting in the month in which the application was filed at the USPTO and ending in the month in
which the invention is licensed. Table 7 reports Probit regression results in which the dependent variable
equals one for the month in which it is licensed and zero otherwise. The variable Application window equals
15The literature has used both the MNL and the latent survivor time approaches to estimate competing risk models. The latentsurvivor model relies on an assumption that is essentially equivalent to the IIA assumption: conditional independence; that is, thelatent duration time for risk k is independent of the duration time for risk j, conditional on the controls. We replicate the MNLregressions using a latent survivor time model, which produce qualitatively similar results (not reported here).
16We use the Stata command ‘Hausman’ to test for the IIA assumption, and the test statistics cannot reject the assumption. Take thespecification in Column (2) in Table 6 for example. The p-value of the Hausman test statistics for excluding the option of licensingafter application is 0.97; and the p-value for removing the option of licensing between the publication and the grant dates is 1.00.
20

one for all months prior to 18 months from application and Publication window equals one for months after
18 months, but within 28, 30 or 32 months after application. The baseline window indicates months later
than 28, 30, or 32 months after application. For these regressions, the Publication window does not involve
publication for pre-AIPA applications and can, thus, be viewed as a placebo against which to compare the
post-AIPA applications. We include the number of months elapsed since application (in logarithm) to control
for the time dependence of the licensing likelihood. Because this data structure permits an adequate number
of observations for each licensor, we report robust standard errors clustered by licensor.
Table 6 presents MNL regression estimates expressed as relative risk ratios. As in Table 5, we report
the before-and-after estimates in the first three columns and the DID estimates in the last two. Across all
specifications, the results show a significant 18-month effect: relative to licensing after patent grant, post-
AIPA inventions are more than three times more likely to be licensed in the window between 18 months and
patent grant. Table 7 presents the Probit results from the panel-structured data. The estimated coefficients
of the interaction term, Publication window*Post AIPA, are also positive and significant across all specifi-
cations, suggesting that, relative to delaying licensing until later, post-AIPA inventions are more likely to be
licensed shortly after the publication date. Overall, both the raw data and the regression results from different
specifications show a significant 18-month effect.
The results on the relative likelihood of licensing after application (the earliest time window) are mixed.
The MNL results in Table 6 show that, relative to licensing after grant, post-AIPA inventions are also signif-
icantly more likely than pre-AIPA inventions to be licensed immediately after application.17 The estimated
coefficients of Application window*Post AIPA in Table 7 are close to zero. Neither specification, however,
shows a significant drop in this likelihood. This suggests that imitation concerns are important enough for
some inventors/inventions that sooner publication after AIPA makes it less worthwhile to prolong secrecy by
delaying the search and negotiation process of licensing.
C. AIPA’s effects on licensing delay
We estimate two sets of regressions to investigate AIPA’s effects on the magnitude of licensing delay.
Panel 1 in Table 8 reports the Tobit estimates, in which the dependent variable is the number of months
between the application and licensing dates. The before-and-after estimates in Column (2) and the DID
estimates in Column (4) show that post-AIPA inventions are licensed ten months sooner, on average, than
pre-AIPA inventions. The effect is economically large (and marginally significant): given that the average
17Note that, in Table 6, the DID estimates for the increase in the likelihood of licensing after application is much larger than thatobtained from the before-and-after regressions. The large estimate is likely to be caused by the fact that, for US patents with foreignequivalents (which are part of the control sample), there are actually no post-AIPA observations that fall into this licensing window.
21

licensing lag was 46 months before AIPA, the change implies a 22 to 24 percent reduction in the licensing
delay. Panel 2 in Table 8 reports the results from a Cox proportional hazard rate regression. The survival
analysis estimates a larger increase in the hazard rate of licensing after AIPA—more than 70 percent from the
corresponding two columns.
4.2 Robustness checks
Table 9 presents robustness checks using the DID specification reported in the fourth column of Tables 5, 6,
and 8. First, Panel 1 reports estimates obtained by restricting the sample to those licenses that specify only one
patent (sixty percent of our original sample). Second, 13 percent of the licenses in the original sample were
allowed within 18 months of patent application date. In principle, these patents, though enjoying a relatively
short examination period, may still be affected by AIPA in expectation because the short patent-grant delay is
realized only ex-post facto. Still, we exclude licenses with patents allowed within 18 months and report the
results in Panel 2. Third, Panel 3 reports the results excluding licenses that involve US patents with foreign
equivalents and, thus, the control group includes only licenses involving pure foreign patents.18
The estimated coefficients of the interaction terms between Post AIPA and US patent are consistent with
the baseline results on magnitude, even though the statistical significance is weaker in some specifications
(the p-values of the coefficients of interest are almost all below 0.2). We also conduct the same three sets of
robustness checks using the before-and-after specification reported in the second column of Tables 5, 6, and 8.
The results (not reported here to preserve space) are consistent with the baseline results and are statistically
significant. While some of the robustness results are noisy—likely due to an even smaller sample size—
the consistently large estimates of the estimated effects across different specifications and subsamples add
confidence to our baseline results.
4.3 Heterogeneous effects of AIPA
Different types of inventors or inventions may face different informational environments before AIPA and,
hence, may be affected differently by AIPA. In the following, we explore whether the effects of AIPA are
heterogeneous for different subsamples within our treatment group.
A. For-profit versus non-profit licensors18The RecapIP database also contains agreements of types that are less likely to be affected by AIPA, such as manufacturing,
marketing and distribution agreements. We also use these types of agreements that are based on US patents without foreign equivalentsas an alternative control group. The results (not reported here) are consistent with our baseline results on economic magnitude, butwith slightly weaker statistical significance.
22
We first compare the effects of AIPA for non-profit and for-profit organizations. 32 percent of the sample’s
licensors are non-profit organizations (universities, hospitals, and research institutes), and the rest are for-profit
entities (66 percent corporations and 2.2 percent individual inventors). Though likely different in a number
of dimensions, the knowledge underlying patents owned by non-profit licensors is more likely to be disclosed
in other venues before patent publication (e.g., through academic publications or conference presentations).
This difference suggests that AIPA should have a smaller effect for non-profit licensors because the change to
their informational environment due to AIPA is smaller.
Panel 1 in Table 10 reports the results including the interaction term between a dummy—indicating for-
profit organizations—and Post AIPA. Column (1) shows that, after AIPA, even though both are significantly
less likely to license after patent grant, the change is 16 percentage points greater for for-profit than for non-
profit licensors, though the difference is not significant. Column (2) shows that, relatively speaking, the 18-
month effect is significantly stronger for for-profit licensors. These results are consistent with our expectation
that for-profit organizations are more intensely treated than non-profit organizations. Furthermore, for-profit
licensors are intuitively more concerned than non-profit licensors about expropriation risks. Thus, finding
a stronger 18-month effect for for-profit licensors, despite their greater concern over expropriation, further
strengthens the evidence for AIPA’s positive impact in reducing information frictions.19
B. By firm experience
In the pre-AIPA regime, firms with a greater ability to credibly convey the value of their inventions and to
protect their inventions from expropriation, such as larger and more-experienced firms, may be less dependent
on patent grant to reduce market frictions. Thus, we expect AIPA to have a greater impact on less-experienced
firms. In the data, we use the licensor’s past number of deals as a seller prior to this particular deal as the
measure of the licensor’s size. Within the treatment group, 74 percent of the licensors have at least one deal
prior to the license, and the median is 3.5 before AIPA and four after AIPA. We define the licensor as less
experienced separately for the pre- and post-AIPA periods, if its past number of deals is less than or equal to
the respective median.
Panel 2 in Table 10 reports the results including the interaction term between a dummy, indicating less-
experienced licensors, and Post AIPA. Column (1) shows that, after AIPA, both are significantly less likely
to license after patent grant. The change is slightly greater for less-experienced than for more-experienced
licensors (five percentage points but not statistically significant). Column (2) shows that, relatively speaking,
19Columns (3) and (4) in Panel 1 of Table 10 show that both types of licensors have a shorter licensing lag after AIPA, but theestimates are not significantly different. This is not entirely surprising because the MNL results in Column (2) show that, relativelyspeaking, post-AIPA inventions by for-profit organizations are less likely to be licensed after application than those by non-profitorganizations, though the coefficient is not statistically significant.
23

the 18-month effect is significantly stronger for less-experienced licensors.
C. By measures of patent value
Before AIPA, because inventors of inventions with a higher ex-ante observable value suffer greater losses
from licensing delays, they would have a stronger incentive to license early despite market frictions. Thus,
AIPA may have a smaller impact for more-valuable inventions. However, inventors of inventions with a higher
ex-ante unobservable value may delay licensing in order not to be pooled with patents of lower value. Thus,
if controlling for the observable value, AIPA should have a greater effect on patents that protect inventions of
higher, ex-ante unobservable value. Since we are unable to effectively separate observable from unobservable
values, it is difficult to hypothesize the relationship between the effect of AIPA and typical measures of patent
importance.
Following the literature, we use the number of claims and the number of three-year forward citations to
measure patent value. We define a patent as high value if it has more claims or has received more citations
than the sample medians separately for the pre- and post-AIPA periods. We group a small number of patents
that are not granted as low-value patents. Panels 3 and 4 in Table 10 present the regression results including
the interaction terms between a dummy, indicating high-value patents, and Post AIPA. The results show that
the effects of AIPA on reducing the likelihood of licensing after grant, as well as the 18-month effect, are both
stronger for higher-valued patents. The differences, however, are not statistically significant.
4.4 AIPA and the incentive to license
Our analysis so far has not considered inventors’ choice between licensing and other modes of profiting from
their inventions. Theoretically, the effect of the pre-grant disclosure required by AIPA on the incentive to
license or even to patent is ambiguous. On the one hand, pre-grant disclosure implies a greater risk of inventing
around, which may make patenting and participating in the market for ideas less attractive (see, also, Aoki
and Spiegel (2009)). On the other hand, as previously discussed, 18-month patent publication may benefit
inventors beyond a voluntary-disclosure regime. Aoki and Prusa (1996) also show that pre-grant disclosure
could increase firms’ incentive to patent because it increases their profits by enabling them to coordinate
their R&D investments better. Without good data on inventors’ decisions of whether or not to license their
patents, we cannot empirically analyze the effects of pre-grant publication on the rate of licensing. Because
our sample has a greater number of licenses based on pre-AIPA patents than on post-AIPA patents (341 and
99, respectively), we discuss whether this reflects that the 18-month publication rule has a negative impact on
the overall rate of licensing.
24

First, recall that our analysis relies on agreements for which the actual contracts are disclosed. According
to RecapIP, the drop in the number of disclosed contracts in later years is due mainly to a sharp decline in the
number of publicly-listed firms (and, hence, the reported contracts) after the burst of the IPO-boom in 2000.
Figure A1 in the Online Supplementary Appendix reveals that the decline in licensed patents starts for patents
filed in 1998. This is consistent with the decline in the disclosed contracts after the IPO bubble because
the average patent is licensed about 40 months after application. Furthermore, for licenses with disclosed
contracts and identifiable IP information, the same figure shows that the number of licenses in the treatment
group exhibits a time trend similar to that of the control licenses that involve any type of foreign patents and to
that of an alternative comparison group including other types of patent-based transactions, such as marketing
and manufacturing contracts. Thus, there seems to be no evidence suggesting that the enactment of AIPA
caused the drop in the number of licenses observed in our sample.
Second, there also appears to be no evidence that the rate of patenting drops.20 Apart from potential
benefits from publication, AIPA also allows inventors to collect royalties from infringers starting from the
publication date. This provisional right may compensate inventors for potential losses due to leakages asso-
ciated with early publication.21 Recall that AIPA also created an opt-out provision that allows patentees who
agree to forgo equivalent foreign patenting to delay publication until grant. The overwhelming preference
for publication, versus opting-out, and the absence of a decline in US patenting after AIPA, documented by
Graham and Hegde (2015) suggest that pre-grant disclosure does not seem to harm the majority of patentees.
5 Concluding thoughts
Previous studies have focused on the role of patent rights in resolving the problem of information asymmetry
bundled with expropriation risk and, thus, facilitating transactions in the market for ideas. Here, we study the
effects of a hitherto understudied function of the patent system—the publication of patent applications—on
transactions in the market for ideas. We leverage an important policy change that required US patent applica-
tions filed beginning on November 29, 2000 to be published 18 months after application date rather than after
20Putnam (1997); Tepperman (2002) investigate the effects of Canada’s 1989 Patent Act reform, which switched from a confidentialfiling system with a first-to-invent priority rule to a pre-grant publication system with a first-to-file priority rule. They find oppositeresults of the reform on the value of patenting and R&D incentives. These studies do not separate out the effects of pre-grantpublication from the effects of switching to first-to-file from first-to-invent.
21We have argued that the provisional right created by AIPA is a natural consequence of the verifiability of invention disclosuresmade possible through patent publication. We attempt to theoretically understand the distinct effects of provisional rights on thetiming of licensing by adding enforcement to our framework (see Appendix A2 in Online Supplementary Appendix). We find that,in this simple framework at least, the legal right to recoup royalties from the publication date does not affect the timing of licensing.This is because, in the post-AIPA regime, the ability to enforce patent rights starting from the publication date affects the payoffsfrom licensing in the same way for all timing options; thus, the effects cancel each other out.
25

grant. Thus, AIPA separated the timing of the disclosure of ideas embedded in patent applications from the
certification of inventors’ property rights over the idea. We develop a simple framework that incorporates the
benefits and risks of public disclosure and helps predict the effects of AIPA on the timing of licensing. We then
assess these predictions using a sample of licensing agreements of high-value inventions in the biomedical
industry.
We find that post-AIPA patent applications are about 20 percentage points less likely than pre-AIPA in-
ventions to wait until patent grant to be licensed. We also consistently find a significant 18-month publication
effect: The likelihood of licensing jumps up significantly after publication for post-AIPA inventions. Overall,
post-AIPA inventions, on average, are licensed ten months earlier than pre-AIPA inventions. The shortening
of the licensing lag is economically significant, representing a 20-percent decrease in licensing delay.22
This significant 18-month effect persists across different specifications and suggests that invention dis-
closure through patent publication benefits at least some inventors beyond what other disclosure mechanisms
can achieve. We propose that by providing more information and greater transparency to the market, public
disclosure through a centralized, standardized and verifiable repository (such as those used by national patent
offices) helps sellers establish the credibility of their ideas and augment potential licensing opportunities.
These findings represent a first step towards a deeper understanding of the mechanisms through which parties
search and discover each other and how they evaluate ideas, as well as the enabling role of centrally regulated
information disclosure mechanisms in this process.
By evaluating the short-term effects of AIPA and patent publication on the market for ideas, our analysis
merely scratches the surface of the effects of public disclosure of inventions. In order to gauge the long-
term effects of AIPA, future research should investigate the effects of the policy change on outcomes such
as knowledge spillovers, the rate of knowledge diffusion, and the duplication of R&D investments. Such
investigations could uncover the effects of public disclosure on the rate and direction of follow-on innovation
and enable us to better inform disclosure-related strategies and public policy.
References
Allain, M.-L., E. Henry, and M. Kyle (2013). Competition and the efficiency of markets for technology. IDEIWorking Papers 784.
Anton, J. J. and D. A. Yao (1994). Expropriation and inventions: Appropriable rents in the absence of propertyrights. The American Economic Review 84(1), 190–209.
22Our findings also contrast those in a recent working paper by de Rassenfosse et al. (2013), who find no difference in the probabil-ity of licensing for inventions covered by pending Australian patent applications and those without patent applications and interpretthis as the absence of a disclosure effect.
26

Anton, J. J. and D. A. Yao (2002). The sale of ideas: Strategic disclosure, property rights, and contracting.Review of Economic Studies 69, 513–31.
Aoki, R. and T. Prusa (1996). Product development and the timing of information disclosure under u.s. andjapanese patent systems. Journal of the Japanese and International Economies 10, 233–249.
Aoki, R. and Y. Spiegel (2009). Pre-grant patent pulication and cumulative innovations. International Journalof Industrial Organization 27, 333–345.
Arora, A. (1995). Licensing tacit knowledge: Intellectual property rights and the market for know-how.Economics of Innovation and New Technology 4, 41–60.
Arora, A., A. Fosfuri, and A. Gambardella (2001). Markets for Technology: The Economics of Innovationand Corporate Strategy. MIT Press, Cambridge, Mass.
Arora, A. and A. Gambardella (2010). Ideas for rent: an overview of markets for technology. Industrial andCorporate Change 19(3), 775–803.
Arrow, K. (1962). Economic welfare and the allocation of resources for invention. In R. Nelson (Ed.), TheRate and Direction of Inventive Activity: Economic and Social Factors. Princeton University Press.
Bessen, J. E. (2005). Patents and the diffusion of technical information. Economics Letters 86, 121–28.
Bhattacharya, S. and J. R. Ritter (1983). Innovation and communication: Signalling with partial disclosure.Review of Economic Studies 50, 331–346.
Budish, E., B. Roin, and H. Williams (2015). Do firms underinvest in long-term research? evidence fromcancer clinical trials. American Economic Review 105, 2044–2085.
de Rassenfosse, G., A. Palangkaraya, and E. Webster (2013). Do patents shield disclosure or assure exclusivitywhen transacting technology? Intellectual Property Research Institute of Australia Working Paper No. 1/13.
Elfenbein, D. W. (2007). Publications, patents, and the market for university inventions. Journal of EconomicBehavior & Organization 63(4), 688–715.
Gallini, N. T. (2002). The economics of patents: Lessons from recent u.s. patent reform. Journal of EconomicPerspectives 16, 131–154.
Gallini, N. T. and B. D. Wright (1990). Technology transfer under asymmetric information. RAND Journalof Economic 21(1), 147–160.
Gans, J. S., D. H. Hsu, and S. Stern (2008). The impact of uncertain intellectual property rights on the marketfor ideas: Evidence from patent grant delays. Management Science 54, 982–997.
Gans, J. S. and S. Stern (2003). The product market and the market for ideas: Commercialization strategiesfor technology entrepreneurs. Research Policy 32(2), 333–350.
Graham, S. and D. Hegde (2015). Disclosing patents’ secrets. Science 347(6219), 236–237.
Hegde, D. (2014). Tacit knowledge and the structure of patent licenses: evidence from the biomedical industry.Journal of Economics & Management Strategy 23, 568–600.
Hellmann, T. (2007). Entrepreneurs and the process of obtaining resources. Journal of Economics andManagement Strategy 16(1), 81–109.
27

Jensen, R. A. and M. C. Thursby (2001). Proofs and prototypes for sale: The licensing of university inventions.American Economic Review 91, 240–259.
Johnson, D. and D. Popp (2003). Forced out of the closet: the impact of the american inventor’s protectionact on the timing of patent disclosure. Rand Journal of Economics 34, 96–112.
Lamoreaux, N. R. and K. L. Sokoloff (1996). Long-term change in the organization of inventive activity.Proceedings of the National Academy of Sciences 93, 12686–92.
Lamoreaux, N. R. and K. L. Sokoloff (2002). Intermediaries in the u.s. market for technology, 1870-1920.NBER Working Paper no. W9017.
Lerner, J. and U. Malmendier (2010). Contractibility and the design of research agreements. AmericanEconomic Review 100, 214–246.
Lerner, J. and R. P. Merges (1998). The control of strategic alliances: An empirical analysis of biotechnologycollaborations. Journal of Industrial Organization 46(2), 125–156.
Long, C. (2002). Patent signals. The University of Chicago Law Review 69, 625–679.
Luo, H. (2014). When to sell your idea: Theory and evidence from the movie industry. Managment Science 60,3067–3086.
Merges, R, P. (2005). A transactional view of property rights. Berkeley Technology Law Journal 20, 1477–1520.
Modigliani, F. and et al. (1999). An open letter to the u.s. senate. available athttp://www.eagleforum.org/patent/nobel letter.html.
Putnam, J. (1997). The value of international patent rights. Mimeo, Charles River Associates.
Ragusa, P. A. (1992). Eighteen months to publication: Should the united states join europe and japan bypromptly publishing patent applications? The George Washington Journal of International Law and Eco-nomics 26, 143–180.
Rosenberg, P. (2002). Patent Law Fundamentals. The Clark Boardman intellectual property library, C.Boardman. 2nd edition.
Teece, D. J. (1986). Profiting from technological innovation: Implications for integration, collaboration,licensing and public policy. Research Policy 15(6), 285–305.
Tepperman, A. (2002). Do priority and disclosure rules matter? canadian evidence from the 1989 patentreforms. Mimeo, Charles River Associates.
Wakeman, S. (2012). How does obtaning intellectual property rights impact technology commercializationstrategy for start-up innovators? reconciling the effects on licensing and financing. Working paper.
28

Tables
Table 1: Sample licenses compared to licensing agreements in the RecapIP database
N Licensor’s prior experience For-profit Licensee’s prior experienceMean Median licensor Mean Median
Panel 1: All licensing agreements, by whether the contract is availableContract not available 5974 13.9 5 0.80 31.2 4Contract available 1473 13.3 6 0.68 20.4 3(p-value) (0.34) (0.16) (0.00) (0.00) (0.00)
Panel 2: When contracts are available, by whether the contract is redactedNon-redacted 440 10.4 3 0.69 24.2 3Redacted 1033 14.5 7 0.68 29.4 4(p-value) (0.00) (0.00) (0.82) (0.09) (0.08)
Panel 3: Our sample compared to all licensing agreementsOur sample 440 10.4 3 0.69 24.2 3All licensing agreements 7447 13.8 5 0.77 29.1 4(p-value) (0.00) (0.00) (0.00) (0.10) (0.10)
Notes: Our sample captures licensing agreements for which (1) the contracts are available and (2) the contracts are not redacted. This tablesummarizes how the characteristics of the licensing parties compare due to each of the data-availability issues. For all licensing agreements in theRecapIP database between 1995 and 2013, Panel 1 compares licenses for which the contracts are available to licenses for which the contracts are notavailable. Within licenses with contracts, Panel 2 compares redacted to non-redacted contracts. Finally, panel 3 compares our sample to all licensingagreements.
Table 2: Licensing windows before and after AIPA
Full Sample Pre-AIPA Post-AIPAPanel 1: U.S. and foreign patents (N=440)
License before 18 months from application 17.70% 17.00% 20.20%License b/w 18 months from application & grant 23.60% 17.60% 44.40%License after patent grant 58.60% 65.40% 35.30%
Panel 2: U.S. patents without foreign equivalents (N=232)License before 18 months from application 23.30% 22.00% 26.60%License b/w 18 months from application & grant 28.50% 22.00% 45.30%License after patent grant 48.30% 56.00% 28.10%
Panel 3: Foreign patents (N=53)License before 18 months from application 13.20% 13.30% 13.00%License b/w 18 months from application & grant 37.70% 30.00% 47.80%License after patent grant 49.10% 56.70% 39.10%
Panel 4: U.S. patents with foreign equivalents (N=155)License before 18 months from application 11.00% 11.90% 0.00%License b/w 18 months from application & grant 11.60% 9.80% 33.30%License after patent grant 77.40% 78.30% 66.70%
29

Table 3: Licensing lags before and after AIPA
Patent application to license lag(in months)
Full Sample Pre-AIPA Post-AIPAUS and foreign patents 48.2 50.7 39.6
[30.4] [30.8] [27.6]US patents without foreign equivalents 43 46.5 33.7
[30.0] [31.1] [24.9]Foreign patents 51.6 55.4 46.6
[29.8] [30.2] [29.2]US patents with foreign equivalents 54.8 54.6 57.5
[30.0] [30.2] [29.5]
Table 4: Summary statistics for control variables
Variables Non-missing Full Before Afterobservations sample AIPA AIPA
Licensing party characteristicsNumber of prior licensee deals 440 24.2 22.2 31.1Number of prior licensor deals 440 10.4 9.6 13.0Number of prior joint deals 440 0.2 0.2 0.3For-profit licensor 440 68.6% 68.6% 68.7%
License characteristicsExclusive license 440 60.2% 57.5% 69.7%Know-how transfer 440 88.6% 88.0% 90.9%Number of potential buyers 297 348.8 296.4 515.7
Patent characteristicsNumber of patent claims 333 24.8 25.1 23.5Number of patent citations 333 2.9 3.1 1.9Number of references to non-patent prior-art 333 6.1 6.0 6.4Patent pendency in months 440 40.2 38.2 47.2
Notes: The table reports summary statistics for the control variables used in the regressions. Observations are at the license level. For licenses withunknown therapeutic areas, we use a dummy variable indicating these licenses and replace the number of potential buyers with zero in theregressions. Technology categories and top therapeutic areas are not summarized here.
30

Table 5: Probit estimates of the probability of licensing after patent grant
SampleUS patents (without foreign equivalent) US and foreign patents
72-month 72-month sample 72-monthsample & granted patents sample
(1) (2) (3) (4) (5)Post AIPA -0.28 -0.25 -0.18 -0.13 -0.03
[0.06]** [0.10]** [0.11]+ [0.06]* [0.09]Post AIPA × US patent -0.21 -0.26
[0.07]** [0.10]**US patent 0.02 0.02
[0.05] [0.06]Number of patents 0.04 0.02 -0.02 0.02 0.02
[0.01]** [0.01]* [0.01] [0.01]* [0.01]+Pendency in months -0.00 -0.00 -0.02 -0.01 -0.01
[0.00] [0.00]** [0.00]** [0.00]** [0.00]**US patent with foreign equivalent 0.17 0.14
[0.06]** [0.07]+Number of prior licensee deals 0.00 0.00 0.00 0.00
[0.00] [0.00] [0.00] [0.00]Number of prior licensor deals 0.00 0.00 0.00 0.00
[0.00] [0.00] [0.00]* [0.00]Number of prior joint deals -0.01 0.03 -0.02 -0.01
[0.05] [0.05] [0.03] [0.04]For-profit licensor 0.11 -0.01 0.18 0.16
[0.07] [0.07] [0.03]** [0.04]**Knowhow transfer 0.16 0.34 0.04 0.09
[0.10]+ [0.07]** [0.06] [0.07]Exclusive license -0.10 -0.10 -0.05 -0.08
[0.08] [0.11] [0.04] [0.05]+Number of potential buyers 0.00 0.00 0.00 0.00
[0.00]** [0.00]** [0.00]** [0.00]**Potential buyers missing -0.24 -0.22 0.01 0.00
[0.14]+ [0.16] [0.07] [0.10]Number of scientific references 0.01
[0.01]Number of claims 0.00
[0.00]3-year citations 0.01
[0.01]Therapeutic area dummies N Y Y Y YTechnology category dummies N Y Y Y YObservations 232 183 129 440 332Pseudo R-squared 0.09 0.33 0.44 0.35 0.35Log likelihood -146 -82 -49 -193 -150
Notes: This table reports the Probit estimates (marginal effects) for licensing after patent grant. US patent equals one for licenses based on US patentapplications without foreign equivalents and zero otherwise. All models report robust standard errors clustered by therapeutic areas; ** p < 0.01, * p< 0.05, + p < 0.1.
31

Tabl
e6:
Mul
tinom
iall
ogit
estim
ates
ofth
ech
oice
oflic
ense
timin
gw
indo
w
Sam
ple
US
pate
nts
(with
outf
orei
gneq
uiva
lent
)U
San
dfo
reig
npa
tent
s72
-mon
th72
-mon
thsa
mpl
e72
-mon
thsa
mpl
e&
gran
ted
pate
nts
sam
ple
Lic
ensi
ngw
indo
wB
efor
eB
/w18
mos
.B
efor
eB
/w18
mos
.B
efor
eB
/w18
mos
.B
efor
eB
/w18
mos
.B
efor
eB
/w18
mos
.18
mos
.&
gran
t18
mos
.&
gran
t18
mos
.&
gran
t18
mos
.&
gran
t18
mos
.&
gran
t(1
)(2
)(3
)(4
)(5
)Po
stA
IPA
2.97
4.07
3.98
5.18
5.33
7.13
1.62
3.42
0.63
1.85
[1.1
6]**
[1.5
5]**
[3.9
8][2
.77]
**[9
.09]
[7.0
6]*
[0.9
0][1
.97]
*[0
.51]
[1.2
2]Po
stA
IPA×
US
pate
nt5.
913.
3310
.03
3.69
[6.1
7]+
[2.2
0]+
[10.
10]*
[2.7
5]+
US
pate
nt0.
690.
930.
711.
17[0
.39]
[0.4
6][0
.50]
[0.5
4]N
umbe
rofp
aten
ts0.
560.
890.
530.
970.
831.
600.
570.
960.
581.
00[0
.10]
**[0
.04]
**[0
.12]
**[0
.04]
[0.1
4][0
.17]
**[0
.09]
**[0
.03]
[0.1
0]**
[0.0
4]Pe
nden
cyin
mon
ths
0.99
1.01
1.02
1.04
1.13
1.19
1.02
1.05
1.05
1.07
[0.0
1]+
[0.0
1][0
.01]
[0.0
1]**
[0.0
4]**
[0.0
6]**
[0.0
1]**
[0.0
0]**
[0.0
1]**
[0.0
1]**
U.S
.pat
entw
ithfo
reig
neq
uiva
lent
0.28
0.29
0.32
0.42
[0.1
7]*
[0.1
6]*
[0.2
6][0
.24]
Num
bero
fpri
orlic
ense
ede
als
0.99
1.00
0.96
1.00
1.00
1.00
0.99
1.00
[0.0
1][0
.00]
[0.0
2]+
[0.0
1][0
.00]
[0.0
0][0
.01]
[0.0
0]N
umbe
rofp
rior
licen
sord
eals
0.97
0.99
0.99
0.95
0.97
0.98
0.98
0.99
[0.0
2][0
.01]
[0.0
3][0
.03]
*[0
.01]
**[0
.01]
[0.0
1]+
[0.0
1]N
umbe
rofp
rior
join
tdea
ls1.
450.
791.
740.
201.
311.
011.
250.
77[0
.65]
[0.2
6][0
.99]
[0.1
7]+
[0.3
5][0
.25]
[0.4
3][0
.24]
For-
profi
tlic
enso
r0.
550.
416.
630.
470.
270.
270.
320.
29[0
.31]
[0.3
0][6
.49]
+[0
.43]
[0.1
1]**
[0.0
8]**
[0.1
2]**
[0.1
2]**
Oth
erco
ntro
lsN
YY
YY
Obs
erva
tions
232
186
132
440
332
Pseu
doR
-squ
ared
0.1
0.31
0.52
0.33
0.33
Log
likel
ihoo
d-2
20-1
41-6
3-2
84-2
34
Not
es:T
his
tabl
ere
port
sth
eM
ultin
omia
llog
ites
timat
esfo
rthe
prob
abili
tyof
licen
sing
inea
chof
the
thre
em
utua
llyex
clus
ive
win
dow
s:(i
)bef
ore
18m
onth
sfr
om(t
hefir
st)p
aten
tapp
licat
ion;
(ii)
betw
een
18m
onth
san
dgr
ant;
and
(iii)
afte
rpat
entg
rant
(the
omitt
edba
seca
tego
ry).
Coe
ffici
ente
stim
ates
are
repo
rted
asR
elat
ive
Ris
kR
atio
s,w
ithre
fere
nce
toth
eba
seca
tego
ry.U
Spa
tent
equa
lson
efo
rlic
ense
sba
sed
onU
Spa
tent
appl
icat
ions
with
outf
orei
gneq
uiva
lent
san
dze
root
herw
ise.
The
cont
rolv
aria
bles
incl
uded
inea
chof
the
mod
els
(om
itted
inth
ein
tere
sts
ofsp
ace)
are
the
sam
eas
that
inTa
ble
5:O
ther
cont
rols
inC
olum
ns(2
)-(5
)(om
itted
inth
ein
tere
sts
ofsp
ace)
incl
ude
know
how
tran
sfer
,exc
lusi
velic
ense
,num
bero
fpot
entia
lbuy
ers,
pote
ntia
lbuy
ers
mis
sing
(dum
my)
,and
dum
mie
sfo
rto
pth
erap
eutic
area
san
dte
chno
logy
cate
gori
es,a
ndC
olum
n(3
)als
oin
clud
esnu
mbe
rofc
laim
s,3-
year
cita
tions
,and
num
bero
fsci
entifi
cre
fere
nces
.All
mod
els
repo
rtro
bust
stan
dard
erro
rscl
uste
red
byth
erap
eutic
area
s;**
p<
0.01
,*p<
0.05
,+p<
0.1.
32

Table 7: Probit estimates of the probability of licensing (panel-structured data)
Def. of the publication window 18-28 months 18-30 months 18-32 monthsSample 72-month 72-month 72-month
sample sample sample(1) (2) (3) (4) (5) (6)
Application window 0.00 -0.01 0.00 -0.01 0.00 -0.01[0.01] [0.01] [0.01] [0.01] [0.01] [0.01]
Publication window -0.01 -0.02 -0.01 -0.03 -0.01 -0.02[0.01]+ [0.01]** [0.01]+ [0.01]** [0.01]+ [0.01]**
Post AIPA × Application window 0.00 0.01 0.00 0.01 0.00 0.01[0.01] [0.01] [0.01] [0.01] [0.01] [0.01]
Post AIPA × Publication window 0.02 0.02 0.02 0.03 0.02 0.02[0.01]* [0.01]* [0.01]* [0.01]* [0.01]* [0.01]*
Post AIPA 0.02 0.01 0.02 0.01 0.02 0.01[0.00]** [0.01]+ [0.00]** [0.01]+ [0.00]** [0.01]+
log(Duration) 0.02 0.02 0.02 0.02 0.02 0.02[0.00]** [0.01]** [0.00]** [0.01]** [0.00]** [0.01]**
Other controls Y Y Y Y Y Y
Observations 9,961 6,043 9,961 6,043 9,961 6,043Pseudo R2 0.07 0.08 0.07 0.08 0.07 0.08Log likelihood -1014 -767 -1013 -767 -1014 -768
Notes: The table presents Probit estimates (marginal effects) for licensing probability using a panel-structured data, containing monthly observationsfor each license in the treatment-group (US patents without foreign equivalent) starting from the corresponding patent’s application date until licensedate. The dependent variable equals 1 if licensing happens in any given particular month, and 0 otherwise. “Application window” equals 1 if themonth is between patent application date and 18 months from application, 0 otherwise. “Publication window” equals 1 if the month is within 10, 12,or 14 months after 18-month publication; that is, 18 to 28, 30, or 32 months from application date. Other controls in all regressions (omitted in theinterests of space) include number of patents, pendency, number of prior licensee deals, number of prior licensor deals, number of prior joint deals,for-profit licensor, knowhow transfer, exclusive license, number of potential buyers, potential buyers missing (dummy), and dummies for toptherapeutic areas and technology classes. All models report robust standard errors clustered by licensor; ** p < 0.01, * p < 0.05, + p < 0.1.
33

Table 8: Licensing delay
(a) Tobit model
SampleUS patents (without foreign equivalent) US and foreign patents
72-month 72-month sample 72-monthsample & granted patents sample
(1) (2) (3) (4) (5)Post AIPA -16.13 -9.57 -12.77 -11.61 -1.69
[3.21]** [4.98]+ [6.49]* [7.83] [6.94]Post AIPA × US patent -11.06 -9.37
[6.19]+ [5.51]+US patent -0.60 -0.81
[3.19] [2.96]Number of patents 1.54 0.52 -0.04 0.99 0.94
[0.24]** [0.28]+ [0.23] [0.30]** [0.36]**Pendency in months 0.49 0.25 0.15 0.23 0.11
[0.07]** [0.06]** [0.07]* [0.04]** [0.04]**U.S. patent with foreign equivalent 7.27 2.43
[3.81]+ [3.56]Other controls N Y Y Y YObservations 232 186 132 440 332Pseudo R-squared 0.0253 0.0588 0.0725 0.0578 0.0336Log likelihood -901.6 -743.2 -478.6 -1770 -1546
(b) Cox hazard model
SampleUS patents (without foreign equivalent) US and foreign patents
72-month 72-month sample 72-monthsample & granted patents sample
(1) (2) (3) (4) (5)Post AIPA 1.77 2.06 2.74 1.95 1.28
[0.30]** [0.61]* [1.01]** [0.60]* [0.49]Post AIPA × US patent 1.73 1.75
[0.46]* [0.61]US patent 1.03 1.15
[0.16] [0.22]Number of patents 0.91 0.98 1.02 0.94 0.96
[0.02]** [0.02] [0.02] [0.02]* [0.03]Pendency in months 0.98 0.98 0.98 0.99 0.99
[0.00]** [0.00]** [0.01]** [0.00]** [0.00]**U.S. patent with foreign equivalent 0.74 0.94
[0.16] [0.20]Other controls N Y Y Y YObservations 232 186 132 440 332Pseudo R-squared 0.02 0.06 0.07 0.05 0.03Log likelihood -1012 -743 -479 -2135 -1546
Notes: Panel (a) reports the Tobit estimates for the licensing delay (the number of months between application and license date), and panel (b) reportsthe Cox hazard rate model estimates for the licensing delay (hazard ratios are reported). US patent equals one for licenses based on US patentapplications without foreign equivalents and zero otherwise. The control variables included in each of the models (omitted in the interests of space)are the same as that in Table 5: Other controls in Columns (2)-(5) include number of prior licensee deals, number of prior licensor deals, number ofprior joint deals, for-profit licensor, knowhow transfer, exclusive license, number of potential buyers, potential buyers missing (dummy), anddummies for top therapeutic areas and technology classes, and Column (3) also includes number of claims, 3-year citations, and number of scientificreferences. All models report robust standard errors clustered by therapeutic areas; ** p < 0.01, * p < 0.05, + p < 0.1.
34

Table 9: Robustness checks for baseline results
Model Probit MNL Tobit Cox
DVLicense Before B/w 18 mos. License License
after grant 18 mos. & grant lag(1) (2) (3) (4)
Panel 1: Single-patent licensesPost AIPA -0.12 1.83 3.29 -6.99 1.20
[0.08] [1.69] [2.13]+ [8.88] [0.42]Post AIPA × US patent -0.24 5.20 4.12 -9.66 2.80
[0.10]* [7.18] [3.35]+ [8.09] [1.05]**US patent 0.04 0.48 1.14 1.28 0.68
[0.09] [0.46] [0.81] [3.97] [0.12]*
Other controls Y Y Y YObservations 262 262 262 262Pseudo R2 0.34 0.33 0.05 0.05Log likelihood -120 -182 -1198 -1138
Panel 2: Excluding patents granted within 18 monthsPost AIPA -0.13 1.53 3.19 -11.98 1.49
[0.06]* [0.80] [1.77]* [7.27]+ [0.45]Post AIPA × US patent -0.22 6.16 3.43 -8.94 1.97
[0.08]** [6.52]+ [2.13]* [5.79] [0.54]*US patent -0.00 0.69 1.01 -1.18 0.95
[0.05] [0.38] [0.45] [3.32] [0.13]
Other controls Y Y Y YObservations 380 380 380 380Pseudo R2 0.33 0.31 0.06 0.06Log likelihood -177 -268 -1743 -1778
Panel 3: Excluding U.S. patents with foreign equivalents from the control groupPost AIPA -0.21 4.36 4.29 -13.46 1.62
[0.09]* [2.60]* [3.19]+ [8.60] [0.53]Post AIPA × US patent -0.14 1.76 2.55 -7.15 1.75
[0.09] [1.65] [1.72] [7.26] [0.54]+US patent -0.05 1.55 1.25 -4.37 1.15
[0.07] [1.00] [0.63] [4.03] [0.21]
Other controls Y Y Y YObservations 285 285 285 285Pseudo R2 0.33 0.32 0.06 0.06Log likelihood -133 -203 -1297 -1252
Notes: This table reports three sets of regressions for robustness checks. Other controls in all regressions (omitted in the interests of space) are thesame as that used in the fourth column in Tables 5, 6, and 8: They include number of patents, pendency, US patent with foreign equivalent, numberof prior licensee deals, number of prior licensor deals, number of prior joint deals, for-profit licensor, knowhow transfer, exclusive license, number ofpotential buyers, potential buyers missing (dummy), and dummies for top therapeutic areas and technology classes. US patent equals one for licensesbased on US patent applications without foreign equivalents and zero otherwise. All models report robust standard errors clustered by therapeuticareas; ** p < 0.01, * p < 0.05, + p < 0.1.
35

Table 10: Heterogenous results of AIPA
Model Probit MNL Tobit Cox
DVLicense Before B/w 18 mos. License License
after grant 18 mos. & grant lag(1) (2) (3) (4)
Panel 1: By licensor typePost AIPA -0.23 6.74 3.37 -19.75 3.31
[0.08]** [5.99]* [2.06]* [5.09]** [1.18]**Post AIPA × For-profit licensor -0.16 0.81 6.68 -3.83 0.91
[0.14] [0.79] [5.99]* [5.54] [0.32]For-profit licensor 0.15 0.70 0.23 6.38 0.73
[0.05]** [0.39] [0.09]** [4.43] [0.16]Pseudo R2 0.34 0.32 0.07 0.07Log likelihood -107 -165 -1044 -962
Panel 2: By licensor experiencePost AIPA -0.32 10.23 6.71 -23.97 3.74
[0.08]** [11.31]* [3.41]** [4.43]** [1.00]**Post AIPA × Low experience -0.05 0.63 2.96 3.60 0.75
[0.07] [0.75] [1.14]** [5.05] [0.17]Low experience 0.07 0.47 0.77 0.56 0.85
[0.06] [0.25] [0.39] [4.25] [0.14]Pseudo R2 0.34 0.33 0.07 0.07Log likelihood -107 -165 -1044 -962
Panel 3: By the number of claimsPost AIPA -0.30 7.58 9.18 -20.63 2.92
[0.10]** [7.33]* [5.79]** [6.59]** [0.89]**Post AIPA × High number of claims -0.06 0.71 1.94 -1.47 0.98
[0.14] [0.67] [1.81] [7.32] [0.37]High number of claims 0.17 0.59 0.20 7.00 0.65
[0.07]* [0.37] [0.10]** [4.98] [0.16]+Pseudo R2 0.36 0.33 0.07 0.07Log likelihood -103 -163 -1042 -959
Panel 4: By the number of citesPost AIPA -0.28 4.70 7.76 -16.97 2.49
[0.07]** [4.12]+ [3.02]** [4.80]** [0.61]**Post AIPA × High number of cites -0.13 3.02 2.85 -16.71 2.05
[0.17] [6.52] [2.91] [10.27] [1.11]High number of cites 0.16 0.31 0.38 6.92 0.72
[0.07]* [0.25] [0.21]+ [4.25] [0.13]+Pseudo R2 0.35 0.32 0.07 0.07Log likelihood -104 -165 -1041 -960
Other controls Y Y Y YObservations 232 232 232 232
Notes: The table presents four sets of regressions for the effects of AIPA on different types of inventors and inventions. Other controls in allregressions (omitted in the interests of space) are the same as that used in the second column in Tables 5, 6, and 8: They include number of patents,pendency, number of prior licensee deals, number of prior licensor deals, number of prior joint deals, for-profit licensor, knowhow transfer, exclusivelicense, number of potential buyers, potential buyers missing (dummy), and dummies for top therapeutic areas and technology classes. All modelsreport robust standard errors clustered by therapeutic areas; ** p < 0.01, * p < 0.05, + p < 0.1.
36