Embed Size (px)
Citation preview

Path Projection for User-Centered Static Analysis Tools
Khoo Yit Phang Jeffrey S. Foster Michael Hicks Vibha SazawalUniversity of Maryland, College Park
{khooyp,jfoster,mwh,vibha}@cs.umd.edu
AbstractThe research and industrial communities have made great strides indeveloping sophisticated defect detection tools based on static anal-ysis. However, to date most of the work in this area has focused ondeveloping novel static analysis algorithms, and neglected study ofother aspects of static analysis tools, in particular user interfaces. Inthis work, we present a novel user interface toolkit called Path Pro-jection that helps users visualize, navigate, and understand programpaths, a common component of many static analysis tools’ error re-ports. We performed a controlled user study to measure the benefitof Path Projection in triaging error reports from Locksmith, a datarace detection tool for C. We found that Path Projection improvedparticipants’ time to complete this task, without affecting accuracy,and that participants felt Path Projection was useful.
1. IntroductionThe research and industrial communities have made great strides inrecent years developing sophisticated defect detection tools basedon static analysis. Such tools have been used to find tens of thou-sands of bugs in real-world systems, including Linux [17, 16, 14],Microsoft productivity software [25, 30], and Java software [31],and in some cases have been used to verify the correctness of mis-sion critical systems [6, 13]. Large companies such as Microsoft,Google, eBay, and Goldman-Sachs are now integrating tools intotheir regular development processes [10, 27, 37], and companieslike Coverity [8] and Fortify [19], which provide defect detectiontools and services, have hundreds of customers.
Most research on defect detection tools has focused on design-ing new static analysis algorithms. We believe it is equally impor-tant to study the other aspects of static analysis tools. Indeed, Pin-cus states that “Actual analysis is only a small part of any programanalysis tool [used at Microsoft]. In PREfix, [it is] less than 10%of the ‘code mass’.” [33].
Generally speaking, static analysis tool users must perform twotasks: triage, deciding whether a report is a true or false positive,and remediation, fixing a true bug. An effective tool will assistthe engineer in performing these tasks. However, while many toolsprovide support for categorizing and managing error reports, mostprovide little assistance for determining whether a report is true orfalse, and if true, how to fix it.
To address this problem, we present a new user interface toolkitcalled Path Projection that helps users visualize, navigate, and un-derstand program paths—call stacks, control flow paths, or dataflow paths—which are a common component of many static anal-ysis tools’ error reports. Our toolkit accepts an XML error reportcontaining a set of paths, each consisting of a sequence of programstatements, and automatically produces a concise view of them inconjunction with the source code. Path Projection aims to help en-
0 Technical Report CS-TR-4919, Department of Computer Science, Univer-sity of Maryland, College Park, August 2008.
gineers understand error reports more easily, to improve the speedand accuracy of triage and remediation.
An underlying principle of Path Projection’s design is to keepthe path display as close to the original source code layout as pos-sible, since that is what the programmer is most familiar with. Tofollow this principle, we use three main techniques. We performfunction call inlining to textually insert the bodies of called func-tions just below the call site, which rearranges the source code inthe order of the path. We perform code folding to automaticallyhide potentially-irrelevant statements that are not involved in thepath. Finally, we show multiple paths side-by-side for easy com-parison. While other interfaces incorporate some of these features,we believe Path Projection’s combination and design of features isnovel.
We evaluated Path Projection’s utility by performing a con-trolled experiment in which users triaged reports produced byLocksmith, a static data race detection tool for C. When Lock-smith finds a potential data race, it produces an error report thatincludes a set of call stacks (the paths). Each call stack describesa concurrently-executing thread that contains an access involvedin the potential race. For Locksmith, the triaging task requires ex-amining each reported call stack to decide whether it is actuallyrealizable at run time, and then deciding whether there are at leasttwo realizable accesses that can execute in parallel.
To our knowledge, ours is the first work to empirically study auser interface for defect detection tools using sophisticated staticanalysis. While commercial vendors may study the utility of theirinterfaces internally, no results of such studies are publicly avail-able. Independent evaluation of commercial tools is also difficultbecause of the tools’ licensing, which often forbids disclosure ofinformation.
In our study, we measured users’ completion time and accu-racy in triaging Locksmith reports, comparing Path Projection toa “standard” viewer that we designed to include the textual errorreport along with commonly-used IDE features. Both interfaces in-cluded a checklist specialized to each error report that enumeratesthe sub-tasks needed to triage the report correctly. We did not re-quire that users propose actual fixes to the code, since even when abug is clear its proper fix may be hard to determine.
In our within-subjects study, each user participated in one ses-sion with one interface, and one session with the other interface.Half the participants started with Path Projection, and the otherhalf began with the standard viewer, to help factor out learningeffects. In each session, after some introductory material, the userwas asked to triage three error reports. At the end of the experiment,we asked users to qualitatively evaluate the interface and compareboth.
We found that Path Projection improved the time it takes totriage a bug, and participants using it made about the same numberof mistakes as with the standard viewer. Moreover, in Path Projec-tion users spent little time looking at the error report itself. Thissuggests that Path Projection succeeds in making paths easy to see
1 2008/8/2
and understand in the source code view. Users clearly preferredPath Projection over the standard viewer, and generally rated allthe features of Path Projection as somewhat or very useful. We alsoobserved that the checklist dramatically reduced the overall triag-ing times for users of both interfaces, compared to an earlier pilotstudy. Though this result is not scientifically rigorous (several otherfeatures changed between the pilot and the current study), we be-lieve it suggests checklists would be a useful addition to many staticanalysis interfaces, and merit further study.
In summary, this paper makes two main contributions:
1. We present Path Projection, a novel toolkit for visualizing pro-gram paths (Section 3). While mature static analysis tools canhave sophisticated graphical user interfaces (Section 7), theseinterfaces are designed for particular tools and cannot easily beused in other contexts. We show how to apply Path Projectionboth to Locksmith and to BLAST [5], a software model check-ing tool. We believe Path Projection’s combination and designof user interface features is novel.
2. We present quantitative and qualitative evidence of Path Projec-tion’s benefits in triaging Locksmith error reports (Sections 5and 6). To our knowledge, ours is the first study to considerthe task of triaging defect detection tool error reports, and thefirst to consider the user interface in this context. Our study re-sults provide some scientific understanding of which featuresare most important for making users more effective when usingstatic analysis tools.
We believe Path Projection is a valuable new toolkit that canbenefit a wide range of static analyses.
2. Background: LocksmithLocksmith [34], our target static analysis, works by enforcing theguarded-by pattern [38]: for each memory location shared amongthreads, there must exist a lock that is consistently acquired atevery access to that location.1 Locksmith initially performs an aliasanalysis to model the pointers and locks in the program. It then usesa sharing analysis to determine what locations are thread-shared,and a lock state analysis to compute the set of locks that guardeach program point. Finally, Locksmith issues an error report forany shared location that is inconsistently guarded.
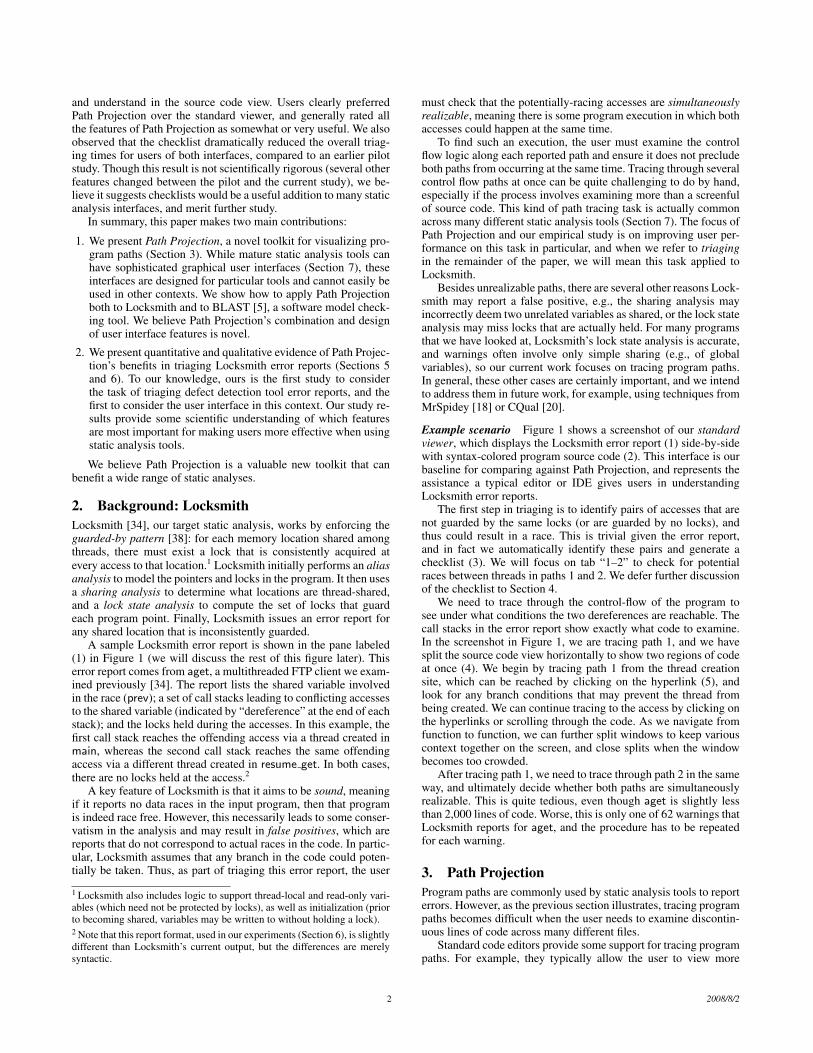
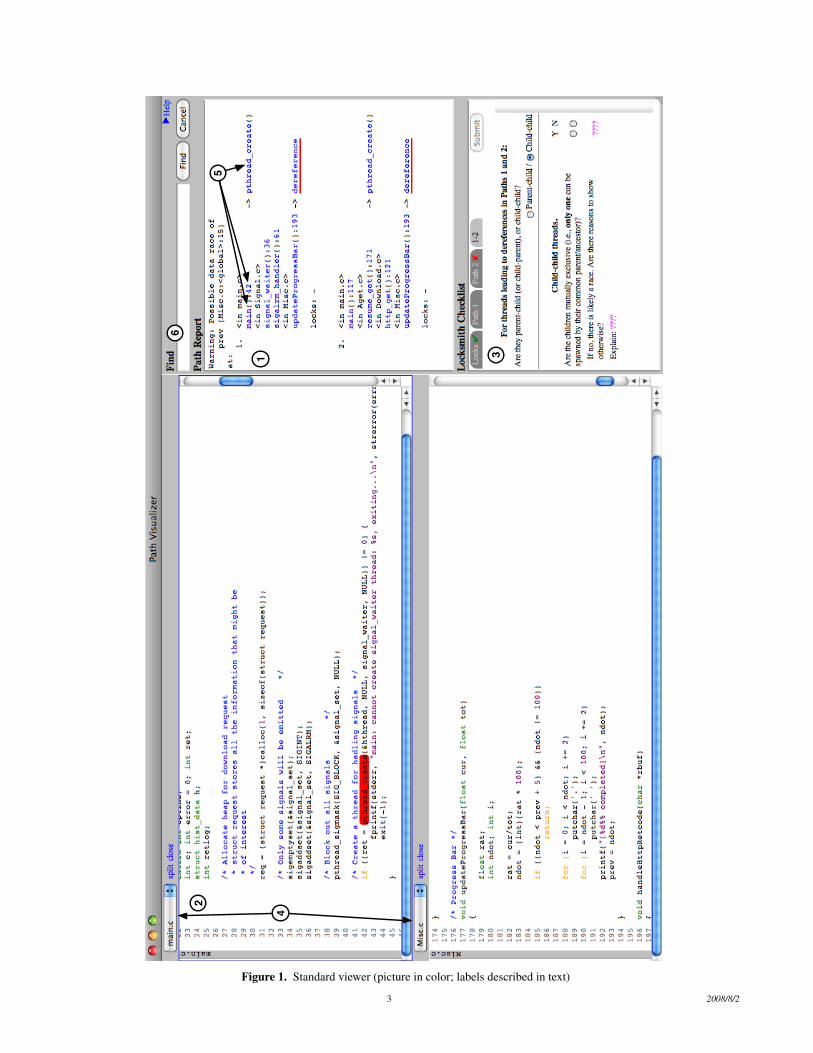
A sample Locksmith error report is shown in the pane labeled(1) in Figure 1 (we will discuss the rest of this figure later). Thiserror report comes from aget, a multithreaded FTP client we exam-ined previously [34]. The report lists the shared variable involvedin the race (prev); a set of call stacks leading to conflicting accessesto the shared variable (indicated by “dereference” at the end of eachstack); and the locks held during the accesses. In this example, thefirst call stack reaches the offending access via a thread created inmain, whereas the second call stack reaches the same offendingaccess via a different thread created in resume get. In both cases,there are no locks held at the access.2
A key feature of Locksmith is that it aims to be sound, meaningif it reports no data races in the input program, then that programis indeed race free. However, this necessarily leads to some conser-vatism in the analysis and may result in false positives, which arereports that do not correspond to actual races in the code. In partic-ular, Locksmith assumes that any branch in the code could poten-tially be taken. Thus, as part of triaging this error report, the user
1 Locksmith also includes logic to support thread-local and read-only vari-ables (which need not be protected by locks), as well as initialization (priorto becoming shared, variables may be written to without holding a lock).2 Note that this report format, used in our experiments (Section 6), is slightlydifferent than Locksmith’s current output, but the differences are merelysyntactic.
must check that the potentially-racing accesses are simultaneouslyrealizable, meaning there is some program execution in which bothaccesses could happen at the same time.
To find such an execution, the user must examine the controlflow logic along each reported path and ensure it does not precludeboth paths from occurring at the same time. Tracing through severalcontrol flow paths at once can be quite challenging to do by hand,especially if the process involves examining more than a screenfulof source code. This kind of path tracing task is actually commonacross many different static analysis tools (Section 7). The focus ofPath Projection and our empirical study is on improving user per-formance on this task in particular, and when we refer to triagingin the remainder of the paper, we will mean this task applied toLocksmith.
Besides unrealizable paths, there are several other reasons Lock-smith may report a false positive, e.g., the sharing analysis mayincorrectly deem two unrelated variables as shared, or the lock stateanalysis may miss locks that are actually held. For many programsthat we have looked at, Locksmith’s lock state analysis is accurate,and warnings often involve only simple sharing (e.g., of globalvariables), so our current work focuses on tracing program paths.In general, these other cases are certainly important, and we intendto address them in future work, for example, using techniques fromMrSpidey [18] or CQual [20].
Example scenario Figure 1 shows a screenshot of our standardviewer, which displays the Locksmith error report (1) side-by-sidewith syntax-colored program source code (2). This interface is ourbaseline for comparing against Path Projection, and represents theassistance a typical editor or IDE gives users in understandingLocksmith error reports.
The first step in triaging is to identify pairs of accesses that arenot guarded by the same locks (or are guarded by no locks), andthus could result in a race. This is trivial given the error report,and in fact we automatically identify these pairs and generate achecklist (3). We will focus on tab “1–2” to check for potentialraces between threads in paths 1 and 2. We defer further discussionof the checklist to Section 4.
We need to trace through the control-flow of the program tosee under what conditions the two dereferences are reachable. Thecall stacks in the error report show exactly what code to examine.In the screenshot in Figure 1, we are tracing path 1, and we havesplit the source code view horizontally to show two regions of codeat once (4). We begin by tracing path 1 from the thread creationsite, which can be reached by clicking on the hyperlink (5), andlook for any branch conditions that may prevent the thread frombeing created. We can continue tracing to the access by clicking onthe hyperlinks or scrolling through the code. As we navigate fromfunction to function, we can further split windows to keep variouscontext together on the screen, and close splits when the windowbecomes too crowded.
After tracing path 1, we need to trace through path 2 in the sameway, and ultimately decide whether both paths are simultaneouslyrealizable. This is quite tedious, even though aget is slightly lessthan 2,000 lines of code. Worse, this is only one of 62 warnings thatLocksmith reports for aget, and the procedure has to be repeatedfor each warning.
3. Path ProjectionProgram paths are commonly used by static analysis tools to reporterrors. However, as the previous section illustrates, tracing programpaths becomes difficult when the user needs to examine discontin-uous lines of code across many different files.
Standard code editors provide some support for tracing programpaths. For example, they typically allow the user to view more
2 2008/8/2
3
2
4
1
5
6
Figure 1. Standard viewer (picture in color; labels described in text)
3 2008/8/2
than one file to be by opening multiple windows or by splitting awindow. Code folding is another commonly available feature usedto hide irrelevant code.
The key issue, however, is that the user has to invoke and man-age these features manually. In particular, the user has to carefullyconsider the tradeoffs of these features, e.g., after opening or split-ting windows, the user may have to move, resize or close otherwindows to make them visible or simply to reduce screen clutter.
This places a significant cognitive burden on the user to extractand organize relevant information from the source code and theerror report, and distracts from the actual task of understanding aprogram path. If paths are long or complicated, as they often are, itcan be hard to keep track of the context of the path while managingwindows and folded code. In our experience, it is all too easy to getlost on a long path and have to backtrack or retrace it many times.
3.1 Design GuidelinesTo develop a better interface for tracing program paths, we can lookto guidelines developed by researchers in information visualization.We found three strategies described by Card et al. [7] to be partic-ularly applicable for our task:
1. Increase users’ memory and processing resources and reducethe search for information. The Locksmith error report is com-pact, but examining the path in the actual source code may in-volve many different source code lines spread across many dif-ferent files. We would ideally like to put all the necessary infor-mation for triaging an error report on one screen, so the user cansee all the information at the same time. We would also like toallow the user to hide any unimportant information, to furtherreduce the cognitive burden.
2. Use visual representation to enhance pattern detection. Wewould like to visually distinguish the source code lines appear-ing in the Locksmith error report from the other lines in theprogram, since the lines in the error reports are presumably veryimportant. We would also like to bring important threading APIcalls, e.g., invocations of pthread X functions, to the user’s at-tention.
3. Encode information in a manipulable medium. We need to givethe user good mechanisms for searching and comparing theinformation we present to them.
Another key guideline we would like to follow is that “codeshould look like code.” We want the user to be able to relateany visualization back to the original source code. This is basedon our experience as programmers: we spend a large fraction oftime editing source code in standard textual form, and relativelylittle working with abstract visualizations. Understanding Lock-smith error reports requires looking at source code in great detail.A visualization that looks like source code will be familiar, whichshould increase acceptance and could increase comprehension.
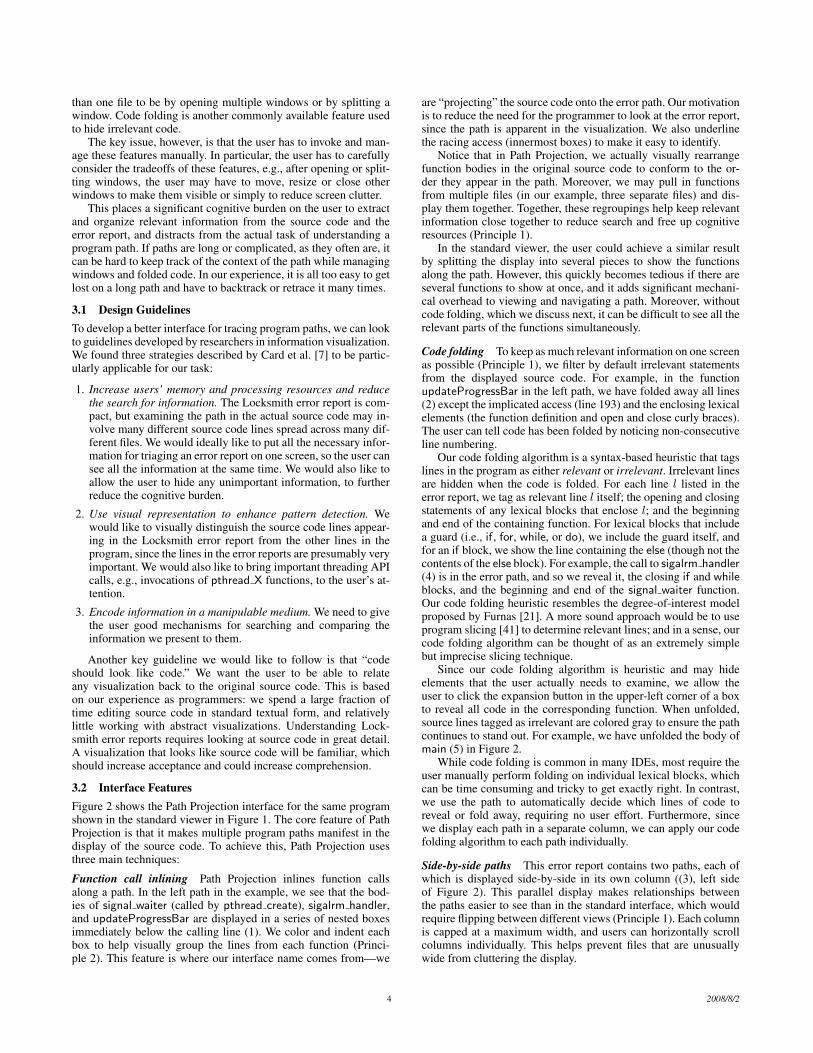
3.2 Interface FeaturesFigure 2 shows the Path Projection interface for the same programshown in the standard viewer in Figure 1. The core feature of PathProjection is that it makes multiple program paths manifest in thedisplay of the source code. To achieve this, Path Projection usesthree main techniques:
Function call inlining Path Projection inlines function callsalong a path. In the left path in the example, we see that the bod-ies of signal waiter (called by pthread create), sigalrm handler,and updateProgressBar are displayed in a series of nested boxesimmediately below the calling line (1). We color and indent eachbox to help visually group the lines from each function (Princi-ple 2). This feature is where our interface name comes from—we
are “projecting” the source code onto the error path. Our motivationis to reduce the need for the programmer to look at the error report,since the path is apparent in the visualization. We also underlinethe racing access (innermost boxes) to make it easy to identify.
Notice that in Path Projection, we actually visually rearrangefunction bodies in the original source code to conform to the or-der they appear in the path. Moreover, we may pull in functionsfrom multiple files (in our example, three separate files) and dis-play them together. Together, these regroupings help keep relevantinformation close together to reduce search and free up cognitiveresources (Principle 1).
In the standard viewer, the user could achieve a similar resultby splitting the display into several pieces to show the functionsalong the path. However, this quickly becomes tedious if there areseveral functions to show at once, and it adds significant mechani-cal overhead to viewing and navigating a path. Moreover, withoutcode folding, which we discuss next, it can be difficult to see all therelevant parts of the functions simultaneously.
Code folding To keep as much relevant information on one screenas possible (Principle 1), we filter by default irrelevant statementsfrom the displayed source code. For example, in the functionupdateProgressBar in the left path, we have folded away all lines(2) except the implicated access (line 193) and the enclosing lexicalelements (the function definition and open and close curly braces).The user can tell code has been folded by noticing non-consecutiveline numbering.
Our code folding algorithm is a syntax-based heuristic that tagslines in the program as either relevant or irrelevant. Irrelevant linesare hidden when the code is folded. For each line l listed in theerror report, we tag as relevant line l itself; the opening and closingstatements of any lexical blocks that enclose l; and the beginningand end of the containing function. For lexical blocks that includea guard (i.e., if, for, while, or do), we include the guard itself, andfor an if block, we show the line containing the else (though not thecontents of the else block). For example, the call to sigalrm handler(4) is in the error path, and so we reveal it, the closing if and whileblocks, and the beginning and end of the signal waiter function.Our code folding heuristic resembles the degree-of-interest modelproposed by Furnas [21]. A more sound approach would be to useprogram slicing [41] to determine relevant lines; and in a sense, ourcode folding algorithm can be thought of as an extremely simplebut imprecise slicing technique.
Since our code folding algorithm is heuristic and may hideelements that the user actually needs to examine, we allow theuser to click the expansion button in the upper-left corner of a boxto reveal all code in the corresponding function. When unfolded,source lines tagged as irrelevant are colored gray to ensure the pathcontinues to stand out. For example, we have unfolded the body ofmain (5) in Figure 2.
While code folding is common in many IDEs, most require theuser manually perform folding on individual lexical blocks, whichcan be time consuming and tricky to get exactly right. In contrast,we use the path to automatically decide which lines of code toreveal or fold away, requiring no user effort. Furthermore, sincewe display each path in a separate column, we can apply our codefolding algorithm to each path individually.
Side-by-side paths This error report contains two paths, each ofwhich is displayed side-by-side in its own column ((3), left sideof Figure 2). This parallel display makes relationships betweenthe paths easier to see than in the standard interface, which wouldrequire flipping between different views (Principle 1). Each columnis capped at a maximum width, and users can horizontally scrollcolumns individually. This helps prevent files that are unusuallywide from cluttering the display.
4 2008/8/2
1
3
2{5
4
6
78
9
Figure 2. Path Projection (picture in color; labels described in text). This and additional screenshots can be found at athttp://www.cs.umd.edu/projects/PL/PP.
5 2008/8/2
1 Trace:2 In function a (3 On line a:5 , call b (4 On line b:10, call c (5 On line c:15 , call d6 )7 )8 On line a:20, call e (9 On line e:25 , call f
10 )11 )
1 Trace:2 In function <path name=”a”>a (3 On line <detour line=”5” name=”b”>a:5, call <path name=”b”>b (4 On line <detour line=”10” name=”c”>b:10, call <path name=”c”>c (5 On line c:15 , call d6 )</path></detour>7 )</path></detour>8 On line <detour line=”20” name=”e”>a:20, call <path name=”e”>e (9 On line e:25 , call f
10 )</path></detour>11 )</path>
Figure 3. A textual path-based report (left) can be converted into the pathreport XML format (right) using <path> and <detour> (someattributes omitted for brevity).
Triaging Locksmith’s error report requires comparing more thanone path, making this feature a necessity. However, we believe thatside-by-side paths would be useful for other tools too. For example,a model-checker may display known-good paths for comparisonwith the error path.
In our experiments, participants used a wide-screen monitor tomake it easier to see multiple paths simultaneously. Since wide-screen displays are commonly available and popular, we thinkdesigning an interface with such displays in mind is reasonable.
Additional interface features Path Projection includes severalother features to make it easier to use. We include a multi-querysearch facility (6) that allow users to locate multiple terms and keepthem highlighted at the same time. Each term is distinguished bya different color in the source code, and the user can cancel thehighlighting of any term individually. Any source line containing amatch is automatically marked as relevant, as are any lexical blocksenclosing the match. For example, in the screenshot in Figure 2,calls to pthread join, which are not included in the error report,have been marked as relevant due to the search (7). This facilityfollows Principle 3, since it allows the user to manipulate codefolding in a natural way. In our experiments, we initialized multi-query to find the four pthread functions shown in the screenshot,since in our pilot study we found users almost always want to locateuses of these functions.
Our interface also includes a reveal definition facility that usesinlining to show the definition of a function or variable. In thescreenshot, the user has clicked on nthreads, and its definition hasbeen inlined below the use (8). While this feature seems potentiallyhandy, we found it was rarely used by participants in our experi-ments.
Lastly, Path Projection still includes the original error reportfrom which the visualization was generated, to act as a back-up andto provide consistency with the standard view. As with the standardview, the report is hyperlinked to the source display.
3.3 Applying Path Projection to Other ToolsWe intend Path Projection to be general toolkit that may be usedby static analysis tool developers to visualize their error reports. Tothis end, Path Projection is implemented as a standalone tool thattakes as input an XML-based error report and the source code underanalysis.
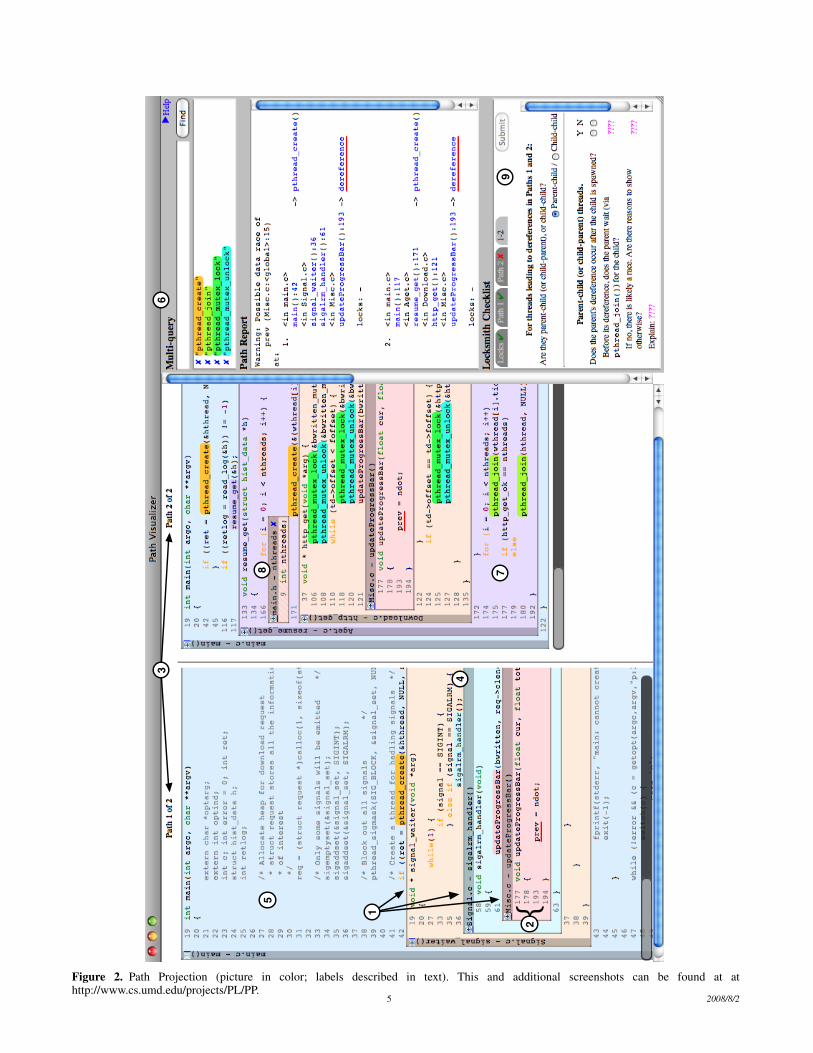
XML format Our XML format, called pathreport, describes oneor more program path using three kinds of tags. It is designedto easily convert a textual path-based report by marking it upappropriately. Briefly, the three tags are:
<path> marks text that corresponds to a continuous block ofcode, such as a function. A <path> can contain any numberof <detour> and <marker> tags.
<detour> marks text that corresponds to a reference in some code,such as a call site. The parent <path> provides the context forthis reference, e.g., the function in which the call site appears.Each <detour> tag must in turn contain exactly one <path>tag.
<marker> tags mark any other texts, such as function names, vari-able names, or line numbers, that point to code that may beinteresting.
These tags also require attributes to precisely indicate informa-tion such as the file where a function is defined. Together, <path>and <detour> recursively describe a program path, and <marker>can be used to mark any interesting line of code along the path.
Figure 3 shows how a path-based textual report can be markedup with <path> and <detour>. Note that on line 2, <path> marksthe entire call to a. Within that, two <detour> tags on line 3 andline 8 mark the call sites to b and e that appear in a.
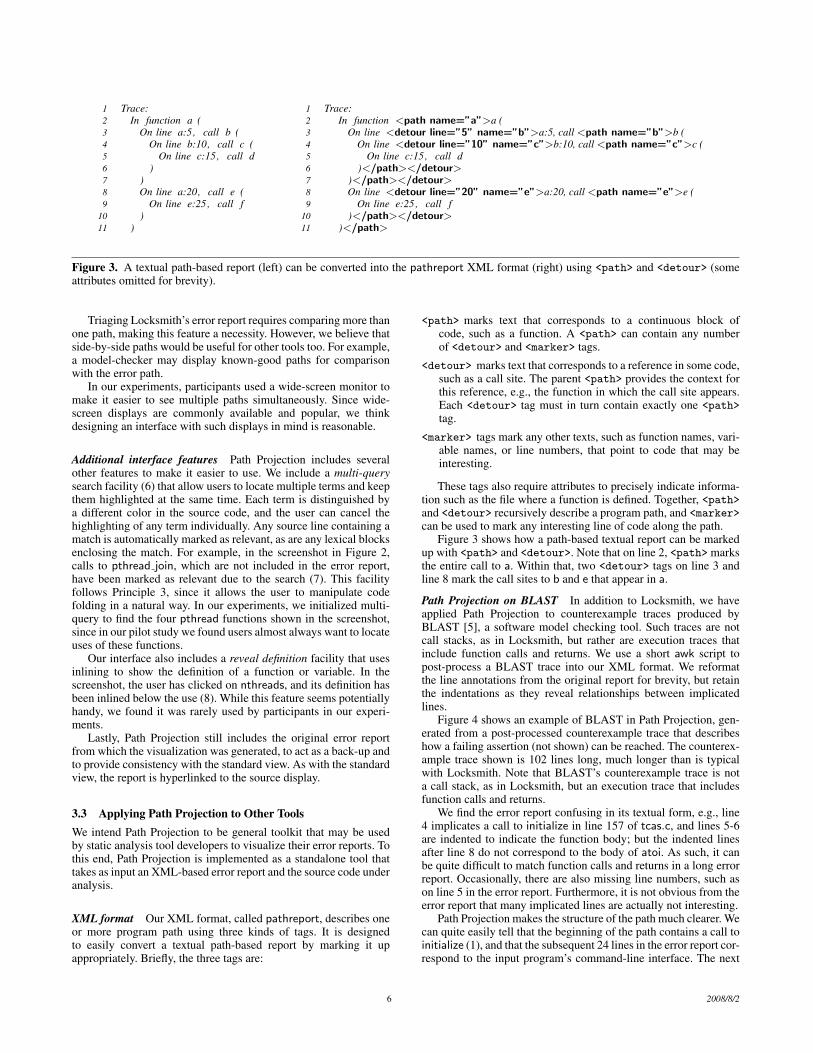
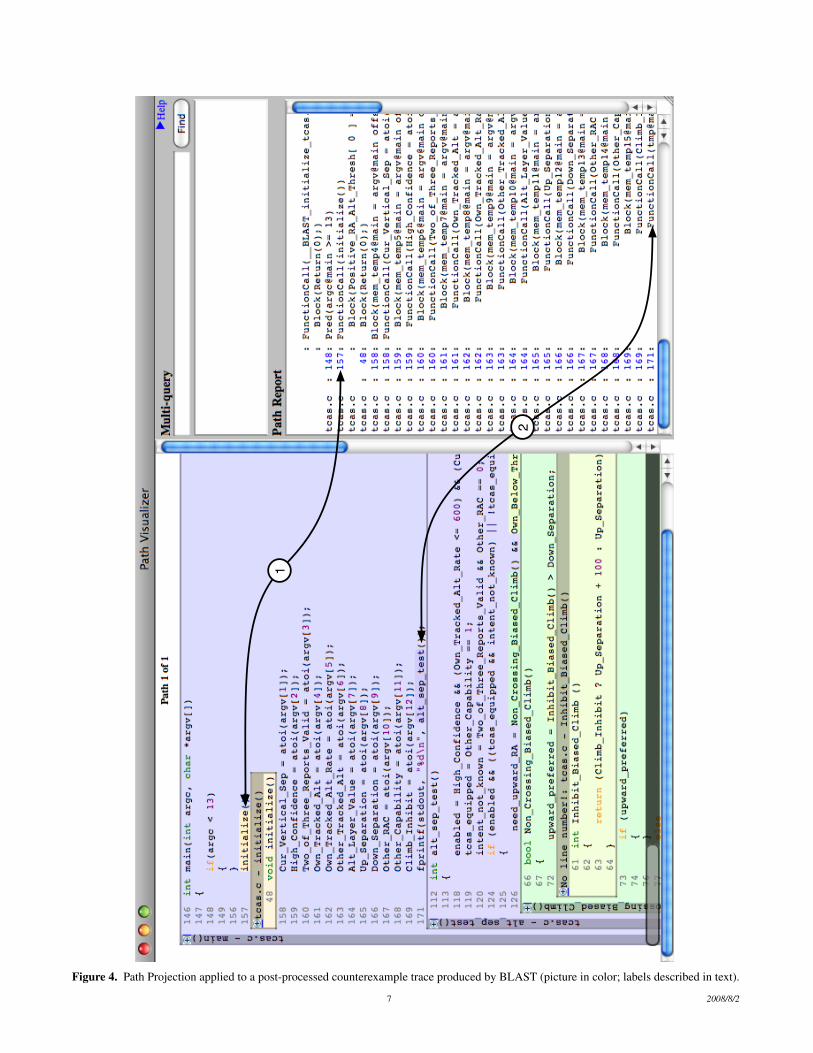
Path Projection on BLAST In addition to Locksmith, we haveapplied Path Projection to counterexample traces produced byBLAST [5], a software model checking tool. Such traces are notcall stacks, as in Locksmith, but rather are execution traces thatinclude function calls and returns. We use a short awk script topost-process a BLAST trace into our XML format. We reformatthe line annotations from the original report for brevity, but retainthe indentations as they reveal relationships between implicatedlines.
Figure 4 shows an example of BLAST in Path Projection, gen-erated from a post-processed counterexample trace that describeshow a failing assertion (not shown) can be reached. The counterex-ample trace shown is 102 lines long, much longer than is typicalwith Locksmith. Note that BLAST’s counterexample trace is nota call stack, as in Locksmith, but an execution trace that includesfunction calls and returns.
We find the error report confusing in its textual form, e.g., line4 implicates a call to initialize in line 157 of tcas.c, and lines 5-6are indented to indicate the function body; but the indented linesafter line 8 do not correspond to the body of atoi. As such, it canbe quite difficult to match function calls and returns in a long errorreport. Occasionally, there are also missing line numbers, such ason line 5 in the error report. Furthermore, it is not obvious from theerror report that many implicated lines are actually not interesting.
Path Projection makes the structure of the path much clearer. Wecan quite easily tell that the beginning of the path contains a call toinitialize (1), and that the subsequent 24 lines in the error report cor-respond to the input program’s command-line interface. The next
6 2008/8/2
1
2
Figure 4. Path Projection applied to a post-processed counterexample trace produced by BLAST (picture in color; labels described in text).
7 2008/8/2
Path iY N
Is the thread created in a loop (loop count > 1)? ○ ○If yes, there is likely a race. Are there reasons to show otherwise? ○ ○Explain:
(a) Single path i
For threads leading to dereferences in Paths i and j:
Are they parent-child (or child-parent), or child-child?○ Parent-child / ○ Child-child
Parent-child (or child-parent) threads. Y NDoes the parent’s dereference occur after the child is spawned? ○ ○
Before its dereference, does the parent wait (via pthread_join)for the child?
○ ○
If no, there is likely a race. Are there reasons to show otherwise? ○ ○Explain:
Child-child threads. Y NAre the children mutually exclusive (i.e., only one can be spawnedby their common parent/ancestor)?
○ ○
If no, there is likely a race. Are there reasons to show otherwise? ○ ○Explain:
(b) Pair of paths i and j
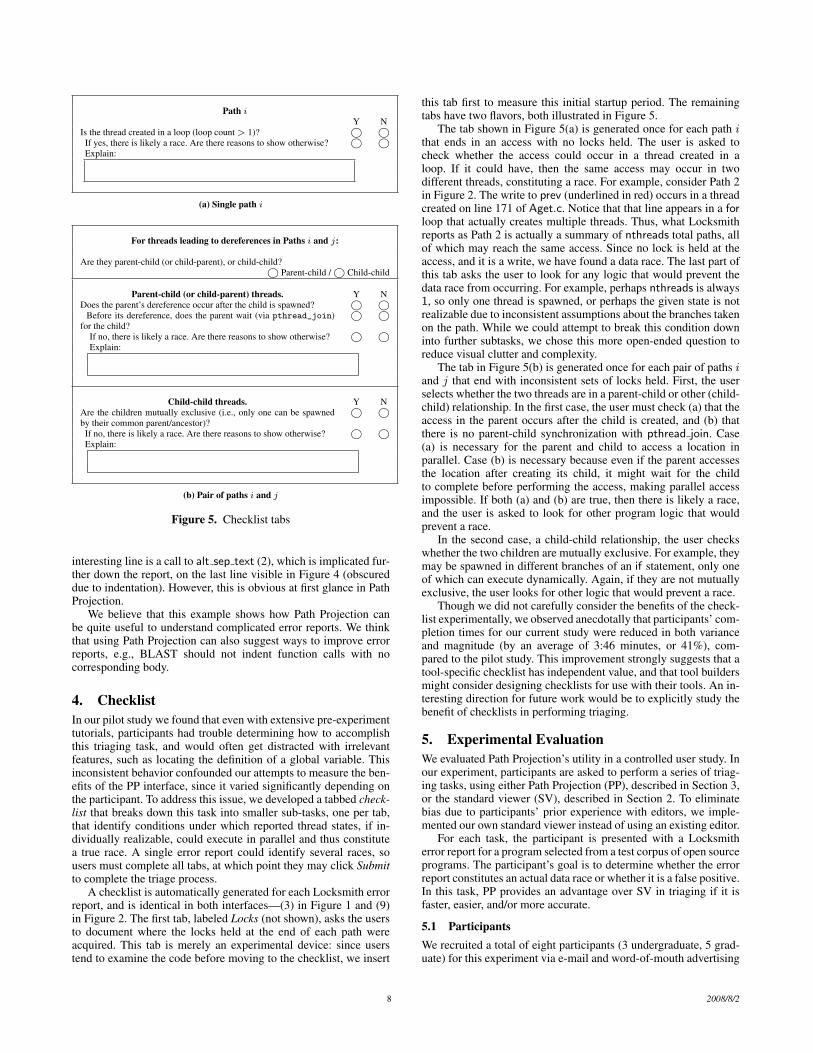
Figure 5. Checklist tabs
interesting line is a call to alt sep text (2), which is implicated fur-ther down the report, on the last line visible in Figure 4 (obscureddue to indentation). However, this is obvious at first glance in PathProjection.
We believe that this example shows how Path Projection canbe quite useful to understand complicated error reports. We thinkthat using Path Projection can also suggest ways to improve errorreports, e.g., BLAST should not indent function calls with nocorresponding body.
4. ChecklistIn our pilot study we found that even with extensive pre-experimenttutorials, participants had trouble determining how to accomplishthis triaging task, and would often get distracted with irrelevantfeatures, such as locating the definition of a global variable. Thisinconsistent behavior confounded our attempts to measure the ben-efits of the PP interface, since it varied significantly depending onthe participant. To address this issue, we developed a tabbed check-list that breaks down this task into smaller sub-tasks, one per tab,that identify conditions under which reported thread states, if in-dividually realizable, could execute in parallel and thus constitutea true race. A single error report could identify several races, sousers must complete all tabs, at which point they may click Submitto complete the triage process.
A checklist is automatically generated for each Locksmith errorreport, and is identical in both interfaces—(3) in Figure 1 and (9)in Figure 2. The first tab, labeled Locks (not shown), asks the usersto document where the locks held at the end of each path wereacquired. This tab is merely an experimental device: since userstend to examine the code before moving to the checklist, we insert
this tab first to measure this initial startup period. The remainingtabs have two flavors, both illustrated in Figure 5.
The tab shown in Figure 5(a) is generated once for each path ithat ends in an access with no locks held. The user is asked tocheck whether the access could occur in a thread created in aloop. If it could have, then the same access may occur in twodifferent threads, constituting a race. For example, consider Path 2in Figure 2. The write to prev (underlined in red) occurs in a threadcreated on line 171 of Aget.c. Notice that that line appears in a forloop that actually creates multiple threads. Thus, what Locksmithreports as Path 2 is actually a summary of nthreads total paths, allof which may reach the same access. Since no lock is held at theaccess, and it is a write, we have found a data race. The last part ofthis tab asks the user to look for any logic that would prevent thedata race from occurring. For example, perhaps nthreads is always1, so only one thread is spawned, or perhaps the given state is notrealizable due to inconsistent assumptions about the branches takenon the path. While we could attempt to break this condition downinto further subtasks, we chose this more open-ended question toreduce visual clutter and complexity.
The tab in Figure 5(b) is generated once for each pair of paths iand j that end with inconsistent sets of locks held. First, the userselects whether the two threads are in a parent-child or other (child-child) relationship. In the first case, the user must check (a) that theaccess in the parent occurs after the child is created, and (b) thatthere is no parent-child synchronization with pthread join. Case(a) is necessary for the parent and child to access a location inparallel. Case (b) is necessary because even if the parent accessesthe location after creating its child, it might wait for the childto complete before performing the access, making parallel accessimpossible. If both (a) and (b) are true, then there is likely a race,and the user is asked to look for other program logic that wouldprevent a race.
In the second case, a child-child relationship, the user checkswhether the two children are mutually exclusive. For example, theymay be spawned in different branches of an if statement, only oneof which can execute dynamically. Again, if they are not mutuallyexclusive, the user looks for other logic that would prevent a race.
Though we did not carefully consider the benefits of the check-list experimentally, we observed anecdotally that participants’ com-pletion times for our current study were reduced in both varianceand magnitude (by an average of 3:46 minutes, or 41%), com-pared to the pilot study. This improvement strongly suggests that atool-specific checklist has independent value, and that tool buildersmight consider designing checklists for use with their tools. An in-teresting direction for future work would be to explicitly study thebenefit of checklists in performing triaging.
5. Experimental EvaluationWe evaluated Path Projection’s utility in a controlled user study. Inour experiment, participants are asked to perform a series of triag-ing tasks, using either Path Projection (PP), described in Section 3,or the standard viewer (SV), described in Section 2. To eliminatebias due to participants’ prior experience with editors, we imple-mented our own standard viewer instead of using an existing editor.
For each task, the participant is presented with a Locksmitherror report for a program selected from a test corpus of open sourceprograms. The participant’s goal is to determine whether the errorreport constitutes an actual data race or whether it is a false positive.In this task, PP provides an advantage over SV in triaging if it isfaster, easier, and/or more accurate.
5.1 ParticipantsWe recruited a total of eight participants (3 undergraduate, 5 grad-uate) for this experiment via e-mail and word-of-mouth advertising
8 2008/8/2
Session 1 Session 21 PP/1.1 PP/1.2 PP/1.3 SV/2.1 SV/2.2 SV/2.32 SV/1.1 SV/1.2 SV/1.3 PP/2.1 PP/2.2 PP/2.3
Figure 6. User interface/problem number schedules
in the UMD Computer Science Department. We required the par-ticipants to have prior experience with C and with multithreadedprogramming (though not necessarily in C). All participants hadtaken at least one college-level class that involved multithreadedprogramming. On a scale of 1 (no experience) to 5 (very experi-enced), participants rated themselves between 3 and 4 when de-scribing their ability to debug data races. Two participants had pre-vious experience in using a race detection tool (Locksmith andEraser [38]).
5.2 DesignEach participant was asked to perform the triaging task in two ses-sions, first with one interface and then with the other. Thus, our ex-periment is a within-subjects design consisting of two conditions,using PP and using SV. Since participants experienced both inter-faces, we were able to measure comparative performance, and wecould ask participants to qualitatively compare the two interfaces.
A within-subjects design potentially suffers from order effects,since participants may be biased towards the interface given first.To compensate, we perform counterbalancing on the interface or-der: participants are randomly placed into one of the two schedulesshown in Figure 6.
Participants in the first schedule use PP in the first session andSV in the second, whereas participants in the second schedule useSV first and PP second. However, all participants receive the sameset of problems, numbered 1.1–2.3, in the same order, which allowsus to directly compare our observations of each problem withoutthe need to account for order effects.
5.3 ProcedureAt the beginning of each session, we ask participants to review ashort tutorial and quiz on pthreads and data races, as well as atutorial on Locksmith with emphasis on the items in the triagingchecklist (below, Section 4). Then we introduce the user interface(PP or SV) with another tutorial. We make sure that participantsare familiar with each interface by encouraging them to try everyfeature and to triage a simple data race problem using the interface.
Following the tutorial is a single practice trial and three actualtrials, all of which follow the same procedure. In each trial, we firstask participants to triage a real Locksmith error report generatedfrom Locksmith’s test corpus (below, Section 5.4). We log partic-ipants’ mouse movements during the trial and measure the totaltime to completion. Triaging ends when participants complete andsubmit the triaging checklist. Immediately after, we present partic-ipants with the same problem and ask them to explain out loud thesteps they took to verify the warning. This allows us to comparetheir descriptions with our expectations.
We do not tell participants whether their answers are correct,for several reasons. Firstly, it is difficult for the experimenter toquickly judge the correctness of the answer, since identifying a datarace may involve understanding many subtle aspects in a program.Secondly, we do not want the participants to become reliant onreceiving an answer or to guess at an answer. Finally, in a realtriaging scenario, users will not have the benefit of an oracle toconfirm their intuitions.
We have found this two-stage procedure to be very effective inour pilot studies. In particular, it allows us to ask about specificinteresting behaviors observed without interrupting the participantduring the task. The participants also benefit from a limited form
of feedback. By recalling their work to the experimenter, they canconfirm their initial understanding, or notice mistakes made. Fur-thermore, we have found that participants gain a better understand-ing of the user interface by demonstrating it to another person. Thisalso helps mitigate the effects of what turned out to be a long learn-ing curve in triaging error reports. The experimenter may also askfor clarification to certain points, which may reveal inconsistenciesor mistakes.
After the experiment, participants complete a questionnaire andare interviewed to determine their opinion of the user interface.Users are asked to evaluate each tool based on ease-of-learning,ease-of-use, and effectiveness in supporting the triaging task.
We ran the experiment on Mac OS X 10.5.2. To avoid bias dueto OS competency, all shortcuts are disabled except for cut, copy,paste, find, and find-next, and participants are informed of theseshortcuts. We also display the interface on a 24-inch wide-screen1920-by-1200 resolution LCD monitor.
5.4 ProgramsEach trial’s error report was drawn from one of four open sourceprograms, all of which we have previously applied Locksmith to:engine, aget, pfscan, and knot. We also chose reports in whichimprecision in the sharing and lock state analysis do not contributeto the report’s validity, so as to focus on the task of tracing programpath as discussed in Section 2.
Reports from engine and pfscan are used during the tutorial andpractice trials. Trials 1.1–1.3 use error reports from aget, and trials2.1–2.3 use error reports from knot. By using different programsin each trial, we prevent participants from carrying over knowledgeof the programs from the first interface to the second. The threeselected reports within each program are significantly differentfrom each other, e.g., they do not follow the same paths. This helpsavoid bias that could arise if participants were given very similartriaging tasks for the same program.
Of the six reports, four contain 3 paths, and two contain 2 paths;eight paths have a call depth of 3, and the two deepest have a calldepth of 8. Overall, there were 23 (non-Locks) tabs to complete forthe experiment, 8 of which are true positives and 15 of which arefalse positives.
We also simplify the task slightly by making four small,semantics-preserving changes to the programs themselves. Doingso makes it simpler to ensure that our participants have a commonknowledge base to work from, and reduces measurement variancedue to individual differences. First, we made local static variablesglobal. Second, we converted wait/signal synchronization to equiv-alent pthread join synchronization when possible. We made bothchanges in response to confusion by some participants in our pilotstudy who were unfamiliar with these constructs. Third, we deletedlines of code disabled via #if 0 or other macros. Finally, in a fewcases we converted gotos and switch statements to equivalent ifstatements. These last changes remove irrelevant complexity fromthe triaging task.
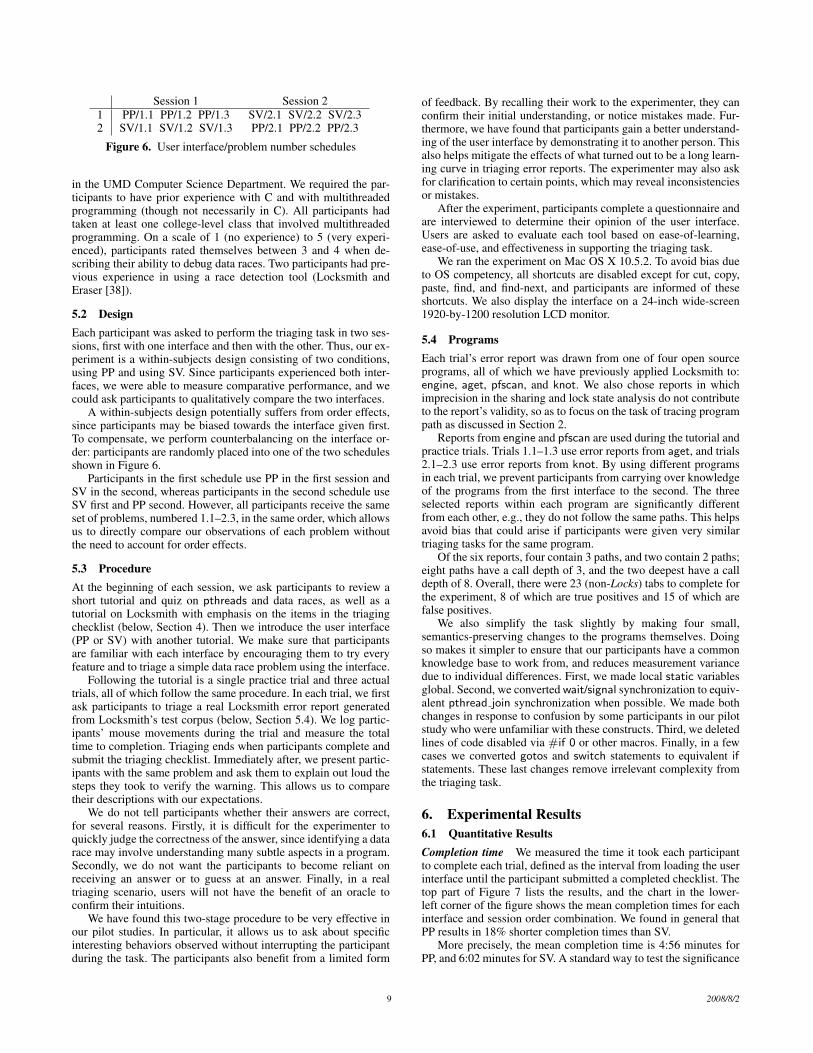
6. Experimental Results6.1 Quantitative ResultsCompletion time We measured the time it took each participantto complete each trial, defined as the interval from loading the userinterface until the participant submitted a completed checklist. Thetop part of Figure 7 lists the results, and the chart in the lower-left corner of the figure shows the mean completion times for eachinterface and session order combination. We found in general thatPP results in 18% shorter completion times than SV.
More precisely, the mean completion time is 4:56 minutes forPP, and 6:02 minutes for SV. A standard way to test the significance
9 2008/8/2
Completion times and accuracy for each trialSession 1 Session 2
Trial 1.1 1.2 1.3 mean 2.1 2.2 2.3 mean
User SV PP1 8:36 14:14 9:44 10:51 7:07 4:48* 4:02 5:192 5:07* 3:10 5:50 4:42 4:16 2:29* 2:10* 2:585 7:46 2:34 5:38* 5:20 5:13 3:43* 1:18* 3:257 5:40 6:23 7:35 6:33 3:05 3:53* 2:32 3:10
6:51 3:43User PP SV
0 6:27* 6:09 8:32* 7:03 9:42 5:16* 3:11* 6:033 6:38 7:18 8:35 7:30 11:18 6:21 3:39 7:064 8:21 2:11 4:43 5:05 5:26* 4:27* 2:46* 4:136 7:11 2:52 4:50** 4:57 4:33 4:06* 1:58* 3:32
6:09 5:14
# Tabs 3 2 6 6 3 3
* one incorrectly answered tab in the checklist
Session 1 Session 2
010
020
030
040
0
Completion time (sec)
Standard ViewerPath Projection
Session 1 Session 2
020
4060
8010
012
0
Duration in error report (sec)
Standard ViewerPath Projection
Figure 7. Quantitative data
of this result is to run a user interface (within subjects) by presen-tation order (between subjects) mixed ANOVA on the mean of thethree completion times for each participants in each session.3 How-ever, this test revealed a significant interaction effect between theinterface and the presentation order (F (1, 6) = 6.046, p = 0.004).(As is standard, we consider a p-value of less than 0.05 to indicate astatistically significant result.) We believe this is a learning effect—notice that for the SV-PP order (SV first, PP second), the meantime improved 3:08 minutes from the first session to the second,and for the PP-SV order the mean time improved 55 seconds. Weran two one-way, within-subjects ANOVAs, analyzing each presen-tation order separately, and we found that both of these improve-ments were statistically significant (F (1, 3) = 12.78, p = 0.038and F (1, 3) = 19.33, p = 0.022, respectively).
However, notice that the SV-PP improvement is much greaterthan the PP-SV improvement. We applied Cohen’s d, a standardmean difference test, which showed that the SV-PP improvementwas large (d = 1.276), and the PP-SV improvement was small-to-medium (d = 0.375). This provides evidence that while there is alearning effect, PP still improves user performance significantly.
Note that when analyzing completion times, we did not distin-guish correct and incorrect answers. Indeed, it is unclear how thisaffects timings, especially since in many cases, only one tab out ofseveral will contain an incorrect answer.
Accuracy The chart at the top of Figure 7 also indicates, for eachtrial, how many of the checklist tabs were answered incorrectly.The total number of checklist tabs in each trial is listed at the bot-tom of the chart. We did not count the Locks tab in either of these
3 We ran all statistical tests in R and SPSS. For ANOVA, we confirmed thatall data sets satisfied normality using the Shapiro-Wilk test.
numbers. User mistakes are evenly distributed across both inter-faces. Participants made 10 mistakes (10.9%) under PP, comparedto 9 mistakes (9.8%) under SV. For each participant, we summedthe number of mistakes they made in each session, and we com-pared the sums for each interface using a Wilcoxon rank-sum test.This showed that the difference is not significant (p = 0.770), sug-gesting the distribution of errors is comparable for both interfaces.This shows that using PP, participants are able to come to similarlyaccurate conclusions in less time.
Most of the participant mistakes occurred in trials 2.2 and 2.3,in which two potentially-racing paths actually contain a commonunrealizable sub-path, making the data race report a false positive.In trial 1.3, one participant completed two tabs incorrectly, but therewas only one underlying mistake: misidentifying the same childthread as a parent thread (and thus affecting the answers to twotabs).
Time spent in error report We found that under PP, participantsspend much less time with the mouse hovering over the error reportcompared to SV. The chart in the bottom right of Figure 7 showsthe mean times for each session and interface. We found that onaverage, participants spend 20 seconds in the error report under PP,compared to 1:34 minutes under SV. This dramatic difference ishighly significant (F(1,3)=15.634, p < 0.001) according to a userinterface (within subjects) by presentation order (between subjects)mixed ANOVA.
We believe this difference is because PP makes the paths clearlyvisible in the source code display, whereas in SV, hyperlinks in theerror report are heavily used to bring up relevant parts of the code.As additional evidence, participants themselves reported the sameresult: one noted that the error report is “necessary for the standardviewer, but just a convenience in [PP].”
Time spent in checklist Finally, we found that participants spend27 seconds more on average with the mouse hovering over thechecklist in PP compared to SV. Since checklist times across dif-ferent trial numbers are incomparable, we applied a user interface-by-trial between-subjects ANOVA, which indicated a statisticallysignificant result (p = 0.007).
We were surprised by this result, because we expected roughlyequal times for this in both interfaces. In retrospect, however, werealized that participants need not scroll or click on the error reportvery often under PP, and hence they may leave the mouse cursoridle over the checklist.
6.2 Qualitative ResultsIn addition to quantitative data, we also examined participants’answers to the questionnaires we administered. The questions areon a 5-point Likert scale, and we analyze them using either theWilcoxon rank-sum test for paired comparisons, or the Wilcoxonsigned-rank test otherwise.
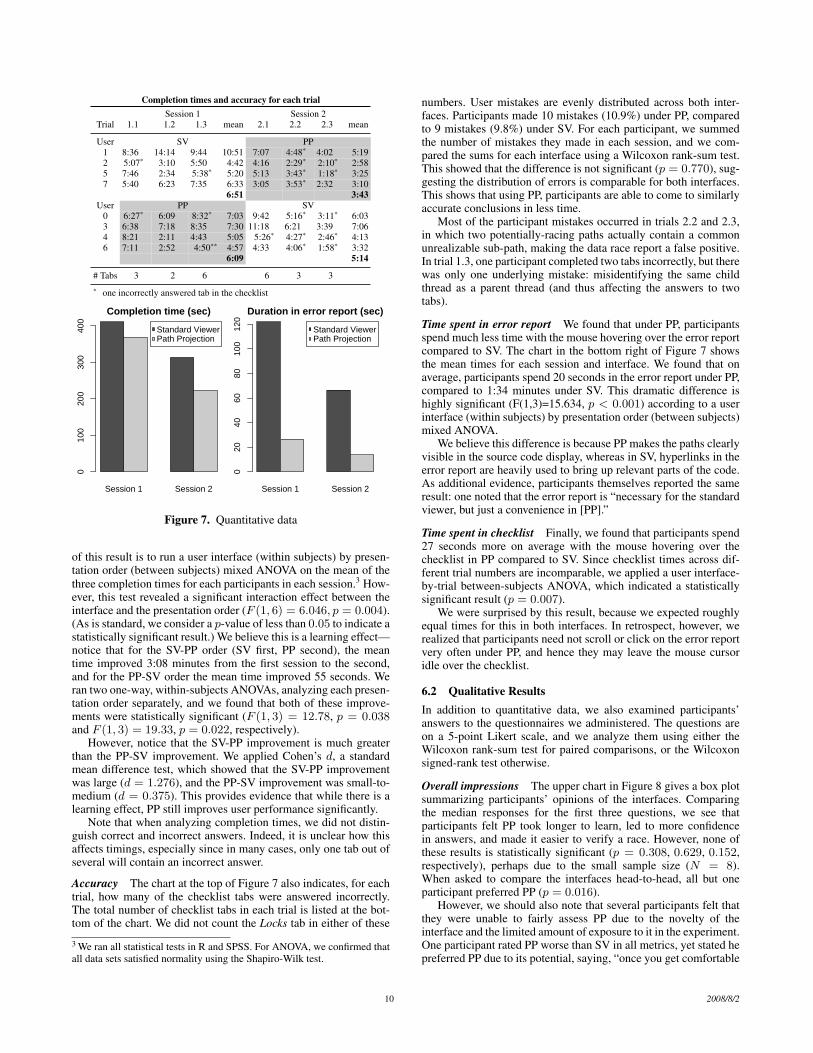
Overall impressions The upper chart in Figure 8 gives a box plotsummarizing participants’ opinions of the interfaces. Comparingthe median responses for the first three questions, we see thatparticipants felt PP took longer to learn, led to more confidencein answers, and made it easier to verify a race. However, none ofthese results is statistically significant (p = 0.308, 0.629, 0.152,respectively), perhaps due to the small sample size (N = 8).When asked to compare the interfaces head-to-head, all but oneparticipant preferred PP (p = 0.016).
However, we should also note that several participants felt thatthey were unable to fairly assess PP due to the novelty of theinterface and the limited amount of exposure to it in the experiment.One participant rated PP worse than SV in all metrics, yet stated hepreferred PP due to its potential, saying, “once you get comfortable
10 2008/8/2

●
●
Quickto learn
Confidentof answer
Easy toverify race
PreferPath Projection
12
34
5
Overall impression
Standard ViewerPath Projection
●
●
●
Errorreport
Checklist Functioninlining
Codefolding
Multi−query
Query revealsfolded code
12
34
5
Usefulness of features
Figure 8. Participants’ overall impression (1: disagree, 5: agree),and usefulness rating for particular features in Path Projection (1:not useful, 5: very useful)
with seeing [only] pieces of your code, I feel it will be moreefficient.”
Usefulness of features Finally, participants generally rated allthe features of PP as somewhat or very useful. The bottom chartin Figure 8 shows a box plot of participants’ responses, and allanswers are statistically significant in favor of PP compared to aneutral response of 3 (p < 0.032).
While participants felt that the error report was very useful, theyalso commented that it served mostly as an initial overview underPP, whereas it was critical under SV. This matches our quantitativeresult indicating participants spent much less time in the errorreport under PP.
The checklist was very well received overall. One participantsaid, “[It] saved me from having to memorize rules.” Interest-ingly, two participants felt that, while the checklist reduces mis-takes, verifying the data race takes longer. This conflicts with ourown experience—as we mentioned earlier, participants in our pilotstudy, which did not include the checklist, took notably longer totriage error reports than participants in our current study.
We thought that participants would be wary about function in-lining and code folding, since the former is an unfamiliar visual-ization and the latter hides away much code. However, participants
rated both very highly, saying particularly that code folding was“the best feature,” “my favorite feature,” and “I love using this fea-ture [code folding].”
Most participants found multi-query useful, but two did not.When we asked them why, they replied that they felt that the codefolding was already doing an adequate job without it. However,they had forgotten that the multi-query was in use by default withthe four preset queries (shown in Figure 2). We believe that multi-query is actually extremely useful in combination with code fold-ing.
6.3 Threats to ValidityThere are a number of potential threats to the validity of our results.The core threat is whether our results generalize. We had a smallnumber of participants, all of whom were students rather thanexpert programmers who had significant experience debugging dataraces. The set of programs (N = 2) and error reports (N = 6)in the experiment was small. Moreover, participants were asked totriage error reports for unfamiliar programs, rather than code basesthey had developed themselves. Lastly, despite long tutorials beforeeach experiment, we were unable to eliminate the learning effectacross our trials.
However, even with these limitations, our experiment did pro-duce statistically significant and anecdotally useful information forour population and sample trials. We leave carrying out a widerrange of experiments to future work.
One minor threat is the small set of changes we made to theprograms (Section 5.4) to avoid confusion in our participants. Us-ing more expert programmers as test subjects would obviate theneed for this. Also, the SV interface represents a typical IDE, butis not an actual, production-quality IDE. We chose this approachon purpose, so that familiarity with a particular IDE would not bea factor, but we may have omitted features that would be useful forour task.
7. Related WorkError report triaging is essentially a program comprehension task.In our study, the particular task is to determine whether two deref-erences could possibly execute simultaneously in two differentthreads. There is a substantial body of tools aimed at assisting inprogram comprehension tasks typically (but not exclusively) asso-ciated with code maintenance or re-engineering (e.g., SHriMP [40],and Code Surfer [1], to name just two more recent tools). As far aswe are aware, none of these tools has been specifically designed tosupport users of static analysis for defect detection.
Conversely, many defect detection tools that use static analysisprovide custom user interfaces [3, 30, 9, 26, 22, 1, 18, 8], IDE plug-ins [28, 19, 39, 23], or both [35]. However, we are not aware ofany prior studies that measure the impact of the user interface on astatic analysis tool’s efficacy. Indeed, many proprietary tools havelicenses that specifically prohibit publishing the results of studiesabout their tools.
Most of the above tools report the errors in part by using pro-gram paths, e.g., to illustrate a suspect data flow or an erroneous ex-ecution trace. We surveyed these tools based on publicly-availablescreenshots and literature and compared their features with PathProjection. As can be seen from Table 1, most interfaces sharesome features with Path Projection, though the implementation ofthese features is rarely the same. Code Sonar has many features incommon with Path Projection, but we believe some of its interfacechoices could be improved. For example, several of Code Sonar’sfeatures insert additional colored lines of text into the source code.We find this results in a multitude of interleaving colored lines thatmake the source code hard to understand.
11 2008/8/2
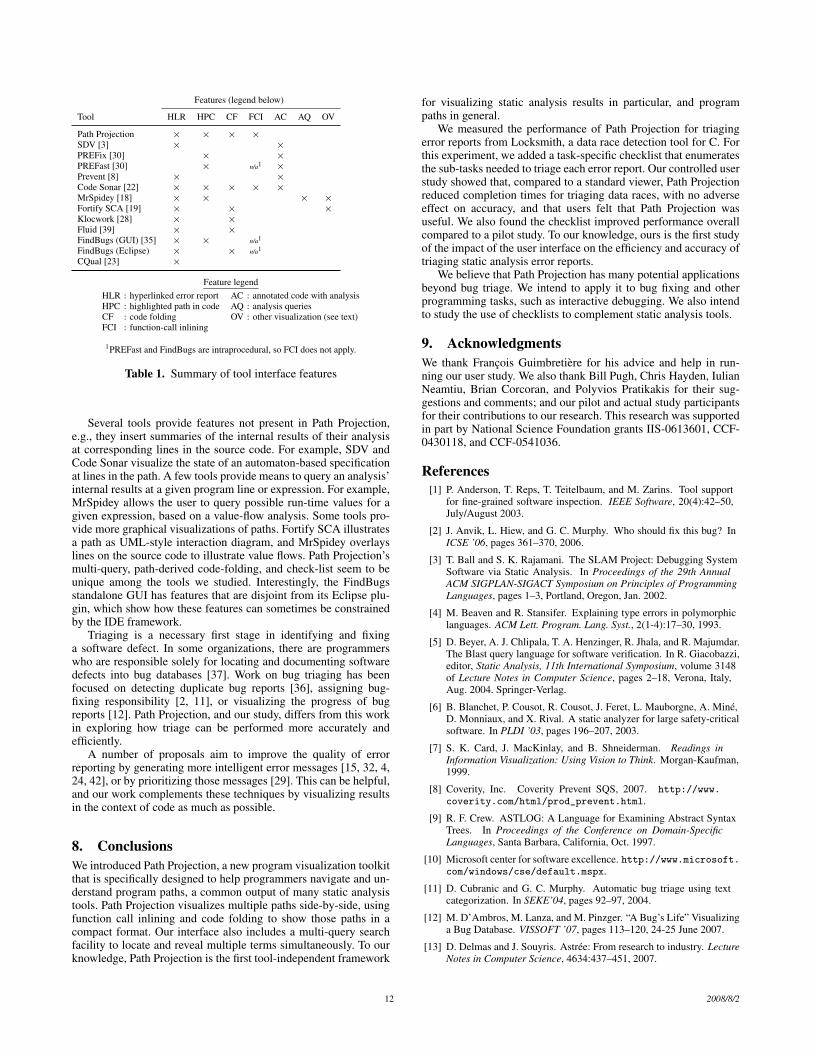
Features (legend below)
Tool HLR HPC CF FCI AC AQ OV
Path Projection × × × ×SDV [3] × ×PREFix [30] × ×PREFast [30] × n/a1 ×Prevent [8] × ×Code Sonar [22] × × × × ×MrSpidey [18] × × × ×Fortify SCA [19] × × ×Klocwork [28] × ×Fluid [39] × ×FindBugs (GUI) [35] × × n/a1
FindBugs (Eclipse) × × n/a1
CQual [23] ×
Feature legendHLR : hyperlinked error report AC : annotated code with analysisHPC : highlighted path in code AQ : analysis queriesCF : code folding OV : other visualization (see text)FCI : function-call inlining
1PREFast and FindBugs are intraprocedural, so FCI does not apply.
Table 1. Summary of tool interface features
Several tools provide features not present in Path Projection,e.g., they insert summaries of the internal results of their analysisat corresponding lines in the source code. For example, SDV andCode Sonar visualize the state of an automaton-based specificationat lines in the path. A few tools provide means to query an analysis’internal results at a given program line or expression. For example,MrSpidey allows the user to query possible run-time values for agiven expression, based on a value-flow analysis. Some tools pro-vide more graphical visualizations of paths. Fortify SCA illustratesa path as UML-style interaction diagram, and MrSpidey overlayslines on the source code to illustrate value flows. Path Projection’smulti-query, path-derived code-folding, and check-list seem to beunique among the tools we studied. Interestingly, the FindBugsstandalone GUI has features that are disjoint from its Eclipse plu-gin, which show how these features can sometimes be constrainedby the IDE framework.
Triaging is a necessary first stage in identifying and fixinga software defect. In some organizations, there are programmerswho are responsible solely for locating and documenting softwaredefects into bug databases [37]. Work on bug triaging has beenfocused on detecting duplicate bug reports [36], assigning bug-fixing responsibility [2, 11], or visualizing the progress of bugreports [12]. Path Projection, and our study, differs from this workin exploring how triage can be performed more accurately andefficiently.
A number of proposals aim to improve the quality of errorreporting by generating more intelligent error messages [15, 32, 4,24, 42], or by prioritizing those messages [29]. This can be helpful,and our work complements these techniques by visualizing resultsin the context of code as much as possible.
8. ConclusionsWe introduced Path Projection, a new program visualization toolkitthat is specifically designed to help programmers navigate and un-derstand program paths, a common output of many static analysistools. Path Projection visualizes multiple paths side-by-side, usingfunction call inlining and code folding to show those paths in acompact format. Our interface also includes a multi-query searchfacility to locate and reveal multiple terms simultaneously. To ourknowledge, Path Projection is the first tool-independent framework
for visualizing static analysis results in particular, and programpaths in general.
We measured the performance of Path Projection for triagingerror reports from Locksmith, a data race detection tool for C. Forthis experiment, we added a task-specific checklist that enumeratesthe sub-tasks needed to triage each error report. Our controlled userstudy showed that, compared to a standard viewer, Path Projectionreduced completion times for triaging data races, with no adverseeffect on accuracy, and that users felt that Path Projection wasuseful. We also found the checklist improved performance overallcompared to a pilot study. To our knowledge, ours is the first studyof the impact of the user interface on the efficiency and accuracy oftriaging static analysis error reports.
We believe that Path Projection has many potential applicationsbeyond bug triage. We intend to apply it to bug fixing and otherprogramming tasks, such as interactive debugging. We also intendto study the use of checklists to complement static analysis tools.
9. AcknowledgmentsWe thank Francois Guimbretiere for his advice and help in run-ning our user study. We also thank Bill Pugh, Chris Hayden, IulianNeamtiu, Brian Corcoran, and Polyvios Pratikakis for their sug-gestions and comments; and our pilot and actual study participantsfor their contributions to our research. This research was supportedin part by National Science Foundation grants IIS-0613601, CCF-0430118, and CCF-0541036.
References[1] P. Anderson, T. Reps, T. Teitelbaum, and M. Zarins. Tool support
for fine-grained software inspection. IEEE Software, 20(4):42–50,July/August 2003.
[2] J. Anvik, L. Hiew, and G. C. Murphy. Who should fix this bug? InICSE ’06, pages 361–370, 2006.
[3] T. Ball and S. K. Rajamani. The SLAM Project: Debugging SystemSoftware via Static Analysis. In Proceedings of the 29th AnnualACM SIGPLAN-SIGACT Symposium on Principles of ProgrammingLanguages, pages 1–3, Portland, Oregon, Jan. 2002.
[4] M. Beaven and R. Stansifer. Explaining type errors in polymorphiclanguages. ACM Lett. Program. Lang. Syst., 2(1-4):17–30, 1993.
[5] D. Beyer, A. J. Chlipala, T. A. Henzinger, R. Jhala, and R. Majumdar.The Blast query language for software verification. In R. Giacobazzi,editor, Static Analysis, 11th International Symposium, volume 3148of Lecture Notes in Computer Science, pages 2–18, Verona, Italy,Aug. 2004. Springer-Verlag.
[6] B. Blanchet, P. Cousot, R. Cousot, J. Feret, L. Mauborgne, A. Mine,D. Monniaux, and X. Rival. A static analyzer for large safety-criticalsoftware. In PLDI ’03, pages 196–207, 2003.
[7] S. K. Card, J. MacKinlay, and B. Shneiderman. Readings inInformation Visualization: Using Vision to Think. Morgan-Kaufman,1999.
[8] Coverity, Inc. Coverity Prevent SQS, 2007. http://www.coverity.com/html/prod_prevent.html.
[9] R. F. Crew. ASTLOG: A Language for Examining Abstract SyntaxTrees. In Proceedings of the Conference on Domain-SpecificLanguages, Santa Barbara, California, Oct. 1997.
[10] Microsoft center for software excellence. http://www.microsoft.com/windows/cse/default.mspx.
[11] D. Cubranic and G. C. Murphy. Automatic bug triage using textcategorization. In SEKE’04, pages 92–97, 2004.
[12] M. D’Ambros, M. Lanza, and M. Pinzger. “A Bug’s Life” Visualizinga Bug Database. VISSOFT ’07, pages 113–120, 24-25 June 2007.
[13] D. Delmas and J. Souyris. Astree: From research to industry. LectureNotes in Computer Science, 4634:437–451, 2007.
12 2008/8/2

[14] I. Dillig, T. Dillig, and A. Aiken. Static error detection using semanticinconsistency inference. In PLDI ’07, pages 435–445, 2007.
[15] D. Duggan and F. Bent. Explaining type inference. Science ofComputer Programming, 27(1):37–83, 1996.
[16] D. Engler and K. Ashcraft. Racerx: effective, static detection of raceconditions and deadlocks. In SOSP ’03, pages 237–252, 2003.
[17] D. Engler, B. Chelf, A. Chou, and S. Hallem. Checking System RulesUsing System-Specific, Programmer-Written Compiler Extensions.In OSDI ’00, 2000.
[18] C. Flanagan, M. Flatt, S. Krishnamurthi, S. Weirich, and M. Felleisen.Catching Bugs in the Web of Program Invariants. In PLDI ’96, pages23–32, 1996.
[19] Fortify Software Inc. Fortify Source Code Analysis, 2007. http://www.fortifysoftware.com/products/sca/.
[20] J. S. Foster, R. Johnson, J. Kodumal, and A. Aiken. Flow-InsensitiveType Qualifiers. ACM Transactions on Programming Languages andSystems, 28(6):1035–1087, Nov. 2006.
[21] G. W. Furnas. Generalized fisheye views. In CHI ’86: Proceedingsof the SIGCHI conference on Human factors in computing systems,pages 16–23, New York, NY, USA, 1986. ACM.
[22] GrammaTech, Inc. CodeSonar, 2007. http://www.grammatech.com/products/codesonar/overview.html.
[23] D. Greenfieldboyce and J. S. Foster. Visualizing Type QualifierInference with Eclipse. In Workshop on Eclipse TechnologyeXchange, Vancouver, British Columbia, Canada, Oct. 2004.
[24] C. Haack and J. B. Wells. Type error slicing in implicitly typedhigher-order languages. Sci. Comput. Program., 50(1-3):189–224,2004.
[25] B. Hackett, M. Das, D. Wang, and Z. Yang. Modular checking forbuffer overflows in the large. In ICSE ’06, pages 232–241, 2006.
[26] S. Hallem, B. Chelf, Y. Xie, and D. Engler. A System and Languagefor Building System-Specific, Static Analyses. In PLDI ’02, pages69–82, 2002.
[27] C. C. Jaspan, I.-C. Chen, and A. Sharma. Understanding the Value ofProgram Analysis Tools. In OOPSLA’07 Practitioner Reports, 2007.
[28] Klocwork Inc. Klocwork Enterprise Development Suite, 2007.http://www.klocwork.com.
[29] T. Kremenek, K. Ashcraft, J. Yang, and D. Engler. Correlationexploitation in error ranking. In FSE ’04, pages 83–93, 2004.
[30] J. R. Larus, T. Ball, M. Das, R. DeLine, M. Fahndrich, J. Pincus, S. K.Rajamani, and R. Venkatapathy. Righting Software. IEEE Software,21(3):92–100, May/June 2004.
[31] M. Naik, A. Aiken, and J. Whaley. Effective static race detection forjava. In PLDI ’06, pages 308–319, 2006.
[32] M. Neubauer and P. Thiemann. Discriminative sum types locate thesource of type errors. In ICFP ’03, pages 15–26, 2003.
[33] J. Pincus. User Interaction Issues in Defect Detection Tools.Presentation at UW/MSR Research Summer Institute, 2001. http://research.microsoft.com/users/jpincus/uwmsrsi01.ppt.
[34] P. Pratikakis, J. S. Foster, and M. Hicks. Locksmith: Context-SensitiveCorrelation Analysis for Race Detection. In PLDI ’06, pages 320–331, 2006.
[35] B. Pugh et al. FindBugs, 2007. http://findbugs.sourceforge.net.
[36] P. Runeson, M. Alexandersson, and O. Nyholm. Detection ofDuplicate Defect Reports Using Natural Language Processing. InICSE ’07, pages 499–510, 2007.
[37] J. R. Ruthruff, J. Penix, J. D. Morgenthaler, S. Elbaum, andG. Rothermel. Predicting accurate and actionable static analysiswarnings. In ICSE ’08, 2008. To appear.
[38] S. Savage, M. Burrows, G. Nelson, P. Sobalvarro, and T. Anderson.Eraser: A Dynamic Data Race Detector for Multi-Threaded Programs.
In SOSP ’97, pages 27–37, 1997.
[39] W. Scherlis et al. The Fluid Project, 2007. http://www.fluid.cs.cmu.edu:8080/Fluid.
[40] M.-A. Storey. A Cognitive Framework For Describing and EvaluatingSoftware Exploration Tools. PhD thesis, Computing Science, SimonFraser University, Canada, 1998.
[41] M. Weiser. Program slicing. IEEE Transactions on SoftwareEngineering, 10(4):352–357, July 1984.
[42] J. Yang, J. Wells, P. Trinder, and G. Michaelson. Improved type errorreporting, 2000.
13 2008/8/2