Embed Size (px)
Citation preview

Pathogen Specific
Diarrheal Diseases
Review Process, Preliminary
Results and Plans for Finalization
Christa Fischer Walker
Johns Hopkins Bloomberg School of Public Health
Department of International Health

• Search Objective: published and unpublished literature meeting inclusion/exclusion criteria
• Search terms included combinations of:
– “diarrhea”, “morbidity”, “incidence”,
“prevalence”, “mortality”, “etiology”, “cause of
death” – Key words and MeSH terms
• Databases searched: – PubMed
– WHO library (WHOLIST)
– SIGLE (System for Information on Grey Literature in Europe),
– CAB Abstracts
Diarrhea Morbidity, Mortality, and Etiology:
Search Strategy

Inclusion:
• Prospective studies conducted in representative populations
• Studies with > 12 mo of surveillance
Exclusion:
• Special populations (travelers, cancer patients, etc), except HIV
• Patients hospitalized for reasons other than diarrhea
• Antibiotic associated diarrhea
• Studies that do not articulate age ( < 5 / > 5 years)
• Case reports of outbreaks
• Recall periods > 2 wks for morbidity
Inclusion / Exclusion Criteria
(not comprehensive)

Mortality

MORTALITY: Modeling Goal
• Goal: Calculate diarrhea proportionate mortality for
2008 and 1990 using single cause model for all
countries lacking appropriate VR data including:
– 119 countries lacking all VR data or < 90% coverage of VR
data
• Model has been tested for 2008. A similar model will
be run for 1990
• Final results have been submitted for publication.
• Results will be available on CHERG website following
publication

10646 Titles identified for
possible inclusion
Titles screened
1871 Abstracts identified
Abstracts screened
443 Full Papers screened
Selection Process for Mortality
90 Papers Included in
Final MORTALITY
database

Mortality Model Inputs
90 studies, including 96 Data Points & > 650,000 Deaths

Morbidity

MORBIDITY Review Objective and Update
• Goal: Calculate diarrhea incidence rates for 2010 and
1990 using age specific incidence data from cohort
• Final results have been submitted to the Global
Burden of Disease Project and have been submitted
for publication
• Results will be available on CHERG website following
publication

10646 Titles identified for
possible inclusion
Titles screened
1871 Abstracts identified
Abstracts screened
443 Full Papers screened
Selection Process for Morbidity
Systematic Review
70 Papers Included in
Final MORBIDITY
database
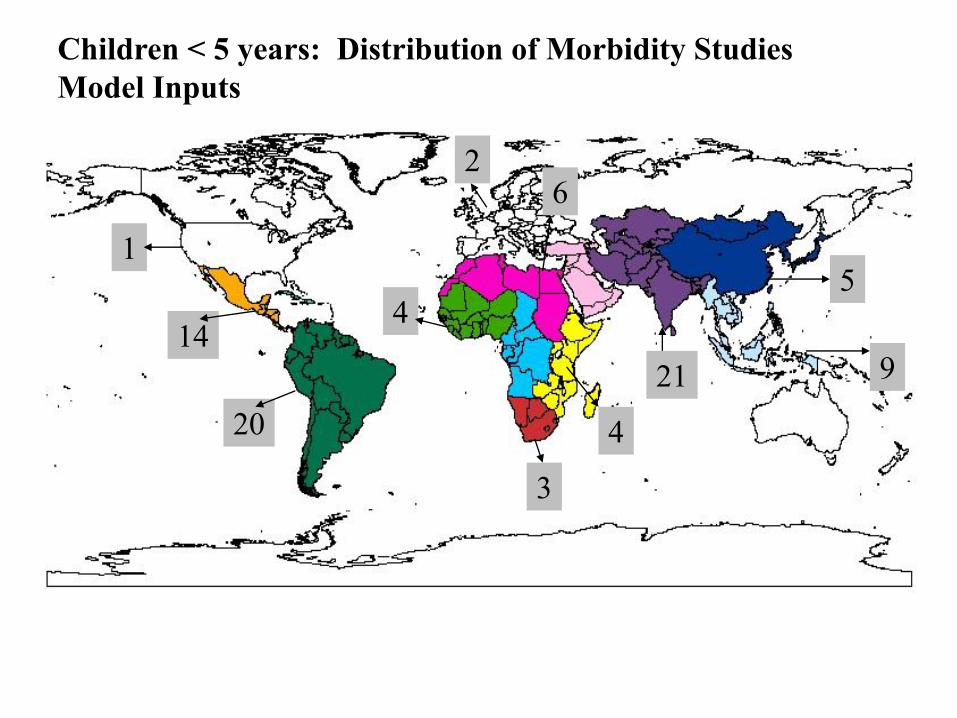
Children < 5 years: Distribution of Morbidity Studies
Model Inputs
14
20
5
2
4
21 9
4
3
1
6

Diarrhea Duration & Severity
Systematic Review
GOAL: Describe the proportion of diarrhea episodes for
children under 5 that are mild, moderate, and severe for
better understanding of the burden of diarrhea disease
• Literature search for peer-reviewed publications on the
duration and/or severity of diarrhea in children and
adults
• Pubmed Mesh search terms: diarrhea, gastroenteritis,
duration, persistence, severity, infant, child, teenage,
adult
• Published from 1990-present in any language
• Reviewed the full papers of unique publications with
relevant title/abstract

Diarrhea Duration in Children
• 1,604 unique publications -> 121 relevant
titles/abstracts -> 49 included studies
Measure of Duration Reported # Studies* Mean Duration 34 Median Duration 5 Proportion Persistent (≥14 days) 18 Study Location by WHO Region Africa 6 Europe 0 Eastern Mediterranean 3 Americas 22 South East Asia 15 Western Pacific 2 * Single studies may report multiple measures and/or study locations

Diarrhea Severity
• 3,061 unique publications -> 284 relevant
titles/abstracts
• Review of relevant publications currently in progress
• According to preliminary data abstraction, the measures
of severity implemented include:
– Level of dehydration (mild, moderate, severe)
– Daily frequency of loose stool passage
– Presence of vomiting & blood and/or mucus in stool
– 20-point Vesikari scoring system, combining the
above indicators and episode duration

Duration and Severity Next Steps
• Final duration and severity results have been
submitted for publication and will be available on
the CHERG website after publication

Etiology

15,881 potential relevant
citations in electronic search
15,203
references
excluded
678 articles for further
evaluation
+
94 from hand search
TOTAL = 772
548 articles excluded
155 articles from which
205 studies selected (115
inpatients + 46 outpatients
+ 44 community)
Selection Process for Etiology
69 articles excluded as
inpatient/outpatient
Under
triple
review

ETIOLOGY: Model Inputs

Goal: Estimate median prevalence proportion for each
pathogen for all children 0-59 mo by type of study
(outpatient, inpatient, and community).
Age adjustments: Studies that do not directly report
prevalence by pathogen for all ages 0-59 mo
– Step 1: Calculate age group conversion factors using all
studies that report both prevalence for all 0-59 and smaller
age groups. The conversion factor for age group X is
calculated as the median of prev0-59 / prevX
– Step 2: Proportion reported for each age group given in the
study is converted to a full 0-59 mo estimate
Analytic Methods (I)

Median pathogen prevalence = median of age -
converted rates by study population (in-, out-patient, and
community)
Uncertainty estimates: • Bootstrap confidence intervals are calculated for those estimates
based on a minimum of 3 studies.
• ‘Pseudo-datasets’ created by sampling studies with
replacement from the real dataset. Each of the 1000 pseudo-
datasets is used in the estimation procedure described above to
generate a corresponding 1000 prevalence proportions. The
2.5th and 97.5th percentile of these proportions give the 95% CI.
Analytic Methods (II)

• Final results have been submitted for publication and
will be available on the CHERG website after
publication
Moving Forward


![Climatic Factors in Relation to Diarrhea for Informed ...3 58Introduction 59An estimated 3.4 million people die from diarrheal and other water-related diseases each year 60[1].Diarrheal](https://img.pdfslide.net/doc/110x75/608634b5c339056f937013d7/climatic-factors-in-relation-to-diarrhea-for-informed-3-58introduction-59an.jpg)