Embed Size (px)
Citation preview
Pathogens and Invasive Species: Insights from Avian Systems
Andy Dobson, EEB, Princeton University, Princeton, NJ&Santa Fe Institute,Santa Fe, NM
Wes Hochachka, Paul Hurtado, Andre Dhondt – Cornell University
Leslie Reperant (Princeton), Thijs Kuiken, Erasmus Labs, The Netherlands
Eric Seabloom, NCEAS, Santa Barbara, CA
Juliet Pulliam (Princeton), Peter Daszak, Consortium for Conservation Medicine, Steve Luby ICDDR, Dakar , Bangladesh.

Menu de jour….
o Pathogens in Invasive Species
o Invasive Species without pathogens
o Phylogenies of Invasive Species
o Hanta virus in Malaysia and Bangladesh
o Avian Influenza in Europe, 2006.

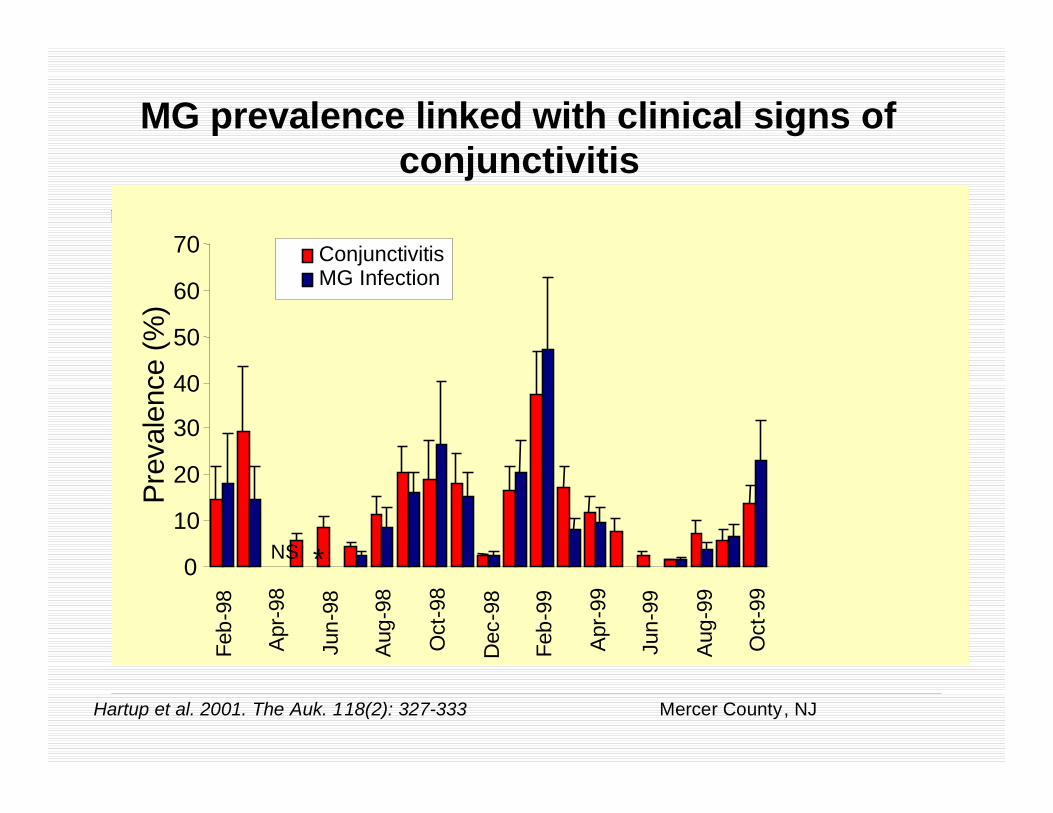
Mycoplasmal conjunctivitis
• caused by the bacterium Mycoplasma gallisepticum
• found in domestic poultry worldwide
• novel strain infects House Finches
• clear external clinical signs
• clinical signs are closely related
to presence of pathogen
Humans aren’t only species at risk – monitoring focuses on humans and livestock….
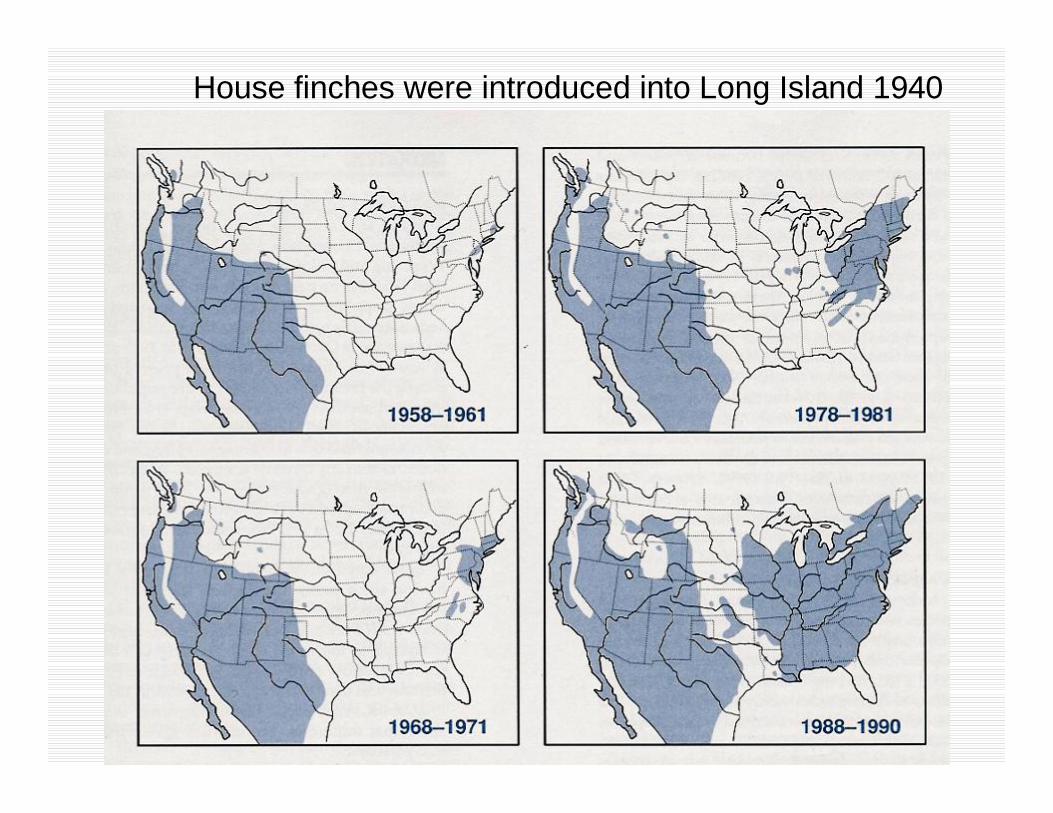
House finches were introduced into Long Island 1940
the Team: Cornell: Dhondt, Kollias, Cooch ; UW, Madison: HartupNCSU: Ley; Princeton: Dobson ; Emory: Altizer;
+students, collaborators
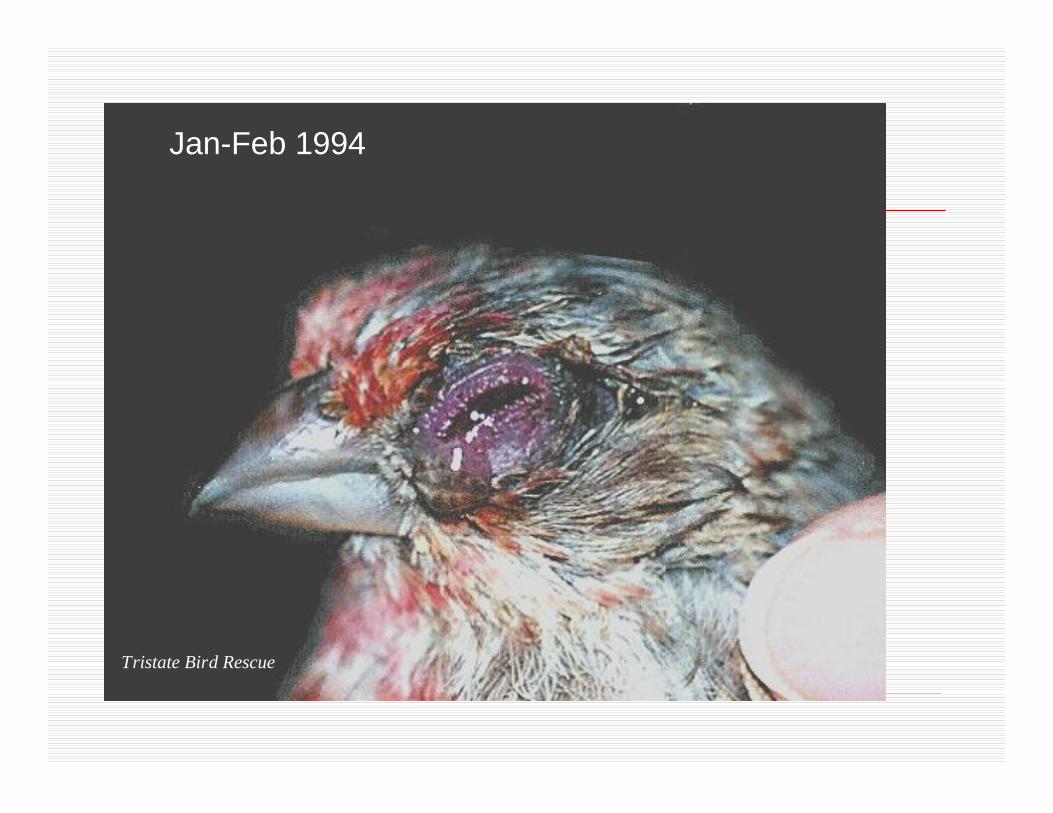
Tristate Bird Rescue
Jan-Feb 1994
0
10
20
30
40
50
60
70Fe
b-98
Apr
-98
Jun-
98
Aug
-98
Oct
-98
Dec
-98
Feb-
99
Apr
-99
Jun-
99
Aug
-99
Oct
-99
Prev
alen
ce (%
)
ConjunctivitisMG Infection
NS *
MG prevalence linked with clinical signs of conjunctivitis
Mercer County, NJHartup et al. 2001. The Auk. 118(2): 327-333

10 months after first observation(HFDS: Dhondt AA, Tessaglia DL, Slothower RL. 1998.. J. Wildlife Dis. 34: 265-280.
)

Disease Spread Rapidly ThroughEastern North America
After 10 month After 2.5 Years

House Finch abundance decreased dramatically because of the new disease
Bird
s/H
our
1970 1980 1990 2000
01
23
Eastern VA, Eastern MD, DE
Year
Bird
s/H
our
1970 1980 1990 2000
02
46
810
Central PA, Eastern NY
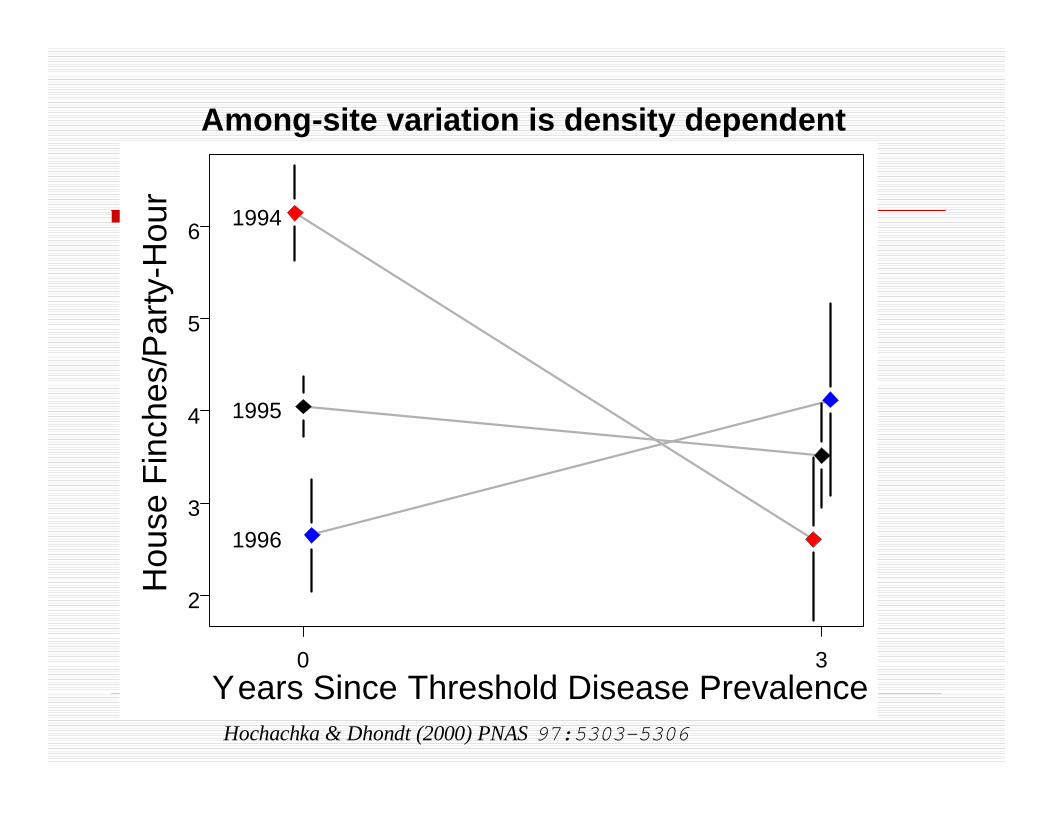
Among-site variation is density dependent
Years Since Threshold Disease Prevalence
Hou
se F
inch
es/P
arty
-Hou
r
0 3
2
3
4
5
6 1994
1995
1996
Hochachka & Dhondt (2000) PNAS 97:5303-5306
1990 1995 2000
4
6
8
10
12
60
70
80
90
100
New York and Pennsylvania%
Fee
ders
with
Hou
se F
inch
es (o
pen
circ
les)
Hou
se F
inch
Gro
up S
izes
(fill
ed d
iam
onds
)
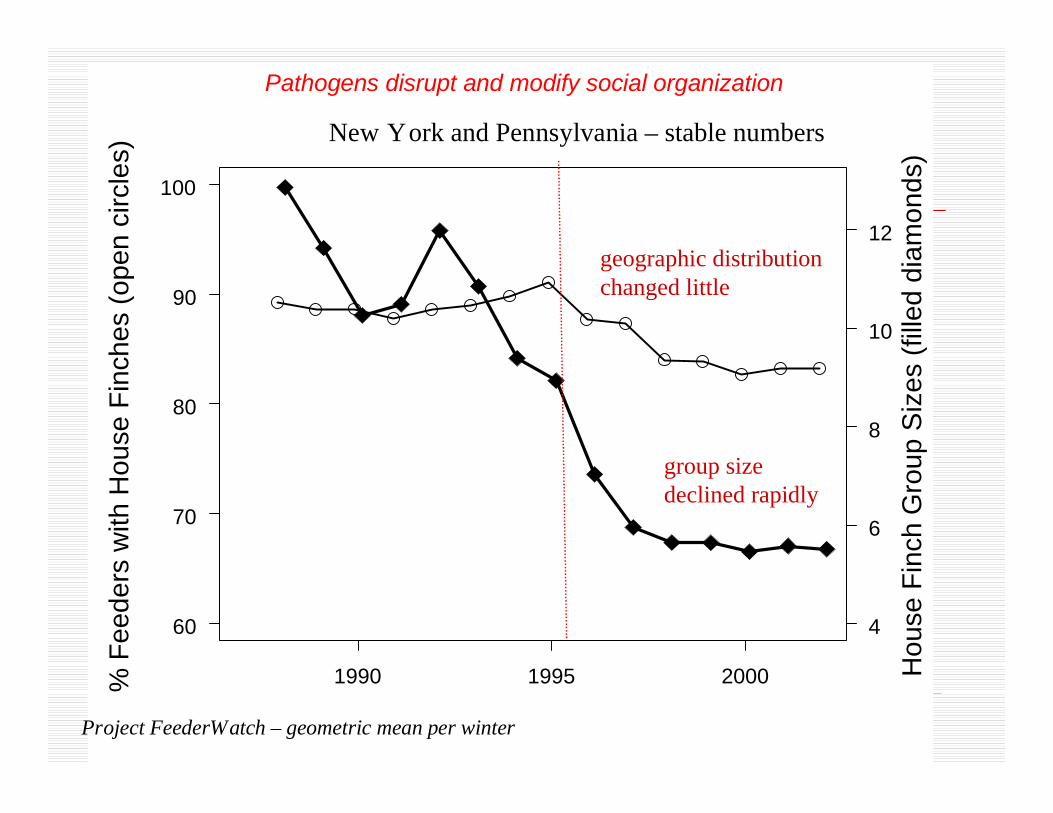
Project FeederWatch – geometric mean per winter
group size declined rapidly
geographic distribution changed little
New York and Pennsylvania – stable numbers
Pathogens disrupt and modify social organization

Parasites and invasive species(with Mark Torchin, Kevin Lafferty, Armand Kuris, NCEAS)

Native and introduced range of green crab

Parasites of the green crab in Europe
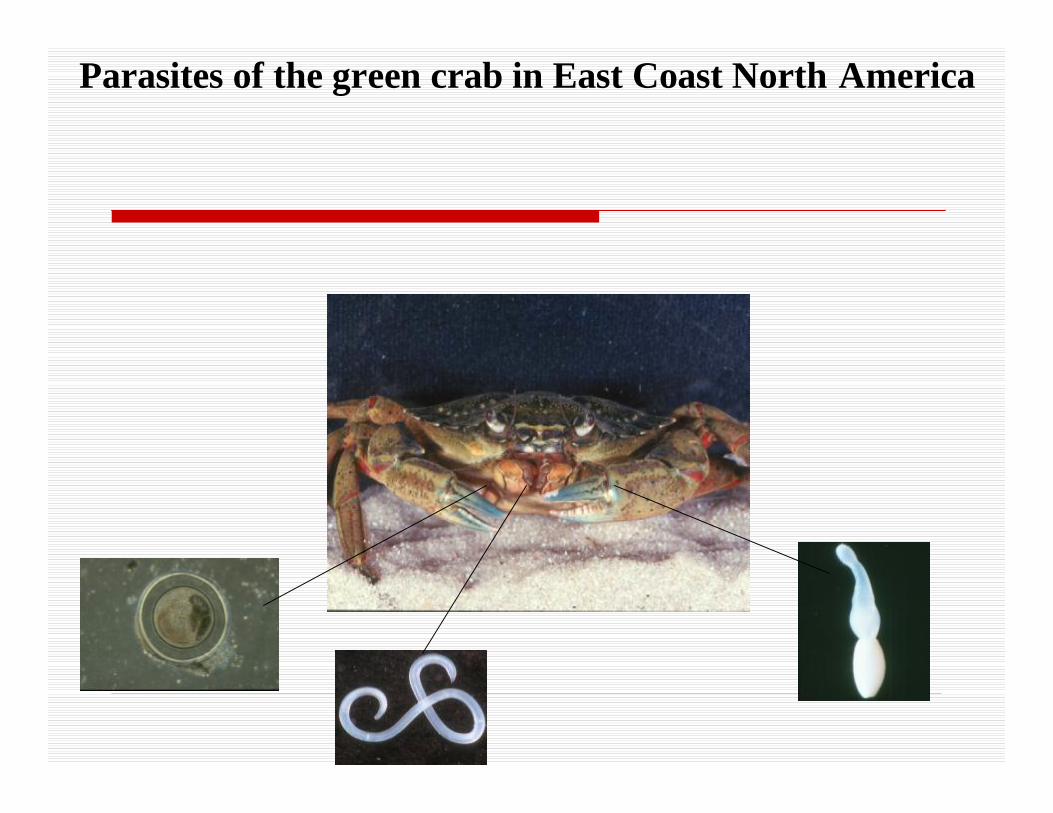
Parasites of the green crab in East Coast North America

Parasites of the green crab in Australia

Parasites of the green crab in West Coast North America
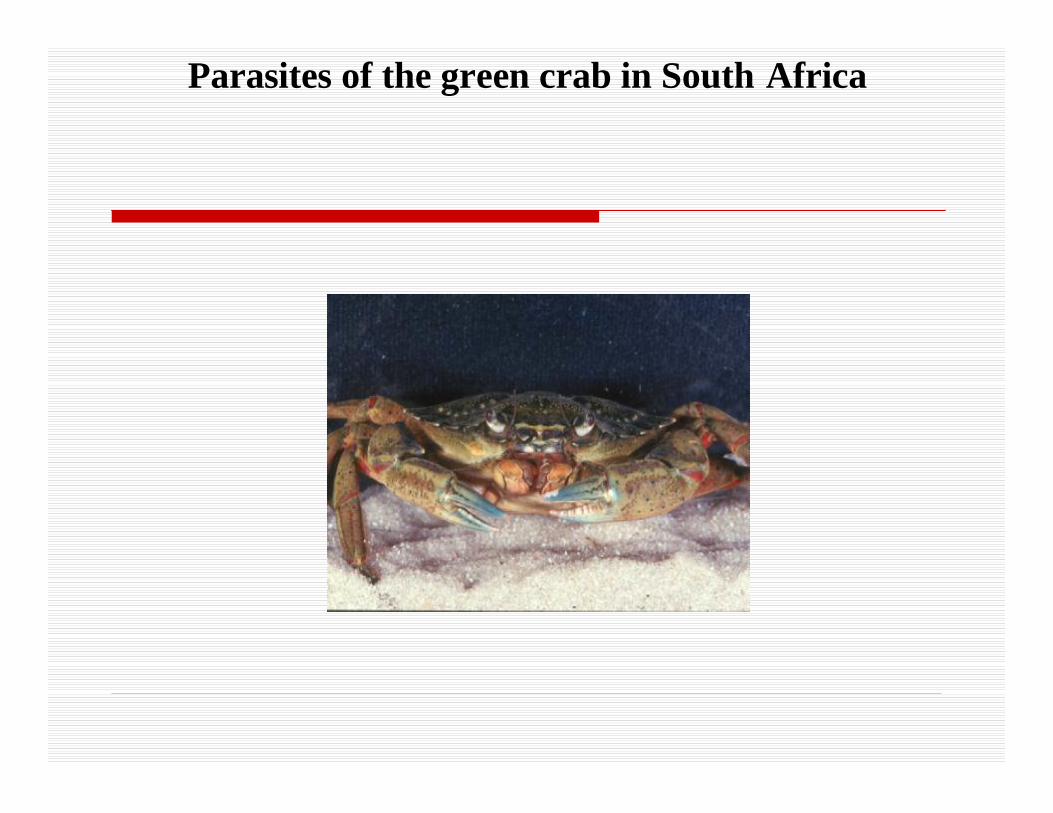
Parasites of the green crab in South Africa
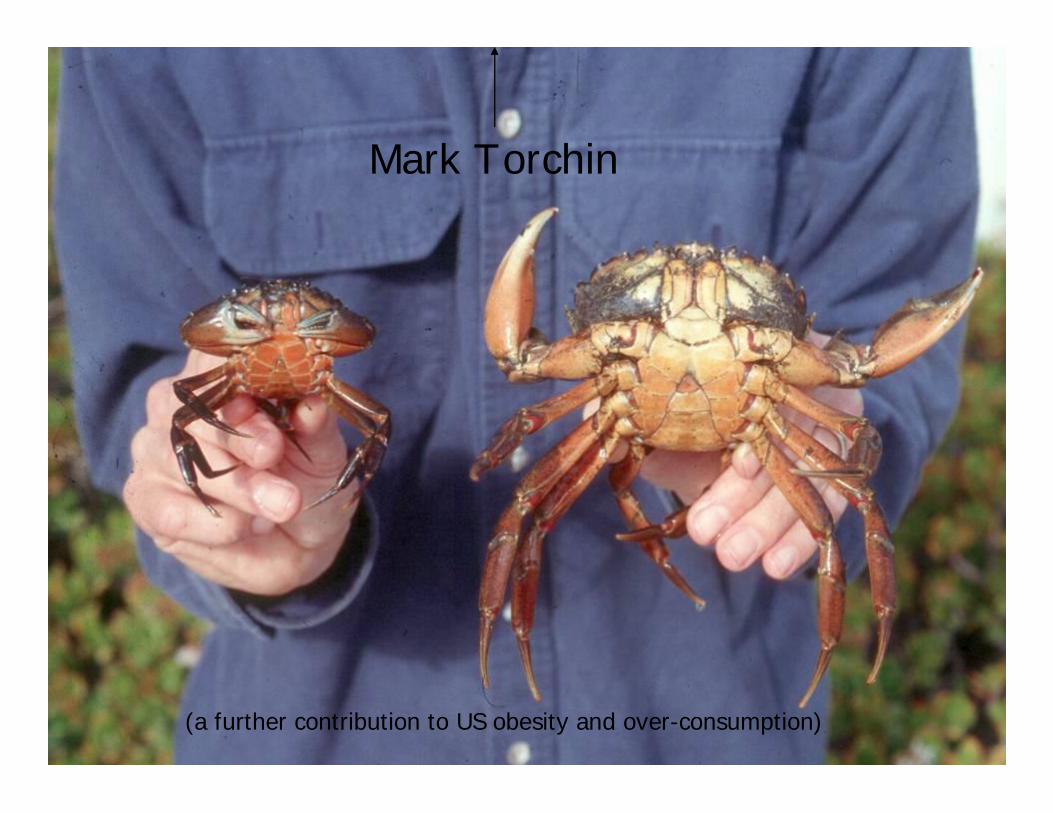
Mark Torchin
(a further contribution to US obesity and over-consumption)

ò = molluscs (N = 7)
¢ = crustaceans (N = 3)
p = fishes (N = 6)
Å = amphibians and reptiles (N = 3)
u = birds (N = 3)
£= mammals (N = 4).
(a) Parasite species richness
0
0.2
0.4
0.6
0.8
1
0 0.2 0.4 0.6 0.8 1Native
Intr
oduc
ed
Torchin et al. 2003 Nature 421: 628-630

ò = molluscs (N = 7)
¢ = crustaceans (N = 3)
p = fishes (N = 6)
Å = amphibians and reptiles (N = 3)
u = birds (N = 3)
£= mammals (N = 4).
(a) Parasite species richness
0
0.2
0.4
0.6
0.8
1
0 0.2 0.4 0.6 0.8 1Native
Intr
oduc
ed
Torchin et al. 2003 Nature 421: 628-630
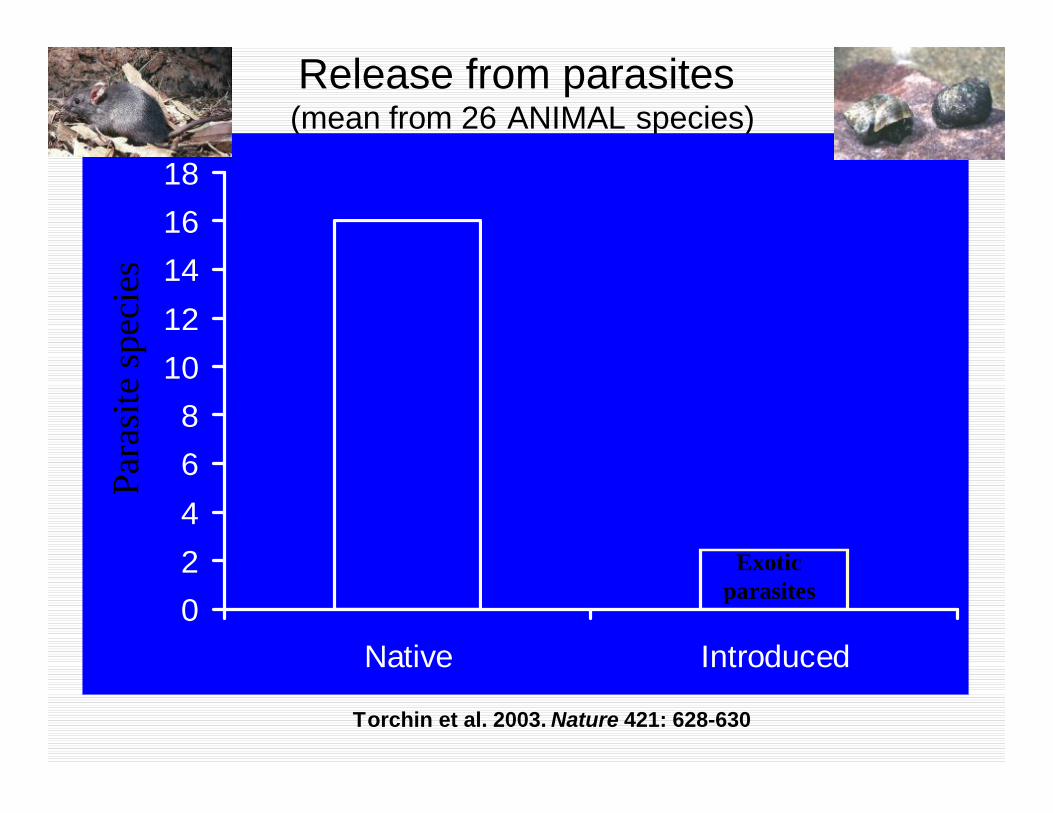
Release from parasites(mean from 26 ANIMAL species)
02468
1012141618
IntroducedNative
Para
site
spec
ies
Torchin et al. 2003. Nature 421: 628-630
Exotic parasites
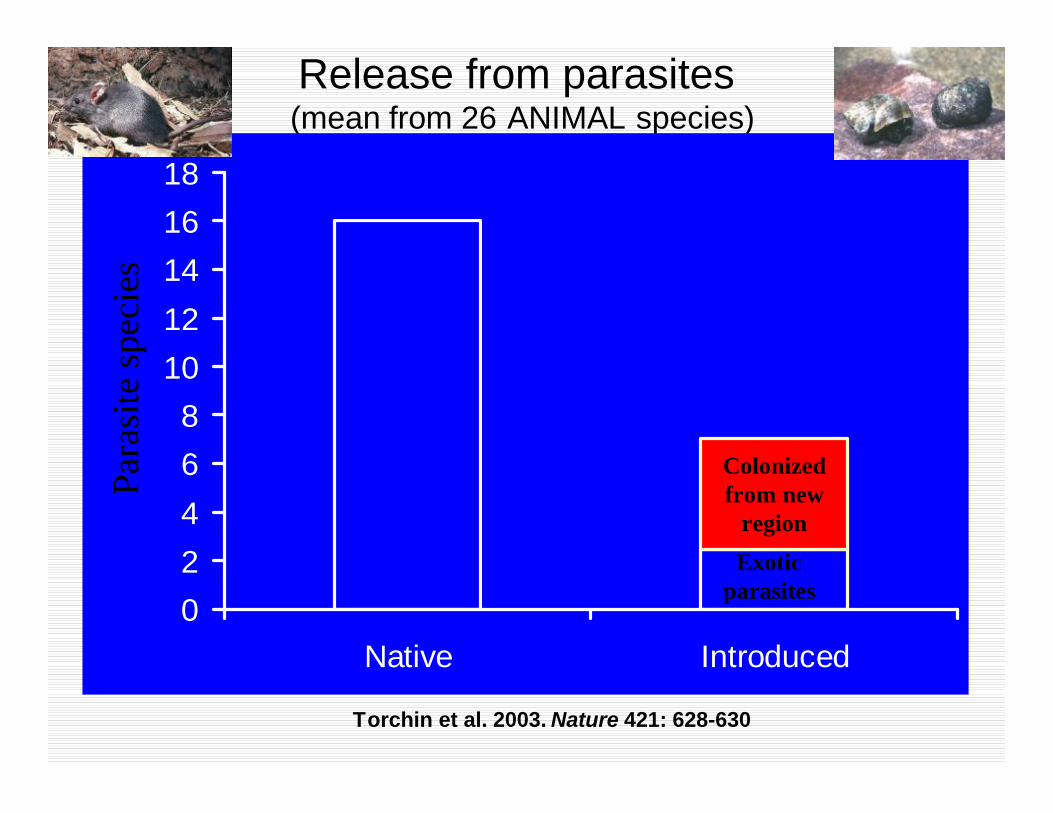
Release from parasites(mean from 26 ANIMAL species)
02468
1012141618
IntroducedNative
Para
site
spec
ies
Torchin et al. 2003. Nature 421: 628-630
Colonized from new
regionExotic
parasites

Native and Alien Plants in California
Seabloom, Dobson and Stoms, Ecological Applications

Seabloom, Dobson and Stoms, Ecological Applications

Nipah Virus: a case study
Paramyxoviridae
o Includes measles, distemper , mumps
o Respiratory infections
o Life-long immunity
Hendra virus (Paramyxoviridae): infects bats, horses, humans

A real Nipah victim (on left!)

Pteropid bats are reservoirs for Nipah and Hendra viruses (Photo Raina Plowright)

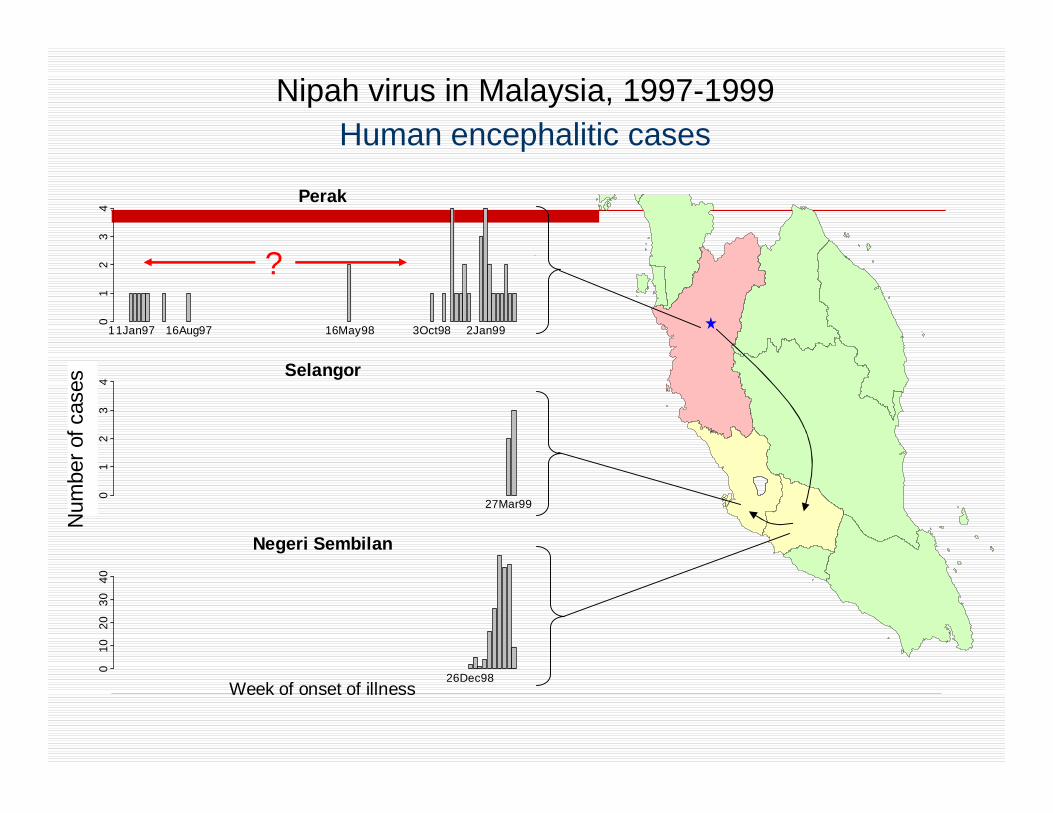
Nipah virus in Malaysia, 1997-1999Human encephalitic cases
11Jan97 16Aug97 16May98 3Oct98 2Jan99
Perak
01
23
4
27Mar99
Selangor
Num
ber o
f cas
es0
12
34
26Dec98
Negeri Sembilan
Week of onset of illness
010
2030
40
Num
ber o
f cas
es
?

Chapter 4
Nipah virus dynamics in domestic pig populations
Human cases of Nipah virus encephalitis
012345
Jan-97 Apr-97 Jul-97 Oct-97 Jan-98 Apr-98 Jul-98 Oct-98 Jan-99 Apr-99
05
101520253035404550
Jan-97 Apr-97 Jul-97 Oct-97 Jan-98 Apr-98 Jul-98 Oct-98 Jan-99 Apr-99
Num
ber o
f new
cas
es
ß---Why the long delay ?? --------------à ???

Nipah virus dynamics in domestic pig populations
0
5000
0
5000
0
5000
0 100 200 300 400 500 600 700 8000
5000
Time since spillover (days)
Num
ber o
f pig
s in
fect
ed
Sows
Piglets
Weaners
Porkers
Human cases of Nipah virus encephalitis
012345
Jan-97 Apr-97 Jul-97 Oct-97 Jan-98 Apr-98 Jul-98 Oct-98 Jan-99 Apr-99

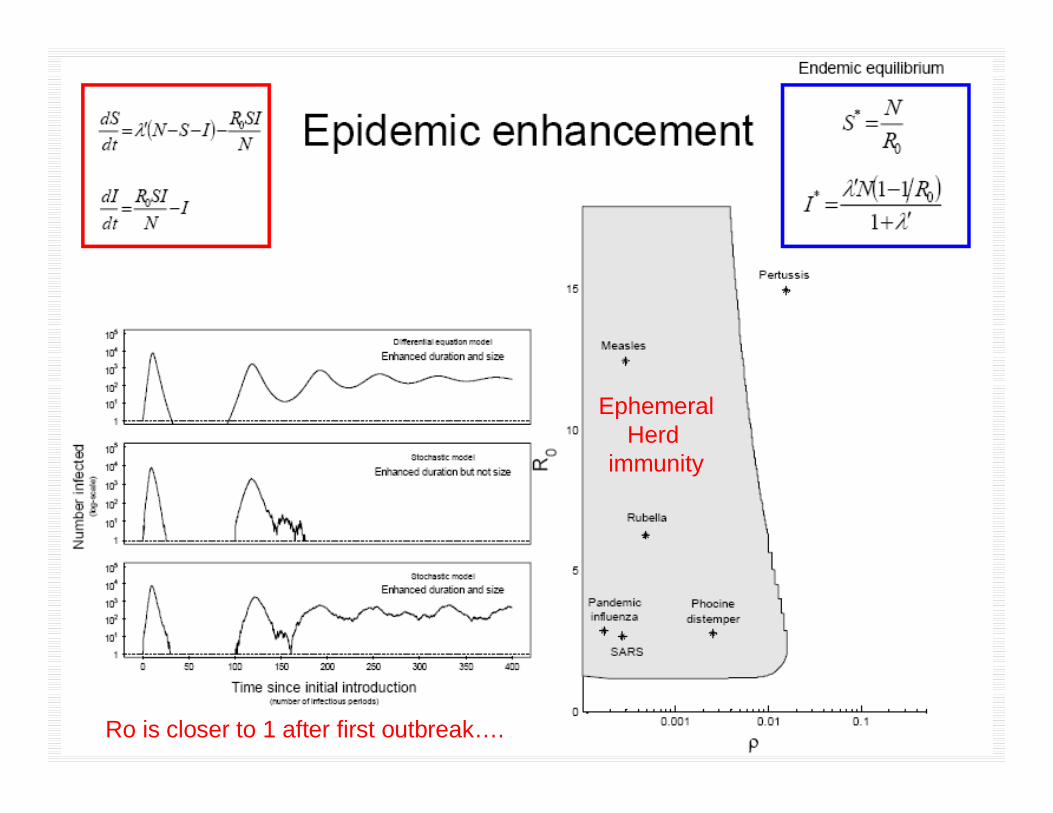
Epidemics are enhanced in a partially immune population(longer duration and increased total number of infectious individuals)
0.2 0.4 0.6 0.8 1.0
010
020
030
0
Epidemic enhancement in partially immune populations
Dur
atio
n of
epi
dem
ic (i
n da
ys)
Median25/75 %iles
0.2 0.4 0.6 0.8 1.0
010
000
2500
0
Percent of population immune upon introduction of virus
Tot
al n
umbe
r of c
ases
Median25/75 %iles
Nipah virus emergenceRepeated spillover
EphemeralHerd
immunity
Ro is closer to 1 after first outbreak….
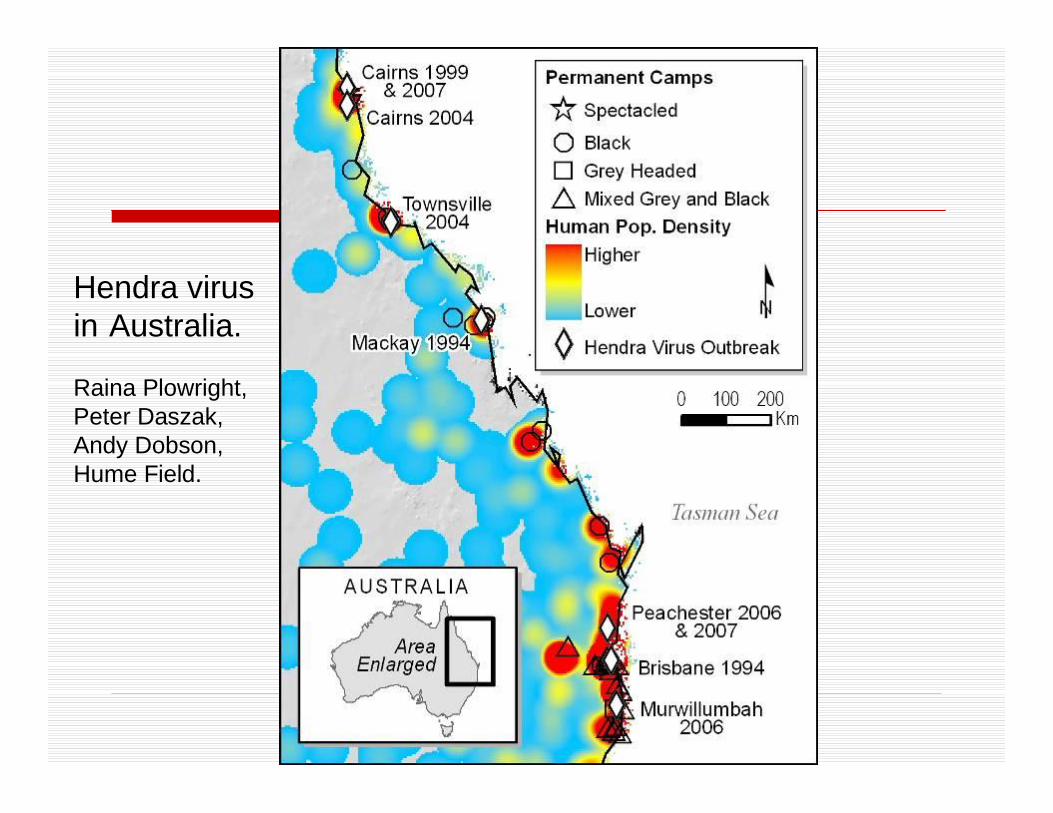
Hendra virusin Australia.
Raina Plowright,Peter Daszak,Andy Dobson,Hume Field.
Traveling WavesPlowright et al, in press.

Seasonal dynamics of Avian Influenza: Insights, Models and Wild Speculation
Andy Dobson, Leslie Reperant,EEB, Princeton University, NJ, USA
Neven-Stjepan Fuckar ,PEI, Geology,Princeton University
Thijs Kuiken, Erasmus Medical Center , Rotterdam,The Netherlands
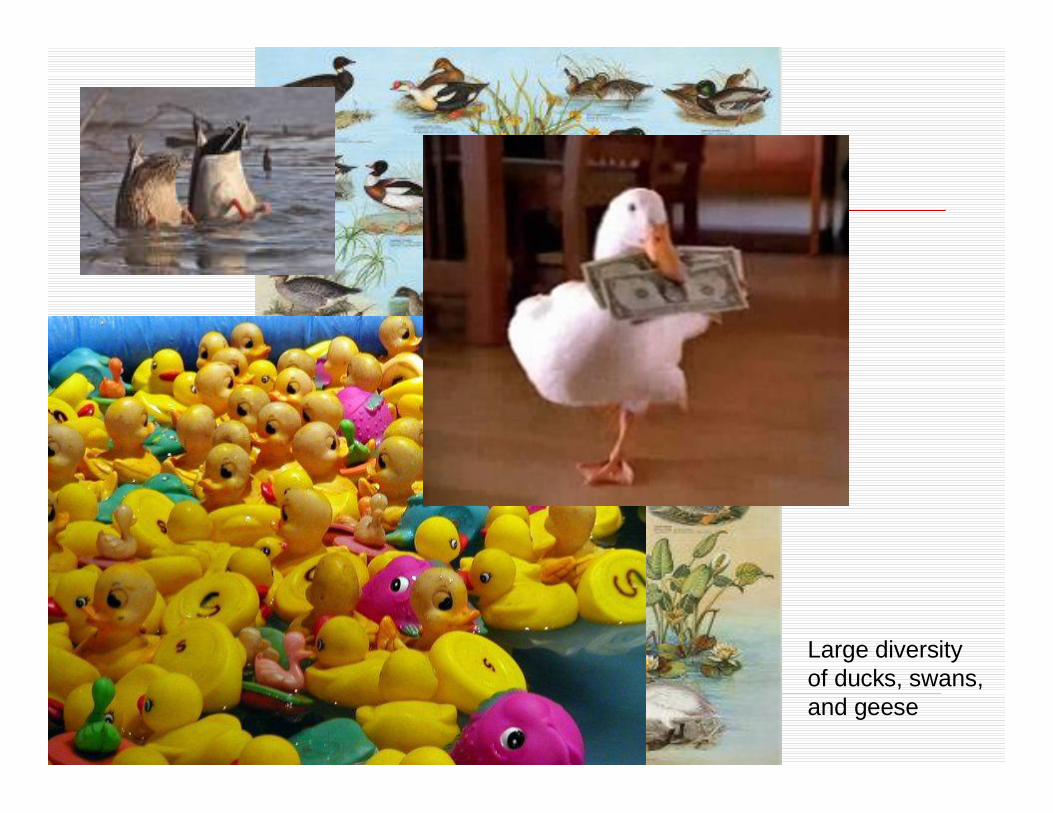
Large diversityof ducks, swans,and geese
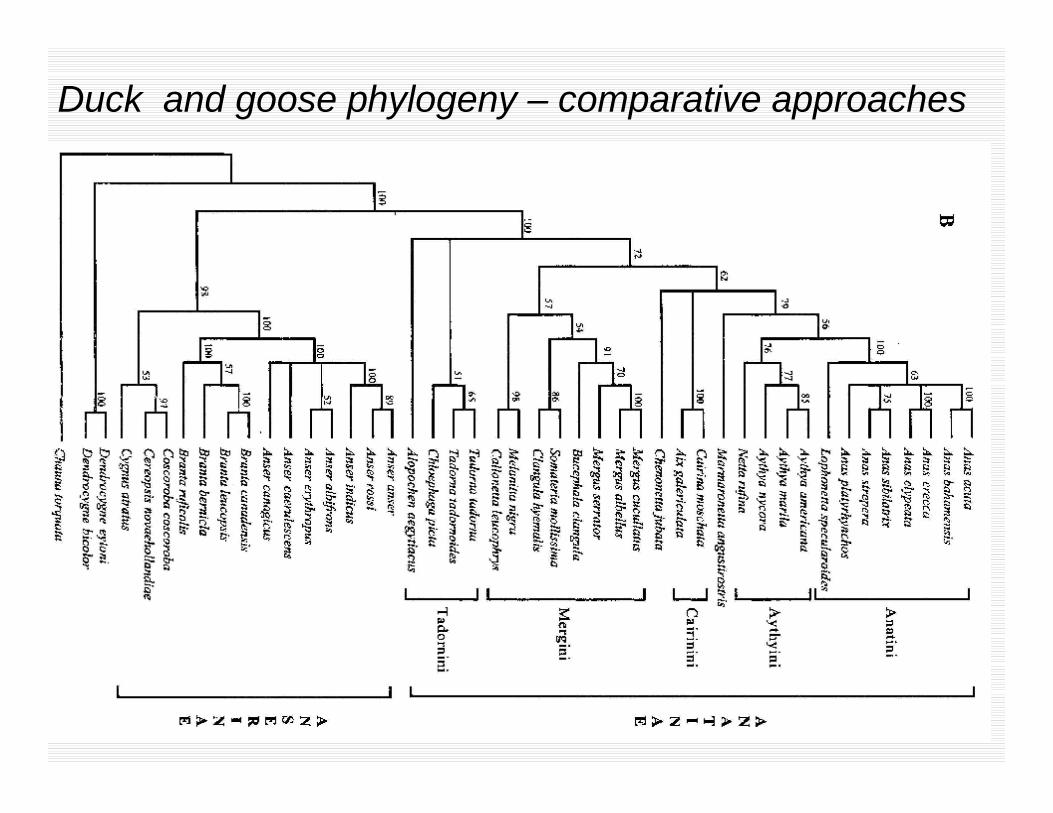
Duck and goose phylogeny – comparative approaches

Duck and goose phylogeny – comparative approaches
9.5->12.9%0.8 -> 1.2% 6.5 2.2%
??......??% ?....?
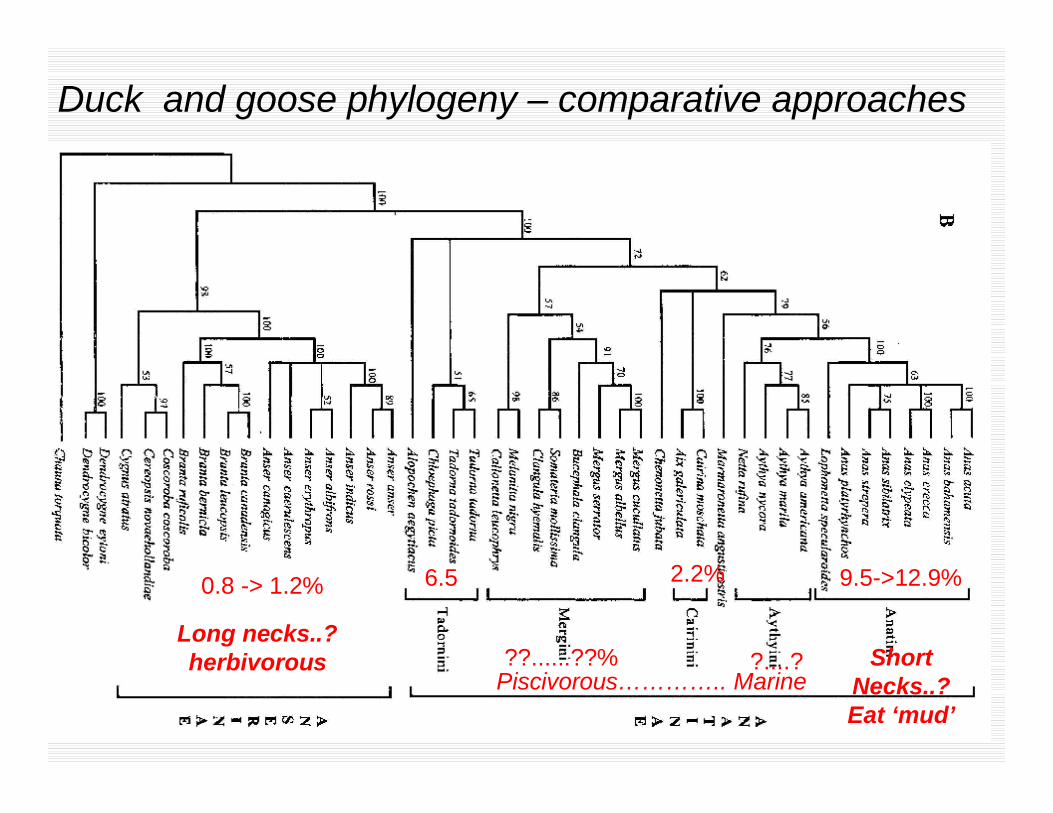
Duck and goose phylogeny – comparative approaches
9.5->12.9%0.8 -> 1.2% 6.5 2.2%
??......??% ?....?Long necks..?herbivorous Short
Necks..?Eat ‘mud’
Piscivorous………….. Marine

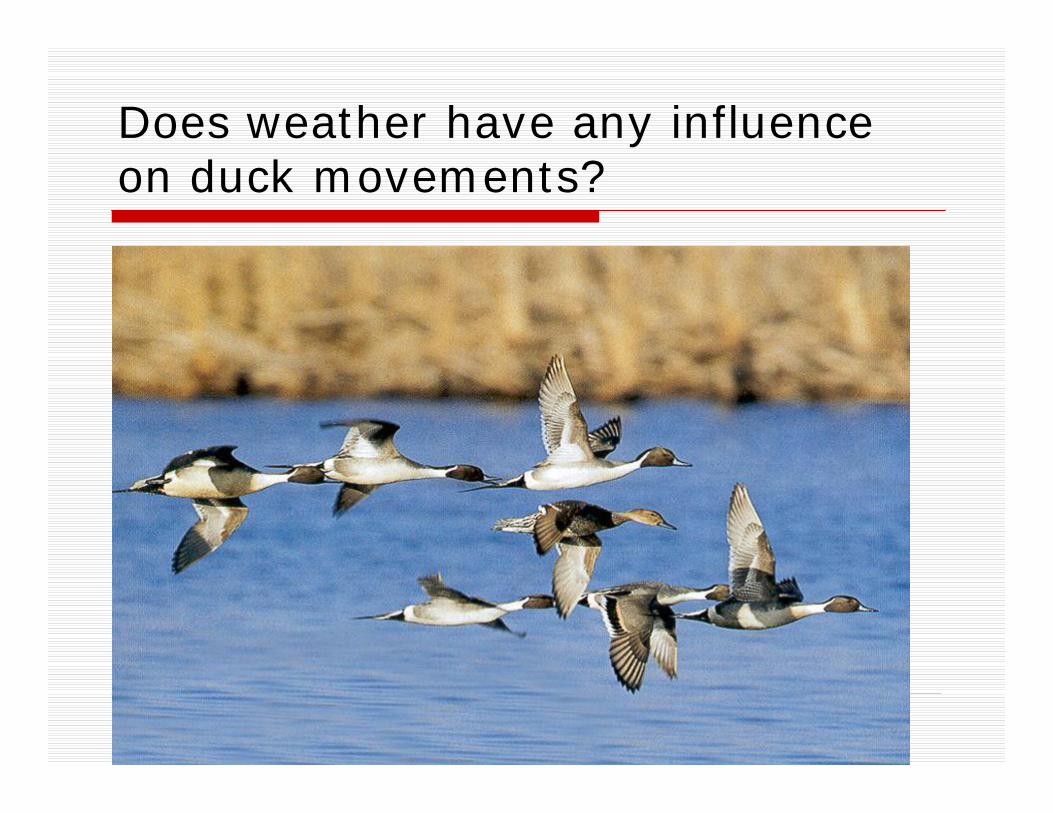
Does weather have any influence on duck movements?

Movements of MaximumSurface Air Temperature Isotherms
in Europe from January 1st to March 31st 2006
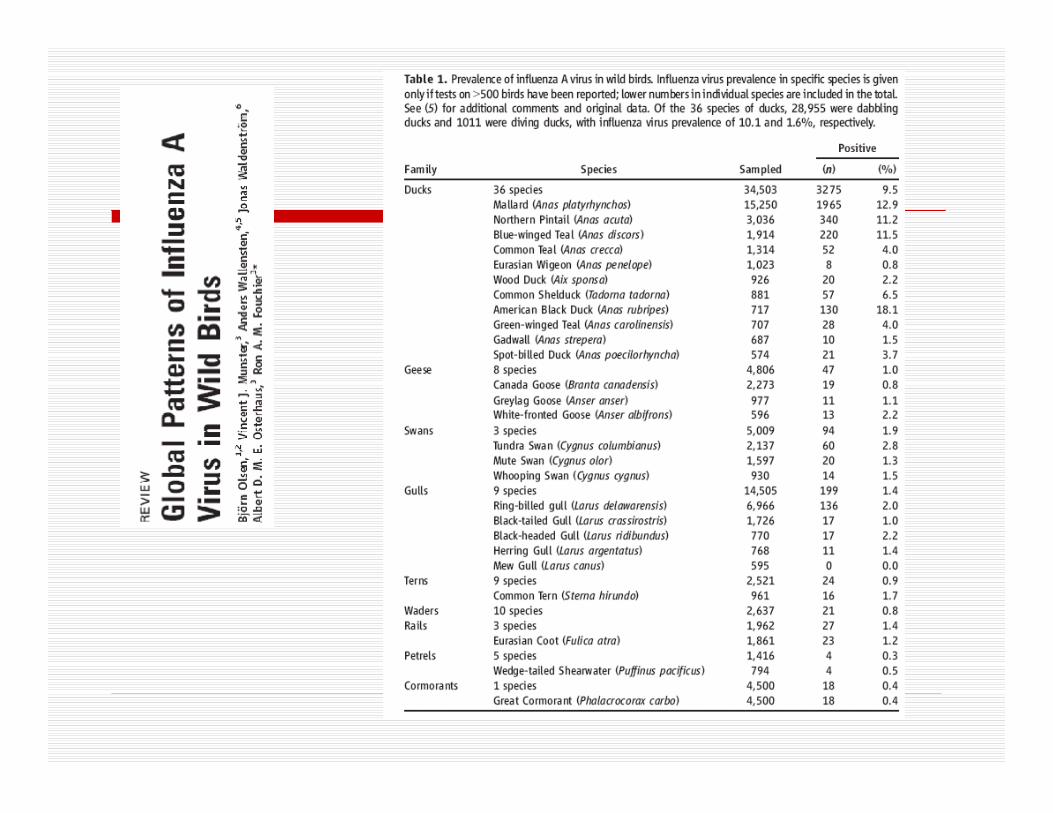
Locations of cases of HPAI H5N1 virus infection in wild birds
Locations three to one days before infected wilds birds were found
Locations on the day infected wild birds were found
Press enter to start

How could we model this?
o Need data on species distribution and range overlaps between potential hosts
o Need data on how different hosts respond to infection – virulence, shedding, etc
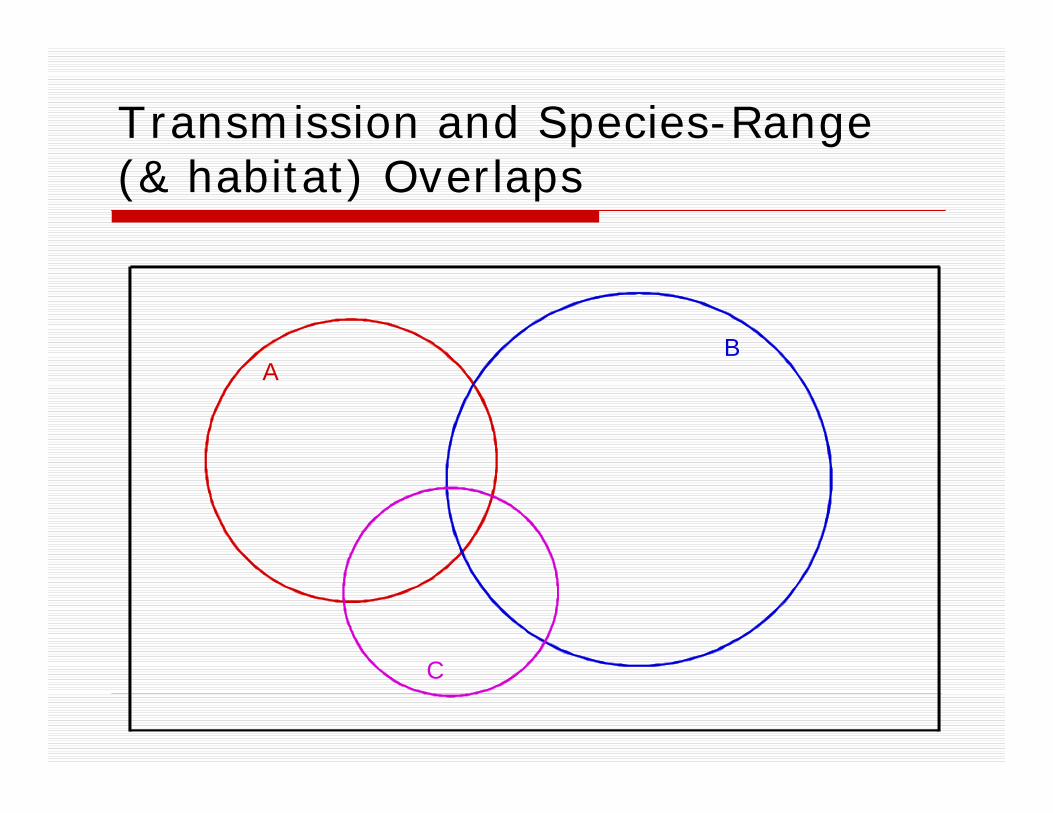
Transmission and Species-Range (& habitat) Overlaps
AB
C

AB
CZero Degree Isocline
SUMMER
Range overlap in summer

Range overlap in winter
AB
C
Zero Degree Isocline
WINTER
Hatched Area is frozen
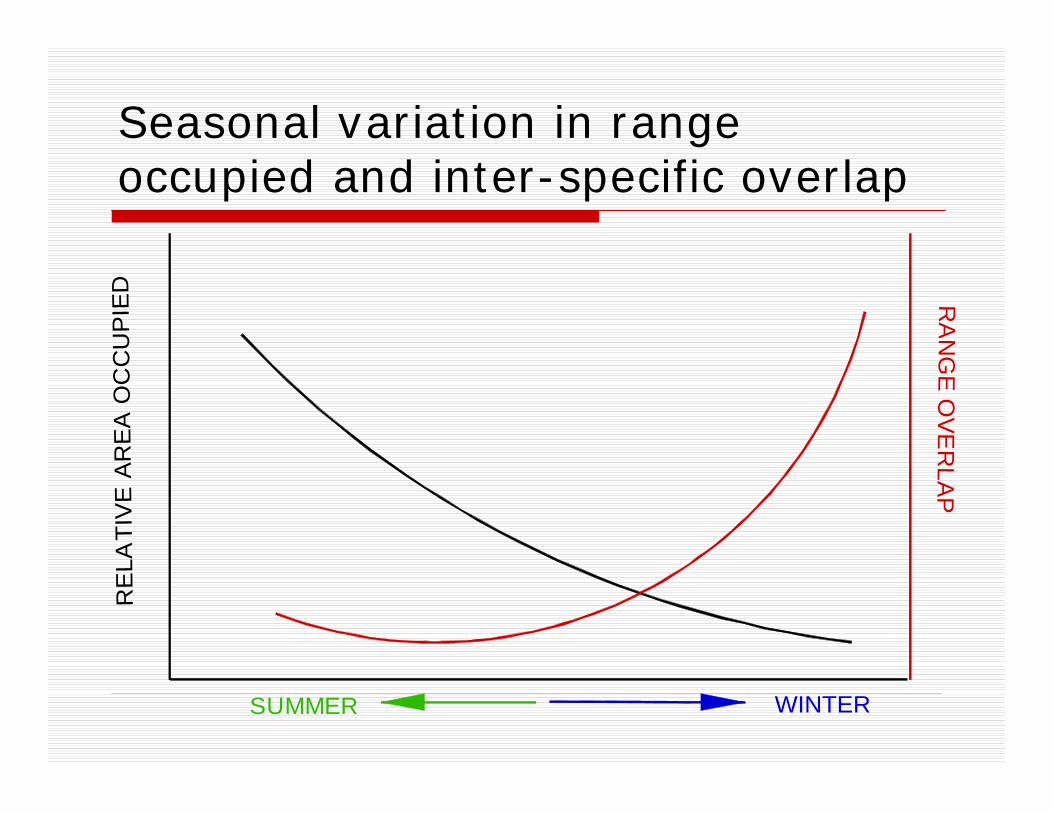
Seasonal variation in range occupied and inter-specific overlap
SUMMER WINTER
RE
LATI
VE
AR
EA
OC
CU
PIE
D RA
NG
E O
VE
RLA
P

Seasonal variation in transmission
SUMMER WINTER
Ro
- tr a
nsm
iss i
on p
ote n
tial
Between species, Bij
Within species, Bii

Framework to model these transmission dynamics
Relatively standard SIR equations (with N=S+I+R)
( ) ( )dS SIb N N dS f tempdt N
β = − ∆ − −
( ) ( )dI SIf temp d Idt N
β α σ = − + +
dR I dRdt
σ= −
( )1
5
tempf temp
eβ
β =
+
Temperaturedependent
transmissionterm
Transmissiondecreases with
increasing temperature
Maximum temperaturefor ‘sustainable’
transmission (Ro>1)

0 10 20 30 40
0.0
0.5
1.0
1.5
2.0
Ro and T emperature
Temperature, Celsius
Ro,
Bas
ic re
prod
uctiv
e nu
mbe
r
Outbreak!
Decline…..
SU
SC
EP
TIB
LES
, RE
CO
VE
RE
D, I
NFE
CTE
D H
OS
TS
0 5 10 15 20
1e-0
21e
+00
1e+0
21e
+04
Single Species Avian Influenza
red = I : blue=S, Green = RTime
Num
bers

Multi-host dynamics
o Expand to three host species
o Different AI-induced mortalities n (5x and 0.1X)
o Within species transmission is higher than between species transmission. But all transmission increases in winter .
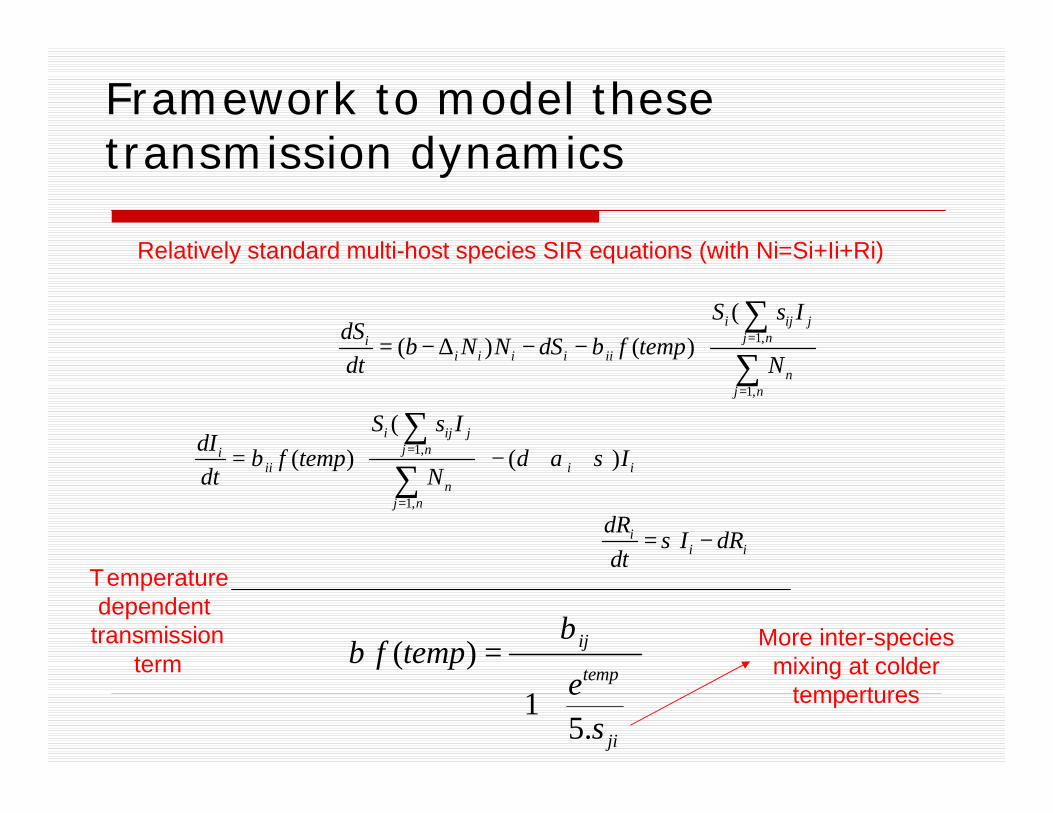
Framework to model these transmission dynamics
Relatively standard multi-host species SIR equations (with Ni=Si+Ii+Ri)
1,
1,
(( ) ( )
i ij jj ni
i i i i iin
j n
S s IdS b N N dS f tempdt N
β =
=
= − ∆ − −
∑∑
1,
1,
(( ) ( )
i ij jj ni
ii i in
j n
S s IdI f temp d Idt N
β α σ=
=
= − + +
∑∑
ii i
dR I dRdt
σ= −
( )1
5.
ij
temp
ji
f tempe
s
ββ =
+
Temperaturedependent
transmissionterm
More inter-speciesmixing at colder
tempertures

0 10 20 30 40 50
1e-0
21e
-01
1e+0
01e
+01
1e+0
2
Multi-Host Species Avian Influenza (Blue = T emperature)
Time (Years)
Num
bers
Infe
cted
Long interval between first two outbreaks!!
More stable dynamics

Summary & Policy Implicationso Dynamics of AI is highly sensitive to seasonal
variation in water temperature
o The presence of multiple host species helps stabilize the long term dynamics.
o BUT, there may be long time intervals between initial epidemic outbreaks
o Dynamics dependent upon colder temperatures and annual seasonal variationn So interpretation of data may be very location
dependent

Final cautionary tale….

Conclusions
o Understanding dynamics is central to control of infectious diseases
o Genomics tells us nothing predictive about dynamics –n At best it’s an occasionally useful post-hoc tooln BUT we’ve trained lots of people in this – so they
have to argue it is God’s gift to the health sciences….
o There is essentially no money at NIH for population dynamics
o This is foolish and dangerous