Embed Size (px)
DESCRIPTION
d
Citation preview


77237_fm.indd ii77237_fm.indd ii 8/11/10 8:26:05 AM8/11/10 8:26:05 AM
This page intentionally left blank.

Pathophysiologyof Heart DiseaseA Collaborative Projectof Medical Studentsand Faculty
FIFTH EDITION
77237_fm.indd i77237_fm.indd i 8/11/10 8:26:04 AM8/11/10 8:26:04 AM

77237_fm.indd ii77237_fm.indd ii 8/11/10 8:26:05 AM8/11/10 8:26:05 AM
This page intentionally left blank.
E d i t i o n
5Pathophysiologyof Heart DiseaseA Collaborative Projectof Medical Studentsand Faculty
EditorLeonard S. Lilly, MDProfessor of MedicineHarvard Medical SchoolChief, Brigham and Women’s/Faulkner CardiologyBrigham and Women’s HospitalBoston, Massachusetts
77237_fm.indd iii77237_fm.indd iii 8/11/10 8:26:05 AM8/11/10 8:26:05 AM

Acquisitions Editor: Crystal TaylorProduct Manager: Julie MontalbanoDesign and Art Direction: Doug Smock, Jennifer ClementsProduction & Composition: MPS Limited, A Macmillan Company
5th Edition
Copyright © 2011, 2007, 2003, 1998, 1993 Lippincott Williams & Wilkins, a Wolters Kluwer business.
351 West Camden Street Two Commerce SquareBaltimore, MD 21201 2001 Market Street Philadelphia, PA 19103
Printed in China.
All rights reserved. This book is protected by copyright. No part of this book may be reproduced or transmitted in any form or by any means, including as photocopies or scanned-in or other electronic copies, or utilized by any information storage and retrieval system without written permission from the copyright owner, except for brief quotations embodied in critical articles and reviews. Materials appearing in this book prepared by individuals as part of their offi cial duties as U.S. government employees are not covered by the above-mentioned copyright. To request permission, please contact Lippincott Williams & Wilkins at Two Commerce Square, 2001 Market Street, Philadelphia, PA 19103, via email at [email protected], or via website at lww.com (products and services).
9 8 7 6 5 4 3 2 1
Library of Congress Cataloging-in-Publication Data
Pathophysiology of heart disease : a collaborative project of medical students and faculty / editor Leonard S. Lilly.—5th ed.
p. ; cm. Includes bibliographical references and index. ISBN 978-1-60547-723-7
1. Heart—Pathophysiology. I. Lilly, Leonard S. II. Harvard Medical School.
[DNLM: 1. Heart Diseases—physiopathology. WG 210]RC682.9.P255 2011 616.1’207—dc22
2010029159
DISCLAIMER
Care has been taken to confi rm the accuracy of the information present and to describe generally accepted practices. However, the authors, editors, and publisher are not responsible for errors or omissions or for any conse-quences from application of the information in this book and make no warranty, expressed or implied, with respect to the currency, completeness, or accuracy of the contents of the publication. Application of this information in a particular situation remains the professional responsibility of the practitioner; the clinical treatments described and recommended may not be considered absolute and universal recommendations.
The authors, editors, and publisher have exerted every effort to ensure that drug selection and dosage set forth in this text are in accordance with the current recommendations and practice at the time of publication. However, in view of ongoing research, changes in government regulations, and the constant fl ow of information relating to drug therapy and drug reactions, the reader is urged to check the package insert for each drug for any change in indica-tions and dosage and for added warnings and precautions. This is particularly important when the recommended agent is a new or infrequently employed drug.
Some drugs and medical devices presented in this publication have Food and Drug Administration (FDA) clear-ance for limited use in restricted research settings. It is the responsibility of the health care provider to ascertain the FDA status of each drug or device planned for use in their clinical practice.
To purchase additional copies of this book, call our customer service department at (800) 638-3030 or fax orders to (301) 223-2320. International customers should call (301) 223-2300.
Visit Lippincott Williams & Wilkins on the Internet: http://www.lww.com. Lippincott Williams & Wilkins customer service representatives are available from 8:30 am to 6:00 pm, EST.
77237_fm.indd iv77237_fm.indd iv 8/11/10 8:26:05 AM8/11/10 8:26:05 AM

Dedicated in Loving Memory of My Father
DAVID LILLY
(1922–2009)
77237_fm.indd v77237_fm.indd v 8/11/10 8:26:05 AM8/11/10 8:26:05 AM

77237_fm.indd vi77237_fm.indd vi 8/11/10 8:26:05 AM8/11/10 8:26:05 AM
This page intentionally left blank.

vii
cardiologist at the Brigham and Women’s and Faulkner Hospitals, has served as the leader of this project. He has brought together a group of talented Harvard medical students and fac-ulty who have collaborated closely to produce this superb introductory text specifi cally de-signed to meet the needs of medical students during their initial encounters with patients with heart disease. While Pathophysiology of Heart Disease is not meant to be encyclopedic or all inclusive, it is remarkably thorough.
Quite appropriately, the fi rst four editions of this fi ne book were received enthusiastically, and Pathophysiology of Heart Disease is now a required or recommended text at many medi-cal schools not only in the United States, but also in other countries. It has been translated into other languages, has received two awards of excellence from the American Medical Writers Association, and has inspired several other student–faculty collaborative book proj-ects. This fi fth edition is not only an updated but also an expanded version of the fourth edi-tion. Many of the fi gures have been redrawn and enhanced to display complex concepts in uncomplicated ways. As such, it will prove to be even more valuable than its predecessors.
Dr. Lilly and his colleagues—both faculty and students—have made a signifi cant and unique contribution in preparing this im-portant book. Future generations of medical educators and students, and ultimately the pa-tients that they serve, will be indebted to them for this important contribution.
EUGENE BRAUNWALD, MDDistinguished Hersey Professor of Medicine
Harvard Medical SchoolBoston, Massachusetts
It is axiomatic that when designing any prod-uct or service, the needs of the prospective
user must receive primary consideration. Re-grettably, this is rarely the case with medical textbooks, which play a vital role in the edu-cation of students, residents, fellows, practic-ing physicians, and paramedical professionals. Most books are written for anyone who will read—or preferably buy—them. As a conse-quence, they often provide a little for every-one but not enough for anyone. Many medical textbooks are reminiscent of the one-room schoolhouse, which included pupils ranging from the fi rst to the twelfth grade. The need to deal with subject matter at enormously dispa-rate levels of sophistication interfered with the educational process.
Medical educators appreciate that the needs of medical students exposed to a subject for the fi rst time differ importantly from those of practicing physicians who wish to review an area learned previously or to be updated on new developments in a fi eld with which they already have some familiarity. The lack of textbooks designed specifi cally for students leads faculty at schools around the country to spend countless hours preparing and duplicat-ing voluminous lecture notes, and providing students with custom-designed “camels” (a camel is a cow created by a committee!).
Pathophysiology of Heart Disease: A Col-laborative Project of Medical Students and Faculty, represents a refreshing and innova-tive departure in the preparation of a medical text. Students—that is, potential consumers—dissatisfi ed with currently available textbooks on cardiology, made their needs clear. For-tunately, their pleas fell on receptive ears. Dr. Leonard Lilly, a Professor of Medicine at Harvard Medical School, and a respected
Foreword
77237_fm.indd vii77237_fm.indd vii 8/11/10 8:26:05 AM8/11/10 8:26:05 AM

This page intentionally left blank.

ix
lar diseases. The chapters are designed and edited to be read in sequence but are suffi -ciently cross-referenced so that they can also be used out of order. The fi nal chapter de-scribes the major classes of cardiovascular drugs and explains the physiologic rationale for their uses.
It has been a great privilege for me to collaborate with the 92 talented, creative, and energetic medical students who have contributed to the fi ve editions of this book. Their intellect, enthusiasm, and dedication have signifi cantly facilitated the completion of each manuscript. I am also indebted to my faculty colleague coauthors for their time, their expertise, and their continued commit-ment to this project.
I deeply appreciate the thoughtful and con-structive comments received from faculty and students around the globe pertaining to the pre-vious editions of this book. These communica-tions have been very helpful in directing the current revision, and the many warm remarks have been an important source of encourage-ment. I also acknowledge with gratitude several individuals who provided material, detailed comments and reviews, or other support to this edition: Behnood Bikdeli, Douglas Burtt, Sharmila Dorbala, Marcelo Di Carli, Raymond Kwong, Frank Rybicki, Frederick Schoen, and Pinak Shah. Additionally, I thank Jovette Auguste and Pamela Nettles for their invaluable administrative assistance.
It has been a pleasure to work with the edi-torial and production staffs of our publisher, Lippincott Williams & Wilkins. In particular, I thank Julie Montalbano, Crystal Taylor, Jennifer Clements, Jonathan Dimes and Arijit Biswas for their skill and professionalism in bringing this edition to completion.
Preface
This textbook is a comprehensive intro-duction to diseases of the cardiovascular
system. Although excellent cardiology refer-ence books are available, their encyclopedic content can overwhelm the beginning student. Therefore, this text was created to serve as a simplifi ed bridge between courses in basic physiology and the care of patients in clinical settings. It is intended to help medical students and physicians-in-training form a solid foun-dation of knowledge of diseases of the heart and circulation, and is designed to be read in its entirety during standard courses in cardio-vascular pathophysiology. Emphasis has been placed on the basic mechanisms by which car-diac illnesses develop, in order to facilitate the later in-depth study of clinical diagnosis and therapy.
The original motivation for writing this book was the need for such a text voiced by our medical students, as well as their desire to participate in its creation and direction. Conse-quently, the book’s development is unusual in that it represents a close collaboration between Harvard medical students and cardiology fac-ulty, who shared in the writing and editing of the manuscript. The goal of this pairing was to focus the subject matter on the needs of the student, while providing the expertise of our faculty members. In this updated and rewrit-ten fi fth edition of Pathophysiology of Heart Disease, the collaborative effort has continued, between a new generation of medical students and our cardiovascular faculty.
The introductory chapters of the book review basic cardiac anatomy and physiol-ogy, and describe the tools needed for un-derstanding clinical aspects of subsequently presented material. The remainder of the text addresses the major groups of cardiovascu-
77237_fm.indd ix77237_fm.indd ix 8/11/10 8:26:05 AM8/11/10 8:26:05 AM

Preface
x
Finally, a project of this magnitude could not be undertaken without the strong support and patience of my family, and for that I am very grateful.
On behalf of the contributors, I hope that this book enhances your understanding of
cardiovascular diseases and provides a solid foundation for further learning and clinical care of your patients.
LEONARD S. LILLY, MDBoston, Massachusetts
77237_fm.indd x77237_fm.indd x 8/11/10 8:26:05 AM8/11/10 8:26:05 AM

xi
David W. Brown, MDAssistant Professor of PediatricsHarvard Medical SchoolCardiology Division, Children’s HospitalBoston, Massachusetts
Patricia Challender Come, MDAssociate Professor of MedicineHarvard Medical SchoolCardiologist, Harvard Vanguard Medical AssociatesAssociate Physician, Brigham and Women’s HospitalBoston, Massachusetts
Mark A. Creager, MDProfessor of MedicineHarvard Medical SchoolDirector, Vascular CenterSimon C. Fireman Scholar in Cardiovascular Medicine, Brigham and Women’s HospitalBoston, Massachusetts
G. William Dec, MDRoman W. DeSanctis Professor of MedicineHarvard Medical SchoolChief, Cardiology Division, Massachusetts General HospitalBoston, Massachusetts
Elazer R. Edelman, MD, PhDThomas D. and Virginia W. Cabot Professor of Health Sciences and Technology Massachusetts Institute of TechnologyDirector, Harvard-MIT Biomedical Engineering CenterProfessor of MedicineHarvard Medical SchoolBoston, Massachusetts
List of Contributors
Student Contributors
David D. Berg (MD 2011)
Neal A. Chatterjee (MD 2010)
Ranliang Hu (MD 2010)
Henry Jung (MD 2010)
Christopher T. Lee (MD 2011)
Fan Liang (MD 2010)
Ken Young Lin (MD, PhD 2010)
Christopher A. Miller (MD 2011)
Stephen R. Pomedli (MD 2011)
Yin Ren (MD 2014)
June-Wha Rhee (MD 2011)
Jordan B. Strom (MD 2011)
Cyrus K. Yamin (MD 2011)
Faculty Contributors
Elliott M. Antman, MDProfessor of MedicineHarvard Medical SchoolCardiovascular Division, Brigham and Women’s HospitalBoston, Massachusetts
Eugene Braunwald, MD (Foreword)Distinguished Hersey Professor of MedicineHarvard Medical SchoolChairman, TIMI Study Group, Brigham and Women’s HospitalBoston, Massachusetts
77237_fm.indd xi77237_fm.indd xi 8/11/10 8:26:05 AM8/11/10 8:26:05 AM

xii
List of Contributors
Michael A. Fifer, MDAssociate Professor of MedicineHarvard Medical SchoolDirector, Cardiac Catheterization LaboratoryMassachusetts General HospitalBoston, Massachusetts
Peter Libby, MDMallinckrodt Professor of MedicineHarvard Medical SchoolChief, Cardiovascular Division, Brigham and Women’s HospitalBoston, Massachusetts
Leonard S. Lilly, MDProfessor of MedicineHarvard Medical SchoolChief, Brigham and Women’s/Faulkner CardiologyBrigham and Women’s HospitalBoston, Massachusetts
Patrick T. O’Gara, MDAssociate Professor of MedicineHarvard Medical SchoolDirector of Clinical CardiologyBrigham and Women’s HospitalBoston, Massachusetts
Marc S. Sabatine, MD, MPHAssociate Professor of MedicineHarvard Medical SchoolCardiovascular Division, Brigham and Women’s HospitalBoston, Massachusetts
William G. Stevenson, MDProfessor of MedicineHarvard Medical SchoolDirector, Clinical Cardiac Electrophysiology Program, Brigham and Women’s HospitalBoston, Massachusetts
Gary R. Strichartz, PhDProfessor of Anaesthesia (Pharmacology)Harvard Medical SchoolDirector, Pain Research CenterVice Chairman of Research, Department of Anesthesia, Brigham and Women’s HospitalBoston, Massachusetts
Gordon H. Williams, MDProfessor of MedicineHarvard Medical SchoolDirector, Specialized Center of Research in HypertensionDirector, Center for Clinical Investigation Brigham and Women’s HospitalBoston, Massachusetts
77237_fm.indd xii77237_fm.indd xii 8/11/10 8:26:05 AM8/11/10 8:26:05 AM
xiii
CHAPTER 7Acute Coronary Syndromes 161June-Wha Rhee, Marc S. Sabatine, andLeonard S. Lilly
CHAPTER 8Valvular Heart Disease 190Christopher A. Miller, Patrick T. O’Gara, and Leonard S. Lilly
CHAPTER 9Heart Failure 216Neal Anjan Chatterjee and Michael A. Fifer
CHAPTER 10The Cardiomyopathies 244Christopher T. Lee, G. William Dec, andLeonard S. Lilly
CHAPTER 11Mechanisms of Cardiac Arrhythmias 261Ranliang Hu, William G. Stevenson, Gary R. Strichartz, and Leonard S. Lilly
CHAPTER 12Clinical Aspects of Cardiac Arrhythmias 279Ranliang Hu, William G. Stevenson, andLeonard S. Lilly
CHAPTER 13Hypertension 301Christopher T. Lee, Gordon H. Williams, and Leonard S. Lilly
Table of Contents
Foreword vii
Preface ix
List of Contributors xi
CHAPTER 1Basic Cardiac Structure and Function 1Ken Young Lin, Elazer R. Edelman, Gary Strichartz, and Leonard S. Lilly
CHAPTER 2The Cardiac Cycle: Mechanisms of Heart Sounds and Murmurs 28Henry Jung and Leonard S. Lilly
CHAPTER 3Cardiac Imaging and Catheterization 44Henry Jung, Ken Young Lin, and Patricia Challender Come
CHAPTER 4The Electrocardiogram 75Stephen R. Pomedli and Leonard S. Lilly
CHAPTER 5Atherosclerosis 113Jordan B. Strom and Peter Libby
CHAPTER 6Ischemic Heart Disease 135June-Wha Rhee, Marc S. Sabatine, andLeonard S. Lilly
77237_fm.indd xiii77237_fm.indd xiii 8/11/10 5:54:26 PM8/11/10 5:54:26 PM

xiv
Table of Contents
CHAPTER 17Cardiovascular Drugs 386Cyrus K. Yamin, Christopher A. Miller, Elliott M. Antman, Gary R. Strichartz, andLeonard S. Lilly
Index 437
CHAPTER 14Diseases of the Pericardium 324Yin Ren and Leonard S. Lilly
CHAPTER 15Diseases of the Peripheral Vasculature 339Fan Liang and Mark A. Creager
CHAPTER 16Congenital Heart Disease 361David D. Berg and David W. Brown
77237_fm.indd xiv77237_fm.indd xiv 8/11/10 5:54:26 PM8/11/10 5:54:26 PM

C H A P T E R
1
1
Basic Cardiac Structure and FunctionKen Young LinElazer R. EdelmanGary StrichartzLeonard S. Lilly
CARDIAC ANATOMY AND HISTOLOGYPericardiumSurface Anatomy of the HeartInternal Structure of the HeartImpulse-Conducting SystemCardiac InnervationCardiac VesselsHistology of Ventricular Myocardial Cells
BASIC ELECTROPHYSIOLOGYIon Movement and ChannelsResting Potential
Action PotentialRefractory PeriodsImpulse ConductionNormal Sequence of Cardiac Depolarization
EXCITATION–CONTRACTION COUPLINGContractile Proteins in the MyocyteCalcium-Induced Calcium Release and the Contractile Cycle�-Adrenergic and Cholinergic Signaling
essential an intimate knowledge of the spatial relationships of cardiac structures. Such in-formation also proves helpful in understand-ing the pathophysiology of heart disease. This section emphasizes the aspects of cardiac anatomy that are important to the clinician—that is, the “functional” anatomy.
Pericardium
The heart and roots of the great vessels are enclosed by a fi broserous sac called the peri-cardium (Fig. 1.1). This structure consists of two layers: a strong outer fi brous layer and an inner serosal layer. The inner serosal layer ad-heres to the external wall of the heart and is
Knowledge of normal cardiac structure and function is crucial to understanding
diseases that affl ict the heart. This chapter re-views basic cardiac anatomy and electrophysi-ology as well as the events that lead to cardiac contraction.
CARDIAC ANATOMY AND HISTOLOGY
Although the study of cardiac anatomy dates back to ancient times, interest in this fi eld has recently gained momentum. The devel-opment of sophisticated cardiac imaging procedures such as coronary angiography, echocardiography, computed tomography, and magnetic resonance imaging has made
77237_ch01.indd 177237_ch01.indd 1 8/11/10 8:07:33 AM8/11/10 8:07:33 AM

Chapter 1
2
called the visceral pericardium. The visceral pericardium refl ects back on itself and lines the outer fi brous layer, forming the parietal pericardium. The space between the visceral and parietal layers contains a thin fi lm of peri-cardial fl uid that allows the heart to beat in a minimal-friction environment.
The pericardium is attached to the sternum and the mediastinal portions of the right and left pleurae. Its many connections to the surround-ing structures keep the pericardial sac fi rmly anchored within the thorax and therefore help to maintain the heart in its normal position.
Emanating from the pericardium in a supe-rior direction are the aorta, the pulmonary ar-tery, and the superior vena cava (see Fig. 1.1). The inferior vena cava projects through the pericardium inferiorly.
Surface Anatomy of the Heart
The heart is shaped roughly like a cone and consists of four muscular chambers. The right and left ventricles are the main pumping cham-bers. The less muscular right and left atria de-liver blood to their respective ventricles.
Several terms are used to describe the heart’s surfaces and borders (Fig. 1.2). The apex is formed by the tip of the left ventricle, which points inferiorly, anteriorly, and to the left. The base or posterior surface of the heart is formed by the atria, mainly the left, and lies between the lung hila. The anterior surface of the heart is shaped by the right atrium and ven-tricle. Because the left atrium and ventricle lie
more posteriorly, they form only a small strip of this anterior surface. The inferior surface of the heart is formed by both ventricles, primarily the left. This surface of the heart lies along the diaphragm; hence, it is also referred to as the diaphragmatic surface.
Observing the chest from an anteroposte-rior view (as on a chest radiograph; see Chap-ter 3), four recognized borders of the heart are apparent. The right border is established by the right atrium and is almost in line with the superior and inferior venae cavae. The infe-rior border is nearly horizontal and is formed mainly by the right ventricle, with a slight contribution from the left ventricle near the apex. The left ventricle and a portion of the left atrium make up the left border of the heart, whereas the superior border is shaped by both atria. From this description of the surface of the heart emerge two basic “rules” of normal cardiac anatomy: (1) right-sided structures lie mostly anterior to their left-sided counterparts, and (2) atrial chambers are located mostly to the right of their corresponding ventricles.
Internal Structure of the Heart
Four major valves in the normal heart direct blood fl ow in a forward direction and prevent backward leakage. The atrioventricular valves (tricuspid and mitral) separate the atria and ventricles, whereas the semilunar valves (pul-monic and aortic) separate the ventricles from the great arteries (Fig. 1.3). All four heart valves are attached to the fi brous cardiac skeleton, which is composed of dense connective tissue. The cardiac skeleton also serves as a site of at-tachment for the ventricular and atrial muscles.
The surface of the heart valves and the in-terior surface of the chambers are lined by a single layer of endothelial cells, termed the endocardium. The subendocardial tissue contains fi broblasts, elastic and collagenous fi bers, veins, nerves, and branches of the con-ducting system and is continuous with the connective tissue of the heart muscle layer, the myocardium. The myocardium is the thickest layer of the heart and consists of bundles of cardiac muscle cells, the histology of which is described later in the chapter. External to the myocardium is a layer of connective tissue and
Figure 1.1. The position of the heart in the chest. The superior vena cava, aorta, and pulmonary artery exit superi-orly, whereas the inferior vena cava projects inferiorly.
Superiorvena cava
Pulmonaryartery
Heart withinpericardium
Diaphragm
Aorta
Inferiorvena cava
77237_ch01.indd 277237_ch01.indd 2 8/11/10 8:07:34 AM8/11/10 8:07:34 AM

Basic Cardiac Structure and Function
3
Figure 1.2. The heart and great vessels. A. The anterior view. B. The posterior aspect (or base), as viewed from the back. a, artery; lig, ligamentum; vv, veins.
Brachiocephalic a. Left common carotid a.
Left subclavian a.
Aortic arch
Left pulmonary a.
Left pulmonary vv.
Left atrial appendage
Left ventricle
Anterior interventriculargroove
Brachiocephalic a.
Azygous v.
Superior vena cava
Right pulmonary a.
Right pulmonary vv.
Right atrium
Inferior vena cava
Left heart border
Superior vena cava
Right pulmonary a.
Right pulmonary vv.
Right atrium
Right ventricle
Inferior vena cava
Right heart border
Inferior heart border
Inferior heart border
Apex
A
Left common carotid a.
Leftatrium
Left subclavian a.
Aortic arch
Lig. arteriosum
Left pulmonary a.
Left pulmonary vv.
Left ventricle
B
77237_ch01.indd 377237_ch01.indd 3 8/11/10 8:07:34 AM8/11/10 8:07:34 AM

Chapter 1
4
adipose tissue through which pass the larger blood vessels and nerves that supply the heart muscle. The epicardium is the outermost layer of the heart and is identical to, and just another term for, the visceral pericardium pre-viously described.
Right Atrium and Ventricle
Opening into the right atrium are the supe-rior and inferior venae cavae and the coronary sinus (Fig. 1.4). The venae cavae return de-oxygenated blood from the systemic veins into the right atrium, whereas the coronary sinus carries venous return from the coronary arter-ies. The interatrial septum forms the postero-medial wall of the right atrium and separates it from the left atrium. The tricuspid valve is located in the fl oor of the atrium and opens into the right ventricle.
The right ventricle (see Fig. 1.4) is roughly triangular in shape, and its superior aspect forms a cone-shaped outfl ow tract, which leads to the pulmonary artery. Although the inner wall of the outfl ow tract is smooth, the rest of the ventricle is covered by a number of ir-
regular bridges (termed trabeculae carneae) that give the right ventricular wall a sponge-like appearance. A large trabecula that crosses the ventricular cavity is called the moderator band. It carries a component of the right bundle branch of the conducting system to the ventri-cular muscle.
The right ventricle contains three papillary muscles, which project into the chamber and via their thin, stringlike chordae tendineae attach to the edges of the tricuspid valve leaf-lets. The leafl ets, in turn, are attached to the fi brous ring that supports the valve between the right atrium and ventricle. Contraction of the papillary muscles prior to other regionsof the ventricle tightens the chordae tendineae, helping to align and restrain the leafl ets of the tricuspid valve as they are forced closed. This action prevents blood from regurgitat-ing into the right atrium during ventricularcontraction.
At the apex of the right ventricular outfl ow tract is the pulmonic valve, which leads to the pulmonary artery. This valve consists of three cusps attached to a fi brous ring. During relaxation of the ventricle, elastic recoil of the pulmonary
Figure 1.3. The four heart valves viewed from above with atria removed. The fi gure depicts the period of ventricular fi lling (diastole) during which the tricuspid and mitral valves are open and the semilunar valves (pulmonic and aortic) are closed. Each annulus fi brosus surrounding the mitral and tricuspid valves is thicker than those surrounding the pulmonic and aortic valves; all four contribute to the heart’s fi brous skeleton, which is composed of dense connective tissue.
Anterior
Posterior
Aorticvalve
Pulmonicvalve
Tricuspidvalve
Annulusfibrosus
Mitralvalve
Annulusfibrosus
77237_ch01.indd 477237_ch01.indd 4 8/11/10 8:07:34 AM8/11/10 8:07:34 AM

Basic Cardiac Structure and Function
5
arteries forces blood back toward the heart, dis-tending the valve cusps toward one another. This action closes the pulmonic valve and pre-vents regurgitation of blood back into the right ventricle.
Left Atrium and Ventricle
Entering the posterior half of the left atrium are the four pulmonary veins (Fig. 1.5). The wall of the left atrium is about 2 mm thick, being slightly greater than that of the right atrium. The mitral valve opens into the left ventricle through the inferior wall of the left atrium.
The cavity of the left ventricle is approxi-mately cone shaped and longer than that of the right ventricle. In a healthy adult heart, the wall thickness is 9 to 11 mm, roughly three times that of the right ventricle. The aortic vestibule is a smooth-walled part of the left ventricular cavity located just inferior to the aortic valve. Inferior to this region, most of the ventricle is covered by trabeculae carneae, which are fi ner and more numerous than those in the right ventricle.
The left ventricular chamber (see Fig. 1.5B) contains two large papillary muscles. These are larger than their counterparts in the right ven-tricle, and their chordae tendineae are thicker but less numerous. The chordae tendineae of
each papillary muscle distribute to both leaf-lets of the mitral valve. Similar to the case in the right ventricle, tensing of the chordae tendineae during left ventricular contraction helps restrain and align the mitral leafl ets, en-abling them to close properly and preventing the backward leakage of blood.
The aortic valve separates the left ventricle from the aorta. Surrounding the aortic valve opening is a fi brous ring to which is attached the three cusps of the valve. Just above the right and left aortic valve cusps in the aortic wall are the origins of the right and left coro-nary arteries (see Fig. 1.5B).
Interventricular Septum
The interventricular septum is the thick wall between the left and right ventricles. It is composed of a muscular and a membranous part (see Fig. 1.5B). The margins of this sep-tum can be traced on the surface of the heart by following the anterior and posterior in-terventricular grooves. Owing to the greater hydrostatic pressure within the left ventricle, the large muscular portion of the septum bulges toward the right ventricle. The small, oval-shaped membranous part of the septum is thin and located just inferior to the cusps of the aortic valve.
Figure 1.4. Interior structures of the right atrium and right ventricle. (Modifi ed from Goss CM. Gray’s Anatomy. 29th ed. Philadelphia, PA: Lea & Febiger; 1973:547.)
Superior vena cava
Pulmonary artery
Pulmonic valve
Interventricular septum
Moderatorband
Trabeculaecarneae
Papillary muscles
Aorta
Right atrium
Inferior vena cava
Coronary sinus
Tricuspid valve Right ventricle
77237_ch01.indd 577237_ch01.indd 5 8/11/10 8:07:34 AM8/11/10 8:07:34 AM

Chapter 1
6
To summarize the functional anatomic points presented in this section, the following is a review of the path of blood fl ow through the heart: Deoxygenated blood is delivered to the heart through the inferior and supe-rior venae cavae, which enters into the right atrium. Flow continues through the tricuspid
valve orifi ce into the right ventricle. Contrac-tion of the right ventricle propels the blood across the pulmonic valve to the pulmonary artery and lungs, where carbon dioxide is re-leased and oxygen is absorbed. The oxygen-rich blood returns to the heart through the pulmonary veins to the left atrium and then
Figure 1.5. Interior structures of the left atrium and left ventricle. A. The left atrium and left ventricular (LV) infl ow and outfl ow regions. B. Interior structures of the LV cavity. (Modifi ed from Agur AMR, Lee MJ. Grant’s Atlas of Anatomy. 9th ed. Baltimore, MD: Williams & Wilkins; 1991:59.)
Left ventricle
Right ventricle
Aortic valve
AortaRight pulmonaryveins
Left atrium
Posterior leafletof mitral valve
Papillary muscle
Pulmonaryartery
Interventricularseptum
A
Posterior cuspof aortic valve
Origin of leftcoronary artery
Anterior cuspof mitral valve
Chordaetendineae
AnteriorpapillarymuscleRIGHT VENTRICLE
Pulmonary artery
Origin of rightcoronary artery
Interventricularseptum,membranouspart
Interventricularseptum, muscularpart
Posteriorpapillarymuscle
Trabeculaecarneae
B
AORTA
77237_ch01.indd 677237_ch01.indd 6 8/11/10 8:07:34 AM8/11/10 8:07:34 AM

Basic Cardiac Structure and Function
7
passes across the mitral valve into the left ven-tricle. Contraction of the left ventricle pumps the oxygenated blood across the aortic valve into the aorta, from which it is distributed to all other tissues of the body.
Impulse-Conducting System
The impulse-conducting system (Fig. 1.6) con-sists of specialized cells that initiate the heart-beat and electrically coordinate contractions of the heart chambers. The sinoatrial (SA) node is a small mass of specialized cardiac muscle fi -bers in the wall of the right atrium. It is located to the right of the superior vena cava entrance and normally initiates the electrical impulse for contraction. The atrioventricular (AV) node lies beneath the endocardium in the inferopos-terior part of the interatrial septum.
Distal to the AV node is the bundle of His, which perforates the interventricular septum posteriorly. Within the septum, the bundle of His bifurcates into a broad sheet of fi bers that continues over the left side of the septum, known as the left bundle branch, and a com-pact, cablelike structure on the right side, the right bundle branch.
The right bundle branch is thick and deeply buried in the muscle of the interventricular septum and continues toward the apex. Near the junction of the interventricular septum and the anterior wall of the right ventricle, the right bundle branch becomes subendocar-dial and bifurcates. One branch travels across the right ventricular cavity in the moderator band, whereas the other continues toward the tip of the ventricle. These branches eventu-ally arborize into a fi nely divided anastomo-sing plexus that travels throughout the right ventricle.
Functionally, the left bundle branch is di-vided into an anterior and a posterior fascicle and a small branch to the septum. The ante-rior fascicle runs anteriorly toward the apex, forming a subendocardial plexus in the area of the anterior papillary muscle. The posterior fascicle travels to the area of the posterior pap-illary muscle; it then divides into a subendo-cardial plexus and spreads to the rest of the left ventricle.
The subendocardial plexuses of both ven-tricles send distributing Purkinje fi bers to the ventricular muscle. Impulses within the His–Purkinje system are transmitted fi rst to
Figure 1.6. Main components of the cardiac conduction system. This system includes the sino-atrial node, atrioventricular node, bundle of His, right and left bundle branches, and the Purkinje fi bers. The moderator band carries a large portion of the right bundle. IV, interventricular.
Sinoatrial node
Coronary sinus
Atrioventricular node
Bundle of His
Moderator band
Right bundle branch
Mitral valve
Membranous part ofIV septum
Bifurcation of bundleof His
Muscular part ofIV septum
Left bundle branch
Purkinje fibers underendocardium of papillarymuscle
77237_ch01.indd 777237_ch01.indd 7 8/11/10 8:07:34 AM8/11/10 8:07:34 AM

Chapter 1
8
the papillary muscles and then throughout the walls of the ventricles, allowing papillary muscle contraction to precede that of the ven-tricles. This coordination prevents regurgita-tion of blood fl ow through the AV valves, as discussed earlier.
Cardiac Innervation
The heart is innervated by both parasympa-thetic and sympathetic afferent and efferent nerves. Preganglionic sympathetic neurons located within the upper fi ve to six thoracic levels of the spinal cord synapse with second-order neurons in the cervical sympathetic gan-glia. Traveling within the cardiac nerves, these fi bers terminate in the heart and great vessels. Preganglionic parasympathetic fi bers originate in the dorsal motor nucleus of the medulla and pass as branches of the vagus nerve to the heart and great vessels. Here the fi bers synapse with second-order neurons located in ganglia within these structures. A rich supply of vagal afferents from the inferior and poste-rior aspects of the ventricles mediates impor-tant cardiac refl exes, whereas the abundant vagal efferent fi bers to the SA and AV nodes are active in modulating electrical impulse ini-tiation and conduction.
Cardiac Vessels
The cardiac vessels consist of the coronary ar-teries and veins and the lymphatics. The largest components of these structures lie within the loose connective tissue in the epicardial fat.
Coronary Arteries
The heart muscle is supplied with oxygen and nutrients by the right and left coronary arter-ies, which arise from the root of the aorta just above the aortic valve cusps (Fig. 1.7; see also Fig. 1.5B). After their origin, these vessels pass anteriorly, one on each side of the pulmonary artery (see Fig. 1.7).
The large left main coronary artery passes between the left atrium and the pulmonary trunk to reach the AV groove. There it di-vides into the left anterior descending (LAD) coronary artery and the circumfl ex artery.
The LAD travels within the anterior inter-ventricular groove toward the cardiac apex. During its descent on the anterior surface, the LAD gives off septal branches that supply the anterior two thirds of the interventricular sep-tum and the apical portion of the anterior pap-illary muscle. The LAD also gives off diagonal branches that supply the anterior surface of the left ventricle. The circumfl ex artery con-tinues within the left AV groove and passes around the left border of the heart to reach the posterior surface. It gives off large obtuse marginal branches that supply the lateral and posterior wall of the left ventricle.
The right coronary artery (RCA) travels in the right AV groove, passing posteriorly be-tween the right atrium and ventricle. It supplies blood to the right ventricle via acute marginal branches. In most people, the distal RCA gives rise to a large branch, the posterior descending artery (see Fig. 1.7C). This vessel travels from the inferoposterior aspect of the heart to the apex and supplies blood to the inferior and posterior walls of the ventricles and the posterior one third of the interventricular septum. Just before giv-ing off the posterior descending branch, the RCA usually gives off the AV nodal artery.
The posterior descending and AV nodal arter-ies arise from the RCA in 85% of the population, and in such people, the coronary circulation is termed right dominant. In approximately 8%, the posterior descending artery arises from the circumfl ex artery instead, resulting in a left dom-inant circulation. In the remaining population, the heart’s posterior blood supply is contributed to from branches of both the RCA and the cir-cumfl ex, forming a codominant circulation.
The blood supply to the SA node is also most often (70% of the time) derived from the RCA. However, in 25% of normal hearts, the SA nodal artery arises from the circumfl ex artery, and in 5% of cases, both the RCA and the circumfl ex artery contribute to this vessel.
From their epicardial locations, the coronary arteries send perforating branches into the ven-tricular muscle, which form a richly branching and anastomosing vasculature in the walls of all the cardiac chambers. From this plexus arise a massive number of capillaries that form an elaborate network surrounding each cardiac muscle fi ber. The muscle fi bers located just
77237_ch01.indd 877237_ch01.indd 8 8/11/10 8:07:34 AM8/11/10 8:07:34 AM

Basic Cardiac Structure and Function
9
beneath the endocardium, particularly those of the papillary muscles and the thick left ventricle, are supplied either by the terminal branches of the coronary arteries or directly from the ven-tricular cavity through tiny vascular channels, known as thebesian veins.
Collateral connections, usually �200 µm in diameter, exist at the subarteriolar level between the coronary arteries. In the normal heart, few of these collateral vessels are visible. However, they may become larger and func-
tional when atherosclerotic disease obstructs a coronary artery, thereby providing blood fl ow to distal portions of the vessel from a nonob-structed neighbor.
Coronary Veins
The coronary veins follow a distribution simi-lar to that of the major coronary arteries. These vessels return blood from the myocardial capillaries to the right atrium predominantly
Figure 1.7. Coronary artery anatomy. A. Schematic representation of the right and left coronary arteries demonstrates their orientation to one another. The left main artery bifurcates into the circumfl ex artery, which perfuses the lateral and posterior re-gions of the left ventricle (LV), and the anterior descending artery, which perfuses the LV anterior wall, the anterior portion of the intraventricular septum, and a portion of the anterior right ventricular (RV) wall. The right coronary artery (RCA) perfuses the right ventricle and variable portions of the posterior left ventricle through its terminal branches. The posterior descending artery most often arises from the RCA. B. Anterior view of the heart demonstrating the coronary arteries and their major branches. C. Posterior view of the heart demonstrating the terminal portions of the right and circumfl ex coronary arteries and their branches.
Pulmonary artery
Left circumflexcoronary artery
Left maincoronary artery
Aorta
Left anteriordescendingcoronary artery
Right coronaryartery
Rightcoronaryartery
Acutemarginal branch
Left circumflexcoronary artery
Left anterior descending coronary artery
Diagonalbranch
Left circumflexcoronary artery
Obtusemarginalbranches
Posterior descendingcoronary artery
Rightcoronaryartery
A
B C
77237_ch01.indd 977237_ch01.indd 9 8/11/10 8:07:34 AM8/11/10 8:07:34 AM

Chapter 1
10
via the coronary sinus. The major veins lie in the epicardial fat, usually superfi cial to their arterial counterparts. The thebesian veins, de-scribed earlier, provide an additional potential route for a small amount of direct blood return to the cardiac chambers.
Lymphatic Vessels
The heart lymph is drained by an extensive plexus of valved vessels located in the sub-endocardial connective tissue of all four cham-bers. This lymph drains into an epicardial plexus from which are derived several larger lymphatic vessels that follow the distribution of the coronary arteries and veins. Each of these larger vessels then combines in the AV groove to form a single lymphatic conduit, which exits
the heart to reach the mediastinal lymphatic plexus and ultimately the thoracic duct.
Histology of Ventricular Myocardial Cells
The mature myocardial cell (also termed the myocyte) measures up to 25 µm in diameter and 100 µm in length. The cell shows a cross-striated banding pattern similar to that of the skeletal muscle. However, unlike the multi-nucleated skeletal myofi bers, myocardial cells contain only one or two centrally located nuclei. Surrounding each myocardial cell is the connec-tive tissue with a rich capillary network.
Each myocardial cell contains numerous myofi brils, which are long chains of individ-ual sarcomeres, the fundamental contractile units of the cell (Fig. 1.8). Each sarcomere
Figure 1.8. Myocardial cell. Top, Schematic representation of the ultra-structure of the myocardial cell. The cell consists of multiple parallel myo-fi brils surrounded by mitochondria. The T tubules are invaginations of the cell membrane (the sarcolemma) that increase the surface area for ion trans-port and transmission of electrical impulses. The intracellular sarcoplasmic reticulum houses most of the intracellular calcium and abuts the T tubules. (Modifi ed from Katz AM. Physiology of the Heart. 2nd ed. New York, NY: Raven Press; 1992:21.) Bottom, Expanded view of a sarcomere, the basic unit of contraction. Each myofi bril consists of serially connected sarcomeres that extend from one Z line to the next. The sarcomere is composed of alternating thin (actin) and thick (myosin) myofi laments. Titin is a protein that tethers myosin to the Z line and provides elasticity.
Myofibril
Z ZMyosin TitinActin
Sarcolemma
Mitochondrion
Sarcoplasmicreticulum T tubule
Sarcomere
77237_ch01.indd 1077237_ch01.indd 10 8/11/10 8:07:34 AM8/11/10 8:07:34 AM

Basic Cardiac Structure and Function
11
is made up of two groups of overlapping fi laments of contractile proteins. Biochemi-cal and biophysical interactions occurringbetween these myofi laments produce muscle contraction. Their structure and function are described later in the chapter.
Within each myocardial cell, the neigh-boring sarcomeres are all in register, produc-ing the characteristic cross-striated banding pattern seen by light microscopy. The rela-tive densities of the cross bands identify the location of the contractile proteins. Underphysiologic conditions, the overall sarcomere length (Z-to-Z distance) varies between 2.2 and 1.5 µm during the cardiac cycle. The largerdimension refl ects the fi ber stretch during ven-tricular fi lling, whereas the smaller dimension represents the extent of fi ber shortening dur-ing contraction.
The myocardial cell membrane is termed the sarcolemma. A specialized region of the membrane is the intercalated disk, a distinct characteristic of cardiac muscle tissue. Interca-lated disks are seen on light microscopic study as darkly staining transverse lines that cross chains of cardiac cells at irregular intervals. They represent the gap junction complexes at the interface of adjacent cardiac fi bers and
establish structural and electrical continuity between the myocardial cells.
Another functional feature of the cell membrane is the transverse tubular system (or T tubules). This complex system is char-acterized by deep, fi ngerlike invaginations of the sarcolemma (Fig. 1.9; see also Fig. 1.8). Similar to the intercalated disks, transverse tubular membranes establish pathways for rapid transmission of the excitatory electri-cal impulses that initiate contraction. The T tubule system increases the surface area of the sarcolemma in contact with the extracel-lular environment, allowing the transmem-brane ion transport accompanying excitation and relaxation to occur quickly and synchro-nously.
The sarcoplasmic reticulum (SR) is an extensive intracellular tubular membrane net-work that complements the T tubule system both structurally and functionally. The SR abuts the T tubules at right angles in lateral sacs, called the terminal cisternae (see Fig. 1.9). These sacs house most of intracellular calcium stores; the release of these stores is important in linking membrane excitation with activation of the contractile apparatus. Lateral sacs also abut the intercalated disks and the sarcolemma,
Figure 1.9. Schematic view of the tubular systems of the myocardial cell. The T tubules, invaginations of the sarcolemma, abut the sarcoplasmic reticulum at right angles at the terminal cisternae sacs. This relationship is important in linking membrane excitation with intracellular release of calcium from the sarcoplasmic reticulum.
T tubule
Sarcolemma
Terminal cisternae
ATPase
Sarcoplasmicreticulum
Ca++
Ca++
Ca++
Ca++ Ca++Ca++
Ca++
Ca++
Ca++
Ca++Ca++
77237_ch01.indd 1177237_ch01.indd 11 8/11/10 8:07:34 AM8/11/10 8:07:34 AM
Chapter 1
12
providing each with a complete system for excitation–contraction coupling.
To serve the tremendous metabolic demand placed on the heart and the need for a constant supply of high-energy phosphates, the myocar-dial cell has an abundant concentration of mito-chondria. These organelles are located between the individual myofi brils and constitute approx-imately 35% of cell volume (see Fig. 1.8).
BASIC ELECTROPHYSIOLOGY
Rhythmic contraction of the heart relies on the organized propagation of electrical impulses along its conduction pathway. The marker of electrical stimulation, the action potential, is created by a sequence of ion fl uxes through specifi c channels in the sarcolemma. To pro-vide a basis for understanding how electrical impulses lead to cardiac contraction, the pro-cess of cellular depolarization and repolariza-
tion is reviewed here. This material serves as an important foundation for topics addressed later in the book, including electrocardiogra-phy (see Chapter 4) and cardiac arrhythmias (see Chapters 11 and 12).
Cardiac cells capable of electrical excita-tion are of three electrophysiologic types, the properties of which have been studied by in-tracellular microelectrode and patch-clamprecordings:
1. Pacemaker cells (e.g., SA node, AV node)
2. Specialized rapidly conducting tissues (e.g., Purkinje fi bers)
3. Ventricular and atrial muscle cells
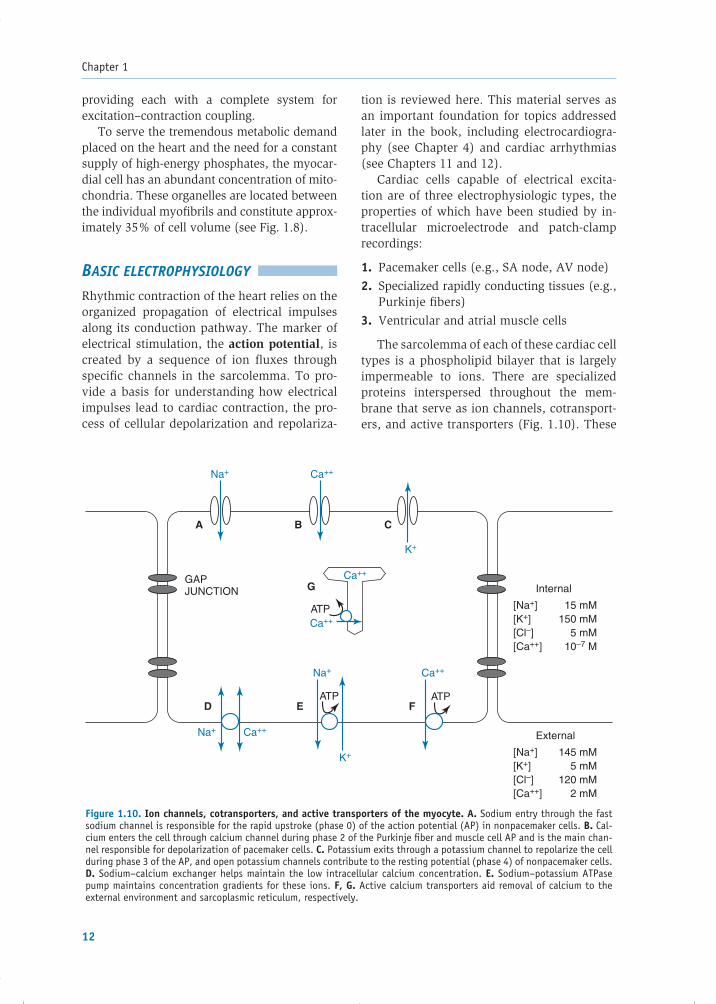
The sarcolemma of each of these cardiac cell types is a phospholipid bilayer that is largely impermeable to ions. There are specialized proteins interspersed throughout the mem-brane that serve as ion channels, cotransport-ers, and active transporters (Fig. 1.10). These
Figure 1.10. Ion channels, cotransporters, and active transporters of the myocyte. A. Sodium entry through the fast sodium channel is responsible for the rapid upstroke (phase 0) of the action potential (AP) in nonpacemaker cells. B. Cal-cium enters the cell through calcium channel during phase 2 of the Purkinje fi ber and muscle cell AP and is the main chan-nel responsible for depolarization of pacemaker cells. C. Potassium exits through a potassium channel to repolarize the cell during phase 3 of the AP, and open potassium channels contribute to the resting potential (phase 4) of nonpacemaker cells. D. Sodium–calcium exchanger helps maintain the low intracellular calcium concentration. E. Sodium–potassium ATPase pump maintains concentration gradients for these ions. F, G. Active calcium transporters aid removal of calcium to the external environment and sarcoplasmic reticulum, respectively.
Ca++
Ca++
Ca++
Ca++
Ca++Na+
Na+
Na+
GAPJUNCTION
ATP
ATPATP
Internal
[Na+][K+][Cl–][Ca++]
15 mM150 mM
5 mM10–7 M
[Na+][K+][Cl–][Ca++]
145 mM5 mM
120 mM2 mM
External
K+
K+
A
D E F
B C
G
77237_ch01.indd 1277237_ch01.indd 12 8/11/10 8:07:34 AM8/11/10 8:07:34 AM
Basic Cardiac Structure and Function
13
help to maintain ionic concentration gradients and charge differentials between the inside and the outside of the cardiac cells. Note that normally, the Na� and Ca�� concentrations are much higher outside the cell and the K� con-centration is much higher inside.
Ion Movement and Channels
The movement of specifi c ions across the cell membrane serves as the basis of the action potential. Ion transport depends on two major factors: (1) the energetic favorability and(2) the permeability of the membrane for the ion.
Energetics
The two major forces that drive the energetics of ion transport are the concentration gradient and the transmembrane potential (voltage). Molecules diffuse from areas of high concen-tration to areas of lower concentration—the gradient between these values is a determi-nant of the rate of ion fl ow. For example, the extracellular Na� concentration is normally 145 mM, while the concentration inside the myocyte is 15 mM. As a result, a strong force tends to drive Na� into the cell, down its con-centration gradient.
The transmembrane potential of cells exerts an electrical force on ions (i.e., like charges repel one another, and opposite charges at-tract). The transmembrane potential of a myo-cyte at rest is about �90 mV (the inside of the cell is negative relative to the outside). Extracellular Na�, a positively charged ion, is therefore attracted to the relatively nega-tively charged interior of the cell. Thus, there is a strong tendency for Na� to enter the cell because of both the steep concentration gradi-ent and the electrical attraction.
Permeability
If there is such a strong force driving Na� into the cell, what keeps this ion from actually moving inside? The membrane of the cell at its resting potential is not permeable to so-dium. The phospholipid bilayer of the cellmembrane is composed of a hydrophobic
core that does not allow simple passage of charged, hydrophilic particles. Instead, per-meability of the membrane is dependent on the opening of specifi c ion channels, special-ized proteins that span the cell membrane and contain hydrophilic pores through which certain charged atoms can pass under specifi c circumstances.
Most types of ion channels share similar protein sequences and structures, consisting of repeating transmembrane domains (Fig. 1.11).Each of these domains contains six membrane- spanning segments. The fourth segment (see S4 in Fig. 1.11) includes a sequence of posi-tively charged amino acids (lysine and argi-nine) that reacts to the membrane potential, and therefore that segment is thought to confer voltage sensitivity to the channel, as described below.
The several types of cardiac ion channels vary by two functional properties: selectivity and gating. Each type of channel is normally selective for a specifi c ion, which is a mani-festation of the size and structure of its pore. For example, in cardiac cells, some channels permit the passage of sodium ions, some are specifi c for potassium, and others allow only calcium to pass through.
An ion can pass through its specifi c chan-nel only at certain times. That is, the ion channel is gated—at any given moment, the channel is either open or closed. The more time a channel is in its open state, the larger the number of ions that pass through it and therefore, the greater the transmembrane current.
Cells contain a population of each type of ion channel, and each individual chan-nel may be in the open or closed state; it is the voltage across the membrane that de-termines what fraction of these channels is open at a given time. Therefore, the gating of channels is said to be voltage sensitive. As the membrane voltage changes during depolarization and repolarization of the cell, specifi c channels open and close, with corre-sponding alterations in the ion fl uxes across the sarcolemma.
An example of voltage-sensitive gating is apparent in the cardiac channel known as the fast sodium channel. The transmembrane
77237_ch01.indd 1377237_ch01.indd 13 8/11/10 8:07:34 AM8/11/10 8:07:34 AM

Chapter 1
14
protein that forms this channel assumes vari-ous conformations depending on the cell’s membrane potential (Fig. 1.12). At a voltage of �90 mV (the typical resting voltage of a ventricular muscle cell), the channels are pri-marily in a closed, resting state, such that Na� ions cannot pass through. In this resting state,
the channels are available for conversion to the open confi guration.
A rapid wave of depolarization causes the membrane potential to become less negative and activates the resting channels to the open state (see Fig. 1.12B). Na� ions readily perme-ate through the open channels, and an inward
Figure 1.11. Structure of ion channels. A. Ion channels consist of glycosylated proteins arranged as repeating transmembrane domains. Each domain consists of six membrane-spanning segments. The potassium channel has four separate domains in a tetrameric struc-ture, while the sodium and calcium channels contain four domains covalently linked as a single unit. In the case of the sodium channel, the loop connecting domains III and IV is believed to serve as the channel’s inactivation gate. B. Enlarged view of a single domain of the sodium channel showing the six membrane-spanning segments. The S4 segment of each domain contains a sequence of positively charged amino acids, which confers the channel’s voltage sensitivity. The peptide loops connecting segments 5 and 6 in each domain form the selectivity fi lter for the channel’s pore, which allows sodium, but not other ions, to pass through. (Parts A and B are reproduced in part from Katz AM. Physiology of the Heart. 2nd ed. New York, NY: Raven Press; 1992:427, 429, with permission.)
C
INACTIVATION GATE
SELECTIVITYFILTER
+ +
+++
SODIUMCHANNEL
A
B
N
C
CALCIUMCHANNEL
POTASSIUMCHANNEL
Extracellular
Intracellular
N
C
N
N
N
S1 S2 S3 S4 S5 S6
N NC
C C
C
DOMAINI
DOMAINII
DOMAINIII
DOMAINIV
77237_ch01.indd 1477237_ch01.indd 14 8/11/10 8:07:34 AM8/11/10 8:07:34 AM

Basic Cardiac Structure and Function
15
Na� current ensues. However, the activated channels remain open for only a brief time, a few thousandths of a second, and then spon-taneously close to an inactive state (see Fig. 1.12C). Channels in the inactivated conforma-tion cannot be directly converted back to the open state.
The inactivated state persists until the membrane voltage has repolarized nearly back to its original resting level. Until it does so, the inactivated channel prevents any fl ow of sodium ions. Thus, during normal cellular depolarization, the voltage-dependent fast sodium channels conduct for a short pe-riod and then inactivate, unable to conduct current again until the cell membrane has nearly fully repolarized and the channels re-
cover from the inactivated to the closed rest-ing state.
Another important attribute of cardiac fast sodium channels should be noted. If the transmembrane voltage of a cardiac cell is slowly depolarized and maintained chroni-cally at levels less negative than the usual resting potential, inactivation of channels oc-curs without initial opening and current fl ow. Furthermore, as long as this partial depolar-ization exists, the closed, inactive channels cannot recover to the resting state. Thus, the fast sodium channels in such a cell are per-sistently unable to conduct Na� ions. This is the typical case in cardiac pacemaker cells(e.g., the SA and AV nodes) in which the membrane voltage is generally less negative
Figure 1.11. (Continued) C. A three-dimensional schematic of the sodium channel, show-ing how the four domains wrap around the channel’s pore. The selectivity fi lter formed by the loops connecting segments 5 and 6 is shown near the extracellular opening of the channel, while the inactivation gate (the loop between domains III and IV) is dis-played on the cytosolic side. (Reproduced from Nelson CL, Cox MM. Lehninger’s Principles of Biochemistry. 3rd ed. New York, NY: Worth; 2000:428, with permission requested.)
Voltagesensor
Selectivityfilter (pore)
III
12
5
3
6
IV II
IInactivationgate (closed)
Inactivationgate (open)
4
C
77237_ch01.indd 1577237_ch01.indd 15 8/11/10 8:07:34 AM8/11/10 8:07:34 AM

Chapter 1
16
than �70 mV throughout the cardiac cycle. As a result, the fast sodium channels in pace-maker cells are persistently inactivated and do not play a role in the generation of the ac-tion potential in these cells (Box 1.1). Calcium and potassium channels in cardiac cells also act in voltage-dependent fashions, but they
behave differently than the sodium channels, as described later.
Resting Potential
In cardiac cells at rest, prior to excitation, the electrical charge differential between
Figure 1.12. Schematic representation of gating of fast sodium channels. A. The four covalently linked transmembrane domains (I, II, III, IV) form the sodium channel, which is guarded by activation and inactivation gates. (Here, domain I is cut away to show the transmembrane pore.) In the resting membrane, most channels are in a closed state. Even though the inactivation gate is open, Na+ ions cannot easily pass through because the activation gate is closed. B. A rapid depolarization changes the cell membrane voltage and forces the activation gate to open, presumably mediated by translocation of the charged portions of segment 4 in each domain. With the channel in this conformation (in which both the activation and inactivation gates are open), Na+ ions permeate into the cell. C. As the inactivation gate spontaneously and quickly closes, the sodium current ceases. The inactivation gating function is thought to be achieved by the peptide loop that connects domains III and IV and swings into the intracellular opening of the channel pore (black arrow). The channel cannot reopen directly from this closed, inactive state. Cellular repolarization returns the channel to the resting condition (A). During repolarization, as high negative membrane voltages are reachieved, the activation gate closes and the inactivation gate reopens.
Activationgate
Rapid depolarization
Repolarization
Spont
aneo
us
Inactivation gate
Outside
A
C
CHANNEL CLOSED(RESTING)
CHANNEL CLOSED(INACTIVE)
Na+
Cellmembrane
Inside
+ + + + + + + +
– – – – – – – –
III
IV II
B
CHANNEL OPEN
Na+
Na+
+ + + + + + + +
– – – – – – – –
+ + + + + + + +
– – – – – – – –
77237_ch01.indd 1677237_ch01.indd 16 8/11/10 8:07:34 AM8/11/10 8:07:34 AM

Basic Cardiac Structure and Function
17
the inside and outside of a cell results in a resting potential. The magnitude of the resting potential of a cell depends on two main properties: (1) the concentration gradients for all the different ions between the inside and outside of the cell, and (2) the relative perme-abilities of ion channels that are open at rest.
As in other tissues such as nerve cells and skeletal muscle, the potassium concentration is much greater inside cardiac cells compared with outside the cells. This is attributed to cell membrane transporters, the most important of which is Na�K�-ATPase. This protein “pump” couples the energy of ATP hydrolysis to ex-port three Na� ions out of the cell in exchange for the inward movement of two K� ions. This acts to maintain intracellular Na+ at low levels and intracellular K� at high levels.
Cardiac myocytes contain a set of potas-sium channels that are open in the resting state (termed inward rectifi er potassium chan-nels), at a time when other ionic channels
(i.e., sodium and calcium) are closed. There-fore, the resting cell membrane is much more permeable to potassium than to other ions. As a result, K� fl ows in an outward direction down its concentration gradient, removing positive charges from the cell. The predominant coun-ter ions for potassium within the cell are large negatively charged proteins that are unable to diffuse outward along with K+. Thus, as potas-sium ions exit the cell, the anions that are left behind cause the interior of the cell to become electrically negative with respect to the outside.
However, as the interior of the cell becomes more negatively charged by the outward fl ux of potassium, the positively charged K+ ions are attracted back by the electrical potential toward the cellular interior, an effect that slows their net exit from the cell. Thus, the two opposing forces directing the fl ux of potassium ions through their open channels in the resting state are (1) the concentration gradient, which favors outward passage of potassium, and (2) the electrostatic
BOX 1.1 Mechanism of Fast Sodium Channels
A key characteristic of fast sodium channels is their ability to activate and then inactivate rapidly when the cell is depolarized. The mechanism by which this occurs has been investigated for many decades. In the mid-1900s, Hodgkin and Huxley studied the action potential in squid giant axons (J Physiol. [Lond] 1952; 117:500–544). They found that ion channels act as if they contain a series of “gates” that open and close in a specifi c pattern when the membrane potential is altered. In the case of the sodium chan-nel, the researchers postulated the presence of m gates that are closed in the resting state and h gates that are open in the resting state. Depolarization of the membrane causes the m gates to open quickly, which allows Na+ ions to pass through the channel (equivalent to the open channel in Fig. 1.12B). However, that same depolarization of the cell also causes the h gates to close, which blocks the passage of sodium ions (the closed, inactive state in Fig. 1.12C). Na+ can fl ow through the channel only when both sets of gates are open. Since the m gates open faster than the h gates close, there is a brief period(about 1 msec) during which Na+ can pass through. After the membrane repolarizes to voltages more negative than about −60 mV, the m gates shut, the h gates reopen, and the channel returns to the closed, resting state (see Fig. 1.12A), available for activation once again. More recent research has demonstrated that ion channel activity is actually more complex than suggested by this model, but there are important correlates with current molecular concepts. For ex-ample, the cluster of positively charged amino acids on segment 4 (S4) of the ion channel domain (seeFig. 1.11) is believed to be the voltage sensor for the m gates that cause the channel to open during depolarization. In the resting state, the strong positive charge on S4 causes it to be pulled inward to-ward the negative membrane potential. During depolarization, as the membrane charge becomes less,S4 can move outward, resulting in a conformational change in the protein that results in channel open-ing. Inactivation (the h gates) is thought to be achieved by the peptide loop that connects domains III and IV of the sodium channel (see Figs. 1.11 and 1.12) that swings into and occludes the channel during depolarization.
77237_ch01.indd 1777237_ch01.indd 17 8/11/10 8:07:34 AM8/11/10 8:07:34 AM
Chapter 1
18
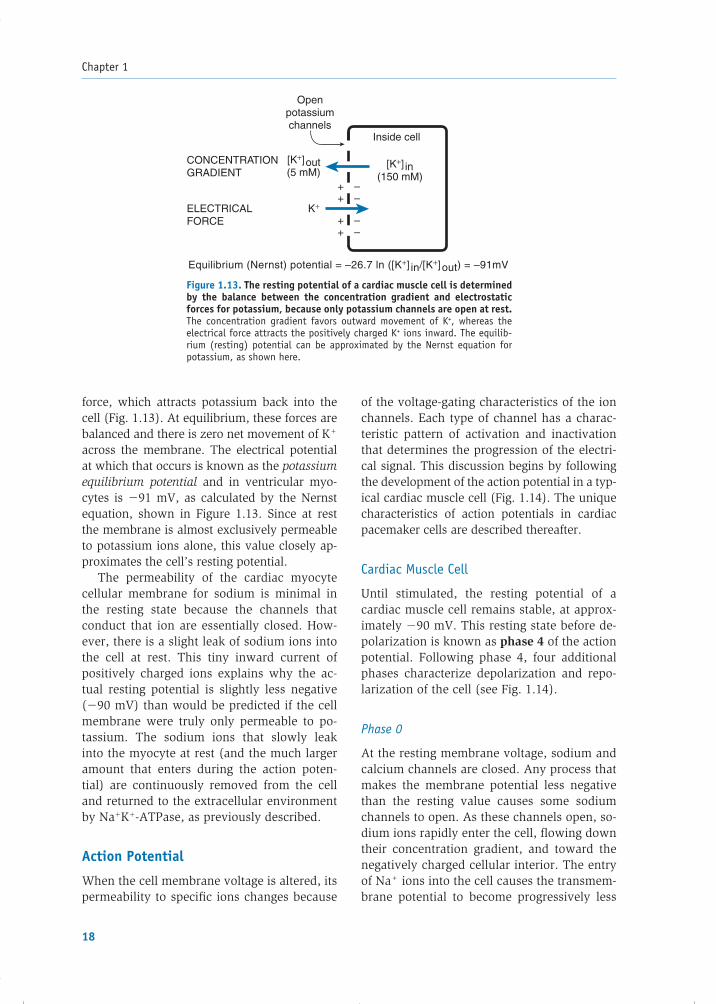
force, which attracts potassium back into the cell (Fig. 1.13). At equilibrium, these forces are balanced and there is zero net movement of K+ across the membrane. The electrical potential at which that occurs is known as the potassium equilibrium potential and in ventricular myo-cytes is �91 mV, as calculated by the Nernst equation, shown in Figure 1.13. Since at rest the membrane is almost exclusively permeable to potassium ions alone, this value closely ap-proximates the cell’s resting potential.
The permeability of the cardiac myocyte cellular membrane for sodium is minimal in the resting state because the channels that conduct that ion are essentially closed. How-ever, there is a slight leak of sodium ions into the cell at rest. This tiny inward current of positively charged ions explains why the ac-tual resting potential is slightly less negative (�90 mV) than would be predicted if the cell membrane were truly only permeable to po-tassium. The sodium ions that slowly leak into the myocyte at rest (and the much larger amount that enters during the action poten-tial) are continuously removed from the cell and returned to the extracellular environment by Na�K�-ATPase, as previously described.
Action Potential
When the cell membrane voltage is altered, its permeability to specifi c ions changes because
of the voltage-gating characteristics of the ion channels. Each type of channel has a charac-teristic pattern of activation and inactivation that determines the progression of the electri-cal signal. This discussion begins by following the development of the action potential in a typ-ical cardiac muscle cell (Fig. 1.14). The unique characteristics of action potentials in cardiac pacemaker cells are described thereafter.
Cardiac Muscle Cell
Until stimulated, the resting potential of a cardiac muscle cell remains stable, at approx-imately �90 mV. This resting state before de-polarization is known as phase 4 of the action potential. Following phase 4, four additional phases characterize depolarization and repo-larization of the cell (see Fig. 1.14).
Phase 0
At the resting membrane voltage, sodium and calcium channels are closed. Any process that makes the membrane potential less negative than the resting value causes some sodium channels to open. As these channels open, so-dium ions rapidly enter the cell, fl owing down their concentration gradient, and toward the negatively charged cellular interior. The entry of Na+ ions into the cell causes the transmem-brane potential to become progressively less
Figure 1.13. The resting potential of a cardiac muscle cell is determined by the balance between the concentration gradient and electrostatic forces for potassium, because only potassium channels are open at rest. The concentration gradient favors outward movement of K+, whereas the electrical force attracts the positively charged K+ ions inward. The equilib-rium (resting) potential can be approximated by the Nernst equation for potassium, as shown here.
Equilibrium (Nernst) potential = –26.7 ln ([K+] in/[K+]out) = –91mV
Inside cell
Openpotassiumchannels
CONCENTRATIONGRADIENT
[K+]out(5 mM)
ELECTRICALFORCE
K+++
++
––
––
[K+] in(150 mM)
77237_ch01.indd 1877237_ch01.indd 18 8/11/10 8:07:34 AM8/11/10 8:07:34 AM

Basic Cardiac Structure and Function
19
negative, which in turn causes more sodium channels to open and promotes further so-dium entry into the cell. When the membrane voltage approaches the threshold potential (approximately �70 mV in cardiac muscle cells), enough of these fast Na+ channels have opened to generate a self-sustaining inward Na+ current. The entry of positively charged Na+ ions exceeds the charge imbalance that was caused by K+ ion movement at rest, such that the cell depolarizes, transiently, to a net positive potential.
The prominent infl ux of sodium ions is re-sponsible for the rapid upstroke, or phase 0, of
the action potential. However, the Na+ chan-nels remain open for only a few thousandths of a second and are then quickly inactivated, preventing further infl ux (see Fig. 1.14). Thus, while activation of these fast Na+ channels causes the rapid early depolarization of the cell, the rapid inactivation makes their major contribution to the action potential short lived.
Phase 1
Following rapid phase 0 depolarization into the positive voltage range, a brief current of repolarization returns the membrane potential to approximately 0 mV. The responsible cur-rent is carried by the outward fl ow of K+ ions through a type of transiently activated potas-sium channel.
Phase 2
This relatively long phase of the action poten-tial is mediated by the balance of an outward K� current in competition with an inward Ca�� current, which fl ows through specifi c L-type calcium channels. The latter channels begin to open during phase 0, when the membrane voltage reaches approximately �40 mV, al-lowing Ca�� ions to fl ow down their con-centration gradient into the cell. Ca�� entry proceeds in a more gradual fashion than the initial infl ux of sodium, because with calcium channels, activation is slower and the chan-nels remain open much longer compared with sodium channels (see Fig. 1.14). During this phase, the Ca�� infl ux is balanced by an ap-proximately equal outward charge movement via K� effl ux, through another specifi c type of potassium channel (termed delayed recti-fi er potassium channels), such that there is no net current and the membrane potential does not change for a prolonged period, which is known as the plateau. Calcium ions that enter the cell during this phase play a critical role in triggering additional internal calcium release from the SR, which is important in initiating myocyte contraction, as discussed later in the chapter. As the Ca�� channels gradually inac-tivate and the effl ux of K� begins to exceed the infl ux of calcium, phase 3 begins.
Figure 1.14. Schematic representation of a myo-cyte action potential (AP) and relative net ion currents for Na+, Ca++, and K+. The resting potential is represented by phase 4 of the AP. Following de-polarization, Na+ infl ux results in the rapid upstroke of phase 0; a transient outward potassium current is responsible for partial repolarization during phase 1; slow Ca++ infl ux (and relatively low K+ effl ux) results in the plateau of phase 2; and fi nal rapid repolariza-tion largely results from K+ effl ux during phase 3.
Mem
bran
e po
tent
ial (
mV
)0
0
Na+
influx
Ca++ influx(and K+ efflux)
K+
efflux
Time
–50
Inwardsodiumcurrent
0
Inwardcalciumcurrent
0
Outwardpotassium
current
–100
1
2
0
4
3
77237_ch01.indd 1977237_ch01.indd 19 8/11/10 8:07:34 AM8/11/10 8:07:34 AM

Chapter 1
20
Phase 3
This is the fi nal phase of repolarization that re-turns the transmembrane voltage back to the resting potential of approximately �90 mV. A continued outward potassium current and low membrane permeability for other cations are re-sponsible for this period of rapid repolarization. Phase 3 completes the action potential cycle, with a return to resting phase 4, preparing the cell for the next stimulus for depolarization.
To preserve normal transmembrane ionic concentration gradients, sodium and calcium ions that enter the cell during depolarization must be returned to the extracellular envi-ronment, and potassium ions must return to the cell interior. As shown in Figure 1.10, Ca�� ions are removed by the sarcolemmal Na��Ca�� exchanger and to a lesser extent by the ATP-consuming calcium pump (sarcolem-mal Ca��-ATPase). The corrective exchange of Na� and K� across the cell membrane is medi-ated by Na�K�-ATPase, as described earlier.
Specialized Conduction System
The process described in the previous sections applies to the action potential of cardiac muscle cells. The cells of the specialized conduction system (e.g., Purkinje fi bers) behave similarly, although the resting potential is slightly more negative and the upstroke of phase 0 is even more rapid.
Pacemaker Cells
The upstroke of the action potential of cardiac muscle cells does not normally occur spontane-ously. Rather, when a wave of depolarization reaches the myocyte from neighboring cells, its membrane potential becomes less negative and an action potential is triggered.
Certain heart cells do not require external provocation to initiate their action potential. Rather, they are capable of self-initiated de-polarization in a rhythmic fashion and are known as pacemaker cells. They are endowed with the property of automaticity, by which the cells undergo spontaneous depolarization during phase 4. When the threshold voltage is reached in such cells, the action potential upstroke is triggered (Fig. 1.15).
Cells that display pacemaker behavior in-clude the SA node (the “natural pacemaker” of the heart) and the AV node. Although atrial and ventricular muscle cells do not normally display automaticity, they may do so under disease conditions such as ischemia.
The shape of the action potential of a pace-maker cell is different from that of a ventricu-lar muscle cell in three ways:
1. The maximum negative voltage of pace-maker cells is approximately �60 mV, substantially less negative than the rest-ing potential of ventricular muscle cells (�90 mV). The persistently less negative membrane voltage of pacemaker cells causes the fast sodium channels within these cells to remain inactivated.
2. Unlike that of cardiac muscle cells, phase 4 of the pacemaker cell action potential is not fl at but has an upward slope, representing spontaneous gradual depolarization. This spontaneous depolarization is the result of an ionic fl ux known as the pacemakercurrent (denoted by If). Current evidence in-dicates that the pacemaker current is carried predominantly by Na+ ions. The ion channel through which the pacemaker current passes is different from the fast sodium channel re-sponsible for phase 0 of the action potential.
Figure 1.15. Action potential of a pace-maker cell. Phase 4 is characterized by gradual, spontaneous depolarization owing to the pacemaker current (If). When the threshold potential is reached, at about−40 mV, the upstroke of the action potential follows. The upstroke of phase 0 is less rapid than in nonpacemaker cells because the cur-rent represents Ca++ infl ux through the rela-tively slow calcium channels.
Mem
bran
e po
tent
ial (
mV
) 0
K+
efflux
Ca2+
influx
lf
Time
–40
–80
4
0
77237_ch01.indd 2077237_ch01.indd 20 8/11/10 8:07:34 AM8/11/10 8:07:34 AM

Basic Cardiac Structure and Function
21
Rather, this pacemaker channel opens during repolarization of the cell, as the membrane potential approaches its most negative val-ues. The inward fl ow of positively charged Na� ions through the pacemaker channel causes the membrane potential to become progressively less negative during phase 4, ultimately depolarizing the cell to its thresh-old voltage (see Fig. 1.15).
3. The phase 0 upstroke of the pacemaker cell action potential is less rapid and reaches a lower amplitude than that of a cardiac mus-cle cell. These characteristics result from the fast sodium channels of the pacemaker cells being inactivated and the upstroke of the action potential relying solely on Ca�� infl ux through the relatively slow calcium channels.
Repolarization of pacemaker cells occurs in a fashion similar to that of ventricular muscle cells and relies on inactivation of the calcium chan-nels and increased activation of potassium chan-nels with enhanced K� effl ux from the cell.
Refractory Periods
Compared with electrical impulses in nerves and skeletal muscle, the cardiac action poten-
tial is much longer in duration. This results in a prolonged refractory period during which the muscle cannot be restimulated. Such a long period is physiologically necessary be-cause it allows the ventricles suffi cient time to empty their contents and refi ll before the next contraction.
There are different levels of refractoriness during the action potential, as illustrated in Figure 1.16. The degree of refractoriness pri-marily refl ects the number of fast Na� chan-nels that have recovered from their inactive state and are capable of reopening. As phase 3 of the action potential progresses, an increas-ing number of Na+ channels recover and can respond to the next depolarization. This, in turn, corresponds to an increasing probability that a stimulus will trigger an action potential and result in a propagated impulse.
The absolute refractory period refers to the time during which the cell is completely unex-citable to a new stimulation. The effective re-fractory period includes the absolute refractory period but extends beyond it to include a short interval of phase 3, during which stimulation produces a localized action potential that is not strong enough to propagate further. The relative refractory period is the interval during which stimulation triggers an action potential
Figure 1.16. Refractory periods (RPs) of the myocyte. During the absolute re-fractory period (ARP), the cell is unexcitable to stimulation. The effective refractory period includes a brief time beyond the ARP during which stimulation produces a localized depolarization that does not propagate (curve 1). During the relative re-fractory period, stimulation produces a weak action potential (AP) that propagates, but more slowly than usual (curve 2). During the supranormal period, a weaker-than-normal stimulus can trigger an AP (curve 3).
Mem
bran
e po
tent
ial (
mV
)
0
AbsoluteRP
EffectiveRP
RelativeRP
Supranormalperiod
–50
–100
1
2
3
77237_ch01.indd 2177237_ch01.indd 21 8/11/10 8:07:34 AM8/11/10 8:07:34 AM

Chapter 1
22
that is conducted, but the rate of rise of the action potential is lower during this period be-cause some of the Na+ channels are inactivated and some of the delayed rectifi er K+ channels remain activated, thus reducing the available net inward current. Following the relative re-fractory period, a short “supranormal” period is present in which a less-than-normal stimu-lus can trigger an action potential.
The refractory period of atrial cells is shorter than that of ventricular muscle cells, such that atrial rates can generally exceed ventricular rates during rapid arrhythmias (see Chapter 11).
Impulse Conduction
During depolarization, the electrical impulse spreads along each cardiac cell, and rap-idly from cell to cell, because each myocyte is connected to its neighbors through low-resistance gap junctions. The speed of tissue depolarization (phase 0) and the conduction velocity along the cell depend on the number of sodium channels and on the magnitude of the resting potential. Tissues with a high con-centration of Na+ channels, such as Purkinje fi bers, have a large, fast inward current, which spreads quickly within and between cells to support rapid conduction. In contrast, the less negative the resting potential, the greater the number of inactivated fast sodium channels, and therefore the less rapid the upstroke ve-locity (Fig. 1.17). Thus, alterations in the rest-ing potential greatly affect the upstroke and conduction velocity of the action potential.
Normal Sequence of Cardiac Depolarization
Electrical activation of the heartbeat is nor-mally initiated at the SA node (see Fig. 1.6). The impulse spreads to the surrounding atrial muscle through intercellular gap junctions that provide electrical continuity between the cells. Ordinary atrial muscle fi bers participate in the propagation of the impulse from the SA to the AV node, although in certain regions the fi -bers are more densely arranged, facilitating conduction.
Fibrous tissue surrounds the tricuspid and mitral valves, such that there is no direct electrical connection between the atrial and ventricular chambers other than through the AV node. As the electrical impulse reaches the AV node, a delay in conduction (approxi-mately 0.1 sec) is encountered. This delay occurs because the small-diameter fi bers in this region conduct slowly, and the action potential is of the “slow” pacemaker type (recall that the fast sodium channels are per-manently inactivated in pacemaker tissues, such that the upstroke velocity relies on the slower calcium channels). The pause in con-duction at the AV node is actually benefi cial because it allows the atria time to contract and fully empty their contents before ven-tricular stimulation. In addition, the delay allows the AV node to serve as a “gatekeeper” of conduction from atria to ventricles, which is critical for limiting the rate of ventricular stimulation during abnormally rapid atrial rhythms.
Figure 1.17. Dependence of speed of depolarization on resting potential. A. Normal resting potential (RP) and rapid rise of phase 0. B. Less negative RP results in slower rise of phase 0 and lower maximum amplitude of the action potential.
Phase0
Mem
bran
e po
tent
ial (
mV
)
0
–50
–100
AB
77237_ch01.indd 2277237_ch01.indd 22 8/11/10 8:07:34 AM8/11/10 8:07:34 AM

Basic Cardiac Structure and Function
23
After traversing the AV node, the cardiac ac-tion potential spreads into the rapidly conduct-ing bundle of His and Purkinje fi bers, which distribute the electrical impulses to the bulk of the ventricular muscle cells. This allows for precisely timed stimulation and contraction of the ventricular myocytes.
EXCITATION–CONTRACTION COUPLING
This section reviews how the electrical action potential leads to physical contraction of cardiac muscle cells, a process known as excitation–contraction coupling. During this process, chem-ical energy in the form of high-energy phosphate compounds is translated into the mechanical energy of myocyte contraction.
Contractile Proteins in the Myocyte
Several distinct proteins are responsible for cardiac muscle cell contraction (Fig. 1.18). Two of the proteins, actin and myosin, are thechief contractile elements. Two other proteins, tropomyosin and troponin, serve regulatory functions.
Myosin is arranged in thick fi laments, each composed of lengthwise stacks of ap-proximately 300 molecules. The myosin fi la-ment exhibits globular heads that are evenly spaced along its length and contain myosin ATPase, an enzyme that is necessary for contraction to occur. Actin, a smaller mol-ecule, is arranged in thin fi laments as an �-helix consisting of two strands that inter-digitate between the thick myosin fi laments
(see Fig. 1.8). Titin (also termed connectin) is a protein that helps tether myosin to the Z line of the sarcomere and provides elasticity to the contractile process.
Tropomyosin is a double helix that lies in the grooves between the actin fi laments and, in the resting state, inhibits the interac-tion between myosin heads and actin, thus preventing contraction. Troponin sits at regular intervals along the actin strands and is composed of three subunits. The troponin T (TnT) subunit links the troponin complex to the actin and tropomyosin molecules. The troponin I (TnI) subunit inhibits the ATPase activity of the actin–myosin interaction. The troponin C (TnC) subunit is responsible for binding calcium ions that regulate the con-tractile process.
Calcium-Induced Calcium Releaseand the Contractile Cycle
The sensitivity of TnC to calcium establishes a crucial role for intracellular Ca�� ions in cellu-lar contraction. The cycling of calcium in and out of the cytosol during each action poten-tial effectively couples electrical excitation to physical contraction.
Recall that during phase 2 of the action potential, activation of L-type Ca�� chan-nels results in an infl ux of Ca�� ions into the myocyte. The small amount of calcium that enters the cell in this fashion is not suffi cient to cause contraction of the myofi brils, but it triggers a much greater Ca�� release from the SR, as follows: The T tubule invaginations of
Figure 1.18. Schematic diagram of the main contractile proteins of the myocyte, actin, and myosin. Tropomyosin and troponin (components TnI, TnC, and TnT) are regulatory proteins.
Tn-1Tn-C
Myosin heads
Tropomyosin
Myosin thick filament
Actin Tn-T
77237_ch01.indd 2377237_ch01.indd 23 8/11/10 8:07:34 AM8/11/10 8:07:34 AM

Chapter 1
24
the sarcolemmal membrane bring the L-type channels into close apposition with special-ized Ca�� release receptors in the SR, known as ryanodine receptors (Fig. 1.19). When calcium enters the cell and binds to the ryan-odine receptor, the receptor undergoes a con-formational change, which results in a much greater release of Ca�� into the cytosol from the abundant stores in the terminal cisternae of the SR. Thus, the initial L-type Ca�� current signal is amplifi ed by this mechanism, known as calcium-induced calcium release (CICR), and the cytosolic calcium concentration dra-matically increases.
As calcium ions bind to TnC, the activity of TnI is inhibited, which induces a conforma-tional change in tropomyosin. The latter event exposes the active site between actin and myo-sin, enabling contraction to proceed.
Contraction ensues as myosin heads bind to actin fi laments and “fl ex,” thus causing the interdigitating thick and thin fi laments to
move past each other in an ATP- dependent reaction (Fig. 1.20). The fi rst step in this process is activation of the myosin head by hydrolysis of ATP, following which the myosin head binds to actin and forms a cross bridge. The interaction between the myosin head and actin results in a conformational change in the head, causing it to pull the actin fi lament inward.
Next, while the myosin head and actin are still attached, ADP is released, and a new mol-ecule of ATP then binds to the myosin head, causing it to release the actin fi lament. The cycle can then repeat. Progressive coupling and uncoupling of actin and myosin causes the muscle fi ber to shorten by increasing the overlap between the myofi laments within each sarcomere. In the presence of ATP, this pro-cess continues for as long as the cytosolic cal-cium concentration remains suffi ciently high to inhibit the troponin–tropomyosin blocking action.
Figure 1.19. Calcium ion movements during excitation and contraction in car-diac muscle cells. Ca++ enters the cell through calcium channels during phase 2 of the action potential, triggering a much larger calcium release from the sarcoplas-mic reticulum (SR) via the ryanodine receptor complex. The binding of cytosolic Ca++ to troponin C (TnC) allows contraction to ensue. Relaxation occurs as Ca++ is returned to the SR by sarco(endo)plasmic reticulum calcium ATPase (SERCA). Phospholamban (PL) is a major regulator of this pump, inhibiting Ca++ uptake in its dephosphorylated state. Excess intracellular calcium is returned to the extracellular environment by sodium–calcium exchange and to a smaller degree by the sarcolem-mal Ca++-ATPase.
Outside cell
Inside cell
PL
Binds toTn-C
Contraction
Ca++
Ca++
Ca++
Ca++
Ca++
SERCASarcoplasmic
reticulum
Ryanodinereceptor
+
Ca++
Na+
ATP
ATP
77237_ch01.indd 2477237_ch01.indd 24 8/11/10 8:07:35 AM8/11/10 8:07:35 AM

Basic Cardiac Structure and Function
25
Myocyte relaxation, like contraction, is syn-chronized with the electrical activity of the cell. Toward the end of phase 2 of the action potential, L-type channels inactivate, arresting the infl ux of Ca�� into the cell and abolishing the trigger for CICR. Concurrently, calcium is pumped back into the SR and out of the cell. Calcium is sequestered back into the SR pri-marily by sarco(endo)plasmic reticulum Ca�� ATPase (SERCA), as shown in Figure 1.19. The small amount of Ca�� that entered the cell through L-type calcium channels is removed via the sarcolemmal Na�–Ca�� exchangerand to a lesser extent by the ATP-consuming calcium pump, sarcolemmal Ca��-ATPase (see Fig. 1.10).
As cytosolic Ca�� concentrations fall and calcium ions dissociate from TnC, tropomyo-sin once again inhibits the actin–myosin inter-action, leading to relaxation of the contracted
cell. The contraction–relaxation cycle can then repeat with the next action potential.
a-Adrenergic and Cholinergic Signaling
There is substantial evidence that the con-centration of Ca�� within the cytosol is the major determinant of the force of cardiac contraction with each heartbeat. Mechanisms that raise intracellular Ca�� concentration enhance force development, whereas fac-tors that lower Ca�� concentration reduce thecontractile force.b -Adrenergic stimulation is one mechanism
that enhances calcium fl uxes in the myocyte and thereby strengthens the force of ventricu-lar contraction (Fig. 1.21). Catecholamines (e.g., norepinephrine) bind to the myocyte�1-adrenergic receptor, which is coupled to and activates the G protein system (Gs) attached
Figure 1.20. The contractile process. A. Myosin head is activated by hydrolysis of ATP. B. Dur-ing cellular depolarization, cytoplasmic calcium concentration increases and removes the troponin–tropomyosin inhibition, such that a cross bridge is formed between actin and myosin. C. Inorganic phosphate (Pi) is released and a conformational change in the myosin head draws the actin fi lament inward. D. ADP is released and replaced by ATP, causing the myosin head to dissociate from the actin fi lament. As the process repeats, the muscle fi ber shortens. The cycle continues until cytosolic calcium concentration decreases at the end of phase 2 of the action potential.
ATP-ATP
-ADP-Pi
-ADP-Pi
-ADP
Pi
Actin
MyosinADP
A. Activation of myosin headby ATP hydrolysis
D. ADP release, ATP binding,actin filament release
B. Cross bridge formationbetween myosin headand actin filament
C. Phosphate releaseand power stroke
77237_ch01.indd 2577237_ch01.indd 25 8/11/10 8:07:35 AM8/11/10 8:07:35 AM

Chapter 1
26
to the inner surface of the cell membrane. Gs in turn stimulates membrane-bound adeny-late cyclase to produce cyclic AMP (cAMP) from ATP. cAMP then activates intracellular protein kinases, which phosphorylate cellular proteins, including the L-type calcium chan-nels within the cell membrane. Phosphoryla-tion of the calcium channel augments Ca�� infl ux, which triggers a corresponding increase in Ca�� release from the SR, thereby enhanc-ing the force of contraction.
�-Adrenergic stimulation of the myocyte also enhances myocyte relaxation. The return of Ca�� from the cytosol to the SR is regulated by phospholamban (PL), a low molecular weight protein in the SR membrane. In its dephos-phorylated state, PL inhibits Ca�� uptake by SERCA (see Fig. 1.19). However, �-adrenergic activation of protein kinases (see Fig. 1.21) causes PL to become phosphorylated, an actionthat blunts PL’s inhibitory effect. The subse-quently greater uptake of calcium ions by the SR hastens Ca�� removal from the cytosol,
promoting myocyte relaxation. The increased cAMP activity also results in phosphorylation of TnI, an action that inhibits actin–myosin interactions and therefore further enhances re-laxation of the cell.
Cholinergic signaling via parasympathetic inputs (mainly from the vagus nerve) opposes the effects of �-adrenergic stimulation (seeFig. 1.21). Acetylcholine released from para-sympathetic nerve terminals binds to the muscarinic M2 receptor on cardiac cells. This receptor also activates G proteins, but in dis-tinction to the �-adrenergic receptor, it is coupled to Gi, an inhibitory G protein system. Gi associated with cholinergic stimulation in-hibits adenylate cyclase activity and reduces cAMP formation. At the sinus node, these actions of cholinergic stimulation serve to re-duce heart rate. In the myocardium, the effect is to counteract the force of contraction in-duced by �-adrenergic stimulation. It should be noted that ventricular cells are much less sensitive to this cholinergic effect than atrial
Figure 1.21. Effects of a-adrenergic and cholinergic stimulation on cardiac cellular sig-naling and calcium ion movement. The binding of a ligand (e.g., norepinephrine) to the �1-adrenergic receptor induces G protein–mediated stimulation of adenylate cyclase and formation of cyclic AMP (cAMP). The latter activates protein kinases, which phosphorylate cellular proteins, including ion channels. Phosphorylation of the slow Ca++ channel enhances calcium movement into the cell and therefore strengthens the force of contraction. Protein kinases also phosphorylate phospholamban (PL), reducing the latter’s inhibition of Ca++ up-take by the sarcoplasmic reticulum. The enhanced removal of Ca++ from the cytosol facilitates relaxation of the myocyte. Cholinergic signaling, triggered by acetylcholine binding to the muscarinic receptor, activates inhibitory G proteins that reduce adenylate cyclase activity and cAMP production, thus antagonizing the effects of �-adrenergic stimulation.
Norepinephrine
Gs protein Gi protein
Ca++
Ca++
Ca++
ATP
Inactiveproteinkinases
Activeproteinkinases PL
ATP
Adenylatecyclase
Muscarinicreceptor
Sarcoplasmicreticulum
cAMP
Acetylcholine
+
+
+ –
77237_ch01.indd 2677237_ch01.indd 26 8/11/10 8:07:35 AM8/11/10 8:07:35 AM

Basic Cardiac Structure and Function
27
cells, likely refl ecting different degrees of G protein coupling.
Thus, physiologic or pharmacologic cat-echolamine stimulation of the myocyte �1-adrenergic receptor enhances contraction of the cell, while cholinergic stimulation opposes that enhancement. We will return to these im-portant properties in later chapters.
SUMMARY
The anatomic structure, cellular composition, and conduction pathways of the heart form an effi cient system for repetitive, organized con-tractions. As a result, the heart is capable of purposeful stimulation billions of times during the life span of a normal person. With each contraction cycle, the heart receives and prop-agates blood through the circulation to provide nutrients to and remove waste products from the body’s tissues.
The following chapters explore what can go wrong with this remarkable system.
Acknowledgments
Contributors to the previous editions of this chap-ter were Vivek Iyer, MD; Kirsten Greineder, MD; Stephanie Harper, MD; Scott Hyver, MD; Paul Kim,
MD; Rajeev Malhotra, MD; Laurence Rhines, MD; James D. Marsh, MD; Gary R. Strichartz, MD; and Leonard S. Lilly, MD.
Additional Reading
Bers DM. Calcium cycling and signaling in cardiac myocytes. Annu Rev Physiol. 2008;70:23–49.
Katz AM. Physiology of the Heart. 4th ed. Philadel-phia, PA: Lippincott Williams & Wilkins; 2006.
Opie LH. Heart Physiology, from Cell to Circulation. 4th ed. Philadelphia, PA: Lippincott Williams & Wilkins; 2004.
Rockman HA, Koch WJ, Lefkowitz RJ. Seven-transmembrane-spanning receptors and heart function. Nature. 2002;415:206.
Saucerman JJ, McCulloch AD. Cardiac beta-adrenergic signaling: from subcellular micro-domains to heart failure. Ann N Y Acad Sci. 2006;1080:348–346.
vanBuren P, Palmer BM. Cooperative activation of the cardiac myofi lament: the pivotal role of tropo-myosin. Circulation. 2010;121:351–353.
Wilcox BR, Cook AC, Anderson RH. Surgical Anat-omy of the Heart. Cambridge, MA: Cambridge University Press, 2005.
Zipes DP, Jalife J, eds. Cardiac Electrophysiology: From Cell to Bedside. 5th ed. Philadelphia, PA: Saunders; 2009.
77237_ch01.indd 2777237_ch01.indd 27 8/11/10 8:07:35 AM8/11/10 8:07:35 AM

28
C H A P T E R
2The Cardiac Cycle: Mechanisms of Heart Sounds and MurmursHenry JungLeonard S. Lilly
CARDIAC CYCLEHEART SOUNDSFirst Heart Sound (S1)Second Heart Sound (S2)Extra Systolic Heart SoundsExtra Diastolic Heart Sounds
MURMURSSystolic MurmursDiastolic MurmursContinuous Murmurs
CARDIAC CYCLE
The cardiac cycle consists of precisely timed electrical and mechanical events that are re-sponsible for rhythmic atrial and ventricular contractions. Figure 2.1 displays the pressure relationships between the left-sided cardiac chambers during the normal cardiac cycle and serves as a platform for describing key events. Mechanical systole refers to the phase of ven-tricular contraction, and diastole refers to the phase of ventricular relaxation and fi lling. Throughout the cardiac cycle, the right and left atria accept blood returning to the heart from the systemic veins and from the pulmo-nary veins, respectively. During diastole, blood passes from the atria into the ventricles across the open tricuspid and mitral valves, causing a gradual increase in ventricular diastolic pres-sures. In late diastole, atrial contraction propels
Cardiac diseases often cause abnormal fi nd-ings on physical examination, including
pathologic heart sounds and murmurs. These fi ndings are clues to the underlying pathophys-iology, and proper interpretation is essential for successful diagnosis and disease manage-ment. This chapter describes heart sounds in the context of the normal cardiac cycle and then focuses on the origins of pathologic heart sounds and murmurs.
Many cardiac diseases are mentioned briefl y in this chapter as examples of abnormal heart sounds and murmurs. Because each of these conditions is described in greater detail later in the book, it is not necessary to memorize the examples presented here. Rather, the goal of this chapter is to explain the mechanisms by which the abnormal sounds are produced, so that their descriptions will make sense in later chapters.
77237_ch02.indd 2877237_ch02.indd 28 8/11/10 8:08:38 AM8/11/10 8:08:38 AM

The Cardiac Cycle: Mechanisms of Heart Sounds and Murmurs
29
a fi nal bolus of blood into each ventricle, an action that produces a brief further rise in atrial and ventricle pressures, termed the a wave (see Fig. 2.1).
Contraction of the ventricles follows, sig-naling the onset of mechanical systole. As the ventricles start to contract, the pressures within them rapidly exceed atrial pressures. This results in the forced closure of the tricus-pid and mitral valves, which produces the fi rst heart sound, termed S1. This sound has two
nearly superimposed components: the mitral component slightly precedes that of the tricus-pid valve because of the earlier electrical acti-vation of the left ventricle (see Chapter 4).
As the right and left ventricular pressures rapidly rise further, they soon exceed the dia-stolic pressures within the pulmonary artery and aorta, forcing the pulmonic and aortic valves to open, and blood is ejected into the pulmonary and systemic circulations. The ventricular pressures continue to increase during the initial portion of this ejection phase, and then decline as ventricular relax-ation commences. Since the pulmonic and aortic valves are open during this phase, the aortic and pulmonary artery pressures rise and fall in parallel to those of the correspond-ing ventricles.
At the conclusion of ventricular ejection, the ventricular pressures decline below those of the pulmonary artery and aorta (the pulmo-nary artery and aorta are elastic structures that maintain their pressures longer), such that the pulmonic and aortic valves are forced to close, producing the second heart sound, S2. Like the fi rst heart sound (S1), this sound consists of two parts: the aortic (A2) component nor-mally precedes the pulmonic (P2) because the diastolic pressure gradient between the aorta and left ventricle is greater than that between the pulmonary artery and the right ventricle, forcing the aortic valve to shut more readily. The ventricular pressures fall rapidly during the subsequent relaxation phase. As they drop below the pressures in the right and left atria, the tricuspid and mitral valves open, followed by diastolic ventricular fi lling and then repeti-tion of this cycle.
Notice in Figure 2.1 that in addition to the a wave, the atrial pressure curve dis-plays two other positive defl ections during the cardiac cycle: the c wave represents a small rise in atrial pressure as the tricuspid and mitral valves close and bulge into their respective atria. The v wave is the result of passive fi lling of the atria from the systemic and pulmonary veins during systole, a pe-riod during which blood accumulates in the atria because the tricuspid and mitral valves are closed.
Figure 2.1. The normal cardiac cycle, showing pressure relationships between the left-sided heart chambers. During diastole, the mitral valve (MV) is open, so that the left atrial (LA) and left ventricular (LV) pressures are equal. In late diastole, LA contraction causes a small rise in pres-sure in both the LA and LV (the a wave). During systolic contraction, the LV pressure rises; when it exceeds the LA pressure, the MV closes, contributing to the fi rst heart sound (S1). As LV pressure rises above the aortic pressure, the aortic valve (AV) opens, which is a silent event. As the ventricle begins to relax and its pressure falls below that of the aorta, the AV closes, contributing to the second heart sound (S2). As LV pressure falls further, below that of the LA, the MV opens, which is silent in the normal heart. In addition to the a wave, the LA pressure curve displays two positive defl ections: the c wave represents a small rise in LA pressure as the MV closes and bulges toward the atrium, and the v wave is the result of passive fi lling of the LA from the pulmonary veins during systole, when the MV is closed.
AV opens
Pre
ssur
e (m
m H
g)
MV opens
AV closes
MV closes
DIASTOLE DIASTOLESYSTOLE
a c v
Time
S1 S2
LV
ECG
100
50
LA
Aorta
77237_ch02.indd 2977237_ch02.indd 29 8/11/10 8:08:38 AM8/11/10 8:08:38 AM
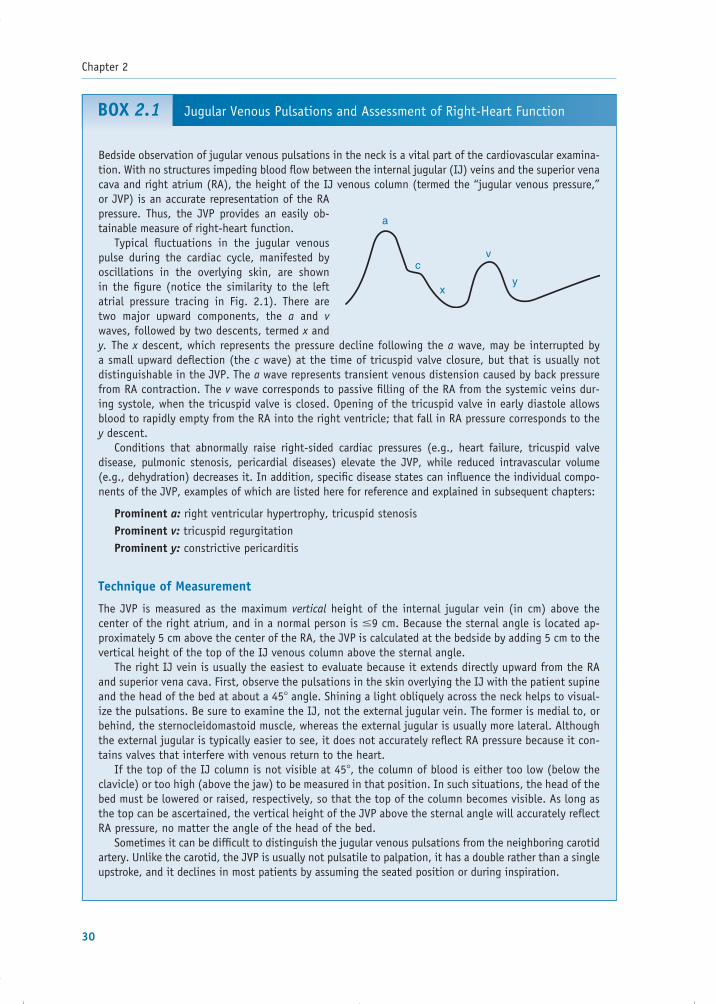
Chapter 2
30
Jugular Venous Pulsations and Assessment of Right-Heart FunctionBOX 2.1
Bedside observation of jugular venous pulsations in the neck is a vital part of the cardiovascular examina-tion. With no structures impeding blood fl ow between the internal jugular (IJ) veins and the superior vena cava and right atrium (RA), the height of the IJ venous column (termed the “jugular venous pressure,” or JVP) is an accurate representation of the RA pressure. Thus, the JVP provides an easily ob-tainable measure of right-heart function. Typical fl uctuations in the jugular venous pulse during the cardiac cycle, manifested by oscillations in the overlying skin, are shown in the fi gure (notice the similarity to the left atrial pressure tracing in Fig. 2.1). There are two major upward components, the a and v waves, followed by two descents, termed x and y. The x descent, which represents the pressure decline following the a wave, may be interrupted by a small upward defl ection (the c wave) at the time of tricuspid valve closure, but that is usually not distinguishable in the JVP. The a wave represents transient venous distension caused by back pressure from RA contraction. The v wave corresponds to passive fi lling of the RA from the systemic veins dur-ing systole, when the tricuspid valve is closed. Opening of the tricuspid valve in early diastole allows blood to rapidly empty from the RA into the right ventricle; that fall in RA pressure corresponds to the y descent. Conditions that abnormally raise right-sided cardiac pressures (e.g., heart failure, tricuspid valve disease, pulmonic stenosis, pericardial diseases) elevate the JVP, while reduced intravascular volume (e.g., dehydration) decreases it. In addition, specifi c disease states can infl uence the individual compo-nents of the JVP, examples of which are listed here for reference and explained in subsequent chapters:
Prominent a: right ventricular hypertrophy, tricuspid stenosisProminent v: tricuspid regurgitationProminent y: constrictive pericarditis
Technique of Measurement
The JVP is measured as the maximum vertical height of the internal jugular vein (in cm) above the center of the right atrium, and in a normal person is �9 cm. Because the sternal angle is located ap-proximately 5 cm above the center of the RA, the JVP is calculated at the bedside by adding 5 cm to the vertical height of the top of the IJ venous column above the sternal angle. The right IJ vein is usually the easiest to evaluate because it extends directly upward from the RA and superior vena cava. First, observe the pulsations in the skin overlying the IJ with the patient supine and the head of the bed at about a 45� angle. Shining a light obliquely across the neck helps to visual-ize the pulsations. Be sure to examine the IJ, not the external jugular vein. The former is medial to, or behind, the sternocleidomastoid muscle, whereas the external jugular is usually more lateral. Although the external jugular is typically easier to see, it does not accurately refl ect RA pressure because it con-tains valves that interfere with venous return to the heart. If the top of the IJ column is not visible at 45�, the column of blood is either too low (below the clavicle) or too high (above the jaw) to be measured in that position. In such situations, the head of the bed must be lowered or raised, respectively, so that the top of the column becomes visible. As long as the top can be ascertained, the vertical height of the JVP above the sternal angle will accurately refl ect RA pressure, no matter the angle of the head of the bed. Sometimes it can be diffi cult to distinguish the jugular venous pulsations from the neighboring carotid artery. Unlike the carotid, the JVP is usually not pulsatile to palpation, it has a double rather than a single upstroke, and it declines in most patients by assuming the seated position or during inspiration.
a
x
v
y
c
77237_ch02.indd 3077237_ch02.indd 30 8/11/10 8:08:38 AM8/11/10 8:08:38 AM

The Cardiac Cycle: Mechanisms of Heart Sounds and Murmurs
31
At the bedside, systole can be approximated as the period from S1 to S2, and diastole from S2 to the next S1. Although the duration of systole remains constant from beat to beat, the length of diastole varies with the heart rate: the faster the heart rate, the shorter the diastolic phase. The main sounds, S1 and S2, provide a frame-work from which all other heart sounds and murmurs can be timed.
The pressure relationships and events de-picted in Figure 2.1 are those that occur in the left side of the heart. Equivalent events occur simultaneously in the right side of the heart in the right atrium, right ventricle, and pulmo-nary artery. At the bedside, clues to right-heart function can be ascertained by examining the jugular venous pulse, which is representative of the right atrial pressure (see Box 2.1).
HEART SOUNDS
Commonly used stethoscopes contain two chest pieces for auscultation of the heart. The concave “bell” chest piece, meant to be applied lightly to the skin, accentuates low-frequency sounds. Conversely, the fl at “diaphragm” chest piece is designed to be pressed fi rmly against the skin to eliminate low frequencies and therefore ac-centuate high-frequency sounds and murmurs. Some modern stethoscopes incorporate both the bell and diaphragm functions into a single chest piece; in these models, placing the piece lightly on the skin brings out the low-frequency sounds, while fi rm pressure accentuates the high-frequency ones. The sections below de-scribe when, and where on the chest, to listen for high- versus low-frequency sounds.
First Heart Sound (S1)
S1 is produced by the closure of the mitral and tricuspid valves in early systole and is loud-est near the apex of the heart (Fig. 2.2). It is a high-frequency sound, best heard with the diaphragm of the stethoscope. Although mi-tral closure usually precedes tricuspid closure, they are separated by only about 0.01 sec, such that the human ear appreciates only a single sound. An exception occurs in patients with right bundle branch block (see Chapter 4), in
whom these components may be audibly split because of delayed right ventricular contrac-tion and late closure of the tricuspid valve.
Three factors determine the intensity of S1: (1) the distance separating the leafl ets of the open valves at the onset of ventricular contrac-tion; (2) the mobility of the leafl ets (normal, or rigid because of stenosis); and (3) the rate of rise of ventricular pressure (Table 2.1).
The distance between the open valve leafl ets at the onset of ventricular contraction relates to the electrocardiographic PR interval (see Chap-ter 4), the period between the onset of atrial and ventricular activation. Atrial contraction at the end of diastole forces the tricuspid and mitral valve leafl ets apart. As they start to drift
Table 2.1. Causes of Altered Intensity of First Heart Sound (S1)
Accentuated S1
1. Shortened PR interval2. Mild mitral stenosis3. High cardiac output states or tachycardia
(e.g., exercise or anemia)
Diminished S1
1. Lengthened PR interval: fi rst-degree AV nodal block
2. Mitral regurgitation3. Severe mitral stenosis4. “Stiff” left ventricle (e.g., systemic
hypertension)
Figure 2.2. Standard positions of stethoscope placement for cardiac auscultation.
Pulmonic area(2nd–3rd leftinterspace)
Mitral area(apex)
Tricuspid area(left lowersternal border)
Aortic area(2nd–3rd rightinterspace)
77237_ch02.indd 3177237_ch02.indd 31 8/11/10 8:08:38 AM8/11/10 8:08:38 AM

Chapter 2
32
back together, ventricular contraction forces them shut, from whatever position they are at, as soon as the ventricular pressure exceeds that in the atrium. An accentuated S1 results when the PR interval is shorter than normal because the valve leafl ets do not have suffi cient time to drift back together and are therefore forced shut from a relatively wide distance.
Similarly, in mild mitral stenosis (see Chap-ter 8), a prolonged diastolic pressure gradient exists between the left atrium and ventricle, which keeps the mobile portions of the mitral leafl ets farther apart than normal during dias-tole. Because the leafl ets are relatively wide apart at the onset of systole, they are forced shut loudly when the left ventricle contracts.
S1 may also be accentuated when the heart rate is more rapid than normal (i.e., tachy-cardia) because diastole is shortened and the leafl ets have insuffi cient time to drift back to-gether before the ventricles contract.
Conditions that reduce the intensity of S1 are also listed in Table 2.1. In fi rst-degree atrioven-tricular (AV) block (see Chapter 12), a dimin-ished S1 results from an abnormally prolonged PR interval, which delays the onset of ventricu-lar contraction. Consequently, following atrial contraction, the mitral and tricuspid valves have additional time to fl oat back together so that the leafl ets are forced closed from only a small distance apart and the sound is softened.
In patients with mitral regurgitation (see Chapter 8), S1 is often diminished in intensity be-cause the mitral leafl ets may not come into full contact with one another as they close. In severe mitral stenosis, the leafl ets are nearly fi xed in position throughout the cardiac cycle, and that reduced movement lessens the intensity of S1.
In patients with a “stiffened” left ventricle (e.g., a hypertrophied chamber), atrial contrac-tion results in a higher-than-normal pressure at the end of diastole. This greater pressure causes the mitral leafl ets to drift together more rapidly, so that they are forced closed from a smaller-than-normal distance when ventricular contrac-tion begins, thus reducing the intensity of S1.
Second Heart Sound (S2)
The second heart sound results from the clo-sure of the aortic and pulmonic valves and
therefore has aortic (A2) and pulmonic (P2) components. Unlike S1, which is usually heard only as a single sound, the components of S2 vary with the respiratory cycle: they are nor-mally fused as one sound during expiration but become audibly separated during inspira-tion, a situation termed normal or physiologic splitting (Fig. 2.3).
One explanation for normal splitting of S2 is as follows. Expansion of the chest during inspiration causes the intrathoracic pressure to become more negative. The negative pres-sure transiently increases the capacitance (and reduces the impedance) of the intrathoracic pulmonary vessels. As a result, there is a tem-porary delay in the diastolic “back pressure” of the pulmonary artery responsible for the closure of the pulmonic valve. Thus, P2 is de-layed; that is, it occurs later during inspiration than during expiration.
Inspiration has the opposite effect on A2. Because the capacity of the intrathoracic pul-monary veins is increased by the negative pressure generated by inspiration, the venous return to the left atrium and ventricle tempo-rarily decreases. Reduced fi lling of the LV di-minishes the stroke volume during the next systolic contraction and therefore shortens the time required for LV emptying. Therefore, aortic valve closure (A2) occurs slightly ear-lier in inspiration than during expiration. The combination of an earlier A2 and delayed P2 during inspiration causes audible separation of the two components. Since these compo-nents are high-frequency sounds, they are best heard with the diaphragm of the stetho-scope, and splitting of S2 is usually most eas-ily appreciated near the second left intercostal space next to the sternum (the pulmonic area in Fig. 2.2).
Abnormalities of S2 include alterations in its intensity and changes in the pattern of split-ting. The intensity of S2 depends on the veloc-ity of blood coursing back toward the valves from the aorta and pulmonary artery after the completion of ventricular contraction, and the suddenness with which that motion is arrested by the closing valves. In systemic hyper-tension or pulmonary arterial hypertension, the diastolic pressure in the respective great artery is higher than normal, such that the ve-
77237_ch02.indd 3277237_ch02.indd 32 8/11/10 8:08:39 AM8/11/10 8:08:39 AM
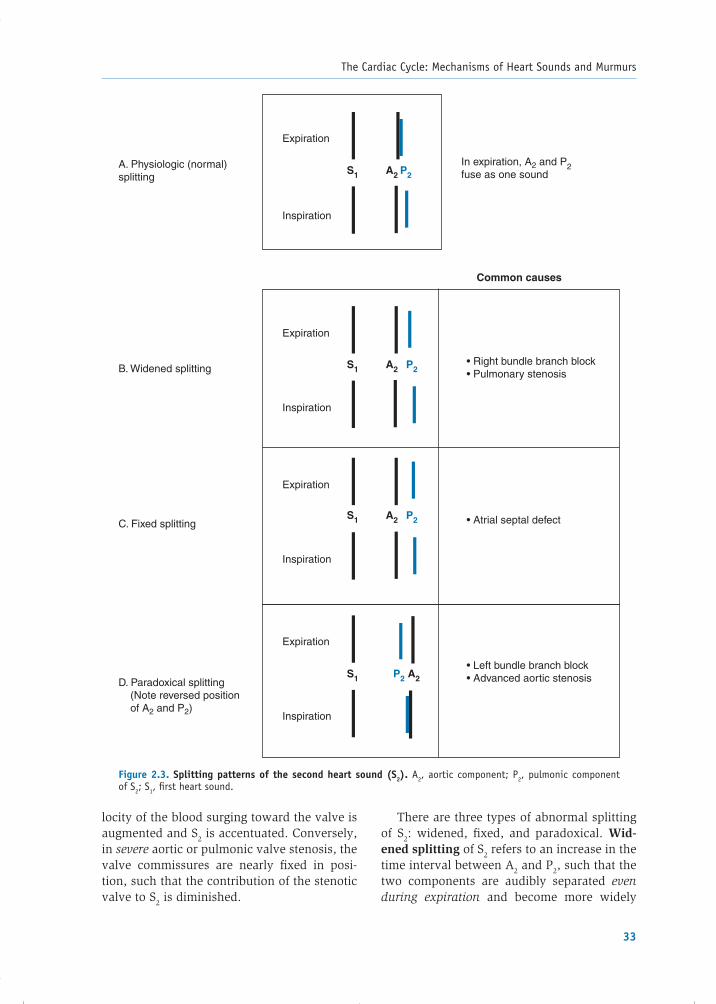
The Cardiac Cycle: Mechanisms of Heart Sounds and Murmurs
33
Figure 2.3. Splitting patterns of the second heart sound (S2). A2, aortic component; P2, pulmonic component of S2; S1, fi rst heart sound.
P2A2A. Physiologic (normal)splitting
B. Widened splitting
C. Fixed splitting
D. Paradoxical splitting (Note reversed position of A2 and P2)
Expiration
Inspiration
Expiration
Inspiration
Expiration
Inspiration
Expiration
Inspiration
In expiration, A2 and P2fuse as one sound
• Right bundle branch block• Pulmonary stenosis
• Left bundle branch block• Advanced aortic stenosis
• Atrial septal defect
Common causes
S1
P2
P2
A2S1
A2S1
A2S1 P2
locity of the blood surging toward the valve is augmented and S2 is accentuated. Conversely, in severe aortic or pulmonic valve stenosis, the valve commissures are nearly fi xed in posi-tion, such that the contribution of the stenotic valve to S2 is diminished.
There are three types of abnormal splitting of S2: widened, fi xed, and paradoxical. Wid-ened splitting of S2 refers to an increase in the time interval between A2 and P2, such that the two components are audibly separated even during expiration and become more widely
77237_ch02.indd 3377237_ch02.indd 33 8/11/10 8:08:39 AM8/11/10 8:08:39 AM

Chapter 2
34
separated in inspiration (see Fig. 2.3). This pattern is usually the result of delayed closure of the pulmonic valve, which occurs in right bundle branch block (described in Chapter 4) and pulmonic valve stenosis (see Chapter 16).
Fixed splitting of S2 is an abnormally wid-ened interval between A2 and P2 that persists unchanged through the respiratory cycle (see Fig. 2.3). The most common abnormality that causes fi xed splitting of S2 is an atrial septal de-fect (see Chapter 16). In that condition, chronic volume overload of the right-sided circulation results in a high-capacitance, low-resistance pulmonary vascular system. This alteration in pulmonary artery hemodynamics delays the back pressure responsible for the closure of the pulmonic valve. Thus, P2 occurs later than normal, even during expiration, such that there is wider-than-normal separation of A2 and P2. The pattern of splitting does not change (i.e., it is fi xed) during the respiratory cycle because (1) inspiration does not substantially increase further the already elevated pulmonary vascu-lar capacitance, and (2) augmented fi lling of the right atrium from the systemic veins during inspiration is counterbalanced by a reciprocal decrease in the left-to-right transatrial shunt, eliminating respiratory variations in right ven-tricular fi lling.
Paradoxical splitting (also termed “re-versed” splitting) refers to audible separation of A2 and P2 during expiration that fuses into a single sound on inspiration, the opposite of the normal situation. It refl ects an abnor-mal delay in the closure of the aortic valve such that P2 precedes A2. In adults, the most common cause is left bundle branch block (LBBB). In LBBB, described in Chapter 4, the spread of electrical activity through the left ventricle is impaired, resulting in delayed ventricular contraction and late closure of the aortic valve, causing A2 to abnormally follow P2. Then during inspiration, as in the normal case, the pulmonic valve closure sound be-comes delayed and the aortic valve closure sound moves earlier. This results in narrow-ing, and often superimposition, of the two sounds; thus, there is no apparent split at the height of inspiration (see Fig. 2.3). In addi-tion to LBBB, paradoxical splitting may be
observed under circumstances in which left ventricular ejection is greatly prolonged, such as aortic stenosis.
Extra Systolic Heart Sounds
Extra systolic heart sounds may occur in early, mid-, or late systole.
Early Extra Systolic Heart Sounds
Abnormal early systolic sounds, or ejection clicks, occur shortly after S1 and coincide with the opening of the aortic or pulmonic valves (Fig. 2.4). These sounds have a sharp, high-pitched quality, so they are heard best with the diaphragm of the stethoscope placed over the aortic and pulmonic areas (see Fig. 2.2).
Figure 2.4. Timing of extra systolic and diastolic heart sounds. S4 is produced by atrial contraction into a “stiff” left ventricle (LV). An ejection click follows the opening of the aortic or pulmonic valve in cases of valve stenosis or dilatation of the corresponding great artery. S3 occurs during the period of rapid ventricular fi lling; it is normal in young people, but its presence in adults implies LV contractile dysfunction. The timing of an opening snap (OS) is placed for comparison, but it is not likely that all of these sounds would appear in the same person. LA, left atrium; MV, mitral valve.
MV opens
S1 S2
LV
ECG
LA
Aorta
S4Ejection
clickOS
S3
77237_ch02.indd 3477237_ch02.indd 34 8/11/10 8:08:39 AM8/11/10 8:08:39 AM

The Cardiac Cycle: Mechanisms of Heart Sounds and Murmurs
35
Ejection clicks indicate the presence of aor-tic or pulmonic valve stenosis or dilatation of the pulmonary artery or aorta. In stenosis of the aortic or pulmonic valve, the sound oc-curs as the deformed valve leafl ets reach their maximal level of ascent into the great artery, just prior to blood ejection. At that moment, the rapidly ascending valve reaches its elastic limit and decelerates abruptly, an action thought to result in the sound generation. In dilatation of the root of the aorta or pulmonary artery, the sound is associated with sudden tensing of the aortic or pulmonic root with the onset of blood fl ow into the vessel. The aortic ejection click is heard at both the base and the apex of the heart and does not vary with respiration. In contrast, the pulmonic ejection click is heard only at the base and its intensity diminishes during inspiration (see Chapter 16).
Mid- or Late Extra Systolic Heart Sounds
Clicks occurring in mid- or late systole are usu-ally the result of systolic prolapse of the mitral or tricuspid valves, in which the leafl ets bulge abnormally from the ventricular side of the AV junction into the atrium during ventricular contraction, often accompanied by valvular re-gurgitation (described in Chapter 8). They are loudest over the mitral or tricuspid ausculta-tory regions, respectively.
Extra Diastolic Heart Sounds
Extra heart sounds in diastole include the opening snap (OS), the third heart sound (S3), the fourth heart sound (S4), and the pericardial knock.
Opening Snap
Opening of the mitral and tricuspid valves is normally silent, but mitral or tricuspid valvular stenosis (usually the result of rheumatic heart disease; see Chapter 8) produces a sound, termed as snap, when the affected valve opens. It is a sharp, high-pitched sound, and its timing does not vary signifi cantly with respiration. In mitral stenosis (which is much more common than tricuspid valve stenosis), the OS is heard best between the apex and the left sternal
border, just after the aortic closure sound (A2), when the left ventricular pressure falls below that of the left atrium (see Fig. 2.4).
Because of its proximity to A2, the A2–OS sequence can be confused with a widely split second heart sound. However, careful auscul-tation at the pulmonic area during inspiration reveals three sounds occurring in rapid suc-cession (Fig. 2.5), which correspond to aortic closure (A2), pulmonic closure (P2), and then the OS. The three sounds become two on expi-ration because A2 and P2 normally fuse.
The severity of stenosis can be approxi-mated by the time interval between A2 and the OS: the more advanced the stenosis, the shorter the interval. This occurs because the degree of left atrial pressure elevation corre-sponds to the severity of mitral stenosis. When the ventricle relaxes in diastole, the greater the left atrial pressure, the earlier the mitral valve opens. Compared with severe stenosis, mild disease is marked by a less elevated left atrial pressure, lengthening the time it takes for the left ventricular pressure to fall below that of the atrium. Therefore, in mild mitral stenosis, the OS is widely separated from A2, whereas in more severe stenosis, the A2–OS interval is narrower.
Third Heart Sound (S3)
When present, an S3 occurs in early diastole, following the opening of the AV valves, during
Figure 2.5. Timing of the opening snap (OS) in mitral stenosis does not change with respiration. On inspiration, normal splitting of the second heart sound (S2) is observed so that three sounds are heard. A2, aortic component; P2, pulmonic com-ponent of S2; S1, fi rst heart sound.
OS
OS
P2A2
Expiration
Inspiration
S1 S2
77237_ch02.indd 3577237_ch02.indd 35 8/11/10 8:08:39 AM8/11/10 8:08:39 AM

Chapter 2
36
the ventricular rapid fi lling phase (see Fig. 2.4). It is a dull, low-pitched sound best heard with the bell of the stethoscope. A left-sided S3 is typically loudest over the cardiac apex while the patient lies in the left lateral decubitus position. A right-sided S3 is better appreciated at the lower-left sternal border. Production of the S3 appears to result from tensing of the chordae tendineae during rapid fi lling and ex-pansion of the ventricle.
An S3 is a normal fi nding in children and young adults. In these groups, an S3 implies the presence of a supple ventricle capable of normal rapid expansion in early diastole. Con-versely, when heard in middle-aged or older adults, an S3 is often a sign of disease, indi-cating volume overload owing to congestive heart failure, or the increased transvalvular fl ow that accompanies advanced mitral or tri-cuspid regurgitation (described in Chapter 8). A pathologic S3 is sometimes referred to as a ventricular gallop.
Fourth Heart Sound (S4)
When an S4 is present, it occurs in late di-astole and coincides with contraction of the atria (see Fig. 2.4). This sound is generated by the left (or right) atrium vigorously con-tracting against a stiffened ventricle. Thus, an S4 usually indicates the presence of car-diac disease—specifi cally, a decrease in ven-tricular compliance typically resulting from ventricular hypertrophy or myocardial isch-emia. Like an S3, the S4 is a dull, low-pitched sound and is best heard with the bell of the stethoscope. In the case of the more common left-sided S4, the sound is loudest at the apex, with the patient lying in the left lateral decu-bitus position. S4 is sometimes referred to as an atrial gallop.
Quadruple Rhythm or Summation Gallop
In a patient with both an S3 and S4, those sounds, in conjunction with S1 and S2, pro-duce a quadruple beat. If a patient with a quadruple rhythm develops tachycardia, dias-tole becomes shorter in duration, the S3 and S4 coalesce, and a summation gallop results.
The summation of S3 and S4 is heard as a long middiastolic, low-pitched sound, often louder than S1 and S2.
Pericardial Knock
A pericardial knock is an uncommon, high-pitched sound that occurs in patients with se-vere constrictive pericarditis (see Chapter 14). It appears early in diastole soon after S2 and can be confused with an OS or an S3. How-ever, the knock appears slightly later in dias-tole than the timing of an OS and is louder and occurs earlier than the ventricular gallop. It re-sults from the abrupt cessation of ventricular fi lling in early diastole, which is the hallmark of constrictive pericarditis.
MURMURS
A murmur is the sound generated by turbu-lent blood fl ow. Under normal conditions, the movement of blood through the vascular bed is laminar, smooth, and silent. However, as a result of hemodynamic and/or structural changes, laminar fl ow can become disturbed and produce an audible noise. Murmurs result from any of the following mechanisms:
1. Flow across a partial obstruction (e.g., aortic stenosis)
2. Increased fl ow through normal structures (e.g., aortic systolic murmur associated with a high-output state, such as anemia)
3. Ejection into a dilated chamber (e.g., aortic systolic murmur associated with aneurys-mal dilatation of the aorta)
4. Regurgitant fl ow across an incompetent valve (e.g., mitral regurgitation)
5. Abnormal shunting of blood from one vas-cular chamber to a lower-pressure chamber (e.g., ventricular septal defect [VSD])
Murmurs are described by their timing, intensity, pitch, shape, location, radiation, and response to maneuvers. Timing refers to whether the murmur occurs during systole or diastole, or is continuous (i.e., begins in systole and continues into diastole). The in-tensity of the murmur is typically quantifi ed
77237_ch02.indd 3677237_ch02.indd 36 8/11/10 8:08:39 AM8/11/10 8:08:39 AM

The Cardiac Cycle: Mechanisms of Heart Sounds and Murmurs
37
by a grading system. In the case of systolic murmurs:
Grade 1/6 (or I/VI): Barely audible (i.e., medical students may not hear it!)
Grade 2/6 (or II/VI): Faint but immediately audible
Grade 3/6 (or III/VI): Easily heardGrade 4/6 (or IV/VI): Easily heard and asso-
ciated with a palpable thrill
Grade 5/6 (or V/VI): Very loud; heard with stethoscope lightly on chest
Grade 6/6 (or VI/VI): Audible without the stethoscope directlyon the chest wall
And in the case of diastolic murmurs:
Grade 1/4 (or I/IV): Barely audibleGrade 2/4 (or II/IV): Faint but immediately
audibleGrade 3/4 (or III/IV): Easily heardGrade 4/4 (or IV/IV): Very loud
Pitch refers to the frequency of the murmur, ranging from high to low. High-frequency murmurs are caused by large pressure gradi-ents between chambers (e.g., aortic stenosis) and are best appreciated using the diaphragm chest piece of the stethoscope. Low-frequency murmurs imply less of a pressure gradient between chambers (e.g., mitral stenosis) and are best heard using the stethoscope’s bell piece.
Shape describes how the murmur changes in intensity from its onset to its completion. For example, a crescendo–decrescendo (or “diamond-shaped”) murmur fi rst rises and then falls off in intensity. Other shapes in-clude decrescendo (i.e., the murmur begins at its maximum intensity and grows softer) and uniform (the intensity of the murmur does not change).
Location refers to the murmur’s region of maximum intensity and is usually described in terms of specifi c auscultatory areas (see Fig. 2.2):
Aortic area: Second to third right intercostal spaces, next to sternum
Pulmonic area: Second to third left intercos-tal spaces, next to sternum
Tricuspid area: Lower-left sternal borderMitral area: Cardiac apex
From their primary locations, murmurs are often heard to radiate to other areas of the chest, and such patterns of transmission relate to the direction of the turbulent fl ow. Finally, similar types of murmurs can be distinguished from one another by simple bedside maneuvers, such as standing upright, Valsalva (forceful ex-piration against a closed airway), or clenching of the fi sts, each of which alters the heart’s loading conditions and can affect the intensity of many murmurs. Examples of the effects of maneuvers on specifi c murmurs are presented in Chapter 8.
When reporting a murmur, some or all of these descriptors are mentioned. For exam-ple, you might describe a particular patient’s murmur of aortic stenosis as “A grade III/VI high-pitched, crescendo–decrescendo systolic murmur, heard best at the upper-right sternal border, with radiation toward the neck.”
Systolic Murmurs
Systolic murmurs are subdivided into systolic ejection murmurs, pansystolic murmurs, and late systolic murmurs (Fig. 2.6). A systolic ejection murmur is typical of aortic or pul-monic valve stenosis. It begins after the fi rst heart sound and terminates before or during S2, depending on its severity and whether the obstruction is of the aortic or pulmonic valve. The shape of the murmur is of the crescendo–decrescendo type (i.e., its intensity rises and then falls).
The ejection murmur of aortic stenosis begins in systole after S1, from which it is separated by
77237_ch02.indd 3777237_ch02.indd 37 8/11/10 8:08:39 AM8/11/10 8:08:39 AM

Chapter 2
38
aortic valve has opened). The murmur be-comes more intense as fl ow increases across the aortic valve during the rise in left ven-tricular pressure (crescendo). Then, as the ventricle relaxes, forward fl ow decreases, and the murmur lessens in intensity (decrescendo) and fi nally ends prior to the aortic component of S2. The murmur may be immediately pre-ceded by an ejection click, especially in mild forms of aortic stenosis.
Although the intensity of the murmur does not correlate well with the severity of aortic stenosis, other features do. For example, the more severe the stenosis, the longer it takes to force blood across the valve, and the later the murmur peaks in systole (Fig. 2.8). Also, as shown in Figure 2.8, as the severity of stenosis increases, the aor-tic component of S2 softens because the leafl ets become more rigidly fi xed in place.
Aortic stenosis causes a high-frequency murmur, refl ecting the sizable pressure gra-dient across the valve. It is best heard in the “aortic area” at the second and third right in-tercostal spaces close to the sternum (see Fig. 2.2). The murmur typically radiates toward the neck (the direction of turbulent blood fl ow) but often can be heard in a wide distribution, including the cardiac apex.
The murmur of pulmonic stenosis also begins after S1, it may be preceded by an ejection click,
Figure 2.7. Systolic ejection murmur of aortic stenosis. There is a short delay between the fi rst heart sound (S1) and the onset of the murmur. LV, left ventricle; S2, second heart sound.
Figure 2.6. Classifi cation of systolic murmurs. Ejection murmurs are crescendo–decrescendo in confi guration, whereas pansystolic murmurs are uniform throughout systole. A late systolic murmur often follows a midsys-tolic click and suggests mitral (or tricuspid) valve prolapse.
ClickS1 S2
S1 S2
S1 S2
A. Ejection type • Aortic stenosis• Pulmonary stenosis
• Mitral regurgitation• Tricuspid regurgitation• Ventricular septal defect
• Mitral valve prolapse
Examples
B. Pansystolic (holosystolic)
C. Late systolic
a short audible gap (Fig. 2.7). This gap cor-responds to the period of isovolumetric con-traction of the left ventricle (the period after the mitral valve has closed but before the
S1 S2
Aorta
LV
Aorticvalveopens
77237_ch02.indd 3877237_ch02.indd 38 8/11/10 8:08:39 AM8/11/10 8:08:39 AM
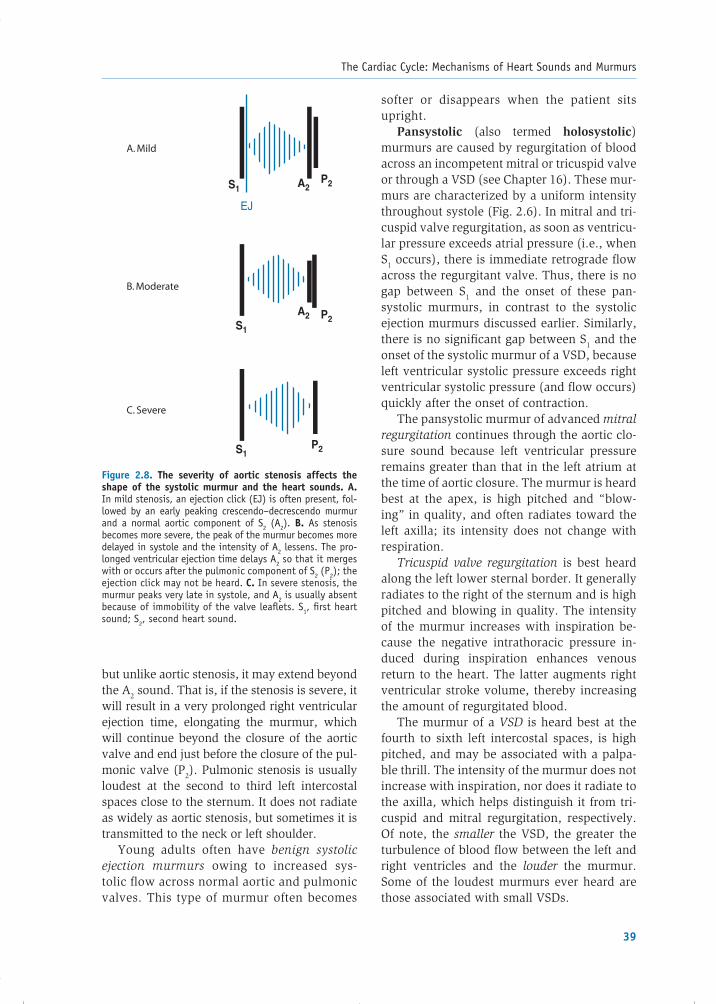
The Cardiac Cycle: Mechanisms of Heart Sounds and Murmurs
39
but unlike aortic stenosis, it may extend beyond the A2 sound. That is, if the stenosis is severe, it will result in a very prolonged right ventricular ejection time, elongating the murmur, which will continue beyond the closure of the aortic valve and end just before the closure of the pul-monic valve (P2). Pulmonic stenosis is usually loudest at the second to third left intercostal spaces close to the sternum. It does not radiate as widely as aortic stenosis, but sometimes it is transmitted to the neck or left shoulder.
Young adults often have benign systolic ejection murmurs owing to increased sys-tolic fl ow across normal aortic and pulmonic valves. This type of murmur often becomes
softer or disappears when the patient sits upright.
Pansystolic (also termed holosystolic) murmurs are caused by regurgitation of blood across an incompetent mitral or tricuspid valve or through a VSD (see Chapter 16). These mur-murs are characterized by a uniform intensity throughout systole (Fig. 2.6). In mitral and tri-cuspid valve regurgitation, as soon as ventricu-lar pressure exceeds atrial pressure (i.e., when S1 occurs), there is immediate retrograde fl ow across the regurgitant valve. Thus, there is no gap between S1 and the onset of these pan-systolic murmurs, in contrast to the systolic ejection murmurs discussed earlier. Similarly, there is no signifi cant gap between S1 and the onset of the systolic murmur of a VSD, because left ventricular systolic pressure exceeds right ventricular systolic pressure (and fl ow occurs) quickly after the onset of contraction.
The pansystolic murmur of advanced mitral regurgitation continues through the aortic clo-sure sound because left ventricular pressure remains greater than that in the left atrium at the time of aortic closure. The murmur is heard best at the apex, is high pitched and “blow-ing” in quality, and often radiates toward the left axilla; its intensity does not change with respiration.
Tricuspid valve regurgitation is best heard along the left lower sternal border. It generally radiates to the right of the sternum and is high pitched and blowing in quality. The intensity of the murmur increases with inspiration be-cause the negative intrathoracic pressure in-duced during inspiration enhances venous return to the heart. The latter augments right ventricular stroke volume, thereby increasing the amount of regurgitated blood.
The murmur of a VSD is heard best at the fourth to sixth left intercostal spaces, is high pitched, and may be associated with a palpa-ble thrill. The intensity of the murmur does not increase with inspiration, nor does it radiate to the axilla, which helps distinguish it from tri-cuspid and mitral regurgitation, respectively. Of note, the smaller the VSD, the greater the turbulence of blood fl ow between the left and right ventricles and the louder the murmur. Some of the loudest murmurs ever heard are those associated with small VSDs.
Figure 2.8. The severity of aortic stenosis affects the shape of the systolic murmur and the heart sounds. A. In mild stenosis, an ejection click (EJ) is often present, fol-lowed by an early peaking crescendo–decrescendo murmur and a normal aortic component of S2 (A2). B. As stenosis becomes more severe, the peak of the murmur becomes more delayed in systole and the intensity of A2 lessens. The pro-longed ventricular ejection time delays A2 so that it merges with or occurs after the pulmonic component of S2 (P2); the ejection click may not be heard. C. In severe stenosis, the murmur peaks very late in systole, and A2 is usually absent because of immobility of the valve leafl ets. S1, fi rst heart sound; S2, second heart sound.
S1 A2P2
P2S1
S1
A2
A. Mild
B. Moderate
C. Severe
P2
EJ
77237_ch02.indd 3977237_ch02.indd 39 8/11/10 8:08:39 AM8/11/10 8:08:39 AM

Chapter 2
40
maximum intensity at its onset. Thereafter in diastole, as the aortic pressure falls and the LV pressure increases (as blood regurgitates into the ventricle), the gradient between the two chambers diminishes and the murmur decreases in intensity. Aortic regurgitation is a high-pitched murmur, best heard using the diaphragm of the stethoscope along the left sternal border with the patient sitting, leaning forward, and exhaling.
Pulmonic regurgitation in adults is usually due to pulmonary arterial hypertension. It is an early diastolic decrescendo murmur simi-lar to that of aortic regurgitation, but it is best heard in the pulmonic area (Fig. 2.2) and its intensity may increase with inspiration.
Mid-to-late diastolic murmurs result from either turbulent fl ow across a stenotic mitral or tricuspid valve or less commonly from abnor-mally increased fl ow across a normal mitral or tricuspid valve (see Fig. 2.9). If resulting from stenosis, the murmur begins after S2 and is preceded by an OS. The shape of this murmur is unique. Following valvular opening (and the OS), the murmur is at its loudest because the pressure gradient between the atrium and
Late systolic murmurs begin in mid-to-late systole and continue to the end of systole (see Fig. 2.6). The most common example is mitral regurgitation caused by mitral valve prolapse—bowing of abnormally redundant and elon-gated valve leafl ets into the left atrium during ventricular contraction. This murmur is usu-ally preceded by a midsystolic click and is de-scribed in Chapter 8.
Diastolic Murmurs
Diastolic murmurs are divided into early de-crescendo murmurs and mid-to-late rumbling murmurs (Fig. 2.9). Early diastolic murmurs result from regurgitant fl ow through either the aortic or pulmonic valve, with the former being much more common in adults. If pro-duced by aortic valve regurgitation, the mur-mur begins at A2, has a decrescendo shape, and terminates before the next S1. Because diastolic relaxation of the left ventricle is rapid, a pressure gradient develops immedi-ately between the aorta and lower-pressured left ventricle in patients with aortic regurgita-tion, and the murmur therefore displays its
Figure 2.9. Classifi cation of diastolic murmurs. A. An early diastolic decrescendo murmur is typical of aortic or pulmonic valve regurgitation. B. Mid-to-late low-frequency rumbling murmurs are usually the result of mitral or tricuspid valve stenosis, and follow a sharp opening snap (OS). Presystolic accentua-tion of the murmur occurs in patients in normal sinus rhythm because of the transient rise in atrial pressure during atrial contraction. C. In more severe mitral or tricuspid valve stenosis, the opening snap and diastolic murmur occur earlier and the murmur is prolonged. S1, fi rst heart sound; S2, second heart sound.
• Aortic regurgitation• Pulmonic regurgitation
• Mild mitral or tricuspid stenosis
• Severe mitral or tricuspid stenosis
S1 S1S2
S1 S1S2
S1 S1S2
A. Early decrescendo
B. Mid-to-late
C. Prolonged mid-to-late
OS
OS
77237_ch02.indd 4077237_ch02.indd 40 8/11/10 8:08:40 AM8/11/10 8:08:40 AM

The Cardiac Cycle: Mechanisms of Heart Sounds and Murmurs
41
ventricle is at its maximum. The murmur then decrescendos or disappears totally during di-astole as the transvalvular gradient decreases. The degree to which the murmur fades de-pends on the severity of the stenosis. If the stenosis is severe, the murmur is prolonged; if the stenosis is mild, the murmur disappears in mid-to-late diastole. Whether the stenosis is mild or severe, the murmur intensifi es at the end of diastole in patients in normal sinus rhythm, when atrial contraction augments fl ow (and turbulence) across the valve (see Fig. 2.9). Since the pressure gradient across a stenotic mitral valve tends to be fairly low, the murmur of mitral stenosis is low pitched and is heard best with the bell of the stetho-scope at the apex, while the patient lies in the left lateral decubitus position. The much less common murmur of tricuspid stenosis is bet-ter auscultated at the lower sternum, near the xiphoid process.
Hyperdynamic states such as fever, ane-mia, hyperthyroidism, and exercise cause in-creased fl ow across the normal tricuspid and mitral valves and can therefore result in a diastolic murmur. Similarly, in patients with advanced mitral regurgitation, the expected systolic murmur can be accompanied by an additional diastolic murmur owing to the increased volume of blood that must return across the valve to the left ventricle in dias-tole. Likewise, patients with either tricuspid regurgitation or an atrial septal defect (see Chapter 16) have increased fl ow, and may therefore display a diastolic fl ow murmur, across the tricuspid valve.
Continuous Murmurs
Continuous murmurs are heard throughout the cardiac cycle. Such murmurs result from conditions in which there is a persistent pres-sure gradient between two structures during both systole and diastole. An example is the murmur of patent ductus arteriosus, in which there is an abnormal congenital communica-tion between the aorta and the pulmonary artery (see Chapter 16). During systole, blood fl ows from the high-pressure ascending aorta through the ductus into the lower-pressure pulmonary artery. During diastole, the aortic pressure remains greater than that in the pul-monary artery and the fl ow continues across the ductus. This murmur begins in early sys-tole, crescendos to its maximum at S2, then de-crescendos until the next S1 (Fig. 2.10).
The “to-and-fro” combined murmur in a patient with both aortic stenosis and aortic re-gurgitation could be mistaken for a continuous murmur (see Fig. 2.10). During systole, there is a diamond-shaped ejection murmur, and dur-ing diastole a decrescendo murmur. However, in the case of a to-and-fro murmur, the sound does not extend through S2 because it has dis-crete systolic and diastolic components.
SUMMARY
Abnormal heart sounds and murmurs are com-mon in acquired and congenital heart disease and can be predicted by the underlying pathol-ogy. Although it may seem diffi cult to remem-ber even the basic features presented here, it
Figure 2.10. A continuous murmur peaks at, and extends through, the second heart sound (S2). A to-and-fro murmur is not continuous; rather, there is a systolic component and a distinct diastolic component, separated by S2. S1, fi rst heart sound.
S1 S1S2
S1 S1S2
To-and-fro
Continuous
• Aortic stenosis and regurgitation• Pulmonic stenosis and regurgitation
• Patent ductus arteriosus
77237_ch02.indd 4177237_ch02.indd 41 8/11/10 8:08:40 AM8/11/10 8:08:40 AM

Chapter 2
42
Table 2.2. Common Heart Sounds
Sound Location Pitch Signifi cance
S1 Apex High Normal closure of mitral and tricuspid valves
S2 Base High Normal closure of aortic (A2) and pulmonic (P2) valves
Extra systolic soundsEjection clicks Aortic: apex and base
Pulmonic: base
High
High
Aortic or pulmonic stenosis, or dilatation of aortic root or pulmonary artery
Mid-to-late click Mitral: apex
Tricuspid: LLSB
High
High
Mitral or tricuspid valve prolapse
Extra diastolic soundsOpening snap Apex High Mitral stenosis
S3 Left-sided: apex Low Normal in children Abnormal in adults: indicates heart failure or volume overload state
S4 Left-sided: apex Low Reduced ventricular compliance
LLSB, lower-left sternal border.
Table 2.3. Common Murmurs
Murmur Type Example Location and Radiation
Systolic ejection Aortic stenosis
Pulmonic stenosis
2nd right intercostal space → neck (but may radiate widely)2nd–3rd left intercostal spaces
Pansystolic Mitral regurgitationTricuspid regurgitation
Apex → axillaLeft lower sternal border → right lower sternal border
Late systolic Mitral valve prolapse Apex → axilla
Early diastolic Aortic regurgitationPulmonic regurgitation
Along left side of sternumUpper left side of sternum
Mid-to-late diastolic Mitral stenosis Apex
S1 S2
S1 S2
S2 S2
S1S2
S1S2
77237_ch02.indd 4277237_ch02.indd 42 8/11/10 8:08:40 AM8/11/10 8:08:40 AM

The Cardiac Cycle: Mechanisms of Heart Sounds and Murmurs
43
will become easier as you learn more about the pathophysiology of these conditions and as your experience in physical diagnosis grows. For now, just remember that the information is here, and refer to it as needed. Tables 2.2 and 2.3 and Figure 2.11 summarize features of the heart sounds and murmurs described in this chapter.
Acknowledgments
Contributors to the previous editions of this chap-ter were Nicole Martin, MD; Oscar Benavidez, MD; Bradley S. Marino, MD; Allan Goldblatt, MD; and Leonard S. Lilly, MD.
Additional Reading
Bickley LS. Bates’ Guide to Physical Examination and History Taking. 10th ed. Philadelphia, PA: Lippincott Williams & Wilkins; 2008.
Constant J. Essentials of Bedside Cardiology. 2nd ed. Totowa, NJ: Humana Press; 2003.
LeBlond RF, DeGowin RL, Brown DD. DeGowin’s Diagnostic Examination. 9th ed. New York, NY: McGraw-Hill; 2008.
Orient JM, Sapira JD. Sapira’s Art and Science of Bedside Diagnosis. 3rd ed. Philadelphia, PA: Lip-pincott Williams & Wilkins; 2005.
Simel DL, Rennie D. The Rational Clinical Examination: Evidence-Based Clinical Diagnosis. New York, NY: McGraw-Hill; 2009.
Figure 2.11. Locations of maximum intensity of common murmurs.
Ejection-type murmur• Pulmonic stenosis• Flow murmur
Pansystolic murmur• Mitral regurgitation
Pansystolic murmur• Tricuspid regurgitation• Ventricular septal defect
Mid-to-late diastolicmurmur• Tricuspid stenosis• Atrial septal defect
Ejection-type murmur• Aortic stenosis• Flow murmur
Mid-to-late diastolic murmur• Mitral stenosis
Pulmonic area
Mitral area
Tricuspid area
Aortic area
Left sternal borderEarly diastolic murmur• Aortic regurgitation• Pulmonic regurgitation
77237_ch02.indd 4377237_ch02.indd 43 8/11/10 8:08:40 AM8/11/10 8:08:40 AM
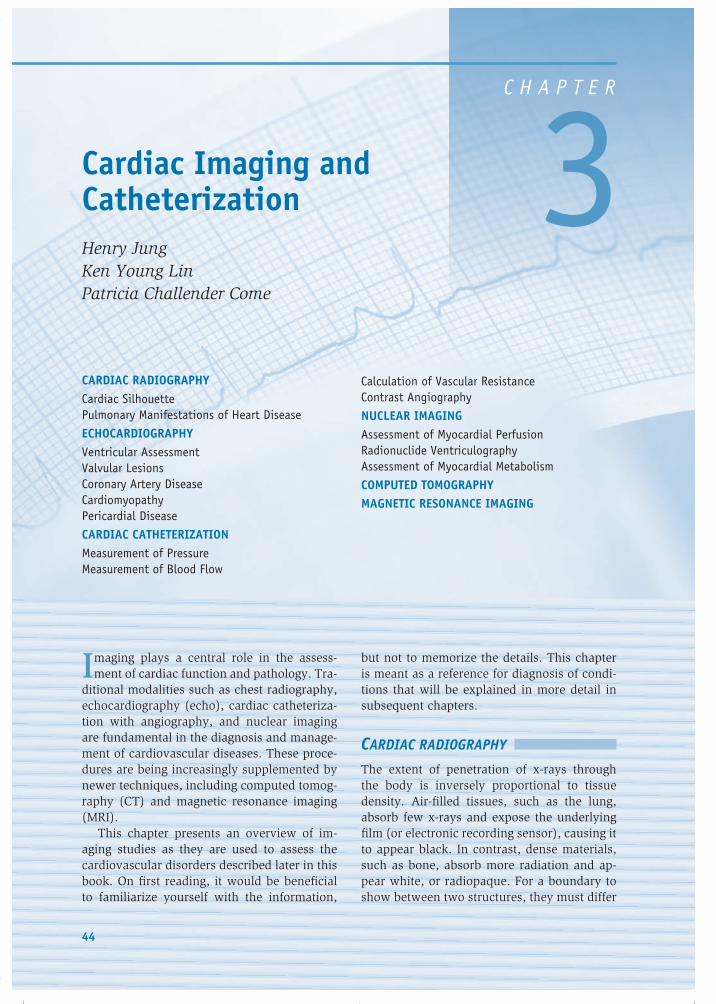
44
C H A P T E R
3Cardiac Imaging and CatheterizationHenry JungKen Young LinPatricia Challender Come
CARDIAC RADIOGRAPHYCardiac SilhouettePulmonary Manifestations of Heart Disease
ECHOCARDIOGRAPHYVentricular AssessmentValvular LesionsCoronary Artery DiseaseCardiomyopathyPericardial Disease
CARDIAC CATHETERIZATIONMeasurement of PressureMeasurement of Blood Flow
Imaging plays a central role in the assess-ment of cardiac function and pathology. Tra-
ditional modalities such as chest radiography, echocardiography (echo), cardiac catheteriza-tion with angiography, and nuclear imaging are fundamental in the diagnosis and manage-ment of cardiovascular diseases. These proce-dures are being increasingly supplemented by newer techniques, including computed tomog-raphy (CT) and magnetic resonance imaging (MRI).
This chapter presents an overview of im-aging studies as they are used to assess the cardiovascular disorders described later in this book. On fi rst reading, it would be benefi cial to familiarize yourself with the information,
Calculation of Vascular ResistanceContrast Angiography
NUCLEAR IMAGINGAssessment of Myocardial PerfusionRadionuclide VentriculographyAssessment of Myocardial Metabolism
COMPUTED TOMOGRAPHYMAGNETIC RESONANCE IMAGING
but not to memorize the details. This chapter is meant as a reference for diagnosis of condi-tions that will be explained in more detail in subsequent chapters.
CARDIAC RADIOGRAPHY
The extent of penetration of x-rays through the body is inversely proportional to tissue density. Air-fi lled tissues, such as the lung, absorb few x-rays and expose the underlying fi lm (or electronic recording sensor), causing it to appear black. In contrast, dense materials, such as bone, absorb more radiation and ap-pear white, or radiopaque. For a boundary to show between two structures, they must differ
77237_ch03.indd 4477237_ch03.indd 44 8/11/10 8:09:13 AM8/11/10 8:09:13 AM
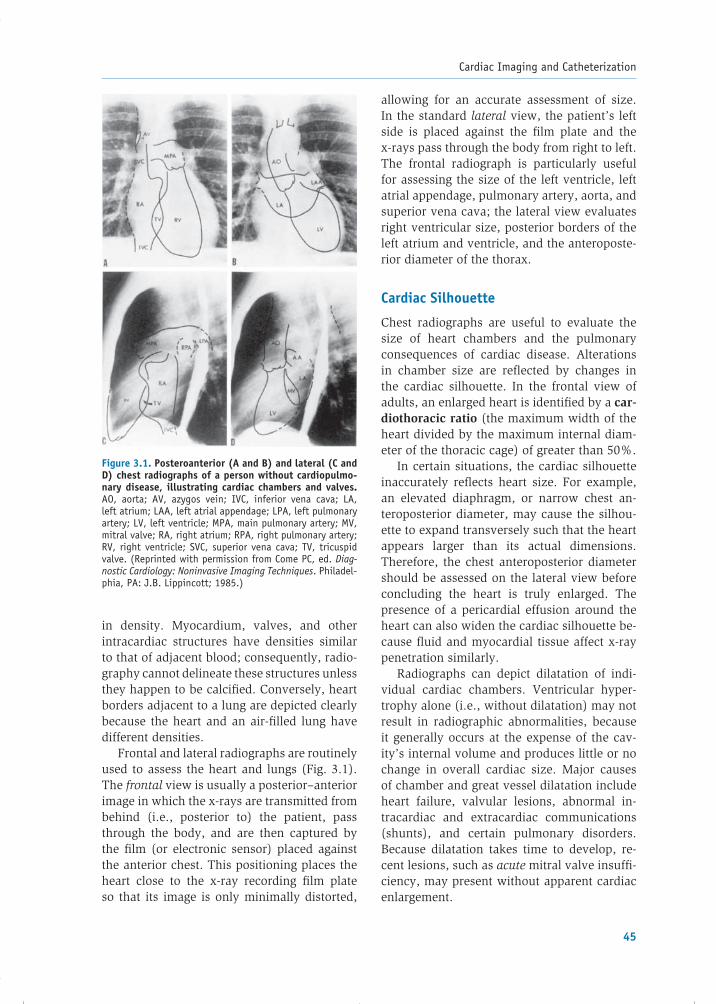
Cardiac Imaging and Catheterization
45
in density. Myocardium, valves, and other in tracardiac structures have densities similar to that of adjacent blood; consequently, radio-graphy cannot delineate these structures unless they happen to be calcifi ed. Conversely, heart borders adjacent to a lung are depicted clearly because the heart and an air-fi lled lung have different densities.
Frontal and lateral radiographs are routinely used to assess the heart and lungs (Fig. 3.1). The frontal view is usually a posterior–anterior image in which the x-rays are transmitted from behind (i.e., posterior to) the patient, pass through the body, and are then captured by the fi lm (or electronic sensor) placed against the anterior chest. This positioning places the heart close to the x-ray recording fi lm plate so that its image is only minimally distorted,
allowing for an accurate assessment of size. In the standard lateral view, the patient’s left side is placed against the fi lm plate and the x-rays pass through the body from right to left. The frontal radiograph is particularly useful for assessing the size of the left ventricle, left atrial appendage, pulmonary artery, aorta, and superior vena cava; the lateral view evaluates right ventricular size, posterior borders of the left atrium and ventricle, and the anteroposte-rior diameter of the thorax.
Cardiac Silhouette
Chest radiographs are useful to evaluate the size of heart chambers and the pulmonary consequences of cardiac disease. Alterations in chamber size are refl ected by changes in the cardiac silhouette. In the frontal view of adults, an enlarged heart is identifi ed by a car-diothoracic ratio (the maximum width of the heart divided by the maximum internal diam-eter of the thoracic cage) of greater than 50%.
In certain situations, the cardiac silhouette inaccurately refl ects heart size. For example, an elevated diaphragm, or narrow chest an-teroposterior diameter, may cause the silhou-ette to expand transversely such that the heart appears larger than its actual dimensions. Therefore, the chest anteroposterior diameter should be assessed on the lateral view before concluding the heart is truly enlarged. The presence of a pericardial effusion around the heart can also widen the cardiac silhouette be-cause fl uid and myocardial tissue affect x-ray penetration similarly.
Radiographs can depict dilatation of indi-vidual cardiac chambers. Ventricular hyper-trophy alone (i.e., without dilatation) may not result in radiographic abnormalities, because it generally occurs at the expense of the cav-ity’s internal volume and produces little or no change in overall cardiac size. Major causes of chamber and great vessel dilatation include heart failure, valvular lesions, abnormal in-tracardiac and extracardiac communications (shunts), and certain pulmonary disorders. Because dilatation takes time to develop, re-cent lesions, such as acute mitral valve insuffi -ciency, may present without apparent cardiac enlargement.
Figure 3.1. Posteroanterior (A and B) and lateral (C and D) chest radiographs of a person without cardiopulmo-nary disease, illustrating cardiac chambers and valves. AO, aorta; AV, azygos vein; IVC, inferior vena cava; LA, left atrium; LAA, left atrial appendage; LPA, left pulmonary artery; LV, left ventricle; MPA, main pulmonary artery; MV, mitral valve; RA, right atrium; RPA, right pulmonary artery; RV, right ventricle; SVC, superior vena cava; TV, tricuspid valve. (Reprinted with permission from Come PC, ed. Diag-nostic Cardiology: Noninvasive Imaging Techniques. Philadel-phia, PA: J.B. Lippincott; 1985.)
77237_ch03.indd 4577237_ch03.indd 45 8/11/10 8:09:14 AM8/11/10 8:09:14 AM

Chapter 3
46
The pattern of chamber enlargement may suggest specifi c disease entities. For exam-ple, dilatation of the left atrium and right ventricle, accompanied by signs of pulmo-nary hypertension, suggests mitral steno-sis (Fig. 3.2). In contrast, dilatation of the pulmonary artery and right heart chambers, but without enlargement of the left-sided heart dimensions, suggests pulmonary vas-cular obstruction or increased pulmonary ar-tery blood fl ow (e.g., due to an atrial septal defect; Fig. 3.3).
Chest radiographs can also detect dilata-tion of the aorta and pulmonary artery. Causes of aortic enlargement include aneurysm, dis-section, and aortic valve disease (Fig. 3.4). Normal aging and atherosclerosis may also cause the aorta to become dilated and tortu-ous. The pulmonary artery may be enlarged in patients with left-to-right shunts, which
cause increased pulmonary blood fl ow, and in those with pulmonary hypertension of diverse causes (see Fig. 3.3). Isolated enlargement of the proximal left pulmonary artery is seen in some patients with pulmonic stenosis.
Pulmonary Manifestations of Heart Disease
The appearance of the pulmonary vasculature refl ects abnormalities of pulmonary arterial and venous pressures and pulmonary blood fl ow. Increased pulmonary venous pressure, as occurs in left-heart failure, causes increased vascular markings, redistribution of blood fl ow from the bases to the apices of the lungs (termed cephalization of vessels), pulmonary edema, and pleural effusions (Fig. 3.5). Blood fl ow redistribution appears as an increase in the number or width of vascular markings at the
Figure 3.2. Posteroanterior chest radiograph of a patient with severe mitral stenosis and secondary pulmonary vascular congestion. The radio-graph shows a prominent left atrial appendage (arrowheads) with consequent straightening of the left-heart border and suggestion of a double-density right cardiac border (arrows) produced by the enlarged left atrium. The aortic silhou-ette is small, which suggests chronic low cardiac output. Radiographic signs of pulmonary vascular congestion include increased caliber of upper-zone pulmo-nary vessel markings and decreased caliber of lower-zone vessels.
77237_ch03.indd 4677237_ch03.indd 46 8/11/10 8:09:14 AM8/11/10 8:09:14 AM
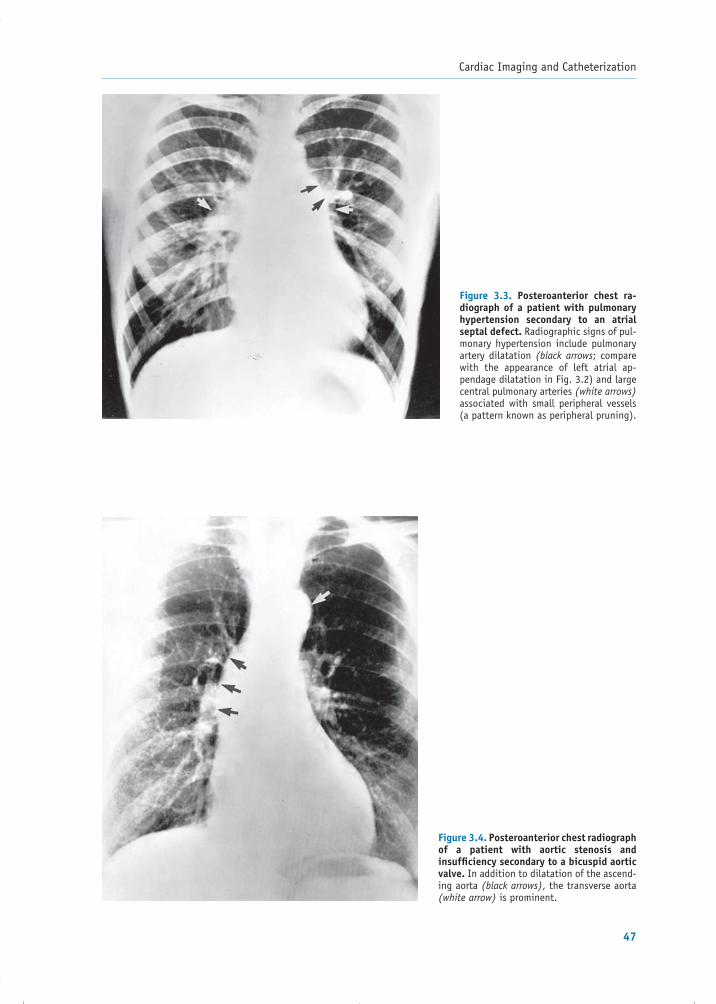
Cardiac Imaging and Catheterization
47
Figure 3.3. Posteroanterior chest ra-diograph of a patient with pulmonary hypertension secondary to an atrial septal defect. Radiographic signs of pul-monary hypertension include pulmonary artery dilatation (black arrows; compare with the appearance of left atrial ap-pendage dilatation in Fig. 3.2) and large central pulmonary arteries (white arrows) associated with small peripheral vessels (a pattern known as peripheral pruning).
Figure 3.4. Posteroanterior chest radiograph of a patient with aortic stenosis and insuffi ciency secondary to a bicuspid aortic valve. In addition to dilatation of the ascend-ing aorta (black arrows), the transverse aorta (white arrow) is prominent.
77237_ch03.indd 4777237_ch03.indd 47 8/11/10 8:09:14 AM8/11/10 8:09:14 AM

Chapter 3
48
Figure 3.5. Radiographs of patients with congestive heart failure. These are anteroposterior views (which may exag-gerate the size of the heart because it is further from the x-ray fi lm), taken with portable x-ray machines at the bedside. A. Mild congestive heart failure. Pulmo-nary congestion is indicated by vascular redistribution from the bases to the api-ces of the lungs. The white spots labeled “L” are electrocardiographic leads on the patient’s chest. B: Severe congestive heart failure. Increased pulmonary vas-cular markings are present throughout the lung fi elds, along with peribronchio-lar cuffi ng (black arrow) and pleural ef-fusion, which is indicated by blunting of the costodiaphragmatic angle and track-ing up the right lateral hemithorax (black arrowheads). The presence of interstitial and alveolar edema produces perihilar haziness and air bronchograms (open ar-rows), which occur when the radiolucent bronchial tree is contrasted with opaque edematous lung tissue.
A
B
77237_ch03.indd 4877237_ch03.indd 48 8/11/10 8:09:15 AM8/11/10 8:09:15 AM

Cardiac Imaging and Catheterization
49
apex. Interstitial and alveolar forms of pulmo-nary edema produce opacity radiating from the hilar region bilaterally (known as a “butterfl y” pattern) and air bronchograms, respectively (Fig. 3.5B). Kerley B lines (short horizontal parallel lines at the periphery of the lungs adja-cent to the pleura, most often at the lung bases) depict fl uid in interlobular spaces that results from interstitial edema. Pleural effusions cause blunting of the costodiaphragmatic angles.
Changes in pulmonary blood fl ow may also alter the appearance of the pulmonary vessels. For example, focal oligemia (reduction in the size of blood vessels due to decreased blood fl ow) is occasionally observed distal to a pul-monary embolism (termed the Westermark sign). The fi nding of enlarged central pul-monary arteries, but small peripheral vessels (termed peripheral pruning), suggests pulmo-nary hypertension (see Fig. 3.3).
Table 3.1 summarizes the major radio-graphic fi ndings in common forms of cardiac disease.
ECHOCARDIOGRAPHY
Echocardiography plays an essential role in the diagnosis and serial evaluation of many cardiac disorders. It is safe, noninvasive, and relatively inexpensive. High-frequency (ultrasonic) waves
generated by a piezoelectric element travel through the body and are refl ected at interfaces where there are differences in the acoustic im-pedance of adjacent tissues. The refl ected waves return to the transducer and are recorded. The machine measures the time elapsed between the initiation and reception of the sound waves, allowing it to calculate the distance between the transducer and each anatomic refl ecting sur-face. Images are then constructed from these calculations.
Three types of imaging are routinely performed during an echocardiographic examination: M-mode, two-dimensional (2D), and Doppler. Each type of imaging can be performed from various body locations. Most commonly, transthoracic studies are performed, in which images are ob-tained by placing the transducer on the surface of the chest. When greater structural detail is re-quired, transesophageal imaging is performed.
M-mode echocardiography, the oldest form of cardiac ultrasonography, provides data from only one ultrasonic beam and is now rarely used by itself. It supplements the other modali-ties to provide accurate measurements of wall thicknesses and timing of valve movements.
In 2D echocardiography, multiple ultra-sonic beams are transmitted from the trans-ducer through a wide arc. The returning signals are integrated to produce 2D images of
Table 3.1. Chest Radiography of Common Cardiac Disorders
Disorder Findings
Congestive heart failure • Vascular redistribution from bases to apices of the lungs
• Interstitial and alveolar edema• Air bronchograms• Pleural effusions
Pulmonic valve stenosis • Poststenotic dilatation of pulmonary artery
Aortic valve stenosis • Poststenotic dilatation of ascending aorta
Aortic regurgitation • Left ventricular enlargement• Dilated aorta
Mitral stenosis • Enlarged left atrium• Signs of pulmonary venous congestion
Mitral regurgitation • Left atrial dilatation• Left ventricular dilatation
77237_ch03.indd 4977237_ch03.indd 49 8/11/10 8:09:17 AM8/11/10 8:09:17 AM

Chapter 3
50
the heart on a video monitor. As a result, this technique depicts anatomic relationships and defi nes the movement of cardiac structures relative to one another. Wall and valve motion abnormalities, and many types of intracardiac masses (e.g., vegetations, thrombi, tumors), can be depicted.
Each 2D plane (Fig. 3.6) delineates only part of a given cardiac structure. Optimal evaluation of the entire heart is achieved by using combi-nations of views. In transthoracic echocardiog-raphy (TTE), in which the transducer is placed against the patient’s skin, these include the parasternal long axis, parasternal short axis, api-cal four-chamber, apical two-chamber, apical
three-chamber (also known as apical long axis), and subcostal views. The parasternal long axis view is recorded with the transducer in the third or fourth intercostal space to the left of the ster-num. This view is particularly useful for evalua-tion of the left atrium, mitral valve, left ventricle, and left ventricular outfl ow tract (LVOT), which includes the aortic valve and adjacent interven-tricular septum. To obtain parasternal short axis views, the transducer is rotated 90° from its position for the long axis view. The short axis images depict transverse planes of the heart. Several different levels are imaged to assess the aortic valve, mitral valve, and left ventricular wall motion.
Figure 3.6. Transthoracic two-dimensional echocardiographic views. A. Paraster-nal long axis view. B. Parasternal short axis view. Notice that the left ventricle appears circular in this view, while the right ventricle is crescent shaped. C. Apical four-chamber view. Ao, aorta; LA, left atrium; LV, left ventricle; RA, right atrium; RV, right ventricle. (Modifi ed from Sahn DJ, Anderson F. Two-Dimensional Anatomy of the Heart. New York, NY: John Wiley & Sons; 1982.)
RV
Tricuspidvalve
Mitralvalve
RA LA
LV
A
B
C
RV
LV
Ao
LA
LV posterior wall
Interventricular septum
Aorticvalve
Mitralvalve
LV
RV
77237_ch03.indd 5077237_ch03.indd 50 8/11/10 8:09:17 AM8/11/10 8:09:17 AM

Cardiac Imaging and Catheterization
51
Apical TTE views are produced when the transducer is placed at the point of maximal apical impulse. The apical four-chamber view evaluates the mitral and tricuspid valves as well as the atrial and ventricular chambers, including the motion of the lateral, septal, and apical left ventricular walls. The apical two-chamber view shows only the left side of the heart, and it depicts movement of the anterior, inferior, and apical walls.
In some patients, such as those with ob-structive airways disease, the parasternal and apical views do not adequately show cardiac structures because the excessive underlying air attenuates the acoustic signal. In such pa-tients, the subcostal view, in which the trans-ducer is placed inferior to the rib cage, may provide a better ultrasonic window.
Doppler imaging depicts blood fl ow direction and velocity, and identifi es regions of vascular turbulence. Additionally, it permits estimation of pressure gradients within the heart and great vessels. Doppler studies are based on the physi-cal principle that waves refl ected from a mov-ing object undergo a frequency shift according to the moving object’s velocity relative to the source of the waves. Color fl ow mapping con-verts the Doppler signals to a scale of colors that represent direction, velocity, and turbulence of blood fl ow in a semiquantitative way. The col-ors are superimposed on 2D images and show the location of stenotic and regurgitant valvular lesions and of abnormal communications within the heart and great vessels. For example, Dop-pler echocardiography in a patient with mitral regurgitation shows a jet of retrograde fl ow into the left atrium during systole (Fig. 3.7).
Sound frequency shifts are converted by the echo machine into blood fl ow velocity mea-surements by the following relationship:
v � fs � c _________ 2fO(cos �)
where v equals the blood fl ow velocity (m/sec); fs, the Doppler frequency shift (kHz); c, the velocity of sound in body tissue (m/sec); fO, the frequency of the sound pulse emitted from the transducer (MHz); and �, the angle between the transmitted sound pulse and the mean axis of blood fl ow.
Transesophageal echocardiography (TEE) uses a miniaturized transducer mounted at the end of a modifi ed endoscope to transmit and receive ultrasound waves from within the esophagus, thus producing very clear images of the neighboring cardiac structures (Fig. 3.8) and much of the thoracic aorta. Modern probes per-mit multiplanar imaging and Doppler interroga-tion. TEE is particularly helpful in the assessment of aortic and atrial abnormalities, conditions that are less well visualized by conventional trans-thoracic echo imaging. For example, TEE is more sensitive than transthoracic echo for the detec-tion of thrombus within the left atrial append-age (Fig. 3.9). The proximity of the esophagus to the heart makes TEE imaging particularly ad-vantageous in patients for whom transthoracic echo images are unsatisfactory (e.g., those with chronic obstructive lung disease).
TEE is also advantageous in the evalua-tion of patients with prosthetic heart valves. During standard transthoracic imaging, artifi -cial mechanical valves refl ect a large portion of ultrasound waves, thus interfering with
Figure 3.7. Doppler color fl ow mapping (reproduced in gray tones) of mitral regurgitation (MR). The Doppler image, recorded in systole, is superimposed on an apical view of the left ventricle (LV), left atrium (LA), and mitral valve (short arrow). The retrograde fl ow of MR into the LA is indicated by the long arrow.
77237_ch03.indd 5177237_ch03.indd 51 8/11/10 8:09:17 AM8/11/10 8:09:17 AM

Chapter 3
52
visualization of more posterior structures (termed acoustic shadowing). TEE aids visu-alization in such patients and is therefore the most sensitive noninvasive technique for eval-uating perivalvular leaks.
TEE is commonly used to evaluate patients with cerebral ischemic events (i.e., strokes) of
unexplained etiology, because it can identify cardiovascular sources of embolism with high sensitivity. These etiologies include intracar-diac thrombi or tumors, atherosclerotic debris within the aorta, and valvular vegetations. TEE is also highly sensitive and specifi c for the detection of aortic dissection.
Figure 3.8. Transesophageal echocardiographic views. LA, left atrium; LV, left ven-tricle; RA, right atrium; RV, right ventricle; N, noncoronary cusp of aortic valve; L, left coronary cusp of aortic valve; R, right coronary cusp of aortic valve.
RVRA
RA
LV
LV
LA
LA
A
A. Cross-sectional view of aortic valve
RV
RV
B
C
B. Long axis view of cardiac chambers
C. Short axis view of left venticle
Esophagus
RN L
Figure 3.9. Echocardiographic imaging of an intracardiac thrombus. A. Transesophageal echocardio-graphic image demonstrates thrombus within the left atrial appendage. (Courtesy of Scott Streckenbach, MD, Massachusetts General Hospital, Boston, MA.) B. Schematic drawing of same image. LA, left atrium; LAA, left atrial appendage.
LA
LAA
Thrombus
A B
77237_ch03.indd 5277237_ch03.indd 52 8/11/10 8:09:18 AM8/11/10 8:09:18 AM

Cardiac Imaging and Catheterization
53
of contrast will appear in the left-sided cham-bers as well. Newer perfl uorocarbon-based contrast agents have been developed with suffi ciently small particle size to intentionally pass through the pulmonary circulation. These agents are used to opacify the left ventricular cavity and, via the coronary arteries, the myo-cardium, enabling superior assessment of LV contraction and myocardial perfusion.
Echocardiographic techniques can identify valvular lesions, complications of coronary ar-tery disease (CAD), septal defects, intracardiac masses, cardiomyopathy, ventricular hyper-trophy, pericardial disease, aortic disease, and congenital heart disease. Typical evaluation includes assessment of cardiac chamber sizes, wall thicknesses, wall motion, valvular func-tion, blood fl ow, and intracardiac hemodynam-ics. A few of these topics are highlighted here.
Ventricular Assessment
Echocardiography allows measurement of ven-tricular wall thickness and mass (Fig. 3.10), and calculation of the ejection fraction, a measure of contractile function (see Chapter 9). Furthermore,
In the operating room, TEE permits imme-diate evaluation after surgical repair of cardiac lesions. In addition, imaging of ventricular wall motion can identify periods of myocardial ischemia during surgery.
The newest ultrasound imaging modality in development, and entering clinical usage, is 3D echocardiography. The spatial reconstructions afforded by this technique are of particular prom-ise in the assessment of valvular defects, intracar-diac masses, and congenital malformations.
Contrast echocardiography is sometimes used to supplement standard imaging to evalu-ate for abnormal intracardiac shunts. In this technique, often called a “bubble study,” an echocardiographic contrast agent (e.g., agitated saline) is rapidly injected into a peripheral vein. Using standard imaging, the contrast can be vi-sualized passing through the cardiac chambers. Normally, there is rapid opacifi cation of the right-sided chambers, but because the contrast is fi ltered out (harmlessly) in the lungs, it does not reach the left-sided chambers. Conversely, in the presence of an intracardiac shunt with abnormal right-to-left heart blood fl ow, or in the presence of an intrapulmonary shunt, bubbles
Figure 3.10. Left ventricular outfl ow tract (LVOT) obstruction in hypertrophic cardiomyopathy. Notice that the interventricular septum (S) is thicker and more echogenic than the posterior wall (P). A. Before ventricular contraction, the LVOT is only slightly narrowed. B. During contraction, the rapidly fl owing blood through the LVOT incites a Venturi effect and abnormally draws the mitral valve apparatus anteriorly toward the hypertrophied septum (arrow), creating a functional obstruction. LA, left atrium; LV, left ventricle.
77237_ch03.indd 5377237_ch03.indd 53 8/11/10 8:09:18 AM8/11/10 8:09:18 AM

Chapter 3
54
2D echocardiography depicts regional ventricular wall motion abnormalities, a sign of CAD, and displays right ventricular function qualitatively.
Diastolic dysfunction (e.g., caused by isch-emic disease, ventricular hypertrophy, or re-strictive cardiomyopathy; see Chapter 9) can be evaluated by Doppler techniques. For ex-ample, Doppler tissue imaging is a modality that can readily record the maximum veloc-ity of mitral annular movement in early dias-tole, an indicator of the left ventricle’s ability to relax normally. Doppler measurement of fl ow velocity across the mitral valve in early, compared with late, diastole also provides information about diastolic function.
Valvular Lesions
Echocardiography can determine underlying causes of valvular abnormalities, and Dop-pler imaging quantitates the degree of valvular stenosis and regurgitation. The pressure gradi-ent across a stenotic valve can be calculated from the maximum blood fl ow velocity (v) measured distal to the valve, using the simpli-fi ed Bernoulli equation:
Pressure gradient � 4 � v2
As an example, if the peak velocity recorded distal to a stenotic aortic valve is 5 m/sec, then the calculated peak pressure gradient across the valve � 4 � 52 � 100 mm Hg.
Other calculations permit noninvasive determination of the cross-sectional area of stenotic valves. The continuity equation is often used to calculate aortic valve area. This equation assumes that blood fl ow (F, expressed in cc/sec) is the same at the aortic valve orifi ce (AV) as at a neighboring position along the fl ow stream (e.g., in the LVOT):
FLVOT � FAV
As shown in Figure 3.11, blood fl ow at any position along a fl ow stream can also be ex-pressed as the product of the Doppler velocity (V, in cm/sec) and cross-sectional area (A, in cm2) at that level. If location 1 in Figure 3.11 represents a position in the LVOT and location 2 represents the aortic valve, then
ALVOT � VLVOT � AAV � VAV
The cross-sectional area of the LVOT (ALVOT) is calculated simply as �(d/2)2, where d represents the LVOT diameter, measured from the paraster-nal long axis view. The velocities (VLVOT and VAV) are measured by Doppler interrogation, from the apical four-chamber view. The equation can then be solved for the aortic valve area (AAV):
AAV � ALVOT � VLVOT ____________ VAV
Color Doppler analysis provides a qualita-tive assessment of the severity of regurgitant valve lesions. In mitral regurgitation (see Fig. 3.7), for example, the ratio of the regur-gitant jet color Doppler area to the entire left atrial area has traditionally been used to clas-sify the regurgitation as mild, moderate, or severe. More quantitative evaluation of mitral regurgitation can now be performed by what is known as the proximal isovelocity surface area (PISA) method. This technique uses advanced color Doppler techniques to calculate the regur-gitant volume and effective regurgitant orifi ce area, two values that predict clinical outcomes in patients with chronic mitral regurgitation.
Coronary Artery Disease
Echocardiography demonstrates ventricular wall motion abnormalities associated with in-farcted or ischemic myocardium. The location and degree of abnormal systolic contraction and decreased systolic wall thickening indicate
Figure 3.11. The continuity equation. Within a closed fl ow stream, the volume rate of fl ow at any point (calcu-lated as the cross-sectional area at that site multiplied by the maximum fl ow velocity at the same location) is equal to the volume rate of fl ow at sequential points. Thus, cross-sectional area and velocity at any location are inversely proportional to one another. Here, location 2 is narrower than location 1. Therefore, the velocity at location 2 must be greater for the same volume to pass per unit time.
1 2
A1
A1 x V1 = A2 x V2
A2
V1 V2
77237_ch03.indd 5477237_ch03.indd 54 8/11/10 8:09:18 AM8/11/10 8:09:18 AM

Cardiac Imaging and Catheterization
55
the extent of an infarction and implicate the responsible coronary artery. Echocardiography also detects complications of infarction includ-ing thrombus formation, papillary muscle rup-ture, ventricular septal rupture, and aneurysm.
Although echocardiography can depict those consequences of CAD, transthoracic echo resolution in adults is insuffi cient to satisfactorily image the coronary arteries themselves. However, stress echocardio-graphy is a technique that aids in the di-agnosis of CAD. This technique produces transient left ventricular regional wall mo-tion abnormalities after exercise or with the infusion of specifi c pharmacologic agents (e.g., dobutamine), as a sign of inducible myocardial ischemia (see Chapter 6).
Cardiomyopathy
Cardiomyopathies are heart muscle disorders that occur in three forms: dilated, hypertrophic,
and restrictive (see Chapter 10). Echocardiog-raphy can distinguish these and permits assess-ment of the severity of systolic and diastolic dysfunction. For example, Figure 3.10 depicts the asymmetrically thickened ventricular walls of hypertrophic cardiomyopathy.
Pericardial Disease
2D echocardiography can identify abnormali-ties in the pericardial cavity (e.g., excessive pericardial fl uid and tumor). Tamponade and constrictive pericarditis, the main con-sequences of pericardial disease (see Chapter 14), are associated with particular echocardio-graphic abnormalities. In tamponade, the in-creased intrapericardial pressure compresses the cardiac chambers and results in diastolic “collapse” of the right atrium and right ven-tricle (Fig. 3.12). Constrictive pericarditis is associated with increased thickness of the
Figure 3.12. Echocardiogram of a patient with a pericardial effusion causing cardiac tamponade. A. Parasternal long axis image showing a large pericardial effusion (PE) surrounding the heart. This frame was obtained in systole and shows normal appearance of the left (LV) and right (RV) ventricles during that phase. B. Same image as A, but this frame was obtained in early diastole and shows collapse of the RV free wall (arrow) due to compression by the effusion. C. Subcostal view, obtained in systole, demonstrating the PE surrounding the right atrium (RA), RV, left atrium (LA), and LV. D. Same image as C, obtained during diastole, showing inward collapse of the RA (arrow).
A B
DC
77237_ch03.indd 5577237_ch03.indd 55 8/11/10 8:09:19 AM8/11/10 8:09:19 AM

Chapter 3
56
pericardial echo, abnormal patterns of dia-stolic left ventricular wall motion, alterations in pulmonary and hepatic venous fl ow pat-terns, and exaggerated changes in mitraland tricuspid valve infl ow velocities during respiration.
Table 3.2 summarizes the echocardio-graphic features of common cardiac diseases.
CARDIAC CATHETERIZATION
To diagnose many cardiovascular abnormali-ties, intravascular catheters are inserted to measure pressures in the heart chambers, to determine cardiac output and vascular resis-tances, and to inject radiopaque material to examine heart structures and blood fl ow. In
Table 3.2. Echocardiography in Common Cardiac Disorders
Disorder Findings
Valvular lesionsMitral stenosis • Enlarged left atrium
• Thickened mitral valve leafl ets• Decreased movement and separation of mitral valve
leafl ets• Decreased mitral valve orifi ce
Mitral regurgitation • Enlarged left atrium (if chronic)• Enlarged left ventricle (if chronic)• Systolic fl ow from left ventricle into left atrium by
Doppler
Aortic stenosis • Thickened aortic valve cusps• Decreased valve orifi ce• Increased left ventricular wall thickness
Aortic regurgitation • Enlarged left ventricle• Abnormalities of aortic valve or aortic root
Left ventricular functionMyocardial infarction and complications • Abnormal regional ventricular wall motion
• Thrombus within left ventricle• Aneurysm of ventricular wall• Septal rupture (abnormal Doppler fl ow)• Papillary muscle rupture
Cardiomyopathies Dilated • Enlarged ventricular chamber sizes
• Decreased systolic contraction
Hypertrophic • Normal or decreased ventricular chamber sizes• Increased ventricular wall thickness• Diastolic dysfunction (assessed by Doppler)
Restrictive • Normal or decreased ventricular chamber sizes• Increased ventricular wall thickness• Ventricular contractile function often normal• Diastolic dysfunction (assessed by Doppler)• Enlarged atria
77237_ch03.indd 5677237_ch03.indd 56 8/11/10 8:09:19 AM8/11/10 8:09:19 AM
Cardiac Imaging and Catheterization
57
in the blood vessel, the catheter is guided by fl uoroscopy (continuous x-ray images) to the area of study, where pressure measurements are made. Figure 3.13 depicts normal intracar-diac and intravascular pressures.
The measurement of right-heart pressures is performed with a specialized balloon-tipped catheter (a common version of which is known as the Swan–Ganz catheter) that is advanced through the right side of the heart with the aid of normal blood fl ow, and into the pulmonary artery. As it travels through the right side of the heart, recorded pressure measurements iden-tify the catheter tip’s position (see Box 3.1).
Right Atrial Pressure
Right atrial pressure is equal to the central ve-nous pressure (estimated by the jugular venous pressure on physical examination) because no obstructing valves impede blood return from the veins into the right atrium. Similarly, right
1929, Werner Forssmann performed the fi rst cardiac catheterization, on himself, thus usher-ing in the era of invasive cardiology. Much of what is known about the pathophysiology of valvular heart disease and congestive heart fail-ure comes from decades of subsequent hemo-dynamic research in the cardiac catheteriza -tion laboratory.
Measurement of Pressure
Before catheterization of an artery or vein, the patient is mildly sedated, and a local anesthetic is used to numb the skin site of catheter entry. The catheter, attached to a pressure transducer outside the body, is then introduced into the appropriate blood vessel. To measure pressures in the right atrium, right ventricle, and pulmo-nary artery, a catheter is inserted into a femoral, brachial, or jugular vein. Pressures in the aorta and left ventricle are measured via catheters inserted into a brachial or femoral artery. Once
Figure 3.13. Diagrams indicating normal pressures in the cardiac chambers and great vessels. The top fi gure shows the normal anatomic relationship of the cardiac chambers and great vessels, whereas the fi gure on the bottom shows a simplifi ed sche-matic to clarify the pressure relationships. Numbers indicate pressures in mm Hg. LA, left atrial mean pressure; LV, left ventricular pressure; PA, pulmonary artery pressure; PCW, pulmonary capillary wedge mean pressure; RA, right atrial mean pressure; RV, right ventricular pressure.
RA
2–8
RV15–30
PA15–30
2–8 4–12
Lungs
PCW2–10
Aorta
LA
2–10
LV100–140
3–12 60–90
Aorta
PCW
RA
RV
LV
LAPA
100–140
2–10
2–10
2–8
15–302–8
100–1403–12
100–14060–90
15–304–12
77237_ch03.indd 5777237_ch03.indd 57 8/11/10 8:09:19 AM8/11/10 8:09:19 AM

Chapter 3
58
atrial pressure normally equals right ven-tricular pressure during diastole because the right heart functions as a “common chamber” when the tricuspid valve is open. The mean right atrial pressure is reduced when there is intravascular volume depletion. It is elevated in right ventricular failure, right-sided valvu-lar disease, and cardiac tamponade (in which
the cardiac chambers are surrounded by high-pressure pericardial fl uid; see Chapter 14).
Certain abnormalities cause characteristic changes in individual components of the right atrial (and therefore jugular venous) pressure (Table 3.3). For example, a prominent a wave is seen in tricuspid stenosis and right ven-tricular hypertrophy. In these conditions, the
Intracardiac Pressure TracingsBOX 3.1
When a catheter is inserted into a systemic vein and advanced into the right side of the heart, each cardiac chamber produces a characteristic pressure curve. It is important to distinguish these record-ings from one another to localize the position of the catheter tip and to derive appropriate physiologic information.
The normal right atrial (RA) pressure demonstrates three positive defl ections (see the fi gure in Box 2.1 for an enlarged view): the a wave refl ects RA contraction at the end of diastole, the c wave results from bulging of the tricuspid valve toward the right atrium as it closes in early systole, and the v wave represents passive fi lling of the right atrium from the systemic veins during systole, when the tricuspid valve is closed. The downward defl ection that follows the c wave is known as the x descent, and the downward defl ection after the v wave is called the y descent. Often the a and c waves merge so that only two major positive defl ections are seen. In patients with atrial fi brillation, the a wave is absent because there is no organized left atrial contraction. As the catheter is advanced into the right ventricle (RV), a dramatic increase in systolic pressure is seen. The RV systolic waveform is characterized by a rapid upstroke and downstroke. In diastole, there is a gradual continuous increase in RV pressure as the chamber fi lls with blood. As the catheter is moved forward into the pulmonary artery (PA), the systolic pressure remains the same as that in the RV (as long as there is no obstruction to RV outfl ow, such as pulmonic valve steno-sis). However, three characteristics of the recording indicate entry into the pulmonary artery: (1) the PA diastolic pressure is higher than that of the RV; (2) the descending systolic portion of the PA tracing inscribes a dicrotic wave, a small transient pressure increase that occurs after the systolic peak and is related to pulmonic valve closure; and (3) the diastolic portion of the PA tracing is downsloping com-pared with the upsloping RV diastolic pressure. Further advancement of the catheter into a branch of the pulmonary artery results in the pulmonary capillary wedge (PCW) tracing, which refl ects the left atrial pressure (see Fig. 3.14). Its characteristic shape is similar to the RA tracing, but the pressure values are usually higher and the tracing is often less clear (with the c wave not observed) because of damped transmission through the capillary vessels.
ECG
20
10
a cx
v
a v
yPre
ssur
e (m
m H
g)
Right ventricle
Right atrium
Pulmonary artery
Time
Pulmonary capillary wedge
77237_ch03.indd 5877237_ch03.indd 58 8/11/10 8:09:19 AM8/11/10 8:09:19 AM

Cardiac Imaging and Catheterization
59
right atrium contracts vigorously against the obstructing tricuspid valve or stiffened right ventricle, respectively, generating a promi-nent pressure wave. Similarly, amplifi ed “can-non” a waves may be produced by conditions of atrioventricular dissociation (see Chapter 12), when the right atrium contracts against a closed tricuspid valve. A prominent v wave is observed in tricuspid regurgitation because normal right atrial fi lling is augmented by the regurgitated blood in systole.
Right Ventricular Pressure
Right ventricular systolic pressure is increased by pulmonic valve stenosis or pulmonary
hyper tension. Right ventricular diastolic pres-sure increases when the right ventricle is sub-jected to pressure or volume overload and may be a sign of right-heart failure.
Pulmonary Artery Pressure
Elevation of systolic and diastolic pulmonary artery pressures occurs in three conditions: (1) left-sided heart failure; (2) parenchymal lung disease (e.g., chronic bronchitis or end-stage emphysema); and (3) pulmonary vascu-lar disease (e.g., pulmonary embolism, primary pulmonary hypertension, or acute respiratory distress syndrome). Normally, the pulmonary artery diastolic pressure is equivalent to the left
Table 3.3. Causes of Increased Intracardiac Pressures
Chamber and Measurement Causes
Right atrial pressure • Right ventricular failure• Cardiac tamponade
a wave • Tricuspid stenosis• Right ventricular hypertrophy• Atrioventricular dissociation
v wave • Tricuspid regurgitation
Right ventricular pressure Systolic • Pulmonic stenosis
• Right ventricular failure• Pulmonary hypertension
Diastolic • Right ventricular failure• Cardiac tamponade• Right ventricular hypertrophy
Pulmonary artery pressure Systolic and diastolic • Pulmonary hypertension
• Left-sided heart failure• Chronic lung disease• Pulmonary vascular disease
Systolic only • Increased fl ow (left-to-right shunt)
Pulmonary artery wedge pressure • Left-sided heart failure• Mitral stenosis or regurgitation• Cardiac tamponade
a wave • Left ventricular hypertrophy
v wave • Mitral regurgitation• Ventricular septal defect
77237_ch03.indd 5977237_ch03.indd 59 8/11/10 8:09:19 AM8/11/10 8:09:19 AM

Chapter 3
60
Figure 3.14. Diagram of a pulmonary artery catheter inserted into a branch of the pulmo-nary artery (PA). Flow is occluded in the arterial, arteriolar, and capillary vessels beyond the catheter; thus, these vessels act as a conduit that transmits the left atrial (LA) pressure to thecatheter tip.
LAPA
A pulmonaryvein
Pulmonarycapillaries
Catheter tipoccludes branchof pulmonary artery
Pulmonaryartery catheter
Shaded area represents“column of blood” betweencatheter tip and LA
atrial pressure because of the low resistance of the pulmonary vasculature that separates them. If the left atrial pressure rises because of left-sided heart failure, both systolic and diastolic pulmonary artery pressures increase in an obligatory manner to maintain forward fl ow through the lungs. This situation leads to “passive” pulmonary hypertension.
In certain conditions, however, pulmonary vascular resistance becomes abnormally high, causing pulmonary artery diastolic pressure to be elevated compared with left atrial pressure. For example, pulmonary vascular obstructive dis-ease may develop as a complication of a chronic left-to-right cardiac shunt, such as an atrial or ventricular septal defect (see Chapter 16).
Pulmonary Artery Wedge Pressure
If a catheter is advanced into the right or left pulmonary artery, its tip will ultimately reach one of the small pulmonary artery branches and temporarily occlude forward blood fl ow beyond it. During that time, a column of stag-nant blood stands between the catheter tip and the portions of the pulmonary capillary and pulmonary venous segments distal to it (Fig. 3.14). That column of blood acts as an extension of the catheter, and the pressure recorded through the catheter refl ects that of the downstream chamber—namely, the left atrium. Such a pressure measurement is termed the pulmonary artery wedge pressure or pulmonary capillary wedge pressure (PCW)
and closely matches the left atrial pressure in most individuals. Furthermore, while the mi-tral valve is open during diastole, the pulmo-nary venous bed, left atrium, and left ventricle normally share the same pressures. Thus, the PCW can be used to estimate the left ventricu-lar diastolic pressure, a measurement of ven-tricular preload (see Chapter 9). As a result, measurement of PCW may be useful in man-aging certain critically ill patients in the inten-sive care unit.
Elevation of the mean PCW is seen in left-sided heart failure and in mitral stenosis or regurgitation. The individual components of the PCW tracing can also become abnormally high. The a wave may be increased in condi-tions of decreased left ventricular compliance, such as left ventricular hypertrophy or acute myocardial ischemia. The v wave is greater than normal when there is increased left atrial fi lling during ventricular contraction, as in mi-tral regurgitation.
Measurement of Blood Flow
Cardiac output is measured by either the ther-modilution method or the Fick technique. In the thermodilution method, saline of a known temperature is injected rapidly through a cath-eter side port into the right side of the heart, at a specifi c distance from the distal tip of the catheter. The catheter tip, positioned in the pulmonary artery, contains a thermistor that registers the change in temperature induced
77237_ch03.indd 6077237_ch03.indd 60 8/11/10 8:09:19 AM8/11/10 8:09:19 AM

Cardiac Imaging and Catheterization
61
Because the normal range of cardiac out-put varies with a patient’s size, it is common to report the cardiac index, which is equal to the cardiac output divided by the patient’s body surface area (normal range of cardiac index � 2.6–4.2 L/min/m2).
Calculation of Vascular Resistance
Once pressures and cardiac output have been determined, pulmonary and systemic vascu-lar resistances can be calculated, based on the principle that the pressure difference across a vascular bed is proportional to the product of fl ow and resistance. The calcula-tions are:
PVR � MPAP � LAP ____________ CO � 80
PVR, pulmonary vascular resistance (dynes-sec-cm–5)
MPAP, mean pulmonary artery pressure (mm Hg)
LAP, mean left atrial pressure (mm Hg)
CO, cardiac output (L/min)
SVR � MAP � RAP ____________ CO � 80
SVR, systemic vascular resistance (dynes-sec-cm–5)
MAP, mean arterial pressure (mm Hg)
RAP, mean right atrial pressure (mm Hg)
CO, cardiac output (L/min)
The normal PVR ranges from 20 to 130 dynes-sec-cm–5. The normal SVR is 700 to 1,600 dynes-sec-cm–5.
Contrast Angiography
This technique uses radiopaque contrast to vi-sualize regions of the cardiovascular system. A catheter is introduced into an appropriate vessel and guided under fl uoroscopy to the site of injection. Following administration of the contrast agent, x-rays are transmitted through the area of interest. A continuous se-ries of x-ray exposures is recorded to produce a motion picture cineangiogram (often simply called a “cine,” or “angiogram”).
by the injected saline. The cardiac output is proportional to the rate of the temperature change and is automatically calculated by the equipment.
The Fick method relies on the principle that the quantity of oxygen consumed by tissues is related to the amount of O2 content removed from blood as it fl ows through the tissue capil-lary bed:
O2 consumption � O2 content removed � Flow
( mL O2 _____ min ) ( mL O2
_______ mL blood ) ( mL blood _______ min )
Or, in more applicable terms:
O2 consumption � AVO2 difference � Cardiac output
where the arteriovenous O2 (AVO2) differ-ence equals the difference in oxygen content between the arterial and venous compart-ments. Total body oxygen consumption can be determined by analyzing expired air from the lungs, and arterial and venous O2 content is measured in blood samples. By rearranging the terms, the cardiac output can be calculated:
Cardiac output � O2 consumption
_______________ AVO2 difference
For example, if the arterial blood in a normal adult contains 190 mL of O2 per liter and the venous blood contains 150 mL of O2 per liter, the arteriovenous difference is 40 mL of O2 per liter. If this patient has a measured O2 con-sumption of 200 mL/min, the calculated car-diac output is 5 L/min.
In many forms of heart disease, the cardiac output is lower than normal. In that situation, the total body oxygen consumption does not change signifi cantly; however, a greater per-centage of O2 is extracted per volume of cir-culating blood by the metabolizing tissues. The result is a lower-than-normal venous O2 content and therefore an increased AVO2 dif-ference. In our example, if the patient’s venous blood O2 content fell to 100 mL/L, the AVO2 difference would increase to 90 mL/L and the calculated cardiac output would be reduced to 2.2 L/min.
77237_ch03.indd 6177237_ch03.indd 61 8/11/10 8:09:20 AM8/11/10 8:09:20 AM

Chapter 3
62
and conduction blocks, damage to vessel walls, hemorrhage, dislodgement of atherosclerotic plaques, pericardial tamponade (see Chapter 14), and infection. The contrast medium itself can cause anaphylaxis and renal toxicity.
Table 3.4 summarizes the catheterization fi ndings in common cardiac abnormalities. Therapeutic interventional catheterization tech-niques are described in Chapter 6.
NUCLEAR IMAGING
Heart function can be evaluated using in-jected, radioactively labeled tracers and γ-camera detectors. The resulting images re-fl ect the distribution of the tracers within the cardiovascular system. Nuclear techniques are used to assess myocardial perfusion, to image blood passing through the heart and great vessels, to localize and quantify myo-cardial ischemia and infarction, and to assess myocardial metabolism.
Assessment of Myocardial Perfusion
Ischemia and infarction resulting from CADcan be detected by myocardial perfusion im-aging using various radioisotopes, includingcompounds labeled with thallium-201 (201Tl)
Digital subtraction angiography (DSA) is commonly used in vascular imaging. Electronic processing of digitalized x-ray images subtracts the background of soft tissue and bone, thus enhancing the blood vessel or chamber into which contrast was injected. DSA has advan-tages over conventional angiography: smaller catheters may be used, the amount of contrast agent required may be lower, and better image quality is usually achieved.
Selective injection of contrast into specifi c heart chambers can be used to identify valvu-lar insuffi ciency, intracardiac shunts, thrombi within the heart, and congenital malforma-tions, and is also used to measure ventricular contractile function (Fig. 3.15).
A widespread application of contrast injec-tion is coronary artery angiography, to ex-amine the location and severity of coronary atherosclerotic lesions. To maximize the test’s sensitivity and reproducibility, each patient is imaged in several standard views. When necessary, angioplasty and stent placement can be performed (Figs. 3.16 and 3.17; see Chapter 6).
A small risk is associated with catheteriza-tion and contrast angiography. Complications are uncommon but include myocardial perfora-tion by the catheter, precipitation of arrhythmias
Figure 3.15. Left ventriculogram, in diastole (A) and systole (B) in the right anterior oblique projection, from a patient with normal ventricular contractility. A catheter (arrow) is used to inject contrast into the left ventricle (LV). The catheter can also be seen in the descending aorta (arrowhead). AO, aortic root.
77237_ch03.indd 6277237_ch03.indd 62 8/11/10 8:09:20 AM8/11/10 8:09:20 AM

Cardiac Imaging and Catheterization
63
99mTc-labeled agents provide better image qual-ity and are superior for detailed single photon emission computed tomography (SPECT, as in Fig. 3.18). Conversely, enhanced detection of myocardial cellular viability is possible with 201Tl imaging.
and technetium-99m (99mTc). Of the latter, cur-rently 99mTc-sestamibi and 99mTc-tetrofosmin are widely used. Both 201Tl- and 99mTc-labeled compounds are sensitive for the detection of ischemic or scarred myocardium, but each has distinct advantages. For example, the
Figure 3.16. Cardiac catheterization and stenting of a proximal left anterior descending artery (LAD) stenosis, shown in an anteroposterior cranial projection. A. When contrast agent is injected into the left main coronary artery (LM), the left circumfl ex artery (LCX) fi lls normally but the LAD is almost completely occluded at its origin (white arrow). B. After the stenosis is successfully stented, the LAD and its branches fi ll robustly.
BA
LMLM
LADLAD
LCX
Diagonalbranch
Septalperforators
Figure 3.17. Cardiac catheterization and stenting of right coronary artery (RCA) stenoses. Both images are obtained in the left anterior oblique (LAO) projection. A. The stenotic segment is located between the white arrows. B. After stenting, the caliber of the vessel and fl ow have improved.
BA
77237_ch03.indd 6377237_ch03.indd 63 8/11/10 5:46:20 PM8/11/10 5:46:20 PM

Chapter 3
64
Table 3.4. Cardiac Catheterization and Angiography in Cardiac Disorders
Disorder Finding
Coronary artery disease • Identifi cation of atherosclerotic lesions
Mitral regurgitation • Large systolic v wave in left atrial pressure tracing
Mitral stenosis • Abnormally high pressure gradient between left atrium and leftventricle in diastole
Tricuspid insuffi ciency • Large systolic v wave in the right atrial pressure tracing
Aortic stenosis • Systolic pressure gradient between left ventricle and aorta
Congestive heart failure • Reduced ejection fraction (see Chapter 9) if systolic dysfunction• Elevated diastolic pressure with normal ejection fraction if diastolic
dysfunction
A
BSHORT AXIS
Anterior
Inferior
LatSepSTRESS
REST
C
HORIZONTALLONG AXIS
Apex
LatSepSTRESS
REST
Figure 3.18. Stress and rest myocardial perfusion single photon emission computed tomography images (using 99mTc-tetrofosmin) of a patient with a high-grade stenosis within the proximal left anterior descending coronary artery. A. Miniaturized reproduction of the complete scan showing tomographic images in each of the three views. The fi rst, third, and fi fth rows demonstrate images during stress, and the second, fourth, and sixth rows are matching images acquired at rest. B,C. Enlarged selected panels from A showing stress and rest images in the short axis and horizontal long axis views. The arrows indicate regions of decreased perfusion during stress but normal perfusion on the matching resting scans, consistent with inducible ischemia. Lat, lateral wall of the LV; Sep, septal wall. (Courtesy of Marcelo Di Carli, MD, Brigham and Women’s Hospital, Boston, MA.)
77237_ch03.indd 6477237_ch03.indd 64 8/11/10 8:09:22 AM8/11/10 8:09:22 AM

Cardiac Imaging and Catheterization
65
demonstrate diminished contractile func-tion owing to chronic reduction of coronary blood fl ow (see Chapter 6). This viable state (in which the affected cells can be predicted to regain function following coronary revas-cularization) can often be differentiated from irreversibly scarred myocardium by repeat imaging at rest after the injection of additional 201Tl to enhance uptake by viable cells.
99mTc-sestamibi (commonly referred to as MIBI) is the most widely used 99mTc-labeled compound. This agent is a large lipophilic molecule that, like thallium, is taken up in the myocardium in proportion to blood fl ow. The uptake mechanism differs in that the compound crosses the myocyte membrane passively, driven by the negative membrane potential. Once inside the cell, it further ac-cumulates in mitochondria, driven by that organelle’s even more negative membrane potential. The myocardial distribution of MIBI refl ects perfusion at the moment of injection, and in contrast to thallium, it remains fi xed intracellularly, that is, it does not redistribute over time. Consequently, performing a MIBI procedure is more fl exible, as images can be obtained up to 4 to 6 hours after injection and repeated as necessary. A MIBI study is usu-ally performed as a 1-day protocol in which an initial injection of a small tracer dose and imaging are performed at rest. Later, a larger tracer dose is given after exercise, and imaging is repeated.
Stress nuclear imaging studies with ei-ther 201Tl- or 99mTc-labeled compounds have greater sensitivity and specifi city than stan-dard exercise electrocardiography for the de-tection of ischemia but are more expensive and should be ordered judiciously. Nuclear imaging is particularly appropriate for patients with certain baseline electrocardiogram (ECG) abnormalities of the ST segment that preclude accurate interpretation of a standard exercise test. Examples include patients with electronic pacemaker rhythms, those with left bundle branch block, those with ST abnormalities due to left ventricular hypertrophy, and those who take certain medications that alter the ST segment, such as digoxin. Nuclear scans also
In the case of 201Tl imaging, the radio-isotope is injected intravenously while the patient is exercising on a treadmill or station-ary bicycle. Because thallium is a potassium analogue, it enters normal myocytes, a pro-cess thought to be partially governed by the sodium– potassium ATPase pump. The intra-cellular concentration of thallium, estimated by the density of the image, depends on vas-cular supply (perfusion) and membrane func-tion (tissue viability). In the normal heart, the radionuclide scan shows a homogenous distribution of thallium in the myocardial tissue. Conversely, myocardial regions that are scarred (by previous infarction) or have reduced perfusion during exercise (i.e., tran-sient myocardial ischemia) do not accumulate as much thallium as normal heart muscle. Consequently, these areas will appear on the thallium scan as light or “cold” spots.
When evaluating for myocardial ischemia, an initial set of images is taken right after exercise and 201Tl injection. Well-perfused myocardium will take up more tracer than ischemic or infarcted myocardium at this time. Delayed images are acquired several hours later, because 201Tl accumulation does not re-main fi xed in myocytes. Rather, continuous redistribution of the isotope occurs across the cell membrane. After 3 to 4 hours of redistri-bution, when additional images are obtained, all viable myocytes will have equal concen-trations of 201Tl. Consequently, any uptake abnormalities on the initial exercise scan that were caused by myocardial ischemia will have resolved (i.e., fi lled in) on the delayed scan (and are therefore termed “reversible” defects), and those representing infarcted or scarred myocardium will persist as cold spots (“fi xed” defects).
Of note, some myocardial segments that demonstrate persistent 201Tl defects on both stress and redistribution imaging are falsely characterized as nonviable, scarred tissue. Sometimes these areas represent ischemic, noncontractile, but metabolically active areas that have the potential to regain func-tion if an adequate blood supply is restored. For example, such areas may representhibernating myocardium, segments that
77237_ch03.indd 6577237_ch03.indd 65 8/11/10 8:09:22 AM8/11/10 8:09:22 AM

Chapter 3
66
RVG is commonly used to assess baseline cardiac function in patients scheduled to un-dergo potentially cardiotoxic chemotherapy (e.g., doxorubicin) and to follow cardiac func-tion over time in such patients. In addition, fi rst-pass imaging permits recognition and quantifi cation of cardiac and vascular shunts (described in Chapter 16).
Assessment of Myocardial Metabolism
Positron emission tomography (PET) is a spe-cialized nuclear imaging technique used to as-sess myocardial perfusion and viability. PET imaging employs positron-emitting isotopes (e.g., rubidium-82, nitrogen-13, and fl uorine-18) attached to metabolic or fl ow tracers. Sensitive detectors measure positron emission from the tracer molecules.
Myocardial perfusion is commonly as-sessed using nitrogen-13–labeled ammonia or rubidium-82. Both are taken up by myocytes in proportion to blood fl ow. Myocardial vi-ability can be determined by PET by studying glucose utilization in myocardial tissue. In nor-mal myocardium under fasting conditions, glu-cose is used for approximately 20% of energy production, with free fatty acids providing the remaining 80%. In ischemic conditions, how-ever, metabolism shifts toward glucose use, and the more ischemic the myocardial tissue, the stronger the reliance on glucose. Fluoro-18 deoxyglucose (18FDG), created by substituting fl uorine-18 for hydrogen in 2-deoxyglucose, is used to study glucose uptake. This substance competes with glucose both for transport into myocytes and for subsequent phosphorylation. Unlike glucose, however, 18FDG is not metabo-lized and becomes trapped within the myocyte.
Combined evaluation of perfusion and 18FDG metabolism allows assessment of both regional blood fl ow and glucose uptake, re-spectively. PET scanning thus helps determine whether areas of ventricular contractile dys-function with decreased fl ow represent irre-versibly damaged scar tissue, or whether the region is still viable (e.g., hibernating myocar-dium). In scar tissue, both blood fl ow to the affected area and 18FDG uptake are decreased. Because the myocytes in this region are per-manently damaged, such tissue is not likely
provide more accurate anatomic localization of the ischemic segment(s) and quantifi cation of the extent of ischemia compared with stan-dard exercise testing. In addition, electronic synchronizing (gating) of nuclear images to the ECG cycle permits wall motion analysis.
Patients with orthopedic or neurologic con-ditions, as well as those with severe physical deconditioning or chronic lung disease, may be unable to perform an adequate exercise test on a treadmill or bicycle. In such pa-tients, stress images can be obtained instead by administering pharmacologic agents, such as adenosine or dipyridamole. These agents induce diffuse coronary vasodilation, aug-menting blood fl ow to myocardium perfused by healthy coronary arteries. Since ischemic regions are already maximally dilated (be-cause of local metabolite accumulation), the drug-induced vasodilation causes a “steal” phenomenon, reducing isotope uptake in re-gions distal to signifi cant coronary stenoses (see Chapter 6). Alternatively, dobutamine (see Chapter 17) can be infused intravenously to increase myocardial oxygen demand as a means to assess for ischemia.
Radionuclide Ventriculography
Radionuclide ventriculography (RVG, also known as blood pool imaging) is used to analyze right and left ventricular function. A radioisotope (usually 99mTc) is bound to red blood cells or to human serum albumin and then injected as a bolus. Nuclear images are obtained at fi xed time intervals as the labeled material passes through the heart and great vessels. Multiple images are displayed sequen-tially to produce a dynamic picture of blood fl ow. Calculations, such as determination of the ejection fraction, are based on the differ-ence between radioactive counts present in the ventricle at end diastole and at end sys-tole. Therefore, measurements are largely in-dependent of any assumptions of ventricular geometry and are highly reproducible. Studies suggest that RVG and echocardiography pro-vide similar left ventricular ejection fraction values, but unlike echocardiography, RVG can also calculate an accurate right ventricular ejection fraction.
77237_ch03.indd 6677237_ch03.indd 66 8/11/10 8:09:22 AM8/11/10 8:09:22 AM

Cardiac Imaging and Catheterization
67
from neighboring soft tissue structures (e.g., myocardium).
Applications of CT in cardiac imaging include assessment of the great vessels, pericardium, myocardium, and coronary arteries. CT is used to diagnose aortic dissections and aneurysms (Fig. 3.19). It can identify abnormal pericardial fl uid, thickening, and calcifi cation. Myocardial abnormalities, such as regional hypertrophy or ventricular aneurysms, and intracardiac throm-bus formation can be distinctly visualized by CT. A limitation of conventional CT techniques is the artifact generated by patient motion (i.e., breathing) during image acquisition. Modern spiral CT imaging allows more rapid image ac-quisition, often during a single breath-hold, at relatively lower radiation doses than conven-tional CT. Spiral CT is particularly important in the diagnosis of pulmonary embolism. When an intravenous iodine-based contrast agent is administered, emboli create the appearance of
to benefi t from revascularization. Hibernat-ing myocardium, in contrast, shows decreased blood fl ow but normal or elevated 18FDG up-take. Such tissue may benefi t from revascular-ization procedures (see Chapter 6).
Table 3.5 summarizes the radionuclide- imaging abnormalities associated with com-mon cardiac conditions.
COMPUTED TOMOGRAPHY
CT uses thin x-ray beams to obtain a large se-ries of axial plane images. An x-ray tube is pro-grammed to rotate around the body, and the generated beams are partially absorbed by body tissues. The remaining beams emerge and are captured by electronic detectors, which relay information to a computer for image compo-sition. CT scanning typically requires admin-istration of an intravenous contrast agent to distinguish intravascular contents (i.e., blood)
Table 3.5. Nuclear Imaging in Cardiac Disorders
Disorder Findings
Myocardial ischemia Stress-delayed reinjection 201Tl • Low uptake during stress with complete or partial
fi ll-in with delayed or reinjection images
Rest–stress 99mTc-labeled compounds • Normal uptake at rest with decreased uptake during stress
PET (N-13 ammonia/18FDG) • Decreased fl ow with normal or increased 18FDG uptake during stress
Myocardial infarction
Stress-delayed reinjection 201Tl • Low uptake during stress and low uptake after reinjection
Rest–stress 99mTc-labeled compounds • Low uptake in rest and stress images
PET (N-13 ammonia/18FDG) • Decreased fl ow and decreased 18FDG uptake at rest
Hibernating myocardium
Rest-delayed 201Tl • Complete or partial fi ll-in of defects after reinjec-tion
PET (N-13 ammonia/18FDG) • Decreased fl ow and normal or increased 18FDG up-take at rest
Assessment of ventricular function
99mTc RBC-gated radionuclide ventriculography • Assessment of global left and right ventricular function
18FDG, fl uoro-18 deoxyglucose; N-13, nitrogen-13; PET, positron emission tomography; RBC, red blood cell; 99mTc, technetium-99m; 201Tl, thallium-201.
77237_ch03.indd 6777237_ch03.indd 67 8/11/10 8:09:22 AM8/11/10 8:09:22 AM
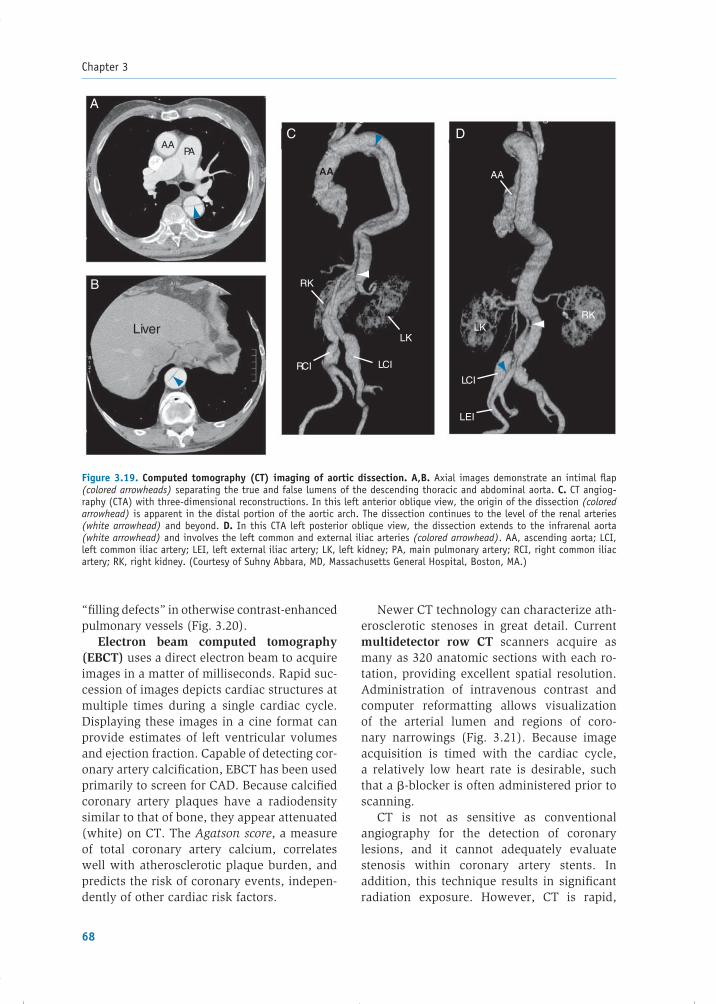
Chapter 3
68
Figure 3.19. Computed tomography (CT) imaging of aortic dissection. A,B. Axial images demonstrate an intimal fl ap (colored arrowheads) separating the true and false lumens of the descending thoracic and abdominal aorta. C. CT angiog-raphy (CTA) with three-dimensional reconstructions. In this left anterior oblique view, the origin of the dissection (colored arrowhead) is apparent in the distal portion of the aortic arch. The dissection continues to the level of the renal arteries (white arrowhead) and beyond. D. In this CTA left posterior oblique view, the dissection extends to the infrarenal aorta (white arrowhead) and involves the left common and external iliac arteries (colored arrowhead). AA, ascending aorta; LCI, left common iliac artery; LEI, left external iliac artery; LK, left kidney; PA, main pulmonary artery; RCI, right common iliac artery; RK, right kidney. (Courtesy of Suhny Abbara, MD, Massachusetts General Hospital, Boston, MA.)
AA
AA AA
RK
RCI LCI
LCI
LEI
RK
LKLK
PA
Liver
A
B
C D
“fi lling defects” in otherwise contrast-enhanced pulmonary vessels (Fig. 3.20).
Electron beam computed tomography (EBCT) uses a direct electron beam to acquire images in a matter of milliseconds. Rapid suc-cession of images depicts cardiac structures at multiple times during a single cardiac cycle. Displaying these images in a cine format can provide estimates of left ventricular volumes and ejection fraction. Capable of detecting cor-onary artery calcifi cation, EBCT has been used primarily to screen for CAD. Because calcifi ed coronary artery plaques have a radiodensity similar to that of bone, they appear attenuated (white) on CT. The Agatson score, a measure of total coronary artery calcium, correlates well with atherosclerotic plaque burden, and predicts the risk of coronary events, indepen-dently of other cardiac risk factors.
Newer CT technology can characterize ath-erosclerotic stenoses in great detail. Current multidetector row CT scanners acquire as many as 320 anatomic sections with each ro-tation, providing excellent spatial resolution. Administration of intravenous contrast and computer reformatting allows visualization of the arterial lumen and regions of coro-nary narrowings (Fig. 3.21). Because image acquisition is timed with the cardiac cycle, a relatively low heart rate is desirable, such that a �-blocker is often administered prior to scanning.
CT is not as sensitive as conventional angiography for the detection of coronary lesions, and it cannot adequately evaluate stenosis within coronary artery stents. In addition, this technique results in signifi cant radiation exposure. However, CT is rapid,
77237_ch03.indd 6877237_ch03.indd 68 8/11/10 8:09:22 AM8/11/10 8:09:22 AM

Cardiac Imaging and Catheterization
69
Figure 3.20. Spiral computed tomography image demonstrating a massive pulmonary embolism. The white arrows point to a large thrombus within the right pulmonary artery. It appears as a fi lling defect within the otherwise contrast-enhanced pulmonary vascu-lature. AA, ascending aorta; DA, descending aorta; LPA, left pulmonary artery; PA, main pulmonary artery; RPA, right pulmonary artery; SVC, superior vena cava.
relatively inexpensive, and signifi cantly less invasive than conventional angiography. Its role in assessing patients with symptoms suggestive of CAD and for following the pro-gression of known coronary disease is under active evaluation.
MAGNETIC RESONANCE IMAGING
MRI uses a powerful magnetic fi eld to obtain detailed images of internal structures. This tech-nique is based on the magnetic polarity of hy-drogen nuclei, which align themselves with an applied magnetic fi eld. Radio frequency excita-tion causes the nuclei to move out of alignment momentarily. As they return to their resting states, the nuclei emit signals that are translated into computer-generated images. Therefore, MRI requires no ionized radiation. Among all the imaging modalities, MRI is best at differentiating tissue contrasts (blood, fl uid, fat, and myocar-dium) and can often do so even without the use of contrast agents. The addition of gadolinium-
based contrast allows further characterization of cardiac structures and tissues.
The detail of soft tissue structures is often exquisitely demonstrated in magnetic reso-nance images (Fig. 3.22). Cardiac MRI has an established role in evaluating congenital anom-alies, such as shunts, and diseases of the aorta, including aneurysm and dissection. It is also used to assess left and right ventricular mass and volume, intravascular thrombus, cardio-myopathies, and neoplastic disease (Fig. 3.23). ECG-gated and cine MRI techniques capture images at discrete times in the cardiac cycle, and permit evaluation of valvular and ventricu-lar function.
Two applications of cardiac MRI deserve special mention. Coronary magnetic reso-nance angiography (coronary MRA) is a non-invasive, contrast-free angiographic imaging modality. Laminar blood fl ow appears as bright signal intensity, whereas turbulent blood fl ow, at the site of stenosis, results in less bright or ab-sent signal intensity. This technique has shown high sensitivity and accuracy for the detection
77237_ch03.indd 6977237_ch03.indd 69 8/11/10 8:09:24 AM8/11/10 8:09:24 AM

Chapter 3
70
In contrast-enhanced MRI, a gadolinium-based agent is administered intravenously to identify infarcted (irreversibly damaged) myo-cardium and to differentiate it from impaired (but viable) muscle segments. This technique
of important CAD in the left main coronaryartery and in the proximal and midportions of the three major coronary vessels. Coronary MRA is also useful in delineating coronaryartery congenital anomalies.
C
Ao
PA
LAD
Figure 3.21. Computed tomography (CT) coronary angiography. After a patient is imaged in a high-resolution axial CT scanner, three-dimensional reconstructions (termed volume renderings) are generated by a computer. A. Volume rendering of a normal CT angiogram. B. Volume rendering of a CT angiogram that demonstrates diffuse coronary artery disease. Notice that the caliber of each vessel is irregular along its length. C. This curved refor-mat of the left anterior descending artery (LAD) depicts the entire course of the vessel in a single, fl at image, making it easier to detect stenoses. None are present here. Ao, aorta; LA, left atrium; LCX, left circumfl ex ar-tery; LM, left main coronary artery; LV, left ventricle; PA, pulmonary artery; RA, right atrium; RCA, right coronary artery; RV, right ventricle. (Courtesy of Suhny Abbara, MD, Massachusetts General Hospital, Boston, MA.)
RA
RV
RV
LV
LAD
RCA
RCA
LCX
LCXLAD
LM LM
LV
LA
LA
AoAo
PA
A B
77237_ch03.indd 7077237_ch03.indd 70 8/11/10 8:09:25 AM8/11/10 8:09:25 AM

Cardiac Imaging and Catheterization
71
studies, gadolinium MRI, or dobutamine echocardiography.
Determining the single best test for any given patient depends on a number of factors. One is the ease by which images may be obtained. In a critically ill patient, bedside echocardiography provides a readily acquired measure of left ven-tricular systolic function. Conversely, obtaining similar information from a nuclear or magnetic resonance study would require a trip to the re-spective scanner. Another factor to consider is the degree of invasiveness of a given imaging technique. Expense, available equipment, and institutional expertise also play roles in select-ing an imaging approach. When used appropri-ately, each of these tools can provide important information to guide the diagnosis and manage-ment of cardiovascular disorders.
Table 3.6 summarizes common uses of the imaging techniques. The listed clinical condi-tions are described in greater detail in subse-quent chapters.
is based on the fact that gadolinium is ex-cluded from viable cells with intact cell mem-branes but can permeate and concentrate in infarcted zones, producing “hyperenhance-ment” on the image (Fig. 3.24). In addition, the transmural extent of myocardial scar can be depicted, and infarcting tissue can also be differentiated from acute myocarditis, a con-dition that may present with similar clinical features (see Chapter 10).
SUMMARY
This chapter has presented an overview of im-aging and catheterization techniques available to assess cardiac structure and function. Many of these tools are expensive and yield similar information. For example, estimates of ven-tricular contractile function can be made by echocardiography, nuclear imaging, contrast angiography, gated CT, or MRI. Myocardial vi-ability can be assessed using nuclear imaging
Figure 3.22. Cardiac magnetic resonance images of a normal person. A. Three-chamber long axis view of the heart in diastole and systole showing the left ventricle (LV), right ventricle (RV), and left atrium (LA). The mitral valve (MV), aortic valve (AV), ascending aorta (AAO), and descending aorta (DA) are also imaged. B. Midventricular short axis view demonstrating the LV, RV, and left ventricular papillary muscles (PMs). PW, posterior wall; S, septum. (Courtesy of Raymond Y. Kwong, MD, Brigham and Women’s Hospital, Boston, MA.)
77237_ch03.indd 7177237_ch03.indd 71 8/11/10 8:09:26 AM8/11/10 8:09:26 AM

Chapter 3
72
A B
LV
RV
RA
LA LA
RA
RV
LV
Figure 3.23. Magnetic resonance imaging of an intracardiac mass. Both images are apical four-chamber views. A. Before a gadolinium-based contrast agent is administered, an abnormal left atrial mass (indicated by the oval) demonstrates di-minished signal relative to the surrounding tissue. In this respect, it resembles a nonvascular thrombus. B. After contrast injection, the mass enhances similar to the surrounding tissue, indicating that it is vascularized. Biopsy revealed a spindle-cell carcinoma. LA, left atrium; LV, left ventricle; RA, right atrium; RV, right ventricle. (Courtesy of Raymond Y. Kwong, MD, Brigham and Women’s Hospital, Boston, MA.)
A
LVRV RV LV
B
Figure 3.24. Gadolinium-enhanced magnetic resonance images dem-onstrating a region of nonviable myocardium. Both images are short axis views. A. Imaging before administration of gadolinium demonstrates thinning of the anterior and anteroseptal myocardium (colored arrow) suggestive of infarcted tissue. B. After contrast injection, the anterior and anteroseptal segments of the left ventricle selectively enhance (white arrows), indicating that scar tissue is present. Because more than half the thickness of the ventricular wall is scarred, coronary revascularization would have a low likelihood of improving contractile function of these myocardial segments. LV, left ventricle; RV, right ventricle. (Courtesy of Raymond Y. Kwong, MD, Brigham and Women’s Hospital, Boston, MA.)
77237_ch03.indd 7277237_ch03.indd 72 8/11/10 8:09:26 AM8/11/10 8:09:26 AM

Cardiac Imaging and Catheterization
73
Table 3.6. Summary of Cardiac Imaging Techniques
Imaging Technique Findings Examples of Clinical Uses
Chest radiography • Cardiac and mediastinalcontours
• Pulmonary vascularmarkings
• Detect chamber dilatation• Identify consequences of stenotic and
regurgitant valve lesions and intracardiac shunts
• Visualize pulmonary signs of heart failure
Transthoracic echocardiography
(TTE)
• Wall thickness, chamberdimensions
• Anatomic relationships and motion of cardiac structures
• Flow direction, turbulence, and velocity measurements
• Echo contrast studies• Stress echocardiography
• Assess global and segmental ventricular contraction
• Identify valvular abnormalities and vegetations
• Diagnose consequences of myocardial infarction (e.g., ventricular aneurysm, papillary muscle rupture, intraventricular thrombus)
• Identify myocardial, pericardial, and congenital abnormalities
Transesophageal echocardiography
(TEE)
• Similar to TTE but higher resolution
• Visualize intracardiac thrombus• Evaluate prosthetic valves and perivalvular
leaks• Identify valvular vegetations and myocardial
abscess in endocarditis• Diagnose aortic dissection
Cardiac catheterization
• Pressure measurement • Contrast angiography
• Evaluate intracardiac pressures (e.g., in valvular disease, heart failure, pericardial disease)
• Visualize ventricular contractile function, regurgitant valve lesions
• Identify coronary anatomy and severity of stenoses
Nuclear SPECT imaging (using 99mTc-labeled
compounds or 201Tl)
• Regional myocardialperfusion
• Myocardial viability
• Detect, quantify, and localize myocardial ischemia
• Perform stress testing in patients with baseline ECG abnormalities
• Distinguish viable myocardium from scar tissue
Radionuclide ventriculography
• Ventricular contractilefunction
• Calculate ventricular ejection fraction and quantitate intracardiac shunts
Positron emission tomography (PET)
• Myocardial perfusion and metabolism
• Evaluate contractile function• Distinguish viable myocardium from scar
tissue
Computed tomography (CT)
• Anatomy and structural relationships
• Diagnose disease of the great vessels (aortic dissection, pulmonary embolism)
• Assess pericardial disease and myocardial abnormalities
• Detect coronary artery calcifi cation and stenoses
Magnetic resonance imaging (MRI)
• Detailed soft tissueanatomy
• Assess myocardial structure and function (e.g., ventricular mass and volume, neoplastic disease, intracardiac thrombus, cardiomyopathies)
• Diagnose aortic and pericardial disease
ECG, electrocardiogram; SPECT, single photon emission computed tomography; 99mTc, technetium-99m; 201Tl, thallium-201.
77237_ch03.indd 7377237_ch03.indd 73 8/11/10 8:09:26 AM8/11/10 8:09:26 AM
Chapter 3
74
Fazel R, Krumholz HM, Wang Y, et al. Exposure to low-dose ionizing radiation from medical imaging procedures. N Engl J Med. 2009;361:849–857.
Hendel RC, Berman DS, Di Carli MF, et al. ACCF/ASNC/ACR/AHA/ASE/SCCT/SCMR/SNM 2009 appropriate use criteria for cardiac radionuclide imaging. Circulation. 2009;119:561–587.
Kern MJ, Samady H. Current concepts of integrated coronary physiology in the catheterization labora-tory. J Am Coll Cardiol. 2010;55:173–185.
Kim HW, Farzaneh-Far A, Kim RJ. Cardiovascular magnetic resonance in patients with myocardial infarction. J Am Coll Cardiol. 2010;55:1–16.
Kurt M, Shaikh KA, Peterson L, et al. Impact of contrast echocardiography on evaluation of ven-tricular function and clinical management in a large prospective cohort. J Am Coll Cardiol. 2009;53:802–810.
Min JK, Shaw LJ, Berman DS. The present state of coronary computed tomographic angiography. J Am Coll Cardiol. 2010;55:957–965.
Otto CM. Textbook of Clinical Echocardiography. 4th ed. Philadelphia, PA: Elsevier Saunders; 2009.
Pennell DJ. Cardiovascular magnetic resonance. Cir-culation. 2010;121:692–705.
Perrino AC, Reeves ST. A Practical Approach to Transesophageal Echocardiography. 2nd ed. Phila-delphia, PA: Lippincott Williams & Wilkins; 2008.
Schuijf JD, van Werkhoven JM, Pundziute G, et al. Inva-sive versus noninvasive evaluation of coronary artery disease. JACC Cardiovasc Imaging. 2008;1:190–199.
Acknowledgments
The authors are grateful to Suhny Abbara, MD; Sharmila Dorbala, MD; Raymond Y. Kwong, MD; and Jeffrey Popma, MD, for their helpful suggestions. Con-tributors to the previous editions of this chapter were Nicole Martin, MD; Deborah Bucino, MD; Sharon Horesh, MD; Shona Pendse, MD; Albert S. Tu, MD; Patrick Yachimski, MD, and Patricia C. Come, MD.
Additional Reading
Baim D, Grossman W. Grossman’s Cardiac Catheter-ization, Angiography and Intervention. 7th ed. Phil-adelphia, PA: Lippincott Williams & Wilkins; 2005.
Bengel FM, Higuchi T, Javadi MS, et al. Cardiac positron emission tomography. J Am Coll Cardiol. 2009;54:1–15.
Dewey M. Coronary CT Angiography. Berlin: Springer; 2009.
Di Carli MF. Hybrid imaging: integration of nuclear imaging and cardiac CT. Cardiol Clin. 2009;27:257–263.
Douglas PS, Khandheria B, Stainback RF, et al. ACCF/ASE/ACEP/ASNC/SCAI/SCCT/SCMR 2007 appropriateness criteria for transthoracic and transesophageal echocardiography. J Am Coll Car-diol. 2007;50:187–204.
Douglas PS, Khandheria B, Stainback RF, et al. ACCF/ASE/ACEP/AHA/ASNC/SCAI/SCCT/SCMR 2008 appropriateness criteria for stress echocardiogra-phy. Circulation. 2008;117:1478–1497.
77237_ch03.indd 7477237_ch03.indd 74 8/11/10 8:09:27 AM8/11/10 8:09:27 AM

75
C H A P T E R
4The ElectrocardiogramStephen R. PomedliLeonard S. Lilly
ELECTRICAL MEASUREMENT—SINGLE-CELL MODELELECTROCARDIOGRAPHIC LEAD REFERENCE SYSTEMSEQUENCE OF NORMAL CARDIAC ACTIVATIONINTERPRETATION OF THE ELECTROCARDIOGRAMCalibrationHeart Rhythm
Heart RateIntervals (PR, QRS, QT)Mean QRS AxisAbnormalities of the P WaveAbnormalities of the QRS ComplexST Segment and T Wave Abnormalities
side of the cell is electrically positive with respect to the inside, because of the ionic distribution across the cell membrane, as de-scribed in Chapter 1. In this resting state, the voltmeter electrodes, which are placed on opposite outside surfaces of the cell, do not record any electrical activity, because there is no electrical potential difference between them (the myocyte surface is homogeneously charged).
This equilibrium is disturbed, however, when the cell is stimulated (see Fig. 4.1B). During the action potential, cations rush across the sarcolemma into the cell and the polarity at the stimulated region transiently reverses such that the outside becomes nega-tively charged with respect to the inside; that is, the region depolarizes. At that moment, an electrical potential is created on the cell sur-face between the depolarized area (negatively charged surface) and the still-polarized (posi-tively charged surface) portions of the cell. As a result, an electrical current begins to fl ow between these two regions.
Cardiac contraction relies on the organized fl ow of electrical impulses through the
heart. The electrocardiogram (ECG) is an eas-ily obtained recording of that activity and pro-vides a wealth of information about cardiac structure and function. This chapter presents the electrical basis of the ECG in health and disease and leads the reader through the ba-sics of interpretation. To become fully adept at this technique and to practice the principles described here, you may wish to consult one of the complete electrocardiographic textbooks listed at the end of this chapter.
ELECTRICAL MEASUREMENT—SINGLE-CELL MODEL
This section begins by observing the propa-gation of an electrical impulse along a single cardiac muscle cell, illustrated in Figure 4.1. On the right side of the diagram, a voltmeter records the electrical potential at the cell’s surface on graph paper. In the resting state, the cell is polarized; that is, the entire out-
77237_ch04.indd 7577237_ch04.indd 75 8/11/10 8:10:16 AM8/11/10 8:10:16 AM

Chapter 4
76
Because the depolarization current in this example proceeds from left to right—that is, toward the (�) electrode—an upward defl ec-tion is recorded by the voltmeter. As the wave of depolarization propagates rightward along the cell, additional electrical forces directed to-ward the (�) electrode record an even greater upward defl ection (see Fig. 4.1C). Once the cell
By convention, the direction of an elec-trical current is said to fl ow from areas that are negatively charged to those that are posi-tively charged. When a depolarization current is directed toward the (�) electrode of the voltmeter, an upward defl ection is recorded. Conversely, if it is directed away from the (�) electrode, a downward defl ection is recorded.
+–
+ –+ –
+–
+–
+–
+–
+–
+–
+–
+–
+–
+–
+–
+–
+–
CARDIAC MUSCLE CELL
Voltmeter
(–)(–) (+)(+)
(+)(+) (–)(–)
+–
+–
+–
+–
+–
+–
+–
+–
+–
+–
+– +
–+–
+–
+–
+–
(+)(+)
A
B
Depolarization Current
+–
+–
+–
+–
+–
+–
+–
+–
+–
+–
+–
+–
+– +
–+–
+–
(+)(+)
C
+–
+–
+–
+ –+ –
+–
+–
+–
+–
+–
+–
+–
+–
+–
+–
+–
(+)(+)
D
+–
+–
+–
+ –+ –
+–
+–
+–
+–
+–
+–
+–
+–
+–
+–
+–
E
Figure 4.1. Depolarization of a single cardiac muscle cell. A. In the rest-ing state, the surface of the cell is positively charged relative to the inside. Because the surface is homogeneously charged, the voltmeter electrodes outside the cell do not record any electrical potential difference (“fl at line” recording). B. Stimulation of the cell initiates depolarization (shaded area); the outside of the depolarized region becomes negatively charged relative to the inside. Because the current of depolarization is directed toward the (�) electrode of the voltmeter, an upward defl ection is recorded. C. Depolarization spreads, creating a greater upward defl ection by the recording electrode. D. The cell has become fully depolarized. The surface of the cell is now completely negatively charged compared with the inside. Because the surface is again homogeneously charged, a fl at line is recorded by the voltmeter. E. Notice that if the position of the voltmeter electrodes had been reversed, the electrical current would have been directed away from the (�) electrode, causing the defl ection to be downward.
77237_ch04.indd 7677237_ch04.indd 76 8/11/10 8:10:16 AM8/11/10 8:10:16 AM

The Electrocardiogram
77
has become fully depolarized (see Fig. 4.1D), its outside is completely negatively charged with respect to the inside, the opposite of the initial resting condition. However, because the surface charge is homogeneous once again, the external electrodes measure a potential difference of zero and the voltmeter records a neutral “fl at line” at this time.
Note that in Figure 4.1E, if the voltmeter electrode positions had been reversed, such that the (�) pole was placed to the left of
the cell, then as the wave of depolarization proceeds toward the right, the current would be directed away from the (�) electrode and the recorded defl ection would be downward. This relationship should be kept in mind when the polarity of ECG leads is described below.
Depolarization initiates myocyte contrac-tion and is then followed by repolarization, the process by which the cellular charges return to the resting state. In Figure 4.2, as
(+) (+)+ –+ –
+–
+–
+–
+–
+–
+–
+–
+–
+–
+–
A
+–
+ –+ –
+–
(+) (+)+ –+ –
+–
+–
+–
+–
+–
+–
B
+–
+ –+ –
+–
(+) (+)
C
D
+–
+ –+ –
+–
+–
+–
+–
+–
+–
+–
+–
+–
+–
+–
+–
+–
+–
+–
+–
+–
Direction of Current
Depolarized portion
Repolarized portion
Figure 4.2. Sequence of repolarization of a single cardiac muscle cell. A. As repolarization commences, positive charges reemerge on the surface of the cell, and a current fl ows from the still negatively charged surface areas to the repolarized region (blue arrows). Be-cause the current is directed away from the (�) electrode of the voltmeter, a downward defl ection is recorded. B. Repolarization pro-gresses. C. Repolarization has completed, and the outside surface of the cell is once again homogeneously charged, so that no further electrical potential is detected (fl at line once again). D. Sequence of cardiac depolarization and repolarization as measured by an ECG machine at the skin surface. As described in the text, repolarization actually proceeds in the direction opposite to that of depolarization in the intact heart, such that the defl ections of repolarization are inverted compared to the schematics presented in parts A–C of this fi gure. Therefore, the defl ections of depolarization and repolarization of the normal heart are oriented in the same direction. Note that the wave of repolarization is more prolonged and of lower amplitude than that of depolarization.
77237_ch04.indd 7777237_ch04.indd 77 8/11/10 8:10:17 AM8/11/10 8:10:17 AM

Chapter 4
78
cells to depolarize). Thus, the cells close to the endocardium are the fi rst to depolarize but are the last to repolarize. As a result, the direction of repolarization recorded by the ECG machine is usually the inverse of what was presented in the single cell example in Figure 4.2. That is, unlike the single cell model, the electrical defl ections of depolarization and repolariza-tion in the intact heart are usually oriented in the same direction on the ECG tracing (see Fig. 4.2D).
The direction and magnitude of the defl ec-tions on an ECG recording depend on how the generated electrical forces are aligned to a set of specifi c reference axes, known as ECG leads, as described in the next section.
ELECTROCARDIOGRAPHIC LEAD REFERENCE SYSTEM
When the fi rst device to produce an ECG was invented over a century ago, the recording was made by dunking the patient’s arms and legs into large buckets of electrolyte solution that were wired to the machine. That process was likely fairly messy and fortunately is no longer necessary. Instead, wire electrodes are placed directly on the skin, held in place by adhesive tabs, on each of the four limbs and on the chest in the standard arrangement shown in Figure 4.3. The right-leg electrode is not used for the measurement but serves as an electrical ground. Table 4.1 lists the standard locations of the chest electrodes.
the left side of the cardiac muscle cell in ourexample begins to repolarize, its surface charge becomes positive once again. An electrical potential is therefore generated and current fl ows from the still negatively charged surface toward the positively charged region. Since this current is directed away from the voltme-ter’s (�) electrode, a downward defl ection is recorded, opposite to that which was observed during the process of depolarization.
Repolarization is a slower process than depolarization, so the inscribed defl ection of repolarization is usually wider and of lower magnitude. Once the cell has returned to the resting state, the surface charges are once again homogeneous and no further electri-cal potential is detected, resulting in a neu-tral fl at line on the voltmeter recording (see Fig. 4.2C).
The depolarization and repolarization of a single cardiac muscle cell have been consid-ered here. As a wave of depolarization spreads through the entire heart, each cell generates electrical forces, and it is the sum of these forces, measured at the skin’s surface, that is recorded by the ECG machine.
It is important to note that in the intact heart the sequence by which regions repolar-ize is actually opposite to that of their depo-larization. This occurs because myocardial action potential durations are more prolonged in cells near the inner endocardium (the fi rst cells stimulated by Purkinje fi bers) than in myocytes near the outer epicardium (the last
BA
V1
V2
V3
V6
V5
V4
Right armelectrode
Left armelectrode
Right legelectrode
Left legelectrode
Chestelectrodes
Figure 4.3. Placement of electrocardiogram (ECG) electrodes. A. Standard posi-tions. B. Close-up view of chest electrode placement, at the standard positions listed in Table 4.1.
77237_ch04.indd 7877237_ch04.indd 78 8/11/10 8:10:17 AM8/11/10 8:10:17 AM

The Electrocardiogram
79
Unipolar Limb Leads
aVRaVF
aVL
Bipolar Limb Leads
(+)
(–)(–)(–) (+)
IIIII
I
(+)(+)
(+)
Figure 4.4. The six limb leads are derived from the electrodes placed on the arms and left leg. Top, Each unipolar lead has a single (�) designated electrode; the (�) pole is an average of the other electrodes. Bottom, Each bipolar lead has specifi c (�) and (�) designated electrodes.
A complete ECG (termed a “12-lead ECG”) is produced by recording electrical activity between the electrodes in specifi c patterns. This results in six reference axes in the body’s frontal plane (termed limb leads) plus six in the transverse plane (termed chest leads). Figure 4.4 demonstrates the orientation of the six limb leads, which are electronically constructed as described in the following paragraphs.
The ECG machine records lead aVR by se-lecting the right-arm electrode as the (�) pole
with respect to the other electrodes. This is known as a unipolar lead, because there is no single (�) pole; rather, the other limb elec-trodes are averaged to create a composite (�) reference. When the instantaneous electrical activity of the heart points in the direction of the right arm, an upward defl ection is re-corded in lead aVR. Conversely, when elec-trical forces are directed away from the right arm, the ECG inscribes a downward defl ection in aVR.
Similarly, lead aVF is recorded by setting the left leg as the (�) pole, such that a positive defl ection is recorded when forces are directed toward the feet. Lead aVL is selected when the left-arm electrode is made the (�) pole and it records an upward defl ection when electrical activity is aimed in that direction.
In addition to these three unipolar leads, three bipolar limb leads are part of thestandard ECG recording (see Fig. 4.4). Bipolarindicates that one limb electrode is the (�) pole and another single electrode provides
Table 4.1. Positions of ECG Chest Electrodes
V1
V2
V3
V4
V5
V6
4th ICS, 2 cm to the right of sternum4th ICS, 2 cm to the left of sternumMidway between V2 and V4
5th ICS, left midclavicular line5th ICS, left anterior axillary line5th ICS, left midaxillary line
ICS, intercostal space.
77237_ch04.indd 7977237_ch04.indd 79 8/11/10 8:10:17 AM8/11/10 8:10:17 AM

Chapter 4
80
the (�) reference. In this case, the ECG ma-chine inscribes an upward defl ection if elec-trical forces are heading toward the (�) electrode and records a downward defl ection if the forces are heading toward the (�) elec-trode. A simple mnemonic to remember theorientation of the bipolar leads is that the lead name indicates the number of l’s in the place-ment sites. For example, lead I connects the left arm to the right arm, lead II connects the right arm to the left leg, and lead III connects the left arm to the left leg. Table 4.2 summa-rizes how the six limb leads are derived.
-90°-60°
-30°
-120°
+30°
0°
+60°+90°
+120°
+150°
+180°
-150°aVR aVL
I
IIIIIaVF
Figure 4.5. The axial reference system is created by combining the six limb leads shown in Figure 4.4. Each lead has a (�) region indicated by the arrowhead and a (�) region indicated by the dashed line.
By overlaying these six limb leads, an axial reference system is established (Fig. 4.5). In the fi gure, each lead is presented with its (�) pole designated by an arrowhead and the (�) aspect by dashed lines. Note that each 30° sector of the circle falls along the (�) or (�) pole of one of the standard six ECG limb leads. Also note that the (�) pole of lead I points to 0° and that, by convention, mea-surement of the angles proceeds clockwise from 0° as �30°, �60°, and so forth. The complete ECG recording provides a simulta-neous “snapshot” of the heart’s electrical ac-tivity, taken from the perspective of each of these lead reference axes.
Figure 4.6 demonstrates how the magni-tude and direction of electrical activity are rep-resented by the ECG recording in each lead. This fi gure should be studied until the follow-ing four points are clear:
1. An electrical force directed toward the (�) pole of a lead results in an upward defl ec-tion on the ECG recording of that lead.
2. Forces that head away from the (�) elec-trode result in a downward defl ection in that lead.
3. The magnitude of the defl ection, either up-ward or downward, refl ects how parallel the electrical force is to the axis of the lead being examined. The more parallel the electrical force is to the lead, the greater the magni-tude of the defl ection.
4. An electrical force directed perpendicular to an electrocardiographic lead does not register any activity by that lead (a fl at line on the recording).
The six standard limb leads examine the electrical forces in the frontal plane of the body. However, because electrical activity travels in three dimensions, recordings from a perpen-dicular plane are also essential (Fig. 4.7A). This is accomplished by the use of the six electrodes placed on the anterior and left lateral aspect of the chest (see Fig. 4.3B), creating the chest (also termed “precordial”) leads. The orienta-tion of these leads around the heart in the cross-sectional plane is shown in Figure 4.7B. These are unipolar leads and, as with the unipolar
Table 4.2. Limb Leads
Lead (�) Electrode (�) Electrode
Bipolar leads
I LA RAII LL RAIII LL LA
Unipolar leads
aVR RA a
aVL LA a
aVF LL a
a(�) Electrode constructed by combining other limb electrodes.
LA, left arm; LL, left leg; RA, right arm.
77237_ch04.indd 8077237_ch04.indd 80 8/11/10 8:10:18 AM8/11/10 8:10:18 AM

The Electrocardiogram
81
A complete ECG prints samples from each of the six limb leads and each of the six chest leads in a standard order, examples of which are presented later in this chapter (seeFigs. 4.28–4.36).
limb leads, electrical forces directed toward these individual (�) electrodes result in an up-ward defl ection on the recording of that lead, and forces heading away record a downward defl ection.
V6
V5
V4
V3V2V1
LV
RV
BA
Figure 4.7. The chest (precordial) leads. A. The cross-sectional plane of the chest. B. Arrangement of the six chest electrodes shown in the cross-sectional plane. Note that the right ventricle is anterior to the left ventricle.
Lead I Lead I
Lead I Lead I
ECG
(–) (+) (–) (+)
(–) (+) (–) (+)
A B
C D
Figure 4.6. Relationship of the magnitude and direction of electrical activity to the ECG lead. A. The electrical vector is oriented parallel to lead I and directed toward the (�) electrode; therefore, a tall upward defl ection is recorded by the lead. B. The vector is still oriented toward the (�) electrode of lead I but not parallel to the lead, so that only a component of the force is recorded. Thus, the recorded defl ection is still upward but of lower amplitude compared with that shown in A. C. The electrical vector is perpendicular to lead I so that no defl ection is generated. D. The vector is directed toward the (�) region of lead I, causing the ECG to record a downward defl ection.
77237_ch04.indd 8177237_ch04.indd 81 8/11/10 8:10:18 AM8/11/10 8:10:18 AM

Chapter 4
82
A
B
AV node
Bundle of His
Left bundlebranch(posteriordivision)
Left bundlebranch(anteriordivision)
Right bundlebranch
SA node1
23
QRS
TP
1 2 3 4
4 4
Figure 4.8. Cardiac conduction pathway. A. The electrical impulse begins at the sinoatrial (SA) node (1) then traverses the atria (2). After a delay at the AV node (3), conduction continues through the bundle of His and into the right and left bundle branches (4). The latter divide into Purkinje fi bers, which stimulate contraction of the myocardial cells. B. Corresponding waveforms on the ECG recording: (1) the SA node discharges (too small to generate any defl ection on ECG), (2) P wave inscribed by depolarization of the atria,(3) delay at the AV node, and (4) depolarization of the ventricles (QRS com-plex). The T wave represents ventricular repolarization.
SEQUENCE OF NORMAL CARDIAC ACTIVATION
Conduction of electrical impulses through the heart is an orderly process. The normal beat begins at the sinoatrial node, located at the junction of the right atrium and the superior vena cava (Fig. 4.8). The wave of depolar-ization spreads rapidly through the right and left atria and then reaches the atrioventricular (AV) node, where it encounters an expected delay. The impulse then travels rapidly through the bundle of His and into the right and left bundle branches. These divide into the Purkinje fi bers, which radiate toward the myocardial fi bers, stimulating them to depo-larize and contract.
Each heartbeat is represented on the ECG by three major defl ections that record the sequence of electrical propagation (see Fig. 4.8B). The P wave represents depolarization of the atria.
Following the P wave, the tracing returns to its baseline as a result of the conduction delay at the AV node. The second defl ection of the ECG, the QRS complex, represents depolariza-tion of the ventricular muscle cells. After the QRS complex, the tracing returns to baseline once again, and after a brief delay, repolariza-tion of the ventricular cells is signaled by theT wave. Occasionally, an additional small defl ection follows the T wave (the U wave), which is believed to represent late phases of ventricular repolarization.
The QRS complex may take one of several shapes but can always be subdivided into in-dividual components (Fig. 4.9). If the fi rst de-fl ection of the QRS complex is downward, it is known as a Q wave. However, if the initial defl ection is upward, then that particular com-plex does not have a Q wave. The R wave is defi ned as the fi rst upward defl ection, whether or not a Q wave is present. Any downward
77237_ch04.indd 8277237_ch04.indd 82 8/11/10 8:10:18 AM8/11/10 8:10:18 AM
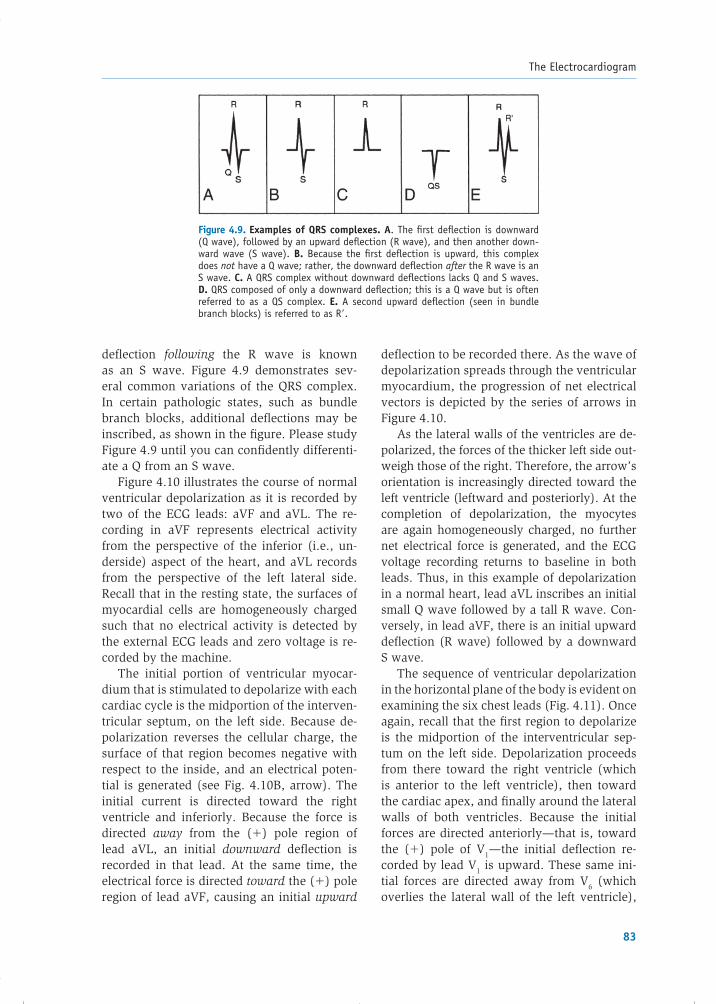
The Electrocardiogram
83
defl ection to be recorded there. As the wave of depolarization spreads through the ventricular myocardium, the progression of net electrical vectors is depicted by the series of arrows in Figure 4.10.
As the lateral walls of the ventricles are de-polarized, the forces of the thicker left side out-weigh those of the right. Therefore, the arrow’s orientation is increasingly directed toward the left ventricle (leftward and posteriorly). At the completion of depolarization, the myocytes are again homogeneously charged, no further net electrical force is generated, and the ECG voltage recording returns to baseline in both leads. Thus, in this example of depolarization in a normal heart, lead aVL inscribes an initial small Q wave followed by a tall R wave. Con-versely, in lead aVF, there is an initial upward defl ection (R wave) followed by a downward S wave.
The sequence of ventricular depolarization in the horizontal plane of the body is evident on examining the six chest leads (Fig. 4.11). Once again, recall that the fi rst region to depolarize is the midportion of the interventricular sep-tum on the left side. Depolarization proceeds from there toward the right ventricle (which is anterior to the left ventricle), then toward the cardiac apex, and fi nally around the lateral walls of both ventricles. Because the initial forces are directed anteriorly—that is, toward the (�) pole of V1—the initial defl ection re-corded by lead V1 is upward. These same ini-tial forces are directed away from V6 (which overlies the lateral wall of the left ventricle),
defl ection following the R wave is known as an S wave. Figure 4.9 demonstrates sev-eral common variations of the QRS complex. In certain pathologic states, such as bundle branch blocks, additional defl ections may be inscribed, as shown in the fi gure. Please study Figure 4.9 until you can confi dently differenti-ate a Q from an S wave.
Figure 4.10 illustrates the course of normal ventricular depolarization as it is recorded by two of the ECG leads: aVF and aVL. The re-cording in aVF represents electrical activity from the perspective of the inferior (i.e., un-derside) aspect of the heart, and aVL records from the perspective of the left lateral side. Recall that in the resting state, the surfaces of myocardial cells are homogeneously charged such that no electrical activity is detected by the external ECG leads and zero voltage is re-corded by the machine.
The initial portion of ventricular myocar-dium that is stimulated to depolarize with each cardiac cycle is the midportion of the interven-tricular septum, on the left side. Because de-polarization reverses the cellular charge, the surface of that region becomes negative with respect to the inside, and an electrical poten-tial is generated (see Fig. 4.10B, arrow). The initial current is directed toward the right ventricle and inferiorly. Because the force is directed away from the (�) pole region of lead aVL, an initial downward defl ection is recorded in that lead. At the same time, the electrical force is directed toward the (�) pole region of lead aVF, causing an initial upward
Figure 4.9. Examples of QRS complexes. A. The fi rst defl ection is downward(Q wave), followed by an upward defl ection (R wave), and then another down-ward wave (S wave). B. Because the fi rst defl ection is upward, this complex does not have a Q wave; rather, the downward defl ection after the R wave is an S wave. C. A QRS complex without downward defl ections lacks Q and S waves. D. QRS composed of only a downward defl ection; this is a Q wave but is often referred to as a QS complex. E. A second upward defl ection (seen in bundle branch blocks) is referred to as R�.
77237_ch04.indd 8377237_ch04.indd 83 8/11/10 8:10:18 AM8/11/10 8:10:18 AM

Chapter 4
84
Left ventricle
A
Rightventricle
++
+
++
+
+
++
+
+
++
+
+
++
++
+
+
+
++
+++
+
+
+
+ +
SeptumaVL
aVF
(+)
(+)
––
–
–
–––
–
– +
+
+
–
–
–
––
–
–
–
–
––
––
–
–
–
–
–
B C
++
aVL
aVF
––
aVL
aVF
D E
aVL
aVF
aVL
aVF
– –
+
++
+
+
+ +
++
+
––
+
+
+
+
+
+
+
++
+
–
–
–
–
–
+
–
–
– –+
+
–
++
++
++
+–
––
–
– +
––
–
––
–
–
+
––
––––
– –
++
+
++
+++
++
–+
– –+–
–+
––
––
––
– –
– –+
++
+
+
+ +
++
+
–
+
+
+
+
+
+
+
++
+
–
–
–
–
–
+
–
–
– –+
+
–
+
++
+
+–
––
–
– +
––
–
––
–
–
+
––
––––
– –
– –
+
+ –
+
–
–
–
–
–
–
Figure 4.10. Normal ventricular depolarization as recorded by leads aVL and aVF. A. In the resting state, the surface is homogeneously charged so that the leads do not record any electrical potential.B. The fi rst area to depolarize is the left side of the ventricular septum. This results in forces heading away from aVL (downward defl ection on aVL recording) but toward the (�) region of aVF, such that an upward defl ection is recorded by that lead. C and D. Depolarization continues; the forces from the thicker-walled left ventricle outweigh those of the right, such that the electrical vector swings leftward and posteriorly toward aVL (upward defl ection) and away from aVF. E. At the completion of depolariza-tion, the surface is again homogeneously charged, and no further electrical forces are recorded.
77237_ch04.indd 8477237_ch04.indd 84 8/11/10 8:10:19 AM8/11/10 8:10:19 AM

The Electrocardiogram
85
AV1
E
V6
BV1
V6
C
V1
V6
D
V1
V6
V1
V6
V5
V4
V3
V2
LV
RV
Figure 4.11. Sequence of depolarization recorded by the chest (precordial) leads. A–D. Depolarization begins at the left side of the septum. The electrical vector then progresses posteriorly toward the thick-walled left ventricle. Thus, V1, which is an anterior lead, records an initial upward defl ection followed by a downward wave, whereas V6, a posterior lead, inscribes the opposite. E. In the normal pattern of the QRS from V1 to V6, the R wave becomes progressively taller and the S wave less deep.
so an initial downward defl ection is recorded there. As the wave of depolarization spreads, the forces of the left ventricle outweigh those of the right, and the vector swings posteriorly toward the bulk of the left ventricular muscle. As the forces swing away from lead V1, the
defl ection there becomes downward, whereas it becomes more upright in lead V6. Leads V2 through V5 record intermediate steps in this process, such that the R wave becomes pro-gressively taller from lead V1 through lead V6 (see Fig. 4.11E), a pattern known as “R wave
77237_ch04.indd 8577237_ch04.indd 85 8/11/10 8:10:19 AM8/11/10 8:10:19 AM

Chapter 4
86
abnormalities. Here is a commonly followed sequence of analysis, followed by a descrip-tion of each:
1. Check voltage calibration
2. Heart rhythm
3. Heart rate
4. Intervals (PR, QRS, QT)
5. Mean QRS axis
6. Abnormalities of the P wave
7. Abnormalities of the QRS (hypertrophy, bundle branch block, infarction)
8. Abnormalities of the ST segment and T wave
Calibration
ECG machines routinely inscribe a 1.0-mV vertical signal at the beginning or end of each 12-lead tracing to document the voltage calibra-tion of the machine. In the normal case, each 1-mm vertical box on the ECG paper represents 0.1 mV, so that the calibration signal records a 10-mm defl ection (e.g., as shown later in Fig. 4.28). However, in patients with markedly
progression.” Typically, the height of the R wave becomes greater than the depth of the S wave in lead V3 or V4; the lead in which this occurs is termed the “transition” lead.
INTERPRETATION OF THE ELECTROCARDIOGRAM
From a technical standpoint, the ECG is re-corded on a special grid divided into lines spaced 1 mm apart in both the horizontal and the vertical directions. Each fi fth line is made heavier to facilitate measurement. On the ver-tical axis, voltage is measured in millivolts (mV), and in the standard case, each 1-mm line separation represents 0.1 mV. The horizontal axis represents time. Because the standard re-cording speed is 25 mm/sec, each 1 mm divi-sion represents 0.04 sec and each heavy line(5 mm) represents 0.2 sec (Fig. 4.12).
Many cardiac disorders alter the ECG re-cording in a diagnostically useful way, and it is important to interpret each tracing in a standard fashion to avoid missing subtle
Paper Speed: 25 mm/sec
PR QT
5 mm = 0.5 mV(1 mm = 0.1 mV)
5 mm = 0.2 sec(1 mm = 1 small box = 0.04 sec)
QRS
Figure 4.12. Enlarged view of an ECG strip. The paper travels through the machine at 25 mm/sec, so that each 1 mm on the horizontal axis represents 0.04 sec. Each 1 mm on the vertical axis represents 0.1 mV. Measurements in this example are as follows: PR interval (from the beginning of the P wave to the beginning of the QRS) � 4 small boxes � 0.16 sec; QRS duration (from the beginning to the end of the QRS complex) � 1.75 small boxes � 0.07 sec; and QT interval (from the beginning of the QRS to the end of the T wave) � 8 small boxes � 0.32 sec. The corrected QT interval � QT ______
�_____
R � R . Because the R�R
interval � 15 small boxes (0.6 sec), the corrected QT interval � 0.32 ____ �___
0.6 � 0.41 sec.
77237_ch04.indd 8677237_ch04.indd 86 8/11/10 8:10:19 AM8/11/10 8:10:19 AM

The Electrocardiogram
87
which corresponds to the heart rate in beats per minute, as illustrated in Figure 4.13 (Method 2).
When the rhythm is irregular, the heart rate may be approximated by counting the number of complexes during 6 sec of the re-cording and multiplying that number by 10. ECG paper often has time markers, spaced 3 sec apart, printed at the top or bottom of the tracing that facilitates this measurement (see Fig. 4.13, Method 3).
Intervals (PR, QRS, QT)
The PR interval, QRS interval, and QT interval are measured as demonstrated in Figure 4.12. For each of these, it is appropriate to take the measurement in the lead in which the inter-val is the longest in duration (the intervals can vary a bit in each lead). The PR interval is measured from the onset of the P wave to the onset of the QRS. The QRS interval is mea-sured from the beginning to the end of the QRS complex. The QT interval is measured from the beginning of the QRS to the end of the T wave. The normal ranges of the intervals are listed in Table 4.3, along with conditions associated with abnormal values.
Because the QT interval varies with heart rate (the faster the heart rate, the shorter the QT), the corrected QT interval is determined by dividing the measured QT by the square root of the R�R interval (see Fig. 4.12). When the heart rate is in the normal range (60 to 100 bpm), a rapid visual rule can be applied: if the QT interval is less than half the interval between two consecutive QRS complexes, then the QT interval is within the normal range.
Mean QRS Axis
The mean QRS axis represents the average of the instantaneous electrical forces generated during the sequence of ventricular depolar-ization as measured in the frontal plane. The normal value is between �30° and �90° (Fig. 4.14). A mean axis that is more negative than �30° implies left axis deviation, whereas an axis greater than �90° represents right axis deviation. The mean axis can be determined precisely by plotting the QRS complexes of
increased voltage of the QRS complex (e.g., some patients with left ventricular hypertrophy or bundle branch blocks), the very large defl ec-tions do not fi t on the standard tracing. To facil-itate interpretation in such a case, the recording is often purposely made at half the standard voltage (i.e., each 1-mm box � 0.2 mV), and this is indicated on the ECG tracing by a change in the height of the 1.0-mV calibration signal (at half the standard voltage, the signal would be 5 mm tall). It is important to check the height of the calibration signal on each ECG to ensure that the voltage criteria used to defi ne specifi c abnormalities are applicable.
Heart Rhythm
The normal cardiac rhythm, initiated by depo-larization of the sinus node, is known as sinus rhythm and is present if (1) every P wave is followed by a QRS; (2) every QRS is preceded by a P wave; (3) the P wave is upright in leads I, II, and III; and (4) the PR interval is greater than 0.12 sec (3 small boxes). If the heart rate in sinus rhythm is between 60 and 100 bpm, then normal sinus rhythm is present. If less than 60 bpm, the rhythm is sinus bradycardia; if greater than 100 bpm, the rhythm is sinus tachycardia. Other abnormal rhythms (termed arrhythmias or dysrhythmias) are described in Chapters 11 and 12.
Heart Rate
The standard ECG paper speed is 25 mm/sec. Therefore,
Heart rate �
25 mm/sec � 60 sec/min ___________________________ Number of mm between beats (bpm)
or more simply, as shown in Figure 4.13:
Heart rate �
1,500 _____________________________ Number of small boxes between
(bpm) two consecutive beats
It is rarely necessary, however, to deter-mine the exact heart rate, and a more rapid determination can be made with just a bit of memorization. Simply “count off” the number of large boxes between two consecutive QRS complexes, using the sequence
300—150—100—75—60—50
77237_ch04.indd 8777237_ch04.indd 87 8/11/10 8:10:19 AM8/11/10 8:10:19 AM

Chapter 4
88
ECG recording paper often indicates 3-sec time markers at the top or bottom of the tracing:
Method 3
3 secmarker marker
Starthere
300 100 6075
Then use this sequence to count the number of large boxes between twoconsecutive beats:
The “count-off” method requires memorizing the sequence:
300—150—100—75—60—50
Method 2
50
The second QRS falls between 75 and 60 bpm; therefore, theheart rate is approximately midway between them ~67 bpm. Knowingthat the heart rate is approximately 60–70 bpm is certainly close enough.
Method 1
23 mm between beats
First, count the number of small boxes (1 mm each) between two adjacent QRS complexes (i.e., between 2 “beats”). Then, since the standard paper speed is 25 mm/sec:
65 bpm1,50023
In this example, there are 23 mm between the first 2 beats.
Heart Rate(beats/min) Number of mm between beats
1,500number of mm between beats
Figure 4.13. Methods to calculate heart rate.
77237_ch04.indd 8877237_ch04.indd 88 8/11/10 8:10:19 AM8/11/10 8:10:19 AM

The Electrocardiogram
89
Table 4.3. Electrocardiographic Intervals
Interval Normal Decreased Interval Increased Interval
PR 0.12–0.20 sec(3–5 small boxes)
• Preexcitation syndrome• Junctional rhythm
• First-degree AV block
QRS �0.10 sec(�2.5 small boxes)
• Bundle branch blocks• Ventricular ectopic beat• Toxic drug effect (e.g., cer-
tain antiarrhythmic drugs—see Chapter 17)
• Severe hyperkalemia
QT Corrected QTa �0.44 sec • Hypercalcemia• Tachycardia
• Hypocalcemia• Hypokalemia (↑ QU interval
owing to ↑ U wave)• Hypomagnesemia• Myocardial ischemia• Congenital prolongation
of QT• Toxic drug effect (e.g., cer-
tain antiarrhythmic drugs—see Chapter 17)
aCorrected QT � QT _______ �______
R � R .
Left axis deviation
Right axis deviation
Left axis deviation• Inferior wall myocardial infarction• Left anterior fascicular block• Left ventricular hypertrophy (sometimes)
Right axis deviation• Right ventricular hypertrophy • Acute right heart strain (e.g., massive pulmonary embolism)• Left posterior fascicular block
-90°-60°
-30°
-120°
+30°
0°
+60°+90°
+120°
+150°
+180°
-150°aVR aVL
I
IIIIIaVF
Figure 4.14. A normal mean QRS axis falls within the shaded area (between �30° and �90°).A mean axis more negative than �30° is termed left axis deviation, whereas an axis more positive than �90° is right axis deviation. The fi gure shows common conditions that result in axis deviation.
different leads on the axial reference diagram for the limb leads (see Fig. 4.5), but this is te-dious and is rarely necessary. The following rapid approach to axis determination generally provides suffi cient accuracy.
First, recall from Figure 4.5 that each ECG lead has a (�) region and a (�) region. Elec-trical activity directed toward the (�) half re-sults in an upward defl ection, whereas activity toward the (�) half results in a downward
77237_ch04.indd 8977237_ch04.indd 89 8/11/10 8:10:19 AM8/11/10 8:10:19 AM

Chapter 4
90
that some other books recommend examining leads I and aVF, rather than leads I and II, to determine whether the mean axis falls in the normal range. However, using leads I and aVF for this purpose would erroneously classify a mean axis between 0° and �30° as beingabnormal.
In order to determine the mean axis with greater precision when necessary, fi rst con-sider the special example in Figure 4.16. The sequence of a ventricular depolariza-tion is represented in this fi gure by vectors a through e, along with the corresponding defl ections on the ECG recording of lead I.
defl ection on the ECG recording of that lead. To determine whether the axis is normal or abnor-mal, examine the QRS complexes in limb leads I and II. As illustrated in Figure 4.15, if the QRS is primarily positive in both of these leads (i.e., the upward defl ection is greater than the downward defl ection in each of them), then the mean vector falls within the normal range and no further calculation is necessary. How-ever, if the QRS in either lead I or II is not pri-marily upward, then the axis is abnormal, and the approximate axis should then be deter-mined by the more precise method described in the following paragraphs. Please be aware
–90
+90
0I
+150
+60
–30
–30
+90
If the QRS is predominantly upright in both leads I and II, then the mean axis must fall within their common “+” regions: between –30 and +90.
If the QRS complex is mainly upward in limb lead I, then the mean axis falls within the “+” region of that lead, shown as the shaded half of the circle below.
Similarly, if the QRS is predominantly upward in limb lead II, then the mean axis falls within the “+” half of lead II, shown as the shaded half here:
NormalAxis
– +
–90
+90
0
+150
II
–
+
Figure 4.15. The mean axis is within the normal range if the QRS complex is predominantly upright in limb leads I and II.
77237_ch04.indd 9077237_ch04.indd 90 8/11/10 8:10:20 AM8/11/10 8:10:20 AM

The Electrocardiogram
91
The initial defl ection (representing left septal depolarization) points to the patient’s right side. Because it is directed completely away from the (�) pole of lead I, a strong down-ward defl ection is recorded by the lead. As depolarization continues, the arrow swings downward and to the left, resulting in less negative defl ections in lead I. After arrow c, the electrical vector swings into the positive region of lead I, so that upward defl ections are recorded.
In this special example, in which electri-cal forces begin exactly opposite lead I’s (�) electrode and terminate when pointed di-rectly at that electrode, note that the mean electrical vector points straight downward (in the direction of arrow c), perpendicular to the lead I axis. Also note the confi gura-tion of the inscribed QRS complex in lead I. There is a downward defl ection, followed by an upward defl ection of equal magnitude (when the upward and downward defl ec-tions of a QRS are of equal magnitude, it is termed an isoelectric complex). Thus, when an ECG limb lead inscribes an isoelectric QRS complex, it indicates that the mean electrical axis of the ventricles is perpendicular to that particular lead.
Therefore, an easy way to determine the mean QRS axis is to glance at the six limb lead recordings and observe which one has the most isoelectric-appearing complex: the mean
axis is simply perpendicular to it. One step re-mains. When the mean axis is perpendicular to a lead, it could be perpendicular in either a clockwise or a counterclockwise direction. In the example of Figure 4.16, the isoelectric complex appears in lead I, such that the mean vector could be at �90° or it could be at �90°, because both are perpendicular. To determine which of these is correct requires inspecting the recording of the ECG lead that is perpen-dicular to the one inscribing the isoelectric complex (and is therefore parallel to the mean axis). If the QRS is predominantly upright in that perpendicular lead, then the mean vector points toward the (�) pole of that lead. If it is predominantly negative, then it points away from the lead’s (�) pole. In the example, the isoelectric complex appears in lead I; therefore, the next step is to inspect the perpendicular lead, which is aVF (see Fig. 4.5 if this relation-ship is not clear). Because the QRS complex in aVF is primarily upward, the mean axis points toward its (�) pole, which is in fact located at �90°.
To summarize, the mean QRS axis is calcu-lated as follows:
1. Inspect limb leads I and II. If the QRS is primarily upward in both, then the axis is normal and you are done. If not, then pro-ceed to the next step.
2. Inspect the six limb leads and determine which one contains the QRS that is most isoelectric. The mean axis is perpendicular to that lead.
3. Inspect the lead that is perpendicular to the lead containing the isoelectric complex. If the QRS in that perpendicular lead is pri-marily upward, then the mean axis points to the (�) pole of that lead. If primarily negative, then the mean QRS points to the (�) pole of that lead.
Conditions that result in left or right axis de-viation are listed in Figure 4.14. In addition, the vertical position of the heart in many normal children and adolescents may result in a mean axis that is slightly rightward (��90°).
In some patients, isoelectric complexes are inscribed in all the limb leads. That situation arises when the heart is tilted, so that the mean
Figure 4.16. Sequence of ventricular depolarization when the mean axis is �90°. Because the mean axis is perpendicular to limb lead I, an isoelectric QRS complex (height of upward defl ection � height of downward defl ec-tion) is recorded by that lead (see text for details).
Lead aVF
Lead I
a bbc
c
ed
d
Meanaxis
a e (+)(–)
(+)
77237_ch04.indd 9177237_ch04.indd 91 8/11/10 8:10:20 AM8/11/10 8:10:20 AM

Chapter 4
92
Abnormalities of the QRS Complex
Ventricular Hypertrophy
Hypertrophy of the left or right ventricle causes the affected chamber to generate greater-than-normal electrical activity. Ordinarily, the thicker-walled left ventricle produces forces that are more prominent than those of the right. However, in right ventricularhypertrophy, the augmented right-sided forces may outweigh those of the left. There-fore, chest leads V1 and V2, which overlie the right ventricle, record greater-than-normal up-ward defl ections: the R wave becomes taller than the S wave in those leads, the opposite of the normal situation (Fig. 4.18). In addition, the increased right ventricular mass shifts the mean axis of the heart, resulting in right axis deviation (mean axis ��90°).
In left ventricular hypertrophy, greater-than-normal forces are generated by that cham-ber, which simply exaggerates the normal situation. Leads that directly overlie the left ventricle (chest leads V5 and V6 and limb leads I and aVL) show taller-than-normal R waves. Leads on the other side of the heart (V1 and V2) demonstrate the opposite: deeper-than-normal
QRS points straight forward or back from the frontal plane, as it may be in patients with chronic obstructive lung disease; in such a case, the mean axis is said to be indeterminate.
Abnormalities of the P Wave
The P wave represents depolarization of the right atrium followed quickly by the depo-larization of the left atrium; the two com-ponents are nearly superimposed on one another (Fig. 4.17). The P wave is usually best visualized in lead II, the lead that is most parallel to the fl ow of electrical current through the atria from the sinoatrial to the AV node. When the right atrium is enlarged, the initial component of the P wave is larger than normal (the P is taller than 2.5 mm in lead II).
Left atrial enlargement is best observed in lead V1. Normally, V1 inscribes a P wave with an initial positive defl ection refl ecting right atrial depolarization (directed anteriorly), followed by a negative defl ection, owing to the left atrial forces oriented posteriorly (see Fig. 1.2 for ana-tomic relationships). Left atrial enlargement is therefore manifested by a greater-than-normal negative defl ection (at least 1 mm wide and 1 mm deep) in lead V1 (see Fig. 4.17).
Lead II Lead V1
Normal
RA enlargement(P height > 2.5 mm
in lead II)
LA enlargement(Negative P in V1 > 1 mm wide and
> 1 mm deep)
RA
LA
Com-bined
RA LA
LA
RA
RA RA
LA
LA
Figure 4.17. The P wave represents superimposition of right atrial (RA) and left atrial (LA) depolarization. RA depolarization occurs slightly earlier than LA depolarization. In RA enlargement, the initial component of the P wave is prominent (�2.5 mm tall) in lead II. In LA enlargement, there is a large terminal downward defl ection in lead V1 (�1 mm wide and �1 mm deep).
77237_ch04.indd 9277237_ch04.indd 92 8/11/10 8:10:20 AM8/11/10 8:10:20 AM

The Electrocardiogram
93
S waves. Many criteria have been proposed for the diagnosis of left ventricular hypertrophy by ECG. Three of the most helpful criteria are listed in Figure 4.18.
Bundle Branch Blocks
Interruption of conduction through the right or left bundle branches may develop from ischemic or degenerative damage. As a re-sult, the affected ventricle does not depo-larize in the normal sequence. Rather than rapid uniform stimulation by the Purkinje fibers, the cells of that ventricle must rely on relatively slow myocyte-to-myocyte spread of electrical activity traveling from the unaffected ventricle. This delayed pro-
cess prolongs depolarization and widens the QRS complex. A normal QRS durationis �0.10 sec (�2.5 small boxes). When a bundle branch block widens the QRS dura-tion to 0.10–0.12 sec (2.5–3.0 small boxes), an incomplete bundle branch block is pres-ent. If the QRS duration is greater than 0.12 sec (3.0 small boxes), complete bundle branch block is identified.
In right bundle branch block (RBBB)(Fig. 4.19; see also Fig. 4.29), normal depolar-ization of the right ventricle is interrupted. In this case, initial depolarization of the ventricu-lar septum (which is stimulated by a branch of the left bundle) is unaffected so that the normal small R wave in lead V1 and small Q wave in lead V6 are recorded. As the wave of depolarization
RIGHT VENTRICULAR HYPERTROPHY
• R > S in lead V1
• Right axis deviation
LEFT VENTRICULAR HYPERTROPHY
• S in V1 plus
R in V5 or V6 ≥ 35 mm or
• R in aVL > 11 mm or
• R in lead I > 15 mm
V6
V6
V1
V1
A
B
LVRV
4
3
2
3
21
1
Figure 4.18. Ventricular hypertrophy. The arrows indicate the sequence of average electrical forces during ventricular depolarization. A. Right ventricular (RV) hypertrophy. The RV forces outweigh those of the left, resulting in tall R waves in leads V1 and V2 and a deep S wave in lead V6. B. Left ventricular (LV) hypertrophy exaggerates the normal pattern of depolarization, with greater-than-normal forces directed toward the LV, resulting in a tall R wave in V6 and a deep S wave in lead V1.
77237_ch04.indd 9377237_ch04.indd 93 8/11/10 8:10:20 AM8/11/10 8:10:20 AM

Chapter 4
94
RightBundle Branch Block
LeftBundle Branch Block
• Widened QRS• RSR' in V1 (”rabbit ears”)• Prominent S in V6
• Widened QRS• Broad, notched R in V6• Absent R and prominent S in V1
1
2
3
V1
V6
V1
V6
V1
V6
V1
V6
LV
RV
V1
V6
V1
V6
A B
Figure 4.19. Bundle branch blocks. Interruption of conduction through the right or left bundles results in delayed, slowed activation of the respective ventricle and wid-ening of the QRS complex. In right bundle branch block, normal initial activation of the septum (1) is followed by depolarization of the left ventricle (2). Slow cell-to-cell spread activates the right ventricle (RV) after the left ventricle (LV) has nearly fully depolarized, so that the late forces generated by the RV are unopposed. Therefore, V1 records an abnormal terminal upward defl ection (R�), and V6 records an abnormal, terminal deep S wave (3). In left bundle branch block, the initial septal depolariza-tion is blocked, such that initial forces are oriented from right to left. Thus, the normal initial R wave in V1 and Q wave in V6 are absent (1). After the RV depolarizes (2), late, slow activation of the LV results in a terminal upward defl ection in V6 and downward defl ection in V1 (3).
77237_ch04.indd 9477237_ch04.indd 94 8/11/10 8:10:20 AM8/11/10 8:10:20 AM

The Electrocardiogram
95
bundle branch, impairment can also occur in just one of the two fascicles, resulting in left anterior or left posterior fascicular blocks (also termed hemiblocks). The main signifi -cance of fascicular blocks in ECG interpreta-tion is that they can markedly alter the mean ECG axis.
Anatomically, the anterior fascicle of the left bundle runs along the front of the left ventricle toward the anterior papillary muscle (which is located in the anterior and superior portion of the chamber), whereas the posterior fascicle travels to the poste-rior papillary muscle (which is located in the posterior, inferior, and medial aspect of the left ventricle). Under normal condi-tions, conduction via the left anterior and left posterior fascicles proceeds simultane-ously, such that electrical activation of the left ventricle is uniform, spreading outward from the bases of the two papillary muscles. However, if conduction is blocked in one of the two divisions, then initial LV depolariza-tion arises exclusively from the unaffected fascicle (Fig. 4.20).
In the case of left anterior fascicular block (LAFB), left ventricular activation begins via the left posterior fascicle alone, at the poste-rior papillary muscle, and then spreads to the rest of the ventricle. Because the left posterior fascicle fi rst activates the posterior, inferior, medial region of the left ventricle, the initial impulses are directed downward (i.e., toward the feet) and toward the patient’s right side (see Fig. 4.20). This results in a positive de-fl ection (initial small R wave) in the inferior leads (leads II, III, and aVF) and a negative de-fl ection (small Q wave) in the left lateral leads, I and aVL. As depolarization then spreads up-ward and to the left, toward the “blocked” anterior, superior, and lateral regions of the left ventricle, a positive defl ection (R wave) is inscribed in leads I and aVL, while a nega-tive defl ection (S wave) develops in the infe-rior leads. The predominance of these leftward forces, resulting from the abnormal activation of the anterior superior left ventricular wall, results in left axis deviation (generally more negative than �45°). A complete 12-lead ECG demonstrating the pattern of LAFB is shown later (see Fig. 4.34).
spreads down the septum and into the left ven-tricular free wall, the sequence of depolarization is indistinguishable from normal, because left ventricular forces normally outweigh those of the right. However, by the time the left ventricle has almost fully depolarized, slow cell-to-cell spread has fi nally reached the “blocked” right ventricle and depolarization of that chamber begins, unopposed by left ventricular activity (because that chamber has nearly fully depo-larized). This prolonged depolarization process widens the QRS complex and produces a late de-polarization current in the direction of the ante-riorly situated right ventricle. Since the terminal portion of the QRS complex in RBBB represents these right ventricular forces acting alone, the ECG records an abnormal terminal upwarddefl ection (known as R� wave) over the right ventricle in lead V1 and a downward defl ec-tion (S wave) in V6 on the opposite side of the heart. The appearance of the QRS complex in lead V1 in RBBB (upward R, downward S, then upward R�) is often described as having the appearance of “rabbit ears.”
Left bundle branch block (LBBB) produces even more prominent QRS abnormalities. In this situation, normal initial depolarization of the left septum does not occur; rather, the right side of the ventricular septum is fi rst to depolarize, through branches of the right bundle. Thus, the initial forces of depolar-ization are directed toward the left ventricleinstead of the right (see Fig. 4.19; see also Fig. 4.30). Therefore, an initial downward de-fl ection is recorded in V1 and the normal small Q wave in V6 is absent. Only after depolariza-tion of the right ventricle does slow cell-to-cell spread reach the left ventricular myocytes. These slowly conducted forces inscribe a wid-ened QRS complex with abnormal terminally upward defl ections in the leads overlying the left ventricle (e.g., V5 and V6), as shown in Figure 4.19.
Fascicular Blocks
Recall from Chapter 1 that the left bundle branch subdivides into two main divisions, termed fascicles: the left anterior fascicle and left posterior fascicle. Although LBBB implies that conduction is blocked in the entire left
77237_ch04.indd 9577237_ch04.indd 95 8/11/10 8:10:20 AM8/11/10 8:10:20 AM

Chapter 4
96
Left Anterior Fascicular Block Left Posterior Fascicular Block
L
X
X
• Left axis deviation• Small Q in leads aVL and I• Small R in inferior leads (II, III, aVF)
1
2
3
• Right axis deviation• Small R in leads aVL and I• Small Q in inferior leads (II, III, aVF)
PV
AMV
aVL
aVF
aVL
aVF
aVL
aVF
aVL
aVF
aVL
aVF
aVL
aVF
Figure 4.20. Left anterior and left posterior fascicular blocks and their patterns in the ECG limb leads. The schematic at the top of the fi gure shows the left ventricle (LV) in the frontal plane. The mitral valve (MV) chordae tendineae insert into the anterior (A) and posterior (P) papillary muscles, which are important landmarks: the anterior fascicle of the left bundle branch courses toward the anterior papillary muscle, whereas the posterior fascicle travels to the posterior papillary muscle (the fascicles are not shown). Notice that the anterior papillary muscle is superior to the posterior papillary muscle. Left side of fi gure: In left anterior fascicular block, activation begins solely in the region of the posterior papillary muscle (1) because initial conduction to the anterior papillary muscle is blocked (denoted by the X ). As a result, the initial forces of depolarization are directed downward toward the feet, producing an initial positive defl ection (R wave) in lead aVF and a negative defl ection (Q wave) in lead aVL. As the wave of depolarization spreads toward the left side and superiorly, aVF begins to register a negative defl ection and aVL starts to record a positive defl ection (2). Panel 3 shows the complete QRS complexes at the end of depolarization. Right side of fi gure: In left posterior fascicular block (denoted by the X ), LV activation begins solely in the region of the anterior papillary muscle (1). Thus, the initial forces are directed upward and toward the patient’s left side, producing an initial R wave in aVL and a Q wave in aVF. Panels 2 and 3 show how the spread of depolarization travels in the direction opposite that of LAFB.
77237_ch04.indd 9677237_ch04.indd 96 8/11/10 8:10:20 AM8/11/10 8:10:20 AM

The Electrocardiogram
97
described in the next section. Unless reperfu-sion of the occluded artery is quickly achieved, irreversible necrosis of the heart muscle served by that vessel ensues and is marked by the for-mation of pathologic Q waves on the electro-cardiographic QRS complex.
Recall that it is normal for small initialQ waves to appear in some ECG leads. For ex-ample, initial septal depolarization routinely inscribes small Q waves in leads V6 and aVL. Such physiologic Q waves are of short duration (�0.04 sec, or 1 small box) and of low magni-tude (�25% of the QRS total height). In distinc-tion, pathologic Q waves are more prominent (Fig. 4.21), having a width �1 small box in dura-tion and a depth �25% of the total height of the QRS. The ECG lead groupings in which patho-logic Q waves appear refl ect the anatomic site of the infarction (Table 4.4; also see Fig. 4.23).
Pathologic Q waves develop in the leads overlying infarcted tissue because necrotic mus-cle does not generate electrical forces. Rather, the ECG electrode over that region detects
Left posterior fascicular block (LPFB) is less common than LAFB. In LPFB, ventricular activation begins via the left anterior fascicle at the base of the anterior papillary muscle (see Fig. 4.20). As that anterosuperior left ventricular region depolarizes, the initial forces are directed upward and to the patient’s left (creating a posi-tive R wave in leads I and aVL and a negative Q wave in the inferior leads). As the impulse then spreads downward and to the right toward the initially blocked region, an S wave is inscribed in leads I and aVL, while an R wave is recorded in leads II, III, and aVF. Because the bulk of these delayed forces head toward the patient’s right side, right axis deviation of the QRS mean axis occurs (see Fig. 4.36).
In contrast to RBBBs and LBBBs, LAFB and LPFB do not result in signifi cant widening of the QRS because rapidly conducting Purkinje fi bers bridge the territories served by the ante-rior and posterior fascicles. Therefore, although the sequence of conduction is altered, the total time required for depolarization is usually only slightly prolonged. Also note that although LBBBs and RBBBs are most easily recognized by analyzing the patterns of depolarization in the precordial (chest) leads, in the case of LAFB and LPFB, it is the recordings in the limb leads (as in Fig. 4.20) that are most helpful.
Pathologic Q waves in Myocardial Infarction
As you will learn in Chapter 7, sudden occlu-sion of a coronary artery typically results in a syndrome known as acute ST segment eleva-tion myocardial infarction. When this occurs, a sequence of abnormalities of the ST segment and T wave evolves over a period of hours, as
A
B
Normal Q Waves
Pathologic Q Waves
Figure 4.21. Normal versus pathologic Q waves. Com-pared with the small Q waves generated during normal depolarization (A), pathologic Q waves are more prominent with a width �1 mm (1 small box) and depth �25% of the height of the QRS complex (B).
Table 4.4. Localization of Myocardial Infarction
Anatomic Site Leads with Abnormal ECG Complexesa Coronary Artery Most Often Responsible
Inferior II, III, aVF RCAAnteroseptal V1–V2 LADAnteroapical V3–V4 LAD (distal)Anterolateral V5–V6, I, aVL CFXPosterior V1–V2 (tall R wave, not Q wave) RCA
aPathologic Q waves in all of leads V1–V6 implies an “extensive anterior MI” usually associated with a proximal left coronary artery occlusion.
CFX, left circumfl ex coronary artery; LAD, left anterior descending coronary artery; RCA, right coronary artery.
77237_ch04.indd 9777237_ch04.indd 97 8/11/10 5:47:34 PM8/11/10 5:47:34 PM

Chapter 4
98
electrical currents from the healthy tissue on op-posite regions of the ventricle, which are directed away from the infarct and the recording elec-trode, thus inscribing the downward defl ection(Fig. 4.22). Q waves are permanent evidence of an ST-elevation type of myocardial infarction; only rarely do they disappear over time.
Notice in Table 4.4 that in the case of a posterior wall myocardial infarction (seeFig. 4.23A), it is not pathologic Q waves that are evident on the ECG. Because standard elec-trodes are not typically placed on the patient’s back overlying the posterior wall, other leads must be relied on to indirectly identify the pres-ence of such an infarction. Chest leads V1 and V2, which are directly opposite the posterior wall, record the inverse of what leads placedon the back would demonstrate. Therefore, taller-than-normal R waves in leads V1 and V2 are the equivalent of pathologic Q waves in the diagnosis of a posterior wall MI. It may be recalled that right ventricular hypertrophy (RVH) also produces tall R waves in leads V1 and V2. These conditions can be distinguished, however, as RVH causes right axis deviation, which is not a feature of posterior wall MI.
It is important to note that if a Q wave appears in only a single ECG lead, it is not diagnostic of an infarction. True pathologic Q waves should appear in the groupings listed in Table 4.4 and Figure 4.23. For example, if a pathologic Q wave is present in lead III but not in II or aVF, it likely does not indicate an in-farction. Also, Q waves are disregarded in lead aVR because electrical forces are normally di-rected away from the right arm. Finally, in the presence of LBBB, Q waves are usually not helpful in the diagnosis of MI because of the markedly abnormal pattern of depolarization in that condition.
ST Segment and T Wave Abnormalities
Transient Myocardial Ischemia
Among the most important abnormalities of the ST segments and T waves are those re-lated to coronary artery disease. Because ventricular repolarization is very sensitive to myocardial perfusion, reversible deviations
aVLLV
RV1
aVL
2
aVL
3
aVL
4
PathologicQ wave
Figure 4.22. Sequence of depolarization recorded by lead aVL, overlying a lateral wall infarction (dark gray region). A pathologic Q wave is recorded because the ne-crotic muscle does not generate electrical forces; rather, at the time when the lateral wall should be depolarizing (panel 3), the activation of the healthy muscle on the op-posite side of the heart is unopposed, such that net forces are directed away from aVL. The terminal R wave recorded by aVL refl ects depolarization of the remaining viable myo-cardium beyond the infarct.
77237_ch04.indd 9877237_ch04.indd 98 8/11/10 8:10:21 AM8/11/10 8:10:21 AM

The Electrocardiogram
99
Anterior(V1–V6)
Anterolateral(V5–V6, I, aVL)
Anteroseptal(V1–V2)
Posterior(Tall R inV1–V2)
Inferior(II, III, aVF)Anteroapical
(V3–V4)
Anteroseptal
Anterolateral Inferior
Anteroapical
A
B
I aVR V1 V4
II aVL V2 V5
III aVF V3 V6
I aVR V1 V4
II aVL V2 V5
III aVF V3 V6
I aVR V1 V4
II aVL V2 V5
III aVF V3 V6
I aVR V1 V4
II aVL V2 V5
III aVF V3 V6
Figure 4.23. Relationship between ECG leads and cardiac anatomic regions. A. The lead groupings listed in parentheses represent each region. B. Miniaturized 12-lead ECG schematic drawings showing the standard orientation of printed samples from each lead. The major anatomic groupings are shaded and labeled in each drawing. While the presence of pathologic Q waves in leads V1 and V2 are indicative of anteroseptal infarction, be aware that tall initial R waves in those leads can indicate a posterior wall infarction, as described in the text.
of the ST segments and T waves (usually de-pression of the ST segment and/or inversion of the T wave) are common during transient episodes of myocardial ischemia, as will be explained in Chapter 6.
Acute ST Segment Elevation MI
As described in the previous section, pathologic Q waves are associated with one type of myo-cardial infarction (ST segment elevation myocar-dial infarction [STEMI]) but do not differentiate between an acute event and an MI that occurred weeks or years earlier. However, an acute STEMI
results in a temporal sequence of ST and T wave abnormalities that permits this distinction(Fig. 4.24). The initial abnormality is elevation of the ST segment, often with a peaked appear-ance of the T wave. At this early stage, myocar-dial cells are still viable and Q waves have not yet developed. In patients who achieve success-ful acute coronary reperfusion (by fi brinolytic therapy or percutaneous coronary intervention, as described in Chapter 7), the ST segments re-turn to baseline and the sequence of changes described in the next paragraph do not occur.
In patients who do not achieve successful acute reperfusion, within several hours myocyte
77237_ch04.indd 9977237_ch04.indd 99 8/11/10 8:10:21 AM8/11/10 8:10:21 AM
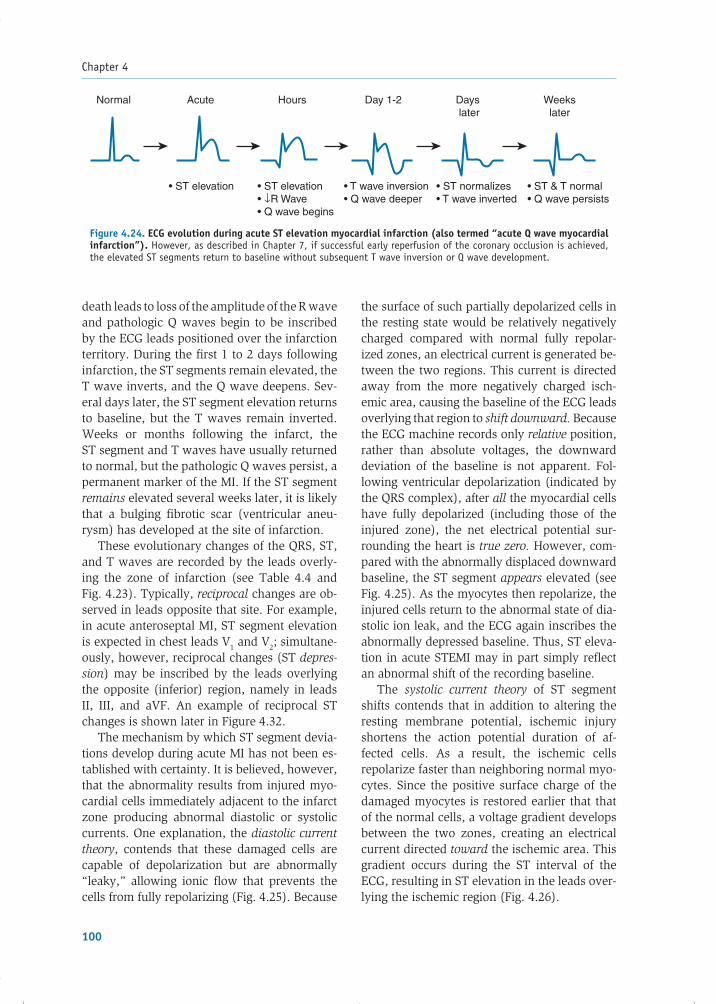
Chapter 4
100
the surface of such partially depolarized cells in the resting state would be relatively negatively charged compared with normal fully repolar-ized zones, an electrical current is generated be-tween the two regions. This current is directed away from the more negatively charged isch-emic area, causing the baseline of the ECG leads overlying that region to shift downward. Because the ECG machine records only relative position, rather than absolute voltages, the downward deviation of the baseline is not apparent. Fol-lowing ventricular depolarization (indicated by the QRS complex), after all the myocardial cells have fully depolarized (including those of the injured zone), the net electrical potential sur-rounding the heart is true zero. However, com-pared with the abnormally displaced downward baseline, the ST segment appears elevated (see Fig. 4.25). As the myocytes then repolarize, the injured cells return to the abnormal state of dia-stolic ion leak, and the ECG again inscribes the abnormally depressed baseline. Thus, ST eleva-tion in acute STEMI may in part simply refl ect an abnormal shift of the recording baseline.
The systolic current theory of ST segment shifts contends that in addition to altering the resting membrane potential, ischemic injury shortens the action potential duration of af-fected cells. As a result, the ischemic cells repolarize faster than neighboring normal myo-cytes. Since the positive surface charge of the damaged myocytes is restored earlier that that of the normal cells, a voltage gradient develops between the two zones, creating an electrical current directed toward the ischemic area. This gradient occurs during the ST interval of the ECG, resulting in ST elevation in the leads over-lying the ischemic region (Fig. 4.26).
death leads to loss of the amplitude of the R wave and pathologic Q waves begin to be inscribed by the ECG leads positioned over the infarction territory. During the fi rst 1 to 2 days following infarction, the ST segments remain elevated, the T wave inverts, and the Q wave deepens. Sev-eral days later, the ST segment elevation returns to baseline, but the T waves remain inverted. Weeks or months following the infarct, theST segment and T waves have usually returned to normal, but the pathologic Q waves persist, a permanent marker of the MI. If the ST segment remains elevated several weeks later, it is likely that a bulging fi brotic scar (ventricular aneu-rysm) has developed at the site of infarction.
These evolutionary changes of the QRS, ST, and T waves are recorded by the leads overly-ing the zone of infarction (see Table 4.4 and Fig. 4.23). Typically, reciprocal changes are ob-served in leads opposite that site. For example, in acute anteroseptal MI, ST segment elevation is expected in chest leads V1 and V2; simultane-ously, however, reciprocal changes (ST depres-sion) may be inscribed by the leads overlying the opposite (inferior) region, namely in leads II, III, and aVF. An example of reciprocal ST changes is shown later in Figure 4.32.
The mechanism by which ST segment devia-tions develop during acute MI has not been es-tablished with certainty. It is believed, however, that the abnormality results from injured myo-cardial cells immediately adjacent to the infarct zone producing abnormal diastolic or systolic currents. One explanation, the diastolic current theory, contends that these damaged cells are capable of depolarization but are abnormally “leaky,” allowing ionic fl ow that prevents the cells from fully repolarizing (Fig. 4.25). Because
Normal Acute
• ST elevation • ST elevation• ↓R Wave• Q wave begins
• T wave inversion• Q wave deeper
• ST & T normal• Q wave persists
• ST normalizes• T wave inverted
Hours Day 1-2 Days later
Weekslater
Figure 4.24. ECG evolution during acute ST elevation myocardial infarction (also termed “acute Q wave myocardial infarction”). However, as described in Chapter 7, if successful early reperfusion of the coronary occlusion is achieved, the elevated ST segments return to baseline without subsequent T wave inversion or Q wave development.
77237_ch04.indd 10077237_ch04.indd 100 8/11/10 8:10:21 AM8/11/10 8:10:21 AM

The Electrocardiogram
101
Normal baseline
Baselineshiftedupward
Heart fully depolarized
Baseline shifted downward
Normal baseline
Heart fully depolarized
Injured segment ispartially depolarizedprior to stimulation
Injured segment ispartially depolarizedprior to stimulation
Recordingelectrode
Recordingelectrode
ST Segment Elevation MI
Non-ST Segment Elevation MI
Figure 4.25. ST deviations in acute MI: diastolic injury current. Top, Ionic leak results in partial depolarization of injured myocardium in diastole, prior to electrical stimulation, which produces forces heading away from that site and shifts the ECG baseline down-ward. This is not noticeable on the ECG because only relative, not absolute, voltages are recorded. Following stimulation, when the entire myocardium has fully depolarized, the voltage is true zero but gives the appearance of ST elevation compared with the abnor-mally depressed baseline. Bottom, In non-ST segment elevation MI, the process is similar, but the ionic leak typically arises from the subendocardial tissue. As a result, the partial depolarization before stimulation results in electrical forces directed toward the recording electrode; hence, the baseline is shifted upward. When fully depolarized, the voltage is true zero, but the ST segment appears depressed compared with the shifted baseline.
Ischemic
Ischemic cellsrepolarize more rapidly than normal
Normal–90 mV
ST elevation+
++
RecordingelectrodeA B
Figure 4.26. ST deviation in acute ST segment elevation MI: systolic injury current. A. Compared with normal myocytes (solid line), ischemic myocytes (dashed line) display a reduced resting membrane potential and repolar-ize more rapidly. B. More rapid repolarization causes the surface of the ischemic zone to be relatively positively charged at the time the ST segment is inscribed. The associated electrical current (arrows) is directed toward the recording electrode overlying that site, so that the ST segment is abnormally elevated.
77237_ch04.indd 10177237_ch04.indd 101 8/11/10 8:10:21 AM8/11/10 8:10:21 AM

Chapter 4
102
Figure 4.27. Conditions that alter repolarization of myocytesand therefore result in ST segment and T wave abnormalities.
Normal
Digoxin therapy
Hyperkalemia
Hypokalemia
Hypercalcemia
Hypocalcemia
Severehyperkalemia
• ST “scooped” depression• Mild PR prolongation
• Flattened P• Widened QRS
• ST depression, flattened T• Prominent U wave
• Tall “peaked” T wave
• Shortened QT interval
• Prolonged QT interval
T U
Acute Non-ST Segment Elevation MI
As described in Chapter 7, not all acute myo-cardial infarctions result in ST segment el-evation and potential Q wave development. A more limited type of infarction, known as acute non-ST elevation MI, typically results from an acute partially occlusive coronary thrombus. In such infarctions, it is ST segment depres-sion and/or T wave inversion, rather than ST elevation, that appears in the leads overlying the infarcting myocardium.
The extent of myocardial damage with this form of infarction is less than in STEMI, often involving only the subendocardial layers of the myocardium. As a result, pathologic Q waves do not develop, because the remaining viable cells are able to generate some electrical activity.
In non-ST elevation MI, the diastolic cur-rent theory maintains that diastolic ionic leak of injured cells adjacent to the subendocardial infarct zone generates electrical forces directed from the inner endocardium to the outer epi-cardium and therefore toward the overlying ECG electrode. Thus, the baseline of the ECG is shifted upward (see Fig. 4.25, bottom). Fol-lowing full cardiac depolarization, the electri-cal potential of the heart returns to true zero but, relative to the abnormal baseline, gives the appearance of ST segment depression.
In addition to myocardial ischemia and in-farction, there are several other causes of ST segment and T wave abnormalities that result from alterations in myocyte repolarization. The most commonly encountered of these are illustrated in Figure 4.27.
77237_ch04.indd 10277237_ch04.indd 102 8/11/10 8:10:21 AM8/11/10 8:10:21 AM

The Electrocardiogram
103
SUMMARY
The ECG provides a wealth of information about the structure and integrity of the heart and is one of the most important diagnostic tools in cardiology. With the knowledge of this chapter in hand, the reader should be well prepared to practice analyzing ECGs in any of the complete
Table 4.5. Summary of Sequence of ECG Interpretation
1. Calibration• Check 1.0 mV vertical box inscription (normal standard � 10 mm)
2. Rhythm• Sinus rhythm is present if
• Each P wave is followed by a QRS complex• Each QRS is preceded by a P wave• P wave is upright in leads I, II, and III• PR interval is �0.12 sec (3 small boxes)
• If these criteria are not met, determine type of arrhythmia (see Chapter 12)3. Heart rate
• Use one of three methods:• 1,500/(number of mm between beats)• Count-off method: 300—150—100—75—60—50• Number of beats in 6 sec � 10
• Normal rate � 60–100 bpm (bradycardia 60, tachycardia �100)4. Intervals
• Normal PR � 0.12–0.20 sec (3–5 small boxes)• Normal QRS � 0.10 sec (�2.5 small boxes)• Normal QT � half the R–R interval, if heart rate normal
5. Mean QRS axis• Normal if QRS is primarily upright in leads I and II (�90° to �30°)• Otherwise, determine axis by isoelectric/perpendicular method
6. P wave abnormalities• Inspect P in leads II and V1 for left and right atrial enlargement
7. QRS wave abnormalities• Inspect for left and right ventricular hypertrophy• Inspect for bundle branch blocks• Inspect for pathologic Q waves: What anatomic distribution?
8. ST segment or T wave abnormalities• Inspect for ST elevations:
• ST segment elevation MI• Pericarditis (see Chapter 14)
• Inspect for ST depressions or T wave inversions:• Myocardial ischemia or non-ST elevation MI• Usually accompany ventricular hypertrophy or bundle branch blocks• Metabolic or chemical abnormalities (see Fig. 4.27)
9. Compare with patient’s previous ECGs
ECG texts listed under “Additional Reading.” Table 4.5 summarizes the suggested sequence of ECG interpretation. Sample normal and ab-normal ECGs, with their interpretations, are presented in Figures 4.28 through 4.36. Distur-bances of the cardiac rhythm can be identifi ed by electrocardiography and are described in Chapters 11 and 12.
77237_ch04.indd 10377237_ch04.indd 103 8/11/10 8:10:22 AM8/11/10 8:10:22 AM

104
Figu
re 4
.28.
12-
lead
ECG
(no
rmal
). T
he r
ecta
ngul
ar u
pwar
d de
fl ect
ion
at t
he b
egin
ning
of
each
lin
e is
the
vol
tage
cal
ibra
tion
sig
nal
(1 m
V).
Rhyt
hm:
norm
al s
inus
. Ra
te:
70 b
pm.
Inte
rval
s: P
R, 0
.17;
QRS
, 0.0
6; Q
T, 0
.40
sec.
Axi
s: 0
° (Q
RS is
isoe
lect
ric
in le
ad a
VF).
The
P w
ave,
QRS
com
plex
, ST
segm
ent,
and
T w
aves
are
nor
mal
. Not
ice
the
grad
ual i
ncre
ase
in R
wav
e he
ight
bet
wee
n le
ads
V 1 th
roug
h V 6.
I II III
aVR
aVL
aVF
V1
V2
V3
V4
V5
V6
77237_ch04.indd 10477237_ch04.indd 104 8/11/10 8:10:22 AM8/11/10 8:10:22 AM

105
Figu
re 4
.29.
12-
lead
ECG
(ab
norm
al).
Rhy
thm
: no
rmal
sin
us.
Rate
: 75
bpm
. In
terv
als:
PR,
0.1
6; Q
RS,
0.15
; QT
, 0.
42 s
ec.
Axis
: in
dete
rmin
ate
(iso
elec
tric
in
all lim
b le
ads)
. P
wav
e: lef
t at
rial
enl
arge
men
t (1
mm
wid
e an
d 1
mm
dee
p in
lead
V1)
. QR
S: w
iden
ed w
ith
RSR�
in le
ad V
1 co
nsis
tent
wit
h ri
ght
bund
le b
ranc
h bl
ock
(RBB
B).
Also
, pa
thol
ogic
Q w
aves
are
in le
ads
II,
III,
and
aVF
, co
nsis
tent
wit
h in
feri
or w
all m
yoca
rdia
l inf
arct
ion
(an
old
one,
bec
ause
the
ST
segm
ents
do
not
dem
onst
rate
an
acut
e in
jury
pat
tern
).
I II III
aVR
aVL
aVF
V1
V2
V3
V4
V5
V6
77237_ch04.indd 10577237_ch04.indd 105 8/11/10 8:10:22 AM8/11/10 8:10:22 AM

106
Figu
re 4
.30.
12-
lead
ECG
(ab
norm
al).
Rhy
thm
: nor
mal
sin
us. R
ate:
68
bpm
. Int
erva
ls: P
R, 0
.16;
QRS
, 0.1
6; Q
T, 0
.40
sec.
Axi
s: �
15°.
P w
ave:
nor
mal
. QRS
: wid
ened
wit
h RR
’ in
lead
s V 4–
V 6 co
nsis
tent
wit
h le
ft b
undl
e br
anch
blo
ck (
LBBB
). T
he S
T se
gmen
t an
d T
wav
e ab
norm
alit
ies
are
seco
ndar
y to
LBB
B.
77237_ch04.indd 10677237_ch04.indd 106 8/11/10 8:10:25 AM8/11/10 8:10:25 AM

107
Figu
re 4
.31.
12-
lead
ECG
(ab
norm
al).
Rhy
thm
: no
rmal
sin
us.
Rate
: 66
bpm
. In
terv
als:
PR,
0.1
6; Q
RS,
0.08
; QT
, 0.
40 s
ec.
Axis
: �
10°.
P w
ave:
nor
mal
. QR
S: p
atho
logi
c Q
wav
es i
n le
ads
V 1–V 4,
con
sist
ent
wit
h an
tero
sept
al a
nd a
nter
oapi
cal m
yoca
rdia
l inf
arct
ion
(MI)
. Th
e ST
seg
men
t an
d T
wav
es d
o no
t de
mon
stra
te a
n ac
ute
inju
ry p
atte
rn; th
us, th
e M
I is
old
.
77237_ch04.indd 10777237_ch04.indd 107 8/11/10 8:10:26 AM8/11/10 8:10:26 AM

108
Figu
re 4
.32.
12-
lead
ECG
(ab
norm
al).
Rhy
thm
: sin
us b
rady
card
ia. R
ate:
55
bpm
. Int
erva
ls: P
R, 0
.20
(in
aVF)
; QRS
, 0.1
0; Q
T, 0
.44
sec.
Axi
s: n
orm
al (
QRS
is p
redo
min
antl
y up
righ
t in
lead
s I
and
II).
P w
ave:
nor
mal
. QR
S: v
olta
ge i
n ch
est
lead
s is
pro
min
ent
but
does
not
mee
t cr
iter
ia f
or v
entr
icul
ar h
yper
trop
hy;
path
olog
ic Q
wav
es a
re p
rese
nt i
n II
, II
I, a
nd a
VF,
indi
cati
ng
infe
rior
wal
l MI,
and
the
tal
l R w
ave
in V
2 is
sugg
esti
ve o
f po
ster
ior
MI
invo
lvem
ent
as w
ell.
Mar
ked
ST s
egm
ent
elev
atio
n is
app
aren
t in
II,
III
, and
aVF
, ind
icat
ing
that
thi
s is
an
acut
e M
I.
Note
the
rec
ipro
cal S
T se
gmen
t de
pres
sion
in le
ads
I an
d aV
L.
77237_ch04.indd 10877237_ch04.indd 108 8/11/10 8:10:26 AM8/11/10 8:10:26 AM

109
Figu
re 4
.33.
12-
lead
ECG
(ab
norm
al).
Rhy
thm
: si
nus
brad
ycar
dia.
Rat
e: 5
5 bp
m.
Inte
rval
s: P
R, 0
.24
(fi rs
t-de
gree
AV
bloc
k; s
ee C
hapt
er 1
2);
QRS,
0.0
9; Q
T, 0
.44
sec.
Axi
s: 0
°. P
wav
e:
norm
al.
QRS:
left
ven
tric
ular
hyp
ertr
ophy
(LV
H):
S i
n V 1
(14
mm
) �
R i
n V 5
(22
mm
) �
35
mm
. Pa
thol
ogic
Q w
aves
in
lead
s II
I an
d aV
F ra
ise
the
poss
ibili
ty o
f an
old
inf
erio
r M
I. T
he S
T se
gmen
t de
pres
sion
and
T w
ave
inve
rsio
n ar
e se
cond
ary
to t
he a
bnor
mal
rep
olar
izat
ion
resu
ltin
g fr
om L
VH.
77237_ch04.indd 10977237_ch04.indd 109 8/11/10 8:10:26 AM8/11/10 8:10:26 AM

110
Figu
re 4
.34.
12-
lead
ECG
(ab
norm
al).
Rhy
thm
: nor
mal
sin
us. R
ate:
68
bpm
. Int
erva
ls: P
R, 0
.24
(fi rs
t-de
gree
AV
bloc
k; s
ee C
hapt
er 1
2); Q
RS, 0
.10;
QT,
0.3
6 se
c. A
xis:
�45
° (l
eft
axis
dev
ia-
tion
). P
wav
e: le
ft a
tria
l enl
arge
men
t (t
erm
inal
defl
ect
ion
of P
wav
e in
V1
is 1
mm
wid
e an
d 1
mm
dee
p—ju
st b
arel
y).
QRS:
pat
tern
of
left
ant
erio
r fa
scic
ular
blo
ck (
LAFB
; se
e Fi
g. 4
.20)
. Th
e ab
norm
ally
sm
all R
wav
es in
lead
s V 2�
V 4 ar
e as
soci
ated
wit
h LA
FB r
esul
ting
fro
m t
he r
educ
tion
of
init
ial a
nter
ior
forc
es.
The
ST s
egm
ent
and
T w
aves
are
unr
emar
kabl
e.
77237_ch04.indd 11077237_ch04.indd 110 8/11/10 8:10:27 AM8/11/10 8:10:27 AM

111
Figu
re 4
.35.
12-
lead
ECG
(ab
norm
al).
Rhy
thm
: no
rmal
sin
us.
Rate
: 95
bpm
. In
terv
als:
PR,
0.2
0; Q
RS,
0.10
; QT
, 0.
34 s
ec.
Axis
: �
160°
(ri
ght
axis
dev
iati
on [
RAD]
). P
wav
e: r
ight
atr
ial
enla
rgem
ent
(P w
ave
in le
ad I
I is
�2.
5 m
m t
all)
. QR
S: r
ight
ven
tric
ular
hyp
ertr
ophy
(RV
H):
R �
S in
V1 w
ith
RAD.
The
T w
aves
are
inve
rted
in t
he a
nter
ior
lead
s, a
t le
ast
in p
art
refl e
ctin
g ab
norm
al r
epol
ariz
atio
n ow
ing
to R
VH.
77237_ch04.indd 11177237_ch04.indd 111 8/11/10 8:10:27 AM8/11/10 8:10:27 AM

Chapter 4
112
Figure 4.36. 12-lead ECG (abnormal). Rhythm: normal sinus. Rate: 62 bpm. Intervals: PR, 0.14; QRS, 0.10; QT, 0.52 (corrected QT, 0.53, which is prolonged). Axis: �95° (right axis deviation [RAD]). QRS: pattern of left posterior fascicular block (LPFB), with small R wave in leads I and aVL, small Q wave in leads II, III, and aVF, and RAD (see Fig. 4.20 for further description of LPFB). The prolonged QT interval in this patient is the result of antiarrhythmic medication.
I aVR V1 V4
II aVL V2 V5
III aVF V3 V6
Acknowledgments
Contributors to the previous editions of this chapter were Lilit Garibyan, MD; Kyle Low, MD; Price Kerfoot, MD; and Leonard S. Lilly, MD.
Additional Reading
Dubin D. Rapid Interpretation of EKGs. 6th ed. Tampa, FL: Cover Publishing; 2000.
Goldberger AL, Goldberger E. Clinical Electrocardi-ography: A Simplifi ed Approach. 7th ed. St. Louis, MO: Mosby; 2006.
O’Keefe JH Jr, Hammill SC, Freed MS, et al. The Complete Guide to ECGs. 3rd ed. Sudbury, MA: Jones and Bartlett Publishers; 2008.
Surawicz B, Knilans TK. Chou’s Electrocardiography in Clinical Practice. 6th ed. Philadelphia, PA: Saunders; 2008.
Surawicz B, Childers R, Deal BJ, et al. AHA/ACC/HRS recommendations for the standardization and in-terpretation of the electrocardiogram (Parts I–VI).J Am Coll Cardiol. 2007;49:1109–1135 and 2009; 53:976–1011.
Wagner GS. Marriott’s Practical Electrocardiography. 11th ed. Baltimore, MD: Lippincott Williams & Wilkins; 2007.
77237_ch04.indd 11277237_ch04.indd 112 8/11/10 8:10:28 AM8/11/10 8:10:28 AM

113
C H A P T E R
5AtherosclerosisJordan B. StromPeter Libby
VASCULAR BIOLOGY OF ATHEROSCLEROSISNormal Arterial WallAtherosclerotic Arterial WallComplications of Atherosclerosis
ATHEROSCLEROSIS RISK FACTORSTraditional Risk FactorsBiomarkers of Cardiovascular RiskOutlook
lumen and therefore most “intimate” with the blood; the media, which is the middle layer; and the outer layer, the adventitia. The intimal surface consists of a single layer of endothelial cells that acts as a metaboli-cally active barrier between circulating blood and the vessel wall. The media is the thickest layer of the normal artery. Boundaries of elas-tin, known as the internal and external elastic laminae, separate this middle layer from the intima and adventitia, respectively. The media consists of smooth muscle cells and extracel-lular matrix, and subserves the contractile and elastic functions of the vessel. The elastic component, more prominent in large arter-ies (e.g., the aorta and its primary branches), stretches during the high pressure of systole and then recoils during diastole, propelling blood forward. The muscular component, more prominent in smaller arteries such as arterioles, constricts or relaxes to alter vessel resistance and therefore luminal blood fl ow (fl ow � pressure/resistance; see Chapter 6). The adventitia contains the nerves, lymphat-ics, and blood vessels (vasa vasorum) that nourish the cells of the arterial wall.
Far from an inert conduit, the living arte-rial wall is a scene of dynamic interchange between its cellular components—most impor-tantly, endothelial cells, vascular smooth mus-cle cells, and their surrounding extracellular
Atherosclerosis is the leading cause of mortality and morbidity in the developed
world. Through its major manifestations of cardiovascular disease and stroke, it likely will become the leading global killer by the year 2020. Commonly known as “hardening of the arteries,” atherosclerosis derives its name from the Greek roots athere-, meaning “gruel,” and -skleros, meaning “hardness.”
Recent evidence has demonstrated that ath-erosclerosis is a chronic infl ammatory condi-tion and that its pathogenesis involves lipids, thrombosis, elements of the vascular wall, and immune cells. The process of atherogenesis can smolder throughout adulthood, punctu-ated by acute cardiovascular events.
This chapter consists of two sections. The fi rst part describes the normal arterial wall, the pathogenesis of atherosclerotic plaque forma-tion, and pathologic complications that lead to clinical symptoms. The second section relates fi ndings from population studies to attributes that lead to this condition, thereby offering op-portunities for prevention and treatment.
VASCULAR BIOLOGY OFATHEROSCLEROSIS
Normal Arterial Wall
The arterial wall consists of three layers (Fig. 5.1): the intima, closest to the arterial
77237_ch05.indd 11377237_ch05.indd 113 8/11/10 8:11:01 AM8/11/10 8:11:01 AM

Chapter 5
114
matrix. An understanding of the dysfunc-tion that leads to atherosclerosis requires knowledge of the normal function of thesecomponents.
Endothelial Cells
In a healthy artery, the endothelium performs structural, metabolic, and signaling functions that maintain homeostasis of the vessel wall. The tightly adjoined endothelial cells form a barrier that contains blood within the lumen of the vessel and limits the passage of large molecules from the circulation into the sub-endothelial space.
As blood traverses the vascular tree, it en-counters antithrombotic molecules produced by the normal endothelium that prevent it from clotting. Some of these molecules reside on the endothelial surface (e.g., heparan sulfate, thrombomodulin, and plasminogen activators; see Chapter 7), while other antithrombotic products of the endothelium enter the circula-tion (e.g., prostacyclin and nitric oxide [NO]; see Chapter 6). Although a net anticoagulant state normally prevails, the endothelium can also produce prothrombotic molecules when subjected to various stressors.
Endothelial cells also secrete substances that modulate contraction of smooth muscle cells in the underlying medial layer. These substances include vasodilators (e.g., NO and prostacyclin) and vasoconstrictors (e.g., endothelin) that alter the resistance of the vessel and therefore luminal blood fl ow. In a normal artery, the predominance of vasodila-tor substances results in net smooth muscle relaxation. Several of the aforementioned endothelial products also function within the vessel wall to inhibit proliferation of smooth muscle cells into the intima, thus enforcing their normal residence within the media.
Endothelial cells can also modulate the immune response. In the absence of patho-logic stimulation, healthy arterial endothelial cells resist leukocyte adhesion and thereby oppose local infl ammation. However, endo-thelial cells in postcapillary venules respond to local injury or infection by secreting chemokines—chemicals that attract white blood cells to the area. Such stimulation also causes endothelial cells to produce cell surface adhesion molecules, which anchor mononuclear cells to the endothelium and facilitate their migration to the site of injury. These effects may be mediated in part via
Figure 5.1. Schematic diagram of the arterial wall. The intima, the innermost layer, overlies the muscular media demarcated by the internal elastic lamina. The external elastic lamina separates the media from the outer layer, the adventitia.
Intima
Media
Adventitia
Endothelial cells
Internal elastic lamina
Smooth muscle cells
External elastic lamina
Lumen
77237_ch05.indd 11477237_ch05.indd 114 8/11/10 8:11:01 AM8/11/10 8:11:01 AM
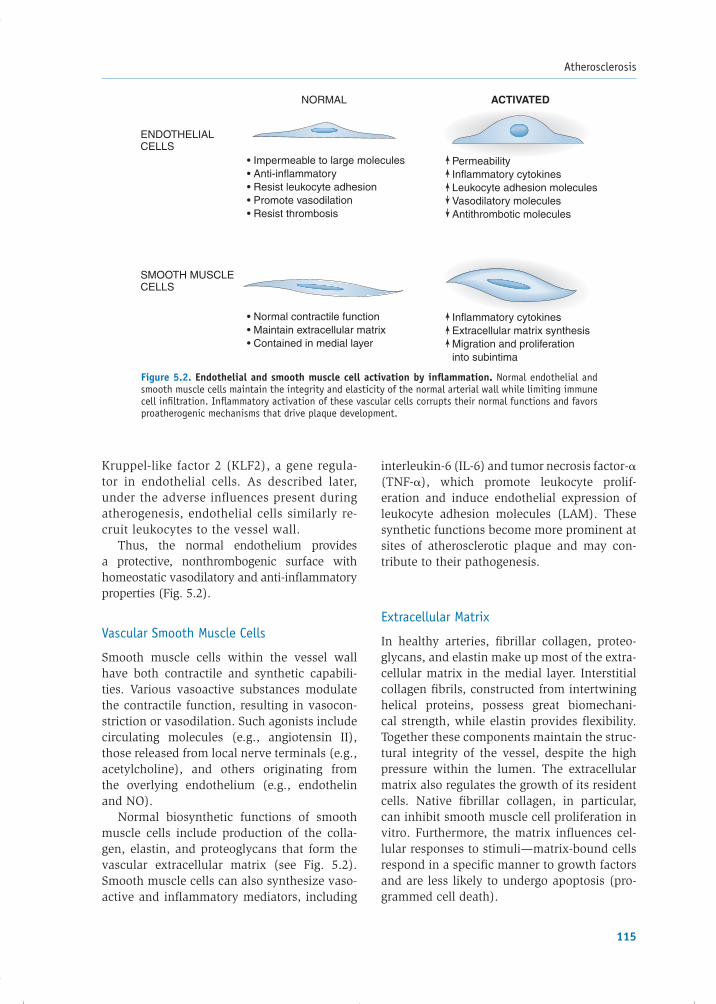
Atherosclerosis
115
Kruppel-like factor 2 (KLF2), a gene regula-tor in endothelial cells. As described later, under the adverse infl uences present during atherogenesis, endothelial cells similarly re-cruit leukocytes to the vessel wall.
Thus, the normal endothelium provides a protective, nonthrombogenic surface with homeostatic vasodilatory and anti-infl ammatory properties (Fig. 5.2).
Vascular Smooth Muscle Cells
Smooth muscle cells within the vessel wall have both contractile and synthetic capabili-ties. Various vasoactive substances modulate the contractile function, resulting in vasocon-striction or vasodilation. Such agonists include circulating molecules (e.g., angiotensin II), those released from local nerve terminals (e.g., acetylcholine), and others originating from the overlying endothelium (e.g., endothelin and NO).
Normal biosynthetic functions of smooth muscle cells include production of the colla-gen, elastin, and proteoglycans that form the vascular extracellular matrix (see Fig. 5.2). Smooth muscle cells can also synthesize vaso-active and infl ammatory mediators, including
interleukin-6 (IL-6) and tumor necrosis factor-�(TNF-�), which promote leukocyte prolif-eration and induce endothelial expression of leukocyte adhesion molecules (LAM). These synthetic functions become more prominent at sites of atherosclerotic plaque and may con-tribute to their pathogenesis.
Extracellular Matrix
In healthy arteries, fi brillar collagen, proteo-glycans, and elastin make up most of the extra-cellular matrix in the medial layer. Interstitial collagen fi brils, constructed from intertwining helical proteins, possess great biomechani-cal strength, while elastin provides fl exibility. Together these components maintain the struc-tural integrity of the vessel, despite the high pressure within the lumen. The extracellular matrix also regulates the growth of its resident cells. Native fi brillar collagen, in particular, can inhibit smooth muscle cell proliferation in vitro. Furthermore, the matrix infl uences cel-lular responses to stimuli—matrix-bound cells respond in a specifi c manner to growth factors and are less likely to undergo apoptosis (pro-grammed cell death).
Figure 5.2. Endothelial and smooth muscle cell activation by infl ammation. Normal endothelial and smooth muscle cells maintain the integrity and elasticity of the normal arterial wall while limiting immune cell infi ltration. Infl ammatory activation of these vascular cells corrupts their normal functions and favors proatherogenic mechanisms that drive plaque development.
• Impermeable to large molecules• Anti-inflammatory• Resist leukocyte adhesion• Promote vasodilation• Resist thrombosis
• Normal contractile function• Maintain extracellular matrix• Contained in medial layer
PermeabilityInflammatory cytokinesLeukocyte adhesion moleculesVasodilatory moleculesAntithrombotic molecules
Inflammatory cytokines Extracellular matrix synthesisMigration and proliferationinto subintima
ENDOTHELIALCELLS
NORMAL ACTIVATED
SMOOTH MUSCLECELLS
77237_ch05.indd 11577237_ch05.indd 115 8/11/10 8:11:02 AM8/11/10 8:11:02 AM
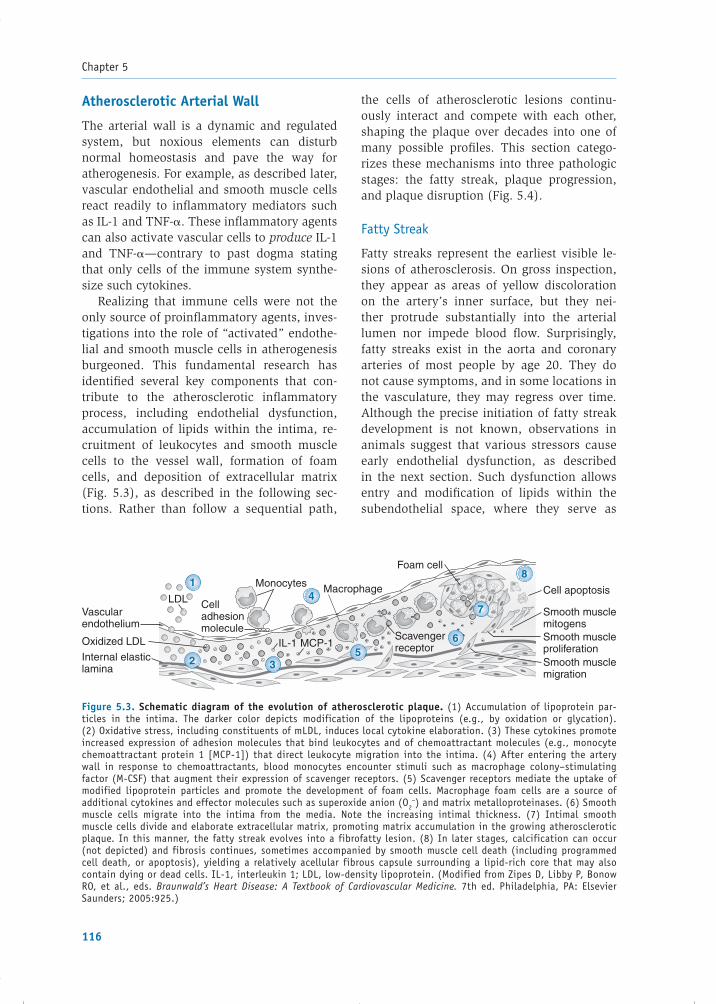
Chapter 5
116
Atherosclerotic Arterial Wall
The arterial wall is a dynamic and regulated system, but noxious elements can disturb normal homeostasis and pave the way for atherogenesis. For example, as described later, vascular endothelial and smooth muscle cells react readily to infl ammatory mediators such as IL-1 and TNF-�. These infl ammatory agents can also activate vascular cells to produce IL-1 and TNF-�—contrary to past dogma stating that only cells of the immune system synthe-size such cytokines.
Realizing that immune cells were not the only source of proinfl ammatory agents, inves-tigations into the role of “activated” endothe-lial and smooth muscle cells in atherogenesis burgeoned. This fundamental research has identifi ed several key components that con-tribute to the atherosclerotic infl ammatory process, including endothelial dysfunction, accumulation of lipids within the intima, re-cruitment of leukocytes and smooth muscle cells to the vessel wall, formation of foam cells, and deposition of extracellular matrix (Fig. 5.3), as described in the following sec-tions. Rather than follow a sequential path,
the cells of atherosclerotic lesions continu-ously interact and compete with each other, shaping the plaque over decades into one of many possible profi les. This section catego-rizes these mechanisms into three pathologic stages: the fatty streak, plaque progression, and plaque disruption (Fig. 5.4).
Fatty Streak
Fatty streaks represent the earliest visible le-sions of atherosclerosis. On gross inspection, they appear as areas of yellow discoloration on the artery’s inner surface, but they nei-ther protrude substantially into the arterial lumen nor impede blood fl ow. Surprisingly, fatty streaks exist in the aorta and coronary arteries of most people by age 20. They do not cause symptoms, and in some locations in the vasculature, they may regress over time. Although the precise initiation of fatty streak development is not known, observations in animals suggest that various stressors cause early endothelial dysfunction, as described in the next section. Such dysfunction allows entry and modifi cation of lipids within the subendothelial space, where they serve as
Figure 5.3. Schematic diagram of the evolution of atherosclerotic plaque. (1) Accumulation of lipoprotein par-ticles in the intima. The darker color depicts modification of the lipoproteins (e.g., by oxidation or glycation).(2) Oxidative stress, including constituents of mLDL, induces local cytokine elaboration. (3) These cytokines promote increased expression of adhesion molecules that bind leukocytes and of chemoattractant molecules (e.g., monocyte chemoattractant protein 1 [MCP-1]) that direct leukocyte migration into the intima. (4) After entering the artery wall in response to chemoattractants, blood monocytes encounter stimuli such as macrophage colony–stimulating factor (M-CSF) that augment their expression of scavenger receptors. (5) Scavenger receptors mediate the uptake of modified lipoprotein particles and promote the development of foam cells. Macrophage foam cells are a source of additional cytokines and effector molecules such as superoxide anion (O2
−) and matrix metalloproteinases. (6) Smooth muscle cells migrate into the intima from the media. Note the increasing intimal thickness. (7) Intimal smooth muscle cells divide and elaborate extracellular matrix, promoting matrix accumulation in the growing atherosclerotic plaque. In this manner, the fatty streak evolves into a fibrofatty lesion. (8) In later stages, calcification can occur (not depicted) and fibrosis continues, sometimes accompanied by smooth muscle cell death (including programmed cell death, or apoptosis), yielding a relatively acellular fibrous capsule surrounding a lipid-rich core that may also contain dying or dead cells. IL-1, interleukin 1; LDL, low-density lipoprotein. (Modified from Zipes D, Libby P, Bonow RO, et al., eds. Braunwald’s Heart Disease: A Textbook of Cardiovascular Medicine. 7th ed. Philadelphia, PA: Elsevier Saunders; 2005:925.)
Smooth musclemitogens
Cell apoptosis
Foam cell
Smooth musclemigration
Smooth muscleproliferation
Oxidized LDL
Vascularendothelium
Internal elasticlamina
LDL
Monocytes Macrophage
IL-1 MCP-1Scavengerreceptor
Celladhesionmolecule
1
2 3
4
5
8
7
6
77237_ch05.indd 11677237_ch05.indd 116 8/11/10 8:11:02 AM8/11/10 8:11:02 AM

Atherosclerosis
117
proinfl ammatory mediators that initiate leu-kocyte recruitment and foam cell formation—the pathologic hallmarks of the fatty streak (Fig. 5.5).
Endothelial Dysfunction
Injury to the arterial endothelium represents a primary event in atherogenesis. Such in-jury can result from exposure to diverse agents, including physical forces and chemi-cal irritants.
The predisposition of certain regions of arteries (e.g., branch points) to develop atheromata supports the role of hydro-dynamic stress. In straight sections of arter-ies, the normal laminar (i.e., smooth) shear forces favor the endothelial production of NO, which is an endogenous vasodilator, an inhibitor of platelet aggregation, and an anti-infl ammatory substance (see Chapter 6).Moreover, laminar fl ow not only activates KLF-2 as described above, but also accen-tuates expression of the antioxidant en-zyme superoxide dismutase, which protects against reactive oxygen species produced by chemical irritants or transient ischemia. Conversely, disturbed fl ow occurs at arterial branch points, which impairs these locally atheroprotective endothelial functions. Ac-cordingly, arteries with few branches (e.g., the internal mammary artery) show relative resistance to atherosclerosis, whereas bifur-cated vessels (e.g., the common carotid and left coronary arteries) are common sites for atheroma formation.
Figure 5.5. Endothelial dysfunction is the primary event in plaque initiation. Physical and chemical stressors alter the normal endothelium, allowing lipid entry into the subintima and promoting infl ammatory cytokine release. This cytokine- and lipid-rich environment promotes recruitment of leukocytes to the subintima, where they may become foam cells—a promi nent infl ammatory participant.
Figure 5.4. Stages of plaque development. A. The fatty streak develops as a result of endothelial dysfunction, lipoprotein entry and modifi cation, leukocyte recruitment, and foam cell formation. B. Plaque progression is char-acterized by migration of smooth muscle cells into the intima, where they divide and elaborate extracellular matrix. The fi brous cap contains a lipid core. C. Hemodynamic stresses and degradation of extracellular matrix increase the susceptibility of the fi brous cap to rupture, allowing superimposed thrombus formation. (Modifi ed from Libby P,Ridker PM, Maseri A. Infl ammation and atherosclerosis. Circulation. 2002;105:1136.)
A B C
FATTY STREAK PLAQUE PROGRESSION PLAQUE DISRUPTION
••
••
Endothelial dysfunctionLipoprotein entry andmodificationLeukocyte recruitmentFoam cell formation
••
Smooth muscle cell migrationAltered matrix synthesis anddegradation
• Disrupted plaque integrity• Thrombus formation
Chemical irritants Hemodynamic stress
Lipoprotein entry &modification
Inflammatorycytokines
Chemokines Leukocyte adhesion molecules
Leukocyte recruitment
Foam Cell Formation
Endothelial Dysfunction
Unregulated uptakeof modified LDL
77237_ch05.indd 11777237_ch05.indd 117 8/11/10 8:11:02 AM8/11/10 8:11:02 AM
Chapter 5
118
Endothelial dysfunction may also result from exposure to a “toxic” chemical environment. For example, tobacco smoking, abnormal cir-culating lipid levels, and diabetes—all known risk factors for atherosclerosis—can promote endothelial dysfunction. Each of these states in-creases endothelial production of reactive oxy-gen species—notably, superoxide anion—which interact with other intracellular molecules to in-fl uence the metabolic and synthetic functions of the endothelium. In such an environment, the cells promote local infl ammation.
When physical and chemical stressors interrupt normal endothelial homeostasis, an activated state ensues, manifested by impairment of the endothelium’s role as a permeability barrier, release of infl amma-tory cytokines, increased production of cell surface adhesion molecules that recruit leu-kocytes, altered release of vasoactive sub-stances (e.g., prostacyclin and NO), and interference with normal antithrombotic properties. These undesired effects of en-dothelial dysfunction lay the groundwork for subsequent events in the development of atherosclerosis (see Fig. 5.2).
Lipoprotein Entry and Modifi cation
The activated endothelium no longer serves as an effective barrier to the passage of cir-culating lipoproteins into the arterial wall (see Box 5.1 for a summary of the major lipoprotein pathways). Increased endothe-lial permeability allows the entry of low-density lipoprotein (LDL) into the intima, a process facilitated by an elevated circulating LDL concentration. In addition to high LDL concentrations from excessive dietary intake, several monogenic causes of elevated LDL exist, including mutations in the LDL recep-tor, apolipoprotein B, and PCSK9, a protease involved in regulation of the LDL receptor. Once within the intima, LDL accumulates in the subendothelial space by binding to com-ponents of the extracellular matrix known as proteoglycans. This “trapping” increases the residence time of LDL within the ves-sel wall, where the lipoprotein may undergo chemical modifi cations that appear critical to the development of atherosclerotic lesions.
Hypertension, a major risk factor for ath-erosclerosis, may promote retention of lipo-proteins in the intima by accentuating the production of LDL-binding proteoglycans by smooth muscle cells.
Oxidation is one type of modifi cation that befalls LDL trapped in the subendothelial space. It can result from the local action of reactive oxygen species and pro-oxidant en-zymes derived from activated endothelial or smooth muscle cells, or from macrophages that penetrate the vessel wall. In addition, the microenvironment of the subendothelial space can sequester oxidized LDL from an-tioxidants in the plasma. In diabetic patients with sustained hyperglycemia, glycation of LDL can occur—a modifi cation that may ultimately render LDL antigenic and proin-fl ammatory. These biochemical modifi cations of LDL act early and contribute to the infl am-matory mechanisms initiated by endothelial dysfunction, and they may continue to pro-mote infl ammation throughout the lifespan of the plaque. In the fatty streak, and likely throughout plaque development, modifi ed LDL (mLDL) promotes leukocyte recruitment and foam cell formation.
Leukocyte Recruitment
Recruitment of leukocytes (primarily monocytes and T lymphocytes) to the vessel wall is a key step in atherogenesis. The process depends on the expression of LAM on the normally nonadherent endothelial luminal surface, and on chemoat-tractant signals (e.g., monocyte chemotactic protein 1 [MCP-1], IL-8, interferon-inducible protein-10) that direct diapedesis (passage of cells through the intact endothelial layer) into the subintimal space. Two major subsets of LAM persist in the infl amed atherosclerotic plaque: the immunoglobulin gene superfam-ily (particularly, vascular cell adhesion mol-ecule 1 [VCAM-1] and intercellular adhesion molecule 1 [ICAM-1]) and the selectins (par-ticularly, E- and P-selectin). Despite the central role of T lymphocytes in the immune system, plaque LAM and chemoattractant signals direct mainly monocytes to the forming lesion. Re-cent research shows that hypercholesterolemia favors accumulation in blood of a particularly
77237_ch05.indd 11877237_ch05.indd 118 8/11/10 8:11:05 AM8/11/10 8:11:05 AM
Atherosclerosis
119
proinfl ammatory subset of monocytes, charac-terized by expression of high levels of proin-fl ammatory cytokines (e.g., IL-1 and TNF-1), distinguished in mice by expression of the cell surface marker Ly6c. Although outnumbered by macrophages, T lymphocytes localize within plaques at all stages, where they likely furnish an important additional source of cytokines.
mLDL and proinfl ammatory cytokines can induce LAM and chemoattractant cytokine (che-mo kine) expression independently, but mLDL also potently stimulates endothelial and smooth muscle cells to produce proinfl amma-tory cytokines, thereby reinforcing the direct action. This dual ability of mLDL to promote leukocyte recruitment and infl ammation di-rectly and indirectly persists throughout atherogenesis.
Foam Cell Formation
After monocytes adhere to and penetrate the intima, they differentiate into phago-cytic macrophages and imbibe lipoproteins to form foam cells. It is important to note that foam cells do not arise from uptake of LDL by the classic cell–surface LDL-receptor mechanism described in Box 5.1, because the high cholesterol content within these cells actually suppresses expression of the recep-tor. Furthermore, the classic LDL receptor does not recognize chemically mLDL. Rather, macrophages rely on a family of “scavenger” receptors that preferentially bind and inter-nalize mLDL. Unlike uptake via the classic LDL receptor, mLDL ingestion by scavenger receptors evades negative feedback inhibition and permits engorgement of the macrophages with cholesterol and cholesteryl ester, result-ing in the typical appearance of foam cells. Although such uptake initially may be benefi -cial (by sequestering proinfl ammatory mLDL particles), the impaired effl ux of these cells, as compared to the amount of infl ux, leads to local accumulation in the plaque, mitigat-ing their protective role and fueling foam cell apoptosis and release of proinfl ammatory cytokines that promote atherosclerotic plaque progression. The lipid-rich center of a plaque, formed by necrotic foam cells, is often called the necrotic core.
Plaque Progression
Whereas endothelial cells play a central role in formation of the fatty streak, smooth muscle cell migration into the intima dominates early plaque progression. During decades of devel-opment, the typical atherosclerotic plaque ac-quires a distinct thrombogenic lipid core that underlies a protective fi brous cap. Not all fatty streaks progress into fi brofatty lesions, and it is unknown why some evolve and others do not.
Early plaque growth shows a compensatory outward remodeling of the arterial wall that preserves the diameter of the lumen and per-mits plaque accumulation without limitation of blood fl ow, hence producing no ischemic symptoms. This stage can even evade detec-tion by angiography. Later plaque growth, however, can outstrip the compensatory arte-rial enlargement, restrict the vessel lumen, and impede perfusion. Such fl ow-limiting plaques can result in tissue ischemia, causing symp-toms such as angina pectoris (see Chapter 6) or intermittent claudication of the extremities (see Chapter 15).
Most acute coronary syndromes (acute myocardial infarction and unstable angina pectoris) result when the fi brous cap of an atherosclerotic plaque ruptures, exposing prothrombotic molecules within the lipid core and precipitating an acute thrombus that suddenly occludes the arterial lumen. As described in this section, the extracellular matrix plays a pivotal role in fortifying the fi brous cap, isolating the thrombogenic plaque interior from coagulation substrates in the circulation.
Smooth Muscle Cell Migration
The transition from fatty streak to fi brous atheromatous plaque involves the migra-tion of smooth muscle cells from the arte-rial media into the intima, proliferation of the smooth muscle cells within the intima, and secretion of extracellular matrix macro-molecules by the smooth muscle cells. Foam cells, activated platelets entering through microfi ssures in the plaque surface, and endothelial cells all elaborate substances that
77237_ch05.indd 11977237_ch05.indd 119 8/11/10 8:11:05 AM8/11/10 8:11:05 AM
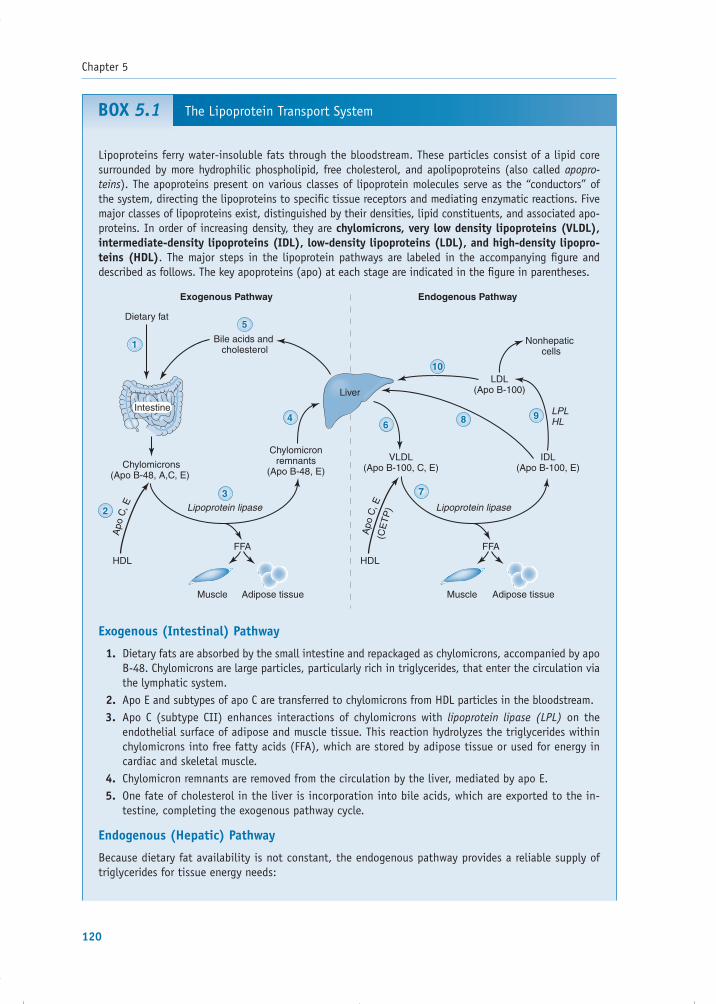
Chapter 5
120
BOX 5.1 The Lipoprotein Transport System
Liver
1
2
3
5
4
10
6
7
8 9Intestine
Chylomicrons(Apo B-48, A,C, E)
Exogenous Pathway Endogenous Pathway
Lipoprotein lipase
HDL HDL
Adipose tissueMuscle Adipose tissueMuscle
Lipoprotein lipase
Dietary fat
Chylomicronremnants
(Apo B-48, E)
Bile acids and cholesterol
Apo
C, E
FFA FFA
VLDL(Apo B-100, C, E)
(CE
TP
)
Apo
C, ELDL
(Apo B-100)
Nonhepaticcells
LPLHL
IDL(Apo B-100, E)
Lipoproteins ferry water-insoluble fats through the bloodstream. These particles consist of a lipid core surrounded by more hydrophilic phospholipid, free cholesterol, and apolipoproteins (also called apopro-teins). The apoproteins present on various classes of lipoprotein molecules serve as the “conductors” of the system, directing the lipoproteins to specifi c tissue receptors and mediating enzymatic reactions. Five major classes of lipoproteins exist, distinguished by their densities, lipid constituents, and associated apo-proteins. In order of increasing density, they are chylomicrons, very low density lipoproteins (VLDL), intermediate-density lipoproteins (IDL), low-density lipoproteins (LDL), and high-density lipopro-teins (HDL). The major steps in the lipoprotein pathways are labeled in the accompanying fi gure and described as follows. The key apoproteins (apo) at each stage are indicated in the fi gure in parentheses.
Exogenous (Intestinal) Pathway
Dietary fats are absorbed by the small intestine and repackaged as chylomicrons, accompanied by apo 1. B-48. Chylomicrons are large particles, particularly rich in triglycerides, that enter the circulation via the lymphatic system.Apo E and subtypes of apo C are transferred to chylomicrons from HDL particles in the bloodstream.2. Apo C (subtype CII) enhances interactions of chylomicrons with 3. lipoprotein lipase (LPL) on the endothelial surface of adipose and muscle tissue. This reaction hydrolyzes the triglycerides within chylomicrons into free fatty acids (FFA), which are stored by adipose tissue or used for energy in cardiac and skeletal muscle.Chylomicron remnants are removed from the circulation by the liver, mediated by apo E.4. One fate of cholesterol in the liver is incorporation into bile acids, which are exported to the in-5. testine, completing the exogenous pathway cycle.
Endogenous (Hepatic) Pathway
Because dietary fat availability is not constant, the endogenous pathway provides a reliable supply of triglycerides for tissue energy needs:
77237_ch05.indd 12077237_ch05.indd 120 8/11/10 8:11:05 AM8/11/10 8:11:05 AM

Atherosclerosis
121
The liver packages cholesterol and triglycerides into VLDL particles, accompanied by apo B-100 and 6. phospholipid. The triglyceride content of VLDL is much higher than that of cholesterol, but this is the main means by which the liver releases cholesterol into the circulation.VLDL is catabolized by LPL (similar to chylomicrons, as described in step 3), releasing fatty acids 7. to muscle and adipose tissue. During this process, VLDL also interacts with HDL, exchanging some of its triglyceride for apo C subtypes, apo E, and cholesteryl ester from HDL. The latter exchange (important in reverse cholesterol transport, as described in the next section) is mediated by cho-lesteryl ester transfer protein (CETP).Approximately 50% of the VLDL remnants (termed intermediate-density lipoproteins [IDL]) are then 8. cleared in the liver by hepatic receptors that recognize apo E.The remaining IDL is catabolized further by LPL and hepatic lipase (HL), which remove additional 9. triglyceride, apo E, and apo C, forming LDL particles.Plasma clearance of LDL occurs primarily via LDL receptor–mediated endocytosis in the liver and 10. peripheral cells, directed by LDL’s apo B-100 and apo E.
Cholesterol Homeostasis and Reverse Cholesterol Transport
Intracellular cholesterol content is tightly maintained by de novo synthesis, cellular uptake, storage, and effl ux from the cell. The enzyme HMG-CoA reductase is the rate-limiting element of cholesterol biosyn-thesis, and cellular uptake of cholesterol is controlled by receptor-mediated endocytosis of circulating LDL (see step 10). When intracellular cholesterol levels are low, the transcription factor sterol regulatory element binding protein (SREBP) is released from the endoplasmic reticulum. The active fragment of SREBP enters the nucleus to increase transcription of HMG-CoA reductase and the LDL receptor—which, through their subsequent actions, tend to normalize the intracellular cholesterol content.
Under conditions of intracellular cholesterol excess (Figure above), peripheral cells increase the tran-scription of the ATP-binding cassette A1 and G1 genes (ABCA1 and ABCG1, respectively). The ABCA1 gene codes for a transmembrane protein transporter that initiates effl ux of cholesterol from the cell to lipid-poor circulating apo AI (which is synthesized by the liver and intestine), thus forming nascent (immature) HDL particles. ABCG1 facilitates further effl ux of cholesterol to form more mature HDL particles. As free choles-terol is acquired by circulating HDL, it is esterifi ed by lecithin cholesterol acyltransferase (LCAT), an enzyme activated by apo AI. The hydrophobic cholesterol esters move into the particle’s core. Most cholesterol esters in HDL can then be exchanged in the circulation (via the enzyme CETP) with any of the apo B–containing lipoproteins (i.e., VLDL, IDL, LDL), which deliver the cholesterol back to the liver. HDL can also transport cholesterol to the liver and steroid hormone–producing tissues via the SR-B1 scavenger receptor.
Freeapo AI Nascent
HDL
Internalizedcholesterolester
Excesscholesterol
MatureHDL CETP
SR-BIreceptor
apo AI
ABCAI ABCGI
LCAT
Peripheralcells
Transfer ofcholesterol to
VLDL, IDL, LDLfor transport to liver
Uptake byliver and steroid
hormone-producing tissues
77237_ch05.indd 12177237_ch05.indd 121 8/11/10 8:11:05 AM8/11/10 8:11:05 AM

Chapter 5
122
signal smooth muscle cell migration and pro-liferation (Fig. 5.6).
Foam cells produce several factors that con-tribute to smooth muscle cell recruitment. For example, they release platelet-derived growth factor (PDGF)—also produced by platelets and endothelial cells—which likely stimulates the migration of smooth muscle cells across the internal elastic lamina and into the subinti-mal space, where they subsequently replicate. PDGF additionally stimulates the growth of resi-dent smooth muscle cells in the intima. Foam cells also release cytokines and growth factors(e.g., TNF-�, IL-1, fi broblast growth factor, and transforming growth factor-� [TGF-�]) that fur-ther incite smooth muscle cell proliferation and synthesis of extracellular matrix proteins. Fur-thermore, these stimulatory cytokines induce smooth muscle cell and leukocyte activation, promoting further cytokine release, thus rein-forcing and maintaining infl ammation in the lesion.
According to the traditional concept, plaques grow gradually and continuously, but
current evidence suggests that this progres-sion may be punctuated by subclinical events with bursts of smooth muscle replication. For example, morphologic evidence of resolved intraplaque hemorrhages indicates that small breaches in plaque integrity can occur with-out clinical symptoms or signs. At the cellular level, such breaches expose tissue factor from foam cells, which activates coagulation and microthrombus formation. Activated plate-lets within such microthrombi release addi-tional potent factors—including PDGF and heparinase—that can spur a local wave of smooth muscle cell migration and prolifera-tion. Heparinase degrades heparan sulfate, a polysaccharide in the extracellular matrix that normally inhibits smooth muscle cell migration and proliferation. Moreover, other forms of lymphocytes—such as Treg and Th2 lymphocytes—may produce factors, includ-ing TGF-� and IL-10, respectively, which can inhibit smooth muscle cell proliferation and thus regulate plaque growth.
Extracellular Matrix Metabolism
As the predominant collagen-synthesizing cell type, smooth muscle cells should, through their proliferation, favor fortifi cation of the fi brous cap. Net matrix deposition depends on the balance of synthesis by smooth muscle cells and degradation, mediated in part by a class of proteolytic enzymes known as matrix metal-loproteinases (MMP). While PDGF and TGF-� stimulate smooth muscle cell production of in-terstitial collagens, the T-lymphocyte–derived cytokine interferon-� (IFN-�) inhibits smooth muscle cell collagen synthesis. Furthermore, infl ammatory cytokines stimulate local foam cells to secrete collagen- and elastin-degrading MMP, thereby weakening the fi brous cap and predisposing it to rupture (Fig. 5.7).
Plaque Disruption
Plaque Integrity
The tug of war between matrix synthesis and degradation continues over decades, but not without consequences. Death of smooth muscle and foam cells, either owing to excess
Figure 5.6. Progression from the fatty streak involves the migration and proliferation of smooth muscle cells. Substances released from foam cells, dysfunctional endothelial cells, and platelets contribute to this pro-cess. IL-1, interleukin-1; NO, nitric oxide; PDGF, platelet-derived growth factor; PGI2, prostacyclin; TGF-�, transforming growth factor-�; TNF-�, tumor necrosis factor-�.
Tissuefactor
Thrombosisand plateletactivation
Heparinase
NOPGI2
Endothelialheparansulfate
PDGF
Foam Cells in Fatty Streak
EndothelialDysfunction
FibrousPlaque
Smooth muscle cells migrate to intima,proliferate, and produce extracellular matrix
77237_ch05.indd 12277237_ch05.indd 122 8/11/10 8:11:05 AM8/11/10 8:11:05 AM

Atherosclerosis
123
infl ammatory stimulation or by contact acti-vation of apoptosis pathways, liberates cellu-lar contents, contributing imbibed lipids and cellular debris to the growing lipid core. The size of the lipid core has biomechanical im-plications for the stability of the plaque. With increasing size and protrusion into the arte-rial lumen, mechanical stress focuses on the plaque border abutting normal tissue, the so-called shoulder region. In addition to bearing increased stress, local accumulation of foam cells and T lymphocytes at this site accelerates degradation of extracellular matrix, making this region the most common site of plaque rupture.
The net deposition and distribution of the fi brous cap is an important determinant of overall plaque integrity. Whereas lesions with thick fi brous caps may cause pronouncedarterial narrowing, they have less propensity to rupture. Conversely, plaques that have thinner caps (and often appear less obstruc-tive by angiography) tend to be fragile, and more likely to rupture and incite thrombo-sis. Current clinical terminology describes
the extreme spectrums of integrity as “stable plaques” (marked by a thick fi brous cap and small lipid core) or “vulnerable plaques” (marked by a thin fi brous cap, rich lipid core, extensive macrophage infi ltrate, and a pau-city of smooth muscle cells; Fig. 5.8). De-spite the common use of these terms, it is important to recognize that this distinction oversimplifi es the heterogeneity of plaques and may overestimate the ability to foresee a plaque’s “clinical future” based on structural information.
Thrombogenic Potential
Rupture of atherosclerotic plaque does not inevitably cause major clinical events such as myocardial infarction and stroke. As de-scribed in the previous section, small non-occlusive thrombi may reabsorb into the plaque, stimulating further smooth muscle growth and fi brous deposition (see Fig. 5.8). It is in large part the balance between the thrombogenic and fi brinolytic potential of the plaque, and the fl uid phase of blood,
Figure 5.7. Matrix metabolism underlies fi brous cap integrity. The net deposition of extracellular matrix is the result of competing synthesis and degradation reactions. Smooth muscle cells synthesize the bulk of the fi brous cap constituents, such as collagen and elastin. Foam cells elaborate destructive proteolytic enzymes, such as the collagen-degrading matrix metalloproteinases and the elastolytic cathepsins. T-lymphocyte–derived factors favor destruction of the fi brous cap. All plaque residents, however, contribute to the cytokine milieu of the plaque, providing multiple activating and inhibitory stimuli as shown. IFN-�, interferon-�; IL-1, interleukin-1; MCP-1, monocyte chemoattractant protein 1; PDGF, platelet-derived growth factor; TGF-�, transforming growth factor-�; TNF-�, tumor necrosis factor-�. (Modifi ed from Libby P. The molecular bases of acute coronary syndromes. Circu-lation. 1995;91:2844–2850; Young JL, Libby P, Schönbeck U. Cytokines in the pathogenesis of atherosclerosis. Thromb Haemost. 2002;88:554–567.)
Foamcell
T lymphocyte
Collagen andelastin
+ +
– +CD40LIFN-γ
Smooth muscle cell
SynthesisDegradation
Lumen
Lipid core
Fibrous Cap
MMP
77237_ch05.indd 12377237_ch05.indd 123 8/11/10 8:11:06 AM8/11/10 8:11:06 AM

Chapter 5
124
Figure 5.8. Stable versus vulnerable plaques. Stable plaque is characterized by a small lipid core and a thick fi brous cap, whereas vulnerable plaque tends to have a large lipid core and a relatively thin fi brous cap. The latter is subject to rupture, resulting in thrombosis. A resulting occlusive clot can cause an acute cardiac event, such as myocardial infarction. A lesser thrombus may resorb, but the wound-healing response stimulates smooth muscle cell proliferation and collagen production, thereby thickening the fi brous cap and narrowing the vessel lumen further. (Modifi ed from Libby P. Infl ammation in athero-sclerosis. Nature. 2002;420:868–874.)
Normal artery
Early atheroma
Ruptured plaquewith thrombus formation
• Small lipid pool• Thick fibrous cap• Preserved lumen
“Stable” plaque• Large lipid pool• Thin fibrous cap• Many inflammatory cells
“Vulnerable” plaque
Acutemyocardialinfarction
• Narrowed lumen• Fibrous intima
Healed rupture
that determines whether disruption of the fi brous cap leads to a transient, nonobstruc-tive mural thrombus or to a completely oc-clusive clot.
The probability of a major thrombotic event refl ects the balance between the com-peting processes of coagulation and fi brin-olysis. Infl ammatory stimuli common in
77237_ch05.indd 12477237_ch05.indd 124 8/11/10 8:11:06 AM8/11/10 8:11:06 AM

Atherosclerosis
125
the plaque microenvironment (e.g., CD40L) elicit tissue factor, the initiator of the extrin-sic coagulation pathway, from many plaque components, including smooth muscle cells, endothelial cells, and macrophage-derived foam cells. Beyond enhancing expression of the potent procoagulant tissue factor, infl am-matory stimuli further support thrombosis by favoring the expression of antifi brinolyt-ics (e.g., plasminogen activator inhibitor-1) over the expression of anticoagulants (e.g., thrombomodulin, heparin-like molecules, protein S) and profi brinolytic mediators (e.g., tissue plasminogen activator and urokinase-type plasminogen activator; Fig. 5.9). More-over, as described earlier, the activated endothelium also promotes thrombin forma-tion, coagulation, and fi brin deposition at the vascular wall.
A person’s propensity toward coagulation may be enhanced by genetics (e.g., the pres-ence of a procoagulant prothrombin gene mutation), comorbid conditions (e.g., diabe-tes), and/or lifestyle factors (e.g., smoking, visceral obesity). Consequently, the concept of the “vulnerable plaque” has expanded to that of the “vulnerable patient,” to acknowl-edge other contributors to a person’s vascular risk.
Complications of Atherosclerosis
Atherosclerotic plaques do not distribute homogeneously throughout the vasculature. They usually develop fi rst in the dorsal aspect
of the abdominal aorta and proximal coronary arteries, followed by the popliteal arteries, de-scending thoracic aorta, internal carotid arter-ies, and renal arteries. Therefore, the regions perfused by these vessels most commonly suf-fer the consequences of atherosclerosis.
Complications of atherosclerotic plaques—including calcifi cation, rupture, hemorrhage, and embolization—can have dire clinical con-sequences due to acute restriction of blood fl ow or alterations in vessel wall integrity. These complications, which are discussed in greater detail in later chapters, include the following:
• Calcifi cation of atherosclerotic plaque, which imparts a pipe-like rigidity to the ves-sel wall and increases its fragility.
• Rupture or ulceration of atherosclerotic plaque, which exposes procoagulants within the plaque to circulating blood, causing a thrombus to form at that site. Such throm-bosis can occlude the vessel and result in infarction of the involved organ. Alterna-tively, the thrombus material can incorpo-rate into the lesion and add to the bulk of the plaque.
• Hemorrhage into the plaque owing to rup-ture of the fi brous cap or of the microvessels that form within the lesion. The resulting in-tramural hematoma may further narrow the vessel lumen.
• Embolization of fragments of disrupted atheroma to distal vascular sites.
• Weakening of the vessel wall: the fi brous plaque subjects the neighboring medial
Figure 5.9. Competing factors in thrombosis. The clinical manifestations of plaque disruption rely not only on the stability of the fi brous cap, but also on the throm-bogenic potential of the plaque core. The balance of physiologic mediators dictates the prominence of the thrombus, resulting in either luminal occlusion or resorption into the plaque. PAI-1, plasminogen activator inhibitor 1; tPA, tissue plasminogen activator; uPA, urokinase-type plasminogen activator.
Favor Occlusive Thrombus Resist Thrombus Accumulation
Procoagulant
Antifibrinolytic
Tissue factor
PAI-1
Anticoagulants
Profibrinolytics
ThrombomodulinProtein S, Protein CHeparin-like molecules
tPA, uPA
•• •
•
•
•
77237_ch05.indd 12577237_ch05.indd 125 8/11/10 8:11:06 AM8/11/10 8:11:06 AM

Chapter 5
126
layer to increased pressure, which may pro-voke atrophy and loss of elastic tissue with subsequent expansion of the artery, forming an aneurysm.
• Microvessel growth within plaques, provid-ing a source for intraplaque hemorrhage and further leukocyte traffi cking.
The complications of atherosclerotic plaque may result in specifi c clinical consequences in different organ systems (Fig. 5.10). In the case of coronary plaque, lesions with gradu-ally progressive expansion and a thick fi brous cap tend to narrow the vessel lumen and cause intermittent chest discomfort on exertion (an-gina pectoris). In contrast, plaque that does not compromise the vessel lumen but has characteristics of vulnerability (a thin fi brous cap and large lipid core) can rupture, leading
to acute thrombosis and myocardial infarction (see Chapter 7). Such nonstenotic plaques are often numerous and dispersed throughout the arterial tree, and because they do not limit ar-terial fl ow, they do not produce symptoms and often evade detection by exercise testing or angiography.
The description presented here of athero-genesis and its complications can explain the limitations of widely employed treat-ments. For example, percutaneous interven-tion (angioplasty and stent placement) of symptomatic coronary stenoses effectively relieves angina pectoris, but does not neces-sarily prevent future myocardial infarction or prolong life. This disparity likely refl ects the multiplicity of nonocclusive plaques at risk of precipitating thrombotic events. It follows that lifestyle modifi cations and drug therapies
Figure 5.10. Clinical sequelae of atherosclerosis. Complications of atherosclerosis arise from the mechanisms listed in the fi gure.
Narrowing of vessel by fibrous plaque
Plaque ulceration or rupture
Intraplaque hemorrhage
Peripheral emboli
Weakening of vessel wall
4
41
1
41
1
2 3
2 3
2 3
5
1
2
3
4
5
Stroke
• Embolic stroke
• Thrombotic stroke
Renal Artery Disease • Atheroembolic renal disease • Renal artery stenosis
Aneurysms
Coronary artery disease
• Myocardial ischemia
• Unstable angina
• Myocardial infarction
Peripheral artery disease • Limb claudication
• Limb ischemia
77237_ch05.indd 12677237_ch05.indd 126 8/11/10 8:11:06 AM8/11/10 8:11:06 AM

Atherosclerosis
127
that curb the risk factors for plaque forma-tion, and lessen features associated with “vul-nerability,” furnish a critical foundation for preventing progression and complications of atherosclerosis.
ATHEROSCLEROSIS RISK FACTORS
In the early 20th century, it was widely be-lieved that atherosclerosis was an inevitable process of aging. But in 1948, the landmark Framingham Heart Study began to examine the relationship between specifi c attributes and cardiovascular disease, establishing the concept of atherosclerotic risk factors. Among later studies, the Multiple Risk Factor Inter-vention Trial (MRFIT) screened more than 325,000 men to correlate risk factors with sub-sequent cardiovascular disease and mortality. These studies and others have established the importance of modifi able risk factors for ath-erosclerosis, including aberrant levels of circu-lating lipids (dyslipidemia), tobacco smoking, hypertension, diabetes mellitus, and lack of physical activity and obesity (Table 5.1). Major nonmodifi able risk factors include ad-vanced age, male sex, and heredity—that is, a history of coronary heart disease among fi rst-degree relatives at a young age (before age 55 for a male relative or before age 65 for a female relative).
In addition to these standard predictors, certain biologic markers associated with the development of cardiovascular events have been undergoing rigorous evaluation as “novel” risk markers. These include elevated circulating levels of the amino acid metabolite homocysteine, the special lipoprotein particle
Lp(a), and certain markers of infl ammation, including the acute-phase reactant C-reactive protein (CRP). Furthermore, recent genome-wide association studies (GWAS) have sought to identify variants in genetic loci associated with increased cardiovascular risk.
The following sections address these risk factors and biologic markers.
Traditional Risk Factors
Dyslipidemia
A large and consistent body of evidence es-tablishes abnormal circulating lipid levels as a major risk factor for atherosclerosis. Obser-vational studies have shown that in the United States and other societies where there is high consumption of saturated fat and prevalent hy-percholesterolemia, there is greater mortality from coronary disease than in countries with traditionally low saturated fat intake and low serum cholesterol levels (e.g., rural Japan and certain Mediterranean nations). Similarly, data from the Framingham Heart Study and other cohorts have shown that the risk of ischemic heart disease increases with higher total serum cholesterol levels. The coronary risk is approximately twice as high for a per-son with a total cholesterol level of 240 mg/dLcompared with a person whose cholesterol level is 200 mg/dL.
In particular, elevated levels of circulating LDL correlate with an increased incidence of atherosclerosis and coronary artery disease. When present in excess, LDL can accumulate in the subendothelial space and undergo the chemical modifi cations that further damage the intima, as described earlier, initiating and perpetuating the development of atheroscle-rotic lesions. Thus, LDL is commonly known as “bad cholesterol.” Conversely, elevated high-density lipoprotein (HDL) particles ap-pear to protect against atherosclerosis, likely because of HDL’s ability to transport choles-terol away from the peripheral tissues back to the liver for disposal (termed “reverse choles-terol transport”; see Box 5.1) and because of its putative antioxidative and anti-infl ammatory properties. Thus, HDL has earned the moniker “good cholesterol.”
Table 5.1. Common Cardiovascular Risk Factors
Modifi able risk factorsDyslipidemia (elevated LDL, decreased HDL)Tobacco smokingHypertensionDiabetes mellitus, metabolic syndromeLack of physical activity
Nonmodifi able risk factorsAdvanced ageMale genderHeredity
77237_ch05.indd 12777237_ch05.indd 127 8/11/10 8:11:06 AM8/11/10 8:11:06 AM

Chapter 5
128
Elevated serum LDL may persist for many reasons, including a high-fat diet or abnor-malities in the LDL-receptor clearance mecha-nism. Patients with genetic defects in the LDL receptor, which leads to a condition known as familial hypercholesterolemia, cannot remove LDL from the circulation effi ciently. Heterozy-gotes with this condition have one normal and one defective gene coding for the receptor. They display high plasma LDL levels and de-velop premature atherosclerosis. Homozygotes who completely lack functional LDL receptors may experience vascular events, such as acute myocardial infarction, as early as the fi rst de-cade of life.
Increasing evidence also implicates triglyceride- rich lipoproteins, such as very low density lipoprotein (VLDL) and intermediate-density lipoprotein (IDL), in the development of atherosclerosis. However, it remains unde-termined whether these particles participate directly in atherogenesis or simply keep com-pany with low levels of HDL cholesterol. Of note, poorly controlled type 2 diabetes mel-litus commonly associates with the combi-nation of hypertriglyceridemia and low HDL levels.
Lipid-Altering Therapy
Strategies that improve abnormal lipid levels can limit the consequences of atherosclerosis. Many large studies of patients with coronary disease show that dietary or pharmacologic re-duction of serum cholesterol can slow the pro-gression of atherosclerotic plaque. These trials form the basis of the screening guidelines de-vised by the National Cholesterol Education Program panel, which recommend a fasting lipid profi le every fi ve years for all adults. The guidelines specify an “optimal” LDL choles-terol level as �100 mg/dL. Patients with es-tablished atherosclerosis, or those who have equivalent risk (e.g., diabetes), should receive treatment to attain this goal. An even lower goal of �70 mg/dL is recommended for pa-tients with atherosclerotic disease at the high-est risk of future vascular events—those who have recently sustained an acute coronary syn-drome (see Chapter 7) and those with multiple risk factors, especially diabetes, the metabolic
syndrome (described later in this chapter), or tobacco smoking.
Diet and exercise comprise two important components of the risk-reduction arsenal. For example, the Lyon Diet Heart Study demon-strated that patients with coronary disease who were randomized to a Mediterranean-style diet decreased their risk of recurrent cardiac events. The diet implemented in this study included replacement of saturated fats with polyun-saturated fats (particularly �-linolenic acid, anomega-3 fatty acid). In vitro evidence indi-cates that polyunsaturated fats may activate a transcription factor (peroxisome proliferator-activated receptor-� [PPAR-�], or its obligate partner, retinoid X receptor), which increases expression of the major HDL apoprotein (apo AI)and the enzyme lipoprotein lipase, and inhib-its cytokine-induced expression of LAM on endothelial cells. These actions may oppose atherogenesis. Physical activity and loss of ex-cess weight can also improve the lipid profi le, notably by lowering triglycerides and raising HDL.
When lifestyle modifi cations fail to achieve target values, pharmacologic agents can im-prove abnormal lipid levels. The major groups of lipid-altering agents (see Chapter 17) in-clude HMG-CoA reductase inhibitors (also known as statins), niacin, fi bric acid deriva-tives, cholesterol intestinal absorption in-hibitors, and bile acid–binding agents. The statins have emerged as the most effective LDL-lowering drugs. They inhibit the rate-limiting enzyme responsible for cholesterol biosynthesis. The resulting reduction in intra-cellular cholesterol concentration promotes increased LDL-receptor expression and thus augmented clearance of LDL particles from the bloodstream. Statins also lower the rate of VLDL synthesis by the liver (thus lowering circulating triglyceride levels), and raise HDL by an unknown mechanism.
Major clinical trials evaluating statin ther-apy have demonstrated reductions in ischemic cardiac events, the occurrence of strokes, and (in many cases) mortality rates (Fig. 5.11). The benefi ts documented in these studies have extended to people with wide ranges of LDL, with or without known preexisting ath-erosclerotic disease. Furthermore, the effect
77237_ch05.indd 12877237_ch05.indd 128 8/11/10 8:11:06 AM8/11/10 8:11:06 AM

Atherosclerosis
129
may depend on the degree of LDL lowering achieved, as demonstrated by the PROVE IT-TIMI 22 and TNT studies, which showed that intensive statin therapy (yielding lower LDL levels) improves cardiovascular outcomes in acute and chronic coronary heart disease more than moderate-dose statins.
The clinical benefi ts of statins likely derive from several mechanisms. The combination of lowering LDL and raising HDL may reduce the lipid content of atherosclerotic plaques and thus favorably affect their biologic activ-ity. Other potentially benefi cial actions (so-called “pleiotropic effects”) include increased NO synthesis, enhanced fi brinolytic activity, inhibition of smooth muscle proliferation and monocyte recruitment, and reduction in macrophage production of matrix-degrading enzymes. In vitro studies suggest that statins may also reduce infl ammation by inhibiting
the macrophage cytokines TNF-�, IL-1, and IL-6, thereby reducing endothelial expres-sion of LAM and macrophage tissue factor production. Some of these pleiotropic effects may result from activation of the transcrip-tion factor KLF2 and interference with pre-nylation of small G proteins implicated in the regulation of infl ammatory functions of vascular cells and leukocytes. Clinical trials have supported an anti-infl ammatory action of statins because they reduce plasma levels of CRP, a serum marker of infl ammation de-scribed later. It should be noted, however, that it is experimentally diffi cult to separate the LDL-lowering effect of statins from their anti-infl ammatory mechanisms because of the prominent role of oxidized LDL in initi-ating infl ammatory cascades. Nonetheless, accumulating clinical and experimental data suggest that at least part of the benefi t of
Figure 5.11. Statins reduce cardiovascular risk. Several major clinical studies have sup-ported the benefi cial role of statin-induced lipid lowering in reducing coronary heart disease (CHD) events. Regardless of baseline serum cholesterol levels, the benefi ts of statins extend to patients with an established history of coronary disease and to patients with signifi cant risk factors who do not have such a history. HDL, high-density lipoprotein; LDL, low-density lipoprotein.
4S
HP
S
CA
RE
WO
SC
OP
S
AS
CO
T
AF
CA
PS
/ Te
xCA
PS
LIP
ID
Included patientswith history of MI or CHD
Excluded patients with known CHD
Baseline LDLor total
cholesterol High Normal High Normal
(low HDL)NormalNormal
to HighNormalto High
Red
uctio
n in
C
HD
eve
nts
(%)
0
30
5
25
10
15
20
35
4S: Scandinavian Simvastatin Survival Study. Lancet. 1994;344:1383–1389.
AFCAPS/TexCAPS: The Air Force/Texas Coronary Atherosclerosis Prevention Study. JAMA. 1998;279:1615–1622.
ASCOT: Anglo-Scandinavian Cardiac Outcomes Trial—Lipid Lowering Arm. Lancet. 2003;361:1149–1158.
CARE: Cholesterol And Recurrent Events. N Engl J Med. 1996;335:1001–1009.
HPS: Heart Protection Study. Lancet. 2004;363:757–767.
LIPID: The Long-term Intervention with Pravastatin in Ischaemic Disease. N Engl J Med. 1998;339:1349–1357.
WOSCOPS: West of Scotland Coronary Primary Prevention Study. N Engl J Med. 1995;333:1301–1307.
77237_ch05.indd 12977237_ch05.indd 129 8/11/10 8:11:06 AM8/11/10 8:11:06 AM

Chapter 5
130
statins derives from mechanisms other than LDL lowering.
Tobacco Smoking
Numerous studies have shown that tobacco smoking increases the risk of atherosclerosis and ischemic heart disease. Even minimal smoking increases the risk, and the heaviest smokers have the greatest risk of cardiovascu-lar events.
Tobacco smoking could lead to athero-sclerotic disease in several ways, including enhanced oxidative modifi cation of LDL, de-creased circulating HDL levels, endothelial dysfunction owing to tissue hypoxia and in-creased oxidant stress, increased platelet ad-hesiveness, increased expression of soluble LAM, inappropriate stimulation of the sym-pathetic nervous system by nicotine, and displacement of oxygen by carbon monoxide from hemoglobin. Extrapolation from animal experiments suggests that smoking not only accelerates atherogenesis, but also increases the propensity for thrombosis—both compo-nents of the “vulnerable patient.”
Fortunately, smoking cessation can reverse some of the adverse outcomes. People who stop smoking greatly reduce their likelihood of coronary heart disease, compared with those who continue to smoke. In one study, after three years of cessation, the risk of cor-onary artery disease for former smokers be-came similar to subjects who never smoked.
Hypertension
Elevated blood pressure (either systolic or dia-stolic) augments the risk of developing athero-sclerosis, coronary heart disease, and stroke (see Chapter 13). The association of elevated blood pressure with cardiovascular disease does not appear to have a specifi c threshold. Rather, risk increases continuously with pro-gressively higher pressure values. Systolic pressure predicts adverse outcomes more reli-ably than does diastolic pressure, particularly in older persons.
Hypertension may accelerate atherosclero-sis in several ways. Animal studies have shown that elevated blood pressure injures vascular
endothelium and may increase the permeabil-ity of the vessel wall to lipoproteins. In ad-dition to causing direct endothelial damage, increased hemodynamic stress can augment the number of scavenger receptors on mac-rophages, thus enhancing the development of foam cells. Cyclic circumferential strain, in-creased in hypertensive arteries, can enhance smooth muscle cell production of proteogly-cans that bind and retain LDL particles, pro-moting their accumulation in the intima and facilitating their oxidative modifi cation. Angio-tensin II, a mediator of hypertension, acts not only as a vasoconstrictor, but also as a stimu-lator of oxidative stress (through activation of NADPH oxidases, a source of superoxide anion, O 2
− ) and as a proinfl ammatory cytokine. Thus, hypertension may also promote athero-genesis by contributing to a pro-oxidant and infl ammatory state.
Antihypertensive Therapy
Like dyslipidemias, treatment of hypertension should start with lifestyle modifi cations, but often requires pharmacologic intervention. The Dietary Approaches to Stop Hyperten-sion (DASH) studies demonstrate that a diet high in fruits and vegetables, with dairy prod-ucts low in fat and an overall reduced sodium content, signifi cantly improves systolic and diastolic blood pressures. Regular exercise can also reduce resting blood pressure levels. Many medications effectively lower blood pressure, as described in Chapters 13 and 17.
Diabetes Mellitus and the Metabolic Syndrome
The global incidence of diabetes mellitus is estimated at 170 million people and projected to grow 40% worldwide by 2030. In the United States alone, 18.2 million people are diabetic, and projections suggest that one in every three children born in 2000 will eventually develop the condition. With a three- to fi vefold in-creased risk of acute coronary events, 80% of diabetic patients succumb to atheroscle-rosis-related conditions, including coronary heart disease, stroke, and peripheral artery disease. Accordingly, some consider diabetes
77237_ch05.indd 13077237_ch05.indd 130 8/11/10 8:11:07 AM8/11/10 8:11:07 AM

Atherosclerosis
131
an atherosclerotic risk equivalent, elevating it to the same risk category as that of people with a history of myocardial infarction.
The predisposition of diabetic patients to atherosclerosis may relate in part to the non-enzymatic glycation of lipoproteins (which enhances uptake of cholesterol by scavenger macrophages, as described earlier), or to a pro-thrombotic tendency and antifi brinolytic state that is often present. Diabetics frequently have impaired endothelial function, gauged by the reduced bioavailability of NO and increased leukocyte adhesion. Tight control of serum glucose levels in diabetic patients reduces the risk of microvascular complications, such as retinopathy and nephropathy. At least one study has also demonstrated a reduction in macrovascular outcomes, such as myocardial infarction and stroke, in patients with type 1 diabetes who followed an intense antidiabetic regimen. In addition, control of hyperten-sion and dyslipidemia in diabetic patients convincingly reduces the risk of cardiac and cerebrovascular complications.
The metabolic syndrome (previously known as the “insulin resistance syndrome” or “syndrome X”) is a descriptor for a clustering of risk factors, including hypertension, hyper-triglyceridemia, reduced HDL, cellular insulin resistance (often leading to glucose intoler-ance), and visceral obesity (excessive adipose tissue in the abdomen). This constellation as-sociates with a high risk for atherosclerosis in both diabetic and nondiabetic patients, and the National Health and Nutrition Examina-tion Survey estimates that an astounding 44% of Americans have the metabolic syndrome based on current guidelines. The presence of insulin resistance in this syndrome appears to promote atherogenesis long before affected persons develop overt diabetes.
Lack of Physical Activity
Exercise may mitigate atherogenesis in several ways. In addition to its benefi cial effects on the lipid profi le and blood pressure, exercise en-hances insulin sensitivity and endothelial pro-duction of NO. Long-term prospective studies of both men and women indicate that even modest activities, such as brisk walking, for as
little as 30 minutes per day can protect against cardiovascular mortality.
Estrogen Status
Cardiovascular disease dominates over other causes of mortality in women, including breast and other cancers. Before menopause, women have a lower incidence of coronary events than men. After menopause, however, men and women have similar rates. This ob-servation suggests that estrogen (the levels of which decline after menopause) may have atheroprotective properties. Physiologic estro-gen levels in premenopausal women raise HDL and lower LDL. Experimentally, estrogen also exhibits potentially benefi cial antioxidant and antiplatelet actions and improves endothelium-dependent vasodilation.
Early observational studies suggested that hormone therapy reduced the risk of coronary artery disease in postmenopausal women, prompting many physicians to prescribe such medications for cardiovascular prevention purposes. However, the Heart and Estrogen/Progestin Replacement Study demonstrated an association between such hormone use and an early increased risk of vascular events in women with preexisting coronary disease. Subsequent randomized primary preven-tion studies from the Women’s Health Initia-tive were terminated prematurely because estrogen-plus-progestin treatment increased cardiovascular risk by 24% overall, with a striking 81% higher risk during the fi rst year of therapy. Of note, these troubling outcomes did not appear in the cohort of patients ran-domized to the estrogen-only arm of the study. Further analyses will help determine if safe hormone therapies are possible. Mean-while, because currently available clinical trial data do not show that gonadal hormone therapy is cardioprotective and that it may ac-tually be harmful, such therapy should not be commenced for the sole goal of reducing cardiovascular risk.
Biomarkers of Cardiovascular Risk
Despite identifi cation of the well-established risk factors just described, one out of fi ve
77237_ch05.indd 13177237_ch05.indd 131 8/11/10 8:11:07 AM8/11/10 8:11:07 AM

Chapter 5
132
cardiovascular events occurs in patients lacking these attributes. In conjunction with growing knowledge about the pathogenesis of athero-sclerosis, several novel markers of risk have emerged. These biomarkers serve three pri-mary roles: (1) as a means to help stratify the risk of atherosclerotic disease and thus guide the choice of therapies, (2) as clinical mea-sures to assess treatment success, and (3) as potential targets of new therapeutic regimens.
Homocysteine
Some studies have shown a signifi cant rela-tionship between elevated circulating levels of the amino acid homocysteine and the in-cidence of coronary, cerebral, and peripheral artery disease. The mechanism by which ho-mocysteine might increase atherosclerotic risk remains undetermined, but current evidence suggests that abnormally high levels may pro-mote oxidative stress, vascular infl ammation, and platelet adhesiveness. Although folic acid and other vitamin B supplements reduce high serum homocysteine levels, clinical trials have not shown that such therapy reduces athero-sclerotic disease or its complications.
Lipoprotein (a)
Lipoprotein (a), referred to as Lp(a) and pro-nounced “L-P-little-a,” has been identifi ed as an independent risk factor for coronary artery disease in some studies. Lp(a) is a variant of LDL whose major apolipoprotein (apo B-100) links by a disulfi de bridge to another protein, apo(a). Apo(a) structurally resembles plas-minogen, a plasma protein important in the endogenous lysis of fi brin clots (see Chapter 7). Thus, the detrimental effect attributed to Lp(a) may relate to competition with normal plasminogen activity. Lp(a) is able to enter the arterial intima, and in vitro studies have shown that it encourages infl ammation and thrombosis.
Lp(a) levels in the population are skewed and not normally distributed, showing a trail-ing prevalence of the higher levels. As with homocysteine, not all population studies sup-port a link between Lp(a) and cardiovascular events, though people with the highest Lp(a)
levels do appear to be at increased risk. Recent GWAS and Mendelian randomization analyses also support a causal link between Lp(a) and cardiovascular events.
Diet and exercise have little impact on Lp(a) levels. Of current lipid-lowering agents, niacin has the greatest effect on Lp(a), lowering its concentration by as much as 20%. However, thus far, there is no evidence that reduction of Lp(a) by drug therapy improves cardiovascu-lar outcomes.
C-Reactive Protein and Other Markersof Infl ammation
Because the pathogenesis of atherosclerosis in-volves infl ammation at every stage, markers of infl ammation have undergone evaluation as predictors of cardiac risk. Recall that the pro-cess of lipoprotein entry and modifi cation in the vessel wall triggers the release of cytok-ines, followed by leukocyte infi ltration, more cytokine release, and smooth muscle migra-tion into—and proliferation within—the in-tima. Involved cytokines (e.g., IL-6) mobilize to the liver and incite increased production of acute-phase reactants, including CRP, fi brino-gen, and serum amyloid A.
Of these molecules, CRP has shown the greatest promise as a marker of low-grade systemic infl ammation associated with athero-sclerotic disease. Large studies of apparently healthy men and women indicate that those with higher basal CRP levels have a greatly increased risk of adverse cardiovascular out-comes, independent of serum cholesterol levels. Recent prospective studies affi rm high-sensitivity CRP as an independent predictor of myocardial infarction, stroke, peripheral artery disease, and sudden cardiac death. Although it serves as a marker of risk not captured by traditional algorithms, there is no convincing evidence that CRP itself is actually a mediator of atherogenesis.
Recent data support the use of CRP levels to guide therapy. The JUPITER trial, a study of 17,800 healthy individuals with above-median levels of CRP but without elevated LDL, dem-onstrated a reduced incidence of major cardio-vascular events among patients who were treated with a statin.
77237_ch05.indd 13277237_ch05.indd 132 8/11/10 8:11:07 AM8/11/10 8:11:07 AM

Atherosclerosis
133
Genetics
Genetic predisposition, as refl ected by fam-ily history, represents a major nonmodifi able risk factor for atherosclerosis. While directly causative genes remain elusive, recent GWAS have identifi ed a number of loci associated with atherosclerotic disease. The strongest connection with CAD and myocardial in-farction localizes to chromosome 9p21.3. This region contains genes that code for two cyclin-dependent kinase inhibitors that are involved in regulation of the cell cycle and may participate in TGF-� inhibitory path-ways. Other associations with CAD include loci on chromosome 6q25.1, which maps to a gene that encodes a mitochondrial C1-tetra-hydrofolate synthase involved in methionine synthesis, and chromosome 2q36.3, a region devoid of known functional genes. It is too early to know whether such fi ndings will ultimately result in enhanced identifi cation, prevention, and treatment of atherosclerotic disease.
Infectious Agents in Atherogenesis
Several studies have identifi ed infectious agents (e.g., herpes viruses, Chlamydia pneu-moniae) within some atherosclerotic lesions, raising the question of their potential role in atherogenesis. These studies have generated substantial controversy, and proof of a causal role is lacking. Although it is unclear if infec-tions truly play a role in atherogenesis, viral and microbial products could plausibly drive aspects of atherogenesis. To date, a number of well-powered trials have not shown that antibiotic treatment directed against infec-tious agents reduces the risk of future car-diac events in survivors of acute coronary syndromes.
Outlook
Despite accumulating knowledge of the patho-genesis of atherosclerosis and its clinical se-quelae, this disease remains a major cause of death in the modern world. Although improve-ments in cardiovascular care have reduced age-adjusted mortality from this condition,
it will continue to be a menace as the popu-lation ages and as developing countries em-brace the adverse dietary and activity habits of a Western lifestyle. Ongoing research of the biology of atherosclerosis, as well as advances in therapeutic procedures and medications, will undoubtedly continue to further our abili-ties to combat this condition. Yet we have not fully capitalized on what we already know—that much cardiovascular risk is modifi able. Effective control of the risk factors described earlier remains a critical component to tame this global scourge. It is here that the patient–physician relationship and the role of medical professionals as community leaders advo-cating healthy lifestyles remain of cardinal importance.
SUMMARY
1. Early in atherogenesis, injurious and in-fl ammatory stimuli activate endothelial and smooth muscle cells. The resulting cascade of events recruits immune cells to the ves-sel wall, fueling a persistent infl ammatory state believed to underlie progression of the disease (see Fig. 5.2).
2. Mechanisms that contribute to atherosclero-sis shape the forming plaque over decades (see Figs. 5.3 through 5.7). Plaques can dis-play features associated with clinical sta-bility or propensity to provoke thrombotic events (so-called “vulnerable” plaques; see Fig. 5.8).
3. Clinical expression of atherosclerosis com-monly results from narrowing of the vessel lumen, from calcifi cation or weakening of the arterial wall, or from plaque disruption with superimposed thrombus formation. Common manifestations include angina pectoris, myocardial infarction, stroke, and peripheral arterial disease (see Fig. 5.10).
4. Modifi able risk factors for atherosclerosis include dyslipidemia, smoking, hyperten-sion, and diabetes. Nonmodifi able risk factors include advanced age, male gen-der, and a family history of premature cor-onary disease. Novel biomarkers, such as CRP, may prove useful in further defi ning risk.
77237_ch05.indd 13377237_ch05.indd 133 8/11/10 8:11:07 AM8/11/10 8:11:07 AM

Chapter 5
134
Acknowledgments
Contributors to the previous editions of this chapter were James L. Young, MD; Rushika Fernandopulle, MD; Gopa Bhattacharyya, MD; Mary Beth Gordon, MD; and Joseph Loscalzo, MD, PhD.
Additional Reading
Ding K, Kullo IJ. Genome-wide association studies for atherosclerotic vascular disease and its risk factors. Circ Cardiovasc Genet. 2009;2:63–72.
Emerging Risk Factors Collaboration. Lipoprotein(a) concentration and the risk of coronary heart dis-ease, stroke, and nonvascular mortality. JAMA. 2009;302:412–423.
Epstein SE, Zhu J, Najafi AH, et al. Insights into the role of infection in atherogenesis and in plaque rupture. Circulation. 2009;119:3133–3141.
Iqbal R, Anand S, Ounpuu S, et al. Dietary patterns and the risk of acute myocardial infarction in 52 countries: results of the INTERHEART study. Cir-culation. 2008;118:1929–1937.
Kuklina EV, Yoon PW, Keenan NL. Trends in high levels of low-density lipoprotein cholesterol in the United States, 1999–2006. JAMA. 2009;302:2104–2110.
Libby P, Nahrendorf M, Pitter MJ, et al. Diversity of denizens of the atherosclerotic plaque: not all monocytes are created equal. Circulation. 2008; 117:3168–3170.
Libby P, Ridker PM, Hansson GK. Infl ammation in atherosclerosis: from pathophysiology to practice. J Am Coll Cardiol. 2009;54:2129–2138.
Melander O, Newton-Cheh C, Almgren P, et al. Novel and conventional biomarkers for predic-tion of incident cardiovascular events in the com-munity. JAMA. 2009;302:49–57.
Miller DT, Ridker PM, Libby P, et al. Atherosclero-sis: the path from genomics to therapeutics. J Am Coll Cardiol. 2007;49:1589–1599.
O’Keefe JH, Carter MD, Lavie CJ. Primary and sec-ondary prevention of cardiovascular diseases: a practical evidence-based approach. Mayo Clin Proc. 2009;84:741–757.
Ridker PM. C-reactive protein: eighty years from discovery to emergence as a major risk marker for cardiovascular disease. Clin Chem. 2009;5:209–215.
Ridker PM, Danielson E, Fonseca FA, et al. Rosu-vastatin to prevent vascular events in men and women with elevated C-reactive protein. N Engl J Med. 2008;359:2195–2207.
Samani NJ, Erdmann J, Hall AS, et al. Genomewide association analysis of coronary artery disease. N Engl J Med. 2007;357:443–453.
Schunkert H, Götz A, Braund P, et al. Repeated rep-lication and a prospective meta-analysis of the association between chromosome 9p21.3 and cor-onary artery disease. Circulation. 2008;117:1675–1684.
77237_ch05.indd 13477237_ch05.indd 134 8/11/10 8:11:07 AM8/11/10 8:11:07 AM

135
C H A P T E R
6Ischemic Heart DiseaseJune-Wha RheeMarc S. SabatineLeonard S. Lilly
DETERMINANTS OF MYOCARDIAL OXYGEN SUPPLY AND DEMANDMyocardial Oxygen SupplyMyocardial Oxygen Demand
PATHOPHYSIOLOGY OF ISCHEMIAFixed Vessel NarrowingEndothelial Cell DysfunctionOther Causes of Myocardial Ischemia
CONSEQUENCES OF ISCHEMIAIschemic Syndromes
CLINICAL FEATURES OF CHRONIC STABLE ANGINAHistoryPhysical Examination
Diagnostic StudiesNatural History
TREATMENTMedical Treatment of an Acute Episode of AnginaMedical Treatment to Prevent Recurrent Ischemic
EpisodesMedical Treatment to Prevent Acute Cardiac EventsRevascularizationMedical Versus Revascularization Therapy
spectrum of syndromes (Table 6.1). For ex-ample, ischemia may be accompanied by the same exertional symptoms described by Heberden. In other cases, it may occur without any clinical manifestations at all, a condition termed silent ischemia. This chapter describes the causes and consequences of chronic isch-emic heart disease syndromes and provides a framework for the diagnosis and treatment of affected patients.
Angina pectoris remains the most com-mon manifestation of ischemic heart disease and literally means “strangling in the chest.” Although other conditions may lead to simi-lar discomfort, angina refers specifi cally to the uncomfortable sensation in the chest and neighboring structures that arises from an
In 1772, the British physician William He-berden reported a disorder in which patients
developed an uncomfortable sensation in the chest when walking. Labeling it angina pecto-ris, Heberden noted that this discomfort would disappear soon after the patient stood still but would recur with similar activities. Although he did not know the cause, it is likely that he was the fi rst to describe the symptoms of ischemic heart disease, a condition of imbalance between myocardial oxygen supply and demand most often caused by atherosclerosis of the coronary arteries. Ischemic heart disease now affl icts mil-lions of Americans and is the leading cause of death in industrialized nations.
The clinical presentation of ischemic heart disease can be highly variable and forms a
77237_ch06.indd 13577237_ch06.indd 135 8/11/10 8:11:56 AM8/11/10 8:11:56 AM
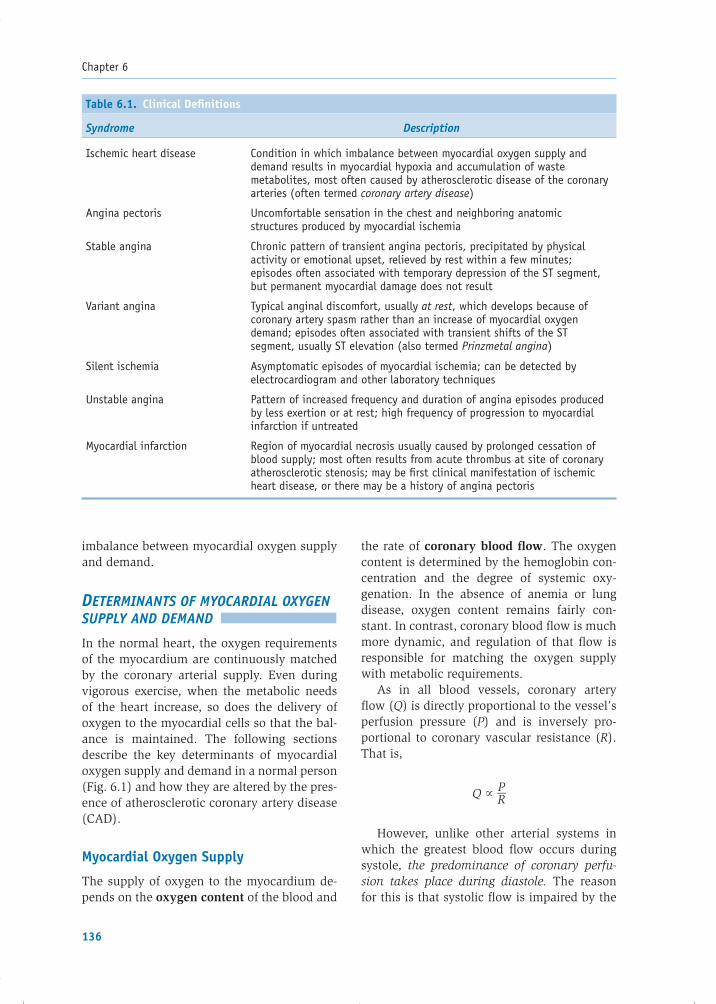
Chapter 6
136
imbalance between myocardial oxygen supply and demand.
DETERMINANTS OF MYOCARDIAL OXYGEN SUPPLY AND DEMAND
In the normal heart, the oxygen requirements of the myocardium are continuously matched by the coronary arterial supply. Even during vigorous exercise, when the metabolic needs of the heart increase, so does the delivery of oxygen to the myocardial cells so that the bal-ance is maintained. The following sections describe the key determinants of myocardial oxygen supply and demand in a normal person (Fig. 6.1) and how they are altered by the pres-ence of atherosclerotic coronary artery disease (CAD).
Myocardial Oxygen Supply
The supply of oxygen to the myocardium de-pends on the oxygen content of the blood and
the rate of coronary blood fl ow. The oxygen content is determined by the hemoglobin con-centration and the degree of systemic oxy-genation. In the absence of anemia or lung disease, oxygen content remains fairly con-stant. In contrast, coronary blood fl ow is much more dynamic, and regulation of that fl ow is responsible for matching the oxygen supply with metabolic requirements.
As in all blood vessels, coronary artery fl ow (Q) is directly proportional to the vessel’s perfusion pressure (P) and is inversely pro-portional to coronary vascular resistance (R). That is,
Q � P __ R
However, unlike other arterial systems in which the greatest blood fl ow occurs during systole, the predominance of coronary perfu-sion takes place during diastole. The reason for this is that systolic fl ow is impaired by the
Table 6.1. Clinical Defi nitions
Syndrome Description
Ischemic heart disease Condition in which imbalance between myocardial oxygen supply and demand results in myocardial hypoxia and accumulation of waste metabolites, most often caused by atherosclerotic disease of the coronary arteries (often termed coronary artery disease)
Angina pectoris Uncomfortable sensation in the chest and neighboring anatomic structures produced by myocardial ischemia
Stable angina Chronic pattern of transient angina pectoris, precipitated by physical activity or emotional upset, relieved by rest within a few minutes; episodes often associated with temporary depression of the ST segment, but permanent myocardial damage does not result
Variant angina Typical anginal discomfort, usually at rest, which develops because of coronary artery spasm rather than an increase of myocardial oxygen demand; episodes often associated with transient shifts of the ST segment, usually ST elevation (also termed Prinzmetal angina)
Silent ischemia Asymptomatic episodes of myocardial ischemia; can be detected by electrocardiogram and other laboratory techniques
Unstable angina Pattern of increased frequency and duration of angina episodes produced by less exertion or at rest; high frequency of progression to myocardial infarction if untreated
Myocardial infarction Region of myocardial necrosis usually caused by prolonged cessation of blood supply; most often results from acute thrombus at site of coronary atherosclerotic stenosis; may be fi rst clinical manifestation of ischemic heart disease, or there may be a history of angina pectoris
77237_ch06.indd 13677237_ch06.indd 136 8/11/10 8:11:57 AM8/11/10 8:11:57 AM

Ischemic Heart Disease
137
compression of the small coronary branches as they course through the contracting myo-cardium. Coronary fl ow is unimpaired in dias-tole because the relaxed myocardium does not compress the coronary vasculature. Thus, in the case of the coronaries, perfusion pressure can be approximated by the aortic diastolic pressure. Conditions that decrease aortic dia-stolic pressure (such as hypotension or aortic valve regurgitation) decrease coronary artery perfusion pressure and may lessen myocardial oxygen supply.
Coronary vascular resistance is the other major determinant of coronary blood fl ow. In the normal artery, this resistance is dynami-cally modulated by (1) forces that externally compress the coronary arteries and (2) factors that alter intrinsic coronary tone.
External Compression
External compression is exerted on the coronary vessels during the cardiac cycle by contraction of the surrounding myocardium. The degree of compression is directly related to intramyocardial pressure and is therefore greatest during systole, as described in the previous section. Moreover, when the myocardium contracts, the subendo-cardium, adjacent to the high intraventricular pressure, is subjected to greater force than are the outer muscle layers. This is one reason that the subendocardium is the region most vulner-able to ischemic damage.
Intrinsic Control of Coronary Arterial Tone
Unlike most tissues, the heart cannot increase oxygen extraction on demand because in its basal state it removes nearly as much oxygen as possible from its blood supply. Thus, any additional oxygen requirement must be met by an increase in blood fl ow, and autoregulation of coronary vascular resistance is the most important mediator of this process. Factors that participate in the regulation of coronary vascular resistance include the accumulation of local metabolites, endothelium-derived sub-stances, and neural innervation.
Metabolic Factors
The accumulation of local metabolites sig-nifi cantly affects coronary vascular tone and acts to modulate myocardial oxygen supply to meet changing metabolic demands. During states of hypoxemia, aerobic metabolism and oxidative phosphorylation in the mitochondria are inhibited. High-energy phosphates, includ-ing adenosine triphosphate (ATP), cannot be regenerated. Consequently, adenosine diphos-phate (ADP) and adenosine monophosphate (AMP) accumulate and are subsequently degraded to adenosine. Adenosine is a potent vasodilator and is thought to be the prime metabolic mediator of vascular tone. By bind-ing to receptors on vascular smooth muscle, adenosine decreases calcium entry into cells, which leads to relaxation, vasodilatation, and
Figure 6.1. Major determinants of myocardial oxygen supply and demand. P, ventricu-lar pressure; r, ventricular radius; h, ventricular wall thickness.
Wall stress(P r/2h)
Heart rate
Contractility
O2 content
Myocardial oxygen supply Myocardial oxygen demand
Coronary blood flow
• coronary perfusion pressure • coronary vascular resistance
• external compression• intrinsic regulation
• local metabolites• endothelial factors• neural innervation
77237_ch06.indd 13777237_ch06.indd 137 8/11/10 8:11:57 AM8/11/10 8:11:57 AM

Chapter 6
138
Endothelium-Derived Relaxing Factor, Nitric Oxide, and the Nobel PrizeBOX 6.1
Normal arterial endothelial cells synthesize potent vasodilator substances that contribute to the modula-tion of vascular tone. Among the fi rst of these to be identifi ed were prostacyclin (an arachidonic acid metabolite) and a substance termed endothelium-derived relaxing factor (EDRF). EDRF was fi rst studied in the 1970s. In experimental preparations, it was shown that acetylcholine (ACh) has two opposite actions on blood vessels. Its direct effect on vascular smooth muscle cells is to cause vasoconstriction, but when an intact endothelial lining overlies the smooth muscle cells, vasodila-tion occurs instead. Subsequent experiments showed that ACh causes the endothelial cells to release a chemical mediator (that was termed EDRF), which quickly diffuses to the adjacent smooth muscle cells and results in their relaxation with subsequent vasodilation of the vessel. Subsequent research demonstrated that the mysterious EDRF is actually the nitric oxide (NO) radi-cal. Binding of ACh (or another endothelial-dependent vasodilator such as serotonin or histamine) to endothelial cells catalyzes the formation of NO from the amino acid L-arginine (see fi gure). NO then dif-fuses to the adjacent vascular smooth muscle, where it activates guanylyl cyclase (G-cyclase). G-cyclase in turn forms cyclic guanosine monophosphate (cGMP), which results in smooth muscle cell relaxation through mechanisms that involve a reduction in cytosolic Ca++.
In contrast to the endothelial-dependent vasodilators, some agents cause smooth muscle relaxation independent of the presence of endothelial cells. For example, the drugs sodium nitroprusside and nitro-glycerin result in vasodilation by providing an exogenous source of NO to vascular smooth muscle cells, thereby activating G-cyclase and forming cGMP without endothelial cell participation. In the cardiac catheterization laboratory, the intracoronary administration of ACh in a normal per-son causes vasodilation of the vessel, presumably through the release of NO. However, in conditions of endothelial dysfunction, such as atherosclerosis, intracoronary ACh administration results in paradoxical vasoconstriction instead. This likely refl ects reduced production of NO by the dysfunctional endothelial cells, resulting in unopposed direct vasoconstriction of the smooth muscle by ACh. Of particular inter-est is that the loss of vasodilatory response to infused ACh is evident in persons with certain cardiac risk factors (e.g., elevated LDL cholesterol, hypertension, cigarette smoking) even before the physical appearance of atheromatous plaque. Thus, the impaired release of NO may be an early and sensitive predictor for the later development of atherosclerotic lesions. The signifi cance of these discoveries was highlighted in 1998, when the Nobel Prize in medicine was awarded to the scientists who discovered the critical role of NO as a cardiovascular signaling molecule.
AGONIST(e.g., ACh, histamine, serotonin)
Nitric oxidesynthase
Nitric oxide
G-cyclase
L-Arginine
GTP cGMP
Nitroprussideor nitroglycerin
RELAXATION
L-Citruline
Nitric oxideO2
Endothelialcell
Smoothmuscle cell
77237_ch06.indd 13877237_ch06.indd 138 8/11/10 8:11:57 AM8/11/10 8:11:57 AM

Ischemic Heart Disease
139
increased coronary blood fl ow. Other meta bolites that act locally as vasodilators include lactate, acetate, hydrogen ions, and carbon dioxide.
Endothelial Factors
Endothelial cells of the arterial wall producenumerous vasoactive substances that contribute to the regulation of vascular tone. Vasodilators produced by the endothelium include nitric oxide (NO), prostacyclin, and endothelium-derived hyperpolarizing factor (EDHF).Endothelin 1 is an example of an endothelium-derived vasoconstrictor.
The discovery and signifi cance of endothelium-derived NO are highlighted in Box 6.1. In brief, NO regulates the vascular tone by diffusing into and then relaxing neighboring arterial smooth muscle by a cyclic guanosine monophosphate (cGMP)–dependent mechanism. The production of NO by normal endothelium occurs in the basal state and is additionally stimulated by many substances and conditions. For example, its release is augmented when the endothelium is exposed to acetylcholine (ACh), thrombin, products of aggregating platelets (e.g., serotonin and ADP), or even the shear stress of blood fl ow. Although the direct effect of many of these
substances on vascular smooth muscle is to cause vasoconstriction, the induced release of NO from the normal endothelium results in vasodilatation instead (Fig. 6.2).
Prostacyclin, an arachidonic acid meta-bolite, has vasodilator properties similar to those of NO (see Fig. 6.2). It is released from endothelial cells in response to many stimuli, including hypoxia, shear stress, ACh, and platelet products (e.g., serotonin). It causes re-laxation of vascular smooth muscle by a cyclic AMP-dependent mechanism.
EDHF also appears to have important vaso-dilatory properties. Like endothelial-derived NO, it is a diffusible substance released by the endothelium that hyperpolarizes (and there-fore relaxes) neighboring vascular smooth muscle cells. EDHF is released by many of the same factors that stimulate NO, including ACh and normal pulsatile blood fl ow. In the coronary circulation, EDHF appears to be more important in modulating relaxation in small ar-terioles than in the large conduit arteries.
Endothelin 1 is a potent vasoconstrictor produced by endothelial cells that partially counteracts the actions of the endothelial vaso-dilators. Its expression is stimulated by several factors, including thrombin, angiotensin II, epi-nephrine, and the shear stress of blood fl ow.
Figure 6.2. Endothelium-derived vasoactive substances and their regu-lators. Endothelium-derived vasodilators are shown on the left and include nitric oxide (NO), prostacyclin, and endothelium-derived hyperpolarizing factor (EDHF). Endothelin 1 is an endothelium-derived vasoconstrictor. In the normal state, the vasodilator infl uence predominates over that of vasoconstriction. ACh, acetylcholine.
ThrombinAngiotensin IIEpinephrine
Endothelin 1Endothelialcell
Smoothmuscle
cell
EDHFNOProstacyclin
EDHF
Endothelial-dependentvasodilators
(ACh, serotonin,thrombin, shear stress)
Relaxation
ContractioncAMP
↓
cGMP
↓
77237_ch06.indd 13977237_ch06.indd 139 8/11/10 8:11:57 AM8/11/10 8:11:57 AM

Chapter 6
140
Under normal circumstances, the healthyendothelium promotes vascular smooth muscle relaxation (vasodilatation) through elaboration of substances such as NO and prostacyclin, the infl uences of which predominate over the endo-thelial vasoconstrictors (see Fig. 6.2). However, as described later in the chapter, dysfunctional endothelium (e.g., in atherosclerotic vessels) secretes reduced amounts of vasodilators, caus-ing the balance to shift toward vasoconstrictioninstead.
Neural Factors
The neural control of vascular resistance has both sympathetic and parasympathetic com-ponents. Under normal circumstances, the contribution of the parasympathetic nervous system appears minor, but sympathetic recep-tors play an important role. Coronary vessels contain both �-adrenergic and �2-adrenergic receptors. Stimulation of �-adrenergic recep-tors results in vasoconstriction, whereas �2-receptors promote vasodilatation.
It is the interplay among the metabolic, endothelial, and neural regulating factors that determines the net impact on coronary vascular tone. For example, catecholamine stimulation of the heart may initially cause coronary vaso-constriction via the �-adrenergic receptor neu-ral effect. However, catecholamine stimulation also increases myocardial oxygen consump-tion through increased heart rate and contrac-tility (�1-adrenergic effect), and the resulting increased production of local metabolites in-duces net coronary dilatation instead.
Myocardial Oxygen Demand
The three major determinants of myocardial oxygen demand are (1) ventricular wall stress, (2) heart rate, and (3) contractility (which is also termed the inotropic state). Additionally, very small amounts of oxygen are consumed in providing energy for basal cardiac meta-bolism and electrical depolarization.
Ventricular wall stress (�) is the tangential force acting on the myocardial fi bers, tending to pull them apart, and energy is expended in opposing that force. Wall stress is related to
intraventricular pressure (P), the radius of the ventricle (r), and ventricular wall thickness (h) and is approximated by Laplace’s relationship:
� � P � r _____ 2h
Thus, wall stress is directly proportional to systolic ventricular pressure. Circumstances that increase pressure development in the left ven-tricle, such as aortic stenosis or hypertension, increase wall stress and myocardial oxygen con-sumption. Conditions that decrease ventricular pressure, such as antihypertensive therapy, re-duce myocardial oxygen consumption.
Because wall stress is also directly propor-tional to the radius of the left ventricle, condi-tions that augment left ventricular (LV) fi lling (e.g., mitral or aortic regurgitation) raise wall stress and oxygen consumption. Conversely, any physiologic or pharmacologic maneuver that decreases LV fi lling and size (e.g., nitrate therapy) reduces wall stress and myocardial oxygen consumption.
Finally, wall stress is inversely proportional to ventricular wall thickness because the force is spread over a greater muscle mass. A hyper-trophied heart has lower wall stress and oxygen consumption per gram of tissue than a thinned-wall heart. Thus, when hypertrophy develops in conditions of chronic pressure overload, such as aortic stenosis, it serves a compensatory role in reducing oxygen consumption.
The second major determinant of myocar-dial oxygen demand is heart rate. If the heart rate accelerates—during physical exertion, for example—the number of contractions and the amount of ATP consumed per minute increases and oxygen requirements rise. Conversely, slowing the heart rate (e.g., with a �-blocker drug) decreases ATP utilization and oxygen consumption.
The third major determinant of oxygen de-mand is myocardial contractility, a measure of the force of contraction (see Chapter 9). Circulating catecholamines, or the administra-tion of positive inotropic drugs, directly increase the force of contraction, which augments oxy-gen utilization. Conversely, negative inotropic effectors, such as �-adrenergic-blocking drugs, decrease myocardial oxygen consumption.
77237_ch06.indd 14077237_ch06.indd 140 8/11/10 8:11:57 AM8/11/10 8:11:57 AM

Ischemic Heart Disease
141
In the normal state, autoregulatory mecha-nisms adjust coronary tone to match myocar-dial oxygen supply with oxygen requirements. In the absence of obstructive coronary disease, these mechanisms maintain a fairly constant rate of coronary fl ow, as long as the aortic per-fusion pressure is approximately 60 mm Hg or greater. In the setting of advanced coronary atherosclerosis, however, the fall in perfusion pressure distal to the arterial stenosis, along with dysfunction of the endothelium of the in-volved segment, sets the stage for a mismatch between the available blood supply and myo-cardial metabolic demands.
PATHOPHYSIOLOGY OF ISCHEMIA
The traditional view has been that myocardial ischemia in CAD results from fi xed atheroscle-rotic plaques that narrow the vessel’s lumen and limit myocardial blood supply. However, recent research has demonstrated that the re-duction of blood fl ow in this condition results from the combination of fi xed vessel narrow-ing and abnormal vascular tone, contributed to by atherosclerosis-induced endothelial cell dysfunction.
Fixed Vessel Narrowing
The hemodynamic signifi cance of fi xed athero-sclerotic coronary artery stenoses relates to both the fl uid mechanics and the anatomy of the vascular supply.
Fluid Mechanics
Poiseuille’s law states that for fl ow through a vessel,
Q � �Pr 4 ______ 8L
in which Q is fl ow, �P is the pressure differ-ence between the points being measured, r is the vessel radius, is the fl uid viscosity, and L is the vessel length. By analogy to Ohm’s law, fl ow is also equal to the pressure differ-ence divided by the resistance (R) to fl ow:
Q � �P ___ R
By combining these two formulas and rear-ranging, resistance to blood fl ow in a vessel can be expressed as:
R � 8L
____ r 4
Thus, vascular resistance is governed, in part, by the geometric component L/r 4. That is, the hemodynamic signifi cance of a stenotic lesion depends on its length and, far more im-portantly, on the degree of vessel narrowing (i.e., the reduction of r) that it causes.
Anatomy
The coronary arteries consist of large, proxi-mal epicardial segments and smaller, distal resistance vessels (arterioles). The proximal vessels are subject to overt atherosclerosis that results in stenotic plaques. The distal vessels are usually free of fl ow-limiting plaques and can adjust their vasomotor tone in response to metabolic needs. These resistance vessels serve as a reserve, increasing their diameter with exertion to meet increasing oxygen de-mand and dilating, even at rest, if a proximal stenosis is suffi ciently severe.
The hemodynamic signifi cance of a coro-nary artery narrowing depends on both the de-gree of stenosis of the epicardial portion of the vessel and the amount of compensatory vaso-dilatation the distal resistance vessels are able to achieve (Fig. 6.3). If a stenosis narrows the lumen diameter by less than 60%, the maximal potential blood fl ow through the artery is not signifi cantly altered and, in response to exer-tion, the resistance vessels can dilate to provide adequate blood fl ow. When a stenosis nar-rows the diameter by more than approximately 70%, resting blood fl ow is normal, but maxi-mal blood fl ow is reduced even with full dilata-tion of the resistance vessels. In this situation, when oxygen demand increases (e.g., from the elevated heart rate and force of contraction dur-ing physical exertion), coronary fl ow reserve is inadequate, oxygen demand exceeds supply, and myocardial ischemia results. If the stenosis compromises the vessel lumen by more than approximately 90%, then even with maximal dilatation of the resistance vessels, blood fl ow
77237_ch06.indd 14177237_ch06.indd 141 8/11/10 8:11:57 AM8/11/10 8:11:57 AM

Chapter 6
142
may be inadequate to meet basal requirements and ischemia can develop at rest.
Although collateral connections (see Chap-ter 1) may become apparent between un-obstructed coronaries and sites distal to atherosclerotic stenoses, and such fl ow can buffer the fall in myocardial oxygen supply, it is often not suffi cient to prevent ischemia dur-ing exertion in critically narrowed vessels.
Endothelial Cell Dysfunction
In addition to fi xed vessel narrowing, the other major contributor to reduced myocardial oxygen supply in chronic CAD is endothelial dysfunc-tion. Abnormal endothelial cell function can contribute to the pathophysiology of ischemia in two ways: (1) by inappropriate vasoconstric-tion of coronary arteries and (2) through loss of normal antithrombotic properties.
Inappropriate Vasoconstriction
In normal persons, physical activity or mental stress results in measurable coronary artery vasodilatation. This effect is thought to be
regulated by activation of the sympathetic ner-vous system, with increased blood fl ow and shear stress stimulating the release of endothelial-derived vasodilators, such as NO. It is pos-tulated that in typical people, the relaxation effect of NO outweighs the direct �-adrenergic constrictor effect of catecholamines on arte-rial smooth muscle, such that vasodilatation results. However, in patients with dysfunc-tional endothelium (e.g., atherosclerosis), an impaired release of endothelial vasodilators leaves the direct catecholamine effect unop-posed, such that relative vasoconstriction occurs instead. The resultant decrease in coro-nary blood fl ow contributes to ischemia. Even the vasodilatory effect of local metabolites (such as adenosine) is attenuated in patients with dysfunctional endothelium, further un-coupling the regulation of vascular tone from metabolic demands.
In patients with risk factors for CAD, such as hypercholesterolemia, diabetes mellitus, hypertension, and cigarette smoking, impaired endothelial-dependent vasodilation is noted even before visible atherosclerotic lesions have developed. This suggests that endothelial dys-function occurs very early in the atheroscle-rotic process.
Inappropriate vasoconstriction also appears to be important in acute coronary syndromes, such as unstable angina and myocardial in-farction (MI). As described in Chapter 7, the usual cause of acute coronary syndromes is disruption of atherosclerotic plaque, with su-perimposed platelet aggregation and thrombus formation. Normally, the products of platelet aggregation in a developing clot (e.g., sero-tonin and ADP) result in vasodilatation be-cause they stimulate the endothelial release of NO. However, with dysfunctional endothelium, the direct vasoconstricting actions of platelet products predominate (Fig. 6.4), further com-promising fl ow through the arterial lumen.
Loss of Normal Antithrombotic Properties
In addition to their vasodilatory actions, factors released from endothelial cells (including NO and prostacyclin) also exert antithrombotic prop-erties by interfering with platelet aggregation (see Fig. 6.4). However, in states of endothelial
Figure 6.3. Resting and maximal coronary blood fl ows are affected by the magnitude of proximal arterial stenosis (percent lesion diameter). The dotted line in-dicates resting blood fl ow, and the solid line represents maximal blood fl ow (i.e., when there is full dilatation of the distal resistance vessels). Compromise of maximal blood fl ow is evident when the proximal stenosis reduces the coronary lumen diameter by more than ~70%. Resting fl ow may be compromised if the stenosis exceeds ~90%. (Modifi ed from Gould KL, Lipscomb K. Effects of coronary stenoses on coronary fl ow reserve and resistance. Am J Car-diol. 1974;34:50.)
Lesion diameter (%)200 40 60 80 100
Nor
mal
ized
mea
n flo
w
5x
4x
3x
2x
1x
Maximal coronary flow
Resting coronary flow
77237_ch06.indd 14277237_ch06.indd 142 8/11/10 8:11:57 AM8/11/10 8:11:57 AM

Ischemic Heart Disease
143
cell dysfunction, release of these substances is reduced; therefore, the antithrombotic effect is attenuated. Thus, in syndromes characterized by thrombosis (i.e., the acute coronary syndromes described in Chapter 7), the impaired release of NO and prostacyclin allows platelets to aggregate and to secrete their potentially harmful proco-agulants and vasoconstrictors.
Other Causes of Myocardial Ischemia
In addition to atherosclerotic CAD, other condi-tions may result in an imbalance between myo-cardial oxygen supply and demand and result in ischemia. Other common causes of decreased myocardial oxygen supply include (1) decreased perfusion pressure due to hypotension (e.g., in
Figure 6.4. The interaction between platelets and endothelial cells. A. Normal endothelium. Aggregating platelets release thromboxane (TXA2) and serotonin (5-HT), the direct vascular effects of which cause contraction of vascular smooth muscle and vasoconstriction. However, platelet products (e.g., ADP and 5-HT) also stimulate the endothelial release of the potent vasodilators nitric oxide (NO) and prostacyclin, such that the net effect is smooth muscle relaxation instead. Endothelial production of NO and prostacy-clin also serves antithrombotic roles, which limit further platelet aggregation. B. Dysfunctional endothelium demonstrates impaired release of the vasodila-tor substances, such that net smooth muscle contraction and vasoconstriction supervene. The reduced endothelial release of NO and prostacyclin diminishes their antiplatelet effect, such that thrombosis proceeds unchecked.
Aggregatingplatelets:
–5-HTADP TXA2
Endothelialcell
Smoothmusclecell
NOProstacyclin
Relaxation Contraction
A
+
Aggregating platelets:
–5-HTADP TXA2
Dysfunctionalendothelium
Smoothmusclecell
↓NO↓Prostacyclin
Relaxation Contraction
B
+
77237_ch06.indd 14377237_ch06.indd 143 8/11/10 8:11:57 AM8/11/10 8:11:57 AM

Chapter 6
144
a patient with hypovolemia or septic shock) and (2) a severely decreased blood oxygen content (e.g., marked anemia, or impaired oxygenation of blood by the lungs). For example, a patient with massive bleeding from the gastrointesti-nal tract may develop myocardial ischemia and angina pectoris, even in the absence of athero-sclerotic coronary disease, because of reduced oxygen supply (i.e., the loss of hemoglobin and hypotension).
On the other side of the balance, a pro-found increase in myocardial oxygen demand can cause ischemia even in the absence of coronary atherosclerosis. This can occur, for example, with rapid tachycardias, acute hyper-tension, or severe aortic stenosis.
CONSEQUENCES OF ISCHEMIA
The consequences of ischemia refl ect the inad-equate myocardial oxygenation and local ac-cumulation of metabolic waste products. For example, during ischemia, myocytes convert from aerobic to anaerobic metabolic pathways. The reduced generation of ATP impairs the in-teraction of the contractile proteins and results in a transient reduction of both ventricular sys-tolic contraction and diastolic relaxation (both of which are energy-dependent processes). The consequent elevation of LV diastolic pressure is transmitted (via the left atrium and pulmonary veins) to the pulmonary capillaries and can pre-cipitate pulmonary congestion and the symptom of shortness of breath (dyspnea). In addition, metabolic products such as lactate, serotonin, and adenosine accumulate locally. It is suspected that one or more of these compounds activate peripheral pain receptors in the C7 through T4 distribution and may be the mechanism by which the discomfort of angina is produced. The accumulation of local metabolites and transient abnormalities of myocyte ion transport may also precipitate arrhythmias (see Chapter 11).
The ultimate fate of myocardium subjected to ischemia depends on the severity and du-ration of the imbalance between oxygen sup-ply and demand. It was previously thought that ischemic cardiac injury results in either irreversible myocardial necrosis (i.e., MI) or rapid and full recovery of myocyte function (e.g., after a brief episode of typical angina).
It is now known that in addition to those out-comes, ischemic insults can sometimes result in a period of prolonged contractile dysfunc-tion without myocyte necrosis, and recovery of normal function may ultimately follow.
For example, stunned myocardium refers to tissue that, after suffering an episode of severe acute, transient ischemia (but not necrosis), demonstrates prolonged systolic dysfunction even after the return of normal myocardial blood fl ow. In this setting, the functional, bio-chemical, and ultrastructural abnormalities following ischemia are reversible and contrac-tile function gradually recovers. The mecha-nism responsible for this delayed recovery of function involves myocyte calcium overload and the accumulation of oxygen-derived free radicals during ischemia. In general, the mag-nitude of stunning is proportional to the de-gree of the preceding ischemia, and this state is likely the pathophysiologic response to an ischemic insult that just falls short of causing irreversible necrosis.
In contrast, hibernating myocardium re-fers to tissue that manifests chronic ventricular contractile dysfunction due to a persistently reduced blood supply, usually because of mul-tivessel CAD. In this situation, irreversible damage has not occurred and ventricular func-tion can promptly improve if appropriate blood fl ow is restored (e.g., by coronary angioplasty or bypass surgery). The clinical importance of stunned or hibernating myocardium is sum-marized in Box 6.2.
Ischemic Syndromes
Depending on the underlying pathophysiologic process and the timing and severity of a myo-cardial ischemic insult, a spectrum of distinct clinical syndromes may result, as illustrated in Figure 6.5.
Stable Angina
Chronic stable angina is manifested as a pat-tern of predictable, transient chest discomfort during exertion or emotional stress. It is gen-erally caused by fi xed, obstructive atheroma-tous plaque in one or more coronary arteries (see Fig. 6.5B). The pattern of symptoms is
77237_ch06.indd 14477237_ch06.indd 144 8/11/10 8:11:57 AM8/11/10 8:11:57 AM

Ischemic Heart Disease
145
usually related to the degree of stenosis. As described in the earlier section on pathophysi-ology, when atherosclerotic stenoses narrow a coronary artery lumen diameter by more than approximately 70%, the reduced fl ow capac-
ity may be suffi cient to serve the low cardiac oxygen needs at rest but is insuffi cient to com-pensate for any signifi cant increase in oxygen demand (see Fig. 6.3). During physical exer-tion, for example, activation of the sympathetic
Clinical Relevance of Stunned and Hibernating MyocardiumBOX 6.2
The concepts of stunned and hibernating myocardium are very important in the clinical setting. Such regions of myocardium contract poorly when imaged (e.g., by echocardiography or contrast angiography) and can appear indistinguishable from irreversibly infarcted heart muscle. However, they can be differ-entiated from necrotic regions by special imaging studies (e.g., dobutamine echocardiography, thallium-201 viability study, or positron emission tomography; see Chapter 3). That distinction infl uences the decision of whether to undertake mechanical reperfusion procedures (percutaneous or surgical), because stunned or hibernating myocardium would be expected to improve with mechanical revascularization, whereas truly infarcted myocardium would not.
Figure 6.5. Pathophysiologic fi ndings in anginal syndromes. A. Normal coronary arteries are widely patent, and the endothelium functions normally. B. In stable angina, atherosclerotic plaque and inappropriate vasoconstriction (caused by dysfunctional endothelium) reduce the vessel lumen’s size and coronary blood fl ow. C. In unstable angina, disruption of the plaque trig-gers platelet aggregation, thrombus formation, and vasoconstriction, all of which contribute to reduced coronary blood supply. D. In variant angina, atherosclerotic plaques are absent; rather, ischemia is due to intense vasospasm that reduces myocardial oxygen supply.
77237_ch06.indd 14577237_ch06.indd 145 8/11/10 8:11:57 AM8/11/10 8:11:57 AM

Chapter 6
146
nervous system results in increased heart rate, blood pressure, and contractility, all of which augment myocardial oxygen consumption. During the period that oxygen demand exceeds available supply, myocardial ischemia results, often accompanied by the chest discomfort of angina pectoris. The ischemia and symptoms persist until the increased demand is alleviated and oxygen balance is restored.
Potentially contributing to the inadequate oxygen supply in stable angina is inappropri-ate coronary vasoconstriction caused, at least in part, by atherosclerosis-associated endothe-lial dysfunction. Recall that normally, the high myocardial oxygen demand during exertion is balanced by an increased supply of blood as the accumulation of local metabolites induces vaso-dilatation. With endothelial cell dysfunction, however, vasodilatation is impaired and the vessels may paradoxically vasoconstrict instead, in response to exercise-induced catecholamine stimulation of �-adrenergic receptors on the coronary artery smooth muscle cells.
As a result, the extent of coronary artery narrowing in patients with atherosclerosis is not necessarily constant. Rather, it can vary from moment to moment because of changes in the superimposed coronary vascular tone. For some patients with stable angina, alterations in tone play a minimal role in the decreased myocardial oxygen supply, and the level of physical activity required to precipitate angina is fairly constant. These patients have fi xed-threshold angina. In other cases, the degree of dynamic obstruction caused by vasoconstric-tion or vasospasm plays a more prominent role, and such patients may have variable-threshold angina. For example, on a given day, a patient with variable-threshold angina can exert her-self or himself without chest discomfort, but on another day, the same degree of myocardial oxygen demand does produce symptoms. The difference refl ects alterations in vascular tone over the sites of fi xed stenosis. Other clinical features of chronic stable angina are described in greater detail later in the chapter.
Unstable Angina
A patient with chronic stable angina may ex-perience a sudden increase in the tempo and
duration of ischemic episodes, occurring with lesser degrees of exertion and even at rest. This acceleration of symptoms is known as unstable angina, which can be a precursor to an acute MI. Unstable angina and acute MI are also known as acute coronary syndromes and result from specifi c pathophysiologic mecha-nisms, most commonly rupture of an unstable atherosclerotic plaque with subsequent plate-let aggregation and thrombosis (see Fig. 6.5C). These syndromes are described in detail in Chapter 7.
Variant Angina
A small minority of patients manifest episodes of focal coronary artery spasm in the absence of overt atherosclerotic lesions, and this syn-drome is known as variant angina or Prin-zmetal angina. In this case, intense vasospasm alone reduces coronary oxygen supply and results in angina (see Fig. 6.5D). The mecha-nism by which such profound spasm develops is not completely understood but may involve increased sympathetic activity in combination with endothelial dysfunction. It is thought that many patients with variant angina may actually have early atherosclerosis manifested only by a dysfunctional endothelium, because the response to endothelium-dependent vaso-dilators (e.g., ACh and serotonin) is often abnormal.
Variant angina often occurs at rest because ischemia in this case results from transient reduction of the coronary oxygen supply rather than an increase in myocardial oxygen demand.
Silent Ischemia
Episodes of cardiac ischemia sometimes occur in the absence of perceptible discom-fort or pain, and such instances are referred to as silent ischemia. These asymptomatic episodes can occur in patients who on other occasions experience typical symptomatic angina. Conversely, in some patients, silent ischemia may be the only manifestation of CAD. It may be diffi cult to diagnose silent ischemia on clinical grounds, but its presence can be detected by laboratory
77237_ch06.indd 14677237_ch06.indd 146 8/11/10 8:11:59 AM8/11/10 8:11:59 AM

Ischemic Heart Disease
147
techniques such as continuous ambulatory electrocardiography or it can be elicited by exercise stress testing, as described later in the chapter. One study estimated that silent ischemic episodes occur in 40% of patients with stable symptomatic angina and in 2.5% to 10% of asymptomatic middle-aged men. When considering the importance of anginal discomfort as a physiologic warning signal, the asymptomatic nature of silent ischemia becomes all the more concerning.
The reason why some episodes of ischemia are silent whereas others are symptomatic has not been elucidated. The degree of ischemia cannot fully explain the disparity, because even MI may present without symptoms in some patients. Silent ischemia has been re-ported to be more common among diabetic patients (possibly due to impaired pain sensa-tion from peripheral neuropathy), the elderly, and in women.
Syndrome X
The term syndrome X refers to patients with typical symptoms of angina pectoris who have no evidence of signifi cant atherosclerotic coro-nary stenoses on coronary angiograms. Some of these patients may show defi nite laboratory signs of ischemia during exercise testing. The pathogenesis of ischemia in this situation may be related to inadequate vasodilator reserve of the coronary resistance vessels. It is thought that the resistance vessels (which are too small to be visualized by coronary angiography) may not dilate appropriately during periods of increased myocardial oxygen demand. Micro-vascular dysfunction, vasospasm, and hyper-sensitive pain perception may each contribute to this syndrome. Patients with syndrome X have a better prognosis than those with overt atherosclerotic disease.
CLINICAL FEATURES OF CHRONIC STABLE ANGINA
History
The most important part of the clinical evalua-tion of ischemic heart disease is the history de-scribed by the patient. Because chest pain is such
a common complaint, it is important to focus on the characteristics that help distinguish myocar-dial ischemia from other causes of discomfort. From a diagnostic standpoint, it would be ideal to interview and examine a patient during an actual episode of angina, but most people are asymptomatic during routine clinic examinations. Therefore, a careful history probing several fea-tures of the discomfort should be elicited.
Quality
Angina is most often described as a “pressure,” “discomfort,” “tightness,” “burning,” or “heavi-ness” in the chest. It is rare that the sensation is actually described as a “pain,” and often a patient will correct the physician who refers to the anginal symptom as such. Sometimes, a pa-tient likens the sensation to “an elephant sitting on my chest.” Anginal discomfort is neither sharp nor stabbing, and it does not vary sig-nifi cantly with inspiration or movement of the chest wall. It is a steady discomfort that lasts a few minutes, yet rarely more than 5 to 10 min-utes. It always lasts more than a few seconds, and this helps to differentiate it from sharper and briefer musculoskeletal pains.
While describing angina, the patient may place a clenched fi st over his or her sternum, referred to as the Levine sign, as if defi ning the constricting discomfort by that tight grip.
Location
Anginal discomfort is usually diffuse rather than localized to a single point. It is most often located in the retrosternal area or in the left pre-cordium but may occur anywhere in the chest, back, arms, neck, lower face, or upper abdo-men. It often radiates to the shoulders and inner aspect of the arms, especially on the left side.
Accompanying Symptoms
During the discomfort of an acute anginal at-tack, generalized sympathetic and parasympa-thetic stimulation may result in tachycardia, diaphoresis, and nausea. Ischemia also results in transient dysfunction of LV systolic contrac-tion and diastolic relaxation. The resultant elevation of LV diastolic pressure is transmitted
77237_ch06.indd 14777237_ch06.indd 147 8/11/10 8:11:59 AM8/11/10 8:11:59 AM

Chapter 6
148
to the pulmonary vasculature and often causes dyspnea during the episode. Transient fatigue and weakness are also common, particularly in elderly patients. When such symptoms occur as a consequence of myocardial ischemia but are unaccompanied by typical chest discomfort, they are referred to as “anginal equivalents.”
Precipitants
Angina, when not caused by pure vasospasm, is precipitated by conditions that increase myocar-dial oxygen demand (e.g., increased heart rate, contractility, or wall stress). These include physi-cal exertion, anger, and other emotional excite-ment. Additional factors that increase myocardial oxygen demand and can precipitate anginal discomfort in patients with CAD include a large meal or cold weather. The latter induces periph-eral vasoconstriction, which in turn augments myocardial wall stress as the left ventricle con-tracts against the increased resistance.
Angina is generally relieved within minutes after the cessation of the activity that precipi-tated it and even more quickly (within 3 to 5 minutes) by sublingual nitroglycerin. This re-sponse can help differentiate myocardial isch-emia from many of the other conditions that produce chest discomfort.
Patients who experience angina primarily due to increased coronary artery tone or vaso-spasm often develop symptoms at rest, inde-pendent of activities that increase myocardial oxygen demand.
Frequency
Although the level of exertion necessary to precipitate angina may remain fairly constant, the frequency of episodes varies considerably because patients quickly learn which activities cause their discomfort and avoid them. It is thus important to inquire about reductions in activi-ties of daily living when taking the history.
Risk Factors
In addition to the description of chest discom-fort, a careful history should uncover risk fac-tors that predispose to atherosclerosis and CAD, including cigarette smoking, dyslipidemia, hypertension, diabetes, and a family history of premature coronary disease (see Chapter 5).
Differential Diagnosis
Several conditions can give rise to symptoms that mimic the transient chest discomfort of angina pectoris, including other cardiac causes (e.g., pericarditis), gastrointestinal disorders (e.g., gastroesophageal refl ux, esophageal spasm, or biliary pain), and musculoskeletal conditions (including chest wall pain, spinal osteoarthritis, and cervical radiculitis). The history remains of paramount importance in distinguishing myocar-dial ischemia from these disorders. In contrast to angina pectoris, gastrointestinal causes of recur-rent chest pain are often precipitated by certain foods and are unrelated to exertion. Musculo-skeletal causes of chest discomfort tend to be more superfi cial or can be localized to a discrete spot (i.e., the patient can point to the pain with one fi nger) and often vary with changes in position. Similarly, the presence of pleuritic pain (sharp pain aggravated by respiratory move-ments) argues against angina as the cause; this symptom is more likely a result of pericarditis, or an acute pulmonary condition such as pulmo-nary embolism or acute pneumothorax. Useful differentiating features of recurrent chest pain are listed in Table 6.2.
Physical Examination
If it is possible to examine a patient during an anginal attack, several transient physical signs may be detected (Fig. 6.6). An increased heart rate and blood pressure are common because of the augmented sympathetic response. Myo-cardial ischemia may lead to papillary muscle dysfunction and therefore mitral regurgitation. Ischemia-induced regional ventricular contrac-tile abnormalities can sometimes be detected as an abnormal bulging impulse on palpation of the left chest. Ischemia decreases ventricu-lar compliance, producing a stiffened ventricle and therefore an S4 gallop on physical exami-nation during atrial contraction (see Chap-ter 2). However, if the patient is free of chest discomfort during the examination, there may be no abnormal cardiac physical fi ndings.
Physical examination should also assess for signs of atherosclerotic disease in more acces-sible vascular beds. For example, carotid bruits may indicate the presence of cerebrovascular dis-ease, whereas femoral artery bruits or diminished
77237_ch06.indd 14877237_ch06.indd 148 8/11/10 8:11:59 AM8/11/10 8:11:59 AM

Ischemic Heart Disease
149
Table 6.2. Causes of Recurrent Chest Pain
Condition Differentiating Features
Cardiac Myocardial ischemia • Retrosternal tightness or pressure; typically radiates to neck, jaw, or left
shoulder and arm• Lasts a few minutes (usually �10)• Brought on by exertion, relieved by rest or nitroglycerin• ECG: transient ST depressions or elevations, or fl attened or inverted T waves
Pericarditis • Sharp, pleuritic pain that varies with position; friction rub on auscultation• Can last for hours to days• ECG: diffuse ST elevations and PR depression
GastrointestinalGastroesophageal refl ux • Retrosternal burning
• Precipitated by certain foods, worsened by supine position, unaffected by exertion
• Relieved by antacids
Peptic ulcer disease • Epigastric ache or burning• Occurs after meals, unaffected by exertion• Relieved by antacids, not by nitroglycerin
Esophageal spasm • Retrosternal pain accompanied by dysphagia• Precipitated by meals, unaffected by exertion• May be relieved by nitroglycerin
Biliary colic • Constant, deep pain in right upper quadrant; can last for hours• Brought on by fatty foods, unaffected by exertion• Not relieved by antacids or nitroglycerin
MusculoskeletalCostochondral syndrome • Sternal pain worsened by chest movement
• Costochondral junctions tender to palpation• Relieved by anti-infl ammatory drugs, not by nitroglycerin
Cervical radiculitis • Constant ache or shooting pains, may be in a dermatomal distribution• Worsened by neck motion
ECG, electrocardiogram.
pulses in the lower extremities can be a clue to peripheral arterial disease (see Chapter 15).
Diagnostic Studies
Once angina is suspected, several diagnostic pro-cedures may be helpful in confi rming myocardial ischemia as the cause. Because many of these tests are costly, it is important to choose the ap-propriate studies for each patient.
Electrocardiogram
One of the most useful tools is an electro-cardiogram (ECG) obtained during an anginal
episode. Although this is easy to arrange when symptoms occur in hospitalized patients, it may not be possible to “catch” episodes in people seen on an outpatient basis. During myocardial ischemia, ST segment and T wave changes commonly appear (Fig. 6.7). Acute ischemia usually results in transient horizontal or downsloping ST segment depressions and T wave fl attening or inversions. Occasionally, ST segment elevations are seen, suggesting more severe transmural myocardial ischemia, and can also be observed during the intense vasospasm of variant angina. In contrast to the ECG of a patient with an acute MI, the
77237_ch06.indd 14977237_ch06.indd 149 8/11/10 8:11:59 AM8/11/10 8:11:59 AM

Chapter 6
150
ST deviations seen in patients with stable an-gina quickly normalize with resolution of the patient’s symptoms. In fact, ECGs obtained during periods free of ischemia are completely normal in approximately half of patients with stable angina. In others, chronic “nondiagnos-tic” ST and T wave deviations may be present. Evidence of a previous MI (e.g., pathologic Q waves) on the ECG also points to the presence of underlying coronary disease.
Stress Testing
Because ECGs obtained during or between episodes of chest discomfort may be normal, such tracings do not rule out underlying isch-emic heart disease. For this reason, provocative
exercise or pharmacologic stress tests are valuable diagnostic and prognostic aids.
Standard Exercise Testing
For many patients suspected of having CAD, a standard exercise test is performed. During this test, the patient exercises on a treadmill or a stationary bicycle to progressively higher workloads and is observed for the development of chest discomfort or excessive dyspnea. The heart rate and ECG are continuously moni-tored, and blood pressure is checked at regular intervals. The test is continued until angina de-velops, signs of myocardial ischemia appear on the ECG, a target heart rate is achieved (85% of the maximal predicted heart rate [MHR]; the
Figure 6.7. Common transient ECG abnormalities during ischemia. Subendocardial ischemia causes ST segment depressions and/or T wave fl attening or inversions. Severe transient transmural ischemia can result in ST segment elevations, similar to the early changes in acute myocardial infarction. When transient ischemia resolves, so do the electrocardiographic changes.
Figure 6.6. Pathophysiology of physical signs during acute myocardial ischemia.
77237_ch06.indd 15077237_ch06.indd 150 8/11/10 8:11:59 AM8/11/10 8:11:59 AM

Ischemic Heart Disease
151
MHR is calculated as 220 beats/min minus the patient’s age), or the patient becomes too fa-tigued to continue.
The test is considered positive if the pa-tient’s typical chest discomfort is reproduced or if ECG abnormalities consistent with ischemia develop (i.e., �1 mm horizontal or downslop-ing ST segment depressions). Among pa-tients who later undergo diagnostic coronary angiography, standard exercise testing has a sensitivity of approximately 65% to 70% and specifi city of 75% to 80% for the detection of anatomically signifi cant CAD.
The stress test is considered markedly posi-tive if one or more of the following signs of se-vere ischemic heart disease occur: (1) ischemic ECG changes develop in the fi rst 3 minutes of exercise or persist 5 minutes after exercise has stopped; (2) the magnitude of the ST segment depressions is �2 mm; (3) the systolic blood pressure abnormally falls during exercise (i.e., resulting from ischemia-induced impairment of contractile function); (4) high-grade ven-tricular arrhythmias develop; or (5) the patient cannot exercise for at least 2 minutes because of cardiopulmonary limitations. Patients with markedly positive tests are more likely to have severe multivessel coronary disease.
The utility of a stress test may be affected by the patient’s medications. For example, �-blockers or certain calcium channel block-ers (verapamil, diltiazem) may blunt the abil-ity to achieve the target heart rate. In these situations, one must consider the purpose of the stress test. If it is to determine whether ischemic heart disease is present, then those medications are typically withheld for 24 to 48 hours before the test. On the other hand, if the patient has known ischemic heart disease and the purpose of the test is to assess the effi cacy of the current medical regimen, testing should be performed while the patient takes his or her usual antianginal medications.
Nuclear Imaging Studies
Because the standard exercise test relies on ischemia-related changes on the ECG, the test is less useful in patients with baseline abnor-malities of the ST segments (e.g., as seen in left bundle branch block or LV hypertrophy).
In addition, the standard exercise stress test sometimes yields equivocal results in patients for whom the clinical suspicion of ischemic heart disease is high. In these situations, radionuclide imaging can be combined with exercise testing to overcome these limitations and to increase the sensitivity and specifi city of the study.
During myocardial perfusion imaging (see Chapter 3), a radionuclide (commonly ei-ther a technetium-99m-labeled compound orthallium-201) is injected intravenously at peak exercise, after which imaging is performed. The radionuclide accumulates in proportion to the degree of perfusion of viable myocar-dial cells. Therefore, areas of poor perfusion (i.e., regions of ischemia) during exercise do not accumulate radionuclide and appear as “cold spots” on the image. However, irrevers-ibly infarcted areas also do not take up the radionuclide, and they too will appear as cold spots. To differentiate between transient isch-emia and infarcted tissue, imaging is also per-formed at rest (either before, or several hours after, the exercise portion of the test). If the cold spot fi lls in, a region of transient ischemia has been identifi ed. If the cold spot remains unchanged, a region of irreversible infarction is likely.
Standard radionuclide exercise tests are 80% to 90% sensitive and approximately 80% specifi c for the detection of clinically signifi -cant CAD. Positron emission tomography (PET; see Chapter 3), another form of nuclear stress imaging that is not as widely available, offers superior spatial and temporal resolution, with sensitivity and specifi city of approximately 90%. Because these techniques are expen-sive, their use in screening for CAD should be reserved for (1) patients in whom baseline ECG abnormalities preclude interpretation of a standard exercise test or for (2) improvement in test sensitivity when standard stress test re-sults are discordant with the clinical suspicion of coronary disease.
Exercise Echocardiography
Exercise testing with echocardiographic im-aging is another technique to diagnose myo-cardial ischemia in patients with baseline ST
77237_ch06.indd 15177237_ch06.indd 151 8/11/10 8:12:00 AM8/11/10 8:12:00 AM

Chapter 6
152
or T wave abnormalities or in those with equivocal standard stress tests. In this proce-dure, LV contractile function is assessed by echocardiography at baseline and immediately after treadmill or bicycle exercise. The test indi-cates inducible myocardial ischemia if regions of ventricular contractile dysfunction develop with exertion and has a sensitivity of approxi-mately 80% and a specifi city of about 90% for the detection of clinically signifi cant CAD.
Pharmacologic Stress Tests
For patients unable to exercise (e.g., those with hip or knee arthritis), pharmacologic stress testing can be performed instead using vari-ous agents, including the inotrope dobutamine (which increases myocardial oxygen demand by stimulating the heart rate and force of con-traction) or the vasodilators dipyridamole or adenosine. Dipyridamole blocks the cellular up-take and destruction of adenosine and thereby increases adenosine’s circulating concentration. When adenosine binds to its vascular receptors, coronary vasodilatation results. As ischemic regions are already maximally dilated (in com-pensation for the epicardial coronary stenoses), the drug-induced vasodilatation increases fl ow to the myocardium perfused by healthy coro-nary arteries and thus “steals” blood away from the diseased segments. These pharmacologic interventions are coupled (in place of exercise) with nuclear imaging or echocardiography, as described above, to reveal regions of impaired myocardial perfusion.
Coronary Angiography
The most direct means of identifying coronary artery stenoses is by coronary angiography, in which atherosclerotic lesions are visual-ized radiographically following the injection ofradiopaque contrast material into the artery (Fig. 6.8; see Chapter 3). Although generally safe, the procedure is associated with a small risk of complications directly related to its in-vasive nature. Therefore, coronary angiogra-phy is typically reserved for patients whose anginal symptoms do not respond adequately to pharmacologic therapy, for those with an unstable presentation, or when the results of
noninvasive testing are so abnormal that severe CAD warranting revascularization is likely.
Although coronary angiography is considered the “gold standard” for the diagnosis of CAD, it should be noted that it provides only anatomic information. The clinical signifi cance of lesions detected by angiography depends not only on the degree of narrowing but also on the pathophysi-ologic consequences. Therefore, treatment deci-sions are made not only on the fi nding of such stenoses but even more so on their functional effects, manifested by the patient’s symptoms, the viability of the myocardium segment served by stenotic vessels, and the degree of ventricular contractile dysfunction. Furthermore, standard arteriography does not reveal the composition of coronary atherosclerotic plaque or its vulner-ability to rupture (see Chapter 5).
Noninvasive Imaging of Coronary Arteries
Cardiac computed tomography (CT) can vi-sualize cardiac anatomy in great detail (see Chapter 3). It is particularly sensitive for the de-tection of coronary artery calcifi cation, which correlates well with the severity of CAD. Con-current administration of intravenous contrast and multidetector scanning permits visualiza-tion of the coronary lumen and stenoses (seeFig. 3.21). CT is not as sensitive as conventional
Figure 6.8. Example of coronary angiography. Injection of the right coronary artery demonstrates a stenosis in the midportion of the vessel, indicated by the arrow. (Courtesy of Pinak B. Shah, MD, Brigham and Women’s Hospital, Bos-ton, MA.)
77237_ch06.indd 15277237_ch06.indd 152 8/11/10 8:12:00 AM8/11/10 8:12:00 AM
Ischemic Heart Disease
153
angiography for defi nition of coronary lesions, and its most helpful role at present is to exclude signifi cant CAD in patients with chest pain and a low clinical suspicion of serious coronarydisease.
Natural History
The patient with chronic angina may show no change in a stable pattern of ischemia for many years. In some patients, however, the course may be punctuated by the occurrence of unstable angina, MI, or sudden cardiac death. These complications are often related to acute thrombosis at the site of disrupted athero-sclerotic plaque (see Chapter 7). Why some patients, but not others, sustain these compli-cations remains a subject of intense clinical and basic science investigation and may relate to the vulnerability of plaque to rupture.
Before the current era of sophisticated phar-macotherapy and coronary revascularization procedures, studies showed that the annual mortality rate of patients with CAD corre-sponded to the number of vessels containing signifi cant stenoses. For example, patients with advanced stenoses within a single coro-nary vessel could expect an annual mortality rate of �4%. Those with two involved vessels had a mortality rate of 7% to 10%, and those with advanced, three-vessel disease showed a 10% to 12% annual mortality rate. If the left main artery was signifi cantly stenosed, the mortality rate was greatly increased (15% to 25%). These outcomes were worse in corre-sponding patients with subnormal ventricular contractile function.
More recent studies have confi rmed that the location and extent of coronary stenoses are important but also that other critical predictors of mortality include (1) the extent of impaired LV contractile function, (2) poor exercise ca-pacity, and (3) the magnitude of clinical an-ginal symptoms. These predictors are taken into account when contemplating treatment decisions.
The mortality associated with CAD has declined signifi cantly in recent decades: the age-adjusted death rate has fallen by more than 50%. This is likely related to (1) athero-sclerotic risk reduction through improved
lifestyle changes (e.g., less tobacco use, less dietary fat consumption, and more exercise); (2) improved therapeutic strategies and lon-gevity following acute coronary syndromes (see Chapter 7); and (3) advances in the pharmacologic and mechanical therapies for chronic CAD.
TREATMENT
The goals of therapy in chronic ischemic heart disease are to decrease the frequency of anginal attacks, to prevent acute coronary syndromes such as MI, and to prolong survival. A long-term crucial step is to address the risk factors that led to the development of atherosclerotic coronary disease. Data convincingly demon-strate the benefi t of smoking cessation, choles-terol improvement, blood pressure control, and serum glucose control in lowering the risk of coronary disease events (see Chapter 5). Im-provements in other risk factors for CAD, in-cluding obesity and physical inactivity, are also likely to reduce the risk of adverse outcomes although the benefi ts of these interventions are less well documented.
The following sections describe medical and surgical strategies to (1) reduce ischemia and its symptoms by restoring the balance be-tween myocardial oxygen supply and demand and (2) prevent acute coronary syndromes and death in patients with chronic CAD.
Medical Treatment of an Acute Episode of Angina
When experiencing acute angina, the patient should cease physical activity. Sublingual nitroglycerin, an organic nitrate, is the drug of choice in this situation. Placed under the tongue, this medication produces a slight burning sensation as it is absorbed through the mucosa, and it begins to take effect in 1 to 2 minutes. Nitrates relieve ischemia primarily through vascular smooth muscle relaxation, particularly venodilatation. Venodilatation reduces venous return to the heart, with a subsequent decline in LV volume (a determi-nant of wall stress). The latter decreases myo-cardial oxygen consumption, thus helping to restore oxygen balance in the ischemic heart.
77237_ch06.indd 15377237_ch06.indd 153 8/11/10 8:12:00 AM8/11/10 8:12:00 AM

Chapter 6
154
A second action of nitrates is to dilate the coronary vasculature, with subsequent aug-mentation of coronary blood fl ow. This effect may be of little value in patients with angina in whom maximal coronary dilatation has al-ready resulted from the accumulation of local metabolites. However, when coronary vasos-pasm plays a role in the development of isch-emia, nitrate-induced coronary vasodilatation may be particularly benefi cial.
Medical Treatment to Prevent Recurrent Ischemic Episodes
Pharmacologic agents are also the fi rst line of defense in the prevention of anginal at-tacks. The goal of these agents is to decrease the cardiac workload (i.e., reduce myocardial oxygen demand) and to increase myocardial perfusion. The three classes of medications most commonly used are the organic nitrates, �-adrenergic blockers, and calcium channel blockers (Table 6.3).
Organic nitrates (e.g., nitroglycerin, iso-sorbide dinitrate, isosorbide mononitrate), as previously mentioned, relieve ischemia primarily through venodilatation (i.e., lower wall stress results from a smaller ventricular radius) and possibly through coronary vaso-dilatation. The organic nitrates are the oldest of the antianginal drugs and come in several preparations (also described in Chapter 17). Sublingual nitroglycerin tablets or sprays are used in the treatment of acute attacks because of their rapid onset of action. In addition, when taken immediately before a person en-gages in activities known to provoke angina, these rapidly acting nitrates are useful asprophylaxis against anginal attacks.
Longer-acting anginal prevention can be achieved through a variety of nitrate prepa-rations, including oral tablets of isosorbide dinitrate (or mononitrate) or a transdermal nitro glycerin patch, which is applied once a day. A limitation to chronic nitrate therapy is the development of drug tolerance (i.e., decreased
Table 6.3. Pharmacologic Agents Used in the Prevention and Treatment of Angina
Drug Class Mechanism of Action Adverse Effects
Organic nitrates ↓ Myocardial O2 demand ↓ Preload (venodilatation)↑ O2 supply ↑ Coronary perfusion ↓ Coronary vasospasm
• Headache• Hypotension• Refl ex tachycardia
�-Blockers ↓ Myocardial O2 demand ↓ Contractility ↓ Heart rate
• Excessive bradycardia• ↓ LV contractile function• Bronchoconstriction• May worsen diabetic control• Fatigue
Calcium channel blockers (agent specifi c; see footnote)
↓ Myocardial O2 demand ↓ Preload (venodilatation) ↓ Wall stress (↓BP) ↓ Contractility (V, D) ↓ Heart rate (V, D)↑ O2 supply ↑ Coronary perfusion ↓ Coronary vasospasm
• Headache, fl ushing • ↓ LV contraction (V, D)• Marked bradycardia (V, D)• Edema (especially N, D)• Constipation (especially V)
Ranolazine ↓ Late phase inward sodium current
• Dizziness, headache• Constipation, nausea
BP, blood pressure; D, diltiazem; LV, left ventricular; N, nifedipine and other dihydropyridine calcium channel antagonists; V, verapamil.
77237_ch06.indd 15477237_ch06.indd 154 8/11/10 8:12:00 AM8/11/10 8:12:00 AM

Ischemic Heart Disease
155
effectiveness of the drug during continued ad-ministration), which occurs to some degree in most patients. This undesired effect can be overcome by providing a nitrate-free interval for several hours each day, usually while the patient sleeps.
There is no evidence that nitrates improve survival or prevent infarctions in patients with chronic CAD, and they are used purely for symptomatic relief. Common side effects in-clude headache, lightheadedness, and palpita-tions induced by vasodilatation and refl ex sinus tachycardia. The latter can be prevented by com-bining a �-blocker with the nitrate regimen.
�-Blockers (see Chapter 17) exert their an-tianginal effect primarily by reducing myocar-dial oxygen demand. They are directed against �-receptors, of which there are two classes: �1-adrenergic receptors are restricted to the myocardium, whereas �2-adrenergic receptors are located throughout blood vessels and the bronchial tree. The stimulation of �1-receptors by endogenous catecholamines and exogenous sympathomimetic drugs increases heart rate and contractility. Consequently, �-adrenergic antagonists decrease the force of ventricular contraction and heart rate, thereby relieving ischemia by reducing myocardial oxygen de-mand. In addition, slowing the heart rate may benefi t myocardial oxygen supply by augment-ing the time spent in diastole, the phase when coronary perfusion primarily occurs.
In addition to suppressing angina, several studies have shown that �-blockers decrease the rates of recurrent infarction and mortal-ity following an acute MI (see Chapter 7). Moreover, they have been shown to reduce the likelihood of an initial MI in patients with hypertension. Thus, �-blockers are fi rst-line chronic therapy in the treatment of CAD.
�-Blockers are generally well tolerated but have several potential side effects. For exam-ple, they may precipitate bronchospasm in pa-tients with underlying asthma by antagonizing �2-receptors in the bronchial tree. Although �1-selective blockers are theoretically less likely to exacerbate bronchospasm in such patients, drug selectivity for the �1-receptor is not com-plete, and in general, all �-blockers should be used cautiously, or avoided, in patients with signifi cant obstructive airway disease.
�-Blockers are also generally not used in pa-tients with acutely decompensated LV dysfunc-tion because they could intensify heart failure symptoms by further reducing inotropy. (How-ever, as described in Chapter 9, �-blockers ac-tually improve outcomes in patients with stable chronic heart failure conditions.) �-Blockers are also relatively contraindicated in patients with marked bradycardia or certain types of heart block to avoid additional impairment of electrical conduction.
�-Blockers sometimes cause fatigue and sexual dysfunction. They should be used with caution in insulin-treated diabetic patients be-cause they can mask tachycardia and other catecholamine-mediated responses that can warn of hypoglycemia. One might also expect that �-blockers would decrease myocardial blood perfusion by blocking the vasodilat-ing �2-adrenergic receptors on the coronary arteries. However, this effect is usually attenu-ated by autoregulation and vasodilation of the coronary vessels owing to the accumulation of local metabolites.
Calcium channel blockers (see Chapter 17) antagonize voltage-gated L-type calcium channels, but the actions of the individual drugs of this group vary. The dihydropyridines (e.g., nifedipine and amlodipine) are potent vasodilators. They relieve myocardial ischemia by (1) decreasing oxygen demand (venodila-tion reduces ventricular fi lling and size, arterial dilation reduces the resistance against which the left ventricle contracts, and both actions reduce wall stress) and (2) increasing myocardial oxy-gen supply via coronary dilatation. By the latter mechanism, they are also potent agents for the relief of coronary artery vasospasm.
Nondihydropyridine calcium channel blockers (verapamil and diltiazem) also act as vasodilators but are not as potent in this re-gard as the dihydropyridines. However, these agents have additional benefi cial antiangi-nal effects stemming from their more potent cardiac depressant actions: they reduce the force of ventricular contraction (contractility) and slow the heart rate. Accordingly, vera-pamil and diltiazem also decrease myocardial oxygen demand by these mechanisms.
Questions have been raised about the safety of short-acting calcium channel–blocking drugs
77237_ch06.indd 15577237_ch06.indd 155 8/11/10 8:12:00 AM8/11/10 8:12:00 AM
Chapter 6
156
in the treatment of ischemic heart disease. In meta-analyses of randomized trials, these drugs have been associated with an increased incidence of MI and mortality. The adverse ef-fect may relate to the rapid hemodynamic ef-fects and blood pressure swings induced by the short-acting agents. Therefore, only long-acting calcium channel blockers (i.e., prepa-rations taken once a day) are recommended in the treatment of chronic angina, generally as second-line drugs if symptoms are not con-trolled by �-blockers and nitrates.
The three standard groups of antianginal drugs described in this section can be used alone or in combination. However, care should be taken in combining a �-blocker with a nondihydropyridine calcium channel blocker (verapamil or diltiazem) because the additive negative chronotropic effect can cause exces-sive bradycardia and the combined negative inotropic effect could precipitate heart failure in patients with LV contractile dysfunction.
Ranolazine, a fourth type of anti-ischemic therapy, is the most recent to become avail-able. This medication has been shown to decrease the frequency of anginal episodes and improve exercise capacity in patients with chronic CAD but differs from other anti-ischemic drugs in that it does not affect the heart rate or blood pressure. Although its mechanism of action has not been fully elucidated, it is believed to inhibit the late phase of the action potential’s inward sodium current (INa
) in ven-tricular myocytes. That late phase tends to be abnormally enhanced in ischemic myocardium, and the associated increased sodium infl ux re-sults in higher-than-normal intracellular Ca (mediated by the trans-sarcolemmal Na –Ca exchanger; see Fig. 1.10). Such calcium overload is thought to result in impaired diastolic relax-ation and contractile ineffi ciency. Inhibition of the late INa
by ranolazine counters these patho-logic effects. Recent studies have supported ra-nolazine’s effectiveness in reducing angina and its long-term safety, when used alone or in com-bination with other antianginal agents.
Although useful in controlling symptoms of angina, none of the antianginal drug groups has been shown to slow or reverse the atheroscle-rotic process responsible for the arterial lesions
of chronic CAD. Moreover, although �-blockers have demonstrated mortality benefi ts in patients after MI, none of these agents has been shown to improve longevity in patients with chronic stable angina and preserved LV function.
Medical Treatment to Prevent Acute Cardiac Events
Platelet aggregation and thrombosis are key ele-ments in the pathophysiology of acute MI and unstable angina (see Chapter 7). Antiplatelet therapy reduces the risk of these acute coronary syndromes in patients with chronic angina and should be a standard part of the regimen used to treat CAD. Aspirin has antithrombotic actions through inhibition of platelet aggregation (and therefore reduces the release of platelet-derived procoagulants and vasoconstrictors) as well as anti-infl ammatory properties that may be im-portant in stabilizing atheromatous plaque. Un-less contraindications are present (e.g., allergy or gastric bleeding), aspirin should be contin-ued indefi nitely in all patients with CAD.
Clopidogrel, a thienopyridine, is one of a group of novel antiplatelet agents that block the platelet P2Y12 ADP receptor, thereby pre-venting platelet activation and aggregation (see Chapter 17). It can be used as an antiplatelet substitute in patients who are allergic to as-pirin. In addition, the combination of aspirin and clopidogrel is superior to aspirin alone in reducing death and ischemic complications in patients with acute coronary syndromes and in those undergoing elective percutaneous coro-nary stenting. Similarly, in patients with a his-tory of MI, long-term treatment with aspirin plus clopidogrel is associated with fewer sub-sequent cardiac events than aspirin alone.
Lipid-regulating therapy also reduces cardiovascular clinical events. In particular, HMG-CoA reductase inhibitors (“statins”; see Chapter 17) lower MI and death rates in pa-tients with established coronary disease and in those at high risk of developing CAD. The benefi ts of statin therapy are believed to ex-tend beyond their lipid-altering effects, be-cause there is evidence that they decrease vascular infl ammation and improve endo-thelial cell dysfunction and thus may help stabilize atherosclerotic plaques. All patients
77237_ch06.indd 15677237_ch06.indd 156 8/11/10 8:12:00 AM8/11/10 8:12:00 AM

Ischemic Heart Disease
157
with CAD should have their LDL cholesterol maintained at �100 mg/dL. Moreover, trials ofpatients with established atherosclerotic disease have demonstrated that intensive lipid lowering (with high-dose statin therapy) is superior to moderate lipid-lowering therapy in preventing ischemic events and cardiovascular death. As a result, current national guidelines include an optional goal of LDL �70 mg/dL for patients with known CAD, especially those at highest risk (e.g., following an acute coronary syn-drome or those with multiple major risk factors, especially diabetes or continued smoking).
Angiotensin-converting enzyme (ACE) inhibitors, known to be benefi cial in the treat-ment of hypertension (see Chapter 13), heart failure (see Chapter 9), and following MI (see Chapter 7), have been studied more recently as chronic therapy for patients with stable CAD not complicated by heart failure. Some (but not all) of these trials have shown reduced rates of death, MI, and stroke. Thus, many cardiologists recom-mend that an ACE inhibitor be included in the medical regimen of patients with chronic CAD.
Revascularization
Patients with angina that becomes asymptom-atic during pharmacologic therapy are usually followed along by their physicians with contin-ued emphasis on cardiac risk factor reduction. However, coronary revascularization is pursued if (1) the patient’s symptoms of angina do not respond adequately to antianginal drug therapy, (2) unacceptable side effects of medications occur, or (3) the patient is found to have high-risk coronary disease for which revasculariza-tion is known to improve survival (as described in the next section). The two techniques used to accomplish mechanical revascularization are percutaneous coronary intervention (PCI) and coronary artery bypass graft (CABG) surgery.
PCIs include percutaneous transluminal coronary angioplasty (PTCA), a procedure per-formed under fl uoroscopy in which a balloon-tipped catheter is inserted through a peripheral artery (usually, femoral, brachial, or radial) and maneuvered into the stenotic segment of a coro-nary vessel. The balloon at the end of the cathe-ter is then infl ated under high pressure to dilate the stenosis, after which the balloon is defl ated
and the catheter is removed from the body. The improvement in the size of the coronary lumen increases coronary perfusion and myocardial oxygen supply. Effective dilatation of the steno-sis results from compression of the atheroscle-rotic plaque and often by creating a fracture within the lesion and stretching the underlying media. The risk of MI during the procedure is less than 1.5%, and mortality is less than 1%. Unfortunately, approximately one third of patients who undergo balloon angio plasty develop recurrent symptoms within 6 months owing to restenosis of the dilated artery and require additional coronary interventions.
For this reason coronary stents were de-veloped, for implantation at the time of PCI, and have been shown to signifi cantly reduce the rate of restenosis. Such stents are slender, cage-like metal support devices that in their collapsed confi guration can be threaded into the region of stenosis by a catheter. Once in position, the stent is expanded into its open position by infl ating a high-pressure balloon in its interior (Fig. 6.9). The balloon and attached
Figure 6.9. Placement of a coronary artery stent. A. A stent, in its original collapsed state, is advanced into the coronary stenosis on a balloon catheter. B. The balloon is infl ated to expand the stent. C. The balloon is defl ated and the catheter is removed from the body, leaving the stent permanently in place.
Artery wall
Ballooncatheter
Stent incollapsedconfiguration
StenosisA
Balloon inflation to expand stent
B
C
77237_ch06.indd 15777237_ch06.indd 157 8/11/10 8:12:00 AM8/11/10 8:12:00 AM

Chapter 6
158
catheter are then removed, but the stent is left permanently in place to serve as a scaffold to maintain arterial patency. Because stents are thrombogenic, a combination of oral antiplate-let agents (commonly, aspirin plus clopidogrel) is crucial after stent implantation.
Compared with conventional balloon angio-plasty, stent implantation decreases restenosis rates and reduces the need for repeat PCIs. Al-though restenosis resulting from vessel elastic recoil is greatly diminished by standard metal stent placement, neointimal proliferation (i.e., migration of smooth muscle cells and produc-tion of extracellular matrix) remains an impor-tant cause of in-stent restenosis and recurrent anginal symptoms.
To address the problem of in-stent resteno-sis after PCI, drug-eluting stents were devised. These special stents are fabricated with a poly-mer coat that incorporates an antiproliferative medication such as sirolimus (an immunosup-pressive agent that inhibits T-cell activation), everolimus (an immunosuppressive similar to sirolimus), or paclitaxel (which interferes with cellular microtubule function). The medica-tion is released from the stent over a period of 2 to 4 weeks, and this approach has shown great effect at preventing neointimal prolifera-tion and reducing the need for repeat revas-cularization by more than half. However, just as neointimal proliferation is slowed, so too is protective endothelialization of the stent. The delay in endothelial cell coverage of the metal struts leaves patients at risk for throm-bus formation within the stent should anti-platelet agents be discontinued prematurely. Therefore, prolonged courses of combination antiplatelet therapy (e.g., aspirin plus clopi-dogrel for at least 12 months) followed by aspi-rin indefi nitely are necessary for patients who receive drug-eluting stents.
Although percutaneous revascularization techniques are generally superior to standard medical therapy for relief of angina, it is im-portant to note that in the setting of stable coronary disease (i.e., not an acute coronary syndrome), they have not been shown to re-duce the risk of MI or death.
CABG surgery entails grafting portions of a patient’s native blood vessels to bypass obstructed coronary arteries. Two types of surgical grafts
are used (Fig. 6.10). The fi rst employs native veins—typically, a section of the saphenous vein (a “superfl uous” vessel removed from the leg) that is sutured from the base of the aorta to a coronary segment downstream from the region of stenosis. The second method uses arterial grafts—most commonly, an in-ternal mammary artery (IMA, a “superfl uous” branch of each subclavian artery)—that can be directly anastomosed distal to a stenotic coro-nary site. Vein grafts have a patency rate of up to 80% at 12 months but are vulnerable to accelerated atherosclerosis; 10 years after surgery, more than 50% have occluded. In contrast, IMA grafts are more resistant to ath-erosclerosis with a patency rate of 90% at 10 years. Therefore, IMA grafts are often used to perfuse sites of critical fl ow such as the left an-terior descending artery. Clinical trial evidence supports the use of aggressive lipid-lowering drug therapy after CABG to improve the long-term patency rates of bypass grafts.
In recent years, less invasive surgical alterna-tives to conventional CABG have been explored. These include “minimally invasive” operations with smaller incisions, the use of transcutane-ous ports with videoscopic robotic assistance,
Figure 6.10. Coronary artery bypass surgery. Two types of bypasses are illustrated: 1) The left internal mammary artery originates from the left subclavian artery, and in this schematic, it is anastomosed to the left anterior descending (LAD) coronary artery distal to obstructing plaque; 2) One end of a saphenous vein graft is sutured to the proximal aorta and the other end to the right coronary artery (RCA) distal to a stenotic segment.
LAD
Obstructingplaque
RCA
Internalmammaryartery graft
Saphenousvein graft
LCx
SVC
Aorta
Pulmonary artery
77237_ch06.indd 15877237_ch06.indd 158 8/11/10 8:12:00 AM8/11/10 8:12:00 AM

Ischemic Heart Disease
159
and “off-pump” procedures, which avoid the use of cardiopulmonary bypass (heart-lung) machines. Current studies are examining the advantages and limitations of these techniques in comparison with standard CABG.
Medical Versus Revascularization Therapy
Many patients with chronic, stable angina can be successfully managed with pharma-cologic therapy alone. However, if anginal symptoms prove refractory to optimal medi-cal therapy, or if intolerable drug side effects develop, coronary angiography is usually rec-ommended for further therapeutic planning. For patients whose angina is controlled by medications, it is standard to perform non-invasive testing (e.g., exercise testing, echocardiography) to identify those with high-risk disease, because the long-term prognosis for such patients can be improved by coronary revascularization.
Once the coronary anatomy is defi ned, the decision to proceed with percutaneous inter-vention or bypass graft surgery depends on several considerations, including those listed in Table 6.4. In general, patients with persistent episodes of angina and signifi cant stenoses in one to two coronary arteries are good candi-dates for PCI, as are certain lower-risk patients with three-vessel disease. Conversely, patients who fare better over the long term with CABG include those with signifi cant (�50%) stenosis
of the left main coronary artery and patients with multivessel disease who also have re-duced LV contractile function.
Each of the previously described ap-proaches for the treatment of coronary disease is benefi ting from rapidly developing research advancements. New surgical techniques (in-creased use of various arterial grafts, less inva-sive operations), new drug-eluting stents (e.g., incorporation of bioabsorbable/biodegradable polymers to decrease late stent thrombosis), novel adjuncts to stenting (potent antithrom-botic drugs), and progress in pharmacologic management (e.g., aggressive use of statins and antithrombotic drugs) will likely further improve outcomes and better defi ne the best therapeutic approaches for specifi c subsets of patients with chronic CAD.
SUMMARY
1. Cardiac ischemia results from an imbalance between myocardial oxygen supply and demand. Myocardial oxygen supply is determined by the oxygen content of the blood and coronary blood fl ow. The latter is dependent on the coronary perfusion pres-sure and coronary vascular resistance. Key regulators of myocardial oxygen demand include myocardial wall stress, heart rate, and contractility.
2. In the presence of atherosclerotic disease, myocardial oxygen supply is compromised.
Table 6.4. Relative Advantages of Coronary Revascularization Procedures
Percutaneous Coronary Interventions (PCI)
Coronary Artery Bypass Graft Surgery (CABG)
Less invasive than CABG
Shorter hospital stay andeasier recuperation than CABG
Superior to pharmacologic therapy for relief of angina
More effective for long-term relief of angina than PCI or pharmacologic therapy
Most complete revascularization
Improved survival in patients with • �50% left main stenosis• 3-vessel CAD, especially if LV contractile function is impaired• 2-vessel disease with tight (�75%) LAD stenosis, especially
if LV contractile function is impaired• Diabetes and multivessel disease
CAD, coronary artery disease; LV, left ventricle; LAD, left anterior descending coronary artery; MI, myocardial infarction.
77237_ch06.indd 15977237_ch06.indd 159 8/11/10 8:12:01 AM8/11/10 8:12:01 AM

Chapter 6
160
Atherosclerotic plaques cause vascular lumen narrowing and reduce coronary blood fl ow. In addition, atherosclerosis-associated endothelial cell dysfunction causes inappropriate vasoconstriction of the coronary resistance vessels.
3. Angina pectoris is the most frequent symptom of intermittent ischemia, and its diagnosis relies heavily on the patient’s description of the discomfort. Angina may be accompanied by signs and symptoms of adrenergic stimulation, pulmonary conges-tion, and transient LV systolic and diastolic dysfunction.
4. The diagnosis of angina can be aided by laboratory studies, including the ECG (ST segment and T wave abnormalities), exer-cise (or pharmacologic) stress testing, and conventional or CT angiography.
5. Standard pharmacologic therapy for chronic angina includes agents to prevent ischemia and relieve symptoms (mainly organic ni-trates, �-blockers, calcium channel antago-nists, alone or in combination) as well as agents that reduce the risk of acute coro-nary syndromes and death (e.g., aspirin, antilipidemic therapy, and consideration of ACE inhibitors). Modifi able risk factors for atherosclerosis should be corrected.
6. Revascularization with PCI or CABG sur-gery may provide relief from ischemia in patients with chronic angina who are re-fractory to, or unable to tolerate, medical therapy. CABG confers improved survival rates to certain high-risk groups.
Acknowledgments
Contributors to the previous editions of this chap-ter were Haley Naik, MD, Christopher P. Chiodo, MD, Carey Farquhar, MD, Anurag Gupta, MD, Rainu Kaushal, MD, William Carlson, MD, Michael E. Mendelsohn, MD, Patrick T. O’Gara, MD, Marc S. Sabatine, MD, and Leonard S. Lilly, MD.
Additional Reading
Abrams J. Chronic stable angina. N Eng J Med. 2005; 352:2524–2533.
The BARI 2D Study Group. A randomized trial of therapies for type 2 diabetes and coronary artery disease. N Engl J Med. 2009;360:2503–2515.
Fraker TD Jr, Fihn SD, Gibbons RJ, et al. 2007 chronic angina focused update of the ACC/AHA 2002 guidelines for the management of patients with chronic stable angina: a report of the Ameri-can College of Cardiology/American Heart Asso-ciation Task Force on Practice Guidelines Writing Group to develop the focused update of the 2002 guidelines. Circulation. 2007;116:2762–2772.
Hannan EL, Wu C, Walford G, et al. Drug-eluting stents vs. coronary-artery bypass grafting in multivessel coronary disease. N Engl J Med. 2008;358:331–341.
King SB III, Smith SC Jr, Hirshfeld JW Jr, et al. 2007 Fo-cused Update of the ACC/AHA/SCAI. 2005 Guide-line Update for Percutaneous Coronary Intervention: a report of the American College of Cardiology/American Heart Association Task Force on Practice Guidelines. Circulation. 2008;117:261–295.
Nash DT, Nash SD. Ranolazine for chronic stable angina. Lancet. 2008;372:1335–1341.
Patel MR, Dehmer GJ, Hirshfeld JW, et al. ACCF/SCAI/STS/AATS/AHA/ASNC 2009 appropri-ateness criteria for coronary revascularization: a report of the American College of Cardiology Foundation Appropriateness Criteria Task Force, Society for Cardiovascular Angiography and Inter-ventions, Society of Thoracic Surgeons, American Association for Thoracic Surgery, American Heart Association, and the American Society of Nuclear Cardiology. Circulation. 2009;119:1330–1352.
Serruys PW, Kutryk MJB, Ong ATL. Coronary-artery stents. N Engl J Med. 2006;354:483–495.
Serruys PW, Morice MC, Kappetein AP, et al. SYNTAX Investigators. Percutaneous coronary intervention versus coronary-artery bypass grafting for severe coronary artery disease. N Engl J Med. 2009;360:961–972.
Tonino PA, De Bruyne B, Pijls NH, et al. FAME Study Investigators. Fractional fl ow reserve versus angiography for guiding percutaneous coronary intervention. N Engl J Med. 2009;360:213–224.
77237_ch06.indd 16077237_ch06.indd 160 8/11/10 8:12:01 AM8/11/10 8:12:01 AM

161
C H A P T E R
7Acute Coronary SyndromesJune-Wha RheeMarc S. SabatineLeonard S. Lilly
PATHOGENESIS OF ACUTE CORONARY SYNDROMESNormal HemostasisEndogenous Antithrombotic MechanismsPathogenesis of Coronary ThrombosisNonatherosclerotic Causes of Acute Coronary
SyndromesPATHOLOGY AND PATHOPHYSIOLOGYEarly Changes in InfarctionLate Changes in InfarctionFunctional Alterations
CLINICAL FEATURES OF ACUTE CORONARY SYNDROMESClinical PresentationDiagnosis of Acute Coronary SyndromesTREATMENT OF ACUTE CORONARY SYNDROMESAcute Treatment of Unstable Angina and Non–ST-
Elevation Myocardial Infarction
Acute Treatment of ST-Elevation Myocardial Infarction
Adjunctive Therapies
COMPLICATIONSRecurrent IschemiaArrhythmiasMyocardial DysfunctionRight Ventricular InfarctionMechanical ComplicationsPericarditisThromboembolism
RISK STRATIFICATION AND MANAGEMENT FOLLOWING MYOCARDIAL INFARCTION
The frequency of ACS is staggering: more than 1.4 million people are admitted to hospi-tals in the United States each year with these conditions. Approximately 38% of patients who experience an ACS will die as a result. Despite these daunting statistics, mortality as-sociated with ACS has actually substantially and continuously declined in recent decades as a result of major therapeutic and preven-tive advances. This chapter considers the
Acute coronary syndromes (ACS) are life-threatening conditions that can punctuate
the course of patients with coronary artery dis-ease at any time. These syndromes form a con-tinuum that ranges from an unstable pattern of angina pectoris to the development of a large acute myocardial infarction (MI), a condition of irreversible necrosis of heart muscle (Fig. 7.1). All ACS share a common initiating pathophysio-logic mechanism, as this chapter will examine.
77237_ch07.indd 16177237_ch07.indd 161 8/11/10 8:12:34 AM8/11/10 8:12:34 AM

Chapter 7
162
against bleeding. This process begins within seconds of vessel injury and is mediated by circulating platelets, which adhere to collagen in the vascular subendothelium and aggregate to form a “platelet plug.” While the primary hemostatic plug forms, the exposure of sub-endothelial tissue factor triggers the plasma coagulation cascade, initiating the process of secondary hemostasis. The plasma coagulation proteins involved in secondary hemostasis are sequentially activated at the site of injury and ultimately form a fi brin clot by the action of thrombin. The resulting clot stabilizes and strengthens the platelet plug.
The normal hemostatic system minimizes blood loss from injured vessels, but there is little difference between this physiologic re-sponse and the pathologic process of coronary thrombosis triggered by disruption of athero-sclerotic plaques.
Endogenous Antithrombotic Mechanisms
Normal blood vessels, including the coronary arteries, are replete with safeguards that prevent spontaneous thrombosis and occlusion, some examples of which are shown in Figure 7.2.
Inactivation of Clotting Factors
Several natural inhibitors tightly regulate the coagulation process to oppose clot formation and maintain blood fl uidity. The most impor-tant of these are antithrombin, proteins C and S, and tissue factor pathway inhibitor (TFPI).
Antithrombin is a plasma protein that irre-versibly binds to thrombin and other clotting factors, inactivating them and facilitating their clearance from the circulation (see mecha-nism 1 in Fig. 7.2). The effectiveness of anti-thrombin is increased 1,000-fold by binding to heparan sulfate, a heparin-like molecule normally present on the luminal surface of endothelial cells.
events that lead to ACS, the pathologic and functional changes that follow, and therapeu-tic approaches that ameliorate the aberrant pathophysiology.
PATHOGENESIS OF ACUTE CORONARY SYNDROMES
More than 90% of ACS result from disruption of an atherosclerotic plaque with subsequent platelet aggregation and formation of an intra-coronary thrombus. The thrombus transforms a region of plaque narrowing to one of severe or complete occlusion, and the impaired blood fl ow causes a marked imbalance between myo-cardial oxygen supply and demand. The form of ACS that results depends on the degree of coronary obstruction and associated ischemia (see Fig. 7.1). A partially occlusive thrombus is the typical cause of the closely related syn-dromes unstable angina (UA) and non–ST-elevation myocardial infarction (NSTEMI, historically referred to as non–Q-wave MI), with the latter being distinguished from the former by the presence of myocardial necrosis. At the other end of the spectrum, if the throm-bus completely obstructs the coronary artery, the results are more severe ischemia and a larger amount of necrosis, manifesting as an ST-elevation myocardial infarction (STEMI, historically referred to as Q-wave MI).
The responsible thrombus in ACS is generated by interactions among the atherosclerotic plaque, the coronary endothelium, circulating platelets, and the dynamic vasomotor tone of the vessel wall, which overwhelm the natural antithrom-botic mechanisms described in the next section.
Normal Hemostasis
When a normal blood vessel is injured, the endothelial surface becomes disrupted and thrombogenic connective tissue is exposed. Primary hemostasis is the fi rst line of defense
Figure 7.1. The continuum of acute coronary syndromes ranges from unstable angina, through non–ST-elevation myocardial infarction (MI), to ST-elevation MI.
ACUTE CORONARY SYNDROMES
UNSTABLE ANGINA NON–ST-ELEVATION MI ST-ELEVATION MI
77237_ch07.indd 16277237_ch07.indd 162 8/11/10 8:12:35 AM8/11/10 8:12:35 AM

Acute Coronary Syndromes
163
combined factor Xa–TFPI binds to and inacti-vates the complex of tissue factor with factor VIIa that normally triggers the extrinsic coagu-lation pathway (see mechanism 3 in Fig. 7.2). Thus, TFPI serves as a negative feedback in-hibitor that interferes with coagulation.
Lysis of Fibrin Clots
Tissue plasminogen activator (tPA) is a pro-tein secreted by endothelial cells in response to many triggers of clot formation. It cleaves the protein plasminogen to form active plas-min, which in turn enzymatically degrades fi -brin clots (see mechanism 4 in Fig. 7.2). When tPA binds to fi brin in a forming clot, its ability to convert plasminogen to plasmin is greatly enhanced.
Protein C/protein S/thrombomodulin form a natural anticoagulant system that inactivates the “acceleration” factors of the coagulation pathway (i.e., factors Va and VIIIa). Protein C is synthesized in the liver and circulates in an inactive form. Thrombomodulin is a thrombin-binding receptor normally present on endothe-lial cells. Thrombin bound to thrombomodulin cannot convert fi brinogen to fi brin (the fi nal re-action in clot formation). Instead, the thrombin–thrombomodulin complex activates protein C. Activated protein C degrades factors Va and VIIIa (see mechanism 2 in Fig. 7.2), thereby in-hibiting coagulation. The presence of protein S in the circulation enhances the inhibitory func-tion of protein C.
TFPI is a plasma serine protease inhibitor that is activated by coagulation factor Xa. The
Figure 7.2. Endogenous protective mechanisms against thrombosis and vessel occlusion. (1) Inactivation of thrombin by antithrombin (AT), the effectiveness of which is enhanced by binding of AT to heparan sulfate. (2) Inactivation of clotting factors Va and VIIIa by activated protein C (protein C*), an action that is enhanced by protein S. Protein C is activated by the thrombomodulin (TM)–thrombin complex. (3) Inactivation of factor VII/tissue factor complex by tissue factor pathway inhibitor (TFPI). (4) Lysis of fi brin clots by tissue plasminogen activator (tPA). (5) Inhibition of platelet activation by prostacyclin and NO.
Plasminogen
Plasmin
Fibrinsplit
products
InactivatedVa,VIIIafactors
ProstacyclinandNO
Irreversiblethrombininhibition
Thrombin
Antithrombin
Heparansulfate
Fibrinclot
Protein S
Protein C*
Protein C
ThrombinTM
tPA
VII
TFPI
Xa
–
4
3
52
1
Tissuefactor
77237_ch07.indd 16377237_ch07.indd 163 8/11/10 8:12:35 AM8/11/10 8:12:35 AM

Chapter 7
164
associated with atherosclerotic lesions may overwhelm these defenses and result in coro-nary thrombosis and vessel occlusion (Fig. 7.3). Atherosclerosis contributes to thrombus forma-tion by (1) plaque rupture, which exposes the circulating blood elements to thrombogenic substances, and (2) endothelial dysfunction with the loss of normal protective antithrom-botic and vasodilatory properties.
Atherosclerotic plaque rupture is consid-ered the major trigger of coronary thrombosis. The underlying causes of plaque disruption are (1) chemical factors that destabilize athero-sclerotic lesions and (2) physical stresses to which the lesions are subjected. As described in Chapter 5, atherosclerotic plaques consist of a lipid-laden core surrounded by a fi brous external cap. Substances released from infl am-matory cells within the plaque can compromise the integrity of the fi brous cap. For example, T lymphocytes elaborate �-interferon, which inhibits collagen synthesis by smooth muscle cells and thereby interferes with the usual strength of the cap. Additionally, cells within
Endogenous Platelet Inhibitionand Vasodilatation
Prostacyclin is synthesized and secreted by endothelial cells (see mechanism 5 in Fig. 7.2), as described in Chapter 6. Prostacyclin increases platelet levels of cyclic AMP and thereby strongly inhibits platelet activation and aggre-gation. It also indirectly inhibits coagulation via its potent vasodilating properties. Vasodilata-tion helps guard against thrombosis by aug-menting blood fl ow (which minimizes contact between procoagulant factors) and by reducing shear stress (an inducer of platelet activation).
Nitric oxide (NO) is similarly secreted by endothelial cells, as described in Chapter 6. It acts locally to inhibit platelet activation, and it too serves as a potent vasodilator.
Pathogenesis of Coronary Thrombosis
Normally, the mechanisms shown in Figure 7.2serve to prevent spontaneous intravascular thrombus formation. However, abnormalities
Figure 7.3. Mechanisms of coronary thrombus formation. Factors that contribute to this process include plaque disruption (e.g., rupture) and inappropriate vasoconstriction and loss of normal antithrombotic defenses because of dysfunctional endothelium.
Atherosclerosis
77237_ch07.indd 16477237_ch07.indd 164 8/11/10 8:12:35 AM8/11/10 8:12:35 AM

Acute Coronary Syndromes
165
Not only is dysfunctional endothelium less equipped to prevent platelet aggregation, but also is less able to counteract the vasoconstrict-ing products of platelets. During thrombus for-mation, vasoconstriction is promoted both by platelet products (thromboxane and serotonin) and by thrombin within the developing clot. The normal platelet-associated vascular re-sponse is vasodilatation, because platelet prod-ucts stimulate endothelial NO and prostacyclin release, the infl uences of which predominate over direct platelet-derived vasoconstrictors (see Fig. 6.4). However, reduced secretion of endothelial vasodilators in atherosclerosis al-lows vasoconstriction to proceed unchecked. Similarly, thrombin in a forming clot is a po-tent vascular smooth muscle constrictor in the setting of dysfunctional endothelium. Vaso-constriction causes torsional stresses that can contribute to plaque rupture or can transiently occlude the stenotic vessel through heightened arterial tone. The reduction in coronary blood fl ow caused by vasoconstriction also reduces the washout of coagulation proteins, thereby enhancing thrombogenicity.
Signifi cance of Coronary Thrombosis
The formation of an intracoronary thrombus results in one of the several potential outcomes (Fig. 7.4). For example, plaque rupture is sometimes superfi cial, minor, and self-limited, such that only a small, nonocclusive throm-bus forms. In this case, the thrombus may simply become incorporated into the growing atheromatous lesion through fi brotic organiza-tion, or it may be lysed by natural fi brinolytic mechanisms. Recurrent asymptomatic plaque ruptures of this type may cause gradual pro-gressive enlargement of the coronary stenosis.
However, deeper plaque rupture may result in greater exposure of subendothelial collagen and tissue factor, with formation of a larger thrombus that more substantially occludes the vessel’s lumen. Such obstruction may cause prolonged severe ischemia and the develop-ment of an ACS. If the intraluminal thrombus at the site of plaque disruption totally occludes the vessel, blood fl ow beyond the obstruction will cease, prolonged ischemia will occur, and an MI (usually an ST-elevation MI) will result.
atherosclerotic lesions produce enzymes (e.g., metalloproteinases) that degrade the interstitial matrix, further compromising plaque stability. A weakened or thin-capped plaque is subject to rupture, particularly in its “shoulder” region (the border with the normal arterial wall that is subjected to high circumferential stress) either spontaneously or by physical forces, such as intraluminal blood pressure and torsion from the beating myocardium.
ACS sometimes occur in the setting of cer-tain triggers, such as strenuous physical activ-ity or emotional upset. The activation of the sympathetic nervous system in these situations increases the blood pressure, heart rate, and force of ventricular contraction—actions that may stress the atherosclerotic lesion, thereby causing the plaque to fi ssure or rupture. In ad-dition, MI is most likely to occur in the early morning hours. This observation may relate to the tendency of key physiologic stressors (such as systolic blood pressure, blood viscos-ity, and plasma epinephrine levels) to be most elevated at that time of day, and these factors subject vulnerable plaques to rupture.
Following plaque rupture, thrombus forma-tion is provoked via the mechanisms shown in Figure 7.3. The exposure of tissue factor from the atheromatous core triggers the coagulation pathway, while the exposure of subendothelial collagen activates platelets. Activated platelets release the contents of their granules, which include facilitators of platelet aggregation (e.g., adenosine diphosphate [ADP] and fi brinogen), activators of the coagulation cascade (e.g., factor Va), and vasoconstrictors (e.g., throm-boxane and serotonin). The developing intra-coronary thrombus, intraplaque hemorrhage, and vasoconstriction all contribute to narrow-ing the vessel lumen, creating turbulent blood fl ow that contributes to shear stress and fur-ther platelet activation.
Dysfunctional endothelium, which is ap-parent even in mild atherosclerotic coronary disease, also increases the likelihood of throm-bus formation. In the setting of endothelial dysfunction, reduced amounts of vasodilators (e.g., NO and prostacyclin) are released and inhibition of platelet aggregation by these fac-tors is impaired, resulting in the loss of a key defense against thrombosis.
77237_ch07.indd 16577237_ch07.indd 165 8/11/10 8:12:35 AM8/11/10 8:12:35 AM

Chapter 7
166
(Table 7.1). These should be suspected when an ACS occurs in a young patient or a person with no coronary risk factors. For example, coronary emboli from mechanical or infected cardiac valves may lodge in the coronary cir-culation, infl ammation from acute vasculitis can initiate coronary occlusion, or patients with connective tissue disorders, or peripar-tum women, can rarely experience a sponta-neous coronary artery dissection (a tear in the vessel wall, described in Chapter 15). Occa-sionally, intense transient coronary spasm can suffi ciently reduce myocardial blood supply to result in UA or infarction.
Another cause of ACS is cocaine abuse. Co-caine increases sympathetic tone by blocking the presynaptic reuptake of norepinephrine and by enhancing the release of adrenal cat-echolamines, which can lead to vasospasm and therefore decreased myocardial oxygen supply. An ACS may ensue because of in-creased myocardial oxygen demand resulting from cocaine-induced sympathetic myocardial stimulation (increased heart rate and blood pressure) in the face of the decreased oxygen supply.
Conversely, if the thrombus partially occludes the vessel (or if it totally occludes the vessel but only transiently because of spontaneous recanalization or by relief of superimposed vasospasm), the severity and duration of isch-emia will be less, and a smaller NSTEMI or UA is the more likely outcome. The distinc-tion between NSTEMI and UA is based on the degree of the ischemia and whether the event is severe enough to cause necrosis, indicated by the presence of certain serum biomarkers (see Fig. 7.4). Nonetheless, NSTEMI and UA act quite alike, and the management of these entities is similar.
Occasionally, a non–ST-elevation infarct may result from total coronary occlusion. In this case, it is likely that a substantial collat-eral blood supply (see Chapter 1) limits the ex-tent of necrosis, such that a larger ST-elevation MI is prevented.
Nonatherosclerotic Causes of Acute Coronary Syndromes
Infrequently, mechanisms other than acute thrombus formation can precipitate an ACS
Figure 7.4. Consequences of coronary thrombosis. A small thrombus formed on superfi cial plaque rupture may not result in symptoms or electrocardiogram (ECG) abnormalities, but healing and fi brous organization may incorporate the thrombus into the plaque, causing the atherosclerotic lesion to enlarge. A partially occlusive thrombus (with or without superimposed vasospasm) narrows the arterial lumen, restricts blood fl ow, and can cause unstable angina or a non–ST-elevation MI, either of which may result in ST segment depression and/orT wave inversion on the ECG. A totally occlusive thrombus with prolonged ischemia is the most common cause of ST-elevation MI, in which the ECG initially shows ST segment elevation, followed by Q wave development. An occlusive thrombus that recanalizes, or one that develops in a region served by adequate collateral blood fl ow, may result in less prolonged ischemia and a non–ST-elevation MI instead. Markers of myocardial necrosis include cardiac-specifi c troponins and creatine kinase MB isoenzyme.
Coronary thrombus
Partially occlusivethrombus
Small thrombus(non–flow limiting)
Occlusivethrombus
ST segmentdepression and/orT wave inversion
Unstable angina Non–ST-segmentelevation MI
(Transientischemia) (Prolonged
ischemia)
No ECGchanges ST elevation
(Q waves later)
Healing andplaque enlargement
ST-segmentelevation MI
77237_ch07.indd 16677237_ch07.indd 166 8/11/10 8:12:35 AM8/11/10 8:12:35 AM

Acute Coronary Syndromes
167
the mass of myocardium perfused by the oc-cluded vessel, (2) the magnitude and duration of impaired coronary blood fl ow, (3) the oxy-gen demand of the affected region, (4) the ad-equacy of collateral vessels that provide blood fl ow from neighboring nonoccluded coronary arteries, and (5) the degree of tissue response that modifi es the ischemic process.
The pathophysiologic alterations that tran-spire during MI occur in two stages: early changes at the time of acute infarction and late changes during myocardial healing and remodeling.
Early Changes in Infarction
Early changes include the histologic evolution of the infarct and the functional impact of oxy-gen deprivation on myocardial contractility. These changes culminate in coagulative necro-sis of the myocardium in 2 to 4 days.
Cellular Changes
As oxygen levels fall in the myocardium supplied by an abruptly occluded coronary vessel, there is a rapid shift from aerobic to anaerobic metabolism (Fig. 7.5). Because mitochondria can no longer oxidize fats or products of glycolysis, high-energy phosphate production drops dramatically and anaerobic glycolysis leads to the accumulation of lactic acid. This results in a lowered pH.
Furthermore, the paucity of high-energy phosphates such as adenosine triphosphate (ATP) interferes with the transmembrane Na�–K�-ATPase, with resultant elevation in the concentrations of intracellular Na� and extra-cellular K�. Rising intracellular Na� contributes to cellular edema. Membrane leak and rising
PATHOLOGY AND PATHOPHYSIOLOGY
MI (either STEMI or NSTEMI) results when myocardial ischemia is suffi ciently severe to cause myocyte necrosis. Although by defi nition UA does not result in necrosis, MI may subse-quently ensue if the underlying pathophysiol-ogy of the unstable pattern of angina is not promptly corrected.
In addition to their clinical classifi cations, in-farctions can be described pathologically by the extent of necrosis they produce within the myo-cardial wall. Transmural infarcts span the entire thickness of the myocardium and result from total, prolonged occlusion of an epicardial coro-nary artery. Conversely, subendocardial infarcts exclusively involve the innermost layers of the myocardium. The subendocardium is particularly susceptible to ischemia because it is the zone sub-jected to the highest pressure from the ventricular chamber, has few collateral connections that sup-ply it, and is perfused by vessels that must pass through layers of contracting myocardium.
Infarction represents the culmination of a disastrous cascade of events, initiated by ischemia, that progresses from a potentially reversible phase to irreversible cell death. Myocardium that is supplied directly by an oc-cluded vessel may die quickly. The adjacent tissue may not necrose immediately because it may be suffi ciently perfused by nearby pat-ent vessels. However, the neighboring cells may become increasingly ischemic over time, as demand for oxygen continues in the face of decreased oxygen supply. Thus, the region of infarction may subsequently extend out-ward. The amount of tissue that ultimately succumbs to infarction therefore relates to (1)
Table 7.1. Causes of Acute Coronary Syndromes
• Atherosclerotic plaque rupture with superimposed thrombus• Vasculitic syndromes (see Chapter 15)• Coronary embolism (e.g., from endocarditis, artifi cial heart valves)• Congenital anomalies of the coronary arteries• Coronary trauma or aneurysm• Severe coronary artery spasm (primary or cocaine-induced)• Increased blood viscosity (e.g., polycythemia vera, thrombocytosis)• Spontaneous coronary artery dissection• Markedly increased myocardial oxygen demand (e.g., severe aortic stenosis)
77237_ch07.indd 16777237_ch07.indd 167 8/11/10 8:12:35 AM8/11/10 8:12:35 AM

Chapter 7
168
An acute infl ammatory response, with infi l-tration of neutrophils, begins after approximately 4 hours and incites further tissue damage. Within 18 to 24 hours, coagulation necrosis is evident with pyknotic nuclei and bland eosinophilic cytoplasm, seen by light microscopy. These early changes are demonstrated in Figure 7.6 and summarized in Table 7.2.
Gross Changes
Gross morphologic changes do not appear until 18 to 24 hours after coronary occlusion, although certain staining techniques (e.g., tetrazolium) permit the pathologist to identify regions of infarc-tion earlier. Most often, ischemia and infarction begin in the subendocardium and then extend laterally and outward toward the epicardium.
Late Changes in Infarction
Late pathologic changes in the course of acute MI (see Table 7.2) include (1) the clearing of necrotic myocardium and (2) the deposition of collagen to form scar tissue.
Irreversibly injured myocytes do not re-generate; rather, the cells are removed andreplaced by fi brous tissue. Macrophages invade the infl amed myocardium shortly after neutro-phil infi ltration and remove necrotic tissue.
extracellular K� concentration contributes to alterations in the transmembrane electrical po-tential, predisposing the myocardium to lethal arrhythmias. Intracellular calcium accumulates in the damaged myocytes and is thought to con-tribute to the fi nal common pathway of cell de-struction through the activation of degradative lipases and proteases.
Collectively, these metabolic changes de-crease myocardial function as early as 2 min-utes following occlusive thrombosis. Without intervention, irreversible cell injury ensues in 20 minutes and is marked by the development of membrane defects. Proteolytic enzymes leak across the myocyte’s altered membrane, dam-aging adjacent myocardium, and the release of certain macromolecules into the circulation serves as a clinical marker of acute infarction.
Edema of the myocardium develops within 4 to 12 hours, as vascular permeability increases and interstitial oncotic pressure rises (because of the leak of intracellular proteins). The earli-est histologic changes of irreversible injury are wavy myofi bers, which appear as intercellular edema separates the myocardial cells that are tugged about by the surrounding, functional myocardium (Fig. 7.6). Contraction bands can often be seen near the borders of the infarct: sarcomeres are contracted and consolidated and appear as bright eosinophilic belts.
Figure 7.5. Mechanisms of cell death in myocardial infarction. Acute ischemia rapidly depletes the intracellular supply of adenosine triphosphate (ATP) as aerobic metabolism fails. Subsequent intracellular acidosis and impairment of ATP-dependent processes culminate in intracellular calcium accumulation, edema, and cell death.
Myocardial hypoxia
Impaired Na+, K+-ATPase Anaerobic metabolism
ATPProteasesLipases
Chromatin clumpingProtein denaturation
Arrhythmias
Intracellularedema
Alteredmembranepotential
Cell death
ExtracellularK+
IntracellularNa+
IntracellularCa++
IntracellularH+
ATP
77237_ch07.indd 16877237_ch07.indd 168 8/11/10 8:12:35 AM8/11/10 8:12:35 AM

Acute Coronary Syndromes
169
Figure 7.6. Pathologic evolution in acute myocardial infarction. A. Early wavy myofi bers and edema; viable myo-cardium is at lower left. B. Coagulation necrosis and dense infi ltration of neutrophils. C. Necrotic myocytes largely removed by phagocytes (7 to 10 days); viable myocardium at lower left. D. Granulation tissue with early collagen deposition; new capillaries have formed (arrows). E. Late fi brotic scarring. (Reprinted with permission from Schoen FJ. Interventional and Surgical Cardiovascular Pathology—Clinical Correlations and Basic Principles. Philadelphia, PA: Saunders; 1989:67.)
77237_ch07.indd 16977237_ch07.indd 169 8/11/10 8:12:35 AM8/11/10 8:12:35 AM

Chapter 7
170
This period of tissue resorption is termed yellow softening because connective tissue el-ements are destroyed and removed along with dead myocardial cells. The phagocytic clearing, combined with thinning and dilatation of the infarcted zone, results in structural weakness of the ventricular wall and the possibility of myocardial wall rupture at this stage. Fibrosis subsequently ensues, and scarring is complete by 7 weeks after infarction (see Fig. 7.6).
Functional Alterations
Impaired Contractility and Compliance
The destruction of functional myocardial cells in infarction quickly leads to impaired ventri cular contraction (systolic dysfunction). Cardiac output is further compromised because synchro-nous contraction of myocytes is lost. Specifi c terms are used to describe the types of wall mo-tion abnormalities that can result. A localized region of reduced contraction is termed hypo-kinetic, a segment that does not contract at all is called akinetic, and a dyskinetic region is one that bulges outward during contraction of the remaining functional portions of the ventricle.
During ACS, the left ventricle is also adversely compromised by diastolic dysfunction. Ischemia
and/or infarction impair diastolic relaxation (an energy-dependent process; see Chapter 1), which reduces ventricular compliance and contributes to elevated ventricular fi lling pressures.
Stunned Myocardium
Sometimes transient myocardial ischemia can result in a very prolonged, but gradually re-versible, period of contractile dysfunction. For example, as described in Chapter 6, stunned myocardium is tissue that demonstrates pro-longed systolic dysfunction after a discrete episode of severe ischemia, despite restoration of adequate blood fl ow, and gradually regains contractile force days to weeks later. Stunning may play an important role in patients with UA or in myocardium adjacent to the region of an acute infarction. In both instances, prolonged contractile dysfunction of affected ventricular segments may be evident after the event, sim-ulating infarcted tissue. However, if the tissue is simply stunned rather than necrotic, its function will recover over time.
Ischemic Preconditioning
Brief ischemic insults to a region of myocar-dium may render that tissue more resistant to
Table 7.2. Pathologic Time Line in Transmural Infarction
Time Event
Early changes1–2 min ATP levels fall; cessation of contractility
10 min 50% depletion of ATP; cellular edema, decreased membrane potential and susceptibility to arrhythmias
20–24 min Irreversible cell injury
1–3 hr Wavy myofi bers
4–12 hr Hemorrhage, edema, PMN infi ltration begins
18–24 hr Coagulation necrosis (pyknotic nuclei with eosinophilic cytoplasm), edema
2–4 days Total coagulation necrosis (no nuclei or striations, rimmed by hyperemictissue); monocytes appear; PMN infi ltration peaks
Late changes5–7 days Yellow softening from resorption of dead tissue by macrophages
7� days Ventricular remodeling
7 weeks Fibrosis and scarring complete
ATP, adenosine triphosphate; PMN, polymorphonuclear leukocyte.
77237_ch07.indd 17077237_ch07.indd 170 8/11/10 8:12:36 AM8/11/10 8:12:36 AM

Acute Coronary Syndromes
171
reduce short- and long-term mortality after in-farction (as discussed later in the chapter).
CLINICAL FEATURES OF ACUTE CORONARY SYNDROMES
Because ACS represent disorders along a continuum, their clinical features overlap. In general, the severity of symptoms and associ-ated laboratory fi ndings progress from UA on one side of the continuum, through NSTEMI, to STEMI on the other end of the continuum (see Fig. 7.1). Distinguishing among these syndromes is based on the clinical presenta-tion, electrocardiographic fi ndings, and serum biomarkers of myocardial damage. To institute appropriate immediate therapy, the most im-portant distinction to make is between ACS that cause ST segment elevation on the elec-trocardiogram (STEMI) and those acute syn-dromes that do not (UA and NSTEMI).
Historically, MIs have been classifi ed as Q-wave or non–Q-wave infarctions. Dogma held that transmural infarcts produce Q waves (after an initial period of ST elevation) on the electrocardiogram (ECG), whereas subendo-cardial infarcts generate ST depressions with-out Q wave development. However, it is now known that these ECG fi ndings do not reliably correlate with the pathologic fi ndings and that much overlap exists among the types of infarc-tion. Moreover, the use of Q waves to classify ACS is now less clinically important, because Q waves, unlike ST changes, may take hours or longer to develop and cannot be used to make early therapeutic decisions. Thus, in this book (and in clinical settings), the terms STEMI and NSTEMI are used instead of Q-wave and non–Q-wave MI, respectively.
Clinical Presentation
Unstable Angina
UA presents as an acceleration of ischemic symptoms in one of the following three ways: (1) a crescendo pattern in which a patient with chronic stable angina experiences a sudden in-crease in the frequency, duration, and/or in-tensity of ischemic episodes; (2) episodes of angina that occur at rest, without provocation;
subsequent episodes, a phenomenon termed ischemic preconditioning. The clinical rel-evance is that patients who sustain an MI in the context of recent angina experience less morbidity and mortality than those without preceding ischemic episodes. The mechanism of this phenomenon is unknown but appears to involve multiple signaling pathways. Sub-stances released during ischemia, including adenosine and bradykinin, are believed to be key triggers of these pathways.
Ventricular Remodeling
Following an MI, changes occur in the geom-etry of both the infarcted and the noninfarcted ventricular muscle. Such alterations in cham-ber size and wall thickness affect long-term cardiac function and prognosis.
In the early post-MI period, infarct expan-sion may occur, in which the affected ven-tricular segment enlarges without additional myocyte necrosis. Infarct expansion represents thinning and dilatation of the necrotic zone of tissue, likely because of “slippage” between the muscle fi bers, resulting in a decreased volume of myocytes in the region. Infarct expansion can be detrimental because it increases ventricular size, which (1) augments wall stress, (2) impairs systolic contractile function, and (3) increases the likelihood of aneurysm formation.
In addition to early expansion of the infarcted territory, remodeling of the ventricle may also involve dilatation of the overworked nonin-farcted segments, which are subjected to in-creased wall stress. This dilatation begins in the early postinfarct period and continues over the ensuing weeks and months. Initially, chamber dilatation serves a compensatory role because it increases cardiac output via the Frank–Starling mechanism (see Chapter 9), but progressive en-largement may ultimately lead to heart failure and predisposes to ventricular arrhythmias.
Adverse ventricular remodeling can be ben-efi cially modifi ed by certain interventions. At the time of infarction, for example, reperfu-sion therapies limit infarct size and therefore decrease the likelihood of infarct expansion. In addition, drugs that interfere with the renin–angiotensin system have been shown to attenuate progressive remodeling and to
77237_ch07.indd 17177237_ch07.indd 171 8/11/10 8:12:36 AM8/11/10 8:12:36 AM

Chapter 7
172
or (3) the new onset of anginal episodes, de-scribed as severe, in a patient without previous symptoms of coronary artery disease. These presentations are different from the pattern of chronic stable angina, in which instances of chest discomfort are predictable, brief, and nonprogressive, occurring only during physi-cal exertion or emotional stress. Patients with UA may progress further along the continuum of ACS and develop evidence of necrosis (i.e., acute NSTEMI or STEMI) unless the condition is recognized and promptly treated.
Acute Myocardial Infarction
The symptoms and physical fi ndings of acute MI (both STEMI and NSTEMI) can be predicted from the pathophysiology described earlier in this chapter and are summarized in Table 7.3. The discomfort experienced during an MI re-sembles angina pectoris qualitatively but is usu-ally more severe, lasts longer, and may radiate more widely. Like angina, the sensation may result from the release of mediators such as ad-enosine and lactate from ischemic myocardial cells onto local nerve endings. Because ischemia in acute MI persists and proceeds to necrosis, these provocative substances continue to ac-cumulate and activate afferent nerves for lon-ger periods. The discomfort is often referred to other regions of the C7 through T4 dermatomes, including the neck, shoulders, and arms. Initial
symptoms are usually rapid in onset and briskly crescendo to leave the victim with a profound “feeling of doom.” Unlike a transient attack of angina, the pain does not wane with rest, and there may be little response to the administra-tion of sublingual nitroglycerin.
The chest discomfort associated with an acute MI is often severe, but not always. In fact, up to 25% of patients who sustain an MI are asymptomatic during the acute event, and the diagnosis is made only in retrospect. This is particularly common among diabetic patients who may not adequately sense pain because of associated peripheral neuropathy.
The combination of intense discomfort and baroreceptor unloading (if hypotension is present) may trigger a dramatic sympathetic nervous system response. Systemic signs of subsequent catecholamine release include dia-phoresis (sweating), tachycardia, and cool and clammy skin caused by vasoconstriction.
If the ischemia affects a suffi ciently large amount of myocardium, left ventricular (LV) contractility can be reduced (systolic dysfunc-tion), thereby decreasing the stroke volume and causing the diastolic volume and pressure within the LV to rise. The increase in LVpressure, compounded by the ischemia-induced stiffness of the chamber (diastolic dysfunction), is conveyed to the left atrium and pulmonary veins. The resultant pulmonary congestiondecreases lung compliance and stimulates
Table 7.3. Signs and Symptoms of Myocardial Infarction
1. Characteristic pain • Severe, persistent, typically substernal
2. Sympathetic effect • Diaphoresis• Cool and clammy skin
3. Parasympathetic (vagal effect) • Nausea, vomiting• Weakness
4. Infl ammatory response • Mild fever
5. Cardiac fi ndings • S4 (and S3 if systolic dysfunction present)gallop
• Dyskinetic bulge (in anterior wall MI)• Systolic murmur (if mitral regurgitation or VSD)
6. Other • Pulmonary rales (if heart failure present)• Jugular venous distention (if heart failure or
right ventricular MI)
MI, myocardial infarction; S3, third heart sound; S4, fourth heart sound; VSD, ventricular septal defect.
77237_ch07.indd 17277237_ch07.indd 172 8/11/10 8:12:36 AM8/11/10 8:12:36 AM

Acute Coronary Syndromes
173
ruptures through the interventricular septum to create a ventricular septal defect (as dis-cussed later in the chapter).
Myocardial necrosis also activates systemic responses to infl ammation. Cytokines such as interleukin 1 (IL-1) and tumor necrosis factor (TNF) are released from macrophages and vas-cular endothelium in response to tissue injury. These mediators evoke an array of clinical re-sponses, including low-grade fever.
Not all patients with severe chest pain are in the midst of MI or UA. Table 7.4 lists other common causes of acute chest discomfort and clinical, laboratory, and radiographic features to differentiate them from an ACS.
juxtacapillary receptors. These J receptors ef-fect a refl ex that results in rapid, shallow breathing and evokes the subjective feeling of dyspnea. Transudation of fl uid into the alveoli exacerbates this symptom.
Physical fi ndings during an acute MI de-pend on the location and extent of the infarct. The S4 sound, indicative of atrial contraction into a noncompliant left ventricle, is frequently present (see Chapter 2). An S3 sound, indica-tive of volume overload in the presence of fail-ing LV systolic function, may also be heard. A systolic murmur may appear if ischemia-induced papillary muscle dysfunction causes mitral valvular insuffi ciency, or if the infarct
Table 7.4. Conditions That May Be Confused with Acute Coronary Syndromes
Condition Differentiating Features
Cardiac Acute coronary syndrome • Retrosternal pressure, radiating to neck, jaw, or left shoulder and
arm; more severe and lasts longer than previous anginal attacks• ECG: localized ST elevations or depressions
Pericarditis • Sharp pleuritic pain (worsens with inspiration)• Pain varies with position (relieved by sitting forward)• Friction rub auscultated over precordium• ECG: diffuse ST elevations (see Chapter 14)
Aortic dissection • Tearing, ripping pain that migrates over time (chest and back)• Asymmetry of arm blood pressures• Widened mediastinum on chest radiograph
Pulmonary Pulmonary embolism • Localized pleuritic pain, accompanied by dyspnea
• Pleural friction rub may be present• Predisposing conditions for venous thrombosis
Pneumonia • Pleuritic chest pain• Cough and sputum production• Abnormal lung auscultation and percussion (i.e., consolidation)• Infi ltrate on chest radiograph
Pneumothorax • Sudden sharp, pleuritic unilateral chest pain• Decreased breath sounds and hyperresonance of affected side• Chest radiograph: increased lucency and absence of pulmonary
markings
Gastrointestinal Esophageal spasm • Retrosternal pain, worsened by swallowing
• History of dysphagia
Acute cholecystitis • Right upper quadrant abdominal tenderness• Often accompanied by nausea• History of fatty food intolerance
77237_ch07.indd 17377237_ch07.indd 173 8/11/10 8:12:36 AM8/11/10 8:12:36 AM

Chapter 7
174
Diagnosis of Acute Coronary Syndromes
The diagnosis of, and distinctions among, the ACS is made on the basis of (1) the patient’s pre-senting symptoms, (2) acute ECG abnormalities, and (3) detection of specifi c serum markers of myocardial necrosis (see Fig. 7.4 and Table 7.5). Specifi cally, UA is a clinical diagnosis supported by the patient’s symptoms, transient ST abnor-malities on the ECG (usually ST depression and/or T wave inversion), and the absence of serum biomarkers of myocardial necrosis. Non–ST seg-ment elevation MI is distinguished from UA by the detection of serum markers of necrosis and often more persistent ST or T wave abnormali-ties. The hallmark of ST-elevation MI is an appro-priate clinical history coupled with ST elevations
on the ECG plus detection of serum markers of myocardial necrosis.
ECG Abnormalities
ECG abnormalities, which refl ect abnormal electrical currents during ACS, are usually man-ifest in characteristic ways. In UA or NSTEMI, ST segment depression and/or T wave inver-sions are most common (Fig. 7.7). These ab-normalities may be transient, occurring just during chest pain episodes in UA, or they may persist in patients with NSTEMI. In contrast, as described in Chapter 4, STEMI presents with a temporal sequence of abnormalities: initial ST segment elevation, followed over the course of several hours by inversion of the T wave and
Figure 7.7. ECG abnormalities in unstable angina and non–ST-elevation myocardial infarction.
Normal
• ST depression
• T wave inversion
or
• ST & T normal• no Q waves
Weekslater
Unstable Angina/Non–ST-Elevation Myocardial Infarction
Acute
Table 7.5. Distinguishing Features of Acute Coronary Syndromes
Myocardial Infarction
Feature Unstable Angina NSTEMI STEMI
Typical symptoms Crescendo, rest, or new-onset severe angina
Prolonged “crushing” chest pain, more severe and wider radiation than usual angina
Serum biomarkers No Yes Yes
Electrocardiogram initial fi ndings
ST depression and/orT wave inversion
ST depression and/orT wave inversion
ST elevation (and Q waves later)
NSTEMI, non–ST-elevation myocardial infarction; STEMI, ST-elevation myocardial infarction.
77237_ch07.indd 17477237_ch07.indd 174 8/11/10 8:12:36 AM8/11/10 8:12:36 AM

Acute Coronary Syndromes
175
Cardiac-specifi c Troponins
Troponin is a regulatory protein in muscle cells that controls interactions between myosin and actin (see Chapter 1). It consists of three subunits: TnC, TnI, and TnT. Although these subunits are found in both skeletal and car-diac muscles, the cardiac forms of troponin I (cTnI) and troponin T (cTnT) are structurally unique, and highly specifi c assays for their detection in the serum have been developed. Because their serum levels are virtually absent in healthy persons, the presence of even minor elevations of cTnI or cTnT serves as a sensitive and power ful marker of myocyte damage. The advent of increasingly sensitive troponin assays has shifted classifi cation of some ACS presenta-tions that would have previously been termed UA to NSTEMI instead. It should also be noted
Q wave development (Fig. 7.8). Note that these characteristic patterns of ECG abnormalities in ACS can be minimized or aborted by early therapeutic interventions.
Serum Markers of Infarction
Necrosis of myocardial tissue causes disrup-tion of the sarcolemma, so that intracellular macromolecules leak into the cardiac inter-stitium and ultimately into the bloodstream (Fig. 7.9). Detection of such molecules in the serum, particularly cardiac-specifi c troponins and creatine kinase MB isoenzyme, serves important diagnostic and prognostic roles. In patients with STEMI or NSTEMI, these mark-ers rise above a threshold level in a defi ned temporal sequence.
Figure 7.8. ECG evolution during ST-elevation myocardial infarction.
Normal Acute
• ST elevation • ST elevation• ↓R Wave• Q wave begins
• T wave inversion• Q wave deeper
• ST & T normal• Q wave persists
• ST normalizes• T wave inverted
Hours Days 1–2 Days later
Weekslater
ST-Elevation Myocardial Infarction
Figure 7.9. Evolution of serum biomarkers in acute myocardial infarction (MI).
1 2 3 4 5
Days after onset of infarction
Troponins
MI Threshold
CK-MB
Mul
tiple
s of
MI t
hres
hold
6 7 8 9 10
1
2
5
10
20
50
77237_ch07.indd 17577237_ch07.indd 175 8/11/10 8:12:36 AM8/11/10 8:12:36 AM

Chapter 7
176
that cardiac troponins can be detected in small quantities in the serum in other conditions that cause acute cardiac strain or infl ammation (e.g., a heart failure exacerbation, myocarditis, hypertensive crisis, or pulmonary embolism [which can cause right ventricular strain]).
In the case of MI, cardiac troponin serum levels begin to rise 3 to 4 hours after the onset of discomfort, peak between 18 and 36 hours, and then decline slowly, allowing for detection for up to 10 to 14 days after a large MI. Thus, their measurement may be helpful for detec-tion of MI for nearly 2 weeks after the event occurs. Given their high sensitivity and speci-fi city, cardiac troponins are the preferred serum biomarkers to detect myocardial necrosis.
Creatine Kinase
The enzyme creatine kinase (CK) reversibly transfers a phosphate group from creatine phosphate, the endogenous storage form of high-energy phosphate bonds, to ADP, pro-ducing ATP. Because creatine kinase is found in the heart, skeletal muscle, brain, and many other organs, serum concentrations of the en-zyme may become elevated following injury to any of these tissues.
There are, however, three isoenzymes of CK that improve diagnostic specifi city of its ori-gin: CK-MM (found mainly in skeletal muscle), CK-BB (located predominantly in the brain), and CK-MB (localized mainly in the heart). It should be noted that small amounts of CK-MB are found in tissues outside the heart, includ-ing the uterus, prostate, gut, diaphragm, and tongue. CK-MB also makes up 1% to 3% of the creatine kinase in skeletal muscle. In the absence of trauma to these other organs and tissues, elevation of CK-MB is highly sugges-tive of myocardial injury. To facilitate the di-agnosis of MI using this marker, it is common to calculate the ratio of CK-MB to total CK. The ratio is usually �2.5% in the setting of myo-cardial injury and less than that when CK-MB elevation is from another source.
The serum level of CK-MB starts to rise 3 to 8 hours following infarction, peaks at 24 hours, and returns to normal within 48 to 72 hours (see Fig. 7.9). This temporal sequence is important because other sources of CK-MB
(e.g., skeletal muscle injury) or other non-MI cardiac conditions that raise serum levels of the isoenzyme (e.g., myocarditis) do not usually show this delayed peaking pattern. It should also be reinforced that CK-MB is not as sensi-tive or specifi c for detection of myocardial in-jury as is measurement of cardiac troponins.
Because troponin and CK-MB levels do not become elevated in the serum until at least a few hours after the onset of MI symptoms, a single normal value drawn early in the course of evaluation (e.g., in the hospital emergency department) does not rule out an acute MI; thus, the diagnostic utility of these biomarkers is limited in that critical period. As a result, early decision making in patients with ACS often relies most heavily on the patient’s his-tory and ECG fi ndings.
Imaging
Sometimes the early diagnosis of MI can re-main uncertain even after careful evaluation of the patient’s history, ECG, and serum bio-markers. In such a situation, an additional diagnostic study that may be useful is echocar-diography, which typically reveals abnormali-ties of ventricular contraction in the region of ischemia or infarction.
TREATMENT OF ACUTE CORONARY SYNDROMES
Successful management of ACS requires rapid initiation of therapy to limit myocardial dam-age and minimize complications. Therapy must address the intracoronary thrombus that incited the syndrome and provide anti-ischemic measures to restore the balance be-tween myocardial oxygen supply and demand. Although certain therapeutic aspects are com-mon to all ACS, there is a critical difference in the approach to patients who present with ST segment elevation (STEMI) compared with those without ST segment elevation (UA and NSTEMI). Patients with STEMI typically have total occlusion of a coronary artery and ben-efi t from immediate reperfusion therapies (pharmacologic or mechanical), while patients without ST elevation do not (Fig. 7.10 and as discussed later in the chapter).
77237_ch07.indd 17677237_ch07.indd 176 8/11/10 8:12:37 AM8/11/10 8:12:37 AM

Acute Coronary Syndromes
177
one entity, whereas the approach to STEMI is described later. The primary focus of treatment for UA and NSTEMI consists of anti-ischemic medications to restore the balance between myocardial oxygen supply and demand and anti-thrombotic therapy aimed at preventing further growth, and facilitating resolution of, the under-lying partially occlusive coronary thrombus.
Anti-ischemic Therapy
The same pharmacologic agents used to de-crease myocardial oxygen demand in chronic stable angina are appropriate in UA and NSTEMI but are often administered moreaggressively. �-Blockers decrease sympathetic drive to the myocardium, thus reducing oxygen demand, and contribute to electrical stability.
General in-hospital measures for any patient with ACS include admitting the patient to an intensive care setting where continuous ECG monitoring for arrhythmias is undertaken. The patient is initially maintained at bed rest to minimize myocardial oxygen demand, while supplemental oxygen is provided (by face mask or nasal cannula), if there is any degree of hypoxemia, to improve oxygen supply. Analgesics, such as morphine, are administered to reduce chest pain and anxiety and thus further reduce myocardial oxygen needs.
Acute Treatment of Unstable Angina and Non–ST-Elevation Myocardial Infarction
The management of UA and NSTEMI is essen-tially the same and is therefore discussed as
Figure 7.10. Management strategies in acute coronary syndromes (ACS). The measures listed in the top box should be considered in all patients with ACS. In those with STEMI, primary PCI is a preferred approach if it is available within 90 minutes. In UA/NSTEMI, an early invasive intervention is advised if patients present with high-risk features. GP, glycoprotein; LMWH, low molecular weight heparin; PCI, percutaneous coronary intervention.
• Anti-ischemic therapies: • β−blocker • Nitrates • +/– Calcium channel blocker
• General measures: • Pain control (morphine) • Supplemental O2 if needed
• Antithrombotic therapies Antiplatelet agents: • Aspirin • Clopidogrel (or prasugrel) • GP IIb/IIIa inhibitor (for selected high risk patients; may be deferred until PCI)
Anticoagulants (use one): • LMWH (enoxaparin) • Unfractionated intravenous heparin • Fondaparinux • Bivalirudin (should be used in ACS patient only if undergoing PCI)
• Adjunctive therapies: • Statin • Angiotensin converting-enzyme inhibitor
ST-Elevation(STEMI)
Non-ST-Elevation(UA and NSTEMI)
Emergent PCI availablewithin 90 min?
Risk Assessment(e.g., TIMI Score)
Conservative strategy(Proceed to cardiac cath only
if recurrent angina or predischargestress test is markedly positive)
Invasive strategy(Cardiac cath leading to
PCI or CABG)
FibrinolyticTherapy(e.g., tPA)
Primary PCI
No Yes Low High
77237_ch07.indd 17777237_ch07.indd 177 8/11/10 8:12:37 AM8/11/10 8:12:37 AM
Chapter 7
178
This group of drugs reduces the likelihood of progression from UA to MI and lowers mortality rates in patients who present with infarction. In the absence of contraindications (e.g., marked bradycardia, bronchospasm, decompensated heart failure, or hypotension), a �-blocker is usually initiated in the fi rst 24 hours to achieve a target heart rate of approximately 60 beats/min. Such therapy is usually continued indefi nitely after hospitalization because of proven long-term mortality benefi ts following an MI.
Nitrates help bring about anginal relief through venodilation, which lowers myocar-dial oxygen demand by diminishing venous return to the heart (reduced preload and therefore less wall stress). Nitrates may also improve coronary fl ow and prevent vaso-spasm through coronary vasodilation. In UA or NSTEMI, nitroglycerin is often initially ad-ministered by the sublingual route, followed by a continuous intravenous infusion. In addi-tion to providing symptomatic relief of angina, intravenous nitroglycerin is useful as a vaso-dilator in patients with ACS accompanied by heart failure or severe hypertension.
Nondihydropyridine calcium channel an-tagonists (i.e., verapamil and diltiazem) exert anti-ischemic effects by decreasing heart rate and contractility and through their vasodila-tory properties (see Chapter 6). These agents do not confer mortality benefi t to patients with ACS and are reserved for those in whom ischemia persists despite �-blocker and nitrate therapies, or for those with contraindications to �-blocker use. They should not be prescribed to patients with LV systolic dysfunction, be-cause clinical trials have shown adverse out-comes in such cases.
Antithrombotic Therapy
The purpose of antithrombotic therapy, includ-ing antiplatelet and anticoagulant medications, is to prevent further propagation of the partially occlusive intracoronary thrombus while facilitat-ing its dissolution by endogenous mechanisms.
Antiplatelet Drugs
Aspirin inhibits platelet synthesis of throm-boxane A2, a potent mediator of platelet acti-vation (see Chapter 17), and is one of the most
important interventions to reduce mortality in patients with all forms of ACS. It should be administered immediately on presentation and continued indefi nitely in patients without con-traindications to its use (e.g., allergy or under-lying bleeding disorder).
Because aspirin blocks only one pathway of platelet activation and aggregation, other antithrombotic agents have also been stud-ied. Clopidogrel, a thienopyridine derivative, blocks activation of the P2Y12 ADP receptor on platelets (see Chapter 17). It is recommended as a substitute antiplatelet agent in patients who are allergic to aspirin. Furthermore, the combination of aspirin plus clopidogrel is su-perior to aspirin alone in reducing cardiovas-cular mortality, recurrent cardiac events, and stroke in patients with UA or NSTEMI. Thus, clopidogrel is currently recommended for most patients with UA or NSTEMI, except those for whom imminent surgery is planned (because of the increased bleeding risk on such therapy).
Not all patients respond to clopidogrel with similar benefi t, as it is a prodrug that requires cytochrome P450-mediated biotransformation to the active metabolite. For example, patients who carry a reduced-function CYP2C19 allele manifest reduced platelet inhibition, and less clinical benefi t. Therefore, newer generation platelet P2Y12 ADP receptor blockers have been developed without this shortcoming. Of these, prasugrel, another thienopyridine deriva-tive, is metabolized more effi ciently and has a greater antiplatelet effect. Compared to clopi-dogrel, it has been shown to further reduce coronary event rates in patients with ACS who undergo percutaneous coronary intervention (PCI), but with an increased bleeding risk.
The glycoprotein (GP) IIb/IIIa receptor antagonists (which include the monoclonal antibody abciximab and the small molecules eptifi batide and tirofi ban) are potent antiplate-let agents that block the fi nal common path-way of platelet aggregation (see Chapter 17). These agents are effective in reducing adverse coronary events in patients undergoing PCI. In patients presenting with UA or NSTEMI, their benefi t is manifest primarily in those at the highest risk of complications (e.g., the pres-ence of elevated serum troponin levels or recur-rent episodes of chest pain). Thus, Gp IIb/IIIa
77237_ch07.indd 17877237_ch07.indd 178 8/11/10 8:12:37 AM8/11/10 8:12:37 AM

Acute Coronary Syndromes
179
of UFH plus a GP IIb/IIIa receptor antagonist in patients with UA or NSTEMI treated with an early invasive strategy, primarily due to a reduced incidence of bleeding. The choice of anticoagulant for an individual patient often depends on whether an initial conservative versus invasive approach is followed.
Conservative Versus Early Invasive Management of UA and NSTEMI
Many patients with UA or NSTEMI stabilize following institution of the therapies described in the previous section, while others progress to a more severe form of ACS. There is cur-rently no defi nitive way to predict which direc-tion a patient will take or to quickly determine which individuals have such severe underlying CAD that coronary revascularization is war-ranted. These uncertainties have led to two therapeutic strategies in UA/NSTEMI: (1) an early invasive approach, in which urgent car-diac catheterization is performed and coronary revascularization undertaken as indicated, or (2) a conservative approach, in which the pa-tient is managed with medications (as detailed in the previous section) and undergoes angiog-raphy only if ischemic episodes spontaneously recur or if the results of a subsequent stress test indicate substantial residual inducible isch-emia. The conservative approach offers the ad-vantage of avoiding costly and potentially risky invasive procedures. Conversely, an early in-vasive strategy allows rapid identifi cation and defi nitive treatment (i.e., revascularization) for those with critical coronary disease.
In general, an early invasive approach is recommended to patients with refractory an-gina, with complications such as shock or ventricular arrhythmias, or those with the most concerning clinical features. Risk assess-ment algorithms consider such features and help identify patients at high likelihood of a poor outcome. One commonly used tool is the Thrombolysis in Myocardial Infarction (TIMI) risk score that employs seven vari-ables to predict a patient’s risk level:
1. Age �65 years old
2. �3 risk factors for coronary artery disease (as described in Chapter 5)
receptor antagonist therapy is prescribed to patients at greatest risk and is usually adminis-tered at the time of PCI.
Anticoagulant Drugs
Intravenous unfractionated heparin (UFH) has long been standard anticoagulant therapy for UA and NSTEMI. It binds to antithrom-bin, which greatly increases the potency of that plasma protein in the inactivation of clot-forming thrombin. UFH additionally inhibits coagulation factor Xa, slowing thrombin forma-tion and thereby further impeding clot devel-opment. In patients with UA or NSTEMI, UFH improves cardiovascular outcomes and reduces the likelihood of progression from UA to MI. It is administered as a weight-based bolus, followed by continuous intravenous infusion. Because of a high degree of pharmacodynamic variability, its anticoagulant effect must be monitored, and its dose adjusted, through serial measurements of the serum activated partial thromboplastin time (aPTT). It is the least expensive of the anti coagulant drugs in this section.
To overcome the pharmacologic shortcom-ings of UFH, low molecular weight heparins (LMWHs) were developed. Like UFH, LMWHs interact with antithrombin but preferentially inhibit coagulation factor Xa. They provide a more predictable pharmacologic response than UFH. As a result, LMWHs are easier to use, prescribed as one or two daily subcutaneous injections based on the patient’s weight. Un-like UFH, repeated monitoring of blood tests and dosage adjustments are not generally nec-essary. In clinical trials in patients with UA or NSTEMI, the LMWH enoxaparin (see Chapter 17) has demonstrated reduced death and isch-emic event rates compared with UFH.
Two other types of anticoagulants have also been shown to be benefi cial in UA and NSTEMI and are sometimes used in place of UFH or LMWHs: (1) the subcutaneously ad-ministered factor Xa inhibitor fondaparinux (see Chapter 17) is similar to the LMWH enox-aparin at reducing cardiac adverse events but with less bleeding complications and (2) the intravenous direct thrombin inhibitor bivali-rudin (see Chapter 17) yields superior clini-cal outcomes compared to the combination
77237_ch07.indd 17977237_ch07.indd 179 8/11/10 8:12:37 AM8/11/10 8:12:37 AM

Chapter 7
180
3. Known coronary stenosis of �50% by prior angiography
4. ST segment deviations on the ECG at pre-sentation
5. At least two anginal episodes in prior24 hours
6. Use of aspirin in prior 7 days (i.e., implying resistance to aspirin’s effect)
7. Elevated serum troponin or CK-MB
Clinical studies have confi rmed that a pa-tient’s TIMI risk score predicts the likelihood of death or subsequent ischemic events, such that an early invasive strategy is recommended in patients with higher scores (�3). If an early invasive approach is adopted, the patient should undergo angiography within 24 hours.
Acute Treatment of ST-Elevation Myocardial Infarction
In contrast to UA and NSTEMI, the culprit artery in STEMI is typically completely oc-cluded. Thus, to limit myocardial damage, the major focus of acute treatment is to achieve prompt reperfusion of the jeopar-dized myocardium using either fi brinolytic drugs or percutaneous coronary mechanical revascularization. These approaches reduce the extent of myocardial necrosis and greatly improve survival. To be effective, they must be undertaken as soon as possible; the ear-lier the intervention occurs, the greater the amount of myocardium that can be salvaged. Decisions about therapy must be made within minutes of a patient’s assessment, based on the history and electrocardiographic fi ndings, often before serum markers of necrosis would be expected to rise.
In addition, as is the case in UA and NSTEMI, specifi c medications should be initi-ated promptly to prevent further thrombosis and to restore the balance between myocardial oxygen supply and demand. For example, anti-platelet therapy with aspirin decreases mortal-ity rates and rates of reinfarction after STEMI. It should be administered immediately on presentation (by chewing a tablet to facilitate absorption) and continued orally daily there-after. Intravenous UFH is typically infused to help maintain patency of the coronary vessel
and is an important adjunct to modern fi brin-olytic regimens. a-Blockers reduce myocardial oxygen demand and lower the risk of recurrent ischemia, arrhythmias, and reinfarction. In the absence of contraindications (e.g., asthma, hypotension, or signifi cant bradycardia), an oral �-blocker should be administered to achieve a heart rate of 50 to 60 beats/min. In-travenous blocker therapy should be reserved for patients who are hypertensive at presenta-tion, as that route of administration has other-wise been associated with an increased risk of cardiogenic shock in STEMI. Nitrate therapy, usually intravenous nitroglycerin, is used to help control ischemic pain and also serves as a benefi cial vasodilator in patients with heart failure or severe hypertension.
Fibrinolytic Therapy
Fibrinolytic drugs accelerate lysis of the occlu-sive intracoronary thrombus in STEMI, thereby restoring blood fl ow and limiting myocardial damage. This section does not pertain to pa-tients with UA or NSTEMI, as such individuals do not benefi t from fi brinolytic therapy.
Currently used fi brinolytic agents include recombinant tissue-type plasminogen activa-tor (alteplase, tPA), reteplase (rPA), and tenecteplase (TNK-tPA). Streptokinase, one of the earliest studied fi brinolytics, is now only rarely used in the United States. Each drug functions by stimulating the natural fi -brinolytic system, transforming the inactive precursor plasminogen into the active protease plasmin, which lyses fi brin clots. Although the intracoronary thrombus is the target, plasmin has poor substrate specifi city and can degrade other proteins, including fi brin’s precursor fi brinogen. As a result, bleeding is the most common complication of these drugs. How-ever, unlike the older agent streptokinase, the newer drugs bind preferentially to fi brin in a formed thrombus (i.e., the intracoronary clot), thereby generating plasmin locally at that site, with less interference of coagulation in the general circulation (Fig. 7.11). Nonetheless, bleeding remains the most important risk with all fi brinolytic agents.
rPA and TNK-tPA are derivatives of tPA with longer half-lives. Their main advantage
77237_ch07.indd 18077237_ch07.indd 180 8/11/10 8:12:37 AM8/11/10 8:12:37 AM

Acute Coronary Syndromes
181
specifi c troponins and CK-MB. During reperfu-sion, transient arrhythmias are common and do not usually require treatment. To prevent immediate vessel reocclusion after successful thrombolysis, antithrombotic regimens are ad-ministered, as described in the next section.
Because the major risk of thrombolysis is bleeding, contraindications to such therapy include situations in which necessary fi brin clots within the circulation would be jeopar-dized (e.g., patients with active peptic ulcer disease or an underlying bleeding disorder, patients who have had a recent stroke, or patients who are recovering from recent sur-gery). Consequently, approximately 30% of patients may not be suitable candidates for thrombolysis.
Several large-scale comparisons of fi brin-olytic agents have been conducted. An early study, the international GUSTO-1 trial found a
is that they can be administered as IV boluses, which is more convenient and less prone to incorrect administration than the continuous intravenous infusion necessary for tPA.
Administration of fi brinolytic agents in the early hours of an acute STEMI restores blood fl ow in most (70% to 80%) coronary occlu-sions and signifi cantly reduces the extent of tissue damage. Improved artery patency translates into substantially increased survival rates and fewer postinfarction complications. The rapid initiation of fi brinolysis is crucial: patients who receive therapy within 2 hours of the onset of symptoms of STEMI have half the mortality rate of those who receive it after 6 hours.
Successful reperfusion is marked by the re-lief of chest pain, return of the ST segments to baseline, and earlier-than-usual peaking of serum markers of necrosis, such as cardiac-
Figure 7.11. Examples of fi brinolytic agents used in ST-elevation myocardial infarction. A. Tissue plasminogen activator (tPA) cleaves fi brin-bound plasmino-gen (P) to form active plasmin (P*), which degrades the fi brin clot. The selectivity of tPA for fi brin-bound P results in localized thrombolysis and minimizes general-ized systemic fi brinolysis. TNK-tPA and rPA (see text) act similarly to tPA but can be administered as boluses, thus simplifying drug administration. B. The older fi brinolytic streptokinase (SK) combines with fi brin-bound and circulating plasmi-nogen to form an active complex, which in turn activates additional plasminogen molecules. The lack of selectivity for fi brin-bound plasminogen results in more of a systemic lytic state.
Fibrin clot
Fibrin clot
tPA P tPA P*
P*
P*
P*P
P
Systemic lyticstate
Degrade clot withoutsystemic lytic state
SK
SK
A
B
77237_ch07.indd 18177237_ch07.indd 181 8/11/10 8:12:37 AM8/11/10 8:12:37 AM
Chapter 7
182
small postinfarction survival advantage of tPA compared with streptokinase, at the expense of a slightly increased risk of intracranial hem-orrhage with tPA. More recent trials compared tPA with the newer agents rPA and TNK-tPA and found similar clinical effi cacies for all three agents. The most important message from these trials is that early and sustained pa-tency of the infarct-related coronary artery im-proves survival. No matter which fi brinolytic is selected, it must be administered as soon as possible, ideally within 30 minutes of the patient’s presentation to the hospital.
Adjunctive Antithrombotic Therapies After Fibrinolysis
As previously stated, aspirin is a mainstay of therapy in all patients with ACS and is typi-cally initiated on the patient’s presentation. Anticoagulants administered with fi brinolytic therapy in STEMI enhance clot lysis and re-duce reocclusion rates. Thus, for patients treated with tPA, rPA, or TNK-tPA, adjunctive IV UFH should be administered for up to 48 hours. LMWH therapy is an alternative to UFH as it has been shown to reduce ischemic com-plications, but at an increased risk of intra-cranial hemorrhage in older patients.
The antiplatelet agent clopidogrel, admin-istered in combination with aspirin, further reduces mortality and major cardiovascular events in STEMI patients who receive fi brin-olytic drugs. Conversely, the antiplatelet GP IIb/IIIa receptor antagonists have not dem-onstrated a survival benefi t in those treated with fi brinolysis and should not be routinely administered to such patients.
Primary Percutaneous Coronary Intervention
An alternative to fi brinolytic therapy in pa-tients with acute STEMI is immediate cardiac catheterization and PCI of the lesion responsi-ble for the infarction. This approach is termed primary PCI and involves angioplasty, and usually stenting, of the culprit vessel. Primary PCI is a very effective method for reestablish-ing coronary perfusion and, in clinical trials performed at highly experienced medical cen-ters, has achieved optimal fl ow in the infarct-
related artery in more than 95% of patients. Compared with fi brinolytic therapy, primary PCI leads to greater survival with lower rates of reinfarction and bleeding. Therefore, pri-mary PCI is usually the preferred reperfusion approach in acute STEMI, if the procedure can be performed by an experienced operator in a rapid fashion (within 90 minutes of hospi-tal presentation). In addition, primary PCI is preferred for patients who have contraindica-tions to fi brinolytic therapy or are unlikely to do well with fi brinolysis, including those who present late (�3 hours from symptom onset to hospital arrival) or are in cardiogenic shock.
Furthermore, “rescue” PCI is recommended for patients initially treated with fi brinolytic therapy who do not demonstrate an adequate response, including expeditious resolution of symptoms and ST segment elevations.
In addition to aspirin and heparin, patients undergoing primary PCI usually receive an intravenous GP IIb/IIIa receptor antagonist in conjunction with the procedure to reduce thrombotic complications (note that the direct thrombin inhibitor bivalirudin can be sub-stituted for the combination of heparin and a GP IIb/IIIa antagonist). For patients who receive coronary stents during PCI, the oral thienopyridines (e.g., clopidogrel) have been shown to reduce the risk of ischemic compli-cations and stent thrombosis. Clopidogrel (or the more potent thienopyridine prasugrel) is therefore continued for a prolonged period (often �12 months), depending on the type of stent placed.
Adjunctive Therapies
Angiotensin-converting enzyme (ACE) in-hibitors limit adverse ventricular remodeling and reduce the incidence of heart failure, re-current ischemic events, and mortality follow-ing an MI. Their benefi t is additive to that of aspirin and �-blocker therapies, and they have shown favorable improvements especially in higher-risk patients—those with anterior wall infarctions or LV systolic dysfunction.
Cholesterol-lowering statins (HMG-CoA reductase inhibitors) reduce mortality rates of patients with coronary artery disease (see Chapter 5). Clinical trials of patients with ACS
77237_ch07.indd 18277237_ch07.indd 182 8/11/10 8:12:37 AM8/11/10 8:12:37 AM

Acute Coronary Syndromes
183
COMPLICATIONS
In UA, the potential complications include death (5% to 10%) or progression to infarc-tion (10% to 20%) over the ensuing days and weeks. Once infarction has transpired, espe-cially STEMI, complications can result from the infl ammatory, mechanical, and electrical abnormalities induced by regions of necrosing myocardium (Fig. 7.12). Early complications re-sult from myocardial necrosis itself. Those that develop several days to weeks later refl ect the infl ammation and healing of necrotic tissue.
Recurrent Ischemia
Postinfarction angina has been reported in 20% to 30% of patients following an MI. This rate has not been reduced by the use of thrombolytic therapy, but it is lower in those who have un-dergone percutaneous angioplasty or coronary stent implantation as part of early MI manage-ment. Indicative of inadequate residual coronary blood fl ow, it is a poor omen and correlates with an increased risk for reinfarction. Such patients
have demonstrated that it is safe to begin sta-tin therapy early during hospitalization, and that an intensive lipid-lowering regimen, de-signed to achieve a low-density lipoprotein (LDL) level �70 mg/dL, provides greater protection against subsequent cardiovascular events and death than “standard” targets (i.e., achieving LDL �100 mg/dL). The benefi ts of statin therapy may extend beyond lipid lower-ing, because this group of drugs has attributes that can improve endothelial dysfunction, in-hibit platelet aggregation, and impair throm-bus formation.
In addition to the short-term use of heparin anticoagulation described earlier, a more pro-longed course, followed by oral anticoagula-tion (i.e., warfarin), is appropriate for patients at high risk of thromboembolism—for exam-ple, patients with documented intraventricular thrombus (typically identifi ed by echocardio-graphy) or atrial fi brillation and those who have suffered a large acute anterior MI with akinesis of that territory (which is susceptible to thrombus formation because of the stagnant blood fl ow).
Figure 7.12. Complications of MI. Infarction may result in decreased contractility, electrical instability, and tissue necrosis, which can lead to the indicated sequelae.
Ventricularthrombus
Myocardial Infarction
Embolism
Contractility
Ischemia Hypotension
Coronaryperfusionpressure
Cardiogenicshock
Electricalinstability
Tissuenecrosis
Arrhythmias
Papillarymuscle
infarction/ischemia
Mitralregurgitation
Congestive heart failure
Ventricularseptaldefect
Ventricularrupture
Cardiactamponade
Pericarditis
Pericardialinflammation
77237_ch07.indd 18377237_ch07.indd 183 8/11/10 8:12:37 AM8/11/10 8:12:37 AM

Chapter 7
184
usually require urgent cardiac catheterization, often followed by revascularization by percu-taneous techniques or coronary artery bypass surgery.
Arrhythmias
Arrhythmias occur frequently during acute MI and are a major source of mortality prior to hos-pital arrival. Fortunately, modern coronary care units are highly attuned to the detection and treatment of rhythm disturbances; thus, once a patient is hospitalized, arrhythmia-associated deaths are uncommon. Mechanisms that con-tribute to arrhythmogenesis after MI include the following (Table 7.6):
1. Anatomic interruption of blood fl ow to structures of the conduction pathway (e.g., sinoatrial node, atrioventricular node, and bundle branches); the nor-mal perfusion of pertinent components of the conduction system is summarized in Table 7.7.
2. Accumulation of toxic metabolic products (e.g., cellular acidosis) and abnormal trans-cellular ion concentrations owing to mem-brane leaks.
3. Autonomic stimulation (sympathetic and parasympathetic).
4. Administration of potentially arrhythmo-genic drugs (e.g., dopamine).
Table 7.6. Arrhythmias in Acute Myocardial Infarction
Rhythm Cause
Sinus bradycardia • ↑Vagal tone• ↓SA nodal artery perfusion
Sinus tachycardia • Pain and anxiety• Heart failure• Volume depletion• Chronotropic drugs (e.g., dopamine)
APBs, atrial fi brillation • Heart failure• Atrial ischemia
VPBs, VT, VF • Ventricular ischemia• Heart failure
AV block (1°, 2°, 3°) • IMI: ↑vagal tone and ↓AV nodal artery fl ow• AMI: extensive destruction of conduction tissue
AMI, anterior myocardial infarction; APBs, atrial premature beats; AV, atrioventricular; IMI, inferior myocardial infarction; SA, sinoatrial;VPBs, ventricular premature beats; VF, ventricular fi brillation; VT, ventricular tachycardia.
Table 7.7. Blood Supply of the Conduction System
Conduction Pathway Primary Arterial Supply
SA nodeAV nodeBundle of HisRBB
• RCA (70% of patients)• RCA (85% of patients)• LAD (septal branches)• Proximal portion by LAD• Distal portion by RCA
LBB Left anterior fascicle Left posterior fascicle
• LAD• LAD and PDA
AV, atrioventricular; LAD, left anterior descending coronary artery; LBB, left bundle branch; PDA, posterior descending artery; RBB, right bundle branch; RCA, right coronary artery; SA, sinoatrial.
77237_ch07.indd 18477237_ch07.indd 184 8/11/10 8:12:37 AM8/11/10 8:12:37 AM

Acute Coronary Syndromes
185
in acute MI. They may result from ischemia or necrosis of conduction tracts, or in the case of atrioventricular blocks, may develop transiently because of increased vagal tone. Vagal activ-ity may be increased because of stimulation of afferent fi bers by the infl amed myocardium or as a result of generalized autonomic activation in association with the pain of an acute MI.
Myocardial Dysfunction
Congestive Heart Failure
Acute cardiac ischemia results in impaired ventricular contractility (systolic dysfunction) and increased myocardial stiffness (diastolic dysfunction), both of which may lead to symp-toms of heart failure. In addition, ventricular remodeling, arrhythmias, and acute mechani-cal complications of MI (described later in the chapter) may culminate in heart failure. Signs and symptoms of such decompensation in-clude dyspnea, pulmonary rales, and a third heart sound (S3). Treatment consists of stan-dard heart failure therapy, which typically in-cludes diuretics for relief of volume overload, and ACE inhibitor and �-blocker therapies for long-term mortality benefi t (see Chapter 9). In addition, for patients with post-MI heart failure and an LV ejection fraction �40%, an aldosterone antagonist (spironolactone or eplerenone—described in Chapter 9) should be considered, as clinical trials have shown that such therapy further improves survival and reduces rehospitalization rates. However, when an aldosterone antagonist is prescribed along with an ACE inhibitor, the serum potas-sium level should be carefully monitored to prevent hyperkalemia.
Cardiogenic Shock
Cardiogenic shock is a condition of severely decreased cardiac output and hypotension (systolic blood pressure �90 mm Hg) with in-adequate perfusion of peripheral tissues that develops when more than 40% of the LV mass has infarcted. It may also follow certain severe mechanical complications of MI described later. Cardiogenic shock is self-perpetuating because (1) hypotension leads to decreased coronary perfusion, which exacerbates ischemic damage,
Ventricular Fibrillation
Ventricular fi brillation (rapid, disorganized electrical activity of the ventricles) is largely responsible for sudden cardiac death during the course of acute MI. Most fatal episodes occur before hospital arrival, a trend that can be impacted by increasing availability of auto-matic external defi brillators in public places. Episodes of ventricular fi brillation that occur during the fi rst 48 hours of MI are often related to transient electrical instability, and the long-term prognosis of survivors of such events is not adversely affected. However, ventricular fi brillation occurring later than 48 hours after the acute MI usually refl ects severe LV dys-function and is associated with high subse-quent mortality rates.
Ventricular ectopic beats, ventricular tachy-cardia, and ventricular fi brillation during an acute MI arise from either reentrant circuits or enhanced automaticity of ventricular cells (see Chapter 11). Ventricular ectopic beats are common and usually not treated unless the beats become consecutive, multifocal, or fre-quent. Cardiac care unit personnel are profi -cient at arrhythmia detection and institution of treatment should more malignant ventricular arrhythmias develop. Therapy for ventricular arrhythmias is described in Chapter 12.
Supraventricular Arrhythmias
Supraventricular arrhythmias are also com-mon in acute MI. Sinus bradycardia results from either excessive vagal stimulation or sinoatrial nodal ischemia, usually in the set-ting of an inferior wall MI. Sinus tachycardia occurs frequently and may result from pain and anxiety, heart failure, drug administration (e.g., dopamine), or intravascular volume depletion. Because sinus tachycardia increases myocardial oxygen demand and could exacerbate ischemia, identifying and treating its cause are important. Atrial premature beats and atrial fi brillation (see Chapter 12) may result from atrial ischemia or atrial distention secondary to LV failure.
Conduction Blocks
Conduction blocks (atrioventricular nodal block and bundle branch blocks) develop commonly
77237_ch07.indd 18577237_ch07.indd 185 8/11/10 8:12:37 AM8/11/10 8:12:37 AM

Chapter 7
186
and (2) decreased stroke volume increases LV size and therefore augments myocardial oxy-gen demand (see Fig. 7.12). Cardiogenic shock occurs in up to 10% of patients after MI, and the mortality rate is �70%. Early cardiac cath-eterization and revascularization can improve the prognosis.
Patients in cardiogenic shock require intra-venous inotropic agents (e.g., dobutamine) to increase cardiac output and, once the blood pressure has improved, arterial vasodilators to reduce the resistance to LV contraction. Pa-tients are often stabilized by the placement of an intra-aortic balloon pump. Inserted into the aorta through a femoral artery, the pump consists of an infl atable, fl exible cham-ber that expands during diastole to increase intra-aortic pressure, thus augmenting perfu-sion of the coronary arteries. During systole, it defl ates to create a “vacuum” that serves to reduce the afterload of the left ventricle, thus aiding the ejection of blood into the aorta and improving cardiac output and peripheral tis-sue perfusion.
If more extensive and prolonged hemo-dynamic support is required, a percutaneous left ventricular assist device (LVAD) can be placed. Using cannulae inserted via the femo-ral vessels, a motor located outside of the body pumps oxygenated blood from the LA or the LV (depending on the model) to the aorta and its branches, bypassing or “assisting” the LV.
Right Ventricular Infarction
Approximately one third of patients with in-farction of the LV inferior wall also develop necrosis of portions of the right ventricle, be-cause the same coronary artery (usually the right coronary) perfuses both regions in most patients. The resulting abnormal contraction and decreased compliance of the right ven-tricle lead to signs of right-sided heart failure (e.g., jugular venous distention) out of pro-portion to signs of left-sided failure. In addi-tion, profound hypotension may result when right ventricular dysfunction impairs blood fl ow through the lungs, leading to the left ventricle becoming underfi lled. In this setting, intravenous volume infusion serves to correct hypotension, often guided by hemodynamic
measurements via a transvenous pulmonary artery catheter (see Chapter 3).
Mechanical Complications
Mechanical complications following MI result from cardiac tissue ischemia and necrosis.
Papillary Muscle Rupture
Ischemic necrosis and rupture of an LV papil-lary muscle may be rapidly fatal because of acute severe mitral regurgitation, as the valve leafl ets lose their anchoring attachments. Par-tial rupture, with more moderate regurgita-tion, is not immediately lethal but may result in symptoms of heart failure or pulmonary edema. Because it has a more precarious blood supply, the posteromedial LV papillary muscle is more susceptible to infarction than the anterolateral one.
Ventricular Free Wall Rupture
An infrequent but deadly complication, rupture of the LV free wall through a tear in the necrotic myocardium may occur within the fi rst 2 weeks following MI. It is more common among women and patients with a history of hypertension. Hemorrhage into the pericardial space owing to LV free wall rupture results in rapid cardiac tamponade, in which blood fi lls the pericardial space and severely restricts ventricular fi lling (see Chapter 14). Survival is rare.
On occasion, a pseudoaneurysm results if rupture of the free wall is incomplete and held in check by thrombus formation that “plugs” the hole in the myocardium. This situation is the cardiac equivalent of a time bomb, because sub-sequent complete rupture into the pericardium and tamponade could follow. If detected (usually by imaging studies), surgical repair may prevent an otherwise disastrous outcome.
Ventricular Septal Rupture
This complication is analogous to LV free wall rupture, but the abnormal fl ow of blood is not directed across the LV wall into the peri-cardium. Rather, blood is shunted across the ventricular septum from the left ventricle to the right ventricle, usually precipitating congestive
77237_ch07.indd 18677237_ch07.indd 186 8/11/10 8:12:37 AM8/11/10 8:12:37 AM

Acute Coronary Syndromes
187
pericardial friction rub are typically present in this situation and help distinguish pericarditis from the discomfort of recurrent myocardial ischemia (see Chapter 14). The symptoms usually promptly respond to aspirin therapy. Anticoagulants are relatively contraindicated in MI complicated by pericarditis to avoid hemorrhage from the infl amed pericardial lining. The frequency of MI-associated peri-carditis has declined since the introduction of acute reperfusion strategies, because those approaches limit the extent of myocardial damage and infl ammation.
Dressler Syndrome
Dressler syndrome is another uncommon form of pericarditis that can occur over the weeks following an MI. The cause is unclear, but an immune process directed against damaged myocardial tissue is suspected to play a role. The syndrome is heralded by fever, malaise, and sharp, pleuritic chest pain typically accom-panied by leukocytosis, an elevated erythrocyte sedimentation rate, and a pericardial effusion. Similar to other forms of acute pericarditis, Dressler syndrome generally responds to as-pirin or other nonsteroidal anti-infl ammatory therapies.
Thromboembolism
Stasis of blood fl ow in regions of impaired LV contraction after an MI may result in intra-cavity thrombus formation, especially when the infarction involves the LV apex, or when a true aneurysm has formed. Subsequent throm-boemboli can result in infarction of peripheral organs (e.g., a cerebrovascular event [stroke] caused by embolism to the brain).
RISK STRATIFICATION AND MANAGEMENT FOLLOWING MYOCARDIAL INFARCTION
The most important predictor of post-MI out-come is the extent of LV dysfunction. Other features that portend adverse outcomes in-clude early recurrence of ischemic symptoms, a large volume of residual myocardium still at risk because of severe underlying coronary dis-ease, and high-grade ventricular arrhythmias.
heart failure because of subsequent volume overload of the pulmonary capillaries. A loud systolic murmur at the left sternal border, rep-resenting transseptal fl ow, is common in this situation. Although each results in a systolic murmur, ventricular septal rupture can be dif-ferentiated from acute mitral regurgitation by the location of the murmur (see Fig. 2.11), by Doppler echocardiography, or by measuring the O2 saturation of blood in the right-sided heart chambers through a transvenous cath-eter. The O2 content in the right ventricle is abnormally higher than that in the right atrium if there is shunting of oxygenated blood from the left ventricle across the septal defect.
True Ventricular Aneurysm
A late complication of MI, a true ventricular an-eurysm occurs weeks to months after the acute infarction. It develops as the ventricular wall is weakened, but not perforated, by the phago-cytic clearance of necrotic tissue, and it results in a localized outward bulge (dyskinesia) when the residual viable heart muscle contracts. Un-like the pseudoaneurysm described earlier, a true aneurysm does not involve communication between the LV cavity and the pericardium, so that rupture and tamponade do not develop. Potential complications of LV aneurysm in-clude (1) thrombus formation within this re-gion of stagnant blood fl ow, serving as a source of emboli to peripheral organs; (2) ventricular arrhythmias associated with the stretched myo-fi bers; and (3) heart failure resulting from re-duced forward cardiac output, because some of the LV stroke volume is “wasted” by fi lling the aneurysm cavity during systole.
Clues to the presence of an LV aneurysm include persistent ST segment elevations on the ECG weeks after an acute ST-elevation MI and a bulge at the LV border on chest radio-graphy. The abnormality can be confi rmed by echocardiography.
Pericarditis
Acute pericarditis may occur in the early (in-hospital) post-MI period as infl amma-tion extends from the myocardium to the adjacent pericardium. Sharp pain, fever, and a
77237_ch07.indd 18777237_ch07.indd 187 8/11/10 8:12:38 AM8/11/10 8:12:38 AM

Chapter 7
188
To identify patients at high risk for com-plications who may benefi t from cardiac cath-eterization and revascularization, exercise treadmill testing is often performed (unless the patient has already undergone catheterization and corrective percutaneous revascularization for the presenting coronary syndrome). Pa-tients with signifi cantly abnormal results, or those who demonstrate an early spontaneous recurrence of angina, are customarily referred for cardiac catheterization to defi ne their coro-nary anatomy.
Standard postdischarge therapy includes aspirin, a �-blocker, and an HMG-CoA re-ductase inhibitor (statin) to achieve an LDL value of �70 mg/dL. ACE inhibitors are pre-scribed to patients who have LV contractile dysfunction; an aldosterone antagonist should also be considered in those with heart failure symptoms. Rigorous attention to underlying cardiac risk factors, such as smoking, hyper-tension, and diabetes, is mandatory, and a formal exercise rehabilitation program often speeds convalescence.
Patients who have an LV ejection fraction of �30% after MI are at high risk of sudden cardiac death and are candidates for prophy-lactic placement of an implantable cardioverter-defi brillator. Current guidelines recommend postponing such implantation for at least 40 days post-MI because clinical trials have not shown a survival benefi t at earlier stages.
SUMMARY
1. ACS include UA, NSTEMI, and STEMI. Most ACS episodes are precipitated by an intra- coronary thrombus at the site of atheroscle-rotic plaque. Plaque rupture is the usual trigger for thrombus formation through activation of platelets and the coagulation cascade. Atherosclerosis-induced endothe-lial dysfunction contributes to the process by producing decreased amounts of vaso-dilators and antithrombotic mediators.
2. Distinctions among types of ACS are based on the severity of ischemia and whether myocardial necrosis results. STEMI is as-sociated with an occlusive thrombus and severe ischemia with necrosis. ACS with-
out ST elevation (NSTEMI and UA) usually result from partially occlusive thrombi with less intense ischemia. Compared with UA, the insult in NSTEMI is of suffi cient magni-tude to cause some myocardial necrosis.
3. ACS result in biochemical and mechanical changes that impair systolic contraction, de-crease myocardial compliance, and predis-pose to arrhythmias. Infarction initiates an infl ammatory response that clears necrotic tissue and leads to scar formation. Tran-sient severe ischemia without infarction can cause “stunned” myocardium, a condi-tion of contractile dysfunction that persists beyond the period of ischemia, with subse-quent gradual recovery of function.
4. The diagnosis of specifi c ACS relies on the patient’s history, ECG abnormalities, and appearance of specifi c biomarkers in the serum (e.g., cardiac troponins).
5. Acute treatment of UA and NSTEMI in-cludes anti-ischemic therapy to restore bal-ance between myocardial oxygen supply and demand (e.g., �-blockers, nitrates) and antithrombotic therapy to facilitate resolu-tion of the intracoronary thrombus (aspirin, an anticoagulant [e.g., IV heparin, LMWH], an ADP receptor antagonist [e.g., clopi-dogrel], and possibly a GP IIb/IIIa receptor antagonist). Statin therapy is usually indi-cated. Early coronary angiography, with subsequent coronary revascularization, is benefi cial in high-risk patients.
6. Acute treatment for STEMI includes early reperfusion strategies with fi brinolytic drugs or percutaneous catheter-based in-terventions. Other important measures include antiplatelet therapy (aspirin, clopi-dogrel), an anticoagulant, a �-blocker, and sometimes nitrate therapy. A statin and an ACE inhibitor are frequently appropriate.
7. Potential complications of infarction in-clude arrhythmias (e.g., ventricular tachy-cardia and fi brillation), atrioventricular blocks, and bundle branch blocks. Cardio-genic shock or congestive heart failure may develop because of ventricular dysfunction or the development of mechanical com-plications (e.g., acute mitral regurgitation or ventricular septal defect). Wall motion
77237_ch07.indd 18877237_ch07.indd 188 8/11/10 8:12:38 AM8/11/10 8:12:38 AM

Acute Coronary Syndromes
189
report of the American College of Cardiology/American Heart Association Task Force on Prac-tice Guidelines. Circulation. 2007;116:803–877.
Bonaca MP, Steg PG, Feldman LJ, et al. Antithrom-botics in acute coronary syndromes. J Am Coll Cardiol. 2009;54:969–984.
Giugliano RP, Braunwald E. The year in non-ST-segment elevation acute coronary syndrome.J Am Coll Cardiol. 2008;52:1095–1103.
Hillis LD, Lange RA. Optimal management of acute coronary syndromes. N Engl J Med. 2009;360: 2237–2240.
Krumholz HM, Wang Y, Chen J, et al. Reduction in acute myocardial infarction mortality in the United States: risk-standardized mortality rates from 1995–2006. JAMA. 2009;302:767–773.
Kumar A, Cannon CP. Acute coronary syndromes: diagnosis and management, parts I and II. Mayo Clin Proc. 2009;84:917–938, 1021–1036.
Kushner FG, Hand M, Smith SC Jr, et al. Focused up-dates: ACC/AHA guidelines for the management of patients with ST-elevation myocardial infarction (updating the 2004 guideline and 2007 focused update) and ACC/AHA/SCAI guidelines on percu-taneous coronary intervention (updating the 2005 guideline and 2007 focused update): a report of the American College of Cardiology Foundation/American Heart Association Task Force on Prac-tice Guidelines. Circulation. 2009;120:2271–2306.
Mega JL, Close SL, Wiviott SD, et al. Cytochrome p-450 polymorphisms and response to clopi-dogrel. N Engl J Med. 2009;360:354–362.
Mehta SR, Granger CB, Boden WE, et al. Early versus delayed invasive intervention in acute coronary syndromes. N Engl J Med. 2009;360:2165–2175.
Myerburg RJ. Implantable cardioverter-defi brilla-tors after myocardial infarction. N Engl J Med. 2008;359:2245–2253.
abnormalities of the affected segment may predispose to thrombus formation.
8. Standard pharmacologic therapy following discharge from the hospital includes mea-sures to reduce the risks of thrombosis (as-pirin and clopidogrel), recurrent ischemia (a �-blocker), progressive atherosclerosis (cholesterol-lowering therapy, usually a statin), and adverse ventricular remodeling (an ACE inhibitor, especially if LV dysfunc-tion is present). Systemic anticoagulation with warfarin is indicated if an intraven-tricular thrombus, a large akinetic segment, or atrial fi brillation is present.
9. Post-ACS risk stratifi cation can identify pa-tients at high risk of recurrent ischemia, re-infarction, or death. Impaired LV function, high-grade ventricular arrhythmias, and ischemic changes during exercise testing all portend unfavorable outcomes and warrant further investigation and treatment.
Acknowledgments
The authors thank Frederick Schoen, MD, for his helpful suggestions. Contributors to the previous editions of this chapter were Haley Naik, MD; J.G. Fletcher, MD; Anurag Gupta, MD; Marc S. Sabatine, MD; William Carlson, MD; Patrick T. O’Gara, MD; and Leonard S. Lilly, MD.
Additional Reading
Anderson JL, Adams CD, Antman EM, et al. ACC/AHA 2007 guidelines for the management of pa-tients with unstable angina/non ST-elevation myocardial infarction: executive summary: a
77237_ch07.indd 18977237_ch07.indd 189 8/11/10 8:12:38 AM8/11/10 8:12:38 AM

190
C H A P T E R
8Valvular Heart DiseaseChristopher A. Miller Patrick T. O’GaraLeonard S. Lilly
cases, cardiac magnetic resonance imaging. In selected patients, additional investigation with exercise testing or cardiac catheterization may be necessary to defi ne fully the signifi cance of the condition and guide therapy.
RHEUMATIC FEVER
Acute rheumatic fever (ARF) was once among the most common causes of valvular heart disease, but its incidence has waned consider-ably in the past half-century in industrialized societies. In the 1940s, the yearly incidence exceeded 200,000 cases in the United States, whereas the disease is now rare. The decline of this condition immediately preceded or coincided with the introduction of penicillin, as well as with the improvement of general health care and the relief from overcrowding.
This chapter describes the pathophysiologic abnormalities in patients with common
valvular heart diseases. Each of the conditions is discussed separately because unifying prin-ciples do not govern the behavior of all stenotic or regurgitant valves. Effective patient man-agement requires accurate identifi cation of the valvular lesion, a determination of its severity, and a clear understanding of the pathophysi-ologic consequences and natural history of the condition.
The evaluation of a patient with a suspected valvular lesion begins at the bedside with a careful history and physical examination from which the trained clinician can usually iden-tify the type of abnormalities that are present. The severity of the valve lesions can then be further assessed from the electrocardiogram, chest radio graph, echocardiogram, and, in some
RHEUMATIC FEVERMITRAL VALVE DISEASEMitral StenosisMitral RegurgitationMitral Valve Prolapse
AORTIC VALVE DISEASEAortic StenosisAortic Regurgitation
TRICUSPID VALVE DISEASETricuspid StenosisTricuspid Regurgitation
PULMONIC VALVE DISEASEPulmonic StenosisPulmonic Regurgitation
PROSTHETIC VALVESINFECTIVE ENDOCARDITISPathogenesisClinical Manifestations
77237_ch08.indd 19077237_ch08.indd 190 8/11/10 8:13:10 AM8/11/10 8:13:10 AM

Valvular Heart Disease
191
Although occasional local outbreaks occur, a major resurgence has not been seen in this country. Nevertheless, in developing parts of the world, ARF continues to be a scourge with fulminant consequences.
ARF is an infl ammatory condition that primarily involves the heart, skin, and con-nective tissues. It is a complication of upper respiratory tract infections caused by group A streptococci and mainly occurs in children and young adults. During epidemics, approx-imately 3% of patients with acute strepto-coccal pharyngitis develop ARF 2 to 3 weeks after the initial throat infection. Although the pathogenesis remains unknown, it does not involve direct bacterial infection of the heart. Some proposed mechanisms include the elab-oration of a toxin by the streptococci or auto-immune cross-reactivity between bacterial and cardiac antigens.
Pathologically in ARF, carditis (i.e., car-diac infl ammation) may affl ict all three lay-ers of the heart (pericardium, myocardium, and endocardium). Histopathologic exami-nation often demonstrates the Aschoff body (Fig. 8.1), an area of focal fi brinoid necrosis surrounded by infl ammatory cells, including lymphocytes, plasma cells, and macrophages, that later resolve to form fi brous scar tissue. The most devastating sequelae result from in-
fl ammatory involvement of the valvular endo-cardium, which leads to chronic rheumatic heart disease characterized by permanent deformity and impairment of one or more cardiac valves. Symptoms of valvular dys-function, however, generally do not become manifest until 10 to 30 years after ARF has subsided. This latency period may be consid-erably shorter with the more aggressive dis-ease observed in developing countries.
The most common presenting symptoms of ARF are chills, fever, fatigue, and migratory arthralgias. The cardinal symptoms and clini-cal manifestations of the disease that establish the diagnosis are known as the Jones criteria (Table 8.1). During the acute episode, carditis may be associated with tachycardia, decreased left ventricular contractility, a pericardial fric-tion rub, a transient murmur of mitral or aortic regurgitation, or a mid-diastolic murmur at the cardiac apex (termed the Carey–Coombs murmur). These transient murmurs likely refl ect turbulent fl ow across infl amed valve leafl ets. Treatment of the acute episode includes the use of high-dose aspirin to reduce infl ammation, penicillin to eliminate residual streptococcal infection, and therapy for complications such as congestive heart failure and pericarditis.
During the chronic phase of this condition, stenosis or regurgitation of cardiac valves is
Figure 8.1. Histopathologic appearance of an Aschoff body in acute rheumatic carditis. Mononuclear infl ammatory cells surround a center of focal necrosis. (Courtesy of Dr. Frederick J. Schoen, Brigham and Women’s Hospital, Boston.)
77237_ch08.indd 19177237_ch08.indd 191 8/11/10 8:13:10 AM8/11/10 8:13:10 AM
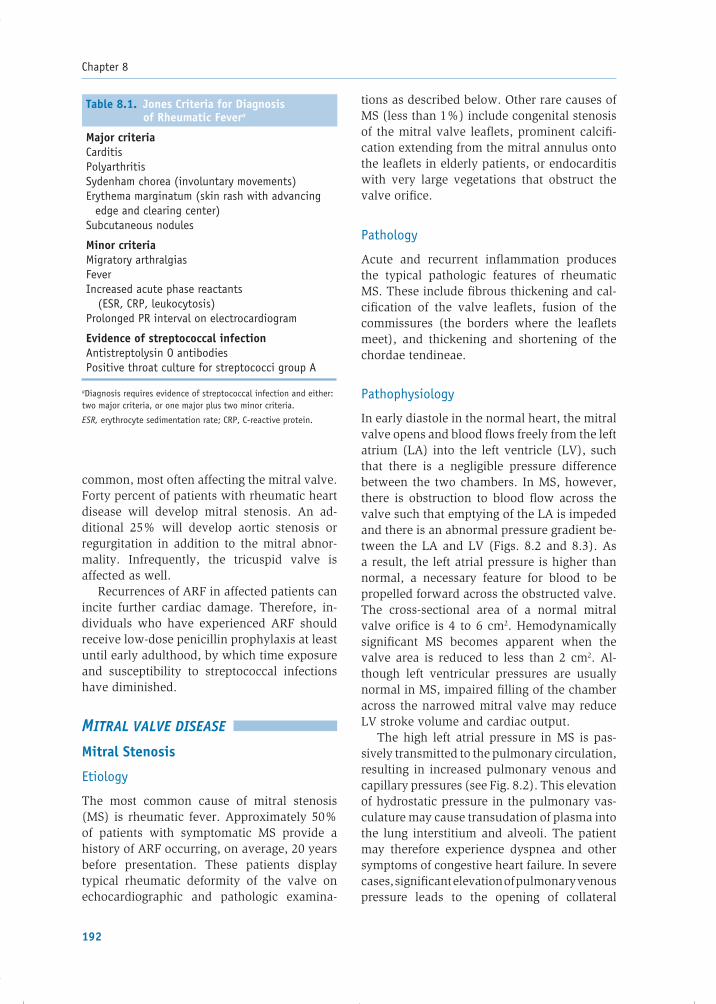
Chapter 8
192
common, most often affecting the mitral valve. Forty percent of patients with rheumatic heart disease will develop mitral stenosis. An ad-ditional 25% will develop aortic stenosis or regurgitation in addition to the mitral abnor-mality. Infrequently, the tricuspid valve is affected as well.
Recurrences of ARF in affected patients can incite further cardiac damage. Therefore, in-dividuals who have experienced ARF should receive low-dose penicillin prophylaxis at least until early adulthood, by which time exposure and susceptibility to streptococcal infections have diminished.
MITRAL VALVE DISEASE
Mitral Stenosis
Etiology
The most common cause of mitral stenosis (MS) is rheumatic fever. Approximately 50% of patients with symptomatic MS provide a history of ARF occurring, on average, 20 years before presentation. These patients display typical rheumatic deformity of the valve on echocardiographic and pathologic examina-
tions as described below. Other rare causes of MS (less than 1%) include congenital stenosis of the mitral valve leafl ets, prominent calcifi -cation extending from the mitral annulus onto the leafl ets in elderly patients, or endocarditis with very large vegetations that obstruct the valve orifi ce.
Pathology
Acute and recurrent infl ammation produces the typical pathologic features of rheumatic MS. These include fi brous thickening and cal-cifi cation of the valve leafl ets, fusion of the commissures (the borders where the leafl ets meet), and thickening and shortening of the chordae tendineae.
Pathophysiology
In early diastole in the normal heart, the mitral valve opens and blood fl ows freely from the left atrium (LA) into the left ventricle (LV), such that there is a negligible pressure difference between the two chambers. In MS, however, there is obstruction to blood fl ow across the valve such that emptying of the LA is impeded and there is an abnormal pressure gradient be-tween the LA and LV (Figs. 8.2 and 8.3). As a result, the left atrial pressure is higher than normal, a necessary feature for blood to be propelled forward across the obstructed valve. The cross-sectional area of a normal mitral valve orifi ce is 4 to 6 cm2. Hemodynamically signifi cant MS becomes apparent when the valve area is reduced to less than 2 cm2. Al-though left ventricular pressures are usually normal in MS, impaired fi lling of the chamber across the narrowed mitral valve may reduce LV stroke volume and cardiac output.
The high left atrial pressure in MS is pas-sively transmitted to the pulmonary circulation, resulting in increased pulmonary venous and capillary pressures (see Fig. 8.2). This elevation of hydrostatic pressure in the pulmonary vas-culature may cause transudation of plasma into the lung interstitium and alveoli. The patient may therefore experience dyspnea and other symptoms of congestive heart failure. In severe cases, signifi cant elevation of pulmonary venous pressure leads to the opening of collateral
Table 8.1. Jones Criteria for Diagnosis of Rheumatic Fevera
Major criteriaCarditisPolyarthritisSydenham chorea (involuntary movements)Erythema marginatum (skin rash with advancing edge and clearing center)Subcutaneous nodules
Minor criteriaMigratory arthralgiasFeverIncreased acute phase reactants (ESR, CRP, leukocytosis)Prolonged PR interval on electrocardiogram
Evidence of streptococcal infectionAntistreptolysin O antibodiesPositive throat culture for streptococci group A
aDiagnosis requires evidence of streptococcal infection and either: two major criteria, or one major plus two minor criteria.
ESR, erythrocyte sedimentation rate; CRP, C-reactive protein.
77237_ch08.indd 19277237_ch08.indd 192 8/11/10 8:13:10 AM8/11/10 8:13:10 AM

Valvular Heart Disease
193
NORMAL(DIASTOLE)
LV
LA
Aorta
MITRALSTENOSIS
Elevated pulmonaryand right-heart pressures
PressureVolume
Figure 8.2. Pathophysiology of mitral stenosis. In the normal heart, blood fl ows freely from the left atrium (LA) into the left ventricle (LV) during diastole. In mitral stenosis, there is obstruction to LA emptying. Thus, the LA pressure increases, which in turn elevates pulmonary and right-heart pressures.
ECG
OS
Figure 8.3. Hemodynamic profi le of mitral stenosis. The left atrial (LA) pressure is elevated, and there is a pressure gradient (shaded area) between the LA and left ventricle (LV) during diastole. Compare with schematic of normal tracing (see Fig. 2.1). Abnormal heart sounds are present: There is a diastolic opening snap (OS) that corresponds to the opening of the mitral valve, followed by a decrescendo murmur. There is accentuation of the murmur just before S1 owing to the increased pressure gradient when the LA contracts (presystolic accentuation).
77237_ch08.indd 19377237_ch08.indd 193 8/11/10 8:13:11 AM8/11/10 8:13:11 AM

Chapter 8
194
channels between the pulmonary and bron-chial veins. Subsequently, the high pulmonaryvascular pressures may rupture a bronchial vein into the lung parenchyma, resulting in coughing up of blood (hemoptysis).
The elevation of left atrial pressure in MS can result in two distinct forms of pulmonary hyper-tension: passive and reactive. Most patients with MS exhibit passive pulmonary hyper-tension, related to the backward transmission of the elevated LA pressure into the pulmonary vasculature. This actually represents an “oblig-atory” increase in pulmonary artery pressure that develops to preserve forward fl ow in the setting of increased left atrial and pulmonary venous pressures. Additionally, approximately 40% of patients with MS demonstrate reactive pulmonary hypertension with medial hyper-trophy and intimal fi brosis of the pulmonary arterioles. Reactive pulmonary hypertension serves a “benefi cial” role because the increased arteriolar resistance impedes blood fl ow into the engorged pulmonary capillary bed and thus reduces capillary hydrostatic pressure (thereby “protecting” the pulmonary capillaries from even higher pressures). However, this benefi t is at the cost of decreased blood fl ow through the pulmonary vasculature and elevation of the right-sided heart pressures, as the right ventricle pumps against the increased resistance. Chronic elevation of right ventricular pressure leads to hypertrophy and dilatation of that chamber and ultimately to right-sided heart failure.
Chronic pressure overload of the LA in MS leads to left atrial enlargement. Left atrial dil-atation stretches the atrial conduction fi bers and may disrupt the integrity of the cardiac conduction system, resulting in atrial fi bril-lation (a rapid irregular heart rhythm; see Chapter 12). Atrial fi brillation contributes to a decline in cardiac output in MS because the increased heart rate shortens diastole. This reduces the time available for blood to fl ow across the obstructed mitral valve to fi ll the LV, and, at the same time, further augments the elevated left atrial pressure.
The relative stagnation of blood fl ow in the dilated LA in MS, especially when combined with the development of atrial fi brillation,predisposes to intra-atrial thrombus forma-tion. Thromboemboli to peripheral organs may
follow, leading to devastating complications such as cerebrovascular occlusion (stroke). Thus, MS patients who develop atrial fi brilla-tion require chronic anticoagulation therapy.
Clinical Manifestations and Evaluation
Presentation
The natural history of MS is variable. The 10-year survival of untreated patients after onset of symptoms is 50% to 60%. Survival exceeds 80% in asymptomatic or minimally symptom-atic patients at 10 years. Longevity is much more limited for patients with advanced symp-toms and is dismal for those who develop sig-nifi cant pulmonary hypertension, with a mean survival less than 3 years.
The clinical presentation of MS depends largely on the degree of reduction in valve area. The more severe the stenosis, the greater the symptoms related to elevation of left atrial and pulmonary venous pressures. The earliest manifestations are those of dyspnea and re-duced exercise capacity. In mild MS, dyspnea may be absent at rest; however, it develops on exertion as LA pressure rises with the exercise-induced increase in blood fl ow through the heart and faster heart rate (i.e., decreased dia-stolic fi lling time). Other conditions and activi-ties that increase heart rate and cardiac blood fl ow and, therefore, precipitate or exacerbate symptoms of MS, include fever, anemia, hyper-thyroidism, pregnancy, rapid arrhythmias such as atrial fi brillation, exercise, emotional stress, and sexual intercourse.
With more severe MS (i.e., a smaller valve area), dyspnea occurs even at rest. Increasing fatigue and more severe signs of pulmonary congestion, such as orthopnea and paroxys-mal nocturnal dyspnea, occur. With advanced MS and pulmonary hypertension, signs of right-sided heart failure ensue, including jugu-lar venous distention, hepatomegaly, ascites, and peripheral edema. Compression of therecurrent laryngeal nerve by an enlarged pul-monary artery or LA may cause hoarseness.
Less often, the diagnosis of MS is heralded by one of its complications: atrial fi brillation, thromboembolism, infective endocarditis, or hemoptysis, as described in the earlier section on pathophysiology.
77237_ch08.indd 19477237_ch08.indd 194 8/11/10 8:13:11 AM8/11/10 8:13:11 AM

Valvular Heart Disease
195
Examination
On examination, there are several typical fi nd-ings of MS. Palpation of the left anterior chest may reveal a right ventricular “tap” in patients with increased right ventricular pressure. Aus-cultation discloses a loud S1 (the fi rst heart sound, which is associated with mitral valve closure) in the early stages of the disease. The increased S1 results from the high pressure gra-dient between the atrium and ventricle, which keeps the mobile portions of the mitral valve leafl ets widely separated throughout diastole; at the onset of systole, ventricular contraction abruptly slams the leafl ets together from the rel-atively wide position, causing the closure sound to be more prominent (see Chapter 2). In late stages of the disease, the intensity of S1 may nor-malize or become reduced as the valve leafl ets thicken, calcify, and become immobile.
A main feature of auscultation in MS is a high-pitched “opening snap” (OS) that follows S2. The OS is thought to result from the sudden tensing of the chordae tendineae and stenotic leafl ets on opening of the valve. The interval between S2 and the OS relates inversely to the severity of MS. That is, the more severe the MS, the higher the LA pressure and the earlier the valve is forced open in diastole. The OS is fol-lowed by a low-frequency decrescendo murmur (termed a diastolic rumble) caused by turbulent fl ow across the stenotic valve during diastole (see Fig. 8.3). The duration, but not the inten-sity, of the diastolic murmur relates to the se-verity of MS. The more severe the stenosis, the longer it takes for the LA to empty and for the gradient between the LA and LV to dissipate. Near the end of diastole, contraction of the LA causes the pressure gradient between the LA and LV to rise again (see Fig. 8.3); therefore, the murmur briefl y becomes louder (termed pre-systolic accentuation). This fi nal accentuation of the murmur does not occur if atrial fi brillation has developed because there is no effective atrial contraction in that situation. Murmurs caused by other valvular lesions are often found concur-rently in patients with MS. For example, mitral regurgitation (discussed later in this chapter) frequently coexists with MS. Additionally, right-sided heart failure caused by severe MS may induce tricuspid regurgitation as a result of right
ventricular enlargement. A diastolic decrescendo murmur along the left sternal border may be present owing to coexistent aortic regurgitation (because of rheumatic involvement of the aortic leafl ets) or pulmonic regurgitation (because of MS-induced pulmonary hypertension).
The electrocardiogram in MS routinely shows left atrial enlargement and, if pulmonary hyper-tension has developed, right ventricular hyper-trophy. Atrial fi brillation may be present. The chest radiograph reveals left atrial enlargement, pulmonary vascular redistribution, interstitial edema, and Kerley B lines resulting from edema within the pulmonary septae (see Chapter 3). With the development of pulmonary hyper-tension, right ventricular enlargement and promi-nence of the pulmonary arteries also appear.
Echocardiography is of major diagnostic value in MS. It reveals thickened mitral leafl ets and abnormal fusion of their commissures with restricted separation during diastole. Left atrial enlargement can be assessed, and if present, intra-atrial thrombus may be visualized. The mitral valve area can be measured directly on cross-sectional views or calculated from Doppler echocardiographic velocity measurements. Patients can be stratifi ed into groups of disease severity based partly on the mitral valve area. A normal mitral valve orifi ce measures between 4 and 6 cm2. A reduced mitral valve area of�2 cm2 correlates with mild MS, and a valve area of 1.1 to 1.5 cm2 correlates with moder-ate MS. Severe MS is defi ned by a valve area of �1.0 cm2. Although cardiac catheteriza-tion is not necessary to confi rm the diagnosis of MS, it is sometimes performed to calculate the valve area by direct hemodynamic meas-urements and to clarify whether signifi cantmitral regurgitation, pulmonary hypertension, or coronary artery disease is present.
Treatment
Diuretics are prescribed to treat symptoms of vascular congestion in MS. If atrial fi bril-lation has developed, a �-blocker, a calcium channel antagonist with negative chronotropic properties (verapamil or diltiazem), or digoxinmay be used to slow the rapid ventricular rate and thereby improve diastolic LV fi lling. Chronic anticoagulation therapy to prevent
77237_ch08.indd 19577237_ch08.indd 195 8/11/10 8:13:11 AM8/11/10 8:13:11 AM

Chapter 8
196
thromboembolism is recommended for pa-tients with MS and atrial fi brillation, and for those in whom emboli have already occurred.
If symptoms of MS persist despite diuretic therapy and control of rapid heart rates, or if sig-nifi cant PA hypertension is present, mechanical correction of the stenosis is warranted. Percuta-neous balloon mitral valvuloplasty is the treat-ment of choice for MS in appropriately selected patients. During this procedure, a balloon cath-eter is advanced from the femoral vein into the right atrium, across the atrial septum (by in-tentionally creating a small septal defect there), and through the narrowed mitral valve orifi ce. The balloon is then rapidly infl ated, thereby “cracking” open the fused commissures. The procedure is safest and most effective in the ab-sence of complicating features, such as mitral regurgitation, extensive valve or subvalvular calcifi cation, or atrial thrombus. The results of this procedure in randomized trials compare favorably with those of surgical treatment in an-atomically appropriate patients. Approximately 5% of patients undergoing balloon mitral val-vuloplasty are left with a residual atrial septal defect. Less frequent complications include cerebral emboli at the time of valvuloplasty, cardiac perforation, or the creation of mitral
regurgitation requiring subsequent surgical re-placement. The estimated event-free survival 7 years after valvuloplasty is 67% to 76%.
Surgical options are undertaken for correct-ing MS in individuals whose anatomy is not ideal for balloon valvuloplasty. These tech-niques include open mitral commissurotomy (an operation in which the stenotic commissures are separated under direct visualization) and, in severe disease, mitral valve replacement. Open mitral valve commissurotomy is effective, and restenosis occurs in fewer than 20% of patients over 10 to 20 years of follow-up.
Mitral Regurgitation
Etiology
Normal closure of the mitral valve during systole requires the coordinated action of each compo-nent of the valve apparatus. Therefore, mitral regurgitation (MR) may result from structural abnormalities of the mitral annulus, the valve leafl ets, the chordae tendineae, or the papillary muscles (Fig. 8.4). For example, myxomatous degeneration of the valve (the etiology of mitral valve prolapse) causes MR because enlarged, redundant leafl ets bow excessively into the LA during systole rather than opposing each other
Left atriumMitral annulus
•
Leaflets
••••
Annular calcification
Myxomatous degeneration (“MVP”)Rheumatic diseaseEndocarditisSAM (hypertrophic cardiomyopathy)
Chordae tendineae
••
•
Rupture (idiopathic)Endocarditis
Papillary muscles
Dysfunction or rupture
•
Left ventricle
Cavity dilatation
Figure 8.4. The mitral valve apparatus and associated common etiologies of mitral regurgitation. MVP, mitral valve prolapse; SAM, systolic anterior motion.
77237_ch08.indd 19677237_ch08.indd 196 8/11/10 8:13:11 AM8/11/10 8:13:11 AM
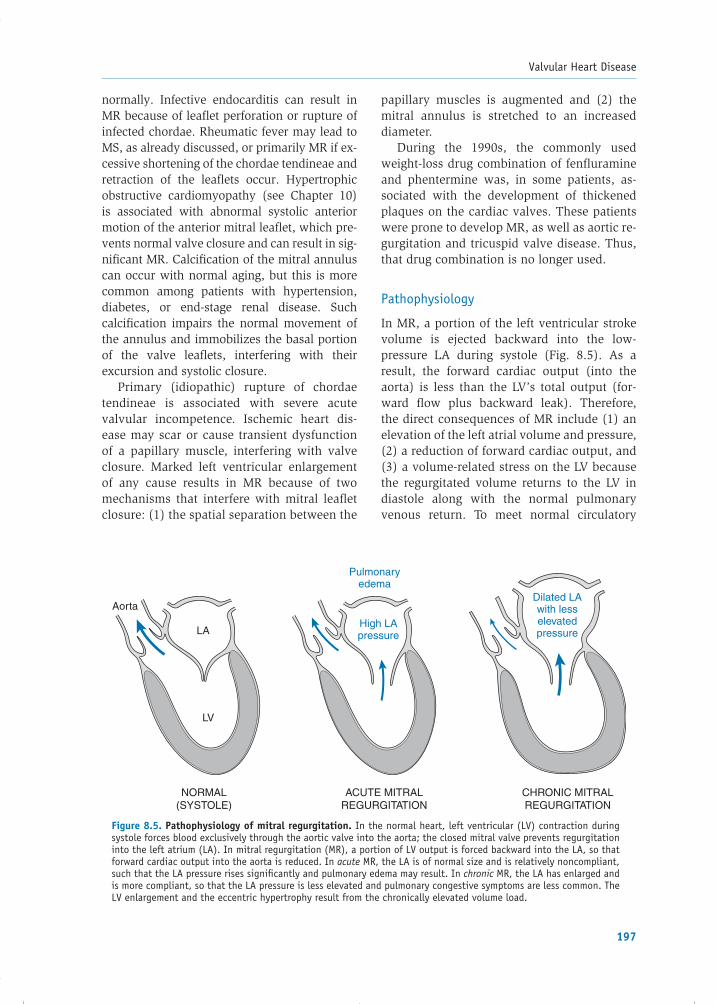
Valvular Heart Disease
197
normally. Infective endocarditis can result in MR because of leafl et perforation or rupture of infected chordae. Rheumatic fever may lead to MS, as already discussed, or primarily MR if ex-cessive shortening of the chordae tendineae and retraction of the leafl ets occur. Hyper trophic obstructive cardiomyopathy (see Chapter 10) is associated with abnormal systolic anterior motion of the anterior mitral leafl et, which pre-vents normal valve closure and can result in sig-nifi cant MR. Calcifi cation of the mitral annulus can occur with normal aging, but this is more common among patients with hyper tension, diabetes, or end-stage renal disease. Such calcifi cation impairs the normal movement of the annulus and immobilizes the basal portion of the valve leafl ets, interfering with their excursion and systolic closure.
Primary (idiopathic) rupture of chordae tendineae is associated with severe acute valvular incompetence. Ischemic heart dis-ease may scar or cause transient dysfunction of a papillary muscle, interfering with valve closure. Marked left ventricular enlargement of any cause results in MR because of two mechanisms that interfere with mitral leafl et closure: (1) the spatial separation between the
papillary muscles is augmented and (2) the mitral annulus is stretched to an increased diameter.
During the 1990s, the commonly used weight-loss drug combination of fenfl uramine and phentermine was, in some patients, as-sociated with the development of thickened plaques on the cardiac valves. These patients were prone to develop MR, as well as aortic re-gurgitation and tricuspid valve disease. Thus, that drug combination is no longer used.
Pathophysiology
In MR, a portion of the left ventricular stroke volume is ejected backward into the low-pressure LA during systole (Fig. 8.5). As a result, the forward cardiac output (into the aorta) is less than the LV’s total output (for-ward fl ow plus backward leak). Therefore, the direct consequences of MR include (1) an elevation of the left atrial volume and pressure, (2) a reduction of forward cardiac output, and(3) a volume-related stress on the LV because the regurgitated volume returns to the LV in diastole along with the normal pulmonary venous return. To meet normal circulatory
Figure 8.5. Pathophysiology of mitral regurgitation. In the normal heart, left ventricular (LV) contraction during systole forces blood exclusively through the aortic valve into the aorta; the closed mitral valve prevents regurgitation into the left atrium (LA). In mitral regurgitation (MR), a portion of LV output is forced backward into the LA, so that forward cardiac output into the aorta is reduced. In acute MR, the LA is of normal size and is relatively noncompliant, such that the LA pressure rises signifi cantly and pulmonary edema may result. In chronic MR, the LA has enlarged and is more compliant, so that the LA pressure is less elevated and pulmonary congestive symptoms are less common. The LV enlargement and the eccentric hypertrophy result from the chronically elevated volume load.
NORMAL(SYSTOLE)
LA
LV
Aorta
ACUTE MITRALREGURGITATION
CHRONIC MITRALREGURGITATION
Pulmonaryedema
High LApressure
Dilated LAwith lesselevatedpressure
77237_ch08.indd 19777237_ch08.indd 197 8/11/10 8:13:11 AM8/11/10 8:13:11 AM

198
Chapter 8
needs and to eject the additional volume, LV stroke volume must rise. This increase is accomplished by the Frank–Starling mecha-nism (see Chapter 9), whereby the elevated LV diastolic volume augments myofi ber stretch and stroke volume with each contraction. The subsequent hemodynamic consequences of MR vary depending on the degree of regurgita-tion and how long it has been present.
The severity of MR and the ratio of forward cardiac output to backward fl ow are dictated by fi ve factors: (1) the size of the mitral orifi ce during regurgitation, (2) the systolic pressure gradient between the LV and LA, (3) the sys-temic vascular resistance opposing forward LV blood fl ow, (4) the left atrial compliance, and (5) the duration of regurgitation with each sys-tolic contraction.
The regurgitant fraction in MR is defi ned as follows:
Volume of MRTotal LV stroke volume
and this ratio rises whenever the resistance to aortic outfl ow is increased (i.e., blood follows the path of least resistance). For example, high systemic blood pressure or the presence of aortic stenosis will increase the regurgitant fraction. The extent to which left atrial pressure rises in response to the regurgitant volume is determined by the left atrial compliance. Compliance is a measure of the chamber’s pressure–volume relationship, refl ecting the ease or diffi culty with which the chamber can be fi lled (see Table 9.1).
In acute MR (e.g., owing to sudden rupture of chordae tendineae), left atrial compliance undergoes little immediate change. Because the LA is a relatively stiff chamber, its pressure increases substantially when it is suddenly ex-posed to the regurgitant volume (see Fig. 8.5). This elevated pressure serves to prevent fur-ther regurgitation; however, the high pressure is also transmitted backward to the pulmonary circulation. Therefore, acute MR can result in rapid pulmonary congestion and edema, a medical emergency.
In acute MR, the LA pressure, or the pul-monary capillary wedge pressure (an indirect measurement of LA pressure; see Chapter 3),
demonstrates a prominent v wave (often re-ferred to as a “cv” wave when it is so promi-nent that it merges with the preceding c wave), refl ecting the increased LA fi lling during sys-tole (Fig. 8.6). Additionally, as in MS, pulmo-nary artery and right-heart pressures passively rise such that forward fl ow through the heart is maintained.
In acute MR, the LV accommodates the in-creased volume load returning from the LA according to the Frank–Starling relationship. The result is a compensatory increase in the LV stroke volume, such that at the end of each systolic contraction, LV volume remains normal in the nonfailing heart. Systolic emp-tying of the ventricle is facilitated in MR by the reduced total impedance to LV contrac-tion (i.e., the afterload is lower than normal), since a portion of the LV output is directed into the relatively low-impedance LA, rather
Figure 8.6. Hemodynamic profi le of mitral regurgitation (MR). A large systolic v wave is noted in the left atrial (LA) pressure tracing. A holosystolic murmur is present in chronic MR (as shown here), beginning at the fi rst heart sound (S1) and continuing through the second heart sound (S2). In severe acute MR, the systolic mur-mur may actually have a decrescendo quality, re-fl ecting rapid equilibration of LV and LA pressures owing to the relatively reduced LA compliance. ECG, electrocardiogram; LV, left ventricle.
Tall vwave
ECG
77237_ch08.indd 19877237_ch08.indd 198 8/11/10 8:13:11 AM8/11/10 8:13:11 AM

Valvular Heart Disease
199
than into the higher-pressure aorta as in nor-mal outfl ow.
In contrast to the acute situation, the more gradual development of chronic MR (e.g., owing to rheumatic valve disease) permits the LA to undergo compensatory changes that lessen the effects of regurgitation on the pulmonary circulation (see Fig. 8.5). In particular, the LA dilates and its compliance increases such that the chamber is able to accommodate a larger volume without a substantial increase in pres-sure. Left atrial dilatation is therefore adaptive in that it prevents signifi cant increases in pul-monary vascular pressures. However, this ad-aptation occurs at the cost of reduced forward cardiac output, because the compliant LA be-comes a preferred low-pressure “sink” for left ventricular ejection, compared with the greater impedance of the aorta. Consequently, as pro-gressively larger fractions of blood regurgitate into the LA, the main symptoms of chronic MR become those of low forward cardiac out-put (e.g., weakness and fatigue). In addition, chronic left atrial dilatation predisposes to the development of atrial fi brillation.
Thus, major pathophysiologic differences between acute and chronic MR relate to a great extent on left atrial size and compliance (see Fig. 8.5):
Acute MR: Normal LA size and compliance → High LA pressure → High pulmonary venous pressure → Pulmonary congestion and edema
Chronic MR: Increased LA size and com-pliance → More normal LA and pulmo-nary venous pressures, but lower forward c ardiac output
In chronic MR, the LV also undergoes gradual compensatory dilatation in response to the volume load, through eccentric hyper-trophy (see Chapter 9). Compared with acute MR, the resulting increased ventricular com-pliance accommodates the augmented fi lling volume with relatively normal diastolic pres-sures. Forward output in chronic MR is pre-served to near-normal levels for an extended period by maintaining a high stroke volume via the Frank–Starling mechanism. Over years, however, chronic volume overload results in
deterioration of systolic ventricular function,a decline in forward output, and symptoms of heart failure.
Clinical Manifestations and Evaluation
Presentation
As should be clear from the pathophysiology discussion, patients with acute MR usually present with symptoms of pulmonary edema (see Chapter 9). The symptoms of chronic MR are predominantly due to low cardiac output, especially during exertion, and consist of fatigue and weakness. Patients with severe MR or those who develop LV contractile dysfunction often complain of dyspnea, orthopnea, and/or paroxy-smal nocturnal dyspnea. In severe chronic MR, symptoms of right-heart failure (e.g., increased abdominal girth, peripheral edema) may de-velop as well.
Examination
The physical examination of a patient with chronic MR typically reveals an apical holo-systolic (also termed pansystolic) murmur that radiates to the axilla (see Fig. 8.6). This description, accurate for rheumatic MR, has some exceptions. For example, when ischemic papillary muscle dysfunction interferes with normal mitral valve closure, the regurgitant jet may be directed toward the anterior left atrial wall, immediately posterior to the aorta. In this setting, the murmur may be best heard along the left sternal edge or in the aortic area (see Chapter 2) and could be confused with the murmur of aortic stenosis (AS). Fortunately, the distinction between the systolic murmur of MR and that of AS can be made by simple bed-side maneuvers. If the patient is instructed to clench the fi sts, systemic vascular resistance will increase, and the severity of MR and its murmur will intensify, whereas the murmur of AS will not. Even more helpful in this distinc-tion is the effect of varying cardiac cycle length (the time between consecutive heart beats) on the intensity of the systolic murmur. In a patient with atrial fi brillation or with frequent premature beats, the LV fi lls to a degree that directly depends on the preceding cycle length (i.e., a longer cycle length permits greater left
77237_ch08.indd 19977237_ch08.indd 199 8/11/10 8:13:11 AM8/11/10 8:13:11 AM

Chapter 8
200
ventricular fi lling). The systolic murmur of AS becomes louder in the beat after a long cycle length because even small pressure gradients are amplifi ed as more blood is ejected across the reduced aortic orifi ce. In MR, however, the intensity of the murmur does not vary sig-nifi cantly because the change in the LV-to-LA pressure gradient is minimally affected by al-terations in the cycle length.
In patients with severe acute MR, the sys-tolic murmur is often different, refl ecting the underlying pathophysiology. In this case, the murmur may have a decrescendo quality, re-fl ecting the rapid equilibration between LV and LA pressures in systole caused by the rela-tively reduced LA compliance.
In addition to the systolic murmur, a com-mon fi nding in chronic MR is the presence of an S3, which refl ects increased volume return-ing to the LV in early diastole (see Chapter 2). In chronic MR, the palpated cardiac apical impulse is often laterally displaced toward the axilla because of LV enlargement.
The chest radiograph may display pulmonary edema in acute MR but in chronic asymptomatic MR more likely demonstrates left ventri cular and atrial enlargement, without pulmonary congestion. Calcifi cation of the mitral annulus may be seen if that is the cause of the MR. In chronic MR, the electrocardiogram typically demonstrates left atrial enlargement and signs of left ventricular hypertrophy. Echocardio-graphy can often identify the structural cause of MR and grade its severity by color Doppler analysis. Left ventricular size and function (usually vigorous in the “compensated” heart because of the increased stroke volume) can be observed. Cardiac catheterization and angio-graphy is useful for identifying a coronary ischemic cause (i.e., papillary muscle dysfunc-tion) and for grading the severity of MR. The characteristic hemodynamic fi nding is a largev wave on the pulmonary capillary wedge pressure (refl ecting LA pressure) tracing.
Natural History and Treatment
The natural history of chronic MR is related to its underlying cause. For example, in rheu-matic heart disease, the course is one of very slow progression with a 15-year survival rate
of 70%. On the other hand, abrupt worsen-ing of chronic MR of any cause can occur with superimposed complications, such as rupture of chordae tendineae or endocarditis, and can result in an immediate life-threatening situation.
Medical therapy of MR involves augment-ing forward cardiac output while reducing regurgitation into the LA and relieving pulmo-nary congestion. In acute MR with heart fail-ure, treatment includes intravenous diuretics to relieve pulmonary edema and vasodilators (e.g., intravenous sodium nitroprusside) to re-duce the resistance to forward fl ow and aug-ment forward cardiac output. In chronic MR, vasodilators are less useful and indicated only for the treatment of accompanying hyper-tension or LV systolic dysfunction, because these drugs have not been shown to delay the need for surgical correction.
Because chronic MR produces continu-ous left ventricular volume overload, it can slowly result in left ventricular contractile impairment and, ultimately, heart failure. Mi-tral valve surgery should be performed before this deterioration occurs. Mitral valve repair (reconstruction of the native valve) is cur-rently the preferred operative technique for appropriately selected patients. In the past, the operative mortality and the drawbacks associated with the use of prosthetic valves were motivations for delaying surgery as long as possible. Studies showed that survival after mitral valve replacement was not clearly better than the natural history of the disease, even though symptomatic improvement was the rule. Fortunately, mitral repair preserves native valve tissue, is associated with less im-pairment of postoperative LV function, and eliminates many of the problems of artifi cial valves.
Mitral repair involves the reconstruction of parts of the valve responsible for the regurgita-tion. For example, a perforated leafl et may be patched with transplanted autologous peri-cardium, or ruptured chordae may be reattached to a papillary muscle. In patients who undergo a repair operation, the postoperative survival rate appears to be better than the natural history of MR and has provided impetus toward earlier surgical intervention.
77237_ch08.indd 20077237_ch08.indd 200 8/11/10 8:13:11 AM8/11/10 8:13:11 AM

Valvular Heart Disease
201
The operative mortality rate is approxi-mately 2% to 4% for mitral valve repair and 5% to 7% for mitral replacement. These rates are higher if concurrent coronary artery bypass grafting is performed. In general, mitral valve repair is more often appropriate for younger patients with myxomatous involvement of the mitral valve, and mitral replacement is more often undertaken in older patients with more extensive valve pathology.
Mitral Valve Prolapse
Mitral valve prolapse (MVP) is a common and usually asymptomatic billowing of the mitral leafl ets into the LA during ventricular systole, sometimes accompanied by MR (Fig. 8.7). Other names for this condition include fl oppy mitral valve, myxomatous mitral valve, or Barlow syndrome. MVP may be inherited as a primary autosomal dominant disorder with variable pen-etrance or may occur as a part of other connec-tive tissue diseases, such as Marfan syndrome or Ehlers–Danlos syndrome. Pathologically, the valve leafl ets, particularly the posterior leafl et,
are enlarged, and the normal dense collagen and elastin matrix of the valvular fi brosa is frag-mented and replaced with loose myxomatous connective tissue. Additionally, in more severe lesions, elongated or ruptured chordae, annu-lar enlargement, or thickened leafl ets may be present. A recent rigorous echocardiographic study indicated that MVP occurs in about 2% of the population and is more common among women, especially those with thin, leanbodies.
MVP is often asymptomatic, but affected individuals may describe chest pain or pal-pitations because of associated arrhythmias. Most often it is identifi ed on routine physical examination by the presence of a midsystolic click and late systolic murmur heard best at the cardiac apex. The midsystolic click is thought to correspond to the sudden tens-ing of the involved mitral leafl et or chordae tendineae as the leafl et is forced back toward the LA; the murmur corresponds to regurgi-tant fl ow through the incompetent valve. The click and murmur are characteristically altered during dynamic auscultation at the bedside:
AO
RV
LA
LV
Figure 8.7. Mitral valve prolapse. Long axis view of the left ven-tricle (LV) demonstrates myxomatous, elongated appearance of the mitral valve with prolapse of the posterior leafl et (arrow) into the left atrium (LA). AO, aorta; RV, right ventricle. (From Schoen FJ. The heart. In: Kumar V, Abbas A, Fausto N, eds. Robbins and Cotran Pathologic Basis of Disease. 7th ed. Philadelphia: Elsevier Saunders; 2005:592. With permission requested.)
77237_ch08.indd 20177237_ch08.indd 201 8/11/10 8:13:11 AM8/11/10 8:13:11 AM

Chapter 8
202
maneuvers that increase the volume of the LV (e.g., sudden squatting, which increases venous return) delay the occurrence of prolapse in sys-tole and cause the click and murmur to occur later (i.e., further from S1). Conversely, if the volume of blood in the LV is decreased (e.g., on sudden standing), prolapse occurs more readily and the click and murmur occur earlier in systole (closer to S1).
Confi rmation of the diagnosis is obtained by echocardiography, which demonstrates posterior displacement of one or both mitral leafl ets into the LA during systole. The electro-cardiogram and chest radiograph are usually normal unless chronic MR has resulted in left atrial and left ventricular enlargement.
The clinical course of MVP is most often benign. Treatment consists of reassurance about the usually good prognosis and moni-toring for the development of progressive MR. Occasionally, rupture of myxomatous chordae in this condition can cause sudden, severe re-gurgitation and pulmonary edema. Other rare complications include infective endocarditis, peripheral emboli owing to microthrombus formation behind the redundant valve tissue, and atrial or ventricular arrhythmias.
AORTIC VALVE DISEASE
Aortic Stenosis
Etiology
Aortic stenosis (AS) is often caused by age-related degenerative calcifi c changes of the valve, formerly termed senile AS. Calcifi c changes that progress to AS may also develop in patients with congenitally deformed aortic valves (about 1% to 2% of the population is born with an abnormal bicuspid aortic valve). Most patients who present with AS after the age of 65 have the age-related form, whereas younger patients usually have calcifi cation of a congenitally bicuspid valve. AS may also result from chronic rheumatic valve disease, although the prevalence of this condition has decreased dramatically in recent decades in the United States. Approximately 95% of patients who are found to have rheumatic AS have coexisting rheumatic involvement of the mitral valve.
Pathology
The pathologic appearance in AS is dependent on its etiology. In age-related degenerative AS, the classic teaching is that the cumulative “wear and tear” of valve motion over many years leads to endothelial and fi brous damage, causing calcifi cation of an otherwise normal trileafl et valve. However, there is also evolv-ing evidence of a common etiology with athero-sclerotic vascular disease. Studies have shown that, as in atherosclerosis, the valve tissue of patients with this form of AS display cellular proliferation, infl ammation, lipid accumulation, and increased margination of macrophages and T lymphocytes.
In the case of a congenitally deformed valve, years of turbulent fl ow across the valve disrupt the endothelium and collagen matrix of the leafl ets, resulting in gradual calcium deposition. In rheumatic AS, endocardial in-fl ammation leads to organization and fi brosis of the valve, and ultimately fusion of the com-missures and the formation of calcifi ed masses within the aortic cusps.
Pathophysiology
In AS, blood fl ow across the aortic valve is impeded during systole (Fig. 8.8). When the valve orifi ce area is reduced by more than 50% of its normal size, signifi cant elevation of left ventricular pressure is necessary to drive blood into the aorta (Fig. 8.9).
LA
Aorta
Pressure
Figure 8.8. Pathophysiology of aortic stenosis (AS). The impediment to left ventricular (LV) outfl ow in AS results in elevated LV pressures and secondary ventricular hypertrophy.
77237_ch08.indd 20277237_ch08.indd 202 8/11/10 8:13:12 AM8/11/10 8:13:12 AM

Valvular Heart Disease
203
of which can be explained on the basis of the underlying pathophysiology. Each manifesta-tion, in order, heralds an increasingly ominous prognosis (Table 8.2).
AS may result in angina because it creates a substantial imbalance between myocardial oxygen supply and demand. Myocardial oxy-gen demand is increased in two ways. First, the muscle mass of the hypertrophied LV is increased, requiring greater-than-normal per-fusion. Second, wall stress is increased because of the elevated systolic ventricular pressure. In addition, AS reduces myocardial oxygen sup-ply because the elevated left ventricular dia-stolic pressure reduces the coronary perfusion pressure gradient between the aorta and the myocardium.
AS may cause syncope during exertion. Although left ventricular hypertrophy allows the chamber to generate a high pressure and maintain a normal cardiac output at rest, the ventricle cannot signifi cantly increase its car-diac output during exercise because of the fi xed stenotic aortic orifi ce. In addition, exer-cise leads to vasodilatation of the peripheral muscle beds. Thus, the combination of peri-pheral vasodilatation and the inability to aug-ment cardiac output contributes to decreased cerebral perfusion pressure and, potentially, loss of consciousness on exertion.
Finally, AS can result in symptoms of heart failure. Early in the course of AS, an abnormally increased left atrial pressure occurs primarily at the end of diastole, when the LA contracts into the thickened noncompliant LV. As a result, the mean left atrial pressure and the pulmonary venous pressure are not greatly affected early in the disease. However, with progression of the
ECG
50
110
130
150
30
10
Figure 8.9. Hemodynamic profi le of aortic stenosis. A systolic pressure gradient (shaded area) is present between the left ventricle (LV) and aorta. The second heart sound (S2) is diminished in intensity, and there is a crescendo–decrescendo systolic murmur that does not extend beyond S2. ECG, electrocardiogram.
Table 8.2. Median Survival Time in Symptomatic Severe Aortic Stenosis
Clinical Symptoms Median Survival
AnginaSyncopeCongestive heart failureAtrial fi brillation
5 years3 years2 years6 months
Derived from Ross J Jr, Braunwald E. Aortic stenosis. Circulation. 1968;38(suppl v):61.
Since AS develops over a chronic course, the LV is able to compensate initially by under-going concentric hypertrophy in response to the high systolic pressure it must generate. Such hypertrophy serves an important role in reducing ventricular wall stress (remember from Chapter 6 that wall stress � (P � r) � 2h, in which h represents wall thickness); how-ever, it also reduces the compliance of the ventricle. The resulting elevation of diastolic LV pressure also causes the LA to hypertrophy in order to fi ll the “stiff” LV. Whereas left atrial contraction contributes only a small portion of the left ventricular stroke volume in normal individuals, it may provide more than 25% of the stroke volume to the stiffened LV in AS p atients. Thus, left atrial hypertrophy is ben-efi cial, and the loss of effective atrial contrac-tion (e.g., development of atrial fi brillation) can cause marked clinical deterioration.
Three major manifestations occur in patients with advanced AS: (1) angina, (2) exertional syncope, and (3) congestive heart failure, all
77237_ch08.indd 20377237_ch08.indd 203 8/11/10 8:13:12 AM8/11/10 8:13:12 AM
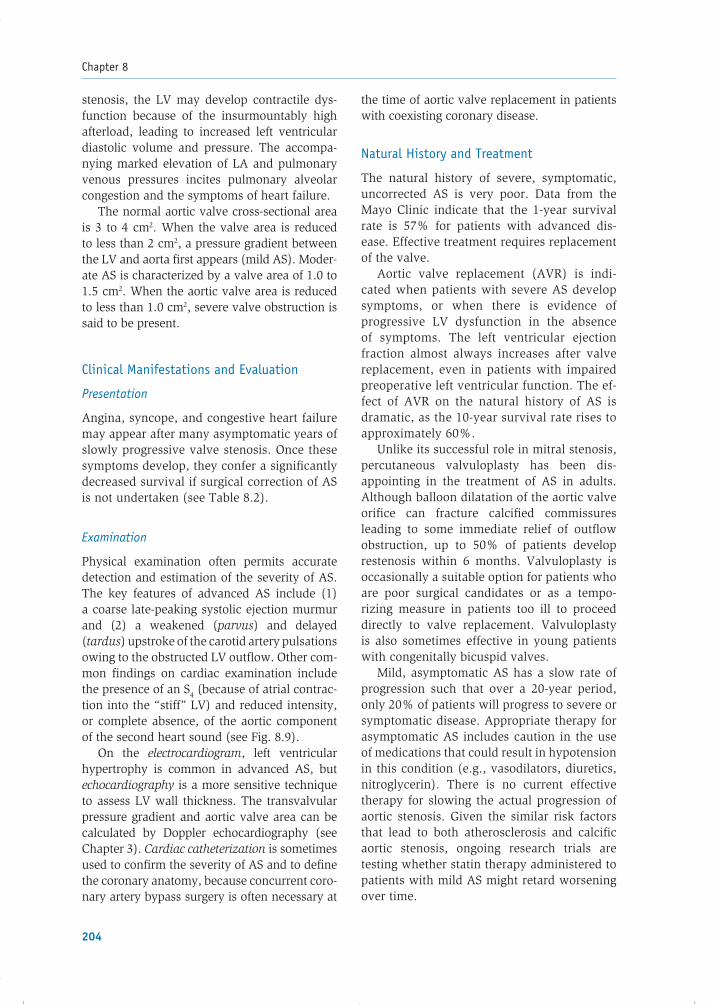
Chapter 8
204
stenosis, the LV may develop contractile dys-function because of the insurmountably high afterload, leading to increased left ventricular diastolic volume and pressure. The accompa-nying marked elevation of LA and pulmonary venous pressures incites pulmonary alveolar congestion and the symptoms of heart failure.
The normal aortic valve cross-sectional area is 3 to 4 cm2. When the valve area is reduced to less than 2 cm2, a pressure gradient between the LV and aorta fi rst appears (mild AS). Moder-ate AS is characterized by a valve area of 1.0 to 1.5 cm2. When the aortic valve area is reduced to less than 1.0 cm2, severe valve obstruction is said to be present.
Clinical Manifestations and Evaluation
Presentation
Angina, syncope, and congestive heart failure may appear after many asymptomatic years of slowly progressive valve stenosis. Once these symptoms develop, they confer a signifi cantly decreased survival if surgical correction of AS is not undertaken (see Table 8.2).
Examination
Physical examination often permits accurate detection and estimation of the severity of AS. The key features of advanced AS include (1) a coarse late-peaking systolic ejection murmur and (2) a weakened (parvus) and delayed (t ardus) upstroke of the carotid artery pulsations owing to the obstructed LV outfl ow. Other com-mon fi ndings on cardiac examination include the presence of an S4 (because of atrial contrac-tion into the “stiff” LV) and reduced intensity, or complete absence, of the aortic component of the second heart sound (see Fig. 8.9).
On the electrocardiogram, left ventricular hypertrophy is common in advanced AS, but echocardiography is a more sensitive technique to assess LV wall thickness. The transvalvular pressure gradient and aortic valve area can be calculated by Doppler echocardiography (see Chapter 3). Cardiac catheterization is sometimes used to confi rm the severity of AS and to defi ne the coronary anatomy, because concurrent coro-nary artery bypass surgery is often necessary at
the time of aortic valve replacement in patients with coexisting coronary disease.
Natural History and Treatment
The natural history of severe, symptomatic, uncorrected AS is very poor. Data from the Mayo Clinic indicate that the 1-year survival rate is 57% for patients with advanced dis-ease. Effective treatment requires replacement of the valve.
Aortic valve replacement (AVR) is indi-cated when patients with severe AS develop symptoms, or when there is evidence of progressive LV dysfunction in the absence of symptoms. The left ventricular ejection fraction almost always increases after valve replacement, even in patients with impaired preoperative left ventricular function. The ef-fect of AVR on the natural history of AS is dramatic, as the 10-year survival rate rises to approximately 60%.
Unlike its successful role in mitral stenosis, percutaneous valvuloplasty has been dis-appointing in the treatment of AS in adults. Although balloon dilatation of the aortic valve orifi ce can fracture calcifi ed commissures leading to some immediate relief of outfl ow obstruction, up to 50% of patients develop restenosis within 6 months. Valvuloplasty is occasionally a suitable option for patients who are poor surgical candidates or as a tempo-rizing measure in patients too ill to proceed directly to valve replacement. Valvuloplasty is also sometimes effective in young patients with congenitally bicuspid valves.
Mild, asymptomatic AS has a slow rate of progression such that over a 20-year period, only 20% of patients will progress to severe or symptomatic disease. Appropriate therapy for asymptomatic AS includes caution in the use of medications that could result in hypotension in this condition (e.g., vasodilators, diuretics, nitroglycerin). There is no current effective therapy for slowing the actual progression of aortic stenosis. Given the similar risk factors that lead to both atherosclerosis and calcifi c aortic stenosis, ongoing research trials are testing whether statin therapy administered to patients with mild AS might retard worsening over time.
77237_ch08.indd 20477237_ch08.indd 204 8/11/10 8:13:12 AM8/11/10 8:13:12 AM

Valvular Heart Disease
205
Aortic Regurgitation
Etiology
Aortic regurgitation (AR), also termed aortic insuffi ciency, may result from (1) diseases of the aortic leafl ets or (2) dilatation of the aortic root. The most common causes of AR are listed in Table 8.3.
Pathophysiology
In AR, abnormal regurgitation of blood from the aorta into the LV occurs during diastole. Therefore, with each contraction, the LV
must pump that regurgitant volume plus the normal amount of blood entering from the LA. Hemodynamic compensation relies on the Frank–Starling mechanism to augment stroke volume. Factors infl uencing the se-verity of AR are analogous to those of MR: (1) the size of the regurgitant aortic orifi ce, (2) the pressure gradient across the aortic valve during diastole, and (3) the duration of diastole.
As in MR, the hemodynamic abnormalities and symptoms differ in acute and chronic AR (Fig. 8.10). In acute AR, the LV is of normal size and relatively noncompliant. Thus, the volume load of regurgitation causes the LV dia-stolic pressure to rise substantially. The sudden high diastolic LV pressure is transmitted to the LA and pulmonary circulation, often produc-ing dyspnea and pulmonary edema. Thus, se-vere acute AR is usually a surgical emergency, requiring immediate valve replacement.
In chronic AR, the LV undergoes compensa-tory adaptation in response to the longstand-ing regurgitation. AR subjects the LV primarily to volume overload but also to an excessive pressure load; therefore, the ventricle com-pensates through chronic dilatation (eccentric
Table 8.3. Causes of Aortic Regurgitation
Abnormalities of valve leafl ets1. Congenital (bicuspid valve)2. Endocarditis3. Rheumatic
Dilatation of aortic root1. Aortic aneurysm (infl ammation; connective
tissue disease, e.g., Marfan syndrome)2. Aortic dissection3. Annuloaortic ectasia4. Syphilis
Aorta
ACUTE AORTICREGURGITATION
CHRONIC AORTICREGURGITATION
Pulmonarycongestion
Pressure
Pressure Pressure N-
Pressure N-
Figure 8.10. Pathophysiology of acute and chronic aortic regurgitation (AR). Abnormal regurgitation of blood from the aorta into the left ventricle (LV) is shown in each schematic drawing (long arrows). In acute AR, the LV is of nor-mal size and relatively low compliance, such that its diastolic pressure rises signifi cantly; this pressure increase is refl ected back to the left atrium (LA) and pulmonary vasculature, resulting in pulmonary congestion or edema. In chronic AR, adaptive LV and LA enlargement have occurred, such that a greater volume of regurgitation can be accommodated with less of an increase in diastolic LV pressure, so that pulmonary congestion is less likely. N, normal.
77237_ch08.indd 20577237_ch08.indd 205 8/11/10 8:13:12 AM8/11/10 8:13:12 AM

Chapter 8
206
hypertrophy, with replication of sarcomeres in series—see Chapter 9) and, to a lesser degree, increased thickness. Over time, the dilatation increases the compliance of the LV and allows it to accommodate a larger regurgitant volume with less of an increase in diastolic pressure, reducing the pressure transmitted into the LA and pulmonary circulation. However, by ac-commodating the large regurgitant volume, the aortic (and therefore systemic arterial) diastolic pressure drops substantially. The combination of a high LV stroke volume (and therefore high systolic arterial pressure) with a reduced aortic diastolic pressure produces a widened pulse pressure (the difference between arterial systolic and diastolic pressures), a hallmark of chronic AR (Fig. 8.11). As a result of the decreased aortic diastolic pressure, the coronary artery perfusion pressure falls, potentially reducing myocardial oxygen supply. This, coupled with the increase in LV size (which causes increased wall stress and myocardial oxygen demand), can produce angina, even in the absence of atherosclerotic coronary disease.
Compensatory left ventricular dilatation and hypertrophy are generally adequate to meet the demands of chronic AR for many years, during which affected patients are asymptomatic. Gradually, however, progres-sive remodeling of the LV occurs, resulting in systolic dysfunction. This causes decreased forward cardiac output as well as an increase in left atrial and pulmonary vascular pressures. At that point, the patient develops symptoms of heart failure.
Clinical Manifestations and Assessment
Presentation
Common symptoms of chronic AR include dyspnea on exertion, fatigue, decreased exer-cise tolerance, and the uncomfortable sensa-tion of a forceful heartbeat associated with the high pulse pressure.
Examination
Physical examination may show bounding pulses and other stigmata of the widened pulse pressure (Table 8.4), in addition to a hyper-dynamic LV impulse and a blowing murmur of
Table 8.4. Physical Findings Associated with Widened Pulse Pressure in Chronic Aortic Regurgitation
Name Description
Bisferiens pulse Double systolic impulse in carotid or brachial artery
Corrigan pulse “Water-hammer” pulses with marked distention and collapse
de Musset sign Head-bobbing with each systole
Duroziez sign To-and-fro murmur heard over femoral artery with light compression
Hill sign Popliteal systolic pressure more than 60 mm Hg greater than brachial systolic pressure
Müller sign Systolic pulsations of the uvula
Quincke sign Capillary pulsations visible at lip or proximal nail beds
Traube sign “Pistol-shot” sound auscul-tated over the femoral artery
ECG
Figure 8.11. Hemodynamic profi le of aortic regurgita-tion. During diastole, the aortic pressure falls rapidly (arrow), and left ventricular (LV) pressure rises as blood regurgitates from the aorta into the LV. A diastolic de-crescendo murmur, beginning at the second heart sound (S2), corresponds with the abnormal regurgitant fl ow. ECG, electrocardiogram.
77237_ch08.indd 20677237_ch08.indd 206 8/11/10 8:13:12 AM8/11/10 8:13:12 AM

Valvular Heart Disease
207
AR in early diastole along the left sternal border (see Fig. 8.11). It is best heard with the patient leaning forward, after exhaling. In addition, a low-frequency mid-diastolic rumbling sound may be auscultated at the cardiac apex in some patients with severe AR. Known as the Austin Flint murmur, it is thought to refl ect turbulence of blood fl ow through the mitral valve during diastole owing to downward displacement of the mitral anterior leafl et by the regurgitant stream of AR. It can be distinguished from the murmur of mitral stenosis by the absence of an OS or presystolic accentuation of the murmur.
In chronic AR, the chest radiograph shows an enlarged left ventricular silhouette. This is usually absent in acute AR, in which pulmo-nary vascular congestion is the more likely fi nding. Doppler echocardiography can identify and quantify the degree of AR and often can identify its cause. Cardiac catheterization with contrast angiography is useful for evaluation of left ventricular function, quantifi cation of the degree of AR, and assessment of coexisting coronary artery disease.
Treatment
Data from natural history studies indicate that clinical progression of patients with asymp-tomatic chronic AR and normal LV contractile function is very slow. Therefore, asymptomatic patients are monitored with periodic exami-nations and assessment of LV function, usu-ally by serial echocardiography. Patients with asymptomatic severe AR and preserved LV function may benefi t from afterload reducing vasodilators (e.g., a calcium channel blocker or an angiotensin-converting enzyme inhibi-tor) when hypertension is present (systolic blood pressure � 140 mm Hg). Such agents do not prolong the compensated stage of chronic AR in the absence of high blood pressure.
Symptomatic patients, or asymptomatic patients with severe AR and impaired LV contractile function (i.e., an ejection fraction �0.50), should be offered surgical correction to prevent progressive deterioration. Studies of patients with AR show that without surgery, death usually occurs within 4 years after the development of angina or 2 years after the onset of heart failure symptoms.
TRICUSPID VALVE DISEASE
Tricuspid Stenosis
Tricuspid stenosis (TS) is rare and is usually a long-term consequence of rheumatic fever. The OS and diastolic murmur of TS are simi-lar to those of MS, but the murmur is heard closer to the sternum and it intensifi es on inspiration because of increased right-heart blood fl ow. In TS, the neck veins are dis-tended and show a large a wave as a result of right atrial contraction against the stenotic tricuspid valve orifi ce. Patients may develop abdominal distention and hepatomegaly owing to passive venous congestion. Surgical therapy is usually required (valvuloplasty or valve replacement).
Tricuspid Regurgitation
Tricuspid regurgitation (TR) is usually func-tional rather than structural; that is, it most commonly results from right ventricular en-largement (e.g., owing to pressure or volume overload) rather than from primary valve dis-ease. Among patients with rheumatic mitral stenosis, 20% also have signifi cant TR (of whom 80% have functional TR because of pulmonary hypertension with right ventri cular enlargement, and 20% have “organic” TR re-sulting from rheumatic involvement of the tricuspid valve). A rare cause of TR is carci-noid syndrome, in which a type of neuro-endocrine tumor (usually in the small bowel or appendix, with metastases to the liver) releases serotonin metabolites into the blood-stream. These metabolites are thought to be responsible for the formation of endocardial plaques in the right side of the heart. Involve-ment of the tricuspid valve immobilizes the leafl ets, often resulting in substantial TR and, less often, TS.
The most common physical signs of TR are prominent v waves in the jugular veins and a pulsatile liver because of regurgitation of right ventricular blood into the systemic veins. The systolic murmur of TR is heard at the lower-left sternal border. It is often soft but becomes louder on inspiration. Doppler echocardiography read-ily detects TR and can quantify it. The treatment
77237_ch08.indd 20777237_ch08.indd 207 8/11/10 8:13:14 AM8/11/10 8:13:14 AM

Chapter 8
208
of functional TR is directed at the conditions re-sponsible for the elevated right ventricular size or pressure, and diuretic therapy; surgical repair of the valve is indicated in severe cases.
PULMONIC VALVE DISEASE
Pulmonic Stenosis
Pulmonic stenosis (PS) is rare, and its cause is almost always congenital deformity of the valve. Carcinoid syndrome, described in the previous section, is another rare etiology, in which encasement and immobilization of the valve leafl ets can occur.
Severe cases of PS are associated with a peak systolic pressure gradient of greater than 80 mm Hg, moderate disease with a gradient of 40 to 80 mm Hg, and mild PS is said to be present when the transvalvular gradient is less than 40 mm Hg. Only patients with moderate to severe gradients are symptomatic. In such cases, transcatheter balloon valvuloplasty is usually effective therapy.
Pulmonic Regurgitation
Pulmonic regurgitation most commonly devel-ops in the setting of severe pulmonary hyper-tension and results from dilatation of the valve ring by the enlarged pulmonary artery. Aus-cultation reveals a high-pitched decrescendo
murmur along the left sternal border that is often indistinguishable from AR (the two con-ditions are easily differentiated by Doppler echocardiography).
PROSTHETIC VALVES
The patient who undergoes valve replace-ment surgery often benefi ts dramatically from hemodynamic and symptomatic improvement but also acquires a new set of potential com-plications related to the valve prosthesis itself. Because all available valve substitutes have certain limitations, valve replacement surgery is not a true “cure.”
The fi rst successful valve replacements took place in the 1960s. Currently available valve substitutes include mechanical and biologic (derived from animal or human tissue) devices (Fig. 8.12). Older mechanical valves included a ball-in-cage design, with a bulky shape that often left a signifi cant valvular gradient and occasionally produced intravascular hemolysis from red blood cell trauma. This valve type, however, had an impressive record of dura-bility, with some models functioning well for more than 30 years. Newer mechanical valves, such as bileafl et prostheses, provide a lower profi le and superior hemodynamics with no apparent sacrifi ce of durability. One example is the St. Jude prosthesis, a hinged bileafl et
Figure 8.12. Examples of prosthetic heart valves. A. St. Jude mechanical bileafl et valve in the open position. (Courtesy of St. Jude Medical, Inc., St. Paul, MN.) B. A bioprosthetic aortic valve with leafl ets in the closed position. (Courtesy of Medtronic, Inc., Minneapolis, MN.)
77237_ch08.indd 20877237_ch08.indd 208 8/11/10 8:13:14 AM8/11/10 8:13:14 AM

Valvular Heart Disease
209
valve consisting of two Pyrolyte carbon discs that open opposite one another (see Fig. 8.12). mechanical valves, while durable, present for-eign thrombogenic surfaces to the circulating blood and require lifelong anticoagulation to prevent thromboembolism.
The most commonly used bioprostheses are made from glutaraldehyde-fi xed porcine valves secured in a support frame. In addition, bovine pericardium and human homograft ( aortic valves harvested and cryopreserved from cadavers) prostheses are used. Bioprosthetic valves have limited durability compared with mechanical valves, and structural failure occurs in up to 50% of valves at 15 years. Failure rates vary greatly depending on the position of the valve. For example, bioprosthetic valves in the mitral position deteriorate more rapidly than those in the aortic position. This is likely be-cause the mitral valve is forced closed during systolic contraction, resulting in greater leafl et stress than that experienced by aortic pros-theses that close during diastolic relaxation.
The principal causes of bioprosthetic valve failure over time are leafl et tears and calcifi -cation. Conversely, the main advantage of bioprostheses is that they display a very low rate of thromboembolism and do not require long-term anticoagulation therapy. For pa-tients with aortic valve endocarditis, aortic homograft replacements are especially use-ful because they have very low rates of sub-sequent infection.
Common to all types of valve replacement is the risk of infective endocarditis (discussed in the next section), which occurs at an in-cidence of 1% to 2% per patient per year. If endocarditis occurs in the fi rst 60 days after valve surgery, the mortality rate is exceedingly high (50% to 80%). If endocarditis occurs later, mortality rates range from 20% to 50%. Reoperation is usually required if endocarditis involves a mechanical prosthesis, because an adjacent abscess is almost always present (the organism cannot infect the prosthetic material itself). Some cases of bioprosthetic valve endo-carditis respond to antibiotic therapy alone.
Given their respective advantages and dis-advantages, the mortality and complication rates of mechanical and bioprosthetic valves are similar for the fi rst 10 years after replace-
ment. In 20-year follow-up of long-term, ran-domized, controlled trials, mechanical valves have been shown to be superior to biopros-thetic valves in event-free survival, except for bleeding complications related to the required anticoagulation therapy. Therefore, the deci-sion about which type of prosthesis to use in a patient often centers on (1) the patient’s ex-pected lifespan in comparison to the functional longevity of the valve, (2) risk-versus-benefi t considerations of chronic anticoagulation ther-apy, and (3) patient and surgeon preferences. Mechanical valves are often recommended for younger patients and for those who will be tolerant of, and compliant with, anticoa gulant therapy. Bioprosthetic valves are suitable choices for patients of 65 years or older and for patients with contraindications to chronic anticoagulation.
INFECTIVE ENDOCARDITIS
Infection of the endocardial surface of the heart, including the cardiac valves, can lead to exten-sive tissue damage and is often fatal. Infective endocarditis (IE) carries an overall 6-month mortality rate of 20% to 25%, even with ap-propriate therapy, and a 100% mortality rate if it is not recognized and treated correctly.
There are three clinically useful ways to classify IE: (1) by clinical course, (2) by host substrate, or (3) by the specifi c infecting micro-organism. In the fi rst classifi cation scheme, IE is termed acute bacterial endocarditis (ABE) when the syndrome presents as an acute, ful-minant infection, and a highly virulent and in-vasive organism such as Staphylococcus aureus is causal. Because of the aggressiveness of the responsible microorganism, ABE may occur on previously healthy heart valves. When IE presents with a more insidious clinical course, it is termed subacute bacterial endocarditis (SBE), and less virulent organisms such as streptococci viridans are involved. SBE most frequently occurs in individuals with prior un-derlying valvular damage.
The second means of classifi cation of IE is according to the host substrate: (1) native valve endocarditis, (2) prosthetic valve endocarditis, or (3) endocarditis in the setting of intravenous drug abuse. Of these, native valve endocarditis
77237_ch08.indd 20977237_ch08.indd 209 8/11/10 8:13:14 AM8/11/10 8:13:14 AM

Chapter 8
210
accounts for 60% to 80% of patients. Differ-ent microorganisms and clinical courses are associated with each of these categories. For example, the skin contaminant Staphylococcus epi dermidis is a common cause of prosthetic valve endocarditis, but that is rarely the case when endocarditis occurs on a native heart valve. Intravenous drug users have a propensity for endocarditis of the right-sided heart valves.
The third classifi cation of IE is according to the specifi c infecting microorganism (e.g., S. aureus endocarditis). Although the remain-der of this discussion focuses on the endo-carditis syndromes based on clinical course, it is important to recognize that all three classifi -cations of IE are used.
Pathogenesis
The pathogenesis of endocarditis requires sev-eral conditions: (1) endocardial surface injury, (2) thrombus formation at the site of injury, (3) bacterial entry into the circulation, and (4) bacterial adherence to the injured endocardial surface. The fi rst two conditions provide an en-vironment favorable to infection, whereas the latter two permit implantation of the organism on the endocardial surface. The most common cause of endothelial injury is turbulent blood fl ow resulting from pre-existing valvular dis-ease; approximately 75% of patients with endo-carditis have evidence of underlying structural or hemodynamic abnormalities (Table 8.5). E ndothelial injury may also be incited by foreign material within the circulation, such as indwell-ing venous catheters or prosthetic heart valves.
Once an endocardial surface is injured, platelets adhere to the exposed subendo-cardial connective tissue and initiate the formation of a sterile thrombus (termed a veg-etation) through fi brin deposition. This pro-cess is referred to as nonbacterial thrombotic endocarditis (NBTE). NBTE makes the endo-cardium more hospitable to microbes in two ways. First, the fi brin-platelet deposits provide a surface for adherence by bacteria. Second, the fi brin covers adherent organisms and pro-tects them from host defenses by inhibiting chemotaxis and migration of phagocytes.
When NBTE is present, the delivery of micro-organisms in the bloodstream to the injured
Table 8.5. Cardiac Lesions That Predispose to Endocarditis
Rheumatic valvular diseaseOther acquired valvular lesions Calcifi c aortic stenosis Aortic regurgitation Mitral regurgitation Mitral valve prolapse (if murmur auscultated or
detected by Doppler)
Hypertrophic obstructive cardiomyopathyCongenital heart disease Ventricular septal defect Patent ductus arteriosus Tetralogy of Fallot Aortic coarctation Bicuspid aortic valve Pulmonic stenosis
Surgically implanted intravascular hardware Prosthetic heart valves Pulmonary-systemic vascular shunts Ventriculoatrial shunts for hydrocephalus
surface can lead to IE. Three factors determine the ability of an organism to induce IE: (1) ac-cess to the bloodstream, (2) survival of the or-ganism in the circulation, and (3) adherence of the bacteria to the endocardium. Bacteria can be introduced into the bloodstream whenever a mucosal or skin surface harboring an organism is traumatized, such as from the mouth during dental procedures or from the skin during illicit intravenous drug use. However, while transient bacteremia is a relatively common event, only microorganisms suited for survival in the circu-lation and able to adhere to the platelet–fi brin mesh overlying the endocardial defect will cause IE. For example, gram-positive organisms account for approximately 90% of cases of endocarditis, largely because of their resistance to destruction in the circulation by comple-ment and their particular tendency to adhere to endothelial and platelet surface proteins. The ability of certain streptococcal species to produce dextran, a bacterial cell wall compo-nent that adheres to thrombus, correlates with their inciting endocarditis. Table 8.6 lists the infectious agents reported to be the most com-mon causes of endocarditis in modern tertiary centers; staphylococci and streptococci are the
77237_ch08.indd 21077237_ch08.indd 210 8/11/10 8:13:14 AM8/11/10 8:13:14 AM

Valvular Heart Disease
211
most frequent. It is important to recognize that in more rural communities with a low preva-lence of intravenous drug abuse, the percentage of viridans streptococcal infections tends to be greater than that of S. aureus.
Once organisms adhere to the injured sur-face, they may be protected from phagocytic activity by the overlying fi brin. The organisms are then free to multiply, which enlarges the in-fected vegetation. The latter provides a source for continuous bacteremia and can lead to sev-eral complications, including (1) mechanical cardiac injury, (2) thrombotic or septic emboli, and (3) immune injury mediated by antigen–antibody deposition. For example, local exten-sion of the infection within the heart can result in progressive valvular damage, abscess for-mation, or erosion into the cardiac conduction system. Portions of a vegetation may embolize systemically, often to the central nervous sys-tem, kidneys, or spleen, and incite infection or infarction of the target organs. Each of these is a potentially fatal complication. Addition-ally, immune complex deposition can result in glomerulonephritis, arthritis, or vasculitis.
The epidemiology of IE has evolved in re-cent decades, as bacteria resistant to antibiotics have become ubiquitous in the hospital setting and have spread into the community. Antibiotic resistant strains such as methicillin-resistant S. aureus and vancomycin-resistant enterococci
have become more common and are associated with increased mortality rates from IE.
Clinical Manifestations
A patient with acute IE is likely to report an ex-plosive and rapidly progressive illness with high fever and shaking chills. In contrast, subacute IE presents less dramatically with low-grade fever often accompanied by nonspecifi c con-stitutional symptoms such as fatigue, anorexia, weakness, myalgia, and night sweats. These symptoms are not specifi c for IE and could eas-ily be mistaken for infl uenza or an upper re-spiratory tract infection. Thus, the diagnosis of subacute IE requires a high index of suspicion. A history of a valvular lesion or other condition known to predispose to endocarditis is helpful. A thorough history should also inquire about intravenous drug use, recent dental procedures, or other potential sources of bacteremia.
Cardiac examination may reveal a murmur representing the underlying valvular pathol-ogy that predisposed the patient to IE, or a new murmur of valvular insuffi ciency owing to IE-induced damage. The development of right-sided valvular lesions (e.g., tricuspid regurgitation), although rare in normal hosts, is particularly common in endocarditis associated with intravenous drug abuse. Serial examina-tion in ABE may be especially useful because changes in a particular murmur (i.e., worsen-ing regurgitation) over time may correspond with rapidly progressive valvular damage. Dur-ing the course of endocarditis, severe valvular damage may result in signs of heart failure.
Other physical fi ndings that may appear in IE are those associated with septic embolism or immune complex deposition. Central ner-vous system emboli are seen in up to 40% of patients, often resulting in new neurologic fi ndings on physical examination. Injury to the kidneys, of embolic or immunologic origin, may manifest as fl ank pain, hematuria, or renal failure. Lung infarction (septic pulmonary em-bolism) or infection (pneumonia) is particu-larly common in endocarditis that involves the right-sided valves.
Embolic infarction and seeding of the vasa vasorum of arteries can cause localized aneu-rysm formation (termed a mycotic aneurysm)
Table 8.6. Microbiology of Infective Endocarditis in Tertiary Centers
Organism Incidence (%)
Staphylococci S. aureus Coagulase-negative
31.610.5
Streptococci Viridans Enterococci S. bovis Other streptococci
18.010.66.55.1
Other organisms (e.g., gram-negative bacteria, fungi)
8.7
Culture negative or polymicrobial ~9.4
Derived from Fowler VG Jr, Miro JM, Hoen B, et al. Staphylococcus aureus endocarditis: a consequence of medical progress. JAMA. 2005;293:3012–3021.
77237_ch08.indd 21177237_ch08.indd 211 8/11/10 8:13:14 AM8/11/10 8:13:14 AM

Chapter 8
212
that weakens the vessel wall and may rupture. Mycotic aneurysms may be found in the aorta, viscera, or peripheral organs, and are particu-larly dangerous in cerebral vessels, because rupture there can result in fatal intracranial hemorrhage.
Skin fi ndings resulting from septic em-bolism or immune complex vasculitis are often collectively referred to as peripheral stigmata of endocarditis. For example, petechiae may appear as tiny, circular, red-brown discolor-ations on mucosal surfaces or skin. Splinter hemorrhages, the result of subungual micro-emboli, are small, longitudinal hemorrhages found beneath nails. Other peripheral stig-mata of IE, which are now rarely encountered, include painless, fl at, irregular discolorations found on the palms and soles called Janeway lesions; tender, pea-sized, erythematous nod-ules found primarily in the pulp space of the fi ngers and toes termed Osler nodes; and
emboli to the retina that produce Roth spots, microinfarctions that appear as white dots surrounded by hemorrhage.
The systemic infl ammatory response pro-duced by the infection is responsible for fever and splenomegaly as well as for a number of laboratory fi ndings, including an elevated white blood cell count with a leftward shift (increase in proportion of neutrophils and immature granulocytes), an elevated erythro-cyte sedimentation rate or C-reactive protein level, and in approximately 50% of cases, an elevated serum rheumatoid factor.
The electrocardiogram may help identify ex-tension of the infection into the cardiac con-duction system, manifest by various degrees of heart block or new arrhythmias. Echocardio-graphy is used to visualize vegetations, valvular dysfunction, and associated abscess forma-tion. Echocardiographic assessment can con-sist of transthoracic echocardiography (TTE)
Table 8.7. Modifi ed Duke Criteria for Diagnosis of Infective Endocarditis (IE)a
Major Criteria Minor Criteria
I. Positive blood culture, defi ned as either A or B A. Typical microorganism for IE from two
separate blood cultures 1. Streptococci viridans, S. bovis, HACEK
group; or 2. Staphylococcus aureus or enterococci, in
the absence of a primary focus B. Microorganisms consistent with IE from
persistently positive blood cultures 1. Blood cultures drawn �12 hours apart, or 2. All of three, or most of four separate
cultures drawn at least 1 hour apart 3. Single positive blood culture for Coxiella
burnetii or antiphase I IgG antibody titer �1:800
Predisposing cardiac condition or intravenous drug useFever (�38.0C)Vascular phenomena (septic arterial or pulmonary emboli, mycotic aneurysm, intracranial hemor-
rhage, conjunctival hemorrhage, Janeway lesions)Immunologic phenomena (glomerulonephritis, Osler nodes, Roth spots, rheumatoid factor)Positive blood cultures not meeting major criteria or serologic evidence of infection with organism
consistent with IE
II. Evidence of endocardial involvement, defi ned as A or B
A. Echocardiogram positive for endocarditis: 1. Oscillating intracardiac mass, or 2. Myocardial abscess, or 3. New partial detachment of prosthetic
valve B. New valvular regurgitation
aClinical diagnosis of defi nitive endocarditis requires two major criteria, one major plus three minor criteria, or fi ve minor criteria.
HACEK, Haemophilus spp., Actinobacillus actinomycetemcomitans, Cardiobacterium hominis, Eikenella spp. and Kingella kingae.
Derived from Li JS, Sexton DJ, Mick N, et al. Proposed modifi cations to the Duke criteria for the diagnosis of infective endocarditis. Clin Infect Dis. 2000;30:633–638.
77237_ch08.indd 21277237_ch08.indd 212 8/11/10 8:13:14 AM8/11/10 8:13:14 AM

Valvular Heart Disease
213
or transesophageal echocardiography (TEE), as described in Chapter 3. TTE is useful in de-tecting large vegetations and has the advan-tage of being noninvasive and easy to obtain. However, while the specifi city of TTE for veg-etations is high, the sensitivity for fi nding veg-etations is less than 60%. TEE, on the other hand, is much more sensitive (�90%) for the detection of small vegetations and can be par-ticularly useful for the evaluation of infection involving prosthetic valves.
Central to the diagnosis and appropriate treatment of endocarditis is the identifi cation of the responsible microorganism by blood cul-ture. Once positive culture results are obtained, treatment can be tailored to the causative or-ganism according to its antibiotic sensitivities. A specifi c etiologic agent will be identifi ed approximately 95% of the time. However, blood cultures may fail to grow the respon-sible organism if antibiotics have already been administered or if the organism has unusual growth requirements.
Even after a careful history, examination, and evaluation of laboratory data, the diagno-sis of IE can be elusive. Therefore, attempts have been made to standardize the diagnosis, resulting in the now widely used Duke crite-ria (Table 8.7). By this standard, the diagnosis of endocarditis rests on the presence of either two major criteria, one major and three minor criteria, or fi ve minor criteria.
Treatment of endocarditis entails 4 to 6 weeks of high-dose intravenous antibiotic therapy. Although empiric broad-spectrum antibiotics may be used initially (after blood cultures are obtained) in patients who are severely ill or hemodynamically unstable, specifi c, directed therapy is preferable once the causative microorganism has been identi-fi ed. Surgical intervention, usually with valve replacement, is indicated for patients with persistent bacteremia despite appropriate anti-biotic therapy, for those with severe valvular dysfunction leading to heart failure, and for in-dividuals who develop myocardial abscesses or experience recurrent thromboembolic events.
An additional essential concept is prevention of endocarditis by administering antibiotics to certain susceptible individuals before in-vasive procedures that are likely to result in
bacteremia. Recently, the American Heart As-sociation issued major changes in the recom-mendations for such prevention. According to the newest guidelines, antibiotic prophylaxis is indicated only for individuals with cardiac conditions that place them at the highest risk for developing an adverse outcome from IE (Table 8.8). Furthermore, the types of proce-dures requiring prophylactic treatment have been updated and simplifi ed (Table 8.9).
Table 8.8. Cardiac Conditions for Which Antibiotic Prophylaxis is Reasonablea
1. Presence of a prosthetic heart valve, or prior valve repair with prosthetic material
2. Prior history of endocarditis3. Certain congenital heart diseases (CHD) • Unrepaired cyanotic CHD (described in
Chapter 16) • Completely repaired congenital heart defects
with prosthetic material, during the fi rst 6 months after the procedure (i.e., prior to protective endothelialization)
• Repaired CHD with residual defects adjacent to the site of prosthetic material (which inhibits endothelialization)
4. Cardiac transplant recipients who develop cardiac valve abnormalities
aThe conditions on this list have the highest risk of adverse out-comes from endocarditis. Note that antimicrobial prophylaxis is no longer recommended for patients with bicuspid aortic valve, acquired aortic or mitral valve disease, or hypertrophic cardio-myopathy.Derived from Wilson W, et al. Prevention of infective endocardi-tis: guidelines from the American Heart Association: a guideline from the American Heart Association Rheumatic Cardiovascular Disease in the Young, and the Council on Clinical Cardiology, Council on Cardiovascular Surgery and Anesthesia, and the Qual-ity of Care and Outcomes Research Interdisciplinary Working Group. Circulation. 2007;116:1736–1754.
Table 8.9. Procedures That Warrant Endocarditis Prophylaxis for Patients in Table 8.8
1. Dental procedures that involve manipulation of gingival tissue, periapical region of teeth, or perforation of the oral mucosa
2. Upper respiratory tract procedures, only if involves incision or biopsy of mucosa (e.g., tonsillectomy, bronchoscopy with biopsy)
3. Genitourinary or gastrointestinal procedures, only if infections of those systems are present
4. Procedures on infected skin, skin structures, or musculoskeletal tissue
77237_ch08.indd 21377237_ch08.indd 213 8/11/10 8:13:15 AM8/11/10 8:13:15 AM

214
Tabl
e 8.
10.
Sum
mar
y of
Maj
or V
alvu
lar
Cond
itio
ns
Valv
e Le
sion
Caus
esSy
mpt
oms
Phys
ical
Fin
ding
sM
urm
ur D
iagr
am
Mit
ral s
teno
sis
(MS)
Se
quel
ae o
f rh
eum
atic
fev
er
Sym
ptom
s of
left
-sid
ed
(and
late
r ri
ght-
side
d)
hear
t fa
ilure
a
• Lo
ud S
1 (i
n ea
rly M
S)•
Open
ing
snap
• Di
asto
lic r
umbl
e (l
oude
st
in le
ft la
tera
l dec
ubit
us
posi
tion
)S
2O
SS
1S
1
Mit
ral
regu
rgit
atio
n (M
R)
Acut
e:•
Endo
card
itis
• Ru
ptur
ed c
hord
ae•
Papi
llary
mus
cle
dysf
unct
ion
Chro
nic:
• Rh
eum
atic
• M
itra
l pro
laps
e•
Calc
ifi ed
ann
ulus
• LV
dila
tati
on
Acut
e:•
Pulm
onar
y ed
ema
Chro
nic:
• Sy
mpt
oms
of le
ft-s
ided
he
art
failu
rea a
nd lo
w
card
iac
outp
ut (
e.g.
, fa
tigu
e)
• H
olos
ysto
lic m
urm
ur a
t ap
ex
(may
be
decr
esce
ndo
in a
cute
M
R)•
Mur
mur
acc
entu
ated
by
clen
chin
g th
e fi s
ts
S2
S1
Aort
ic s
teno
sis
(AS)
• De
gene
rati
ve c
alci
fi c•
Cong
enit
al•
Rheu
mat
ic
• Ch
est
pain
• Sy
ncop
e•
Dysp
nea
on e
xert
ion
• Ca
roti
ds: de
laye
d up
stro
ke
and
decr
ease
d vo
lum
e•
Palp
atio
n: s
upra
ster
nal t
hrill
• Au
scul
tati
on:
So
ft A
2
Syst
olic
eje
ctio
n-ty
pe
mur
mur
(lo
udes
t at
upp
er-
righ
t st
erna
l bor
der)
S2
S1
Aort
ic
regu
rgit
atio
n (A
R)
• Co
ngen
ital
(e
.g.,
bic
uspi
d va
lve)
• En
doca
rdit
is•
Rheu
mat
ic•
Aort
ic r
oot
dila
tati
on
• Dy
spne
a on
exe
rtio
n•
Ches
t pa
in (
som
etim
es)
• W
ide
puls
e pr
essu
re•
Boun
ding
pul
ses
• Ea
rly d
iast
olic
dec
resc
endo
m
urm
ur (
hear
d be
st a
t en
d ex
pira
tion
, w
ith
pati
ent
lean
ing
forw
ard)
S2
S1
a Sym
ptom
s of
left
-sid
ed h
eart
fai
lure
incl
ude
exer
tion
al d
yspn
ea, or
thop
nea,
par
oxys
mal
noc
turn
al d
yspn
ea; sy
mpt
oms
of r
ight
-sid
ed h
eart
fai
lure
incl
ude
peri
pher
al e
dem
a, a
bdom
inal
blo
atin
g, a
nd r
ight
upp
er
quad
rant
ten
dern
ess
(hep
atic
enl
arge
men
t).
A 2, a
orti
c co
mpo
nent
of
seco
nd h
eart
sou
nd;
LV,
left
ven
tric
ular
; S 1,
fi rs
t he
art
soun
d; S
2, s
econ
d he
art
soun
d.
77237_ch08.indd 21477237_ch08.indd 214 8/11/10 8:13:15 AM8/11/10 8:13:15 AM
Valvular Heart Disease
215
SUMMARY
Valvular heart disease can be a signifi cant source of disability and mortality. From simple bedside observations to complex hemo dynamic measurements, much has been learned about the pathophysiology of these conditions. A summary of the important fi ndings associ-ated with major valve lesions is presented in Table 8.10.
Acknowledgments
Contributors to the previous editions of this chapter were Mia M. Edwards, MD; Edward Chan, MD; Elia Duh, MD; Stephen K. Frankel, MD; Brian Stidham, MD; Patrick Yachimski, MD; John A. Bittl, MD; and Leonard S. Lilly, MD.
Additional Reading
Bonow RO, Carabello BA, Chatterjee K, et al. 2008 Focused update incorporated into the ACC/AHA 2006 guidelines for the management of pa-tients with valvular heart disease: a report of the American College of Cardiology/American Heart Association Task Force on Practice Guidelines. Circulation. 2008;118:e523–e661.
Cawley PJ, Maki JH, Otto CM. Cardiovascular mag-netic resonance imaging for valvular heart dis-ease. Circulation. 2009;119:468–478.
Gerber MA, Baltimore RS, Eaton CB, et al. Pre-vention of rheumatic fever and diagnosis and treatment of acute streptococcal pharyngitis. Circulation. 2009;119:1541–1551.
Habib G, Hoen B, Tomos P, et al. Guidelines on the prevention, diagnosis, and treatment of infective endocarditis (new version 2009); The Task Force on the Prevention, Diagnosis, and Treatment of Infective Endocarditis of the European Society of Cardiology. Eur HeartJ. 2009;30:2369–2413.
Murdoch DR, Corey GR, Hoen B, et al. Clinical presentation, etiology, and outcome of infective endocarditis in the 21st century. Arch Intern Med. 2009;169:463–473.
Nishimura RA, Carabello BA, Faxon DP, et al. ACC/AHA 2008 guideline update on valvular heart dis-ease: focused update on infective endocarditis: a report of the American College of Cardiology/American Heart Association Task Force on Practice Guidelines: endorsed by the Society of Cardio-vascular Anesthesiologists, Society for Cardio-vascular Angiography and Interventions, and Society of Thoracic Surgeons. Circulation. 2008;118:887–896.
O’Gara P, Braunwald E. Valvular heart disease. In: Fauci AS, Braunwald E, Kasper DL, et al. Har-rison’s Principles of Internal Medicine. 17th ed. New York: McGraw-Hill; 2008:1465–1480.
Stassano P, Di Tommaso L, Monaco M, et al. Aor-tic valve replacement: a prospective randomized evaluation of mechanical versus biological valves in patients 55 to 70 years. J Am Coll Cardiol. 2009;54:1862–1868.
Stout KK, Verrier ED. Acute valvular regurgitation. Circulation. 2009;119:3232–3241.
Verma S, Mesana TG. Mitral-valve repair for mitral-valve prolapse. N England J Med. 2009;361:2261–2269.
Weisse AB. The surgical treatment of mitral stenosis: the fi rst heart operation. Am J Cardiol. 2009; 103:143–147.
Wilson W, Taubert KA, Gewitz M, et al. Prevention of infective endocarditis: guidelines from the American Heart Association: a guideline from the American Heart Association Rheumatic Fever, Endocarditis, and Kawasaki Disease Committee, Council on Cardiovascular Disease in the Young, and the Council on Clinical Cardiology, Council on Cardiovascular Surgery and Anesthesia, and the Quality of Care and Outcomes Research Interdisciplinary Working Group. Circulation. 2007;116:1736–1754.
77237_ch08.indd 21577237_ch08.indd 215 8/11/10 8:13:15 AM8/11/10 8:13:15 AM

216
C H A P T E R
9
severe hemorrhage) or increased metabolic demands (e.g., hyperthyroidism), in this chapter, only cardiac causes of heart failure are considered.
Heart failure may be the fi nal and most severe manifestation of nearly every form of cardiac disease, including coronary athero-sclerosis, myocardial infarction, valvular dis-eases, hypertension, congenital heart disease, and the cardiomyopathies. More than 500,000 new cases are diagnosed each year in the United States, where the current prevalence
PHYSIOLOGYDeterminants of Contractile Function
in the Intact HeartPressure–Volume Loops
PATHOPHYSIOLOGYHeart Failure with Reduced EFHeart Failure with Preserved EFRight-Sided Heart Failure
COMPENSATORY MECHANISMSFrank–Starling MechanismNeurohormonal AlterationsVentricular Hypertrophy and Remodeling
MYOCYTE LOSS AND CELLULAR DYSFUNCTIONPRECIPITATING FACTORSCLINICAL MANIFESTATIONSSymptomsPhysical SignsDiagnostic Studies
PROGNOSISTREATMENT OF HEART FAILURE WITH REDUCED EJECTION FRACTIONDiureticsVasodilatorsInotropic Drugs�-BlockersAldosterone Antagonist TherapyAdditional Therapies
TREATMENT OF HEART FAILURE WITH PRESERVED EJECTION FRACTIONACUTE HEART FAILUREAcute Pulmonary Edema
The heart normally accepts blood at low fi lling pressures during diastole and
then propels it forward at higher pressures in systole. Heart failure is present when the heart is unable to pump blood forward at a suffi cient rate to meet the metabolicdemands of the body (forward failure), or is able to do so only if the cardiac fi lling pres-sures are abnormally high (backward fail-ure), or both. Although conditions outside the heart may cause this defi nition to be met through inadequate tissue perfusion (e.g.,
Heart FailureNeal Anjan ChatterjeeMichael A. Fifer
77237_ch09.indd 21677237_ch09.indd 216 8/11/10 8:13:42 AM8/11/10 8:13:42 AM

Heart Failure
217
is approximately 5 million. The number of patients with heart failure is increasing, not only because the population is aging, but also because of interventions that prolong survival after damaging cardiac insults such as myo-cardial infarction. As a result, heart failure now accounts for more than 12 million medi-cal offi ce visits annually and is the most com-mon diagnosis of hospitalized patients aged 65 and older.
Heart failure most commonly results from conditions of impaired left ventricular func-tion. Thus, this chapter begins by reviewing the physiology of normal myocardial contrac-tion and relaxation.
PHYSIOLOGY
Experimental studies of isolated cardiac muscle segments have revealed several im-portant principles that can be applied to the intact heart. As a muscle segment is stretched apart, the relation between its length and the tension it passively develops is curvi-linear, reflecting its intrinsic elastic proper-ties (Fig. 9.1A, lower curve). If the muscle is first passively stretched and then stimulated to contract while its ends are held at fixed positions (termed an isometric contraction), the total tension (the sum of active plus passive tension) generated by the fibers is proportional to the length of the muscle at the time of stimulation (see Fig. 9.1A, upper curve). That is, stretching the muscle be-fore stimulation optimizes the overlap and interaction of myosin and actin filaments, increasing the number of cross bridges and the force of contraction. Stretching cardiac muscle fibers also increases the sensitivity of the myofilaments to calcium, which fur-ther augments force development.
This relationship between the initial fi ber length and force development is of great impor-tance in the intact heart: within a physiologic range, the larger the ventricular volume dur-ing diastole, the more the fi bers are stretched before stimulation and the greater the force of the next contraction. This is the basis of the Frank–Starling relationship, the observation that ventricular output increases in relation
to the preload (the stretch on the myocardial fi bers before contraction).
A second observation from isolated muscle experiments arises when the fi bers are not tethered at a fi xed length but are allowed to shorten during stimulation against a fi xed load (termed the afterload). In this situation (termed an isotonic contraction), the fi nal length of the muscle at the end of contrac-tion is determined by the magnitude of the load but is independent of the length of the muscle before stimulation (see Fig. 9.1B). That is, (1) the tension generated by the fi ber is equal to the fi xed load; (2) the greater the load opposing contraction, the less the muscle fi ber can shorten; (3) if the fi ber is stretched to a longer length before stimulation but the afterload is kept constant, the muscle will shorten a greater distance to attain the same fi nal length at the end of contraction; and (4) the maximum tension that can be produced during isotonic contraction (i.e., using a load suffi ciently great such that the muscle is just unable to shorten) is the same as the force produced by an isometric contraction at that initial fi ber length.
This concept of afterload is also relevant to the intact heart: the pressure generated by the ventricle, and the size of the chamber at the end of each contraction depend on the load against which the ventricle contracts, but are independent of the stretch on the myocardial fi bers before contraction.
A third key experimental observation re-lates to myocardial contractility, which ac-counts for changes in the force of contraction independent of the initial fi ber length and afterload. Contractility refl ects chemical and hormonal infl uences on cardiac contraction, such as exposure to catecholamines. When contractility is enhanced pharmacologically (e.g., by a norepinephrine infusion), the rela-tion between initial fi ber length and force devel-oped during contraction is shifted upward (see Fig. 9.1C) such that a greater total tension de-velops with isometric contraction at any given preload. Similarly, when contractility is aug-mented and the cardiac muscle is allowed to shorten against a fi xed afterload, the fi ber con-tracts to a greater extent and achieves a shorter
77237_ch09.indd 21777237_ch09.indd 217 8/11/10 8:13:43 AM8/11/10 8:13:43 AM

Chapter 9
218
b
d
ac
e
ca
f
g e
b
a
Figure 9.1. Physiology of normal cardiac muscle segments. A. Passive (lower curve) and total (upper curve) length–tension relations for isolated cat papillary muscle. Lines ab and cd represent the force de-veloped during isometric contractions. Initial passive muscle length c is longer (i.e., has been stretched more) than length a and therefore has a greater passive tension. When the muscle segments are stimu-lated to contract, the muscle with the longer initial length generates greater total tension (point d vs. point b). B. If the muscle fi ber preparation is allowed to shorten against a fi xed load, the length at the end of the contraction is dependent on the load but not the initial fi ber length; stimulation at point a or c results in the same fi nal fi ber length (e). Thus, the muscle that starts at length c shortens a greater distance (�Lc) than the muscle at length a (�La). C. The uppermost curve is the length–tension relation in the presence of the positive inotropic agent norepinephrine. For any given initial length, an isometric contraction in the presence of norepinephrine generates greater force (point f ) than one in the absence of norepinephrine (point b). When contracting against a fi xed load, the presence of norepi-nephrine causes greater muscle fi ber shortening and a smaller fi nal muscle length (point g) compared with contraction in the absence of the inotropic agent (point e). (Adapted from Downing SE, Sonnenblick EH. Cardiac muscle mechanics and ventricular performance: force and time parameters. Am J Physiol. 1964;207:705–715.)
77237_ch09.indd 21877237_ch09.indd 218 8/11/10 8:13:43 AM8/11/10 8:13:43 AM

Heart Failure
219
fi nal fi ber length compared with the baseline state. At the molecular level, enhanced contrac-tility is likely related to an increased cycling rate of actin–myosin cross-bridge formation.
Determinants of Contractile Functionin the Intact Heart
In a healthy person, cardiac output is matched to the body’s total metabolic need. Cardiac output (CO) is equal to the product of stroke volume (SV, the volume of blood ejected with each contraction) and the heart rate (HR):
CO � SV � HR
The three major determinants of stroke vol-ume are preload, afterload, and myocardial contractility, as shown in Figure 9.2.
Preload
The concept of preload (Table 9.1) in the intact heart was described by physiologists Frank and Starling a century ago. In experimental preparations, they showed that within physi-ologic limits, the more a normal ventricle is
distended (i.e., fi lled with blood) during di-astole, the greater the volume that is ejected during the next systolic contraction. This rela-tionship is illustrated graphically by the Frank–Starling curve, also known as the v entricular function curve (Fig. 9.3). The graph relates a measurement of cardiac performance (such as cardiac output or stroke volume) on the vertical axis as a function of preload on the horizontal axis. As described earlier, the
Figure 9.2. Key mediators of cardiac output. Determinants of the stroke volume include contractility, preload, and afterload. Cardiac output � Heart rate � Stroke volume.
Contractility Preload Afterload
Heartrate
Strokevolume
CARDIAC
OUTPUT
+ –+
++
Table 9.1. Terms Related to Cardiac Performance
Term Defi nition
Preload The ventricular wall tension at the end of diastole. In clinical terms, it is the stretch on the ventricular fi bers just before contraction, often approximated by the end-diastolic volume or end-diastolic pressure.
Afterload The ventricular wall tension during contraction; the resistance that must be overcome for the ventricle to eject its content. Often approximated by the systolic ventricular (or arterial) pressure.
Contractility (inotropic state) Property of heart muscle that accounts for changes in the strength of con-traction, independent of the preload and afterload. Refl ects chemical or hormonal infl uences (e.g., catecholamines) on the force of contraction.
Stroke volume (SV) Volume of blood ejected from the ventricle during systole. SV � End-diastolic volume � End-systolic volume.
Ejection fraction (EF) The fraction of end-diastolic volume ejected from the ventricle during each systolic contraction (normal range � 55% to 75%).EF � Stroke volume � End-diastolic volume.
Cardiac output (CO) Volume of blood ejected from the ventricle per minute. CO � SV � Heart rate.
Compliance Intrinsic property of a chamber that describes its pressure–volume rela-tionship during fi lling. Refl ects the ease or diffi culty with which the cham-ber can be fi lled. Strict defi nition: Compliance � � Volume � � Pressure.
77237_ch09.indd 21977237_ch09.indd 219 8/11/10 8:13:43 AM8/11/10 8:13:43 AM

Chapter 9
220
preload can be thought of as the amount of myocardial stretch at the end of diastole, just before contraction. Measurements that corre-late with myocardial stretch, and that are often used to indicate the preload on the horizontal axis, are the ventricular end-diastolic volume (EDV) or end-diastolic pressure (EDP). Con-ditions that decrease intravascular volume, and thereby reduce ventricular preload (e.g., dehydration or severe hemorrhage), result in a smaller EDV and hence a reduced stroke volume during contraction. Conversely, an increased volume within the left ventricle
during diastole (e.g., a large intravenous fl uid infusion) results in a greater-than-normal stroke volume.
Afterload
Afterload (see Table 9.1) in the intact heart refl ects the resistance that the ventricle must overcome to empty its contents. It is more formally defi ned as the ventricular wall stress that develops during systolic ejection. Wall stress (�), like pressure, is expressed as force per unit area, and for the left ventricle, may be
Figure 9.3. Left ventricular (LV) performance (Frank–Starling) curves relate preload, measured as LV end-diastolic volume (EDV) or pressure (EDP), to cardiac performance, measured as ventricular stroke volume or cardiac output. On the curve of a normal heart (middle line), cardiac performance continuously increases as a function of preload. States of in-creased contractility (e.g., norepinephrine infusion) are characterized by an augmented stroke volume at any level of preload (upper line). Conversely, decreased LV contractility (commonly associated with heart failure) is char-acterized by a curve that is shifted downward (lower line). Point a is an example of a normal person at rest. Point b represents the same person after developing systolic dysfunction and heart failure (e.g., after a large myo-cardial infarction): stroke volume has fallen, and the decreased LV emptying results in elevation of the EDV. Because point b is on the ascending portion of the curve, the elevated EDV serves a compensatory role because it results in an increase in subsequent stroke volume, albeit much less than if operat-ing on the normal curve. Further augmentation of LV fi lling (e.g., increased circulating volume) in the heart failure patient is represented by point c, which resides on the relatively fl at part of the curve: stroke volume is only slightly augmented, but the signifi cantly increased EDP results in pulmonary congestion.
Str
oke
volu
me
(or
card
iac
outp
ut)
Left ventricular end-diastolic pressure(or end-diastolic volume)
Increasedcontractility
Normal
Heart failure
Pulmonary congestion
Hyp
oten
sion
a
bc
77237_ch09.indd 22077237_ch09.indd 220 8/11/10 8:13:43 AM8/11/10 8:13:43 AM

Heart Failure
221
estimated from Laplace’s relationship:
� � P � r _____ 2h
where P is ventricular pressure, r is ventri-cular chamber radius, and h is ventricular wall thickness. Thus, ventricular wall stress rises in response to a higher pressure load (e.g., hypertension) or an increased chamber size (e.g., a dilated left ventricle). Conversely, as would be expected from LaPlace’s relation-ship, an increase in wall thickness (h) serves a compensatory role in reducing wall stress, because the force is distributed over a greater mass per unit surface area of ventricular muscle.
Contractility (also termed “InotropicState”)
In the intact heart, as in the isolated muscle preparation, contractility accounts for changes in myocardial force for a given set of pre-load and afterload conditions, resulting from chemical and hormonal infl uences. By relat-ing a measure of ventricular performance (stroke volume or cardiac output) to preload (left ventricular end-diastolic pressure or vol-ume), each Frank–Starling curve is a refl ec-tion of the heart’s current inotropic state (see Fig. 9.3). The effect on stroke volume by an alteration in preload is refl ected by a change in position along a particular Frank–Starling curve. Conversely, a change in contractility actually shifts the entire curve in an upward or downward direction. Thus, when contrac-tility is enhanced pharmacologically (e.g., by an infusion of norepinephrine), the ventricular performance curve is displaced upward such that at any given preload, the stroke volume is increased. Conversely, when a drug that reduces contractility is administered, or the ventricle’s contractile function is impaired (as in certain types of heart failure), the curve shifts in a downward direction, leading to re-ductions in stroke volume and cardiac output at any given preload.
Pressure–Volume Loops
Another useful graphic display to illustrate the determinants of cardiac function is the
ventricular pressure–volume loop, which re-lates changes in ventricular volume to corre-sponding changes in pressure throughout the cardiac cycle (Fig. 9.4). In the left ventricle, fi lling of the chamber begins after the mitral valve opens in early diastole (point a). The curve between points a and b represents dia-stolic fi lling. As the volume increases during diastole, it is associated with a small rise in pressure, in accordance with the passive length–tension properties or compliance (see
Figure 9.4. Example of a normal left ventricular (LV) pressure–volume loop. At point a, the mi-tral valve opens. During diastolic fi lling of the LV (line ab), the volume increases in association with a gradual rise in pressure. When ventricular contraction commences and its pressure ex-ceeds that of the left atrium, the mitral valve (MV) closes (point b) and isovolumetric contraction of the LV ensues (the aortic valve is not yet open, and no blood leaves the chamber), as shown by line bc. When LV pressure rises to that in the aorta, the aortic valve (AV) opens (point c) and ejection begins. The volume within the LV declines during ejection (line cd), but LV pressure continues to rise until ventricular relaxation com-mences, then it begins to lessen. At point d, the LV pressure during relaxation falls below that in the aorta, and the AV closes, lead-ing to isovolumetric relaxation (line da). As the LV pressure falls further, the mitral valve reopens (point a). Point b rep-resents the end-diastolic volume (EDV) and pressure, and point d is the end-systolic volume (ESV) and pressure. Stroke volume is the difference between the EDV and ESV.
Strokevolume
d c
ba
Volume (mL)
Pre
ssur
e (m
m H
g)
77237_ch09.indd 22177237_ch09.indd 221 8/11/10 8:13:43 AM8/11/10 8:13:43 AM

Chapter 9
222
Table 9.1) of the myocardium, analogous to the lower curve in Figure 9.1A for an isolated muscle preparation.
Next, the onset of left ventricular systolic contraction causes the ventricular pressure to rise. When the pressure in the left ventricle (LV) exceeds that of the left atrium (point b),the mitral valve is forced to close. As the pressure continues to increase, the ventricular volume does not immediately change, because the aortic valve has not yet opened; therefore, this phase is called isovolumetric contraction. When the rise in ventricular pressure reaches the aortic diastolic pressure, the aortic valve is forced to open (point c) and ejection of blood into the aorta commences. During ejection, the volume within the ventricle decreases, but its pressure continues to rise until ventricular relaxation begins. The pressure against which the ventricle ejects (afterload) is represented by the curve cd. Ejection ends during the re-laxation phase, when the ventricular pressure falls below that of the aorta and the aortic valve closes (point d).
As the ventricle continues to relax, its pres-sure declines while its volume remains constant because the mitral valve has not yet opened (this phase is known as isovolumetric relax-ation). When the ventricular pressure falls below that of the left atrium, the mitral valve opens again (point a) and the cycle repeats.
Note that point b represents the pressure and volume at the end of diastole, whereas point d represents the pressure and volume at the end of systole. The difference between the EDV and end-systolic volume (ESV) represents the quantity of blood ejected during contrac-tion (i.e., the stroke volume).
Changes in any of the determinants of car-diac function are refl ected by alterations in the pressure–volume loop. By analyzing the effects of a change in an individual param-eter (preload, afterload, or contractility) on the pressure–volume relationship, the result-ing modifi cations in ventricular pressure and stroke volume can be predicted (Fig. 9.5).
Alterations in Preload
If afterload and contractility are held con-stant but preload is caused to increase (e.g.,
by administration of intravenous fl uid), left ventricular EDV rises. This increase in pre-load augments the stroke volume via the Frank–Starling mechanism such that the ESV achieved is the same as it was before increas-ing the preload. This means that the normal left ventricle is able to adjust its stroke volume and effectively empty its contents to match its diastolic fi lling volume, as long as contractility and afterload are kept constant.
Although end-diastolic volume and end-diastolic pressure are often used interchange-ably as markers of preload, the relationship between fi lling volume and pressure (i.e., ventricular compliance; see Table 9.1) largely governs the extent of ventricular fi lling. If ventricular compliance is reduced (e.g., in severe LV hypertrophy), the slope of the dia-stolic fi lling curve (segment ab in Fig. 9.4) be-comes steeper. A “stiff” or poorly compliant ventricle reduces the ability of the chamber to fi ll during diastole, resulting in a lower-than-normal ventricular end-diastolic volume. In this circumstance, the stroke volume will be reduced while the end-systolic volume re-mains unchanged.
Alterations in Afterload
If preload and contractility are held constant and afterload is augmented (e.g., in high- impedance states such as hypertension or aortic stenosis), the pressure generated by the left ventricle during ejection increases. In this situation, more ventricular work is expended in overcoming the resistance to ejection and less fi ber shortening takes place. As shown in Figure 9.5B, an increase in afterload results in a higher ventricular systolic pressure and a greater-than-normal LV end-systolic volume. Thus, in the setting of increased afterload, the ventricular stroke volume (EDV–ESV) is reduced.
The dependence of the end-systolic vol-ume on afterload is approximately linear: the greater the afterload, the higher the end-systolic volume. This relationship is depicted in Figure 9.5 as the end-systolic pressure–volume relation (ESPVR) and is analogous to the total tension curve in the isolated muscle experiments described earlier.
77237_ch09.indd 22277237_ch09.indd 222 8/11/10 8:13:44 AM8/11/10 8:13:44 AM

Heart Failure
223
Alterations in Contractility
The slope of the ESPVR line on the pressure-volume loop graph is a function of cardiac contractility. In conditions of increased contrac-tility, the ESPVR slope becomes steeper; that is, it shifts upward and toward the left. Hence, at any given preload or afterload, the ventricle empties more completely (the stroke volume increases) and results in a smaller-than-normal end-systolic volume (see Fig. 9.5C). Conversely, in situations of reduced contractility, the ESPVR
line shifts downward, consistent with a decline in stroke volume and a higher end-systolic volume. Thus, the end-systolic volume is dependent on the afterload against which the ventricle contracts and the inotropic state, but is independent of the end-diastolic volume prior to contraction.
The important physiologic concepts in this section are summarized here:
1. Ventricular stroke volume is a function of preload, afterload, and contractility. SV
Figure 9.5. The effect of varying preload, afterload, and contractility on the pressure–volume loop. A. When arterial pressure (afterload) and contractility are held constant, sequential increases (lines 1, 2, and 3) in preload (measured in this case as end-diastolic volume [EDV]) are associated with loops that have progressively higher stroke volumes but a constant end-systolic volume (ESV). B. When the preload (EDV) and contractility are held constant, sequential increases (points 1, 2, and 3) in arterial pressure (afterload) are associated with loops that have progressively lower stroke volumes and higher end-systolic volume end-systolic volume. There is a nearly linear relationship between the afterload and ESV, termed the end-systolic pressure–volume relation (ESPVR). C. A positive inotropic intervention shifts the end-systolic pressure–volume relation upward and leftward from ESPVR-1 to ESPVR-2, resulting in loop 2, which has a larger stroke volume and a smaller end-systolic volume than the original loop 1.
Volume (mL)
Volume (mL)
Volume (mL)
Pre
ssur
e (m
m H
g)
Pre
ssur
e (m
m H
g)
Pre
ssur
e (m
m H
g)
77237_ch09.indd 22377237_ch09.indd 223 8/11/10 8:13:44 AM8/11/10 8:13:44 AM

Chapter 9
224
rises when there is an increase in preload, a decrease in afterload, or augmented contractility.
2. Ventricular end-diastolic volume (or end-diastolic pressure) is used as a representa-tion of preload. The end-diastolic volume is infl uenced by the chamber’s compliance.
3. Ventricular end-systolic volume depends on the afterload and contractility but not on the preload.
PATHOPHYSIOLOGY
Chronic heart failure may result from a wide variety of cardiovascular insults. The etio-logies can be grouped into those that (1) im-pair ventricular contractility, (2) increase afterload, or (3) impair ventricular relax-ation and fi lling (Fig. 9.6). Heart failure that results from an abnormality of ventricular emptying (due to impaired contractility or
Figure 9.6. Conditions that cause left-sided heart failure through impairment of ventricular systolic or diastolic function. aNote that in chronic stable stages the condi-tions in this box may instead result in heart failure with preserved EF, due to compensa-tory ventricular hypertrophy and increased diastolic stiffness (diastolic dysfunction).
Reduced Ejection Fraction(Systolic Dysfunction)
Heart Failure
Preserved Ejection Fraction(Diastolic Dysfunction)
1. Coronary artery disease
• Myocardial infarction
• Transient myocardialischemia
2. Chronic volume overload
• Mitral regurgitation
• Aortic regurgitation
3. Dilated cardiomyopathies
Impaired Contractility
1. Advanced aortic stenosis
2. Uncontrolled severehypertension
↑↑Afterload(Chronic Pressure Overloada)
1. Left ventricular hypertrophy
2. Restrictive cardiomyopathy
3. Myocardial fibrosis
4. Transient myocardial ischemia
5. Pericardial constriction or
tamponade
Impaired Diastolic Filling
77237_ch09.indd 22477237_ch09.indd 224 8/11/10 8:13:44 AM8/11/10 8:13:44 AM

Heart Failure
225
greatly excessive afterload) is termed systolic dysfunction, whereas heart failure caused by abnormalities of diastolic relaxation or ventricular fi lling is termed diastolic dysfunc-tion. However, there is much overlap, and many patients demonstrate both systolic and diastolic abnormalities. As a result, it is now common to categorize heart failure patients into two general categories, based on the left ventricular ejection fraction (EF), a mea-sure of cardiac performance (see Table 9.1): (1) heart failure with reduced EF (i.e., pri-marily systolic dysfunction) and (2) heart failure with preserved EF (i.e., primarily diastolic dysfunction). In the United States, approximately one half of patients with heart failure fall into each of these categories.
Heart Failure with Reduced EF
In states of systolic dysfunction, the affected ventricle has a diminished capacity to eject blood because of impaired myocardial con-tractility or pressure overload (i.e., excessive afterload). Loss of contractility may result from destruction of myocytes, abnormal myo-cyte function, or fi brosis. Pressure overload
impairs ventricular ejection by signifi cantly in-creasing resistance to fl ow.
Figure 9.7A depicts the effects of systolic dysfunction due to impaired contractility on the pressure–volume loop. The ESPVR is shifted downward such that systolic emptying ceases at a higher-than-normal end-systolic volume. As a result, the stroke vol-ume falls. When normal pulmonary venous return is added to the increased end-systolic volume that has remained in the ventricle because of incomplete emptying, the dias-tolic chamber volume increases, resulting in a higher-than-normal end-diastolic volume and pressure. While that increase in preload induces a compensatory rise in stroke vol-ume (via the Frank–Starling mechanism), impaired contractility and the reduced ejec-tion fraction cause the end-systolic volume to remain elevated.
During diastole, the persistently elevated LV pressure is transmitted to the left atrium (through the open mitral valve) and to the pul-monary veins and capillaries. An elevated pul-monary capillary hydrostatic pressure, when suffi ciently high (usually 20 mm Hg), results in the transudation of fl uid into the pulmonary
Figure 9.7. The pressure–volume loop in systolic and diastolic dysfunction. A. The normal pressure–volume loop (solid line) is compared with one demonstrating systolic dysfunction (dashed line). In systolic dysfunction caused by decreased cardiac contractility, the end-systolic pressure–volume relation is shifted downward and rightward (from line 1 to line 2). As a result, the end-systolic volume (ESV) is increased (arrow). As normal venous return is added to that greater-than-normal ESV, there is an obligatory increase in the end-diastolic volume (EDV) and pressure (preload), which serves a compensatory function by partially elevating stroke volume toward normal via the Frank–Starling mechanism. B. The pressure–volume loop of diastolic dysfunction resulting from increased stiffness of the ventricle (dashed line). The passive diastolic pressure–volume curve is shifted upward (from line 1 to line 2) such that at any diastolic volume, the ventricular pressure is higher than normal. The result is a decreased EDV (arrow) because of reduced fi lling of the stiffened ventricle at a higher-than-normal end-diastolic pressure.
2
2
Volume (mL) Volume (mL)
Pre
ssur
e (m
m H
g)
Pre
ssur
e (m
m H
g)
77237_ch09.indd 22577237_ch09.indd 225 8/11/10 8:13:44 AM8/11/10 8:13:44 AM

Chapter 9
226
interstitium and symptoms of pulmonary congestion.
Heart Failure with Preserved EF
Patients who exhibit heart failure with pre-served EF frequently demonstrate abnormali-ties of ventricular diastolic function: either impaired early diastolic relaxation (an active, energy-dependent process), increased stiff-ness of the ventricular wall (a passive prop-erty), or both. Acute myocardial ischemia is an example of a condition that transiently inhibits energy delivery and diastolic relax-ation. Conversely, left ventricular hyper-trophy, fi brosis, or restrictive cardiomyopathy (see Chapter 10) causes the LV walls to be-come chronically stiffened. Certain pericardial diseases (cardiac tamponade and pericardial constriction, as described in Chapter 14) pres-ent an external force that limits ventri cular fi lling and represent potentially reversible forms of diastolic dysfunction. The effect of impaired diastolic function is refl ected in the pressure–volume loop (see Fig. 9.7B): in dias-tole, fi lling of the ventricle occurs at higher-than-normal pressures because the lower part of the loop is shifted upward as a result of reduced chamber compliance. Patients with diastolic dysfunction often manifest signs of vascular congestion because the elevated diastolic pressure is transmitted retrograde to the pulmonary and systemic veins.
Right-Sided Heart Failure
Whereas the physiologic principles mentioned above may be applied to both right-sided and left-sided heart failure, there are distinct differ-ences in function between the two ventricles. Compared with the left ventricle, the right ventricle (RV) is a thin-walled, highly compliant chamber that accepts its blood volume at low pressures and ejects against a low pulmonary vascular resistance. As a result of its high com-pliance, the RV has little diffi culty accepting a wide range of fi lling volumes without sig-nifi cant changes in its fi lling pressures. Con-versely, the RV is quite susceptible to failure in situations that present a sudden increase in afterload, such as acute pulmonary embolism.
The most common cause of right-sided heart failure is actually the presence of left-sided heart failure (Table 9.2). In this situation, excessive afterload confronts the right ventricle because of the elevated pul-monary vascular pressures that result from LV dysfunction. Isolated right-heart failure is less common and usually refl ects increased RV afterload owing to diseases of the lung parenchyma or pulmonary vasculature. Right-sided heart disease that results from a primary pulmonary process is known as cor pulmonale, which may lead to symptoms of right-heart failure.
When the right ventricle fails, the elevated diastolic pressure is transmitted retrograde to the right atrium with subsequent conges-tion of the systemic veins, accompanied by signs of right-sided heart failure as described below. Indirectly, isolated right-heart failure may also infl uence left-heart function: the decreased right ventricular output reduces blood return to the LV (i.e., diminished pre-load), causing left ventricular stroke volume to decline.
COMPENSATORY MECHANISMS
Several natural compensatory mechanismsare called into action in patients with heart failure that buffer the fall in cardiac outputand help preserve suffi cient blood pressure to perfuse vital organs. These compensations
Table 9.2. Examples of Conditions That Cause Right-Sided Heart Failure
Cardiac causes Left-sided heart failure Pulmonic valve stenosis Right ventricular infarction
Pulmonary parenchymal diseases Chronic obstructive pulmonary disease Interstitial lung disease (e.g., sarcoidosis) Adult respiratory distress syndrome Chronic lung infection or bronchiectasis
Pulmonary vascular diseases Pulmonary embolism
Primary pulmonary hypertension
77237_ch09.indd 22677237_ch09.indd 226 8/11/10 8:13:44 AM8/11/10 8:13:44 AM
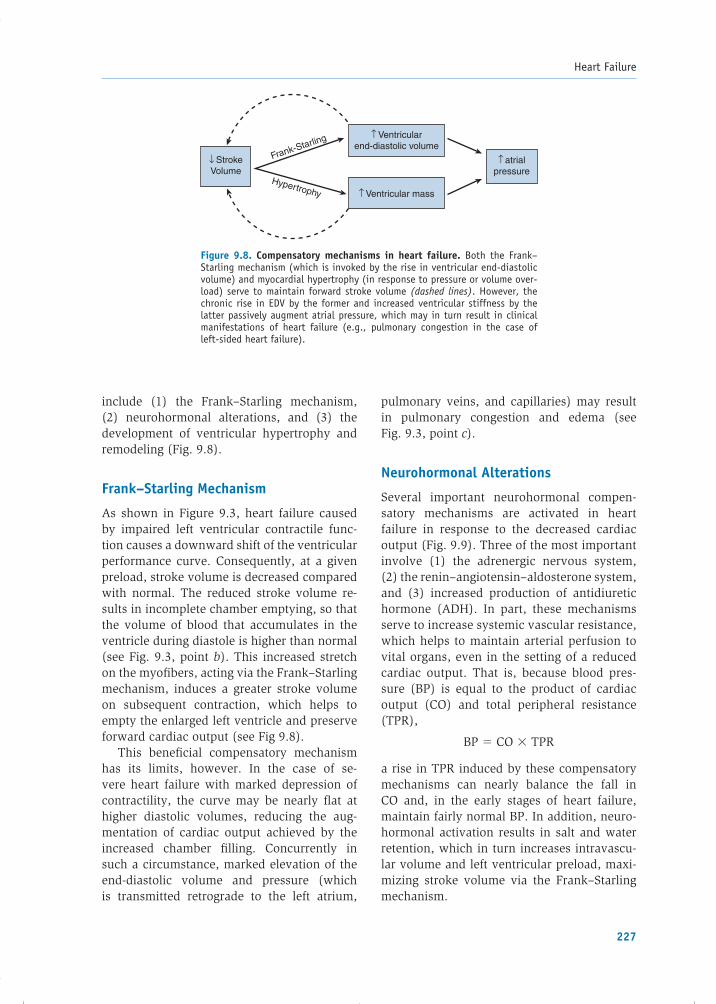
Heart Failure
227
include (1) the Frank–Starling mechanism,(2) neurohormonal alterations, and (3) the development of ventricular hypertrophy and remodeling (Fig. 9.8).
Frank–Starling Mechanism
As shown in Figure 9.3, heart failure caused by impaired left ventricular contractile func-tion causes a downward shift of the ventricular performance curve. Consequently, at a given preload, stroke volume is decreased compared with normal. The reduced stroke volume re-sults in incomplete chamber emptying, so that the volume of blood that accumulates in the ventricle during diastole is higher than normal (see Fig. 9.3, point b). This increased stretch on the myofi bers, acting via the Frank–Starling mechanism, induces a greater stroke volume on subsequent contraction, which helps to empty the enlarged left ventricle and preserve forward cardiac output (see Fig 9.8).
This benefi cial compensatory mechanism has its limits, however. In the case of se-vere heart failure with marked depression of contractility, the curve may be nearly fl at at higher diastolic volumes, reducing the aug-mentation of cardiac output achieved by the increased chamber fi lling. Concurrently in such a circumstance, marked elevation of the end-diastolic volume and pressure (which is transmitted retrograde to the left atrium,
pulmonary veins, and capillaries) may result in pulmonary congestion and edema (see Fig. 9.3, point c).
Neurohormonal Alterations
Several important neurohormonal compen-satory mechanisms are activated in heart failure in response to the decreased cardiac output (Fig. 9.9). Three of the most important involve (1) the adrenergic nervous system,(2) the renin–angiotensin–aldosterone system, and (3) increased production of antidiuretic hormone (ADH). In part, these mechanisms serve to increase systemic vascular resistance, which helps to maintain arterial perfusion to vital organs, even in the setting of a reduced cardiac output. That is, because blood pres-sure (BP) is equal to the product of cardiac output (CO) and total peripheral resistance (TPR),
BP � CO � TPR
a rise in TPR induced by these compensatory mechanisms can nearly balance the fall in CO and, in the early stages of heart failure, maintain fairly normal BP. In addition, neuro-hormonal activation results in salt and water retention, which in turn increases intravascu-lar volume and left ventricular preload, maxi-mizing stroke volume via the Frank–Starling mechanism.
Figure 9.8. Compensatory mechanisms in heart failure. Both the Frank–Starling mechanism (which is invoked by the rise in ventricular end-diastolic volume) and myocardial hypertrophy (in response to pressure or volume over-load) serve to maintain forward stroke volume (dashed lines). However, the chronic rise in EDV by the former and increased ventricular stiffness by the latter passively augment atrial pressure, which may in turn result in clinical manifestations of heart failure (e.g., pulmonary congestion in the case of left-sided heart failure).
↑ Ventricularend-diastolic volume
↑ Ventricular mass
↑ atrialpressure
↓ StrokeVolume
Frank-Starling
Hypertrophy
77237_ch09.indd 22777237_ch09.indd 227 8/11/10 8:13:44 AM8/11/10 8:13:44 AM

Chapter 9
228
Although the acute effects of neuro hormonal stimulation are compensatory and benefi cial, chronic activation of these mechanisms often ultimately proves deleterious to the failing heart and contributes to a progressive downhill course, as described later.
Adrenergic Nervous System
The fall in cardiac output in heart failure is sensed by baroreceptors in the carotid sinus and aortic arch. These receptors decrease their rate of fi ring in proportion to the fall in BP, and the signal is transmitted by the 9th and 10th cranial nerves to the cardiovascular con-trol center in the medulla. As a result, sym-pathetic outfl ow to the heart and peripheral
circulation is increased, and parasympathetic tone is diminished. There are three immediate consequences (see Fig. 9.9): (1) an increase in heart rate, (2) augmentation of ventricular contractility, and (3) vasoconstriction caused by stimulation of -receptors on the systemic veins and arteries.
The increased heart rate and ventricular contractility directly augment cardiac output (see Fig. 9.2). Vasoconstriction of the venous and arterial circulations is also initially ben-efi cial. Venous constriction augments blood return to the heart, which increases preload and raises stroke volume through the Frank–Starling mechanism, as long as the ventricle is operating on the ascending portion of its ventricular performance curve. Arteriolar
Figure 9.9. Compensatory neurohormonal stimulation develops in response to the reduced forward cardiac output and blood pressure of heart failure. Increased ac-tivity of the sympathetic nervous system, renin–angiotensin–aldosterone system, and antidiuretic hormone serve to support the cardiac output and blood pressure (boxes). However, adverse consequences of these activations (dashed lines) include an increase in afterload from excessive vasoconstriction (which may then impede cardiac out-put) and excess fl uid retention, which contributes to peripheral edema and pulmonary congestion.
Decreased Cardiac Output
↑ Sympatheticnervous system
↑ Renin-angiotensinsystem
↑ Antidiuretichormone
↑ Contractility ↑ Heartrate
↑ Circulating volume
↑ Venous return toheart
(↑ preload)
↑ Strokevolume
Vasoconstriction
Peripheral edemaand pulmonary
congestion
MaintainBlood
Pressure
CardiacOutput –
+
+
Arteriolar Venous
77237_ch09.indd 22877237_ch09.indd 228 8/11/10 8:13:44 AM8/11/10 8:13:44 AM

Heart Failure
229
constriction increases the peripheral vascular re-sistance and therefore helps to maintain blood pressure (BP � CO � TPR). The regional distri-bution of -receptors is such that during sympa-thetic stimulation, blood fl ow is redistributed to vital organs (e.g., heart and brain) at the expense of the skin, splanchnic viscera, and kidneys.
Renin–Angiotensin–Aldosterone System
This system is also activated early in patients with heart failure (see Fig. 9.9), mediated by increased renin release. The main stimuli for renin secretion from the juxtaglomerular cells of the kidney in heart failure patients include (1) decreased renal artery perfusion pres-sure secondary to low cardiac output, (2) de-creased salt delivery to the macula densa of the kidney owing to alterations in intrarenal hemo dynamics, and (3) direct stimulation of juxtaglomerular �2-receptors by the activated adrenergic nervous system.
Renin is an enzyme that cleaves circulating angiotensinogen to form angiotensin I, which is then rapidly cleaved by endothelial cell-bound angiotensin-converting enzyme (ACE) to form angiotensin II (AII), a potent vasoconstrictor (see Chapter 13). Increased AII constricts ar-terioles and raises total peripheral resistance, thereby serving to maintain systemic blood pressure. In addition, AII acts to increase intra-vascular volume by two mechanisms: (1) at the hypothalamus, it stimulates thirst and there-fore water intake; and (2) at the adrenal cortex, it acts to increase aldosterone secretion. The latter hormone promotes sodium reabsorption from the distal convoluted tubule of the kidney into the circulation (see Chapter 17), serving to augment intravascular volume. The rise in intravascular volume increases left ventricular preload and thereby augments cardiac output via the Frank–Starling mechanism in patients on the ascending portion of the ventricular per-formance curve (see Fig. 9.3).
Antidiuretic Hormone
Secretion of this hormone (also termed vaso-pressin) by the posterior pituitary is increased in many patients with heart failure, presumably mediated through arterial baroreceptors, and
by increased levels of AII. ADH contributes to increased intravascular volume because it pro-motes water retention in the distal nephron. The increased intravascular volume serves to augment left ventricular preload and cardiac output. ADH also appears to contribute to sys-temic vasoconstriction.
Although each of these neurohormonal alterations in heart failure is initially benefi -cial, continued activation ultimately proves harmful. For example, the increased circulat-ing volume and augmented venous return to the heart may worsen engorgement of the lung vasculature, exacerbating congestive pulmo-nary symptoms. Furthermore, the elevated arteriolar resistance increases the afterload against which the failing left ventricle con-tracts and may therefore impair stroke volume and reduce cardiac output (see Fig. 9.9). In addition, the increased heart rate augments metabolic demand and can therefore further reduce the performance of the failing heart. Continuous sympathetic activation results in downregulation of cardiac �-adrenergic recep-tors and upregulation of inhibitory G proteins, contributing to a decrease in the myocardium’s sensitivity to circulating catecholamines and a reduced inotropic response.
Chronically elevated levels of AII and aldo-sterone have additional detrimental effects.They provoke the production of cytokines (small proteins that mediate cell–cell communi-cation and immune responses), activate macro-phages, and stimulate fi broblasts, resulting in fi brosis and adverse remodeling of the failing heart.
Because the undesired consequences of chronic neurohormonal activation eventually outweigh their benefi ts, much of today’s phar-macologic therapy of heart failure is designed to moderate these “compensatory” mecha-nisms, as examined later in the chapter.
Natriuretic Peptides
In contrast to the ultimately adverse conse-quences of the neurohormonal alterations de-scribed in the previous section, the natriuretic peptides are natural “benefi cial” hormones se-creted in heart failure in response to increased
77237_ch09.indd 22977237_ch09.indd 229 8/11/10 8:13:45 AM8/11/10 8:13:45 AM

Chapter 9
230
intracardiac pressures. The best studied of these are atrial natriuretic peptide (ANP) and B-type natriuretic peptide (BNP). ANP is stored in atrial cells and is released in response to atrial distention. BNP is not detected in normal hearts but is produced when ventricular myo-cardium is subjected to hemodynamic stress (e.g., in heart failure or during myocardial in-farction). Recent studies have shown a close relationship between serum BNP levels and the clinical severity of heart failure.
Actions of the natriuretic peptides are medi-ated by specifi c natriuretic receptors and are largely opposite to those of the other hormone systems activated in heart failure. They result in excretion of sodium and water, vasodilata-tion, inhibition of renin secretion, and antago-nism of the effects of AII on aldosterone and vasopressin levels. Although these effects are benefi cial to patients with heart failure, they are usually not suffi cient to fully counteract the vasoconstriction and volume-retaining ef-fects of the other activated hormonal systems.
Other Peptides
Among other peptides that are generated in heart failure is endothelin-1, a potent vaso-constrictor, derived from endothelial cells lin-ing the vasculature (see Chapter 6). In patients with heart failure, the plasma concentration of endothelin-1 correlates with disease severity and adverse outcomes. Drugs designed to in-hibit endothelin receptors (and therefore blunt adverse vasoconstriction) improve LV function in heart failure patients, but long-term clinical benefi ts have not been demonstrated.
Ventricular Hypertrophy and Remodeling
Ventricular hypertrophy and remodeling are important compensatory processes that de-velop over time in response to hemodynamic burdens. Wall stress (as defi ned earlier) is often increased in developing heart failure because of either LV dilatation (increased chamber ra-dius) or the need to generate high systolic pres-sures to overcome excessive afterload (e.g., in aortic stenosis or hypertension). A sustained increase in wall stress (along with neuro-hormonal and cytokine alterations) stimulates
the development of myocardial hypertrophy and deposition of extracellular matrix. This in-creased mass of muscle fi bers serves as a com-pensatory mechanism that helps to maintain contractile force and counteracts the elevated ventricular wall stress (recall that wall thick-ness is in the denominator of the Laplace wall stress formula). However, because of the in-creased stiffness of the hypertrophied wall, these benefi ts come at the expense of higher-than-normal diastolic ventricular pressures, which are transmitted to the left atrium and pulmonary vasculature (see Fig. 9.8).
The pattern of compensatory hypertrophy and remodeling that develops depends on whether the ventricle is subjected to chronic volume or pressure overload. Chronic cham-ber dilatation owing to volume overload (e.g., chronic mitral or aortic regurgitation) results in the synthesis of new sarcomeres in series with the old, causing the myocytes to elongate. The radius of the ventricular chamber therefore en-larges, doing so in proportion to the increase in wall thickness, and is termed eccentric hyper-trophy. Chronic pressure overload (e.g., caused by hypertension or aortic stenosis) results in the synthesis of new sarcomeres in parallel with the old (i.e., the myocytes thicken), termed concentric hypertrophy. In this situation, the wall thickness increases without proportional chamber dilatation, and wall stress may there-fore be reduced substantially.
Such hypertrophy and remodeling help to reduce wall stress and maintain contractile force, but ultimately, ventricular function may decline, allowing the chamber to dilate out of proportion to wall thickness. When this oc-curs, the excessive hemodynamic burden on the contractile units produces a downward spiral of deterioration with progressive heart failure symptomatology.
MYOCYTE LOSS AND CELLULAR DYSFUNCTION
Impairment of ventricular function in heart failure may result from the actual loss of myo-cytes and/or impaired function of living myo-cytes. The loss of myocytes may result from cellular necrosis (e.g., from myocardial infarc-tion or exposure to cardiotoxic drugs such as
77237_ch09.indd 23077237_ch09.indd 230 8/11/10 8:13:45 AM8/11/10 8:13:45 AM
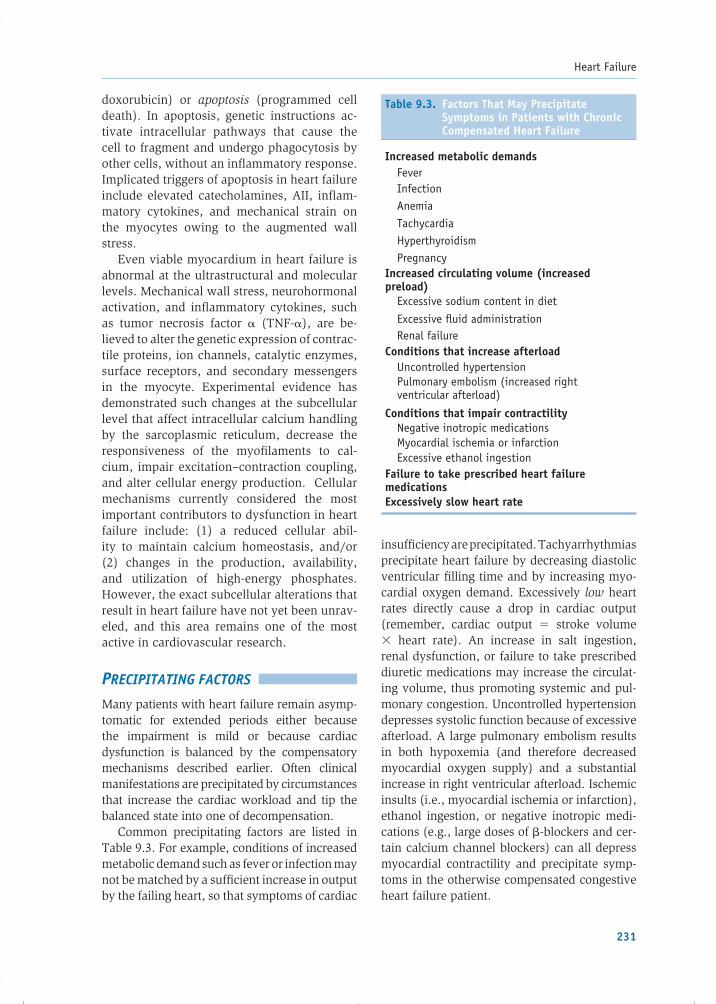
Heart Failure
231
doxorubicin) or apoptosis (programmed cell death). In apoptosis, genetic instructions ac-tivate intracellular pathways that cause the cell to fragment and undergo phagocytosis by other cells, without an infl ammatory response. Implicated triggers of apoptosis in heart failure include elevated catecholamines, AII, infl am-matory cytokines, and mechanical strain on the myocytes owing to the augmented wall stress.
Even viable myocardium in heart failure is abnormal at the ultrastructural and molecular levels. Mechanical wall stress, neurohormonal activation, and infl ammatory cytokines, such as tumor necrosis factor (TNF-), are be-lieved to alter the genetic expression of contrac-tile proteins, ion channels, catalytic enzymes, surface receptors, and secondary messengers in the myocyte. Experimental evidence has demonstrated such changes at the subcellular level that affect intracellular calcium handling by the sarcoplasmic reticulum, decrease the responsiveness of the myofi laments to cal-cium, impair excitation–contraction coupling, and alter cellular energy production. Cellular mechanisms currently considered the most important contributors to dysfunction in heart failure include: (1) a reduced cellular abil-ity to maintain calcium homeostasis, and/or(2) changes in the production, availability, and utilization of high-energy phosphates. However, the exact subcellular alterations that result in heart failure have not yet been unrav-eled, and this area remains one of the most active in cardiovascular research.
PRECIPITATING FACTORS
Many patients with heart failure remain asymp-tomatic for extended periods either because the impairment is mild or because cardiac dysfunction is balanced by the compensatory mechanisms described earlier. Often clinical manifestations are precipitated by circumstances that increase the cardiac workload and tip the balanced state into one of decompensation.
Common precipitating factors are listed in Table 9.3. For example, conditions of increased metabolic demand such as fever or infection may not be matched by a suffi cient increase in output by the failing heart, so that symptoms of cardiac
insuffi ciency are precipitated. Tachy arrhythmias precipitate heart failure by decreasing diastolic ventricular fi lling time and by increasing myo-cardial oxygen demand. Excessively low heart rates directly cause a drop in cardiac output (remember, cardiac output � stroke volume � heart rate). An increase in salt ingestion, renal dysfunction, or failure to take prescribed diuretic medications may increase the circulat-ing volume, thus promoting systemic and pul-monary congestion. Uncontrolled hypertension depresses systolic function because of excessive afterload. A large pulmonary embolism results in both hypoxemia (and therefore decreased myocardial oxygen supply) and a substantial increase in right ventricular afterload. Ischemic insults (i.e., myocardial ischemia or infarction), ethanol ingestion, or negative inotropic medi-cations (e.g., large doses of �-blockers and cer-tain calcium channel blockers) can all depress myocardial contractility and precipitate symp-toms in the otherwise compensated congestive heart failure patient.
Table 9.3. Factors That May Precipitate Symptoms in Patients with Chronic Compensated Heart Failure
Increased metabolic demands Fever Infection Anemia Tachycardia Hyperthyroidism PregnancyIncreased circulating volume (increasedpreload) Excessive sodium content in diet
Excessive fl uid administration Renal failureConditions that increase afterload Uncontrolled hypertension Pulmonary embolism (increased right ventricular afterload)
Conditions that impair contractility Negative inotropic medications Myocardial ischemia or infarction Excessive ethanol ingestionFailure to take prescribed heart failuremedicationsExcessively slow heart rate
77237_ch09.indd 23177237_ch09.indd 231 8/11/10 8:13:45 AM8/11/10 8:13:45 AM

Chapter 9
232
CLINICAL MANIFESTATIONS
The clinical manifestations of heart failure re-sult from impaired forward cardiac output and/or elevated venous pressures, and relate to the ventricle that has failed (Table 9.4). A pa-tient may present with the chronic progressive symptoms of heart failure described here or, in certain cases, with sudden decompensation of left-sided heart function (e.g., acute pulmonary edema, as described later in the chapter).
Symptoms
The most prominent manifestation of chronic left ventricular failure is dyspnea (breathless-ness) on exertion. Controversy regarding the cause of this symptom has centered on whether it results primarily from pulmonary venous congestion, or from decreased forward cardiac output. A pulmonary venous pressure that ex-ceeds approximately 20 mm Hg leads to transu-dation of fl uid into the pulmonary interstitium and congestion of the lung parenchyma. The resulting reduced pulmonary compliance in-creases the work of breathing to move the same volume of air. Moreover, the excess fl uid in the interstitium compresses the walls of the bron-chioles and alveoli, increasing the resistance to airfl ow and requiring greater effort of res-piration. In addition, juxtacapillary receptors(J receptors) are stimulated and mediate rapid shallow breathing. The heart failure patient can also suffer from dyspnea even in the absence of
pulmonary congestion, because reduced blood fl ow to overworked respiratory muscles and ac-cumulation of lactic acid may also contribute to that sensation. Heart failure may initially cause dyspnea only on exertion, but more severe dys-function results in symptoms at rest as well.
Other manifestations of low forward output in heart failure may include dulled mental sta-tus because of reduced cerebral perfusion and impaired urine output during the day because of decreased renal perfusion. The latter often gives way to increased urinary frequency at night (nocturia) when, while supine, blood fl ow is redistributed to the kidney, promoting renal perfusion and diuresis. Reduced skeletal muscle perfusion may result in fatigue and weakness.
Other congestive manifestations of heart failure include orthopnea, paroxysmal noc-turnal dyspnea (PND), and nocturnal cough. Orthopnea is the sensation of labored breath-ing while lying fl at and is relieved by sitting upright. It results from the redistribution of in-travascular blood from the gravity-dependent portions of the body (abdomen and lower ex-tremities) toward the lungs after lying down. The degree of orthopnea is generally assessed by the number of pillows on which the patient sleeps to avoid breathlessness. Sometimes, orthopnea is so signifi cant that the patient may try to sleep upright in a chair.
PND is severe breathlessness that awakens the patient from sleep 2 to 3 hours after retiring to bed. This frightening symptom results from the gradual reabsorption into the circulation of
Table 9.4. Common Symptoms and Physical Findings in Heart Failure
Symptoms Physical Findings
Left-sided Dyspnea Diaphoresis (sweating) Orthopnea Tachycardia, tachypnea Paroxysmal nocturnal dyspnea Pulmonary rales Fatigue Loud P2
S3 gallop (in systolic dysfunction)S4 gallop (in diastolic dysfunction)
Right-sided Peripheral edema Jugular venous distention Right upper quadrant discomfort Hepatomegaly (because of hepatic enlargement) Peripheral edema
77237_ch09.indd 23277237_ch09.indd 232 8/11/10 8:13:45 AM8/11/10 8:13:45 AM

Heart Failure
233
lower extremity interstitial edema after lying down, with subsequent expansion of intra-vascular volume and increased venous return to the heart and lungs. A nocturnal cough is another symptom of pulmonary congestion and is produced by a mechanism similar to orthopnea. Hemoptysis (coughing up blood) may result from rupture of engorged bronchial veins.
In right-sided heart failure, the elevated systemic venous pressures can result in ab-dominal discomfort because the liver becomes engorged and its capsule stretched. Similarly, anorexia (decreased appetite) and nausea may result from edema within the gastrointesti-nal tract. Peripheral edema, especially in the ankles and feet, also refl ects increased hydro-static venous pressures. Because of the effects of gravity, it tends to worsen while the patient is upright during the day and is often im-proved by morning after lying supine at night. Even before peripheral edema develops, the patient may note an unexpected weight
gain resulting from the accumulation of inter-stitial fl uid.
The symptoms of heart failure are com-monly graded according to the New York Heart Association (NYHA) classifi cation (Table 9.5), and patients may shift from one class to an-other, in either direction, over time. A newer system classifi es patients according to their stage in the temporal course of heart failure (Table 9.6). In this system, progression is in only one direction, from Stage A to Stage D, refl ecting the typical sequence of heart failure manifestations in clinical practice.
Physical Signs
The physical signs of heart failure depend on the severity and chronicity of the condi-tion and can be divided into those associ-ated with left- or right-heart dysfunction (see Table 9.4). Patients with only mild impairment may appear well. However, a patient with se-vere chronic heart failure may demonstrate
Table 9.6. Stages of Chronic Heart Failure
Stage Description
A Patient who is at risk of developing heart failure but has not yet developed structural cardiac dysfunction (e.g., patient with coronary artery disease, hypertension, or family history of cardiomyopathy).
B Patient who has structural heart disease associated with heart failure but has not yet developed symptoms.
C Patient who has current or prior symptoms of heart failure associated with structural heart disease.
D Patient who has structural heart disease and marked heart failure symptoms despite maximal medical therapy and requires advanced interventions (e.g., cardiac transplantation).
Derived from Hunt SA, Baker DW, Chin MH, et al. ACC/AHA guidelines for the evaluation and management of chronic heart failure in the adult: executive summary. Circulation. 2001;104:2996–3007.
Table 9.5. New York Heart Association Classifi cation of Chronic Heart Failure
Class Defi nition
I No limitation of physical activity.
II Slight limitation of activity. Dyspnea and fatigue with moderate exertion (e.g., walkingupstairs quickly).
III Marked limitation of activity. Dyspnea with minimal exertion (e.g., slowly walking upstairs).
IV Severe limitation of activity. Symptoms are present even at rest.
77237_ch09.indd 23377237_ch09.indd 233 8/11/10 8:13:45 AM8/11/10 8:13:45 AM

Chapter 9
234
cachexia (a frail, wasted appearance) owing in part to poor appetite and to the metabolic demands of the increased effort in breathing. In decompensated left-sided heart failure, the patient may appear dusky (decreased cardiac output) and diaphoretic (sweating because of increased sympathetic nervous activity), and the extremities are cool because of peri-pheral arterial vasoconstriction. Tachypnea (rapid breathing) is common. The pattern of Cheyne–Stokes respiration may also be pres-ent in advanced heart failure, characterized by periods of hyperventilation separated by inter-vals of apnea (absent breathing). This pattern is related to the prolonged circulation time be-tween the lungs and respiratory center of the brain in heart failure that interferes with the normal feedback mechanism of systemic oxy-genation. Sinus tachycardia (resulting from in-creased sympathetic nervous system activity) is also common. Pulsus alternans (alternating strong and weak contractions detected in the peripheral pulse) may be present as a sign of advanced ventricular dysfunction.
In left-sided heart failure, the auscultatory fi nding of pulmonary rales is created by the “popping open” of small airways during inspi-ration that had been closed off by edema fl uid. This fi nding is initially apparent at the lung bases, where hydrostatic forces are greatest; however, more severe pulmonary congestion is associated with additional rales higher in the lung fi elds. Compression of conduction air-ways by pulmonary congestion may produce coarse rhonchi and wheezing; the latter fi nd-ing in heart failure is termed cardiac asthma.
Depending on the cause of heart failure, palpation of the heart may show that the left ventricular impulse is not focal but diffuse (in dilated cardiomyopathy), sustained (in pres-sure overload states such as aortic stenosis or hypertension), or lifting in quality (in volume overload states such as mitral regurgitation). Because elevated left-heart fi lling pressures result in increased pulmonary vascular pres-sures, the pulmonic component of the second heart sound is often louder than normal. An early diastolic sound (S3) is frequently heard in adults with systolic heart failure and is caused by abnormal fi lling of the dilated chamber (see Chapter 2). A late diastolic sound (S4) results
from forceful atrial contraction into a stiffened ventricle and is common in states of decreased LV compliance (diastolic dysfunction). The murmur of mitral regurgitation is sometimes auscultated in left-sided heart failure if LV dilatation has stretched the valve annulus and spread the papillary muscles apart from one another, thus preventing proper closure of the mitral leafl ets in systole.
In right-sided heart failure, different physical fi ndings may be present. Cardiac examination may reveal a palpable parasternal right ventri-cular heave, representing RV enlargement, or a right-sided S3 or S4 gallop. The murmur of tricuspid regurgitation may be auscultated and is due to right ventricular enlargement, analo-gous to mitral regurgitation that develops in LV dilatation. The elevated systemic venous pressure produced by right-heart failure is manifested by distention of the jugular veins as well as hepatic enlargement with abdominal right upper quadrant tenderness. Edema accu-mulates in the dependent portions of the body, beginning in the ankles and feet of ambulatory patients and in the presacral regions of those who are bedridden.
Pleural effusions may develop in either left- or right-sided heart failure, because the pleural veins drain into both the systemic and pulmo-nary venous beds. The presence of pleural ef-fusions is suggested on physical examination by dullness to percussion over the posterior lung bases.
Diagnostic Studies
A normal mean left atrial (LA) pressure is �10 mm Hg. If the LA pressure exceeds ap-proximately 15 mm Hg, the chest radiograph shows upper-zone vascular redistribution, such that the vessels supplying the upper lobes of the lung are larger than those supplying the lower lobes (see Fig. 3.5). This is explained as follows: when a patient is in the upright posi-tion, blood fl ow is normally greater to the lung bases than to the apices because of the effect of gravity. Redistribution of fl ow occurs with the development of interstitial and perivascular edema, because such edema is most prominent at the lung bases (where the hydrostatic pres-sure is the highest), such that the blood vessels
77237_ch09.indd 23477237_ch09.indd 234 8/11/10 8:13:45 AM8/11/10 8:13:45 AM
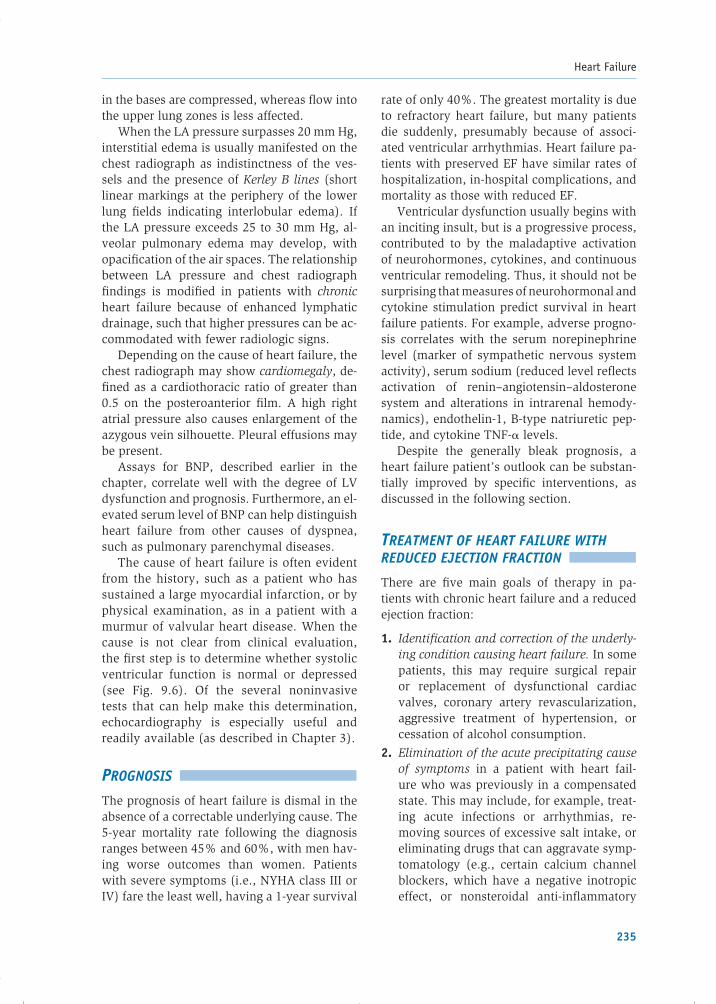
Heart Failure
235
in the bases are compressed, whereas fl ow into the upper lung zones is less affected.
When the LA pressure surpasses 20 mm Hg, interstitial edema is usually manifested on the chest radiograph as indistinctness of the ves-sels and the presence of Kerley B lines (short linear markings at the periphery of the lower lung fi elds indicating interlobular edema). If the LA pressure exceeds 25 to 30 mm Hg, al-veolar pulmonary edema may develop, with opacifi cation of the air spaces. The relationship between LA pressure and chest radiograph fi ndings is modifi ed in patients with chronic heart failure because of enhanced lymphatic drainage, such that higher pressures can be ac-commodated with fewer radiologic signs.
Depending on the cause of heart failure, the chest radiograph may show cardiomegaly, de-fi ned as a cardiothoracic ratio of greater than 0.5 on the posteroanterior fi lm. A high right atrial pressure also causes enlargement of the azygous vein silhouette. Pleural effusions may be present.
Assays for BNP, described earlier in the chapter, correlate well with the degree of LV dysfunction and prognosis. Furthermore, an el-evated serum level of BNP can help distinguish heart failure from other causes of dyspnea, such as pulmonary parenchymal diseases.
The cause of heart failure is often evident from the history, such as a patient who has sustained a large myocardial infarction, or by physical examination, as in a patient with a murmur of valvular heart disease. When the cause is not clear from clinical evaluation, the fi rst step is to determine whether systolic ventri cular function is normal or depressed (see Fig. 9.6). Of the several noninvasive tests that can help make this determination, echocardiography is especially useful and readily available (as described in Chapter 3).
PROGNOSIS
The prognosis of heart failure is dismal in the absence of a correctable underlying cause. The 5-year mortality rate following the diagnosis ranges between 45% and 60%, with men hav-ing worse outcomes than women. Patients with severe symptoms (i.e., NYHA class III or IV) fare the least well, having a 1-year survival
rate of only 40%. The greatest mortality is due to refractory heart failure, but many patients die suddenly, presumably because of associ-ated ventricular arrhythmias. Heart failure pa-tients with preserved EF have similar rates of hospitalization, in-hospital complications, and mortality as those with reduced EF.
Ventricular dysfunction usually begins with an inciting insult, but is a progressive process, contributed to by the maladaptive activation of neurohormones, cytokines, and continuous ventricular remodeling. Thus, it should not be surprising that measures of neurohormonal and cytokine stimulation predict survival in heart failure patients. For example, adverse progno-sis correlates with the serum norepinephrine level (marker of sympathetic nervous system activity), serum sodium (reduced level refl ects activation of renin–angiotensin– aldosterone system and alterations in intrarenal hemody-namics), endothelin-1, B-type natriuretic pep-tide, and cytokine TNF- levels.
Despite the generally bleak prognosis, a heart failure patient’s outlook can be substan-tially improved by specifi c interventions, as discussed in the following section.
TREATMENT OF HEART FAILURE WITH REDUCED EJECTION FRACTION
There are fi ve main goals of therapy in pa-tients with chronic heart failure and a reduced ejection fraction:
1. Identifi cation and correction of the underly-ing condition causing heart failure. In some patients, this may require surgical repair or replacement of dysfunctional cardiac valves, coronary artery revascularization, aggressive treatment of hypertension, or cessation of alcohol consumption.
2. Elimination of the acute precipitating cause of symptoms in a patient with heart fail-ure who was previously in a compensated state. This may include, for example, treat-ing acute infections or arrhythmias, re-moving sources of excessive salt intake, or eliminating drugs that can aggravate symp-tomatology (e.g., certain calcium channel blockers, which have a negative inotropic effect, or nonsteroidal anti- infl ammatory
77237_ch09.indd 23577237_ch09.indd 235 8/11/10 8:13:45 AM8/11/10 8:13:45 AM

Chapter 9
236
drugs, which can contribute to volume retention).
3. Management of heart failure symptoms:
a. Treatment of pulmonary and systemic vascular congestion. This is most readily accomplished by dietary sodium restric-tion and diuretic medications.
b. Measures to increase forward cardiac output and perfusion of vital organs through the use of vasodilators and pos-itive inotropic drugs.
4. Modulation of the neurohormonal response to prevent adverse ventricular remodel-ing in order to slow the progression of LVdysfunction.
5. Prolongation of long-term survival. There is strong evidence from clinical trials that lon-gevity is enhanced by specifi c therapies, as described below.
Diuretics
The mechanisms of action of diuretic drugs are summarized in Chapter 17. By promoting the elimination of sodium and water through the kidney, diuretics reduce intravascular volume and thus venous return to the heart. As a result, the preload of the left ventricle is decreased, and its diastolic pressure falls out of the range that promotes pulmonary con-gestion (Fig. 9.10, point b). The intent is to
Figure 9.10. The effect of treatment on the left ventricular (LV) Frank–Starling curve in patients who have heart failure with reduced EF. Point a represents the failing heart on a curve that is shifted downward compared with normal. The stroke volume is reduced (with blood pressure bordering on hypotension), and the LV end-diastolic pressure (LVEDP) is increased, resulting in symptoms of pulmonary congestion. Therapy with a diuretic or pure venous vasodilator (point b on the same Frank–Starling curve) reduces LV pressure without much change in stroke volume (SV). However, exces-sive diuresis or venous vasodilatation may result in an undesired fall in SV with hypotension (point b�). Inotropic drug therapy (point c) and arteriolar (or “balanced”) vasodilator therapy (point d) augment SV, and because of improved LV emptying during contraction, the LVEDP lessens. Point e repre-sents the potential added benefi t of combining an inotrope and vasodilator together. The middle curve shows one example of how the Frank–Starling relationship shifts upward during inotropic/vasodilator therapy but does not achieve the level of a normal ventricle.
Left ventricular end-diastolic pressure(or end-diastolic volume)
Pulmonary congestion
Hyp
oten
sion
Str
oke
volu
me
(or
card
iac
outp
ut)
Normal
Heart failure
ec
a
d
b́b
77237_ch09.indd 23677237_ch09.indd 236 8/11/10 8:13:45 AM8/11/10 8:13:45 AM

Heart Failure
237
reduce the end-diastolic pressure (and there-fore hydrostatic forces contributing to pulmo-nary congestion) without a signifi cant fall in stroke volume. The judicious use of diuretics does not signifi cantly reduce stroke volume and cardiac output in this setting, because the failing ventricle is operating on the “fl at” portion of a depressed Frank–Starling curve. However, overly vigorous diuresis can lower LV fi lling pressures into the steep portion of the ventricular performance curve, resultingin an undesired fall in cardiac output (seeFig. 9.10, point b�). Thus, diuretics should be used only if there is evidence of pulmonary congestion (rales) or peripheral interstitial fl uid accumulation (edema).
Agents that act primarily at the renal loop of Henle (e.g., furosemide, torsemide, and bumetanide) are the most potent diuretics in heart failure. Thiazide diuretics (e.g., hydro-chlorothiazide and metolazone) are also useful but are less effective in the setting of decreased renal perfusion, which is often present in this condition.
The potential adverse effects of diuretics are described in Chapter 17. The most important in heart failure patients include overly vigor-ous diuresis resulting in a fall in cardiac out-put, and electrolyte disturbances (particularly hypokalemia and hypomagnesemia), which may contribute to arrhythmias.
Vasodilators
One of the most important cardiac advances in the late twentieth century was the introduc-tion of vasodilator therapy for the treatment of heart failure, particularly the class of agents known as ACE inhibitors. As indicated earlier, neurohormonal compensatory mechanisms in heart failure often lead to excessive vaso-constriction, volume retention, and ventri cular remodeling, with progressive deterioration of cardiac function. Vasodilator drugs help to reverse these adverse consequences. More-over, multiple studies have shown that cer-tain vasodilator regimens signifi cantly extend survival in patients with heart failure. The pharmacology of these drugs is described in Chapter 17.
Venous vasodilators (e.g., nitrates) increase venous capacitance, and thereby decrease ve-nous return to the heart and left ventricular preload. Consequently, LV diastolic pressures fall and the pulmonary capillary hydrostatic pressure declines, similar to the hemodynamic effects of diuretic therapy. As a result, pulmo-nary congestion improves, and as long as the heart failure patient is on the relatively “fl at” part of the depressed Frank–Starling curve (see Fig. 9.10), the cardiac output does not fall despite the reduction in ventricular fi lling pressure. However, venous vasodilatation in a patient who is operating on the steeper part of the curve may result in an undesired fall in stroke volume, cardiac output, and blood pressure.
Pure arteriolar vasodilators (e.g., hydral-azine) reduce systemic vascular resistance and therefore LV afterload, which in turn permits increased ventricular muscle fi ber shortening during systole (see Fig. 9.5B). This results in an augmented stroke volume and is represented on the Frank–Starling diagram as a shift in an upward direction (see Fig. 9.10). Although an arterial vasodilator might be ex-pected to reduce blood pressure—an unde-sired effect in patients with heart failure who may already be hypotensive—this generally does not happen. As resistance is reduced by arteriolar vasodilatation, a concurrent rise in cardiac output usually occurs, such that blood pressure remains constant or decreases only mildly.
Some groups of drugs result in vaso-dilatation of both the venous and arteriolar circuits (“balanced” vasodilators). Of these, the most important are agents that inhibit the renin– angiotensin–aldosterone system. ACE inhibitors (described in Chapters 13 and 17) interrupt the production of AII, thereby mod-ulating the vasoconstriction incited by that hormone in heart failure patients. In addition, because aldosterone levels fall in response to ACE inhibitor therapy, sodium elimination is facilitated, resulting in reduced intravascular volume and improvement of systemic andpulmonary vascular congestion. ACE inhibi-tors also augment circulating levels of brady-kinin (see Chapter 17), which is thought to
77237_ch09.indd 23777237_ch09.indd 237 8/11/10 8:13:45 AM8/11/10 8:13:45 AM

Chapter 9
238
contribute to benefi cial vasodilation in heart failure. As a result of these effects, ACE inhibi-tors limit maladaptive ventricular remodel-ing in patients with chronic heart failure andfollowing acute myocardial infarction (see Chapter 7).
Supporting the benefi cial hemodynamic and neurohormonal blocking effects of ACE in-hibitors, many large clinical trials have shown that these drugs reduce heart failure symp-toms, improve stamina, reduce the need for hospitalization, and most importantly, extend survival in patients with heart failure with re-duced EF. Thus, ACE inhibitors are standard fi rst-line chronic therapy for patients with LV systolic dysfunction.
The renin–angiotensin–aldosterone system can also be therapeutically inhibited by angio-tensin II receptor blockers (ARBs), as de-scribed in Chapters 13 and 17. Since AII can be formed by pathways other than ACE, ARBs pro-vide a more complete inhibition of the system than ACE inhibitors, through blockade of the actual AII receptor (see Fig. 17.6). Conversely, ARBs do not stimulate the potentially benefi -cial rise in serum bradykinin. The net result is that the hemodynamic effects of ARBs in heart failure are similar to those of ACE inhibitors, and studies thus far have not shown any supe-riority of these agents over ACE inhibitors in terms of patient survival. Thus, they are pre-scribed to heart failure patients mainly when ACE inhibitors are not tolerated (e.g., because of the common side effect of cough).
Chronic therapy using the combination of the venous dilator isosorbide dinitrate plus the arteriolar dilator hydralazine has also been shown to improve survival in patients with moderate symptoms of heart failure. However, when administration of the ACE inhibitor enalapril was compared with the hydralazine–isosorbide dinitrate (H-ISDN) combination, the ACE inhibitor was shown to produce the greater improvement in survival. Thus, H-ISDN is generally substituted when a patient cannot tolerate ACE inhibitor or ARB therapy (e.g., because of renal insuffi ciency or hyperkalemia). Of note, H-ISDN has been shown to have particular benefi t in certain individuals with heart failure. The African–American Heart Failure trial demonstrated
that the addition of H-ISDN to standard heart failure therapy (including a diuretic, �-blocker, ACE inhibitor, or ARB) in black patients with heart failure further improved functional sta-tus and survival.
Nesiritide (human recombinant B-type natriuretic peptide) is an intravenous vasodila-tor drug available for hospitalized patients with decompensated heart failure. It causes rapid and potent vasodilatation, reduces elevated intracardiac pressures, augments forward cardiac output, and lessens the activation of the renin-angiotensin-aldosterone and sympa-thetic nervous systems. It promotes diuresis, reduces heart failure symptoms, and can be combined with diuretics and positive inotro-pic drugs. However, it is an expensive drug, and recent evidence has raised questions about its safety. One analysis shows that pa-tients treated with nesiritide are more likely to die over the following month than are those receiving traditional heart failure therapies. Therefore, nesiritide is currently used primar-ily in patients who have not responded to or cannot tolerate other intravenous vasodilators, such as intravenous nitroglycerin or nitroprus-side (see Chapter 17).
Inotropic Drugs
The inotropic drugs include �-adrenergic agonists, digitalis glycosides, and phospho-diesterase inhibitors (see Chapter 17). By increasing the availability of intracellular cal-cium, each of these drug groups enhances the force of ventricular contraction and therefore shifts the Frank–Starling curve in an upward direction (see Fig. 9.10). As a result, stroke volume and cardiac output are augmented at any given ventricular end-diastolic vol-ume. Therefore, these agents may be useful in treating patients with systolic dysfunction but typically not those with heart failure with preserved EF.
The �-adrenergic agonists (e.g., dobu-tamine and dopamine) are administered intravenously for temporary hemodynamic support in acutely ill, hospitalized patients. Their long-term use is limited by the lack of an oral form of administration and by the rapid development of drug tolerance. The latter
77237_ch09.indd 23877237_ch09.indd 238 8/11/10 8:13:45 AM8/11/10 8:13:45 AM

Heart Failure
239
refers to the progressive decline in effective-ness during continued administration of the drug, possibly owing to downregulation of myocardial adrenergic receptors. Likewise, the role of phosphodiesterase inhibitors (e.g., milrinone) is limited to the intravenous treatment of congestive heart failure in acutely ill patients. Despite the initial promise of effective oral phosphodiesterase inhibitors, studies thus far actually demonstrate reduced survival among patients receiving this form of treatment.
One of the oldest forms of inotropic therapy is digitalis (see Chapter 17), which can be administered intravenously or orally. Digitalis preparations enhance contractility, reduce cardiac enlargement, improve symptoms, and augment cardiac output in patients with systolic heart failure. Digitalis also increases the sensitivity of the baroreceptors, so that the compensatory sympathetic drive in heart failure is blunted, a desired effect that reduces left ventricular afterload. By slowing AV nodal conduction and thereby reducing the rate of ventricular contractions, digitalis has an added benefi t in patients with congestive heart fail-ure who have concurrent atrial fi brillation. Although digitalis can improve symptomatol-ogy and reduce the rate of hospitalizations in heart failure patients, it has not been shown to improve long-term survival. Its use is thuslimited to patients who remain symptomatic despite other standard therapies or to help slow the ventricular rate if atrial fi brillation is also present. Digitalis is not useful in the treatment of heart failure with preserved EF because it does not improve ventricular relax-ation properties.
�-Blockers
Historically, �-blockers were contraindi-cated in patients with systolic dysfunction because the negative inotropic effect of the drugs would be expected to worsen symp-tomatology. Paradoxically, more recent stud-ies have actually shown that �-blockers have important benefi ts in heart failure, including augmented cardiac output, reduced hemo-dynamic deterioration, and improved survival. The explanation for this observation remains
conjectural but may relate to the drugs’ effect on reducing heart rate and blunting chronic sympathetic activation, or to their anti-ischemic properties.
In clinical trials of patients with symptom-atic heart failure with reduced EF, �-blockers have been well tolerated in stable patients (i.e., those without recent deterioration of symptoms or active signs of volume overload) and have resulted in improved mortality rates and fewer hospitalizations compared with placebo. Not all �-blockers have been tested in heart failure. Those that have, and have shown benefi t in randomized clinical trials include carvedilol (a nonselective �1- and �2-receptor blocker with weak -blocking prop-erties) and the �1-selective metoprolol (in a sustained-release formulation). Despite these benefi ts, �-blockers must be used cautiously in heart failure to prevent acute deteriora-tion due to their potentially negative inotropiceffect. Regimens should be started at lowdosages and augmented gradually.
Aldosterone Antagonist Therapy
There is evidence that chronic excess of aldo-sterone in heart failure contributes to cardiac fi brosis and adverse ventricular remodeling. Antagonists of this hormone (which have been used historically as mild diuretics—see Chapter 17) have shown clinical benefi t in heart failure patients. For example, in a clini-cal trial of patients with advanced heart failure who were already taking an ACE inhibitor and diuretics, the aldosterone receptor antagonist spironolactone substantially reduced mor-tality rates and improved heart failure symp-toms. Eplerenone, a more specifi c aldosterone receptor inhibitor, has been shown to improve survival of patients with congestive heart fail-ure after an acute myocardial infarction (see Chapter 7). Although aldosterone antagonists are well tolerated in carefully controlled stud-ies, the serum potassium level must be closely monitored to prevent hyperkalemia, especially if there is renal impairment or concomitant ACE inhibitor therapy.
In summary, standard therapy of chronic heart failure with reduced EF should include
77237_ch09.indd 23977237_ch09.indd 239 8/11/10 8:13:45 AM8/11/10 8:13:45 AM

Chapter 9
240
several drugs, the cornerstones of which are an ACE inhibitor and a �-blocker. An ac-cepted sequence of therapy is to start with an ACE inhibitor, as well as a diuretic if pul-monary or systemic congestive symptoms are present. If the patient is unable to tolerate the ACE inhibitor, then an ARB (or hydralazine plus isosorbide dinitrate) may be substituted. For patients without recent clinical deteriora-tion or volume overload, a �-blocker should be added. Those with advanced heart failure may benefi t from the addition of an aldo-sterone antagonist. For persistent symptoms, digoxin can be prescribed for its hemo dynamic benefi t.
Additional Therapies
Other therapies sometimes administered to patients with heart failure and reduced EF in-clude (1) chronic anticoagulation with war farin to prevent intracardiac thrombus formation if LV systolic function is severely impaired (a controversial therapy in the absence of other indications for anticoagulation, because this approach has not yet been tested in clini-cal trials) and (2) treatment of atrial and ventricular arrhythmias that frequently ac-company chronic heart failure. For example, atrial fi brillation is very common in heart fail-ure, and conversion back to sinus rhythm can substantially improve cardiac output. Ventri-cular arrhythmias are also frequent in this population and may lead to sudden death. The antiarrhythmic drug that is most effective at suppressing arrhythmias and least likely to provoke other dangerous rhythm disorders in heart failure patients is amiodarone. How-ever, studies of amiodarone for treatment of asymptomatic ventricular arrhythmias in heart failure have not shown a consistent survival benefi t. In addition, heart failure patients with symptomatic or sustained ventricular ar-rhythmias, or those with inducible ventricular tachycardia during electrophysiologic testing, benefi t more from the insertion of an implant-able cardioverter-defi brillator (ICD; see Chap-ter 11). Based on the results of large-scale randomized trials, ICD implantation is indi-cated for many patients with chronic ischemic or nonischemic dilated cardiomyopathies and
at least moderately reduced systolic function (e.g., left ventricular ejection fraction �35%), regardless of the presence of ventricular ar-rhythmias, because this approach reduces the likelihood of sudden cardiac death in this population.
Cardiac Resynchronization Therapy
Intraventricular conduction abnormalities with widened QRS complexes (especially left bundle branch block) are common in patients with advanced heart failure. Such abnormalities can actually contribute to cardiac symptoms because of the uncoor-dinated pattern of right and left ventricular contraction. Advanced pacemakers have therefore been developed that stimulate both ventricles simultaneously, thus resyn-chronizing the contractile effort. This tech-nique of biventricular pacing, also termed cardiac resynchronization therapy (CRT), has been shown to augment left ventri cular systolic function, improve exercise capac-ity, and reduce the frequency of heart fail-ure exacerbations and mortality. Thus, CRT is appropriate for selected patients with advanced systolic dysfunction (LV ejection fraction �35%), a prolonged QRS duration (120 msec) and continued symptoms of heart failure despite appropriate pharmaco-logic therapies. Since patients who receive CRT are typically also candidates for an ICD, modern devices combine both functions in a single, small implantable unit.
Cardiac Replacement Therapy
A patient with severe LV dysfunction whose condition remains refractory to maximal medical management may be a candidate for cardiac transplantation. Because of a short-age of donor hearts, only approximately 3,000 transplants are performed worldwide each year, much fewer than the number of patients with refractory heart failure symptoms. Thus, alternative heart support therapies are in se-lected use and are undergoing further intense development, including ventricular mechani-cal assist devices and implanted artifi cial hearts.
77237_ch09.indd 24077237_ch09.indd 240 8/11/10 8:13:45 AM8/11/10 8:13:45 AM

Heart Failure
241
TREATMENT OF HEART FAILURE WITH PRESERVED EJECTION FRACTION
The goals of therapy in heart failure with pre-served EF include (1) the relief of pulmonary and systemic congestion, and (2) addressing correctable causes of the impaired diastolic function (e.g., hypertension, coronary artery disease). Diuretics reduce pulmonary conges-tion and peripheral edema but must be used cautiously to avoid under fi lling of the left ventricle. A stiffened left ventricle relies on higher-than-normal pressures to achieve ad-equate diastolic fi lling (see Fig. 9.7B) and ex-cessive diuresis could reduce fi lling and stroke volume (see Fig. 9.10).
Unlike patients with impaired systolic func-tion, �-blockers, ACE inhibitors, and ARBs have no demonstrated mortality benefi t in patients with heart failure with preserved EF. Additionally, since contractile function is pre-served, inotropic drugs have no role in this condition.
ACUTE HEART FAILURE
In contrast to the fi ndings of chronic heart fail-ure described to this point, patients with acute heart failure are those who present with urgent and often life-threatening symptomatology. Acute heart failure may develop in a previously asymptomatic patient (e.g., resulting from an acute coronary syndrome [Chapter 7], severe hypertension [Chapter 13], or acute valvular regurgitation [Chapter 8]), or it may complicate chronic compensated heart failure following a precipitating trigger (see Table 9.3). Manage-ment of acute heart failure typically requires hospitalization and prompt interventions.
The classifi cation of patients with acute heart failure, and the approach to therapy, can be tailored based on the presence or absence of two major fi ndings at the bedside: (1) volume overload (i.e., “wet” vs. “dry”) as a refl ection of elevated LV fi lling pressures, and (2) signs of decreased cardiac output with reduced tis-sue perfusion (“cold” vs. “warm” extremities). Examples of a “wet” profi le, indicative of vol-ume overload, include: pulmonary rales, jugu-lar venous distension, and edema of the lower extremities. Figure 9.11 shows how patients
Figure 9.11. Hemodynamic profi les in acute heart fail-ure. (Derived from Nohria A, Tsang SW, Fang JC, et al. Clinical assessment identifi es hemodynamic profi les that predict outcomes in patients admitted with heart failure. J Am Coll Cardiol. 2003;41:1797–1804.)
NO YES
NO
YES
Profile A“Warm and Dry”
Profile B“Warm and Wet”
Profile L“Cold and Dry”
Profile C“Cold and Wet”
↑ LV-filling Pressures(Pulmonary and/or Systemic Congestion)
Red
uced
Car
diac
Out
put
and
Vas
ocon
stric
tion
with acute heart failure can be divided into four profi les based on observations of these parameters.
Profi le A indicates normal hemodynamics. Cardiopulmonary symptoms in such patients would be due to factors other than heart fail-ure, such as parenchymal lung disease or tran-sient myocardial ischemia. Profi les B and C are typical of patients with acute pulmonary edema (described below). Those with Profi le B have “wet” lungs but preserved (“warm”) tissue perfusion. Profi le C is more serious; in addition to congestive fi ndings, impaired forward cardiac output results in marked systemic vasoconstriction (e.g., activation of the sympathetic nervous system) and there-fore “cold” extremities. Patients with Profi le C have a prognosis worse than those with Pro-fi le B, who in turn have poorer outcomes than those with Profi le A.
Patients with Profi le L do not represent an extension of this continuum. Rather, they display “cold” extremities due to low output (hence the label “L”) but no signs of vascular congestion. This profi le may arise in patients who are actually volume deplete, or those with very limited cardiac reserve in the ab-sence of volume overload (e.g., a patient with a dilated left ventricle and mitral regurgitation who becomes short of breath with activity be-cause of the inability to generate adequate for-ward cardiac output). These profi les of acute heart failure should not be confused with the
77237_ch09.indd 24177237_ch09.indd 241 8/11/10 8:13:45 AM8/11/10 8:13:45 AM

Chapter 9
242
classifi cation of chronic heart failure (Stages A through D) presented in Table 9.6.
The goals of therapy in acute heart failure are to (1) normalize ventricular fi lling pres-sures and (2) restore adequate tissue per-fusion. Identifi cation of the patient’s profi le type guides therapeutic interventions. For example, a patient with Profi le B would re-quire diuretic and/or vasodilator therapy for pulmonary edema (described in the next sec-tion), and those with Profi le C may addition-ally require intravenous inotropic medications to strengthen cardiac output. Patients with Profi le L may require volume expansion. The presence of profi le A would prompt a search for contributions to the patient’s symptoms other than heart failure.
Acute Pulmonary Edema
A common manifestation of acute left-sided heart failure (e.g., typical of Profi les B and C) is cardiogenic pulmonary edema, in which elevated capillary hydrostatic pressure causes rapid accumulation of fl uid within the inter-stitium and alveolar spaces of the lung. In the presence of normal plasma oncotic pressure, pulmonary edema develops when the pulmo-nary capillary wedge pressure, which refl ects LV diastolic pressure, exceeds approximately 25 mm Hg.
This condition is frequently accompanied by hypoxemia because of shunting of pul-monary blood fl ow through regions of hypo-ventilated alveoli. Like other manifestations of acute heart failure, pulmonary edema may appear suddenly in a previously asymptomatic person (e.g., in the setting of an acute myo-cardial infarction) or in a patient with chronic compensated congestive heart failure follow-ing a precipitating event (see Table 9.3). Pul-monary edema is a horrifying experience for the patient, resulting in severe dyspnea and anxiety while struggling to breathe.
On examination, the patient is tachy-cardic and may demonstrate cold, clammy skin owing to peripheral vasoconstriction in response to increased sympathetic outfl ow (i.e., Profi le C). Tachypnea and coughing of “frothy” sputum represent transudation of fl uid into the alveoli. Rales are present
initially at the bases and later throughout the lung fi elds, sometimes accompanied by wheezing because of edema within the con-ductance airways.
Pulmonary edema is a life-threatening emergency that requires immediate improve-ment of systemic oxygenation and elimina-tion of the underlying cause. The patient should be seated upright to permit pooling of blood within the systemic veins of the lower body, thereby reducing venous return to the heart. Supplemental oxygen is provided by a face mask. Morphine sulfate is adminis-tered intravenously to reduce anxiety and as a venous dilator to facilitate pooling of blood peripherally. A rapidly acting diuretic, such as intravenous furosemide, is administered to further reduce LV preload and pulmonary capillary hydrostatic pressure. Other means of reducing preload include administration of nitrates (often intravenously). Intra-venous inotropic drugs (e.g., dopamine—see Chapter 17) may increase forward CO and are used primarily in patients with Profi le C. During resolution of the pulmonary con-gestion and hypoxemia, attention should be directed at identifying and treating the un-derlying precipitating cause.
An easy-to-remember mnemonic for the principal components of management of pul-monary edema is the alphabetic sequence LMNOP:
Lasix (trade name for furosemide)
Morphine
Nitrates
Oxygen
Position (sit upright)
SUMMARY
1. Heart failure is present when cardiac out-put fails to meet the metabolic demands of the body or meets those demands only if the cardiac fi lling pressures are abnor-mally high. Chronic heart failure may be classifi ed into two categories: (1) heart failure with reduced EF (impaired left ventri cular systolic function) and (2) heart failure with preserved EF (e.g., diastolic dysfunction).
77237_ch09.indd 24277237_ch09.indd 242 8/11/10 8:13:45 AM8/11/10 8:13:45 AM

Heart Failure
243
2. Compensatory mechanisms in heart failure that initially maintain circulatory function include (1) preload augmentation with in-creased stroke volume via the Frank–Starling mechanism, (2) activation of neurohormonal systems, and (3) ventricular hypertrophy. However, these compensations eventually become maladaptive, contributing to adverse ventricular remodeling and progressive dete-rioration of ventricular function.
3. Symptoms of heart failure may be exacer-bated by precipitating factors that increase metabolic demand, increase circulating vol-ume, raise afterload, or decrease contractil-ity (summarized in Table 9.3).
4. Treatment of heart failure includes identi-fi cation of the underlying cause of the con-dition, elimination of precipitating factors, and modulation of neurohormonal activa-tions. Standard treatment of heart failure patients with reduced EF includes an ACE inhibitor, �-blocker and, as needed, diuret-ics and inotropic drugs. For patients who do not tolerate an ACE inhibitor, an ARB or the combination of hydralazine plus nitrates can be substituted. The addition of spirono-lactone should be considered for patients with advanced heart failure. In patients with advanced disease who meet specifi c criteria, CRT (biventricular pacing) and/or insertion of an ICD should be considered.
5. Therapy for heart failure with preserved EF relies primarily on diuretics and vaso-dilators to relieve pulmonary congestion. Such therapy must be administered cau-tiously to avoid excess reduction of preload and hypotension.
6. Acute heart failure can be characterized by, and treatment decisions based on, the pres-ence or absence of (1) elevated left heart fi ll-ing pressures (wet vs. dry) and (2) reduced systemic tissue perfusion with elevated sys-temic vascular resistance (i.e., cold vs. warm) as in Figure 9.11.
Acknowledgments
Contributors to the previous editions of this chapter were Ravi V. Shah, MD; Arthur Coday Jr, MD; George S. M. Dyer, MD; Stephen K. Frankel, MD; Vikram Janakiraman, MD; and Michael A. Fifer, MD.
Additional Reading
Braunwald, E. Biomarkers in heart failure. N Engl J Med. 2008;358:2148–2159.
Dec GW, ed. Heart Failure: A Comprehensive Guide to Diagnosis and Treatment. New York: Marcel Dekker; 2005.
Dickstein K, Cohen-Solal A, Filippatos G, et al. ESC Guidelines for the diagnosis and treatment of acute and chronic heart failure 2008: the Task Force for the Diagnosis and Treatment of Acute and Chronic Heart Failure 2008 of the European Society of Cardi-ology. Eur Heart J. 2008;29:2388–2442.
Hsich EM, Pina IL. Heart failure in women. J Am Coll Cardiol. 2009;54:491–498.
Jessup M, Abraham WT, Casey DE, et al. 2009 Focused update: ACCF/AHA guidelines for the diagnosis and management of heart failure in adults: a report of the American College of Cardiology Foundation/American Heart Association Task Force on Practice Guidelines. Circulation. 2009;119:1977–2016.
Maeder MT, Kaye DM. Heart failure with normal left ventricular ejection fraction. J Am Coll Cardiol. 2009;53:905–918.
McMurray JJV. Systolic heart failure. N Engl J Med. 2010;362:228–238.
Ramani GV, Uber PA, Mehra MR. Chronic heart fail-ure: contemporary diagnosis and management. Mayo Clin. Proc. 2010;85:180–195.
Schocken DD, Benjamin EJ, Fonarow GC, et al. Prevention of heart failure: a scientifi c statement from the American Heart Association councils on epidemiology and prevention, clinical cardiology, cardiovascular nursing, and high blood pressure research; quality of care and outcomes research interdisciplinary working group; and functional genomics and translational biology interdisciplinary working group. Circulation. 2008;117:2544–2565.
Triposkiadis F, Karayannis G, Giamouzis G, et al. The sympathetic nervous system in heart failure: physiology, pathophysiology, and clinical impli-cations. J Am Coll Cardiol. 2009;54:1747–1762.
Walsh RA., ed. Molecular Mechanisms of Cardiac Hypertrophy and Failure. New York: Taylor & Francis; 2005.
Wang J, Nagueh SF. Current perspectives on cardiac function in patients with diastolic heart failure. Circulation. 2009;119:1146–1157.
Ware LB, Matthay MA. Acute pulmonary edema. N Engl J Med. 2005;353:2788–96.
Wilson SR, Givertz MM, Stewart GC, et al. Ventri-cular assist devices. J Am Coll Cardiol. 2009;54: 1647–1659.
77237_ch09.indd 24377237_ch09.indd 243 8/11/10 8:13:45 AM8/11/10 8:13:45 AM

244
C H A P T E R
10The CardiomyopathiesChristopher T. LeeG. William DecLeonard S. Lilly
DILATED CARDIOMYOPATHYEtiologyPathologyPathophysiologyClinical FindingsPhysical ExaminationDiagnostic StudiesTreatmentPrognosis
HYPERTROPHIC CARDIOMYOPATHYEtiologyPathologyPathophysiologyClinical Findings
Physical ExaminationDiagnostic StudiesTreatmentPrognosis
RESTRICTIVE CARDIOMYOPATHYPathophysiologyClinical FindingsPhysical ExaminationDiagnostic StudiesTreatment
and abnormal physiology of the left ventri-cle (LV) (Fig. 10.1). Dilated cardiomyopathy is characterized by ventricular chamber enlargement with impaired systolic contrac-tile function; hypertrophic cardiomyo pathy, by an abnormally thickened ventricular wall with abnormal diastolic relaxation but usually intact systolic function; and restrictive cardiomyopathy, by an abnor-mally stiffened myocardium (because of fi brosis or an infi ltrative process) leading to impaired diastolic relaxation, but sys-tolic contractile function is normal or near normal.
The cardiomyopathies are a group of heart disorders in which the major structural
abnormality is limited to the myocardium. These conditions often result in symptoms of heart failure, and although the underlying cause of myocardial dysfunction can sometimes be identifi ed, the etiology frequently remains un-known. Excluded from the classifi cation of this group of diseases is heart muscle impairment resulting from other defi ned cardio vascular conditions, such as hypertension, valvular dis-orders, or coronary artery disease.
Cardiomyopathies can be classifi ed into three types based on the anatomic appearance
77237_ch10.indd 24477237_ch10.indd 244 8/11/10 8:14:50 AM8/11/10 8:14:50 AM

The Cardiomyopathies
245
DILATED CARDIOMYOPATHY
Etiology
Myocyte damage and cardiac enlargement in di-lated cardiomyopathy (DCM) result from a wide spectrum of genetic, infl ammatory, toxic, and metabolic causes (Table 10.1). Although most cases are idiopathic (i.e., the cause is undeter-mined), examples of defi ned conditions that are associated with DCM include viral myocarditis, chronic excessive alcohol ingestion, the peri-partum state, and specifi c gene mutations.
Acute viral myocarditis generally affl icts young, previously healthy people. Com-mon responsible infecting organisms include c oxsackievirus group B, parvovirus B19, and adenovirus, among many others. Viral myo-carditis is usually a self-limited illness with full recovery, but for unknown reasons, some pa-tients progress to DCM. It is hypothesized that myocardial destruction and fi brosis result from immune-mediated injury triggered by viral constituents. Nonetheless, immunosuppres-sive drugs have not been shown to improve
Figure 10.1. Anatomic appearance of the cardiomyopathies (CMPs). A. Normal heart demonstrating left ventricle (LV) and left atrium (LA). B. Dilated CMP is characterized by prominent ventricular enlarge-ment with only mildly increased thickness. C. Hypertrophic CMP demonstrates signifi cant ventricular hypertrophy, often asymmetrically involving the intraventricular septum. D. Restrictive CMP is caused by infi ltration or fi brosis of the ventricles, usually without chamber enlargement. LA enlargement is common to all three types of CMP.
A. NORMAL B. DILATEDCARDIOMYOPATHY
LV
LA
Aorta
D. RESTRICTIVE CARDIOMYOPATHY
C. HYPERTROPHICCARDIOMYOPATHY
Infiltrated or fibrotic LV
Dilated LVwith minimalhypertrophy
Marked LVhypertrophy
77237_ch10.indd 24577237_ch10.indd 245 8/11/10 8:14:50 AM8/11/10 8:14:50 AM

Chapter 10
246
the prognosis of this condition. Transvenous right ventricular biopsy during acute myo-carditis may demonstrate active infl ammation, but specifi c viral genomic sequences have been demonstrated in only a minority of patients.
Alcoholic cardiomyopathy develops in a small number of people who consume alco-holic beverages excessively and chronically. Although the pathophysiology of the condition is unknown, ethanol is thought to impair cellu-lar function by inhibiting mitochondrial oxida-tive phosphorylation and fatty acid oxidation. Its clinical presentation and histologic features are similar to those of other dilated cardiomyo-pathies. Alcoholic cardiomyopathy is important to identify because it is potentially reversible; cessation of ethanol consumption can lead to dramatic improvement of ventricular function.
Peripartum cardiomyopathy is a form of DCM that presents with heart failure symp-toms between the last month of pregnancy and up to 6 months postpartum. Risk factors include older maternal age, being African American, and having multiple pregnancies. A unifying etiology of this condition has not yet been identifi ed. Ventricular function returns to normal in approximately 50% of affected women in the months following pregnancy,
but recurrences of DCM with subsequent preg-nancies have been reported. Other potentially reversible causes of DCM include other toxin exposures, metabolic abnormalities (such as hypothyroidism), and some infl ammatory eti-ologies, including sarcoidosis and connective tissue diseases.
Several familial forms of DCM have been identifi ed and are believed to be responsible for 20% to 30% of what were once classi-fi ed as idiopathic DCM. Autosomal dominant, autosomal recessive, X-linked, and mito-chondrial patterns of inheritance have been described, leading to defects in contractile force generation, force transmission, energy production, and myocyte viability. Identifi ed mutations occur in genes that code for cardiac cytoskeletal, myofi brillar, and nuclear mem-brane proteins (Table 10.2).
Pathology
Marked enlargement of all four cardiac cham-bers is typical of DCM (Fig. 10.2), although sometimes the disease is limited to the left or right side of the heart. The thickness of the ventricular walls may be increased, but cham-ber dilatation is out of proportion to any con-centric hypertrophy. Microscopically, there is evidence of myocyte degeneration with irregular hypertrophy and atrophy of myo-fi bers. Interstitial and perivascular fi brosis is often extensive.
Pathophysiology
The hallmark of DCM is ventricular dilatation with decreased contractile function (Fig. 10.3). Most often in DCM, both ventricles are im-paired, but sometimes dysfunction is limited to the LV and even less commonly to the right ventricle (RV).
As ventricular stroke volume and cardiac output decline because of impaired myocyte contractility, two compensatory effects are ac-tivated: (1) the Frank–Starling mechanism, in which the elevated ventricular diastolic vol-ume increases the stretch of the myofi bers, thereby increasing the subsequent stroke volume; and (2) neurohormonal activation, initially mediated by the sympathetic nervous
Table 10.1. Examples of Dilated Cardiomyopathies
Idiopathic
Familial (genetic)
Infl ammatory Infectious (especially viral) Noninfectious Connective tissue diseases Peripartum cardiomyopathy Sarcoidosis
Toxic Chronic alcohol ingestion Chemotherapeutic agents (e.g., doxorubicin)
Metabolic Hypothyroidism Chronic hypocalcemia or hypophosphatemia
Neuromuscular Muscular or myotonic dystrophy
77237_ch10.indd 24677237_ch10.indd 246 8/11/10 8:14:51 AM8/11/10 8:14:51 AM

The Cardiomyopathies
247
system (see Chapter 9). The latter contributes to an increased heart rate and contractility, which help to buffer the fall in cardiac out-put. These compensations may render the patient asymptomatic during the early stages of ventricular dysfunction; however, as pro-gressive myocyte degeneration and volume
overload ensue, clinical symptoms of heart failure develop.
With a persistent reduction of cardiac out-put, the decline in renal blood fl ow prompts the kidneys to secrete increased amounts of renin. This activation of the renin-angiotensin-aldosterone axis increases peripheral vascular resistance (mediated through angiotensin II) and intravascular volume (because of increased aldosterone). As described in Chapter 9, these effects are also initially helpful in buffering the fall in cardiac output.
Ultimately, however, the “compensatory” effects of neurohormonal activation prove detrimental. Arteriolar vasoconstriction and increased systemic resistance render it more diffi cult for the LV to eject blood in the forward direction, and the rise in intravascular volume further burdens the ventricles, resulting in pul-monary and systemic congestion. In addition, chronically elevated levels of angiotensin II and aldosterone directly contribute to pathological myocardial remodeling and fi brosis.
As the cardiomyopathic process causes the ventricles to enlarge over time, the mitral and tricuspid valves may fail to coapt properly in
Table 10.2. Familial Forms of Dilated and Hypertrophic Cardiomyopathies
Protein
MutationsIdentifi ed in Dilated
Cardiomyopathy
MutationsIdentifi ed in Hypertrophic
Cardiomyopathy
Cytoskeletal Proteins Desmin √ Dystrophin √ Myosin-binding protein C √ √ Sarcoglycans √ Titin √ √
Myofi brillar Proteins �-Myosin heavy chain √ √ Cardiac troponin T √ √ Cardiac troponin I √ √ Cardiac troponin C √ √ �-Tropomyosin √ √ Essential myosin light chain √ Cardiac actin √ √
Nuclear Membrane Protein Lamin A/C √
Figure 10.2. Transverse sections of a normal heart (right) and a heart from a patient with dilated cardio-myopathy (DCM). In the DCM specimen, there is biventri-cular dilatation without a proportional increase in wall thickness. LV, left ventricle; RV, right ventricle. (Modifi ed from Emmanouilides GC, ed. Moss and Adams’ Heart Disease in Infants, Children, and Adolescents. 5th ed. Baltimore, MD: Lippincott Williams & Wilkins; 1995:86.)
77237_ch10.indd 24777237_ch10.indd 247 8/11/10 8:14:51 AM8/11/10 8:14:51 AM

Chapter 10
248
systole, and valvular regurgitation ensues. This regurgitation has three detrimental con-sequences: (1) excessive volume and pressure loads are placed on the atria, causing them to dilate, often leading to atrial fi brillation; (2) regurgitation of blood into the left atrium fur-ther decreases forward stroke volume into the aorta and systemic circulation; and (3) when the regurgitant volume returns to the LV during each diastole, an even greater volume load is presented to the dilated LV.
Clinical Findings
The clinical manifestations of DCM are those of congestive heart failure. The most common symptoms of low forward cardiac output in-clude fatigue, lightheadedness, and exertional dyspnea associated with decreased tissue perfu-sion. Pulmonary congestion results in dyspnea, orthopnea, and paroxysmal nocturnal dyspnea, whereas chronic systemic venous congestion causes ascites and peripheral edema. Because these symptoms may develop insidiously, the patient may complain only of recent weight gain (because of interstitial edema) and short-ness of breath on exertion.
Physical Examination
Signs of decreased cardiac output are often present and include cool extremities (owing
to peripheral vasoconstriction), low arterial pressure, and tachycardia. Pulmonary venous congestion results in auscultatory crackles (rales), and basilar chest dullness to percus-sion may be present because of pleural effu-sions. Cardiac examination shows an enlarged heart with leftward displacement of a diffuse apical impulse. On auscultation, a third heart sound (S3) is common as a sign of poor sys-tolic function. The murmur of mitral valve re-gurgitation is often present as a result of the signifi cant left ventricular dilatation. If right ventricular heart failure has developed, signs of systemic venous congestion may include jugular vein distention, hepatomegaly, as-cites, and peripheral edema. Right ventricular enlargement and contractile dysfunction are often accompanied by the murmur of tricus-pid valve regurgitation.
Diagnostic Studies
The chest radiograph shows an enlarged car-diac silhouette. If heart failure has developed, then pulmonary vascular redistribution, inter-stitial and alveolar edema, and pleural effu-sions are evident (see Fig. 3.5).
The electrocardiogram (ECG) usually dem-onstrates atrial and ventricular enlargement. Patchy fi brosis of the myofi bers results in a wide array of arrhythmias, most importantly atrial fi brillation and ventricular tachycardia.
↑Ventricular filling pressures LV dilatation
Myocyte injury
↓Stroke volume
Mitralregurgitation
↓Forward cardiac output
Pulmonarycongestion
Systemiccongestion
↓Contractility
• Dyspnea• Orthopnea• Rales
• JVD• Hepatomegaly• Edema
• Fatigue• Weakness
Figure 10.3. Pathophysiology of dilated cardiomyopathy. The reduced ventricular stroke vol-ume results in decreased forward cardiac output and increased ventricular fi lling pressures. The listed clinical manifestations follow. JVD, jugular venous distention.
77237_ch10.indd 24877237_ch10.indd 248 8/11/10 8:14:52 AM8/11/10 8:14:52 AM
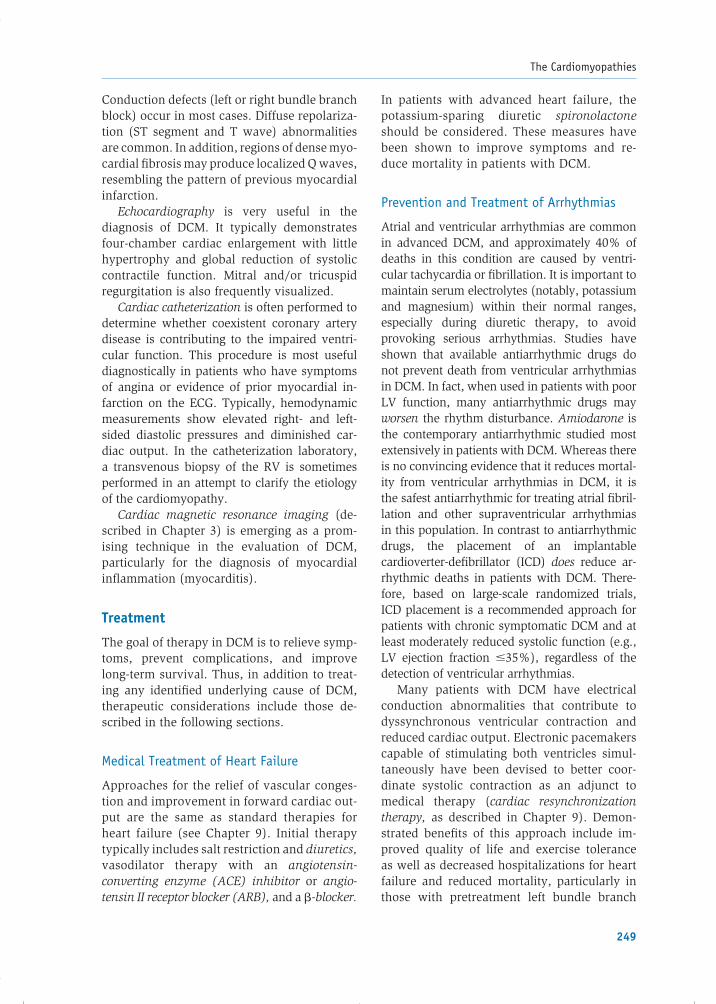
The Cardiomyopathies
249
Conduction defects (left or right bundle branch block) occur in most cases. Diffuse repolariza-tion (ST segment and T wave) abnormalities are common. In addition, regions of dense myo-cardial fi brosis may produce localized Q waves, resembling the pattern of previous myocardial infarction.
Echocardiography is very useful in the diagnosis of DCM. It typically demonstrates four-chamber cardiac enlargement with little hypertrophy and global reduction of systolic contractile function. Mitral and/or tricuspid regurgitation is also frequently visualized.
Cardiac catheterization is often performed to determine whether coexistent coronary artery disease is contributing to the impaired ventri-cular function. This procedure is most useful diagnostically in patients who have symptoms of angina or evidence of prior myocardial in-farction on the ECG. Typically, hemodynamic measurements show elevated right- and left-sided diastolic pressures and diminished car-diac output. In the catheterization laboratory, a transvenous biopsy of the RV is sometimes performed in an attempt to clarify the etiology of the cardiomyopathy.
Cardiac magnetic resonance imaging (de-scribed in Chapter 3) is emerging as a prom-ising technique in the evaluation of DCM, particularly for the diagnosis of myocardial infl ammation (myocarditis).
Treatment
The goal of therapy in DCM is to relieve symp-toms, prevent complications, and improve long-term survival. Thus, in addition to treat-ing any identifi ed underlying cause of DCM, therapeutic considerations include those de-scribed in the following sections.
Medical Treatment of Heart Failure
Approaches for the relief of vascular conges-tion and improvement in forward cardiac out-put are the same as standard therapies for heart failure (see Chapter 9). Initial therapy typically includes salt restriction and diuretics, vasodilator therapy with an angiotensin-converting enzyme (ACE) inhibitor or angio-tensin II receptor blocker (ARB), and a �-blocker.
In patients with advanced heart failure, the potassium-sparing diuretic spironolactone should be considered. These measures have been shown to improve symptoms and re-duce mortality in patients with DCM.
Prevention and Treatment of Arrhythmias
Atrial and ventricular arrhythmias are common in advanced DCM, and approximately 40% of deaths in this condition are caused by ventri-cular tachycardia or fi brillation. It is important to maintain serum electrolytes (notably, potassium and magnesium) within their normal ranges, especially during diuretic therapy, to avoid provoking serious arrhythmias. Studies have shown that available antiarrhythmic drugs do not prevent death from ventricular arrhythmias in DCM. In fact, when used in patients with poor LV function, many antiarrhythmic drugs may worsen the rhythm disturbance. Amiodarone is the contemporary antiarrhythmic studied most extensively in patients with DCM. Whereas there is no convincing evidence that it reduces mortal-ity from ventricular arrhythmias in DCM, it is the safest antiarrhythmic for treating atrial fi bril-lation and other supraventricular arrhythmias in this population. In contrast to anti arrhythmic drugs, the placement of an implantable cardioverter-defi brillator (ICD) does reduce ar-rhythmic deaths in patients with DCM. There-fore, based on large-scale randomized trials, ICD placement is a recommended approach for patients with chronic symptomatic DCM and at least moderately reduced systolic function (e.g., LV ejection fraction �35%), regardless of the detection of ventricular arrhythmias.
Many patients with DCM have electrical conduction abnormalities that contribute to dyssynchronous ventricular contraction and reduced cardiac output. Electronic pace makers capable of stimulating both ventricles simul-taneously have been devised to better coor-dinate systolic contraction as an adjunct to medical therapy (cardiac resynchronization therapy, as described in Chapter 9). Demon-strated benefi ts of this approach include im-proved quality of life and exercise tolerance as well as decreased hospitalizations for heart failure and reduced mortality, particularly in those with pretreatment left bundle branch
77237_ch10.indd 24977237_ch10.indd 249 8/11/10 8:14:53 AM8/11/10 8:14:53 AM

Chapter 10
250
block or other conduction abnormalities with a markedly prolonged QRS duration.
Prevention of Thromboembolic Events
Patients with DCM are at increased risk of thromboembolic complications for reasons that include: (1) stasis in the ventricles re-sulting from poor systolic function, (2) stasis in the atria due to chamber enlargement or atrial fi brillation, and (3) venous stasis be-cause of poor circulatory fl ow. Peripheral venous or right ventricular thrombus may lead to pulmonary emboli, whereas thrombo-emboli of left ventricular origin may lodge in any systemic artery, resulting in, for ex-ample, devastating cerebral, myocardial, or renal infarctions. The only defi nite indica-tions for systemic anticoagulation in DCM patients are atrial fi brillation, a previous thromboembolic event, or an intracardiac thrombus visualized by echocardiography. However, chronic oral anticoagulation ther-apy (i.e., warfarin) is often administered to DCM patients who have severe depression of ventricular function (e.g., LV ejection frac-tion �30%) to prevent thromboembolism (be aware that prospective studies are lack-ing to confi rm the effectiveness of this ap-proach in DCM patients who are in sinus rhythm).
Cardiac Transplantation
In suitable patients, cardiac transplantation offers a substantially better 5-year prognosis than the standard therapies for DCM previ-ously described. The current 5- and 10-year survival rates after transplantation are 74% and 55%, respectively. However, the scarcity of donor hearts greatly limits the availability of this technique. As a result, other mechani-cal options have been explored and continue to undergo experimental refi nements, includ-ing ventricular assist devices and completely implanted artifi cial hearts.
Prognosis
Up to one third of patients will experience spontaneous improvement of heart function
after the diagnosis of DCM is made. How-ever, the prognosis for patients with persistent DCM who do not undergo cardiac transplanta-tion is poor—the average 5-year survival rate is �50%. Methods to reduce progressive LV dysfunction by early intervention in asymp-tomatic or minimally symptomatic patients, and the prevention of sudden cardiac death, remain major research goals in the manage-ment of this disorder.
HYPERTROPHIC CARDIOMYOPATHY
Hypertrophic cardiomyopathy (HCM) has re-ceived notoriety in the lay press because it is the most common cardiac abnormality found in young athletes who die suddenly during vigorous physical exertion. With an incidence of about 1 of 500 in the general population, HCM is characterized by asymmetric (or some-times global) left ventricular hypertrophy that is not caused by chronic pressure overload (i.e., not the result of systemic hypertension or aortic stenosis). Other terms frequently used to describe this disease are “hypertrophic obstructive cardiomyopathy” and “idiopathic hypertrophic subaortic stenosis”. In this con-dition, systolic LV contractile function is vigor-ous but the thickened muscle is stiff, resulting in impaired ventricular relaxation and high diastolic pressures.
Etiology
HCM is a familial disease in which inheri-tance follows an autosomal dominant pat-tern with variable penetrance, and hundreds of mutations in several different genes have been implicated. The proteins encoded by the responsible genes are all part of the sarcomere complex and include �-myosin heavy chain (�-MHC), cardiac troponins, and myosin-binding protein C (see Table 10.2). The incorporation of these mutated peptides into the sarcomere is thought to cause impaired contractile function. The resultant increase in myocyte stress is then hypothesized to lead to compensatory hypertrophy and proliferation of fi broblasts.
The pathophysiology and natural his-tory of familial HCM are quite variable and
77237_ch10.indd 25077237_ch10.indd 250 8/11/10 8:14:53 AM8/11/10 8:14:53 AM

The Cardiomyopathies
251
appear related to particular mutations within the disease-causing gene, rather than theactual gene involved. In fact, it has been shown that the precise genetic mutation determines the age of onset of hypertrophy, the extent and pattern of cardiac remodeling, and the person’s risk of developing symptomatic heart failure or sudden death. For example, mutations in the �-MHC gene that alter electrical charge in the encoded protein are associated with worse prognoses than other mutations.
Pathology
Although hypertrophy in HCM may involve any portion of the ventricles, asymmetric hypertrophy of the ventricular septum (Fig. 10.4) is most common (approximately 90% of cases). Less often, the hypertrophy involves the ventricular walls symmetrically or is local-ized to the apex or midregion of the LV.
Unlike ventricular hypertrophy resulting from hypertension in which the myocytes enlarge uniformly and remain orderly, the histology of HCM is unusual. The myocardial fi bers are in a pattern of extensive disarray (Fig. 10.5). Short, wide, hypertrophied fi bers are oriented in chaotic directions and are surrounded by numerous cardiac fi broblasts and extracellular matrix. This myocyte dis-array and fi brosis are characteristic of HCM
IVS
Figure 10.4. Postmortem heart specimen from a patient with hypertrophic cardiomyopathy. Marked left ventri-cular hypertrophy is present, especially of the interventri-cular septum (IVS).
Figure 10.5. Light microscopy of the hypertrophic myocardium. A. Normal myocardium. B. Hypertrophic myocytes result-ing from pressure overload in a patient with valvular heart disease. C. Disordered myocytes with fi brosis in a patient with hypertrophic cardiomyopathy. (Modifi ed from Schoen FJ. Interventional and Surgical Cardiovascular Pathology: Clinical Correla-tions and Basic Principles. Philadelphia, PA: WB Saunders; 1989:181.)
and play a role in the abnormal diastolic stiffness and the arrhythmias common to this disorder.
77237_ch10.indd 25177237_ch10.indd 251 8/11/10 8:14:53 AM8/11/10 8:14:53 AM

Chapter 10
252
Pathophysiology
The predominant feature of HCM is marked ventricular hypertrophy that reduces the com-pliance and diastolic relaxation of the chamber, such that fi lling becomes impaired (Fig. 10.6). Patients who have asymmetric hypertrophy of the proximal interventricular septum may display additional fi ndings related to transient obstruction of left ventricular outfl ow during systole. It is useful to consider the pathophysi-ology of HCM based on whether such systolic outfl ow tract obstruction is present.
HCM Without Outfl ow Tract Obstruction
Although systolic contraction of the LV is usually vigorous in HCM, hypertrophy of the walls results in increased stiffness and impaired relaxation of the chamber. The re-duced ventricular compliance alters the nor-mal pressure–volume relationship, causing the
passive diastolic fi lling curve to shift upward (see Fig. 9.7B). The associated rise in diastolic LV pressure is transmitted backward, lead-ing to elevated left atrial, pulmonary venous, and pulmonary capillary pressures. Dyspnea, especially during exertion, is thus a common symptom in this disorder.
HCM With Outfl ow Obstruction
Approximately one third of patients with HCM manifest systolic outfl ow tract obstruction. The mechanism of systolic obstruction is thought to involve abnormal motion of the anterior mitral valve leafl et toward the LV outfl ow tract where the thickened septum protrudes (Fig. 10.7). The process is explained as follows: (1) during ventricular contraction, ejection of blood toward the aortic valve is more rapid than usual, because it must fl ow through an outfl ow tract that is narrowed by the thickened septum; (2) this rapid fl ow creates Venturi
Figure 10.6. Pathophysiology of hypertrophic cardiomyopathy. The disarrayed and hypertrophied myocytes may lead to ventricular arrhythmias (which can cause syncope or sudden death) and impaired diastolic left ventricular (LV) relaxation (which causes elevated LV fi lling pressures and dyspnea). If dynamic left ventricular outfl ow obstruction is present, mitral regurgitation often accompanies it (which contributes to dyspnea), and the impaired ability to raise cardiac output with exertion can lead to ex-ertional syncope. The thickened LV wall, and increased systolic pressure associated with outfl ow tract obstruction, each contribute to increased myocardial oxygen consumption (MVO2) and can precipitate angina. CO, cardiac output; LVEDP, LV end-diastolic pressure; LVH, LV hypertrophy.
77237_ch10.indd 25277237_ch10.indd 252 8/11/10 8:14:53 AM8/11/10 8:14:53 AM

The Cardiomyopathies
253
forces that abnormally draw the anterior mitral leafl et toward the septum during contraction; and (3) the anterior mitral leafl et approaches and abuts the hypertrophied septum, causing transient obstruction of blood fl ow into the aorta.
In patients with outfl ow obstruction, el-evated left atrial and pulmonary capillary wedge pressures result from both the de-creased ventricular compliance and the out-fl ow obstruction during contraction. During systolic obstruction, a pressure gradient de-velops between the main body of the LV and the outfl ow tract distal to the obstruction (see Fig. 10.7). The elevated ventricular systolic pressure increases wall stress and myocardial oxygen consumption, which can result in an-gina (see Fig. 10.6). In addition, because ob-struction is caused by abnormal motion of the anterior mitral leafl et toward the septum (and therefore away from the posterior mitral leaf-let), the mitral valve does not close properly during systole, and mitral regurgitation may result. Such regurgitation further elevates left atrial and pulmonary venous pressures and may worsen symptoms of dyspnea, as well
as contribute to the development of atrialfi brillation.
The systolic pressure gradient observed in obstructive HCM is dynamic in that its magni-tude varies during the contraction phase and depends, at any given time, on the distance between the anterior leafl et of the mitral valve and the hypertrophied septum. Situations that decrease LV cavity size (e.g., reduced venous return because of intravascular volume deple-tion) bring the mitral leafl et and septum into closer proximity and promote obstruction. Conversely, conditions that enlarge the LV (e.g., augmented intravascular volume) in-crease the distance between the anterior mitral leafl et and septum and reduce the obstruc-tion. Positive inotropic drugs (which augment the force of contraction) also force the mitral leafl et and septum into closer proximity and contribute to obstruction, whereas negative inotropic drugs (e.g., �-blockers, verapamil) have the opposite effect.
Although dynamic systolic outfl ow tract obstruction creates impressive murmurs and receives great attention, the symptoms of ob-structive HCM appear to primarily stem from
EARLY SYSTOLE MID-TO-LATESYSTOLE
LV
LAAorta
AML
Septum
MR
Figure 10.7. Pathophysiology of left ventricular (LV) outfl ow obstruction and mitral regurgitation in hypertrophic cardiomyopathy. Left panel. The LV outfl ow tract is abnormally narrowed between the hypertrophied interventricular septum and the anterior leafl et of the mitral valve (AML). It is thought that the rapid ejection velocity along the narrowed tract in early systole draws the AML toward the septum (small arrow). Right panel. As the mitral valve anterior leafl et abnormally moves toward, and contacts, the septum, outfl ow into the aorta is transiently obstructed. Because the mitral leafl ets do not coapt normally in sys-tole, mitral regurgitation (MR) also results.
77237_ch10.indd 25377237_ch10.indd 253 8/11/10 8:14:54 AM8/11/10 8:14:54 AM

Chapter 10
254
the increased LV stiffness and diastolic dysfunc-tion also present in the nonobstructive form.
Clinical Findings
The symptoms of HCM vary widely in differ-ent individuals, from none to marked physical limitations. The average age of presentation is the mid-20s.
The most frequent symptom is dyspnea owing to elevated diastolic LV (and therefore pulmonary capillary) pressure. This symptom is further exacerbated by the high systolic LV pressure and mitral regurgitation found in patients with outfl ow tract obstruction.
Angina is often described by patients with HCM, even in the absence of obstructive coro-nary artery disease. Myocardial ischemia may be contributed to by (1) the high oxygen de-mand of the increased muscle mass and (2) the narrowed small branches of the coronary arteries within the hypertrophied ventricular wall. If outfl ow tract obstruction is present, the high systolic ventricular pressure also in-creases myocardial oxygen demand because of the increased wall stress.
Syncope in HCM may result from cardiac arrhythmias that develop because of the struc-turally abnormal myofi bers. In patients with outfl ow tract obstruction, syncope may also be induced by exertion, when the pressure gradient is made worse by the increased force of contrac-tion, thereby causing a transient fall in cardiac output. Orthostatic lightheadedness is also com-mon in patients with outfl ow tract obstruction. This occurs because venous return to the heart is reduced on standing by the gravitational pooling of blood in the lower extremities. The LV thus decreases in size and outfl ow tract obstruction intensifi es, transiently reducing cardiac output and cerebral perfusion.
When arrhythmias occur, symptoms of HCM may be exacerbated. For example, atrial fi brillation is not well tolerated because the loss of the normal atrial “kick” further impairs diastolic fi lling and can worsen symptoms of pulmonary congestion. Of greatest concern, the fi rst clinical manifestation of HCM may be ventricular fi brillation, resulting in sudden cardiac death, particularly in young adults with HCM during strenuous physical exertion.
Risk factors for sudden death among patients with HCM include a history of syncope, a fam-ily history of sudden death, certain high-risk HCM mutations, and extreme hypertrophy of the LV wall (�30 mm in thickness).
Physical Examination
Patients with mild forms of HCM are often asymptomatic and have normal or near-normal physical exams. A common fi nding is the pres-ence of a fourth heart sound (S4), generated by left atrial contraction into the stiffened LV (see Chapter 2). The forceful atrial contraction may also result in a palpable presystolic impulse over the cardiac apex (a “double apical impulse”).
Other fi ndings are common in patients with systolic outfl ow obstruction. The carotid pulse rises briskly in early systole but then quickly declines as obstruction to cardiac outfl ow appears. The characteristic systolic murmur of LV outfl ow obstruction is rough and crescendo–decrescendo in shape, heard best at the left lower sternal border (because of turbulent fl ow through the narrowed outfl ow tract). In addition, as the stethoscope is moved toward the apex, the holosystolic blowing murmur of the accompanying mitral regurgitation may be auscultated. Although the LV outfl ow ob-struction murmur may be soft at rest, bedside maneuvers that alter preload and afterload can dramatically increase its intensity and help dif-ferentiate this murmur from other conditions, such as aortic stenosis (Table 10.3).
A commonly used technique in this regard is the Valsalva maneuver, produced by asking the patient to “bear down” (technically defi ned as forceful exhalation with the nose, mouth, and glottis closed). The Valsalva maneuver in-creases intrathoracic pressure, which decreases venous return to the heart and transiently
Table 10.3. Effect of Maneuvers on Murmurs of Aortic Stenosis and Hypertrophic Cardiomyopathy
Valsalva Squatting Standing
HCM murmur ↑ ↓ ↑
AS murmur ↓ ↑ ↓
HCM, hypertrophic cardiomyopathy; AS, aortic stenosis.
77237_ch10.indd 25477237_ch10.indd 254 8/11/10 8:14:54 AM8/11/10 8:14:54 AM

The Cardiomyopathies
255
reduces LV size. This action brings the hypertrophied septum and anterior leafl et of the mitral valve into closer proximity, creat-ing greater obstruction to forward fl ow. Thus, during Valsalva, the murmur of HCM increases in intensity. In contrast, the murmur of aortic stenosis decreases in intensity during Valsalva because of the reduced fl ow across the stenotic valve.
Conversely, a change from standing to a squatting position suddenly augments venous return to the heart (which increases preload) while simultaneously increasing the systemic vascular resistance. The increased preload raises the stroke volume and therefore causes the murmur of aortic stenosis to become louder. In contrast, the transient increase in LV size during squatting reduces the LV outfl ow tract obstruction in HCM and softens the in-tensity of that murmur. Sudden standing from a squatting position has the opposite effect on each of these murmurs (see Table 10.3).
Diagnostic Studies
The ECG typically shows left ventricular hyper-trophy and left atrial enlargement. Prominent Q waves are common in the inferior and lateral leads, representing amplifi ed forces of initial depolarization of the hypertrophied septum directed away from those leads. In some pa-tients, diffuse T wave inversions are present, which can predate clinical, echocardiographic, or other electrocardiographic manifestations of HCM. Atrial and ventricular arrhythmias are frequent, especially atrial fi brillation. Ventri-cular arrhythmias are particularly ominous because they may herald ventricular fi bril-lation and sudden death, even in previously asymptomatic patients.
Echocardiography is very helpful in the eval-uation of HCM. The degree of LV hypertrophy can be measured and regions of asymmetrical wall thickness readily identifi ed. Signs of left ventricular outfl ow obstruction may also be demonstrated and include abnormal anterior motion of the mitral valve as it is drawn toward the hypertrophied septum during systole, and partial closure of the aortic valve in midsys-tole as fl ow across it is transiently obstructed. Doppler recordings during echocardiography
accurately measure the outfl ow pressure gradient and quantify any associated mitral regurgitation. Children and adolescents with apparently mild HCM should undergo serial echocardiographic assessment over time, be-cause the degree of hypertrophy may increase during puberty and early adulthood.
Cardiac catheterization is reserved for pa-tients for whom the diagnosis is uncertain or if percutaneous septal ablation (described in the Treatment section) is planned. The major feature in patients with obstruction is the fi nd-ing of a pressure gradient within the outfl ow portion of the LV, either at rest or during ma-neuvers that transiently reduce LV size and promote outfl ow tract obstruction. Myocardial biopsy at the time of catheterization is not nec-essary, because histologic fi ndings do not pre-dict disease severity or long-term prognosis.
Finally, genetic testing can be helpful in es-tablishing, or excluding, the diagnosis of HCM in family members of an affected patient when a specifi c mutation in that family has been identifi ed.
Treatment
�-Blockers are standard therapy for HCM be-cause they (1) reduce myocardial oxygen de-mand by slowing the heart rate and the force of contraction (and therefore diminish angina and dyspnea); (2) lessen any LV outfl ow gra-dient during exercise by reducing the force of contraction (allowing the chamber size to in-crease, thus separating the anterior leafl et of the mitral valve from the ventricular septum); (3) increase passive diastolic ventricular fi lling time owing to the decreased heart rate; and (4) decrease the frequency of ventricular ecto-pic beats. Despite their antiarrhythmic effect, �-blockers have not been shown to prevent sudden arrhythmic death in this condition.
Calcium channel antagonists can reduce ventricular stiffness and are sometimes use-ful in improving exercise capacity in patients who fail to respond to �-blockers. Patients who develop pulmonary congestion may ben-efi t from mild diuretic therapy, but these drugs must be administered cautiously to avoid volume depletion; reduced intra vascular vol-ume decreases LV size and could exacerbate
77237_ch10.indd 25577237_ch10.indd 255 8/11/10 8:14:54 AM8/11/10 8:14:54 AM

Chapter 10
256
outfl ow tract obstruction. Vaso dilators (in-cluding nitrates) similarly reduce LV size and should be avoided.
Atrial fi brillation is poorly tolerated in HCM and should be controlled aggressively, most commonly with antiarrhythmic drugs. Effec-tive and useful antiarrhythmic drugs for atrial fi brillation in HCM include amiodarone and disopyramide (a type IA antiarrhythmic drug that also possesses negative inotropic proper-ties that may help reduce LV outfl ow tract ob-struction; see Chapter 17). Digitalis should be avoided in HCM because its positive inotropic effect increases the force of contraction and can worsen LV outfl ow tract obstruction.
Sudden cardiac death has a propensity to occur in patients with HCM in association with physical exertion; therefore, strenuous exer-cise and competitive sports should be avoided. Sudden death in this syndrome is almost al-ways caused by ventricular tachycardia or fi brillation. Although amiodarone may reduce the frequency of ventricular arrhythmias, HCM patients who are at high risk (i.e., a family his-tory of sudden death, extreme hyper trophy with ventricular wall thickness �30 mm, unexplained prior syncopal episodes, history of high-grade ventricular tachyarrythmias) should receive an ICD. ICD therapy is life sav-ing for both primary prevention in such pa-tients, and for HCM patients who have already survived a cardiac arrest.
Some studies have shown clinical improve-ment when patients with the obstructive form of HCM are treated with a dual-chamber per-manent pacemaker, the electrodes of which are placed in the right atrium and RV. The LV outfl ow gradient may become reduced by this procedure, possibly by altering the normal se-quence of ventricular contraction, such that septal–mitral valve apposition becomes less prominent. This technique seems to be useful for only a small percentage of markedly symp-tomatic patients.
Surgical therapy (myomectomy) is considered for patients whose symptoms do not respond adequately to pharmacologic therapy. This procedure involves excision of portions of the hypertrophied septal muscle mass and usually improves outfl ow tract obstruction, symptoms, and exercise capacity. A less invasive
alternative is percutaneous septal ablation, performed in the cardiac catheterization lab-oratory, in which ethanol is injected directly into the fi rst major septal coronary artery (a branch of the left anterior descending artery), causing a small, controlled myocardial infarc-tion. The desired and often achieved result is reduction of septal thickness and improvement in outfl ow tract obstruction. Randomized trials have not been performed to compare the out-comes of ethanol septal ablation with surgical myomectomy. Thus, while septal ablation is an alternative for persistently symptomatic patients who cannot tolerate an operation, myomectomy remains the standard accepted procedure given its 40� year history of experi-ence and effi cacy.
Theoretically, infective endocarditis could develop in patients with the obstructive form of HCM because of turbulent blood fl ow through the LV outfl ow tract and the associated mitral regurgitation. However, that is rare and anti-biotic prophylaxis for prevention of endocardi-tis in this condition is no longer recommended (see Chapter 8).
Finally, genetic counseling should be pro-vided to all patients with HCM. Because it is an autosomal dominant disease, children of affected persons have a 50% chance of inher-iting the abnormal gene. First-degree relatives of patients with HCM should be screened by physical examination, electrocardiography, echocardiography, and sometimes genetic testing. Even asymptomatic HCM patients are at risk of complications, including sudden death, and must be evaluated.
Prognosis
The incidence of sudden death in HCM is 2% to 4% per year in adults and 4% to 6% in children and adolescents. It has become clear that different mutations have vastly different phenotypes. Some cause extreme hyper trophy in childhood without any clinical symp-toms until the occurrence of sudden death; others present later in life with heart failure symptoms. Most mutations produce only mild hypertrophy and are associated with a normal life expectancy. As the natural histo-ries of specifi c mutations are better defi ned,
77237_ch10.indd 25677237_ch10.indd 256 8/11/10 8:14:54 AM8/11/10 8:14:54 AM

The Cardiomyopathies
257
the use and timing of specifi c therapeutic inter ventions will likely improve.
RESTRICTIVE CARDIOMYOPATHY
The restrictive cardiomyopathies are less common than DCM and HCM. They are char-acterized by abnormally rigid (but not nec-essarily thickened) ventricles with impaired diastolic fi lling but usually normal, or near-normal, systolic function. This condition re-sults from either (1) fi brosis or scarring of the endomyocardium or (2) infi ltration of the myocardium by an abnormal substance (Table 10.4).
The most common recognized cause of re-strictive cardiomyopathy in nontropical coun-tries is amyloidosis. In this systemic disease, insoluble misfolded amyloid fi brils deposit within tissues, including the heart, caus-ing organ dysfunction. Amyloid deposition is diagnosed histologically by the Congo red stain, which displays amyloid fi brils with a characteristic green birefringence under polar-ized light.
Amyloid fi brils can pathologically develop from a host of different proteins that dis-tinguish the categories of disease. Primary amyloidosis is caused by deposition of immuno-globulin light chain AL fragments secreted by a plasma cell tumor (usually, multiple
myeloma). In contrast, secondary amyloidosis is characterized by the presence of AA amyloid (derived from the infl ammatory marker serum amyloid A) in a variety of chronic infl amma-tory conditions, such as rheumatoid arthritis. Less common is hereditary amyloidosis, an auto-somal dominant condition in which amyloid fi brils form from point mutations in the pro-tein transthyretin (formerly known as prealbu-min). Senile amyloidosis refers to a condition in the elderly, in which amyloid deposits, de-rived from transthyretin or other proteins, are found scattered throughout the vascular sys-tem, muscles, kidney, and lung. In each form of amyloidosis, cardiac involvement is marked by deposition of extracellular amyloid between myocardial fi bers in the atria and ventricles, in the coronary arteries and veins, and in the heart valves.
Clinical manifestations of cardiac involvement are most common in the primary (AL) form of amyloidosis and typically relate to the develop-ment of restrictive cardiomyopathy because of the infi ltrating amyloid protein. Diastolic dysfunction is the prominent cardiac abnormality; systolic dysfunction may also develop later in the disease. Orthostatic hypotension is present in about 10% of patients, likely contributed to by amyloid de-position in the autonomic nervous system and peripheral blood vessels. Infi ltration of amyloid into the cardiac conduction system can cause arrhythmias and conduction impairments, which can result in syncope or sudden death.
Pathophysiology
Reduced compliance of the ventricles in re-strictive cardiomyopathy, whether due to in-fi ltration or fi brosis, results in an upward shift of the passive ventricular fi lling curve (see Fig. 9.7B), leading to abnormally high diastolic pressures. This condition has two major con-sequences: (1) elevated systemic and pulmo-nary venous pressures, with signs of right- and left-sided vascular congestion, and (2) reduced ventricular cavity size with decreased stroke volume and cardiac output.
Clinical Findings
It follows from the underlying pathophysio-logy that signs of left- and right-sided heart
Table 10.4. Examples of Restrictive Cardiomyopathy
Noninfi ltrative Idiopathic Scleroderma
Infi ltrative Amyloidosis Sarcoidosis
Storage diseases Hemochromatosis Glycogen storage diseases
Endomyocardial disease Endomyocardial fi brosis Hypereosinophilic syndrome Metastatic tumors Radiation therapy
77237_ch10.indd 25777237_ch10.indd 257 8/11/10 8:14:54 AM8/11/10 8:14:54 AM

Chapter 10
258
failure are expected (Fig. 10.8). Decreased cardiac output is manifested by fatigue and decreased exercise tolerance. Systemic conges-tion (often more prominent than pulmonary congestion in this syndrome) leads to jugular venous distention, peripheral edema, and as-cites with a large, tender liver. Arrhythmias, including atrial fi brillation, are common. Infi l-trative etiologies that involve the cardiac con-duction system can cause conduction blocks.
Physical Examination
Signs of congestive heart failure are often pres-ent, including pulmonary rales, distended neck veins, ascites, and peripheral edema. Similar to constrictive pericarditis (see Chapter 14), jugular venous distention may paradoxically worsen with inspiration (the Kussmaul sign) because the stiffened RV cannot accommodate the increased venous return.
Diagnostic Studies
The chest radiograph usually shows a normal-sized heart with signs of pulmonary conges-tion. The ECG often displays nonspecifi c ST and T wave abnormalities; conduction distur-bances such as atrioventricular block or a bundle branch block may be present.
The restrictive cardiomyopathies share nearly identical symptoms, physical signs, and hemodynamic profi les with constrictive peri-carditis, as described in Chapter 14. However, it is important to distinguish these two entities because constrictive pericarditis is often cor-rectable, whereas interventions for the restric-tive cardiomyopathies are more limited.
The most useful diagnostic tools to differenti-ate restrictive cardiomyopathy from constrictive pericarditis are transvenous endomyocardial biopsy, computed tomography (CT), and mag-netic resonance imaging (MRI). For example, in restrictive cardiomyopathy, a transvenous endomyocardial biopsy may demonstrate the presence of infi ltrative matter such as amyloid, iron deposits (hemochromatosis), or metastatic tumors. Conversely, CT or MRI scans are use-ful to identify the thickened pericardium of constrictive pericarditis, a fi nding that is not ex-pected in restrictive cardiomyopathy.
Treatment
Restrictive cardiomyopathy typically has a very poor prognosis, except when treatment can target an underlying cause. For example, phlebotomy and iron chelation therapy may be helpful in the early stages of hemochroma-tosis. Symptomatic therapy for all etiologies includes salt restriction and cautious use of diuretics to improve symptoms of systemic and pulmonary congestion. Unlike the dilated cardiomyopathies, vasodilators are not helpful because systolic function is usually preserved. Maintenance of sinus rhythm (e.g., converting atrial fi brillation if it occurs) is important to maximize diastolic fi lling and forward cardiac output. Some restrictive cardio myopathies are prone to intraventri cular thrombus formation, thus warranting chronic oral anticoagulant therapy. In the case of primary (AL) amyloi-dosis, chemotherapy followed by autologous bone marrow stem cell transplantation has proved effective in selected patients with early cardiac involvement.
Figure 10.8. Pathophysiology of restrictive cardiomyopathy. The rigid myocardium results in elevated ventri-cular diastolic pressures and decreased ventricular fi lling. The resultant symptoms can be predicted from these abnormalities. CO, cardiac output.
• Jugular vein distention• Hepatomegaly and ascites• Peripheral edema
• Weakness• Fatigue
Venouscongestion
↓CO
↑Diastolicventricularpressure
↓Ventricularfilling
RigidMyocardium
77237_ch10.indd 25877237_ch10.indd 258 8/11/10 8:14:54 AM8/11/10 8:14:54 AM

The Cardiomyopathies
259
SUMMARY
1. The cardiomyopathies are diseases of heart muscles classifi ed by their patho-physiologic presentation into dilated, hyper-trophic, or restrictive types (Table 10.5).
2. Dilated cardiomyopathies are character-ized by ventricular dilatation with impaired systolic function. Progressive left ventri-cular enlargement often leads to symptom-atic heart failure, ventricular arrhythmias, and/or embolic complications.
3. HCM is characterized by a thickened LV with impaired diastolic relaxation. Dynamic LV out-fl ow tract obstruction during systole may be present. The most common symptoms are dys-pnea and exertional angina. Ventricular arrhy-thmias may lead to sudden cardiac death.
4. The restrictive cardiomyopathies are uncom-mon and are characterized by impairment of diastolic ventricular relaxation owing to an infi ltrated or fi brotic myocardium. Symp-toms of heart failure are typical.
Table 10.5. Summary of the Cardiomyopathies
Dilated Cardiomyopathy
Hypertrophic Cardiomyopathy
Restrictive Cardiomyopathy
Ventricular morphology
Dilated LV with little concentric hypertrophy
LV
LA
Marked hypertrophy, often asymmetric
Fibrotic or infi ltrated myocardium
Etiologies Genetic, infectious, alcoholic, peripartum
Genetic Amyloidosis, hemochromatosis, scleroderma, radiation therapy
Symptoms Fatigue, weakness, dyspnea, orthopnea, PND
Dyspnea, angina, syncope
Dyspnea, fatigue
Physical exam Pulmonary rales, S3; if RV failure present: JVD, hepatomegaly, peripheral edema
S4; if outfl ow obstruction present: systolic murmur loudest at left sternal border, accompanied by mitral regurgitation
Predominantly signs of RV failure: JVD, hepatomegaly, peripheral edema
Pathophysiology Impaired systolic contraction
Impaired diastolic relaxation; LV systolic function vigorous, often with dynamic obstruction
“Stiff” LV with impaired diastolic relaxation but usually normal systolic function
Cardiac size on chest radiograph
Enlarged Normal or enlarged Usually normal
Echocardiogram Dilated, poorly contractile LV
LV hypertrophy, often more pronounced at septum; systolic anterior movement of MV with mitral regurgitation
Usually normal systolic contraction; “speckled” appearance in infi ltrative disorders
LV, left ventricle; PND, paroxysmal nocturnal dyspnea; RV, right ventricle; JVD, jugular venous distension; MV, mitral valve.
77237_ch10.indd 25977237_ch10.indd 259 8/11/10 8:14:54 AM8/11/10 8:14:54 AM

Chapter 10
260
Acknowledgments
The authors thank Frederick Schoen, MD, for pro-viding pathology specimens. Contributors to the previous editions of this chapter were Marc N. Wein, MD; Yi-Bin Chen, MD; Kay Fang, MD; David Grayzel, MD; G. William Dec, MD; and Leonard S. Lilly, MD.
Additional Reading
Cooper L. Myocarditis. N Engl J Med. 2009;360:1526–1538.
Fifer MA, Vlahakes GJ. Management of symptoms in hypertrophic cardiomyopathy. Circulation. 2008;117:429–439.
Friedrich MG, Sechtem U, Schulz-Menger J, et al. Cardiovascular magnetic resonance in myo-carditis: a JACC white paper. J Am Coll Cardiol. 2009;53:1475–1487.
Hershberger RE, Lindenfeld J, Mestroni L, et al. Genetic evaluation of cardiomyopathy. J Card Fail. 2009;15:83–97.
Ho CY, Seidman CE. A contemporary approach to hypertrophic cardiomyopathy. Circulation. 2006;113:e858–e862.
Maron BJ, Spirito P, Shen WK, et al. Implantable cardioverter-defi brillators and prevention of sud-den cardiac death in hypertrophic cardiomyo-pathy. JAMA. 2007;298:405–412.
Maron BJ, Towbin JA, Thiene G, et al. Contemporary defi nitions and classifi cation of the cardiomyo-pathies: an American Heart Association scientifi c statement from the Council on Clinical Cardiol-ogy, Heart Failure and Transplantation Commit-tee; Quality of Care and Outcomes Research and Functional Genomics and Translational Biology Interdisciplinary Working Groups; and Council on Epidemiology and Prevention. Circulation. 2006;113:1807–1816.
Schultz JC, Hilliard AA, Cooper LT, et al. Diagno-sis and treatment of viral myocarditis. Mayo Clin Proc. 2009;84:1001–1009.
Selvanayagam JB, Hawkins PN, Paul B, et al. Evaluation and management of the cardiac amyloidosis. J Am Coll Cardiol. 2007;50:2101–2110.
Silwa K, Fett J, Elkayam U. Peripartum cardiomyo-pathy. Lancet. 2006;38:687–693.
Yazdani K, Maraj S, Amanullah AM. Differentiating constrictive pericarditis from restrictive cardio-myopathy. Rev Cardiovasc Med. 2005;6:61–71.
77237_ch10.indd 26077237_ch10.indd 260 8/11/10 8:14:54 AM8/11/10 8:14:54 AM

261
C H A P T E R
11Mechanisms of Cardiac ArrhythmiasRanliang HuWilliam G. StevensonGary R. StrichartzLeonard S. Lilly
NORMAL IMPULSE FORMATIONIonic Basis of AutomaticityNative and Latent PacemakersOverdrive SuppressionElectrotonic Interactions
ALTERED IMPULSE FORMATIONAlterations in Sinus Node AutomaticityEscape RhythmsEnhanced Automaticity of Latent PacemakersAbnormal AutomaticityTriggered Activity
ALTERED IMPULSE CONDUCTIONConduction BlockUnidirectional Block and Reentry
PHYSIOLOGIC BASIS OF ANTIARRHYTHMIC THERAPYBradyarrhythmiasTachyarrhythmias
Normal cardiac function relies on the fl ow of electric impulses through the heart in
an exquisitely coordinated fashion. Abnor-malities of the electric rhythm are known as arrhythmias (also termed dysrhythmias) and are among the most common clinical problems encountered. The presentations of arrhyth-mias range from common benign palpitations to very severe symptoms of low cardiac output and death; therefore, a thorough understand-ing of these disorders is important to the daily practice of medicine.
Abnormally slow rhythms are termed brady-cardias (or bradyarrhythmias). Fast rhythms are known as tachycardias (or tachyarrhyth-mias). Tachycardias are further characterized
as supraventricular when they involve the atrium or AV node, and designated ventri cular when they originate from the His-Purkinje system or ventricles. This chapter describes the mechanisms by which such arrhythmias develop, followed by a general description of their management. Chapter 12 summarizes specifi c rhythm disorders and how to recog-nize and treat them.
Disorders of heart rhythm result from altera-tions of impulse formation, impulse conduc-tion, or both. This chapter fi rst addresses how abnormalities of impulse formation and con-duction occur, and under what circumstances they cause arrhythmias. Figure 11.1 provides an organizational schema for this presentation.
77237_ch11.indd 26177237_ch11.indd 261 8/11/10 8:15:28 AM8/11/10 8:15:28 AM

Chapter 11
262
NORMAL IMPULSE FORMATION
As described in Chapter 1, electric impulse formation in the heart arises from the intrinsic automaticity of specialized cardiac cells. Auto-maticity refers to a cell’s ability to depolarize itself to a threshold voltage to generate a spon-taneous action potential. Although atrial and ventricular myocytes do not have this property under normal conditions, the cells of the spe-cialized conducting system do possess natural automaticity and are therefore termed pace-maker cells. The specialized conducting system includes the sinoatrial (SA) node, the atrio-ventricular (AV) nodal region, and the ventri-cular conducting system. The latter is composed of the bundle of His, the bundle branches, and the Purkinje fi bers. In pathologic situations, myocardial cells outside the conducting system may also acquire automaticity.
Ionic Basis of Automaticity
Cells with natural automaticity do not have a static resting voltage. Rather, they inherently display gradual depolarization during phase 4 of the action potential (Fig. 11.2). If this spon-taneous diastolic depolarization reaches the threshold condition, an action potential upstroke
is generated. An important ionic current largely responsible for phase 4 spontaneous depolariza-tion is known as the pacemaker current (If). The channels that carry this current are activated by hyperpolarization (increasingly negative volt-ages) and mainly conduct sodium ions. If chan-nels begin to open when the membrane voltage becomes more negative than approximately �50 mV and are different from the fast sodium channels responsible for rapid phase 0 depolar-ization in ventricular and atrial myocytes. The inward fl ow of Na� through these slow chan-nels, driven by its concentration gradient and the negative intracellular potential, depolarizes the membrane toward threshold.
In the pacemaker cells of the SA node, al-terations in three other ionic currents also contribute to phase 4 gradual depolarization: (1) a slow inward calcium current, carried mostly by L-type Ca�� channels that become activated at voltages reached near the end of phase 4, (2) a progressive decline of an out-ward potassium current, and (3) an additional inward sodium current mediated by activation of the sodium—calcium exchanger by calcium release from the sarcoplasmic reticulum (SR). The latter mechanism, driven by oscillatory re-lease of calcium from the SR, has been referred to as the “calcium clock.”
Figure 11.1. Arrhythmias result from alterations in impulse formation and/or impulse conduction. Tachyarrhythmias result from enhanced automaticity, unidirectional block with reentry, or triggered activ-ity. Bradyarrhythmias result from decreased automaticity or conduction block. SA, sinoatrial.
Automaticityof SA node
Automaticityof latent
pacemakers
Enhancedautomaticity
Abnormalautomaticity
Triggeredactivity
Automaticityof SA node
Unidirectional blockand reentry
Conduction block
ALTEREDIMPULSE
FORMATION
ALTEREDIMPULSE
CONDUCTION
TACHYARRHYTHMIAS (Increased firing rate)
BRADYARRHYTHMIAS (Decreased firing rate)
77237_ch11.indd 26277237_ch11.indd 262 8/11/10 8:15:28 AM8/11/10 8:15:28 AM

Mechanisms of Cardiac Arrhythmias
263
When the membrane potential of a pace-maker cell reaches the threshold condition, the upstroke of the action potential is gener-ated. In contrast to the phase 0 upstroke of cells in the Purkinje system, that of cells in the sinus and AV nodes is much slower (see Fig. 11.2). The reason for the difference is that the membrane potential determines the proportion of fast sodium channels that are in a resting state capable of depolarization, compared with an inactivated state. The num-ber of available (or resting-state) fast sodium channels increases as the resting membrane potential becomes more negative. Because sinus and AV nodal cells have less negative maximum diastolic membrane voltages (�50 to �60 mV) than do Purkinje cells (�90 mV), a greater proportion of the fast sodium chan-nels is inactivated in these pacemaker cells. Thus, the action potential upstroke relies to a greater extent on a calcium current (through the relatively slower opening of Ca�� chan-nels) and has a less rapid rate of rise than cells of the Purkinje system or ventricular myocardium. The repolarization phase of pacemaker cells depends on inactivation of the calcium channels and the opening of voltage-gated potassium channels that permit effl ux of potassium from the cells.
Native and Latent Pacemakers
The distinct populations of automatic cells in the specialized conduction pathway have dif-ferent intrinsic rates of fi ring. These rates are determined by three variables that infl uence how fast the membrane potential reaches the threshold condition: (1) the rate (i.e., the slope) of phase 4 spontaneous depolarization, (2) the maximum negative diastolic potential, and (3) the threshold potential. A more negative maxi-mum diastolic potential, or a less negative threshold potential, slows the rate of impulse initiation because it takes longer to reach the threshold value (Fig. 11.3). Conversely, the greater the If, the steeper the slope of phase 4 and the faster the cell depolarizes. The size of If depends on the number and kinetics of the individual pacemaker channels through which this current fl ows.
Since all healthy myocardial cells are elec-trically connected by gap junctions, an action potential generated in one part of the myo-cardium will ultimately spread to all other re-gions. When an impulse arrives at a cell that is not yet close to threshold, current from the depolarized cell will bring the adjacent cell’s membrane potential to the threshold level so that it will fi re (regardless of how close its
Figure 11.2. The action potential (AP) of a pacemaker cell (e.g., from the sinus node). Notice the slow phase 4 depolarization, largely caused by the If (pacemaker) current through slow Na� channels, which drives the cell to threshold (potential of approximately �40 mV). The upstroke of the AP is caused by the slow inward current of Ca� ions. Inactivation of the cal-cium channels and K� weffl ux through potassium channels are responsible for repolarization. MDP, maximum negative diastolic potential; TP, threshold potential.
Ifinflux
77237_ch11.indd 26377237_ch11.indd 263 8/11/10 8:15:29 AM8/11/10 8:15:29 AM

Chapter 11
264
intrinsic If has brought it to threshold). Thus, the pacemaker cells with the fastest rate of de-polarization set the heart rate. In the normal heart, the dominant pacemaker is the sino-atrial node, which at rest initiates impulses at a rate of 60 to 100 bpm. Because the sinus node rate is faster than that of the other tissues that possess automaticity, its repeated dis-charges prevent spontaneous fi ring of other potential pacemaker sites.
The SA node is known as the native pace-maker because it normally sets the heart rate. Other cells within the specialized conduction system harbor the potential to act as pacemak-ers if necessary, and are therefore called latent pacemakers (or ectopic pacemakers). In con-trast to the SA node, the AV node and the bundle of His have intrinsic fi ring rates of 50 to 60 bpm, and cells of the Purkinje system have rates of
approximately 30 to 40 bpm. These latent sites may initiate impulses and take over the pacemak-ing function if the SA node slows or fails to fi re, or if conduction abnormalities block the normal wave of depolarization from reaching them.
Overdrive Suppression
Not only does the cell population with the fastest intrinsic rhythm preempt all other automatic cells from spontaneously fi ring, it also directly suppresses their automaticity. This phenomenon is called overdrive suppression. Cells maintain their trans-sarcolemmal ion dis-tributions because of the continuously active Na�K�-ATPase pump that extrudes three Na� ions from the cell in exchange for two K� ions transported in (Fig. 11.4). Because its net trans-port effect is one positive charge in the outward
Figure 11.3. Determinants of cell fi ring rates. A. Alterations in the pacemaker current (If) and in the magnitude of the maximum diastolic potential (MDP) alter the cell fi ring rate. (a) The normal action potential (AP) of a pacemaker cell. (b) Re-duced If renders the slope of phase 4 less steep; thus, the time required to reach threshold potential (TP) is increased. (c) The MDP is more negative; therefore, the time required to reach TP is increased. B. Alterations in TP change the fi ring rate of the cell. Compared with the normal TP (a), the TP in b is less negative; thus, the duration of time to achieve threshold is increased, and the fi ring rate decreases.
a b
a b
c
77237_ch11.indd 26477237_ch11.indd 264 8/11/10 8:15:29 AM8/11/10 8:15:29 AM

Mechanisms of Cardiac Arrhythmias
265
direction, the Na�K�-ATPase pump creates a hyperpolarizing current (i.e., it tends to make the inside of the cell more negative). As the cell potential becomes increasingly negative, addi-tional time is required for spontaneous phase 4 depolarization to reach the threshold volt-age (see Fig. 11.3A), and therefore the rate of spontaneous fi ring is decreased. Although the hyperpolarizing current moves the membrane away from threshold, pacemaker cells fi ring at their own intrinsic rate have an If current suffi -ciently large to overcome this hyperpolarizing infl uence (see Fig. 11.4).
The hyperpolarizing current increases when a cell is forced to fi re faster than its intrinsic pacemaker rate. The more frequently the cell is depolarized, the greater the quantity of Na� ions that enter the cell per unit time. As a result of the increased intracellular Na�, the Na�K�-ATPase pump becomes more active, thereby tending to restore the normal transmembrane Na� gradi-ent. This increased pump activity provides a larger hyperpolarizing current, opposing the de-polarizing current If, and further decreases the rate of spontaneous depolarization. Thus, over-drive suppression decreases a cell’s automatic-ity when that cell is driven to depolarize faster than its intrinsic discharge rate.
Electrotonic Interactions
In addition to overdrive suppression, anatomic connections between pacemaker and nonpace-maker cells are important in determining how adjacent cells suppress latent pacemaker foci.
Myocardial cells in the ventricle and Purkinje system repolarize to a resting potential of a pproximately �90 mV, whereas pacemaker cells in the sinus and AV nodes repolarize to a maximum diastolic potential of about �60 mV. When these two cell types are adjacent to one another, they are electrically coupled through low-resistance gap junctions concentrated in their intercalated discs. This coupling results in a compromise of electric potentials owing to electrotonic current fl ow between the cells, causing relative hyperpolarization of the pace-maker cell and relative depolarization of the nonpacemaker cell (Fig. 11.5). The hyper-polarizing current in the coupled pacemaker cell competes with If and causes the slope of phase 4 diastolic depolarization to be less steep, thereby reducing the cell’s automaticity. Elec-trotonic effects may be particularly important in suppressing automaticity in the AV node (via connections between atrial myocytes and AV nodal cells) and in the distal Purkinje fi bers (which are coupled to nonautomatic ventri-cular myocardial cells). In contrast, cells in the center of the SA node are less tightly coupled to atrial myocytes; thus, their automaticity is less subject to electrotonic interactions.
Decoupling of normally suppressed cells, such as those in the AV node (e.g., by ische-mic damage), may reduce the inhibitory elec-trotonic infl uence and enhance automaticity, producing ectopic rhythms by the latent pace-maker tissue.
ALTERED IMPULSE FORMATION
Arrhythmias may arise from altered impulse formation at the SA node or from other sites, including the specialized conduction path-ways or regions of cardiac muscle. The main abnormalities of impulse initiation that lead to arrhythmias are (1) altered automaticity (of the sinus node or latent pacemakers within the specialized conduction pathway), (2) abnor-mal automaticity in atrial or ventricular myo-cytes, and (3) triggered activity.
Alterations in Sinus Node Automaticity
The rate of impulse initiation by the sinus node, as well as by the latent pacemakers of
Figure 11.4. Competition between the depolar-izing pacemaker current (If) and the Na�K�-ATPase pump, which produces a hyperpolariz-ing current. The Na�K�-ATPase pump transports three positive charges outside the cell for every two it pumps in. The hyperpolarizing current acts to suppress automaticity by antagonizing If and contributes to overdrive suppression in cells that are stimulated more rapidly than their intrin-sic fi ring rate.
77237_ch11.indd 26577237_ch11.indd 265 8/11/10 8:15:29 AM8/11/10 8:15:29 AM

Chapter 11
266
the specialized conducting system, is regulated primarily by neurohumoral factors.
Increased Sinus Node Automaticity
The most important modulator of normal sinus node automaticity is the autonomic ner-vous system. Sympathetic stimulation, acting through �1-adrenergic receptors, increases the open probability of the pacemaker channels (Fig. 11.6), through which If can fl ow. The in-crease in If leads to a steeper slope of phase 4 depolarization, causing the SA node to reach threshold and fi re earlier than normal and the heart rate to increase.
In addition, sympathetic stimulation shifts the action potential threshold to more nega-tive voltages by increasing the probability that voltage-sensitive Ca�� channels are capable of opening (recall that calcium carries the current of phase 0 depolarization in pacemaker cells). Therefore, diastolic depolarization reaches
the threshold potential earlier. Sympathetic activity thus increases sinus node automatic-ity both by increasing the rate of pacemaker depolarization via If and by causing the action potential threshold to become more negative. Examples of this normal physiologic effect occur during exercise or emotional stress, when sympathetic stimulation appropriately increases the heart rate.
Decreased Sinus Node Automaticity
Normal decreases in SA node automaticity are mediated by reduced sympathetic stimulation and by increased activity of the parasympa-thetic nervous system. Whereas activation of the sympathetic nervous system has a major role in increasing the heart rate during times of stress, the parasympathetic nervous system is the major controller of the heart rate at rest.
Cholinergic (i.e., parasympathetic) stimula-tion via the vagus nerve acts at the SA node
Figure 11.5. Electrotonic interaction between pacemaker (e.g., AV nodal) and nonpacemaker (myocardial) cells. A. When pacemaker cells are not coupled to myocardial cells, they have a maximum negative potential (MDP) of approxi-mately �60 mV, whereas myocardial cells have a resting potential (RP) of approximately �90 mV. B. When pacemaker cells and myocytes are neighbors, they may be connected electrically by gap junctions in their intercalated discs (e.g., in the AV node). In this situation, electric current fl ows between the pacemaker cell and the myocardial cell, tending to hyperpolarize the former and depolarize the latter, driving their membrane potentials closer to one another. The hyperpolarizing current opposes If of the pacemaker cell, such that the slope of phase 4 depolarization is less steep and therefore cellular automaticity is suppressed. If a disease state impairs coupling between cells, the infl uence of sur-rounding myocytes on the pacemaker cell is reduced, allowing If to depolarize to threshold more readily and enhancing automaticity. TP, threshold potential.
77237_ch11.indd 26677237_ch11.indd 266 8/11/10 8:15:29 AM8/11/10 8:15:29 AM

Mechanisms of Cardiac Arrhythmias
267
to reduce the probability of pacemaker chan-nels being open (see Fig. 11.6). Thus, If and the slope of phase 4 depolarization are re-duced, and the intrinsic fi ring rate of the cell is slowed. In addition, the probability of the Ca�� channels being open is decreased, such that the action potential threshold increases to a more positive potential. Furthermore, cholin ergic stimulation increases the prob-ability of acetylcholine-sensitive K� channels being open at rest. Positively charged K� ions exit through these channels, producing an out-ward current that drives the diastolic potential to become more negative. The overall effect of reduced If, a more negative maximum diastolic potential, and a less negative threshold level is a slowing of the intrinsic fi ring rate and there-fore a reduced heart rate.
It follows that the use of pharmacologic agents that modify these effects of the auto-nomic nervous system will also affect the fi ring
rate of the SA node. For example, �-receptor blocking drugs (“�-blockers”) antagonize the �-adrenergic sympathetic effect; therefore, they decrease the rate of phase 4 depolariza-tion of the SA node and slow the heart rate. Conversely, atropine, an anticholinergic (anti-muscarinic) drug, has the opposite effect: by blocking parasympathetic activity, the rate of phase 4 depolarization increases and the heart rate accelerates.
Escape Rhythms
If the sinus node becomes suppressed and fi res less frequently than normal, the site of impulse formation often shifts to a latent pacemaker within the specialized conduction pathway. An impulse initiated by a latent pacemaker because the SA node rate has slowed is called an escape beat. Persistent impairment of the SA node will allow a continued series of es-cape beats, termed an escape rhythm. Escape rhythms are protective in that they prevent the heart rate from becoming pathologically slow when SA node fi ring is impaired.
As discussed in the previous section, sup-pression of sinus node activity may occur because of increased parasympathetic tone. Different regions of the heart have different sensitivities to parasympathetic (vagal) stimu-lation. The SA node and the AV node are most sensitive to such an infl uence, followed by atrial tissue. The ventricular conducting sys-tem is the least sensitive. Therefore, moder-ate parasympathetic stimulation slows the sinus rate and allows the pacemaker to shift to the AV node. However, very strong para-sympathetic stimulation suppresses excitabil-ity at both the SA node and AV node, and may therefore result in the emergence of a ventri-cular escape pacemaker.
Enhanced Automaticity of Latent Pacemakers
Another means by which a latent pacemaker can assume control of impulse formation is if it develops an intrinsic rate of depolarization faster than that of the sinus node. Termed an ectopic beat, the impulse is premature rela-tive to the normal rhythm, whereas an escape
Figure 11.6. Effect of sympathetic and parasym-pathetic (cholinergic) stimulation on pacemaker current channels. The channels through which the pacemaker current (If) fl ows are voltage gated, opening at more negative membrane potentials. At any given voltage, there exists a probability be-tween 0 and 1 that a specifi c channel will be open. Compared with normal baseline behavior (curve A), sympathetic stimulation (curve B) or treatment with anticholinergic drugs shifts this probability to a higher value for any given level of membrane voltage, thus increasing the number of open chan-nels and the rate at which the cell will fi re. Curve C shows that parasympathetic stimulation (or treat-ment with �-blockers) has the opposite effect, de-creasing the probability of a channel being open, and therefore inhibiting depolarization.
77237_ch11.indd 26777237_ch11.indd 267 8/11/10 8:15:29 AM8/11/10 8:15:29 AM

Chapter 11
268
beat is late and terminates a pause caused by a slowed sinus rhythm. A sequence of similar ectopic beats is called an ectopic rhythm.
Ectopic beats may arise in several circum-stances. For example, high catecholamine con-centrations can enhance the automaticity of latent pacemakers, and if the resulting rate of depolarization exceeds that of the sinus node, then an ectopic rhythm will develop. Ectopic beats are also commonly induced by hypox-emia, ischemia, electrolyte disturbances, and certain drug toxicities (such as digitalis, as de-scribed in Chapter 17).
Abnormal Automaticity
Cardiac tissue injury may lead to pathologic changes in impulse formation whereby myo-cardial cells outside the specialized conduction system acquire automaticity and spontane-ously depolarize. Although such activity may appear similar to impulses originating from latent pacemakers within the specialized conduction pathways, these ectopic beats arise from cells that do not usually possess automaticity. If the rate of depolarization of such cells exceeds that of the sinus node, they transiently take over the pacemaker function and become the source of an abnor-mal ectopic rhythm.
Because these myocardial cells have few or no activated pacemaker channels, they do not normally carry If. How injury allows such cells to spontaneously depolarize has not been fully elucidated. However, when myocytes
become injured, their membranes become “leaky.” As such, they are unable to maintain the concentration gradients of ions, and the resting potential becomes less negative (i.e., the cell partially depolarizes). When a cell’s membrane potential is reduced to a value less negative than �60 mV, gradual phase 4 de-polarization can be demonstrated even among nonpacemaker cells. This spontaneous depo-larization probably results from a very slowly inactivating calcium current and a decrease in the outward potassium current that normally acts to repolarize the cell.
Triggered Activity
Under certain conditions, an action potential can “trigger” abnormal depolarizations that re-sult in extra heart beats or rapid arrhythmias. This process may occur when the fi rst action potential leads to oscillations of the membrane voltage known as afterdepolarizations. Unlike the spontaneous activity seen when enhanced automaticity occurs, this type of automaticity is stimulated by a preceding action potential. As illustrated in Figures 11.7 and 11.8, there are two types of afterdepolarizations depend-ing on their timing after the inciting action potential: early afterdepolarizations occur during the repolarization phase of the incit-ing beat, whereas delayed afterdepolarizations occur shortly after repolarization has been completed. In either case, abnormal action po-tentials are triggered if the afterdepolarization reaches a threshold voltage.
Figure 11.7. Triggered activity. An early afterdepolarization (arrow) occurs before the action potential (AP) has fully repolarized. Repetitive afterdepolarizations (dashed curve) may produce a rapid sequence of triggered action potentials and hence a tachyarrhythmia.
77237_ch11.indd 26877237_ch11.indd 268 8/11/10 8:15:29 AM8/11/10 8:15:29 AM

Mechanisms of Cardiac Arrhythmias
269
Early afterdepolarizations are changes of the membrane potential in the positive direc-tion that interrupt normal repolarization (see Fig 11.7). They can occur either during the plateau of the action potential (phase 2) or during rapid repolarization (phase 3). Early afterdepolarizations are more likely to develop in conditions that prolong the action po-tential duration (and therefore the electro-cardiographic QT interval), as may occur during therapy with certain drugs (see Chap-ter 17) and in the inherited long-QT syndromes (see Chapter 12).
The ionic current responsible for an early afterdepolarization depends on the membrane voltage at which the triggered event occurs. If the early afterdepolarization occurs during phase 2 of the action potential, when most of the Na� channels are in an inactivated state, the upstroke of the triggered beat relies mostly on an inward Ca�� current. If, however, the afterdepolarization occurs during phase 3 (when the membrane voltage is more nega-tive), there is partial recovery of the inactivated Na� channels, which then contribute more to the current underlying the triggered beat.
An early afterdepolarization-triggered ac-tion potential can be self-perpetuating and lead to a series of depolarizations (see Fig. 11.7). Early afterdepolarizations appear to be the initiating mechanism of the polymorphic ventricular tachycardia known as torsades de pointes, which is described in Chapter 12.
Delayed afterdepolarizations may appear shortly after repolarization is complete (see Fig. 11.8). They most commonly develop in
states of high intracellular calcium, as may be present with digitalis intoxication (see Chapter 17), or during marked catecholamine stimula-tion. It is thought that intracellular Ca�� ac-cumulation causes the activation of chloride currents or of the Na�–Ca�� exchanger that results in brief inward currents that generate the delayed afterdepolarization.
As with early afterdepolarizations, if the amplitude of the delayed afterdepolarization reaches a threshold voltage, an action potential will be generated. Such action potentials can be self-perpetuating and lead to tachyarrhyth-mias. Some idiopathic ventricular tachycardias that occur in otherwise structurally normal hearts are likely due to this mechanism, as are atrial and ventricular tachycardias associated with digitalis toxicity (see Chapter 17).
ALTERED IMPULSE CONDUCTION
Alterations in impulse conduction also lead to arrhythmias. Conduction blocks generally slow the heart rate (bradyarrhythmias); however, under certain circumstances, the process of reentry (described later) can ensue and produce abnormal fast rhythms (tachyarrhythmias).
Conduction Block
A propagating impulse is blocked when it en-counters a region of the heart that is electrically unexcitable. Conduction block can be either transient or permanent and may be unidirec-tional (i.e., conduction proceeds when the in-volved region is stimulated from one direction,
Figure 11.8. Triggered activity. A delayed afterdepolarization (arrow) arises after the cell has fully repolarized. If the delayed afterdepolarization reaches the threshold voltage, a propagated action potential (AP) is triggered (dashed curve).
77237_ch11.indd 26977237_ch11.indd 269 8/11/10 8:15:30 AM8/11/10 8:15:30 AM

Chapter 11
270
but not when stimulated from the opposite direction, as described below) or bidirectional (conduction is blocked in both directions). Various conditions may cause conduction block, including ischemia, fi brosis, infl am-mation, and certain drugs. When conduction block occurs because a propagating impulse encounters cardiac cells that are still refractory (from a previous depolarization), the block is said to be functional. A propagating impulse that arrives later may be conducted. For exam-ple, antiarrhythmic drugs that prolong action potential duration tend to produce functional conduction block. When conduction block is caused by a barrier imposed by fi brosis or scarring that replaces myocytes, conduction block is fi xed.
Conduction block within the specialized conducting system of the AV node or the His-Purkinje system prevents normal propagation of the cardiac impulse from the sinus node to more distal sites. This atrioventricular block (AV block) removes the normal overdrive suppression that keeps latent pacemakers in the His-Purkinje system in check. Thus, con-duction block usually results in emergence of escape beats or escape rhythms, as the more distal sites assume the pacemaker function.
AV block is common and a major reason for implantation of a permanent pacemaker, as discussed in Chapter 12.
Unidirectional Block and Reentry
A common mechanism by which altered impulse conduction leads to tachyarrhythmias is termed reentry. During such a rhythm, an electric impulse circulates repeatedly around a reentry path, recurrently depolarizing a region of cardiac tissue.
During normal cardiac conduction, each electric impulse that originates in the SA node travels in an orderly, sequential fashion through the rest of the heart, ultimately depolarizing all the myocardial fi bers. The refractory period of each cell prevents immediate reexcitation from adjacent depolarized cells, so that the impulse stops when all of the heart muscle has been excited. However, conduction blocks that pre-vent rapid depolarization of parts of the myo-cardium can create an environment conducive
to continued impulse propagation and reentry, as illustrated in Figure 11.9.
The fi gure depicts electric activity as it fl ows through a branch point anywhere within the conduction pathways. Panel A shows propa-gation of a normal action potential. At point x, the impulse reaches two parallel pathways (� and �) and travels down each into the more distal conduction tissue. In the normal heart, the � and � pathways have similar conduction velocities and refractory periods such that the wave fronts that pass through them may col-lide in the distal conduction tissue and extin-guish each other.
Panel B shows what happens if conduction is blocked in one limb of the pathway. In this example, the action potential is obstructed when it encounters the � pathway from above and therefore propagates only down the � tract into the distal tissue. As the impulse continues to spread, it encounters the distal end of the � pathway (at point y). If the tissue in the distal � tract is also unable to conduct, the impulse simply continues to propagate into the deeper tissues and reentry does not occur. However, if the impulse at point y is able to propagate retrogradely (backward) into pathway �, one of the necessary conditions for reentry has been met.
When an action potential can conduct in a retrograde direction in a conduction pathway, whereas it had been prevented from doing so in the forward direction, unidirectional block is said to be present. Unidirectional block tends to occur in regions where the re-fractory periods of adjacent cells are hetero-geneous, such that some cells recover before others. In addition, unidirectional block may occur in states of cellular dysfunction, and in regions where fi brosis has altered the myo-cardial structure.
As shown in panel C of Figure 11.9, if the impulse is able to propagate retrogradely up the � pathway, it will again arrive at point x. At that time, if the � pathway has not yet re-polarized from the previous action potential that had occurred moments earlier, that limb is refractory to repeat stimulation and the re-turning impulse simply stops there.
However, panel D illustrates what hap-pens if the velocity of retrograde conduction
77237_ch11.indd 27077237_ch11.indd 270 8/11/10 8:15:30 AM8/11/10 8:15:30 AM
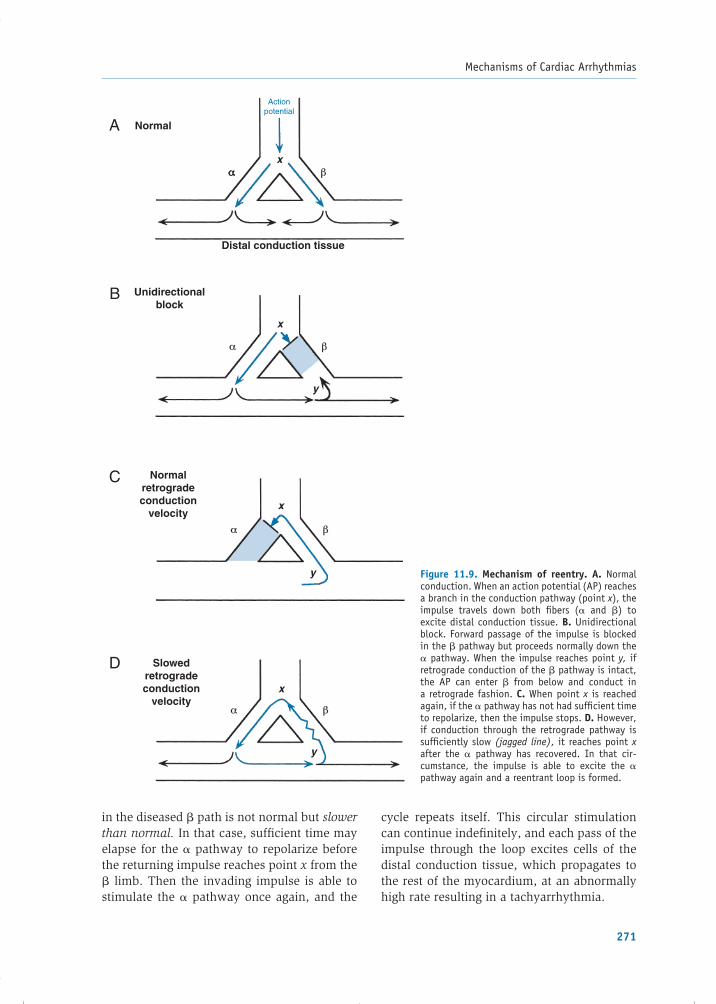
Mechanisms of Cardiac Arrhythmias
271
in the diseased � path is not normal but slower than normal. In that case, suffi cient time may elapse for the � pathway to repolarize before the returning impulse reaches point x from the � limb. Then the invading impulse is able to stimulate the � pathway once again, and the
cycle repeats itself. This circular stimulation can continue indefi nitely, and each pass of the impulse through the loop excites cells of the distal conduction tissue, which propagates to the rest of the myocardium, at an abnormally high rate resulting in a tachyarrhythmia.
Actionpotential
x
Normal
Unidirectionalblock
Distal conduction tissue
x
y
Normalretrogradeconduction
velocityx
y
Slowedretrogradeconduction
velocityx
y
D
C
B
A
αα β
α β
α β
α β
Figure 11.9. Mechanism of reentry. A. Normal conduction. When an action potential (AP) reaches a branch in the conduction pathway (point x), the impulse travels down both fi bers (� and �) to excite distal conduction tissue. B. Unidirectional block. Forward passage of the impulse is blocked in the � pathway but proceeds normally down the � pathway. When the impulse reaches point y, if retrograde conduction of the � pathway is intact, the AP can enter � from below and conduct in a retrograde fashion. C. When point x is reached again, if the � pathway has not had suffi cient time to repolarize, then the impulse stops. D. However, if conduction through the retrograde pathway is suffi ciently slow (jagged line), it reaches point x after the � pathway has recovered. In that cir-cumstance, the impulse is able to excite the � pathway again and a reentrant loop is formed.
77237_ch11.indd 27177237_ch11.indd 271 8/11/10 8:15:30 AM8/11/10 8:15:30 AM

Chapter 11
272
For the mechanism of reentry to occur, the propagating impulse must continuously en-counter excitable tissue. Thus, the time it takes for the impulse to travel around the reentrant loop must be greater than the time required for recovery (the refractory period) of the tis-sue, and this must be true for each point in the circuit. If the conduction time is shorter than the recovery time, the impulse will encounter refractory tissue and stop. Because normal conduction velocity in ventricular myocytes is approximately 50 cm/sec and their average effective refractory period is about 0.2 sec, a reentry path circuit would need to be at least 10 cm long for reentry to occur in a normal ventricle. However, with slower conduction velocities, a shorter reentry circuit is possible. Most clinical cases of reentry occur within small regions of tissue because the conduction velocity within the reentrant loop is, in fact, abnormally slow.
In summary, the two critical conditions for reentry are (1) unidirectional block and (2) slowed conduction through the reentry path. These conditions commonly occur in regions where fi brosis has developed, such as infarc-tion scars. In some cases, reentry occurs over an anatomically fi xed circuit or path, such as AV reentry using an accessory pathway (as discussed in the following section). Reentry around distinct anatomic pathways usually appears as a monomorphic tachycardia on the electrocardiogram (ECG); that is, in the case of ventricular tachycardia, each QRS has the same appearance as the preceding and sub-sequent QRS complexes. This is because the reentry path is the same from beat to beat, producing a stable, regular tachycardia. This is the most common mechanism of ventricular tachy cardia associated with areas of ventri cular scar, as from a prior myocardial infarction.
Other types of reentry do not require a stable, fi xed path. For example, one form can occur in electrically heterogeneous myo-cardium, in which waves of reentrant excitation spiral through the tissue, continually chang-ing direction. These so-called “spiral waves” can be initiated when a wave front of depo-larization encounters a broad region of func-tional block, which could be refractory from a preceding wave front, or be poorly excitable
tissue due to myocardial ischemia or be under the infl uence of certain antiarrhythmic medica-tions. Forward propagation of the wave front is asymmetrically blocked by this region, as the remainder of the front proceeds around the block. As the region repolarizes and becomes excitable again, parts of the wave front then spread retrogradely through it and continue in a spiral path following in the wake of the depo-larization that had just passed. Unlike an ana-tomically fi xed reentrant tract, the center of the spiral wave can move through the myocardium and even split into two or more reentry waves. In the ventricles, the resulting tachycardia has a continually changing QRS appearance pro-ducing polymorphic ventri cular tachycardia. If such activation is rapid and very disorganized, no distinct QRS complexes will be discernable and the rhythm is ventri cular fi brillation (as described in Chapter 12).
Accessory Pathways and the Wolff–Parkinson–White Syndrome
The concept of reentry is dramatically illustrated by the Wolff–Parkinson–White (WPW) syndrome. In the normal heart, the impulse generated by the SA node propagates through atrial tissue to the AV node, where expected slower conduction causes a short delay before continuing on to the ventricles. However, approximately 1 in 1,500 people has the WPW syndrome and is born with an ad-ditional connection between an atrium and ventricle. Termed an accessory pathway or bypass tract, this connection allows conduc-tion between the atria and ventricles to bypass the AV node. The most common type of accessory pathway consists of microscopic fi bers that span the AV groove somewhere along the mitral or tricuspid annuli (known as a bundle of Kent), as shown in Figure 11.10.
Because accessory pathway tissue conducts impulses faster than the AV node, stimulation of the ventricles during sinus rhythm begins earlier than normal, and the PR interval of the ECG is therefore shortened (usually �0.12 sec, or �3 small boxes). In this situation, the ven-tricles are said to be “preexcited.” However, the accessory pathway connects to ventri-cular myocardium rather than to the Purkinje
77237_ch11.indd 27277237_ch11.indd 272 8/11/10 8:15:30 AM8/11/10 8:15:30 AM

Mechanisms of Cardiac Arrhythmias
273
system, such that the subsequent spread of the impulse through the ventricles from that site is slower than usual. In addition, because normal conduction over the AV node proceeds concurrently, ventricular depolarization rep-resents a combination of the electric impulse traveling via the accessory tract and that con-ducted through the normal conduction path-way. As a result, the QRS complex in patients with WPW is wider than normal and demon-strates an abnormally slurred initial upstroke, known as a delta wave (Fig. 11.10).
During sinus rhythm, simultaneous con-duction through the accessory pathway and AV node creates an interesting ECG appear-ance but causes no symptoms. The presence of the abnormal pathway, however, creates an ideal condition for reentry because the refrac-tory period of the pathway is usually different from that of the AV node. An appropriately timed abnormal impulse (e.g., a premature beat) may encounter block in the accessory pathway but conduct through the AV node, or vice versa. If the propagating impulse then fi nds that the initially blocked pathway has re-covered (unidirectional block), it can conduct in a retrograde direction up to the atrium and then down the other pathway back to the ven-tricles. Thus, a large anatomic loop is estab-lished, with the accessory pathway serving as
one limb and the normal conduction pathway through the AV node as the other. The clinical characteristics of the WPW syndrome, includ-ing the types of reentrant tachycardia associ-ated with it, are described in Chapter 12.
The mechanisms of altered impulse for-mation and conduction form the basis of all common arrhythmias, both abnormally slow rhythms (bradyarrhythmias) and abnormally fast ones (tachyarrhythmias). Table 11.1 lists the underlying mechanisms and examples of their commonly associated rhythm distur-bances.
PHYSIOLOGIC BASIS OF ANTIARRHYTHMIC THERAPY
Appropriate treatment of a rhythm disor-der depends on its severity and its likely mechanism. When an arrhythmia produces severe hypotension or cardiac arrest, it must be immediately terminated to restore effec-tive cardiac function. Therapy for termina-tion may include electric cardioversion (an electric “shock”) for tachycardias, cardiac pacing for bradycardias, or administration of medications.
Additional therapy to prevent recurrences is guided by the etiology of the rhythm
AVnode
WidenedQRS
QRS
P T
Delta wave
SAnode
Bypasstract
Shortened PR
Normal ECG
ECG with bypass tract
Figure 11.10. Accessory pathway (also termed a bypass tract). Example of an atrioventricular bypass tract (bundle of Kent), shown schematically, which can conduct impulses from the atrium directly to the ventricles, bypassing the AV node. The ECG demonstrates a short PR interval and a “delta wave” caused by early excitation of the ventricles via the accessory pathway. ECG, electrocardiogram; SA, sinoatrial.
77237_ch11.indd 27377237_ch11.indd 273 8/11/10 8:15:30 AM8/11/10 8:15:30 AM

Chapter 11
274
disturbance. Correctable factors that con-tribute to abnormal impulse formation and conduction (such as ischemia or electrolyte abnormalities) should be corrected. If there is a risk of recurrent arrhythmia, medica-tions that alter automaticity, conduction and/or refractoriness may be administered. Sometimes, catheter or surgical ablation of conduction pathways is undertaken to physically disrupt the region responsible for the arrhythmia. Other advanced options include implantation of a permanent pace-maker for serious bradyarrhythmias or an internal cardioverter-defi brillator (ICD) to automatically terminate malignant tachy-arrhythmias should they recur. The following sections summarize the common therapeutic
modalities, and Chapter 12 describes how they are used to address specifi c rhythm disorders.
Bradyarrhythmias
Not all slow heart rhythms require specifi c treatment. For those that do, pharmacologic therapy can increase the heart rate acutely, but the effect is transient. Electronic pacemak-ers are used when more sustained therapy is needed.
Pharmacologic Therapy
Pharmacologic therapy of bradyarrhythmias modifi es the autonomic input to the heart in one of two ways:
Table 11.1. Mechanisms of Arrhythmia Development
Abnormality Mechanism Examples
BradyarrhythmiasAltered impulse formation• Decreased automaticity Decreased phase 4 depolarization
(e.g., parasympathetic stimulation)
Sinus bradycardia
Altered impulse conduction• Conduction blocks Ischemic, anatomic, or drug-
induced impaired conductionFirst-, second-, and third-degree AV blocks
TachyarrhythmiasAltered impulse formation• Enhanced automaticity Sinus node
AV node Ectopic focus
Increased phase 4 depolarization (e.g., sympathetic stimulation)
Acquires phase 4 depolarization
Sinus tachycardia
AV junctional tachycardiaEctopic atrial tachycardia and some forms of VT
• Triggered activity Early afterdepolarization
Delayed afterdepolarization
Prolonged action potential durationIntracellular calcium overload (e.g., digitalis toxicity)
Torsades de pointes
APBs, VPBs, digitalis-induced arrhythmias, “idiopathic” VT
Altered impulse conduction• Reentry
Anatomical
Functional
Unidirectional block plus slowed conduction
Atrial fl utter, AV nodal reentrant tachycardia, VT related to
ventricular scar tissueAtrial fi brillation, polymorphic VT, ventricular fi brillation
AV, atrioventricular; APB, atrial premature beat; VPB, ventricular premature beat; VT, ventricular tachycardia.
77237_ch11.indd 27477237_ch11.indd 274 8/11/10 8:15:32 AM8/11/10 8:15:32 AM

Mechanisms of Cardiac Arrhythmias
275
1. Anticholinergic drugs (i.e., antimuscarinic agents such as atropine). Vagal stimulation reduces the rate of sinus node depolariza-tion (which slows the heart rate) and de-creases conduction through the AV node, through the release of acetylcholine onto muscarinic receptors. Anticholinergic drugs competitively bind to muscarinic receptors and thereby reduce the vagal effect. This results in an increased heart rate and en-hanced AV nodal conduction.
2. �1-Receptor agonists (e.g., isoproterenol). Mimicking the effect of endogenous cate-cholamines, these drugs increase heart rate and speed AV nodal conduction.
Atropine and isoproterenol are adminis-tered intravenously. Although these drugs are useful in managing certain slow heart rhythms emergently, it is not practical to continue them over the long term to treat persistent brady-arrhythmias.
Electronic Pacemakers
Electronic pacemakers apply repeated electric stimulation to the heart to initiate depolar-izations at a desired rate, thereby assuming control of the rhythm. Pacemakers may be in-stalled on a temporary or a permanent basis. Temporary units are used to stabilize patients who are awaiting implantation of a permanent pacemaker or to treat transient bradyarrhyth-mias, such as those caused by reversible drug toxicities.
There are two types of temporary pace-makers. External transthoracic pacemakers deliver electric pulses to the patient’s chest through large adhesive electrodes placed on the skin. The advantage of this technique is that it can be applied rapidly. Unfortunately, because the current used must be suffi cient to initiate a cardiac depolarization, it stimu-lates thoracic nerves and skeletal muscle, which can be quite uncomfortable. Therefore, this form of pacing is usually used only on an emergency basis until another means of treat-ing the arrhythmia can be implemented.
The other option for temporary pacing is a transvenous unit. In this case, an electrode-tipped catheter is inserted percutaneously
into the venous system, passed into the heart, and connected to an external power source (termed a pulse generator). Electric pulses are applied directly to the heart through the elec-trode catheter, which is typically placed in the right ventricle or right atrium. This type of pac-ing is not painful and can be effective for days. There is, however, a risk of infection and/or thrombosis associated with the catheter.
Permanent pacemakers are more sophis-ticated than the temporary variety. Various confi gurations can sense and capture the elec-tric activity of the atria and/or ventricles. One or more wires (known as leads) with pacing electrodes are passed through an axillary or subclavian vein into the right ventricle or right atrium, or through the coronary sinus into a cardiac vein (to stimulate the left ventricle). The pulse generator, similar in size to two silver dollars stacked on top of one another, is connected to the leads and then implanted under the skin, typically in the infraclavicular region. The pacemaker battery typically lasts about 10 years.
Modern permanent pacemakers sense car-diac activity and pace only when needed. They incorporate complex functions to track the patient’s normal heart rate and can stimu-late beats automatically in response to activ-ity. They can also record useful data, such as whether fast rates have been sensed (that might indicate a tachyarrhythmia), the amount of pacing that has been required, and other parameters of pacemaker function. An external radio frequency programming device is used to “interrogate” the pacemaker to obtain the recorded information and to adjust the pacing functions.
Although the most common indications for permanent pacemakers are bradyarrhyth-mias, pacemakers that incorporate a left ventricular pacing lead are also used to im-prove cardiac performance in some patients with heart failure (cardiac resynchronization t herapy—see Chapter 9).
Tachyarrhythmias
The treatment of tachyarrhythmias is di-rected at (1) protection of the patient from the consequences of the arrhythmia and (2) the
77237_ch11.indd 27577237_ch11.indd 275 8/11/10 8:15:32 AM8/11/10 8:15:32 AM
Chapter 11
276
specifi c mechanism responsible for the ab-normal rhythm. Pharmacologic agents and cardio version/defi brillation are commonly used approaches, but innovative electric devices and transvenous catheter–based tech-niques to intentionally damage (ablate) ar-rhythmia-causing tissue have revolutionized treatment of these disorders.
Pharmacologic Therapy
Pharmacologic management of tachyarrhyth-mias is directed against the underlying mech-anism (abnormal automaticity, reentrant circuits, or triggered activity). Many anti-arrhythmic drugs are available and the choice of which to use relies on the cause of the specifi c arrhythmia. From consideration of the arrhythmia mechanisms presented in this chapter, the following strategies emerge.
Desired Drug Effects to Eliminate Rhythms Caused by Increased Automaticity:
1. Reduce the slope of phase 4 spontaneous depolarization of the automatic cells
2. Make the diastolic potential more negative (hyperpolarize)
3. Make the threshold potential less negative
Desired Antiarrhythmic Effects to Interrupt Reentrant Circuits:
1. Decrease conduction in the reentry circuit to the point that conduction fails, thus stop-ping the reentry impulse
2. Increase the refractory period within the reentrant circuit so that a propagating im-pulse fi nds tissue within the loop unexcit-able and the impulse stops
3. Suppress premature beats that can initiate reentry
Desired Drug Effects to Eliminate Triggered Activity:
1. Shorten the action potential duration (to prevent early afterdepolarizations)
2. Correct conditions of calcium overload (to prevent delayed afterdepolarizations)
Drugs used to achieve these goals modulate the action potential through interactions with
ion channels, surface receptors, and transport pumps. Many drugs have multiple effects and may attack arrhythmias through more than one mechanism. The commonly used anti-arrhythmic drugs and their actions are de-scribed in Chapter 17.
It is extremely important to recognize that in addition to suppressing arrhythmias, these drugs have the potential to aggravate or provoke certain rhythm disturbances. This undesired consequence is referred to as proarrhythmia and is a major limitation of contemporary antiarrhythmic drug therapy. For example, antiarrhythmic agents that act therapeutically to prolong the action poten-tial duration can, as an undesired effect, cause early afterdepolarizations, the mecha-nism underlying the polymorphic ventricular tachycardia known as torsades de pointes (see Chapter 12). In addition, most agents used to treat tachyarrhythmias have the potential to aggravate bradyarrhythmias, and all anti-arrhythmics have potentially toxic noncardiac side effects. These shortcomings have led to an increased reliance on nonpharmacologic treatment options, as described in the follow-ing sections.
Vagotonic Maneuvers
Many tachycardias involve transmission of impulses through the AV node, a struc-ture that is sensitive to vagal modulation. Vagal tone can be transiently increased by a number of bedside maneuvers, and per-forming these may slow conduction, which terminates some reentrant tachyarrhyth-mias. For example, carotid sinus massage is performed by rubbing firmly for a few seconds over the carotid sinus, located at the bifurcation of the internal and external carotid arteries on either side of the neck. This maneuver stimulates the baroreceptor reflex (see Chapter 13), which elicits the de-sired increase in vagal tone and withdrawal of sympathetic tone. This maneuver should be performed on only one carotid sinus at a time (to prevent interference with brain per-fusion) and is best avoided in patients with known atherosclerosis involving the carotid arteries.
77237_ch11.indd 27677237_ch11.indd 276 8/11/10 8:15:32 AM8/11/10 8:15:32 AM

Mechanisms of Cardiac Arrhythmias
277
Electric Cardioversion and Defi brillation
Cardioversion and defi brillation involve the application of an electric shock to terminate a tachycardia. A shock with suffi cient en-ergy depolarizes the bulk of excitable myo-cardial tissue, interrupts reentrant circuits, establishes electric homogeneity, and allows the sinus node (the site of fastest spontane-ous discharge) to regain pacemaker control. Tachyarrhythmias that are caused by reentry can usually be terminated by this procedure, whereas arrhythmias due to abnormal auto-maticity may simply persist.
External cardioversion is used to terminate supraventricular tachycardias or organized ven-tricular tachycardias. It is performed by briefl y sedating the patient and then placing two large electrode paddles (or adhesive electrodes) against the chest on either side of the heart. The electric discharge is electronically synchro-nized to occur at the time of a QRS complex (i.e., when ventricular depolarization occurs). This prevents the possibility of discharge during the T-wave, when a shock can induce re entry (leading to ventricular fi brillation) because re-gions of myocardium are in different phases of depolarization and recovery.
External defi brillation is performed to ter-minate ventricular fi brillation, employing the same equipment as that used for cardioversion. However, during fi brillation, there is no orga-nized QRS complex on which to synchronize the electric discharge, so it is delivered using the “asynchronous” mode of the device.
Implantable Cardioverter Defi brillators
ICDs automatically terminate dangerous ventri-cular arrhythmias using internal cardioversion/defi brillation, or by way of a special type of artifi cial pacing. These devices are implanted, in a manner similar to that of permanent pace-makers, in patients at high risk of sudden car-diac death from ventricular arrhythmias. The device continuously monitors cardiac activity, and if the heart rate exceeds a certain program-mable threshold for a specifi ed time, the ICD delivers an appropriate intervention, such as an electric shock. Internal cardioversion or de-fi brillation requires substantially less energy
than external defi brillation but is still painful if the patient is conscious.
The majority of monomorphic ventricular tachycardias can be terminated by an ICD with a rapid burst of electric impulses, termed anti-tachycardia pacing (ATP), rather than a shock. The goal is to artifi cially pace the heart at a rate faster than the tachycardia to prematurely de-polarize a portion of a reentrant circuit, thereby rendering it refractory to further immediate stimulation. Consequently, when a reentrant impulse returns to the zone that has already been depolarized by the device, it encounters unexcitable tissue, it cannot propagate further, and the circuit is broken. An advantage of the ATP technique is that, unlike internal cardio-version, it is painless. However, ATP is not effective for terminating ventricular fi brillation, a situation in which the device is programmed to deliver an electric shock instead.
Catheter Ablation
If an arrhythmia originates from a distinct ana-tomical reentry circuit or an automatic focus, electrophysiologic mapping techniques can be used to localize the region of myocardium or conduction tissue responsible for the distur-bance. It is then often possible to ablate the site via a catheter that applies radiofrequency current to heat and destroy the tissue. Such procedures have revolutionized the manage-ment of patients with many types of tachy-cardias, because they often offer a permanent therapeutic solution that spares patients from prolonged antiarrhythmic drug therapy. Addi-tionally, for patients with ICDs and recurrent ventricular tachycardias causing defi brillator shocks, ablation is often effective in reducing the frequency of episodes.
SUMMARY
1. Arrhythmias result from disorders of im-pulse formation, impulse conduction, or both.
2. Bradyarrhythmias develop because of de-creased impulse formation (e.g., sinus brady cardia) or decreased impulse conduc-tion (e.g., AV nodal conduction blocks).
77237_ch11.indd 27777237_ch11.indd 277 8/11/10 8:15:32 AM8/11/10 8:15:32 AM

Chapter 11
278
3. Tachyarrhythmias result from increased automaticity (of the SA node, latent pace-makers, or abnormal myocardial sites), triggered activity, or reentry.
4. Bradyarrhythmias are usually treated with drugs that accelerate the rate of sinus node discharge and enhance AV nodal conduc-tion (atropine, isoproterenol) or electronic pacemakers.
5. Pharmacologic therapy for tachyarrhyth-mias is directed at the mechanism re-sponsible for the rhythm disturbance. For refractory tachyarrhythmias, or in emer-gency situations, electric cardioversion or defi brillation is used. Catheter-based ab-lative techniques are useful for long-term
control of certain tachyarrhythmias. ICDs are lifesaving devices implanted in patients at high risk of sudden cardiac death be-cause of ventricular tachyarrhythmias.
Chapter 12 describes the diagnosis and management of the most common arrhyth-mias. Additional reading suggestions are listed at the end of that chapter. Chapter 17 describes commonly used antiarrhythmic drugs.
Acknowledgments
Contributors to the previous editions of this chapter were Hillary K. Rolls, MD; Wendy Armstrong, MD; Nicholas Boulis, MD; Jennifer E. Ho, MD; Mark S. Sabatine, MD; Elliott M. Antman, MD; Leonard I. Ganz, MD; Gary R. Strichartz, PhD; and Leonard S. Lilly, MD.
77237_ch11.indd 27877237_ch11.indd 278 8/11/10 8:15:32 AM8/11/10 8:15:32 AM

279
C H A P T E R
12Clinical Aspects of Cardiac ArrhythmiasRanliang HuWilliam G. StevensonLeonard S. Lilly
BRADYARRHYTHMIASSinoatrial NodeEscape RhythmsAtrioventricular Conduction System
TACHYARRHYTHMIASSupraventricular ArrhythmiasVentricular Arrhythmias
ranges from 60 to 100 bpm. Bradyarrhythmias are rhythms in which the heart rate is �60 bpm. They arise from disorders of impulse formation or impaired impulse conduction, as discussed in Chapter 11.
Sinoatrial Node
Sinus Bradycardia
Sinus bradycardia (Fig. 12.1) is a slowing of the normal heart rhythm, as a result of decreased fi ring of the sinoatrial (SA) node, to a rate �60 bpm. Sinus bradycardia at rest or during sleep is normal and a benign fi nding in many people. Conversely, pathologic sinus bradycardia can result from either intrinsic SA node disease or extrinsic factors that affect the node. Depressed intrinsic automaticity can be caused by aging or any disease process that affects the atrium, including ischemic heart disease or cardiomyo-pathy. Extrinsic factors that suppress SA nodal activity include medications (e.g., �-blockers and certain calcium channel blockers) and met-abolic causes (e.g., hypothyroidism).
Chapter 11 presented the mechanisms by which abnormal heart rhythms develop.
This chapter describes how to recognize and treat such disorders. Table 12.1 categorizes the common arrhythmias considered in this chapter.
There are fi ve basic questions to consider when confronted with a patient with an abnor-mal heart rhythm, as detailed in the sections that follow:
1. Identifi cation: What is arrhythmia?
2. Pathogenesis: What is the underlying mechanism?
3. Precipitating factors: What conditions pro-voke it?
4. Clinical presentation: What symptoms and signs accompany the arrhythmia?
5. Treatment: What to do about it?
BRADYARRHYTHMIAS
The normal resting heart rate, resulting from repetitive depolarization of the sinus node,
77237_ch12.indd 27977237_ch12.indd 279 8/11/10 8:21:31 AM8/11/10 8:21:31 AM

Chapter 12
280
Highly trained athletes often have elevated vagal tone, which results in physiologic and asymptomatic resting sinus bradycardia. Transient periods of high vagal tone can also occur in individuals as a refl ex response to pain or fear, resulting in inappropriate sinus bradycardia.
Mild sinus bradycardia is usually asymp-tomatic and does not require treatment. How-ever, a pronounced reduction of the heart rate can produce a fall in cardiac output with fa-tigue, light-headedness, confusion, or syncope. In such cases, any extrinsic provocative factors should be corrected, and specifi c therapy, as described in the next section, may be needed.
Sick Sinus Syndrome
Intrinsic SA node dysfunction that causes peri-ods of inappropriate bradycardia is known as sick sinus syndrome (SSS). This condition often produces symptoms of dizziness, confusion, or syncope. Patients with this syndrome (or any
cause of symptomatic sinus bradycardia) can be treated with intravenous anticholinergic drugs (e.g., atropine) or �-adrenergic agents (e.g., isoproterenol), which transiently accel-erate the heart rate. If the problem is chronic and not corrected by removal of aggravating factors, placement of a permanent pacemaker is required.
SSS is common in elderly patients, who are also susceptible to supraventricular tachycardias (SVTs), most commonly atrial fi brillation (AF). This combination is known as the bradycardia–tachycardia syndrome (Fig. 12.2) and is thought to result from atrial fi brosis that impairs function of the SA node and predisposes to AF and fl utter. During the tachyarrhythmia, overdrive suppression of the SA node occurs, and when the tachycardia ter-minates, a period of profound sinus bradycar-dia may ensue. Treatment generally requires the combination of antiarrhythmic drug ther-apy to suppress the tachyarrhythmias plus a permanent pacemaker to prevent bradycardia.
Table 12.1. Common Arrhythmias
Location Bradyarrhythmias Tachyarrhythmias
SA node Sinus bradycardiaSick sinus syndrome
Sinus tachycardia
Atria Atrial premature beatsAtrial fl utterAtrial fi brillationParoxysmal supraventricular tachycardiasFocal atrial tachycardiaMultifocal atrial tachycardia
AV node Conduction blocksJunctional escape rhythm
Paroxysmal reentrant tachycardias (AV or AV nodal)
Ventricles Ventricular escape rhythm Ventricular premature beatsVentricular tachycardiaTorsades de pointesVentricular fi brillation
AV, atrioventricular; SA, sinoatrial.
Figure 12.1. Sinus bradycardia. The P wave and QRS complexes are normal but the rate is �60 bpm.
77237_ch12.indd 28077237_ch12.indd 280 8/11/10 8:21:31 AM8/11/10 8:21:31 AM

Clinical Aspects of Cardiac Arrhythmias
281
Escape Rhythms
Cells in the atrioventricular (AV) node and His–Purkinje system are capable of automatic-ity but typically have slower fi ring rates than the sinus node and are therefore suppressed during normal sinus rhythm. However, if SA node activity becomes impaired or if there is conduction block of the impulse from the SA node, escape rhythms can emerge from the more distal latent pacemakers (Fig. 12.3).
Junctional escape beats arise from the AV node or proximal bundle of His. They are char-acterized by a normal, narrow QRS complex, and when they occur in sequence (termed a junctional escape rhythm), appear at a rate of 40 to 60 bpm. The QRS complexes are not preceded by normal P waves because the im-pulse originates below the atria. However, retrograde P waves may be observed as an impulse propagates from the more distal pace-maker backward to the atrium. Retrograde P waves typically follow the QRS complex and are inverted (negative defl ection on the electrocardiogram [ECG]) in limb leads II, III,
and aVF, indicating activation of the atria from the inferior direction.
Ventricular escape rhythms are charac-terized by even slower rates (30 to 40 bpm) and widened QRS complexes. The complexes are wide because the ventricles are not de-polarized by the normal rapid simultaneous conduction over the right and left bundle branches but rather from a more distal point in the conduction system. The morphology that the QRS shows depends on the site of origin of the escape rhythm. For example, an escape rhythm originating from the left bundle branch will cause a right bundle branch block QRS pattern, because the impulse depolarizes the left ventricle fi rst and then spreads more slowly through the right ventricle (RV). Con-versely, an escape rhythm originating in the right bundle branch causes the QRS to appear with a left bundle branch block confi guration. Escape rhythms that originate more distally, in the ventricular myocardium itself, are charac-terized by even wider QRS complexes because such impulses are conducted outside the rap-idly propagating Purkinje fi bers.
Figure 12.2. Bradycardia–tachycardia syndrome. A brief irregular tachycardia is followed by slow sinus node discharge.
Figure 12.3. Escape rhythms. No P waves are evident. A. Junctional escape rhythm with normal-width QRS complexes. B. Wide QRS complexes typical of a ventricular escape rhythm.
77237_ch12.indd 28177237_ch12.indd 281 8/11/10 8:21:32 AM8/11/10 8:21:32 AM

Chapter 12
282
Junctional and ventricular escape rhythms are protective backup mechanisms that main-tain a heart rate and cardiac output when the sinus node or normal AV conduction fails. The clinical fi ndings and treatment of bradycardia associated with escape rhythms are identical to those of SSS described earlier.
Atrioventricular Conduction System
The AV conduction system includes the AV node, bundle of His, and the left and right bundle branches. Impaired conduction be-tween the atria and ventricles can result in three degrees (types) of AV conduction block.
First-Degree AV Block
First-degree AV block, shown in Figure 12.4, indicates prolongation of the normal delay between atrial and ventricular depolarization, such that the PR interval is lengthened (�0.2 sec, which is �5 small boxes on the ECG). In this situation, the 1:1 relationship between P waves and QRS complexes is preserved. The impairment of conduction is usually within the AV node itself and can be caused by a tran-sient reversible infl uence or a structural defect. Reversible causes include heightened vagal tone, transient AV nodal ischemia, and drugs that depress conduction through the AV node, including �-blockers, certain calcium channel
antagonists, digitalis, and other antiarrhythmic medications. Structural causes of fi rst-degree AV block include myocardial infarction and chronic degenerative diseases of the conduction system, which commonly occur with aging.
Generally, fi rst-degree AV block is a benign, asymptomatic condition that does not require treatment. However, it can indicate disease in the AV node associated with susceptibility to higher degrees of AV block if drugs are admin-istered that further impair AV conduction, or if the conduction disease progresses.
Second-Degree AV Block
Second-degree AV block is characterized by intermittent failure of AV conduction, result-ing in some P waves not followed by a QRS complex. There are two forms of second- degree AV block. In Möbitz type I block (also termed Wenckebach block), shown in Figure 12.5, the degree of AV delay gradually increases with each beat until an impulse is completely blocked, such that a QRS does not follow a P wave for a single beat. Therefore, the ECG shows a progressive increase in the PR interval from one beat to the next until a single QRS complex is absent, after which the PR interval shortens to its initial length, and the cycle starts anew. Möbitz type I block almost always results from impaired conduc-tion in the AV node (rather than more distally
P P P P P
Figure 12.4. First-degree AV block. The PR interval is prolonged.
P P P P P P
Figure 12.5. Second-degree AV block: Möbitz type I (Wenckebach). The P-wave rate is constant, but the PR interval progressively lengthens until a QRS is completely blocked (after fourth P wave).
77237_ch12.indd 28277237_ch12.indd 282 8/11/10 8:21:32 AM8/11/10 8:21:32 AM

Clinical Aspects of Cardiac Arrhythmias
283
in the conduction system). It is usually benign and may be seen in children, trained athletes, and people with high vagal tone, particularly during sleep. It may also occur during an acute myocardial infarction because of increased vagal tone or ischemia of the AV node, but the block is usually temporary. Treatment is typi-cally not necessary, but in symptomatic cases, administration of intravenous atropine or iso-proterenol usually improves AV conduction transiently. Placement of a permanent pace-maker is required for a symptomatic block that does not resolve spontaneously or persists de-spite the correction of aggravating factors.
Möbitz type II second-degree AV block is characterized by the sudden intermittent loss of AV conduction, without preceding gradual lengthening of the PR interval (Fig. 12.6). The block may persist for two or more beats (i.e., two sequential P waves not followed by QRS complexes), in which case it is known as high-grade AV block (Fig. 12.7). Möbitz type II block is usually caused by conduction block beyond the AV node (in the bundle of His or more distally in the Purkinje system), and the QRS pattern often is widened in a pattern of right or left bundle branch block. This type of block may arise from extensive myocardial in-farction involving the septum or from chronic degeneration of the His–Purkinje system. It usually indicates severe disease and is more
dangerous than Möbitz type I block. Möbitz type II may progress to third-degree block without warning; therefore, treatment with a pacemaker is usually warranted, even in asymptomatic patients.
Third-Degree AV Block
Third-degree AV block, also termed complete heart block (Fig. 12.8), is present when there is complete failure of conduction between the atria and ventricles. In adults, the most com-mon causes are acute myocardial infarction and chronic degeneration of the conduction path-ways with age. Third-degree AV block electri-cally disconnects the atria and ventricles; there is no relationship between the P waves and QRS complexes because the atria depolarize in response to SA node activity, while a more distal escape rhythm drives the ventricles inde-pendently. Thus, the P waves “march out” at a rate that is not related to the intervals at which QRS complexes appear. Depending on the site of the escape rhythm, the QRS complexes may be of normal width and occur at 40 to 60 bpm (originating from the AV node) or may be wid-ened and occur at slower rates (originating from the His–Purkinje system). As a result of the slow rate, patients frequently experience light-headedness or syncope. Permanent pace-maker therapy is almost always necessary.
Figure 12.6. Second-degree AV block: Möbitz type II. A QRS complex is blocked (after the fourth P wave) without gradual lengthening of the preceding PR intervals. While the QRS width in this example is normal, it is often widened in patients with Möbitz type II block.
P P P P P
P P P P P P
Figure 12.7. High-grade AV block. Sequential QRS complexes are blocked (after the second and third P waves).
77237_ch12.indd 28377237_ch12.indd 283 8/11/10 8:21:33 AM8/11/10 8:21:33 AM
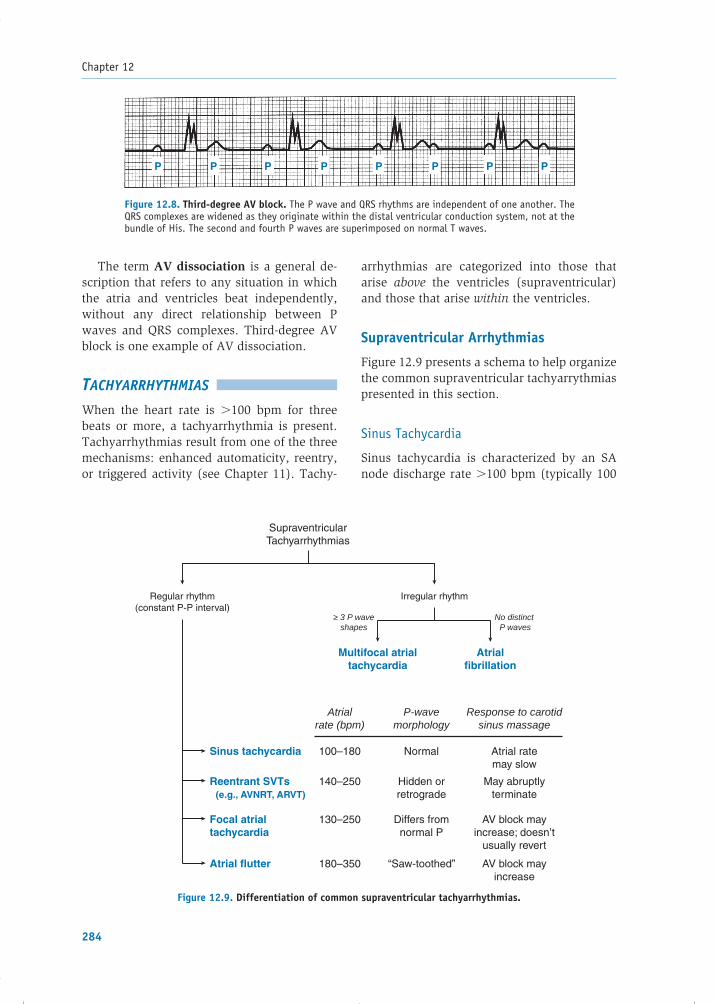
Chapter 12
284
The term AV dissociation is a general de-scription that refers to any situation in which the atria and ventricles beat independently, without any direct relationship between P waves and QRS complexes. Third-degree AV block is one example of AV dissociation.
TACHYARRHYTHMIAS
When the heart rate is �100 bpm for three beats or more, a tachyarrhythmia is present. Tachyarrhythmias result from one of the three mechanisms: enhanced automaticity, reentry, or triggered activity (see Chapter 11). Tachy-
arrhythmias are categorized into those that arise above the ventricles (supraventricular) and those that arise within the ventricles.
Supraventricular Arrhythmias
Figure 12.9 presents a schema to help organize the common supraventricular tachyarrythmias presented in this section.
Sinus Tachycardia
Sinus tachycardia is characterized by an SA node discharge rate �100 bpm (typically 100
P P PP PP PP
Figure 12.8. Third-degree AV block. The P wave and QRS rhythms are independent of one another. The QRS complexes are widened as they originate within the distal ventricular conduction system, not at the bundle of His. The second and fourth P waves are superimposed on normal T waves.
Sinus tachycardia
Reentrant SVTs (e.g., AVNRT, ARVT)
Focal atrialtachycardia
Atrial flutter
Atrialrate (bpm)
P-wavemorphology
100–180 Normal Atrial ratemay slow
Response to carotidsinus massage
140–250 Hidden orretrograde
May abruptlyterminate
130–250 Differs fromnormal P
AV block mayincrease; doesn’t
usually revert
180–350 “Saw-toothed” AV block mayincrease
Regular rhythm(constant P-P interval)
SupraventricularTachyarrhythmias
Multifocal atrialtachycardia
Atrialfibrillation
Irregular rhythm
≥ 3 P waveshapes
No distinct P waves
Figure 12.9. Differentiation of common supraventricular tachyarrhythmias.
77237_ch12.indd 28477237_ch12.indd 284 8/11/10 8:21:33 AM8/11/10 8:21:33 AM

Clinical Aspects of Cardiac Arrhythmias
285
to 180 bpm) with normal P waves and QRS complexes (Fig. 12.10). This rhythm most often results from increased sympathetic and/or decreased vagal tone. Sinus tachycardia is an appropriate physiologic response to exer-cise. However, it may also result from sym-pathetic stimulation in pathologic conditions, including fever, hypoxemia, hyperthyroidism, hypovolemia, and anemia. In disease states, sinus tachycardia is usually a sign of the se-verity of the primary pathophysiologic pro-cess and treatment should be directed at the underlying cause.
Atrial Premature Beats
Atrial premature beats (APBs) are common in healthy as well as diseased hearts (Fig. 12.11). They originate from automaticity or reentry in an atrial focus outside the SA node and are often exacerbated by sympathetic stimulation. APBs are usually asymptomatic but may cause palpitations. On the ECG, an APB appears as an earlier-than-expected P wave with an abnormal shape (the impulse does not arise from the SA node, resulting in abnormal con-duction through the atria). The QRS complex that follows the P wave is usually normal, resembling the QRS during sinus rhythm, be-cause ventricular conduction is not impaired. However, if the abnormal atrial focus fi res
very soon after the previous beat, the impulse may encounter an AV node that is refractory to excitation, resulting in a blocked impulse that does not conduct to the ventricles. The pre-mature P wave is then not followed by a QRS complex and is termed a blocked APB. Simi-larly, if the ectopic focus fi res just a bit later in diastole, it may conduct through the AV node but encounter portions of the His–Purkinje system that are still refractory. As a result, the impulse is conducted through those territories and to the ventricular myocytes more slowly than normal, producing QRS complexes that are abnormally wide (termed an APB with ab-errant conduction).
APBs require treatment only if they are symptomatic. Because caffeine, alcohol, and adrenergic stimulation (e.g., emotional stress) can all predispose to APBs, it is important to address these factors. �-Blockers are the initial preferred pharmacologic treatment if needed.
Atrial Flutter
Atrial fl utter is characterized by rapid, regu-lar atrial activity at a rate of 180 to 350 bpm (Fig. 12.12). Many of these fast impulses reach the AV node during its refractory period and do not conduct to the ventricles, resulting in a slower ventricular rate, often an even fraction
Figure 12.10. Sinus tachycardia. The P wave and QRS complexes are normal, but the rate is �100 bpm.
APB
Figure 12.11. Atrial premature beat (APB). The P wave occurs earlier than expected, and its shape is abnormal.
77237_ch12.indd 28577237_ch12.indd 285 8/11/10 8:21:33 AM8/11/10 8:21:33 AM

Chapter 12
286
of the atrial rate. Thus, if the atrial rate is 300 bpm and 2:1 block occurs at the AV node (i.e., every other atrial impulse fi nds the AV node refractory), the ventricular rate is 150 bpm. Because vagal maneuvers (e.g., carotid sinus massage) decrease AV nodal conduction, they increase the degree of block, temporarily slow-ing the ventricular rate, which allows better visualization of the underlying atrial activity. In general, atrial fl utter is caused by reentry over a large anatomically fi xed circuit. In the common form of atrial fl utter, this circuit is the atrial tissue along the tricuspid valve annu-lus: the circulating depolarization wave propa-gates up the interatrial septum, across the roof and down the free wall of the right atrium and fi nally along the fl oor of the right atrium between the tricuspid valve annulus and inferior vena cava. Because large parts of the atrium are depolarized throughout the cycle, P waves often have a sinusoidal or “sawtooth” appearance. Large fl utter circuits can occur in other parts of the right or left atrium as well, usually associated with areas of atrial scarring from disease, prior heart surgery, or ablation procedures.
Atrial fl utter generally occurs in patients with preexisting heart disease. It may be par-oxysmal and transient, persistent (lasting for days or weeks), or permanent. Symptoms of atrial fl utter depend on the accompanying ventricular rate. If the rate is �100 bpm, the patient may be asymptomatic. Conversely, faster rates often cause palpitations, dysp-nea, or weakness. Paradoxically, antiarrhyth-mic medications that reduce the rate of atrial fl utter by slowing conduction in the atrium may paradoxically make the rhythm more
dangerous by allowing the AV node more time to recover between impulses. In this situa-tion, the AV node may begin to conduct in a 1:1 fashion, producing very rapid ventricular rates. For example, a patient with atrial fl utter at a rate of 280 bpm and 2:1 conduction block at the AV node would have a ventricular rate of 140 bpm. If the atrial rate then slows to 220 bpm, the AV node may be able to recover suf-fi ciently between depolarizations to conduct every atrial impulse, causing the ventricular rate to accelerate to 220 bpm. In patients with limited cardiac reserve, this acceleration may result in a profound reduction of cardiac out-put and hypotension. Atrial fl utter also predis-poses to atrial thrombus formation.
Several approaches to the treatment of atrial fl utter are available:
1. For symptomatic patients with recent-onset atrial fl utter, the most expeditious therapy is electrical cardioversion to restore sinus rhythm. This technique is also used to re-vert chronic atrial fl utter that has not re-sponded to other approaches.
2. Flutter can be terminated by rapid atrial stimulation (burst pacing) using a tempo-rary or permanent pacemaker (see Chap-ter 11). This procedure can be used when temporary atrial pacing wires are already present, as in the days following cardiac surgery. In addition, certain types of per-manent pacemakers and implanted defi bril-lators can be programmed to perform burst pacing automatically when atrial fl utter occurs.
3. Patients without an immediate need for cardioversion can begin pharmacologic
Figure 12.12. Atrial fl utter is typifi ed by rapid “saw-toothed” atrial activity (arrows).
77237_ch12.indd 28677237_ch12.indd 286 8/11/10 8:21:34 AM8/11/10 8:21:34 AM

Clinical Aspects of Cardiac Arrhythmias
287
therapy. First, the ventricular rate is slowed by drugs that increase AV block: �-blockers, calcium channel blockers (e.g., verapamil, diltiazem), or digoxin. Once the rate is effectively slowed, attempts are made to restore sinus rhythm using antiarrhythmic drugs that slow conduction or prolong the refractory period of the atrial myocar-dium (class IA, IC, or III agents; see Chap-ter 17). Should these drugs fail to convert the rhythm, electrical cardioversion can be undertaken. Once sinus rhythm has been restored, class IA, IC, or III antiarrhythmic drugs may be administered chronically to prevent recurrences.
4. When chronic therapy is required to pre-vent recurrences, catheter ablation is often a better alternative than pharmacologic approaches. In this method, an electrode catheter is inserted into the femoral vein, passed via the inferior vena cava to the right atrium, and used to localize and cau-terize (ablate) part of the reentrant loop to permanently interrupt the fl utter circuit.
Atrial Fibrillation
AF is a chaotic rhythm with an atrial rate so fast (350 to 600 discharges/min) that dis-tinct P waves are not discernible on the ECG(Fig. 12.13). As with atrial fl utter, many of the atrial impulses encounter refractory tissue at the AV node, allowing only some of the depo-larizations to be conducted to the ventricles in a very irregular fashion (indicated by a char-acteristic “irregularly irregular” rhythm). The average ventricular rate in untreated AF is ap-proximately 140 to 160 bpm. Because discrete
P waves are not visible on the ECG, the base-line shows low-amplitude undulations punctu-ated by QRS complexes and T waves.
The mechanism of AF probably involves multiple wandering reentrant circuits within the atria, and in some patients, the rhythm re-petitively shifts between fi brillation and atrial fl utter. When fi brillation is paroxysmal (i.e., sudden, unpredictable episodes), it is often initiated by rapid fi ring of foci in sleeves of atrial muscle that extend into the pulmonary veins. To sustain AF, a minimum number of reentrant circuits is needed, and an enlarged atrium increases the potential for this to occur. Thus, AF is often associated with right or left atrial enlargement. Accordingly, diseases that increase atrial pressure and size promote AF, including heart failure, hypertension, coro-nary artery disease, and pulmonary disease. Thyrotoxicosis and alcohol consumption can precipitate AF in some people.
AF is a potentially dangerous arrhythmia because: (1) rapid ventricular rates may com-promise cardiac output, resulting in hypoten-sion and pulmonary congestion (especially in patients with a hypertrophied or “stiff” left ventricle in whom the loss of normal atrial contraction can signifi cantly reduce left ven-tricular fi lling and stroke volume), and (2) the absence of organized atrial contraction promotes blood stasis in the atria, increasing the risk of thrombus formation, particularly in the left atrial appendage. Embolization of left atrial thrombi is an important cause of stroke. Thus, treatment of AF considers three aspects of the arrhythmia: (1) ventricular rate control, (2) consideration of methods to restore sinus rhythm, and (3) assessment of the need for anticoagulation to prevent thromboembolism.
Figure 12.13. Atrial fi brillation is characterized by chaotic atrial activity without organized P waves and by irregularity of the ventricular (QRS) rate.
77237_ch12.indd 28777237_ch12.indd 287 8/11/10 8:21:34 AM8/11/10 8:21:34 AM

Chapter 12
288
Figure 12.14. Paroxysmal supraventricular tachycardia caused by AV nodal reentry. Retrograde P waves in this example occur simultaneously with, and are “hidden” in, the QRS complexes.
Antiarrhythmic drug treatment of AF is similar to that of atrial fl utter. �-Blockers or certain Ca�� channel antagonists (diltiazem, verapamil) are administered to promote block at the AV node and to reduce the ventricular rate. Digitalis is less effective for this pur-pose, although it may be useful in patients with accompanying impairment of ventricular contractile function. For those who remain symptomatic despite adequate rate control, con-version to sinus rhythm is usually attempted, as described in the next paragraph. AF that has been present for more than 48 hours may predispose to atrial thrombus formation, and systemic anticoagulation (for at least 3 weeks) is usually warranted prior to cardioversion to reduce the risk of thromboembolism. Alter-natively, a transesophageal echocardiogram can be performed to evaluate for the pres-ence of thrombus; if none is found, cardio-version may proceed directly, with minimum thromboembolic risk.
Cardioversion to sinus rhythm can be at-tempted chemically by administration of class IA, IC, or III antiarrhythmic drugs (see Chap-ter 17). Alternatively, electrical cardioversion can be undertaken. Following successful conversion to sinus rhythm, antiarrhythmic drugs are often continued in an attempt to prevent recurrences. Note that these drugs have the capacity to cause serious, sometimes lethal, side effects (see Chapter 17). Thus, in patients with asymptomatic AF, it is often ap-propriate to simply control the ventricular rate and continue anticoagulation therapy chronically, rather than to pursue cardiover-sion. Such an approach is supported by clini-cal trials of AF that have assessed long-term clinical outcomes.
Because the effi cacies and toxicities of an-tiarrhythmic drugs have been disappointing, nonpharmacologic options for the manage-ment of AF have been devised. For example, the surgical maze procedure places multiple in-cisions in the left and right atria to prevent the formation of reentry circuits and is sometimes performed in patients who undergo cardiac surgery for coronary artery or valve disease who also have AF. A less invasive approach is percutaneous catheter ablation. In this ap-proach, areas of the left atrium around the pulmonary veins are cauterized to interrupt potential reentry circuits and foci that initiate AF. It requires extensive catheter manipula-tion and ablation in the left atrium, and risks of the procedure includes stroke from systemic thromboembolism and cardiac perforation that can cause tamponade. Thus, catheter ablation for AF is usually reserved for patients who remain symptomatic despite pharmacologic approaches.
When sinus rhythm cannot be maintained and the heart rate cannot be controlled ade-quately with medications, catheter ablation of the AV node is another available procedure. This method intentionally creates complete heart block as a means to permanently slow the ventricular rate. As a consequence, a per-manent pacemaker is also required to generate an adequate ventricular rate.
Paroxysmal Supraventricular Tachycardias
Paroxysmal supraventricular tachycardias (PSVTs) are manifested by (1) sudden onset and termination, (2) atrial rates between 140 and 250 bpm, and (3) narrow (normal) QRS comp-lexes (Fig. 12.14), unless aberrant conduction
77237_ch12.indd 28877237_ch12.indd 288 8/11/10 8:21:34 AM8/11/10 8:21:34 AM

Clinical Aspects of Cardiac Arrhythmias
289
is present, as summarized later. The mecha-nism of PSVTs is most often reentry involving the AV node, atrium, or an accessory pathway between an atrium and ventricle. Enhanced au-tomaticity and triggered activity in the atrium or AV node are less common causes.
AV Nodal Reentrant Tachycardia
Atrioventricular nodal reentrant tachycardia (AVNRT) is the most common form of PSVT in adults. In the normal heart, the AV node is a lobulated structure that consists of a compact portion and several atrial extensions. The latter constitute two (or more) potential pathways for conduction through the AV node (Fig. 12.15). In some people, these extensions conduct at different velocities, providing both slow- and fast-conducting pathways. The fast pathway is characterized by a rapid conduction veloc-ity, whereas the slow pathway demonstrates slower conduction but typically has a shorter refractory period than the fast pathway. Thus, although the fast pathway conducts rapidly, it takes longer to recover between impulses compared with the slow pathway. Normally, a stimulus arriving at the AV node travels down both pathways, but the impulse traveling down the fast pathway reaches the bundle of His fi rst. By the time the impulse traversing the slow pathway reaches the bundle of His, it en-counters refractory tissue and is extinguished. Thus, under normal conditions, only the fast pathway impulse makes its way forward to the ventricles (see Fig. 12.15A).
In contrast, consider what happens when an APB spontaneously occurs (Fig. 12.15B). Because the refractory period of the fast path-way is relatively long, an APB would fi nd that pathway unexcitable and unable to conduct the impulse. However, the impulse is able to conduct over the slow pathway (which is excit-able because it has a shorter refractory period than the fast pathway and has already repolar-ized when the APB arrives). By the time this impulse travels down the slowly conducting pathway and reaches the compact portion of the AV node, the distal end of the fast pathway may have had time to repolarize, and the im-pulse is able to propagate both distally (to the bundle of His and ventricles) and backward to
the atria, up the fast pathway in a retrograde direction. On reaching the atria, the impulse can then circulate back down the slow path-way, completing the reentrant loop and ini-tiating tachycardia as this sequence repeats. Thus, the fundamental conditions for reentry in AVNRT in this example are transient uni-directional block in the fast pathway (an APB encountering refractory tissue) and relatively slow conduction through the other pathway.
The ECG in AVNRT shows a regular tachy-cardia with normal-width QRS complexes. P waves may not be apparent, because retrograde atrial depolarization typically occurs simultane-ously with ventricular depolarization. Thus, the retrograde P wave and QRS are inscribed at the same time and the P is typically “hidden” in the QRS complex. When P waves are visible, they are superimposed on the terminal portion of the QRS complex and inverted (negative de-fl ection) in limb leads II, III, and aVF because of the caudocranial direction of atrial activation.
Rarely, the reentrant loop revolves in the reverse direction, with anterograde conduction down the fast pathway and retrograde conduc-tion up the slow pathway. This is known as un-common AVNRT and, unlike the more common rhythm, results in clearly visible retrograde P waves following the QRS complex on the ECG.
AVNRT often presents in teenagers or young adults. It is usually well tolerated but causes palpitations that many patients fi nd frighten-ing, and rapid tachycardias can cause light-headedness or shortness of breath. In elderly patients or those with underlying heart dis-ease, more severe symptoms may result, such as syncope, angina, or pulmonary edema.
Acute treatment of AVNRT is aimed at ter-minating reentry by impairing conduction in the AV node. Transient increases in vagal tone produced by the Valsalva maneuver or carotid sinus massage (see Chapter 11) may block AV conduction, terminating the tachycardia. The most rapidly effective pharmacologic treatment is intravenous adenosine, which impairs AV nodal conduction and often aborts the reentrant rhythm (see Chapter 17). Other drug options in-clude intravenous calcium channel antagonists (verapamil and diltiazem) or �-blockers.
Most patients with AVNRT have infrequent episodes that terminate with vagal maneuvers
77237_ch12.indd 28977237_ch12.indd 289 8/11/10 8:21:35 AM8/11/10 8:21:35 AM

Chapter 12
290
Impulse fromSA node Fast pathway
Compactnode
Tobundle of His
Atrialpremature
beat
To
bundle of His
Unidirectionalblock
Retrogradeconduction
Slow pathway
Figure 12.15. Common mechanism of AV nodal reentry. In most patients, the AV node (gray region in the drawing) is a lobulated structure consisting proximally of several atrial extensions and distally of a compact node portion. A. In patients with AV nodal reentry, two functionally distinct tracts exist within the AV node (termed the slow and fast path-ways). The slow pathway conducts slowly and has a short refractory period, whereas the fast pathway conducts more rapidly but has a long refractory period. Impulses from above conduct down both pathways; because the fast pathway impulse reaches the distal com-mon pathway fi rst, it continues to the bundle of His. Conversely, the slow pathway impulse arrives later and encounters refractory tissue. B. An atrial premature beat arrives at the entrance of the two pathways. The fast pathway is still refractory from the preceding beat and the impulse is blocked, but the slow pathway has repolarized and is able to conduct. When the impulse reaches the distal portion of the fast pathway after traveling down the slower pathway, the fast pathway has repolarized and is able to conduct the impulse in a retrograde direction (exemplifying unidirectional block). The impulse can then travel through the atrium and back to the slow pathway, and a reentrant loop is initiated.
77237_ch12.indd 29077237_ch12.indd 290 8/11/10 8:21:35 AM8/11/10 8:21:35 AM

Clinical Aspects of Cardiac Arrhythmias
291
and do not require other specifi c interven-tions. Frequent symptomatic episodes, partic-ularly when requiring visits to the emergency department for treatment, warrant preventive therapy: oral �-blockers, calcium channel blockers, or digoxin are often successful for this purpose. Catheter ablation of the slow AV nodal pathway is also an effective option but is associated with a small risk (�2%) of heart block owing to unintended damage to the fast AV nodal pathway, a complication that requires permanent pacemaker implantation. Chronic class IA or IC antiarrhythmic drugs are also effective, but are often less desirable than catheter ablation, because of associated potential drug toxicities.
Atrioventricular Reentrant Tachycardias
Atrioventricular reentrant tachycardias (AVRTs) are similar to AVNRTs except that in the former, one limb of the reentrant loop is constituted by an accessory pathway (bypass tract), rather than by separate fast and slow pathways within the AV node itself. As described in Chapter 11, an acces-sory pathway is an abnormal band of myocytes that spans the AV groove and connects atrial to ventricular tissue separately from the normal con-duction system (see Fig. 11.10). Approximately 1 in 1,500 people has such a pathway.
Accessory pathways allow an impulse to conduct from atrium to ventricle (anterograde conduction), from ventricle to atrium (retro-grade conduction), or in both directions. De-pending on the characteristics of the pathway, one of two characteristic entities can result: (1) the ventricular pre-excitation syndrome, or (2) PSVT resulting from a concealed accessory pathway. Some pathways do not conduct im-pulses at rates suffi cient to cause tachycardias and cause no symptoms at all.
Ventricular Pre-excitation Syndrome
In patients with ventricular pre-excitation (also termed Wolff–Parkinson–White [WPW] syndrome; see Chapter 11), atrial impulses can pass in an anterograde direction to the ventricles through both the AV node and the accessory pathway. Because conduction through the accessory pathway is usually faster than that via the AV node, the ventricles are stimulated earlier than by normal conduc-tion over the AV node. During sinus rhythm, activation of the ventricle from the accessory pathway causes a characteristic ECG appear-ance: (1) the PR interval is short (�0.12 sec) because ventricular stimulation begins earlier than normal through the accessory pathway, (2) the QRS has a slurred rather than a sharp upstroke (referred to as a delta wave) because the initial ventricular activation by the acces-sory pathway is slower than activation over the Purkinje system, and (3) the QRS complex is widened because it represents fusion of two excitation wave fronts through the ventricles, one from the accessory pathway and one from the normal His–Purkinje system (Figs. 12.16 and 12.17).
Patients with WPW syndrome are predis-posed to PSVTs because the accessory pathway provides a potential limb of a reentrant loop. The most common PSVT in these patients is orthodromic AVRT. During this tachycardia, an impulse travels anterogradely down the AV node to the ventricles and then retrogradely up the accessory tract back to the atria (see Fig. 12.17B). Because the ventricles in this situation are depolarized exclusively via the normal con-duction system (through the AV node and the bundle of His), there is no delta wave during the tachycardia and the width of the QRS is usually normal. Retrograde P waves are often visible
Figure 12.16. Wolff–Parkinson–White syndrome. The delta wave (arrow) indicates pre-excitation of the ventricles. Note the shortened PR interval.
77237_ch12.indd 29177237_ch12.indd 291 8/11/10 8:21:37 AM8/11/10 8:21:37 AM
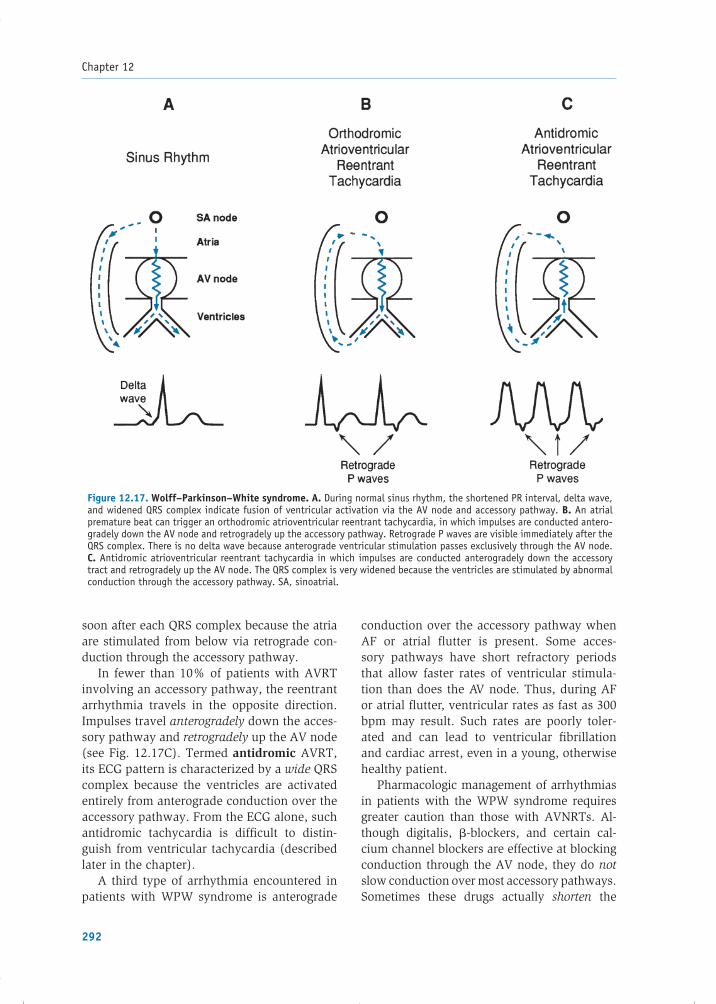
Chapter 12
292
soon after each QRS complex because the atria are stimulated from below via retrograde con-duction through the accessory pathway.
In fewer than 10% of patients with AVRT involving an accessory pathway, the reentrant arrhythmia travels in the opposite direction. Impulses travel anterogradely down the acces-sory pathway and retrogradely up the AV node (see Fig. 12.17C). Termed antidromic AVRT, its ECG pattern is characterized by a wide QRS complex because the ventricles are activated entirely from anterograde conduction over the accessory pathway. From the ECG alone, such antidromic tachycardia is diffi cult to distin-guish from ventricular tachycardia (described later in the chapter).
A third type of arrhythmia encountered in patients with WPW syndrome is anterograde
conduction over the accessory pathway when AF or atrial fl utter is present. Some acces-sory pathways have short refractory periods that allow faster rates of ventricular stimula-tion than does the AV node. Thus, during AF or atrial fl utter, ventricular rates as fast as 300 bpm may result. Such rates are poorly toler-ated and can lead to ventricular fi brillation and cardiac arrest, even in a young, otherwise healthy patient.
Pharmacologic management of arrhythmias in patients with the WPW syndrome requires greater caution than those with AVNRTs. Al-though digitalis, �-blockers, and certain cal-cium channel blockers are effective at blocking conduction through the AV node, they do not slow conduction over most accessory pathways. Sometimes these drugs actually shorten the
Figure 12.17. Wolff–Parkinson–White syndrome. A. During normal sinus rhythm, the shortened PR interval, delta wave, and widened QRS complex indicate fusion of ventricular activation via the AV node and accessory pathway. B. An atrial premature beat can trigger an orthodromic atrioventricular reentrant tachycardia, in which impulses are conducted antero-gradely down the AV node and retrogradely up the accessory pathway. Retrograde P waves are visible immediately after the QRS complex. There is no delta wave because anterograde ventricular stimulation passes exclusively through the AV node. C. Antidromic atrioventricular reentrant tachycardia in which impulses are conducted anterogradely down the accessory tract and retrogradely up the AV node. The QRS complex is very widened because the ventricles are stimulated by abnormal conduction through the accessory pathway. SA, sinoatrial.
77237_ch12.indd 29277237_ch12.indd 292 8/11/10 8:21:37 AM8/11/10 8:21:37 AM

Clinical Aspects of Cardiac Arrhythmias
293
refractory period of the accessory pathway, thus speeding conduction. Therefore, the drugs could precipitate even faster ventricular rates (and hemodynamic collapse) when administered to patients with WPW syndrome who develop AF or fl utter. In contrast, sodium channel blockers (specifi cally, class IA and IC antiarrhythmics) and some class III antiarrhythmic drugs slow conduction and prolong the refractory period of accessory pathways as well as the AV node; therefore, these are the preferred pharmaco-logic agents for this condition.
When a patient with WPW presents with a wide QRS tachycardia, acute therapy depends on the patient’s tolerance of the arrhythmia. If accompanied by hemodynamic collapse, im-mediate cardioversion is required. Conversely, if the patient is hemodynamically stable, in-travenous administration of procainamide (a class IA agent that slows conduction in the ac-cessory pathway) or ibutilide (a class III agent that prolongs refractoriness in the accessory pathway) will often terminate the arrhythmia.
Patients who have WPW with symptom-atic arrhythmias should generally undergo an invasive electrophysiologic study and have radiofrequency catheter ablation of the ac-cessory pathway. Ablation abolishes conduc-tion over the pathway, curing the condition. If this procedure is not an option, chronic oral therapy should include a drug that slows ac-cessory pathway conduction (i.e., a class IA, IC, or III agent).
The Lown–Ganong–Levine syndrome is also characterized by a short PR interval, but a normal, narrow QRS complex (i.e., no delta wave during sinus rhythm). It used to be con-sidered a form of pre-excitation, but most pa-tients just have enhanced conduction through the normal AV node, thus shortening the PR interval. When PSVT occurs in these patients, it is usually simply due to AV nodal reentry.
Concealed Accessory Pathways
Accessory pathways do not always result in ECG fi ndings of ventricular pre-excitation (i.e., short PR, delta wave). Many are capable of only retrograde conduction. In this case, dur-ing sinus rhythm, the ventricles are depolar-ized normally through the AV node alone and
the ECG is normal (i.e., the accessory pathway is concealed). However, because the accessory pathway is capable of retrograde conduction, it can form a limb of a reentrant circuit under appropriate circumstances and result in ortho-dromic AVRT.
Management of patients with tachycardia involving a concealed accessory pathway is the same as for patients with AVNRT. Because the reentrant circuit travels anterogradely down the AV node, vagal maneuvers and drugs that interrupt conduction over the AV node (e.g., adenosine, verapamil, diltiazem, and �-blockers) can terminate the tachycardia. Another option for recurrent episodes is cath-eter ablation of the accessory pathway, which is curative in most patients.
Focal Atrial Tachycardia
Focal atrial tachycardia (AT) results from either automaticity of an atrial ectopic site, or reentry. The ECG has the appearance of sinus tachycardia, with a P wave before each QRS complex, but the P-wave morphology is dif-ferent from that of sinus rhythm, indicating depolarization of the atrium from an abnormal site. The arrhythmia can be paroxysmal and of limited duration, or it can persist. Short, asymptomatic bursts of atrial tachycardia are commonly observed on 24-hour ECG record-ings, even in otherwise healthy people.
Atrial tachycardia can be caused by digi-talis toxicity and is also aggravated by ele-vated sympathetic tone (e.g., during exertion or periods of illness). Initial treatment includes correction of any contributing factors. Unlike AVNRT or AVRT, vagal maneuvers (such as carotid sinus massage) may have no effect on atrial discharges from an ectopic pacemaker focus. However, �-blockers, calcium channel blockers, and class IA, IC, and III antiarrhyth-mic drugs can be effective. Catheter ablation is also a useful option for symptomatic patients.
Multifocal Atrial Tachycardia
In multifocal atrial tachycardia (MAT), the ECG shows an irregular rhythm with multiple (at least three) P-wave morphologies, and the average atrial rate is �100 bpm (Fig. 12.18).
77237_ch12.indd 29377237_ch12.indd 293 8/11/10 8:21:37 AM8/11/10 8:21:37 AM

Chapter 12
294
An isoelectric (i.e., “fl at”) baseline between P waves distinguishes MAT from the chaotic baseline of AF. This rhythm is likely caused by either abnormal automaticity in several foci within the atria or triggered activity and oc-curs most often in the setting of severe pulmo-nary disease and hypoxemia. Because patients with this rhythm are often critically ill from the underlying disease, the mortality rate is high, and treatment is aimed at the causative disor-der. The calcium channel blocker verapamil is often effective at slowing the ventricular rate as a temporizing measure.
Ventricular Arrhythmias
The common ventricular arrhythmias are (1) ventricular premature beats (VPBs), (2) ventric-ular tachycardia (VT), and (3) ventricular fi bril-lation (VF). Ventricular arrhythmias are usually more dangerous than supraventricular rhythm disorders and are responsible for many of the approximately 300,000 sudden cardiac deaths that occur every year in the United States.
Ventricular Premature Beats
Similar to APBs, VPBs are common even among healthy people and are often asympto-matic and benign (Fig. 12.19). A VPB arises when an ectopic ventricular focus fi res an
action potential. On the ECG, a VPB appears as a widened QRS complex, because the impulse travels from its ectopic site through the ventri-cles via slow cell-to-cell connections rather than through the normal rapidly conducting His–Purkinje system. Furthermore, the ectopic beat is not related to a preceding P wave.
VPBs can also occur in repeating patterns. When every alternate beat is a VPB, the rhythm is termed bigeminy. When two normal beats precede every VPB, trigeminy is present. Con-secutive VPBs are referred to as couplets (two in a row) or triplets (three in a row).
VPBs are not dangerous by themselves, and in patients without heart disease, they confer no added risk of a life-threatening arrhythmia. They can, however, be an indication of an un-derlying cardiac disorder and take on added signifi cance in that case. For example, in pa-tients with structural heart disease, VPBs gen-erally increase in frequency in relation to the severity of depressed ventricular contractility. They have been associated with an increased risk of sudden death in patients with heart fail-ure or prior myocardial infarction.
In otherwise healthy persons, treatment of VPBs mainly involves reassurance and, if needed, symptomatic control using �-blockers. In patients with advanced structural heart disease with features that place them at risk of life-threatening ventricular arrhythmias,
P P PPPPPPPP
Figure 12.18. Multifocal atrial tachycardia. The rhythm is irregular and each QRS is preceded by a P wave of varying morphology.
Figure 12.19. Ventricular premature beats (arrows).
77237_ch12.indd 29477237_ch12.indd 294 8/11/10 8:21:38 AM8/11/10 8:21:38 AM

Clinical Aspects of Cardiac Arrhythmias
295
placement of an implantable cardioverter- defi brillator (ICD) is typically recommended.
Ventricular Tachycardia
VT is a series of three or more VPBs(Fig. 12.20). VT is divided arbitrarily into two categories. If it persists for more than 30 sec, produces severe symptoms such as syncope, or requires termination by cardioversion or administration of an antiarrhythmic drug, it is designated as sustained VT; self-terminating episodes are termed nonsustained VT. Both forms of VT are found most commonly in patients with structural heart disease, includ-ing myocardial ischemia and infarction, heart failure, ventricular hypertrophy, primary electrical diseases (e.g., long-QT syndromes [LQTS]; see Box 12.1), valvular heart diseases, and congenital cardiac abnormalities.
The QRS complexes of VT are typically wide (�0.12 sec) and occur at a rate of 100 to 200 bpm or sometimes faster. VT is further categorized according to its QRS morphol-ogy. When every QRS complex appears the same and the rate is regular, it is referred to as monomorphic VT (see Fig. 12.20). Sus-tained monomorphic VT usually indicates a structural abnormality that supports a reentry circuit, most commonly a region of myocardial scar from an old infarction or cardiomyopa-thy. Occasionally, sustained monomorphic VT occurs as a result of an ectopic ventricular focus in an otherwise healthy person (referred to as idiopathic VT).
When the QRS complexes continually change in shape and the rate varies from beat to beat, the VT is referred to as polymorphic. Multiple ectopic foci or a continually chang-ing reentry circuit is the cause. Torsades de
pointes (discussed later in the chapter) and acute myocardial ischemia or infarction are the most common causes of polymorphic VT. Rare, inherited predispositions to polymorphic VT and sudden death arise from abnormali-ties of cardiac ion channels or calcium han-dling (e.g., the LQTS, the Brugada syndrome, familial catecholaminergic polymorphic VT), as described in Box 12.1. Sustained polymor-phic VT usually degenerates to VF.
The symptoms of VT vary depending on the rate of the tachycardia, its duration, and the underlying condition of the heart. Sustained VT can cause low cardiac output resulting in the loss of consciousness (syncope), pulmonary edema, or progress to cardiac arrest. These severe consequences of VT are most likely in patients who have underlying depressed con-tractile function. Conversely, if sustained VT is relatively slow (e.g., �130 bpm), it may be well tolerated and cause only palpitations.
Distinguishing Monomorphic VT from Supraventricular Tachycardia
VT can usually be distinguished from SVT by the width of the QRS complex: it is routinely wide in the former and narrow (i.e., normal) in the latter. However, under certain circum-stances, arrhythmias that originate from sites above the ventricles can result in wide QRS complexes and may appear similar to mono-morphic VT. This situation is termed SVT with aberrant ventricular conduction, or simply SVT with aberrancy, and may arise in three scenarios: (1) a patient has an underlying con-duction abnormality (e.g., a bundle branch block), such that the QRS is abnormally wide even when in normal sinus rhythm; (2) re-petitive rapid ventricular stimulation during
Figure 12.20. Monomorphic ventricular tachycardia.
77237_ch12.indd 29577237_ch12.indd 295 8/11/10 8:21:38 AM8/11/10 8:21:38 AM

Chapter 12
296
BOX 12.1 Genetic Mutations and Ventricular Arrhythmias
Genetic causes of ventricular arrhythmias occur either in association with various types of structural heart disease or as isolated conditions. Examples of inherited structural disease that can be complicated by life-threatening arrhythmias include hypertrophic cardiomyopathy and the familial dilated cardiomyopathies, both described in Chapter 10. Arrhythmogenic right ventricular dysplasia (ARVD; also called “arrhythmogenic right ventricular cardiomyopathy”) is another form of myocardial disease associated with reentrant VT, typically originating from the RV. This condition is characterized by replacement of portions of the RV with adipose and fi brous tissue, and approximately half of patients display a familial pattern with autosomal dominant inheri-tance. The most common mutations involve genes that encode components of cell membrane desmosomes, which may result in loss of cell-to-cell adhe-sion, leading to fi brosis or aberrant signaling with proliferation of adipose tissue in the myocardium. ARVD may be suspected on routine ECG by the presence of inverted T waves in leads V1 through V3 and occasionally an ep-silon wave, a terminal notch of the QRS complex in lead V1 (see arrow in the accompanying fi gure), which refl ects abnormal RV activation. The abnormal RV morphology can be identifi ed by noninvasive imaging techniques in some patients. Treatment typically in-cludes an ICD because the disease is progressive and VT is common, which can lead to sudden death. Several other inherited arrhythmic disorders occur in the absence of structural cardiac disease. These occur infrequently but are important because they can cause life-threatening arrhythmias in young, otherwise healthy people without prior warning. The most common of these conditions are (1) the Brugada syndrome, (2) the congenital LQTS, and (3) familial catecholaminergic polymorphic VT. The Brugada syndrome is believed to be responsible for a signifi cant percentage of idiopathic ventricular fi brillation. It is inherited in an autosomal dominant fashion and has been linked in some (but not all) families to mutations in a sodium channel subunit gene (SCN5A). A clue to the presence of this syndrome is a specifi c ECG fi nding of prominent ST elevation in leads V1 through V3 (see accompanying fi gure). This pattern may be present chronically or intermittently; in the latter case, the syndrome may be unmasked by administering certain antiarrhythmic drugs (e.g., fl ecainide, pro-cainamide). Brugada syndrome is a potentially lethal condition, and ICD implantation is the most effective way to prevent an arrhythmic death. The congenital long-QT syndromes are associated with prolonged ventricular repolarization (hence the long QT interval), which can lead to life-threatening polymorphic VT (i.e., torsades de pointes). Muta-tions in a number of different genes result in LQTS (the three most common are listed in the accompanying table) by prolonging the action potential duration. Most identifi ed mutations alter ion channel function to either enhance the depolarizing Na� current or impair the repolarizing K� current. Autosomal dominant and recessive patterns of inheritance occur.
V1
V1
Genetic Basis of the Three Most Common Congenital Long-QT Syndromes
Gene Mechanism of ProlongedType (location) Protein Repolarization Inheritance
LQT1 KCNQ1(11p15)
KvLQT1(� subunit of IKs K
� channel)↓ Outward K� current AD and AR
LQT2 KCNH2(7q35)
HERG(� subunit of IKr K
� channel)↓ Outward K� current AD
LQT3 SCN5A(3p21)
Nav 1.5(Na� channel)
↑ Inward Na� current AD
AD, autosomal dominant; AR, autosomal recessive.
77237_ch12.indd 29677237_ch12.indd 296 8/11/10 8:21:38 AM8/11/10 8:21:38 AM

Clinical Aspects of Cardiac Arrhythmias
297
SVT fi nds one of the bundle branches refrac-tory (because of insuffi cient time to recover from the previous depolarization), such that the impulse propagates abnormally through the ventricles, causing the QRS to be distorted and wide; or (3) a patient develops antidromic tachycardia through an accessory pathway (described earlier).
Certain clinical and electrocardiographic features can help to distinguish wide QRS complexes of monomorphic VT from those of supraventricular rhythms with aberrant con-duction. In patients with a history of prior myocardial infarction, congestive heart failure, or left ventricular dysfunction, a wide complex tachycardia is more likely to be VT rather than SVT with aberrancy. At the bedside, SVT is more probable if vagal maneuvers (such as
carotid sinus massage) affect the rhythm (see Fig. 12.9).
Electrocardiographically, a supraventri-cular tachyarrhythmia is more likely if the morphology of the QRS at the rapid rate is similar to that on the patient’s ECG trac-ing obtained while in sinus rhythm (i.e., the complex is widened because of an underlying bundle branch block). Conversely, VT is more likely if (1) there is no relationship between the QRS complexes and any observed P waves (AV dissociation) or (2) the QRS complexes in each of the chest leads (V1 through V6) have a similar appearance, with a dominant posi-tive or negative defl ection (i.e., there is “con-cordance” of the precordial QRS complexes). These features are summarized in Table 12.2. Other morphologic ECG features have been
Table 12.2. Differentiation of Wide Complex Tachycardias
Supports SVT with Aberrant Conduction Supports Ventricular Tachycardia
QRS morphology same as when in sinus rhythm
Rhythm responds to vagal maneuvers (see Fig. 12.9)
History of prior MI or heart failure
No relationship between P waves and QRS complexes
Concordance of QRS complexes in the chest leads (V1–V6)
MI, myocardial infarction; SVT, supraventricular tachycardia.
Gene penetrance and symptomatology of patients with LQTS is highly variable, even for individuals with the same mutation. The degree of QT prolongation and, in some cases, the patient’s gender are pre-dictors of arrhythmic risk when a mutation is present. An affected patient may be asymptomatic and come to medical attention only as a result of the abnormal ECG, or because of a family member with this condi-tion. Others present with syncope or even sudden death caused by torsades de pointes. The most common forms (LQT1 and LQT2) are associated with ventricular arrhythmias during physical exercise (particularly swimming), or emotional stress. Conversely, those with LQT3 are much more likely to experience cardiac events at rest or during sleep. Other acquired conditions that prolong the QT interval can trigger life-threatening arrhythmias in patients with LQTS, including hypokalemia, hypomagnesemia, hypocalcemia, and several medications (including many antiarrhythmic drugs). Conversely, �-blockers reduce the risk of arrhythmias in many forms of LQTS, even though they do not shorten the QT interval. For patients at high risk of life-threatening arrhythmias, ICD implantation is warranted. Familial catecholaminergic polymorphic VT, inherited in autosomal dominant and recessive pat-terns, is marked by VT and/or ventricular fi brillation during exercise or emotional arousal. The mech-anism is thought to be triggered activity resulting from delayed afterdepolarizations (described in Chapter 11). Mutations in affected families have been demonstrated in at least two genes involved in intracellular calcium handling, including a missense mutation in the locus that codes for the cardiac ryanodine receptor. �-Blockers are effective for some patients; otherwise, an ICD is implanted.
77237_ch12.indd 29777237_ch12.indd 297 8/11/10 8:21:38 AM8/11/10 8:21:38 AM

Chapter 12
298
used to distinguish VT from SVT with aber-rancy, but the distinction is often very diffi -cult. Most patients with wide QRS tachycardia should be managed as though they have VT until proven otherwise.
Management of Patients with VT
Sustained episodes of VT are dangerous be-cause they can produce syncope or deteriorate into VF, which is fatal if not quickly corrected. Acute treatment usually consists of electrical cardioversion. Intravenous administration of certain antiarrhythmic drugs, such as amio-darone, procainamide, or lidocaine, can be considered if the patient is hemodynamically stable.
After sinus rhythm is restored, a patient who has had sustained VT requires careful evaluation to defi ne whether underlying struc-tural heart disease is present and to correct any aggravating factors, such as myocardial ischemia, electrolyte disturbances, or drug tox-icities. Patients who have suffered VT in the setting of structural heart disease have a high risk of recurrence and sudden cardiac death; implantation of an ICD is usually warranted to automatically and promptly terminate future episodes.
Patients who experience VT in the absence of underlying structural heart disease are usu-ally found to have idiopathic VT. This type of arrhythmia tends to originate from foci in the right ventricular outfl ow tract or in the septal portion of the left ventricle. It is rarely life threatening. �-Blockers, calcium channel blockers, or catheter ablation are commonly effective to control symptomatic episodes of idiopathic VT.
Torsades de Pointes
Torsades de pointes (“twisting of the points”) is a form of polymorphic VT that presents as varying amplitudes of the QRS, as if the complexes were “twisting” about the base-line (Fig. 12.21). It can be produced by early afterdepolarizations (triggered activity), par-ticularly in patients who have a prolonged QT interval. QT prolongation (which indi-cates a lengthened action potential duration) can result from electrolyte disturbances (hy-pokalemia or hypomagnesemia), persistent bradycardia, and drugs that block cardiac potassium currents, including many anti-arrhythmic agents (particularly the class III drugs sotalol, ibutilide, and dofetilide and some class I drugs, including quinidine, procainamide, and disopyramide). Many medications administered for noncardiac ill-nesses can also prolong the QT interval and predispose to torsades de pointes, including erythromycin, phenothiazines, haloperidol, and methadone. A rare group of hereditary ion channel abnormalities produces congeni-tal QT prolongation, which can also lead to torsades de pointes (see Box 12.1).
Torsades de pointes is usually symptomatic, causing light-headedness or syncope, but is frequently self-limited. Its main danger results from degeneration into VF. When it is drug or electrolyte induced, correcting the underlying cause abolishes recurrences. In other cases, administration of intravenous magnesium often suppresses repeated episodes. Additional preventive strategies are aimed at shortening the QT interval by increasing the underly-ing heart rate with intravenous �-adrenergic stimulating agents (e.g., isoproterenol) or
Figure 12.21. Torsades de pointes. The widened polymorphic QRS complexes demonstrate a waxing and waning pattern.
77237_ch12.indd 29877237_ch12.indd 298 8/11/10 8:21:38 AM8/11/10 8:21:38 AM

Clinical Aspects of Cardiac Arrhythmias
299
an artifi cial pacemaker. When torsades de pointes results from congenital prolongation of the QT interval, �-blocking drugs are often the treatment of choice, because sympathetic stimulation actually aggravates the arrhyth-mia in many such individuals. An implant-able defi brillator is often appropriate for these patients.
Ventricular Fibrillation
VF is an immediately life-threatening arrhyth-mia (Fig. 12.22). It results in disordered, rapid stimulation of the ventricles with no coordi-nated contractions. The result is essentially cessation of cardiac output and death if not quickly reversed. This rhythm most often oc-curs in patients with severe underlying heart disease and is the major cause of mortality in acute myocardial infarction.
VF is often initiated by an episode of VT, which degenerates, it is believed, by the breakup of excitation waves into mul-tiple smaller wavelets of reentry that wander through the myocardium. On the ECG, VF is characterized by a chaotic irregular appear-ance without discrete QRS waveforms.
Untreated, VF rapidly leads to death. The only effective therapy is prompt electrical defi brillation. As soon as the heart has been converted to a safe rhythm, the underlying precipitant of the arrhythmia (e.g., electrolyte imbalances, hypoxemia, or acidosis) should be sought and corrected to prevent further episodes. Intravenous antiarrhythmic drug therapy may be administered to prevent im-mediate recurrences. If no reversible inciting precipitant is found, survivors of VF usually receive an ICD.
SUMMARY
1. Disorders of impulse formation and conduction result in bradyarrhythmias and tachyarrhythmias. Through careful analysis of the ECG, it is usually possible to distinguish individual rhythm disor-ders so that appropriate therapy can be administered.
2. When evaluating a patient with a slow heart rhythm (Figs. 12.1–12.8), two key questions should be addressed:
a. Are P waves present?
b. What is the relationship between the P waves and the QRS complexes?
3. Differentiation of tachyarrhythmias requires assessment of:
a. The width of the QRS complex (normalor wide).
b. The morphology and rate of the P waves.
c. The relationship between the P waves and the QRS complexes.
d. The response to vagal maneuvers (see Fig. 12.9).
Each of the ECG texts listed at the end of Chapter 4 provides many additional examples of the rhythm disorders presented in this chapter.
Acknowledgments
Contributors to the previous editions of this chapter were Hillary K. Rolls, MD; Wendy Armstrong, MD; Nicholas Boulis, MD; Jennifer E. Ho, MD; Marc S. Sabatine, MD; Elliott M. Antman, MD; Leonard I. Ganz, MD; William G. Stevenson, MD; and Leonard S. Lilly, MD.
Figure 12.22. Ventricular fi brillation.
77237_ch12.indd 29977237_ch12.indd 299 8/11/10 8:21:39 AM8/11/10 8:21:39 AM

Chapter 12
300
Additional Reading
Crandall MA, Bradley DJ, Packer DL, et al. Contem-porary management of atrial fi brillation: update on anticoagulation and invasive management strategies. Mayo Clin Proc. 2009;84:643–662.
Delacretaz E. Supraventricular tachycardia. N Engl J Med. 2006;354:1039–1051.
Dobrzynski H, Boyett MR, Anderson RH. New insights into pacemaker activity: promoting understand-ing of sick sinus syndrome. Circulation. 2007;115:1921–1932.
Epstein AE, DiMarco JP, Ellenbogen KA, et al. ACC/AHA/HRS 2008 Guidelines for Device-Based Therapy of Cardiac Rhythm Abnor-malities: a report of the American College of Cardiology/American Heart Association Task Force on Practice Guidelines. Circulation. 2008; 17:e350–e408.
Nass RD, Aiba T, Tomaselli GF, et al. Mecha-nisms of disease: ion channel remodeling in the
failing ventricle. Nat Clin Pract Cardiovasc Med. 2008;5:196–207.
Noseworthy PA, Newton-Cheh C. Genetic deter-minants of sudden cardiac death. Circulation. 2008;118:1854–1863.
Roberts JD, Gollb MH. Impact of genetic discover-ies on the classifi cation of lone atrial fi brillation. J Am Coll Cardiol. 2010;55:705–712.
Roden DM. Clinical practice. Long-QT syndrome. N Engl J Med. 2008;358:169–176.
Shah M, Akar FG, Tomaselli GF. Molecular basis of arrhythmias. Circulation. 2005;112:2517–2529.
Thavendiranathan P, Bagai A, Khoo C, et al. Does this patient with palpitations have a cardiac arrhythmia? JAMA. 2009;302:2135–2143.
Zipes DP, Camm AJ, Borggrefe M, et al. ACC/AHA/ESC 2006 guidelines for management of patients with ventricular arrhythmias and the preven-tion of sudden cardiac death. J Am Coll Cardiol. 2006;48:e247–e346.
77237_ch12.indd 30077237_ch12.indd 300 8/11/10 8:21:39 AM8/11/10 8:21:39 AM

301
C H A P T E R
13
hypertension is a critical aspect of preventive medicine.
Hypertension is also a scientifi c prob-lem of unexpected complexity. In approxi-mately 90% of affected patients, the cause of the blood pressure elevation is unknown, a condition termed primary or essential hypertension (EH). Evidence suggests that the causes of EH are multiple and diverse, and considerable insight into those causes can be achieved by studying the normal physiology of blood pressure control, as examined in this chapter.
High blood pressure attributed to a defi n-able cause is termed secondary hypertension. Although far less common than EH, condi-tions that cause secondary hypertension are important because many are amenable to per-manent cure. Following the discussions of EH
HypertensionChristopher T. LeeGordon H. WilliamsLeonard S. Lilly
WHAT IS HYPERTENSION?HOW IS BLOOD PRESSURE REGULATED?Hemodynamic FactorsBlood Pressure Refl exes
ESSENTIAL HYPERTENSIONEpidemiology and GeneticsExperimental FindingsNatural History
SECONDARY HYPERTENSIONPatient EvaluationExogenous Causes
Renal CausesMechanical CausesEndocrine Causes
CONSEQUENCES OF HYPERTENSIONClinical Signs and SymptomsOrgan Damage Caused by Hypertension
HYPERTENSIVE CRISISTREATMENT OF HYPERTENSIONNonpharmacologic TreatmentPharmacologic Treatment
Approximately 60 million Americans, and 1 billion people throughout the world,
have hypertension—a blood pressure high enough to be a danger to their well-being. This number will undoubtedly rise; data from the Framingham Heart Study indicate that 90% of people over age 55 will develop hypertension during their lifetimes. Thus, this condition represents a great public health concern because it is a major risk factor for coronary artery disease, stroke, heart failure, renal disease, and peripheral vascular disease. Surprisingly, more than two thirds of hyper-tensive persons are either unaware of their elevated blood pressure or are not treated adequately to minimize the cardiovascular risk. Moreover, because elevated blood pres-sure is usually asymptomatic until an acute cardiovascular event strikes, screening for
77237_ch13.indd 30177237_ch13.indd 301 8/11/10 8:22:21 AM8/11/10 8:22:21 AM
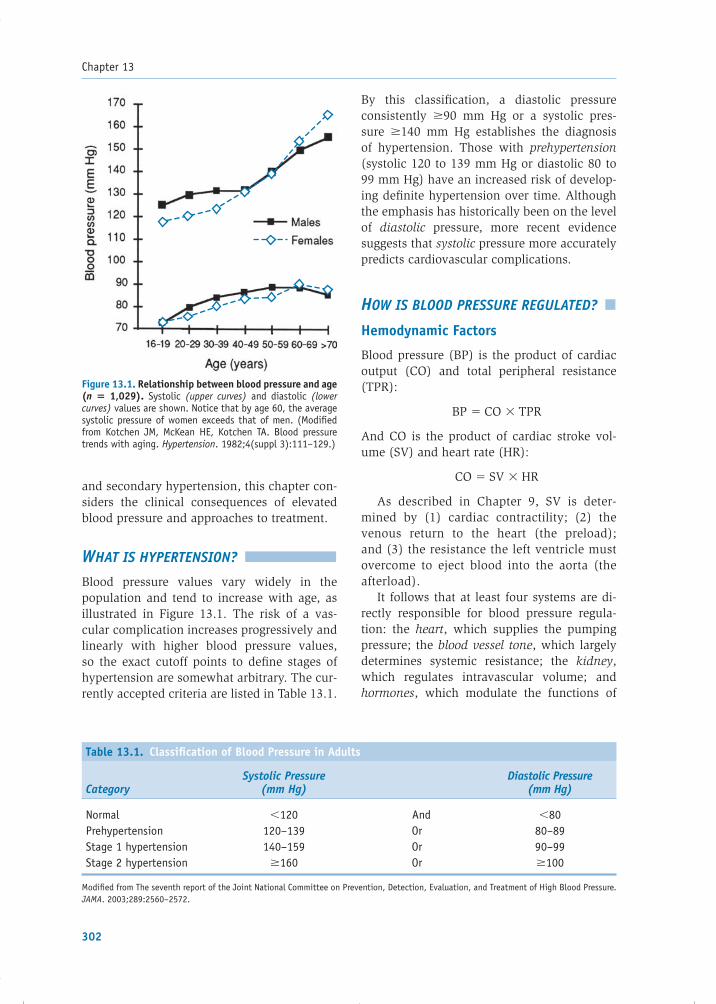
Chapter 13
302
and secondary hypertension, this chapter con-siders the clinical consequences of elevated blood pressure and approaches to treatment.
WHAT IS HYPERTENSION?
Blood pressure values vary widely in the population and tend to increase with age, as illustrated in Figure 13.1. The risk of a vas-cular complication increases progressively and linearly with higher blood pressure values, so the exact cutoff points to defi ne stages of hypertension are somewhat arbitrary. The cur-rently accepted criteria are listed in Table 13.1.
By this classifi cation, a diastolic pressure consistently �90 mm Hg or a systolic pres-sure �140 mm Hg establishes the diagnosis of hypertension. Those with prehypertension (systolic 120 to 139 mm Hg or diastolic 80 to 99 mm Hg) have an increased risk of develop-ing defi nite hypertension over time. Although the emphasis has historically been on the level of diastolic pressure, more recent evidence suggests that systolic pressure more accurately predicts cardiovascular complications.
HOW IS BLOOD PRESSURE REGULATED?
Hemodynamic Factors
Blood pressure (BP) is the product of cardiac output (CO) and total peripheral resistance (TPR):
BP � CO � TPR
And CO is the product of cardiac stroke vol-ume (SV) and heart rate (HR):
CO � SV � HR
As described in Chapter 9, SV is deter-mined by (1) cardiac contractility; (2) the venous return to the heart (the preload); and (3) the resistance the left ventricle must overcome to eject blood into the aorta (the afterload).
It follows that at least four systems are di-rectly responsible for blood pressure regula-tion: the heart, which supplies the pumping pressure; the blood vessel tone, which largely determines systemic resistance; the kidney, which regulates intravascular volume; and hormones, which modulate the functions of
Table 13.1. Classifi cation of Blood Pressure in Adults
CategorySystolic Pressure
(mm Hg)Diastolic Pressure
(mm Hg)
Normal �120 And �80Prehypertension 120–139 Or 80–89Stage 1 hypertension 140–159 Or 90–99Stage 2 hypertension �160 Or �100
Modifi ed from The seventh report of the Joint National Committee on Prevention, Detection, Evaluation, and Treatment of High Blood Pressure. JAMA. 2003;289:2560–2572.
Figure 13.1. Relationship between blood pressure and age (n � 1,029). Systolic (upper curves) and diastolic (lower curves) values are shown. Notice that by age 60, the average systolic pressure of women exceeds that of men. (Modifi ed from Kotchen JM, McKean HE, Kotchen TA. Blood pressure trends with aging. Hypertension. 1982;4(suppl 3):111–129.)
77237_ch13.indd 30277237_ch13.indd 302 8/11/10 8:22:21 AM8/11/10 8:22:21 AM

Hypertension
303
the other three systems. Figure 13.2 shows how factors related to these systems contribute to CO and TPR.
The renal component of blood pressure regulation deserves special mention, in light of the temptation to view hypertension simply as a cardiovascular problem. No matter how high the CO or TPR, renal excretion has the capacity to completely return blood pressure to normal by reducing intravascular volume. Therefore, the maintenance of chronic hypertension requires renal participation. Transplantation studies have confi rmed this point: the implan-tation of a kidney from a normotensive person into a hypertensive one typically improves the blood pressure. Similarly, surgical placement
of a kidney from a genetically hypertensive rat into a previously normotensive one usually leads to hypertension.
In the presence of normally functioning kidneys, an increase in blood pressure leads to augmented urine volume and sodium ex-cretion, which then returns the blood pres-sure back to normal. This process, known as pressure natriuresis, is blunted in the kidneys of hypertensive patients; thus, higher pres-sures are required to excrete a given sodium and water load. Current evidence suggests at least two possible reasons for this blunted response. First, microvascular and tubuloint-erstitial injury within the kidneys of hyper-tensive patients impairs sodium excretion.
Figure 13.2. Regulation of systemic blood pressure. The small arrows indicate whether there is a stimulatory (↑) or inhibitory (↓) effect on the boxed parameters. ADH, antidiuretic hormone; HR, heart rate; NP, natriuretic peptides; PSNS, parasympathetic nervous system; SNS, sympathetic nervous system; SV, stroke volume.
Blood Pressure
Cardiac Output Peripheral Resistance
HR SVCirculatingregulators
Directinnervation
Localregulators
Bloodviscosity
Contractility Venousreturn
Bloodvolume
Venoustone
Renalretention
(Na+, H20)
• PSNS (↓)• SNS (↑)• Catecholamines (↑)
• Angiotensin II (↑)• Catecholamines (↑)
• α1-Receptors (↑)• β2-Receptors (↓)
• Nitric oxide (↓)• Endothelin (↑)• [H+] (↓)• Oxygen (↑)• Adenosine (↓)• Prostaglandins (↓)
• Hematocrit (↑)
• Catecholamines (↑)• SNS (↑)
• Aldosterone (↑)• ADH (↑)• SNS (↑)• NP(↓)
• Thirst (↑)
• SNS (↑)• Catecholamines (↑)
77237_ch13.indd 30377237_ch13.indd 303 8/11/10 8:22:21 AM8/11/10 8:22:21 AM

Chapter 13
304
Second, the defect may lie with hormonal fac-tors critical to appropriate renal reactions to the sodium and intravascular volume environ-ment (e.g., the renin–angiotensin system, as described later in the chapter). In contrast to the fi rst possibility, abnormalities of hormonal regulation are amenable to correction with ap-propriate therapy.
Blood Pressure Refl exes
The cardiovascular system is endowed with feedback mechanisms that continuously moni-tor arterial pressure: they sense when the pres-sure becomes excessively high or low and then respond rapidly to those changes. One such mechanism is the baroreceptor refl ex, which is mediated by receptors in the walls of the aortic arch and the carotid sinuses. The barore-ceptors monitor changes in pressure by sens-ing the stretch and deformation of the arteries. If the arterial pressure rises, the baroreceptors are stimulated, increasing their transmission of impulses to the central nervous system (i.e., the medulla). Negative feedback signals are then sent back to the circulation via the autonomic nervous system, causing the blood pressure to fall back to its baseline level.
The higher the blood pressure rises, the more the baroreceptors are stretched and the greater the impulse transmission rate to the medulla. Signals from the carotid sinus receptors are carried by the glossopharyngeal nerve (cranial nerve IX), whereas those from the aortic arch receptors are carried by the vagus nerve (cranial nerve X). These nerve fi bers converge at the tractus solitarius in the medulla, where the baroreceptor impulses in-hibit sympathetic nervous system outfl ow and excite parasympathetic effects. The net result is (1) a decline in peripheral vascular resis-tance (i.e., vasodilation) and (2) a reduction in CO (because of a lower HR and reduced force of cardiac contraction). Each of these effects tends to lower arterial pressure back toward its baseline. Conversely, when a fall in systemic pressure is sensed by the baroreceptors, fewer impulses are transmitted to the medulla, lead-ing to a refl exive increase in blood pressure.
The main effect of the baroreceptor mech-anism is to modulate moment-by-moment
variations in systemic blood pressure. How-ever, the baroreceptor refl ex is not involved in the long-term regulation of blood pressure and does not prevent the development of chronic hypertension. The reason for this is that the baroreceptors constantly reset themselves. After a day or two of exposure to higher-than-baseline pressures, the baroreceptor-fi ring rate slows back to its control value.
ESSENTIAL HYPERTENSION
Approximately 90% of hypertensive patients have blood pressures that are elevated for no readily defi nable reason, a condition termed essential hypertension. The diagnosis of EH is one of exclusion; it is the option left to the clinician after considering the causes of sec-ondary hypertension described later in this chapter.
EH is more a description than a diagno-sis, indicating only that a patient manifests a specifi c physical fi nding (high blood pres-sure) for which no cause has been found. In all likelihood, different underlying defects are responsible for the elevated pressure in differ-ent subpopulations of patients. Because the exact nature of these defects is unknown, to understand EH is to understand the possibili-ties: what could go wrong with normal physi-ology to produce chronically elevated blood pressure?
This discussion of EH therefore refl ects what is currently known about its epidemiol-ogy and genetics, experimental fi ndings, and natural history. The picture that emerges is that EH likely results from multiple defects of blood pressure regulation that interact with environmental stressors. The regulatory defects may be acquired or genetically determined and may be independent of one another. As a result, EH patients exhibit varied combina-tions of abnormalities and, therefore, have various physiologic bases for their elevated blood pressures.
Epidemiology and Genetics
Heredity appears to play an important role in EH, but defi nite genetic markers have not been consistently identifi ed. It seems most likely
77237_ch13.indd 30477237_ch13.indd 304 8/11/10 8:22:22 AM8/11/10 8:22:22 AM

Hypertension
305
that EH is a complex genetic disorder, involv-ing several loci. Evidence for a hereditary role is suggested by the higher rate of elevated blood pressures among fi rst-degree relatives of hypertensive patients than in the general population. Concordance between identical twins is high and signifi cantly greater than between dizygotic twins. Furthermore, an un-even distribution of EH exists among different racial groups. For example, in most age distri-butions, blacks are signifi cantly more likely to be hypertensive than persons of other races.
Although no gene has been consistently linked to EH, several loci have demonstrated positive associations. For example, autosomal dominant contributors to elevated blood pres-sure have been discovered, usually involving defects of renal sodium channels. However, these abnormalities are rare and are thought to be present in only a small fraction of hyper-tensive patients. Genes regulating the renin–angiotensin–aldosterone axis have been most thoroughly studied in hypertensives because of the central role of this system in determining intravascular volume and vascular tone. Within this group, certain polymorphisms in the gene for angiotensinogen confer an increased risk of hypertension. Additionally, polymorphisms in the gene for alpha-adducin, a cytoskeletal protein, may be involved in a subgroup of EH patients, possibly by increasing renal tubular sodium absorption. And as described later in the chapter, signifi cant associations exist be-tween hypertension and obesity, insulin resis-tance, and diabetes. The pathophysiologic and genetic links among these four conditions are areas of very active investigation.
Experimental Findings
Systemic Abnormalities
Multiple defects in blood pressure regulation have been found in EH patients and their rela-tives. By themselves, or in conjunction with one another, these abnormalities may contrib-ute to chronic blood pressure elevation.
The heart can contribute to a high CO-based hypertension owing to sympathetic overactiv-ity. For example, when tested under psycho-logically stressful conditions, hypertensive
patients (and their fi rst-degree relatives) often develop excessive HR acceleration compared with control subjects, suggesting an excessive sympathetic response.
The blood vessels may contribute to peri-pheral vascular resistance–based hypertension by constricting in response to (1) increased sympathetic activity; (2) abnormal regulation of vascular tone by local factors, including nitric oxide, endothelin, and natriuretic fac-tors; or (3) ion channel defects in contractile vascular smooth muscle.
The kidney can induce volume-based hyper-tension by retaining excessive sodium and water as a result of (1) failure to regulate renal blood fl ow appropriately; (2) ion channel defects (e.g., reduced basolateral Na�K�-ATPase), which di-rectly cause sodium retention; or (3) inappro-priate hormonal regulation. For example, the renin–angiotensin–aldosterone axis is an impor-tant hormonal regulator of peripheral vascular resistance. Renin levels in EH patients (com-pared with those in normotensive persons) are subnormal in 25%, normal in ~60%, and high in 10 to 15%. Because renin secretion should be suppressed by high blood pressure, even “nor-mal” levels are inappropriate in hypertensives. Thus, abnormalities of this system’s regulation may play a role in some individuals with EH.
Figure 13.3 highlights these and other po-tential mechanisms of EH. Note that although the heart, blood vessels, and kidneys are the organs ultimately responsible for producing the pressure, primary defects may be located elsewhere as well (e.g., the central nervous system, arterial baroreceptors, and adrenal hormone secretion). Yet, although abnormal regulation at these sites can contribute to elevated blood pressure, it is important to remember that without renal complicity, mal-function of other systems would not produce sustained hypertension, since the normal kid-ney is capable of eliminating suffi cient volume to return the blood pressure to normal.
Insulin Resistance, Obesity,and the Metabolic Syndrome
Recent research has suggested that the hormone insulin may play a role in the development of EH. In many people with hypertension, especially
77237_ch13.indd 30577237_ch13.indd 305 8/11/10 8:22:22 AM8/11/10 8:22:22 AM

Chapter 13
306
those who are obese or have type 2 diabetes, there is impaired insulin–dependent transport of glucose into many tissues (termed insulin re-sistance). As a result, serum glucose levels rise, stimulating the pancreas to release additional in-sulin. Elevated insulin levels may contribute to hypertension via increased sympathetic activa-tion or by stimulation of vascular smooth muscle cell hypertrophy, which increases vascular resis-tance. Smooth muscle cell hypertrophy may be caused by a direct mitogenic effect of insulin or through enhanced sensitivity to platelet-derived growth factor.
Obesity itself has been directly associ-ated with hypertension. Possible explana-tions for this relationship include (1) the release of angiotensinogen from adipocytes as substrate for the renin–angiotensin system, (2) augmented blood volume related to in-creased body mass, and (3) increased blood viscosity caused by adipocyte release of profi -brinogen and plasminogen activator inhibitor 1. The current epidemic of obesity has led to a dramatic increase in the number of people
with metabolic syndrome. As described in Chapter 5, this condition represents a clustering of atherogenic risk factors, including hyperten-sion, hypertriglyceridemia, low serum high-density lipoprotein (HDL), a tendency toward glucose intolerance, and truncal obesity. Cur-rent evidence suggests that insulin resistance is central to the pathogenesis of this clustering.
Natural History
EH characteristically arises after young adult-hood. Its prevalence increases with age and more than 60% of Americans older than 60 years are hypertensive. In addition, the hemodynamic characteristics of blood pres-sure elevation in EH tend to change over time. The systolic pressure increases throughout adult life, while the diastolic pressure rises until about the age of 50 then declines slightly thereafter (see Fig. 13.1). Accordingly, dia-stolic hypertension is more common in young people, while a substantial number of hy-pertensive patients over age 50 have isolated
Figure 13.3. Potential primary abnormalities in essential hypertension. These defects are supported by experimental evidence, but their specifi c contributions to essential hypertension remain unknown. CNS, central nervous system; RAA, renin–angiotensin–aldosterone system.
••• •
↓ Nitric oxide secretion↑ Endothelin productionCa2+ or Na+/K+ channel defectsHyperresponsiveness tocatecholamines
Blood vessel
Functional:
• Exaggerated medialhypertrophy
Structural:
Adrenal
• Catecholamine leakor malregulation
Kidney
••
RAA dysfunctionIon channel defects (e.g., Na+/K+/2Cl–
cotransporter, basolateral Na+/K+ ATPase,Ca2+ ATPase)
Pressure/volume receptors
• Desensitization
CNS
•••
↑ Basal sympathetic toneAbnormal stress responseAbnormal response to signals frombaroreceptors and volume receptors
77237_ch13.indd 30677237_ch13.indd 306 8/11/10 8:22:22 AM8/11/10 8:22:22 AM

Hypertension
307
systolic hypertension with normal diastolic values (see Fig. 13.4).
In younger persons with hypertension, ele-vated blood pressure tends to be driven by high CO in the setting of relatively normal peripheral vascular resistance, termed the hyperkinetic phase of EH (Fig. 13.5). With advancing age, however, the effect of CO declines, perhaps be-cause of the development of left ventricular hy-pertrophy and its consequent reduced diastolic fi lling (which in turn reduces SV and CO). Con-versely, vascular resistance increases with age due to medial hypertrophy as the vessels adapt
to the prolonged pressure stress. Thus, younger hypertensive patients often display augmented CO as the principal abnormality, and older pa-tients tend to have elevated TPR as the major hemodynamic fi nding.
In summary, EH is a syndrome that may arise from many potential abnormalities, but it exhibits a characteristic hemodynamic profi le and natural history. It is likely that multiple defects, separately inherited or acquired, act together to chronically raise blood pressure. Although we may not understand the precise
Figure 13.4. Categories of blood pressure elevation in untreated hypertensive patients. Isolated systolic hypertension predominates in patients older than 50 years, primarily as a result of decreased vascular compli-ance. (Modifi ed from Franklin SS, Jacobs MJ, Wong ND, et al. Predominance of isolated systolic hypertension among middle aged and elderly US hypertensives: analysis based on National Health and Nutrition Examination Survey (NHANES III). Hypertension. 2001;37:869–874.)
Isolated systolichypertension
Systolic and diastolichypertension
Isolated diastolichypertension
Age (years)
Fre
qu
ency
<40 40–49 50–59 60–69 70–79 >80
100%
90%
80%
70%
60%
50%
40%
30%
20%
10%
0%
Figure 13.5. Hemodynamic progression of essential hypertension. Schematic representation of the changing contribution of cardiac output (CO) and total peripheral resistance (TPR) as age increases in many patients with essential hypertension.
CO
TPR
Increasing age
Cardiacoutput (CO)contribution
to bloodpressure
Peripheralresistance (TPR)
contributionto
bloodpressure
77237_ch13.indd 30777237_ch13.indd 307 8/11/10 8:22:22 AM8/11/10 8:22:22 AM

Chapter 13
308
underlying mechanisms in individual hyper-tensive patients, we can at least describe what kind of pathophysiology might be at fault.
SECONDARY HYPERTENSION
Although EH dominates the clinical picture, a defi ned structural or hormonal cause for hypertension may be found in a small percent-age of patients. Identifi cation of such cases of secondary hypertension is important because the underlying conditions may require therapy different from that administered for EH and they are often curable. Moreover, if second-ary hypertension is left uncontrolled, adaptive cardiovascular changes may develop analo-gous to those of long-standing EH that could cause the elevated pressures to persist even after the underlying cause is corrected.
Although secondary forms should be con-sidered in the workup of all patients with
hypertension, there are clues that a given pa-tient may have one of the correctable condi-tions (Table 13.2):
1. Age. If a patient develops hypertension before age 20 or after age 50 (outside the usual range of EH), secondary hyper-tension is more likely.
2. Severity. Secondary hypertension often causes blood pressure to rise dramatically, whereas most EH patients usually have mild to moderate hypertension.
3. Onset. Secondary forms of hypertension often present abruptly in a patient who was previously normotensive, rather than grad-ually progressing over years as is the usual case in EH.
4. Associated signs and symptoms. The pro-cess that induces hypertension may give rise to other characteristic abnormalities, identifi ed by the history and physical
Table 13.2. Causes of Hypertension
TypePercent of
Hypertensive Patients Clinical Clues
Essential ~90% • Age of onset: 20–50 years• Family history of hypertension• Normal serum K�, urinalysis
Chronic renal disease 2–4% • ↑ Creatinine, abnormal urinalysis
Primary aldosteronism �2%–15% • ↓ Serum K�
(varies by sensitivity of screening)
Renovascular 1% • Abdominal bruit• Sudden onset (especially if age �50 or
�20)• ↓ Serum K�
Pheochromocytoma 0.2% • Paroxysms of palpitations, diaphoresis, and headache
• Weight loss• Episodic hypertension in one third of
patients
Coarctation of the aorta 0.1% • Blood pressure in arms � legs, or right arm � left arm
• Midsystolic murmur between scapulae• Chest x-ray: aortic indentation, rib-
notching due to arterial collaterals
Cushing syndrome 0.1% • “Cushingoid” appearance (e.g., central obesity, hirsutism)
77237_ch13.indd 30877237_ch13.indd 308 8/11/10 8:22:24 AM8/11/10 8:22:24 AM

Hypertension
309
examination. For example, a renal artery bruit (swishing sound caused by turbulent blood fl ow through a stenotic artery) may be heard on abdominal examination in a patient with renal artery stenosis.
5. Family history. EH patients often have hypertensive fi rst-degree relatives, whereas secondary hypertension more commonly occurs sporadically.
Patient Evaluation
The usual clinical evaluation of a patient with recently diagnosed hypertension begins with a careful history and physical examination, includ-ing a search for clues to the secondary forms. For example, repeated urinary tract infections may suggest the presence of chronic pyelonephritis with renal damage as the cause of hyperten-sion. Excessive weight loss may be an indica-tor of pheochromocytoma, whereas weight gain may point to the presence of Cushing syndrome. The history also should include an assessment of lifestyle behaviors that may contribute to hypertension, such as excessive alcohol con-sumption, and the patient’s medications should be reviewed because certain drugs (see next section) may elevate blood pressure. Obstructive sleep apnea is commonly associated with hyper-tension and should be considered particularly in patients who snore and have a history of hyper-tension refractory to medications.
Laboratory tests commonly performed in the initial evaluation of the hypertensive patient, including general screening for sec-ondary causes, are (1) urinalysis and measure-ment of the serum concentration of creatinine and blood urea nitrogen to evaluate for renal abnormalities; (2) serum potassium level (abnormally low in renovascular hyperten-sion or aldosteronism); (3) blood glucose level (elevated in diabetes, which is strongly asso-ciated with hypertension and renal disease); (4) serum cholesterol, HDL cholesterol, and triglyceride levels, as part of the global vascu-lar risk screen; and (5) an electrocardiogram (for evidence of left ventricular hypertrophy caused by chronic hypertension).
If no abnormalities are found that suggest a secondary form of hypertension, the patient is presumed to have EH and treated accord-
ingly. If, however, the patient’s blood pres-sure continues to be elevated despite standard treatments, then more detailed diagnostic test-ing may be undertaken to search for specifi c secondary causes.
Exogenous Causes
Several medications can elevate blood pressure. For example, oral contraceptives may cause secondary hypertension in some women. The mechanism is likely related to increased activity of the renin–angiotensin system. Estro-gens increase the hepatic synthesis of angio-tensinogen, leading to greater production of angiotensin II (Fig. 13.6). Angiotensin II raises blood pressure by several mechanisms, most notably by direct vasoconstriction and by stim-ulating the adrenal release of aldosterone. The latter hormone causes renal sodium retention and therefore increased intravascular volume.
Other medications that can raise blood pres-sure include glucocorticoids, cyclosporine (an antirejection drug used in patients with organ transplants), erythropoietin (a hormone that increases bone marrow red blood cell forma-tion and elevates blood pressure by increasing blood viscosity and reversing local hypoxic vasodilatation), and sympathomimetic drugs (which are common in over-the-counter cold remedies). Nonsteroidal anti-infl ammatory drugs can contribute to hypertension through dose-related augmentation of sodium and water retention by the kidneys.
Two other substances that may contribute to hypertension are ethanol (i.e., chronic ex-cessive consumption) and cocaine. Both of these are associated with increased sympa-thetic nervous system activity.
Renal Causes
Given the crucial role of kidney in the control of blood pressure, it is not surprising that renal dysfunction can lead to hypertension. In fact, renal disease contributes to two important endogenous causes of secondary hyperten-sion: renal parenchymal disease, accounting for 2% to 4% of hypertensive patients, and renal arterial stenosis, which accounts for approximately 1%.
77237_ch13.indd 30977237_ch13.indd 309 8/11/10 8:22:24 AM8/11/10 8:22:24 AM
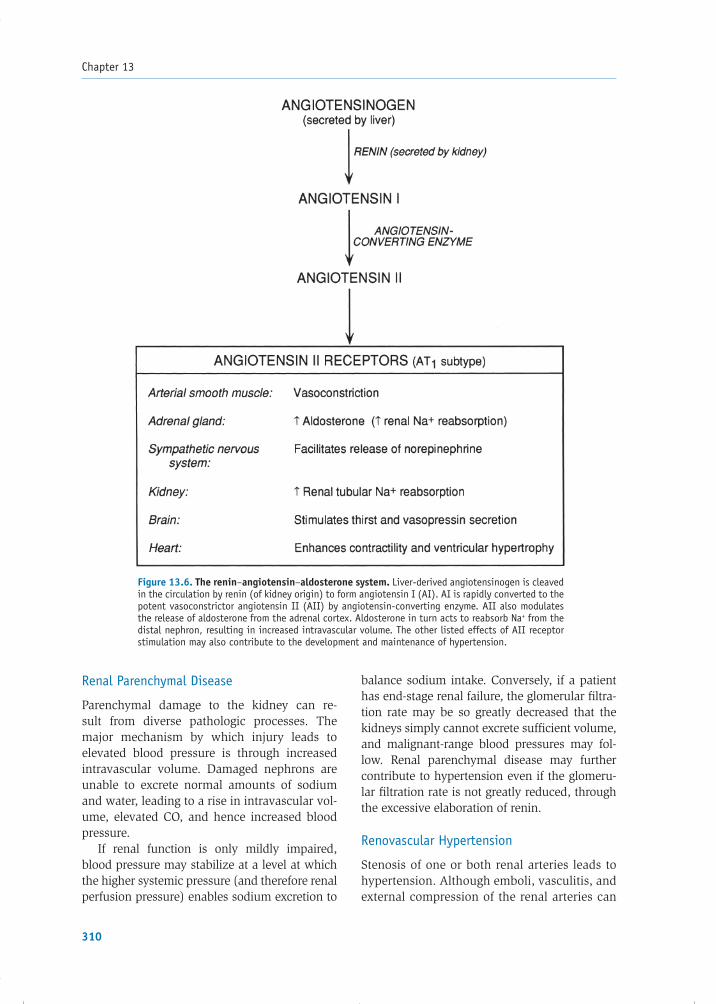
Chapter 13
310
Renal Parenchymal Disease
Parenchymal damage to the kidney can re-sult from diverse pathologic processes. The major mechanism by which injury leads to elevated blood pressure is through increased intravascular volume. Damaged nephrons are unable to excrete normal amounts of sodium and water, leading to a rise in intravascular vol-ume, elevated CO, and hence increased blood pressure.
If renal function is only mildly impaired, blood pressure may stabilize at a level at which the higher systemic pressure (and therefore renal perfusion pressure) enables sodium excretion to
balance sodium intake. Conversely, if a patient has end-stage renal failure, the glomerular fi ltra-tion rate may be so greatly decreased that the kidneys simply cannot excrete suffi cient volume, and malignant-range blood pressures may fol-low. Renal parenchymal disease may further contribute to hypertension even if the glomeru-lar fi ltration rate is not greatly reduced, through the excessive elaboration of renin.
Renovascular Hypertension
Stenosis of one or both renal arteries leads to hypertension. Although emboli, vasculitis, and external compression of the renal arteries can
Figure 13.6. The renin–angiotensin–aldosterone system. Liver-derived angiotensinogen is cleaved in the circulation by renin (of kidney origin) to form angiotensin I (AI). AI is rapidly converted to the potent vasoconstrictor angiotensin II (AII) by angiotensin-converting enzyme. AII also modulates the release of aldosterone from the adrenal cortex. Aldosterone in turn acts to reabsorb Na+ from the distal nephron, resulting in increased intravascular volume. The other listed effects of AII receptor stimulation may also contribute to the development and maintenance of hypertension.
77237_ch13.indd 31077237_ch13.indd 310 8/11/10 8:22:24 AM8/11/10 8:22:24 AM

Hypertension
311
be responsible, the two most common causes of renovascular hypertension (RH) are athero-sclerosis and fi bromuscular dysplasia. Athero-sclerotic lesions arise from extensive plaque formation either within the renal artery or in the aorta at the origin of the renal artery. This form accounts for about two thirds of cases of RH and occurs most commonly in elderly men. In contrast, fi bromuscular lesions consist of discrete regions of fi brous or muscular pro-liferation, generally within the arterial media. Fibromuscular dysplasia accounts for one third of cases of RH and characteristically occurs in young women.
The elevated blood pressure in RH arises from reduced renal blood fl ow to the affected kidney, which responds to the lower perfusion pressure by secreting renin. The latter raises the blood pressure through the subsequent actions of an-giotensin II (vasoconstriction) and aldosterone (sodium retention), as shown in Figure 13.6.
The diagnosis of RH is suggested by an ab-dominal bruit, which can be found in 40% to 60% of patients, or by the presence of unex-plained hypokalemia (owing to excessive renal excretion of potassium as a result of elevated aldosterone levels). RH is a correctable form of hypertension that may be treated successfully by percutaneous catheter interventions or surgical reconstruction of the stenosed vessel. Medical therapy, particularly with angiotensin-converting enzyme (ACE) inhibitors, can also be effective initial therapy in patients with unilateral renal artery disease. ACE inhibitors negate the hy-pertensive effects of elevated circulating renin in this situation by impeding the formation of angiotensin II (see Chapter 17). Conversely, this class of drugs should be avoided, or used cau-tiously, in patients with bilateral stenotic lesions. The inhibition of angiotensin II production may excessively reduce intraglomerular pressure and fi ltration, and worsen renal function, in patients with bilateral disease who already have compro-mised perfusion to both kidneys.
Mechanical Causes
Coarctation of the Aorta
Coarctation is an infrequent congenital nar-rowing of the aorta typically located just distal
to the origin of the left subclavian artery (see Chapter 16). As a result of the relative obstruc-tion to fl ow, the blood pressure in the aortic arch, head, and arms is higher than that in the descending aorta and its branches and in the lower extremities. Sometimes the coarcta-tion involves the origin of the left subclavian artery, causing lower pressure in the left arm compared with the right arm.
Hypertension in this condition arises by two mechanisms. First, reduced blood fl ow to the kidneys stimulates the renin– angiotensin system, resulting in vasocon-striction (via angiotensin II). Second, high pressures proximal to the coarctation stiffen the aortic arch through medial hyperplasia and accelerated atherosclerosis, blunting the normal baroreceptor response to elevated in-travascular pressure.
Clinical clues to the presence of coarctation include symptoms of inadequate blood fl ow to the legs or left arm, such as claudication or fatigue, or the fi nding of weakened or absent femoral pulses. A midsystolic murmur asso-ciated with the stenotic segment of the aorta may be auscultated, especially over the back, between the scapulae. The chest radiograph may show indentation of the aorta at the level of the coarctation. It may also demonstrate a notched appearance of the ribs secondary to the enlargement of collateral intercostal ar-teries, which shunt blood around the aortic narrowing. Treatment options include angio-plasty or surgery to correct the stenosis. How-ever, hypertension may not abate completely after mechanical correction, in part because of persistent desensitization of the arterial baroreceptors.
Endocrine Causes
Circulating hormones play an important role in the control of normal blood pressure, so it should not be surprising that endocrine dis-eases may cause hypertension. When sus-pected, the presence of such conditions is evaluated in four ways:
1. History of characteristic signs and symptoms
2. Measurement of hormone levels
77237_ch13.indd 31177237_ch13.indd 311 8/11/10 8:22:24 AM8/11/10 8:22:24 AM

Chapter 13
312
3. Assessment of hormone secretion in re-sponse to stimulation or inhibition
4. Imaging studies to identify tumors secreting the excessive hormone
Pheochromocytoma
Pheochromocytomas are catecholamine- secreting tumors of neuroendocrine cells (usually in the adrenal medulla) that cause approximately 0.2% of cases of hypertension. The release of epinephrine and norepinephrine by the tumor results in intermittent or chronic vasoconstriction, tachycardia, and other sym-pathetic-mediated effects. A characteristic pre-sentation consists of paroxysmal rises in blood pressure accompanied by “autonomic attacks” caused by the increased catecholamine levels: severe throbbing headaches, profuse sweat-ing, palpitations, and tachycardia. Although some patients are actually normotensive be-tween attacks, most have sustained hyperten-sion. Ten percent of pheochromocytomas are malignant.
Determination of plasma catecholamine levels, or urine catecholamines and their metabolites (e.g., vanillylmandelic acid and metanephrine), obtained under controlled circumstances, are used to identify this con-dition. Because some pheochromocytomas se-crete only episodically, diagnosis may require measurement of catecholamines immediately following an attack.
Pharmacologic therapy of pheochromocyto-mas includes the combination of an �-receptor blocker (e.g., phenoxybenzamine) combined with a -blocker. However, once the tumor is localized by computed tomography, mag-netic resonance imaging, or angiography, the defi nitive therapy is surgical resection. For patients with inoperable disease, treatment consists of �- and -blockade as well as drugs that inhibit catecholamine biosynthesis (e.g., �-methyltyrosine).
Adrenocortical Hormone Excess
Among the hormones produced by the adrenal cortex are mineralocorticoids and glucocorti-coids. Excess of either of these can result in hypertension.
Mineralocorticoids, primarily aldosterone, increase blood volume by stimulating reab-sorption of sodium into the circulation by the distal portions of the nephron. This occurs in exchange for potassium excretion into the urine, and the resulting hypokalemia is an important marker of mineralocorticoid excess. Primary aldosteronism results either from an adrenal adenoma (termed Conn syndrome) or from bilateral hyperplasia of the adrenal glands. While once considered rare, recent data suggest that the frequency of primary al-dosteronism may be as high as 10% to 15% among hypertensives, depending on the sen-sitivity of screening, with a substantial major-ity having the bilateral hyperplasia form. The diagnosis may be suspected by the presence of hypokalemia and is confi rmed by the fi nd-ing of excessive plasma aldosterone and a sup-pressed renin level. Therapy includes either surgical removal of the responsible adenoma (if present) or medical management with aldosterone receptor antagonists.
Glucocorticoid-remediable aldosteronism (GRA), an uncommon hereditary (autosomal dominant) form of primary aldosteronism, re-sults from a genetic rearrangement in which aldosterone synthesis abnormally comes under the regulatory control of adrenocorticotropic hormone (ACTH). This condition typically presents as severe hypertension in childhood or young adulthood, as opposed to the more com-mon forms of primary aldosteronism, which are generally diagnosed in the third through sixth decades. Unlike other forms of hypertension, GRA-related blood pressure elevation responds to glucocorticoid therapy, which suppresses ACTH release from the pituitary gland.
Secondary aldosteronism can result from increased angiotensin II production stimulated by rare renin-secreting tumors. More com-monly, secondary elevation of aldosterone is a result of augmented circulating angiotensin II in women taking oral contraceptives (which stimulate hepatic production of angiotensino-gen, as described earlier) or because of im-paired angiotensin II degradation in chronic liver diseases.
Glucocorticoids, such as cortisol, elevate blood pressure when present in excess amounts, likely via blood volume expansion
77237_ch13.indd 31277237_ch13.indd 312 8/11/10 8:22:24 AM8/11/10 8:22:24 AM

Hypertension
313
and stimulated synthesis of components of the renin–angiotensin system. In addition, though mineralocorticoids are more potent ac-tivators of mineralocorticoid receptors in the renal tubules, excess glucocorticoids may also activate them.
Nearly 80% of patients with Cushing syn-drome, a disorder of glucocorticoid excess, have some degree of hypertension. These patients often present with classic “cushin-goid” features: a characteristic rounded fa-cial appearance, central obesity, proximal muscle weakness, and hirsutism. The cause of the excess glucocorticoids may be either a pituitary ACTH-secreting adenoma, a peri-pheral ACTH-secreting tumor (either of which causes adrenal cortical hyperplasia), or an adrenal cortisol–secreting adenoma. The diag-nosis of Cushing syndrome is confi rmed by a 24-hour urine collection for the measurement of cortisol, or by a dexamethasone test, which evaluates whether exogenous glucocorticoids can suppress cortisol secretion.
Thyroid Hormone Abnormalities
Approximately one third of hyperthyroid and one fourth of hypothyroid patients have sig-nifi cant hypertension. Thyroid hormones exert their cardiovascular effects by (1) inducing sodium–potassium ATPases in the heart and vessels; (2) increasing blood volume; and (3) stimulating tissue metabolism and oxy-gen demand, with secondary accumulation of metabolites that modulate local vascular tone. Hyperthyroid patients develop hyperten-sion through cardiac hyperactivity with an in-crease in blood volume. Hypothyroid patients demonstrate predominantly diastolic hyper-tension and an increase in peripheral vascular resistance. Though the precise mechanism is unclear, the latter effect appears to be medi-ated by sympathetic and adrenal activation in hypothyroidism.
CONSEQUENCES OF HYPERTENSION
Whatever the cause of blood pressure eleva-tion, the ultimate consequences are similar. High blood pressure itself is generally asymp-tomatic but can result in devastating effects
on many organs, especially the blood vessels, heart, kidney, and retina.
Clinical Signs and Symptoms
In the past, “classic” symptoms of hyper-tension were considered to include headache, epistaxis (nose bleeds), and dizziness. The usefulness of these symptoms has been called into question, however, by studies that indi-cate that they are found no more frequently among hypertensive patients than in the gen-eral population. Other symptoms, such as fl ushing, sweating, and blurred vision, do seem more common in the hypertensive popu-lation. In general, however, most hypertensive patients are asymptomatic and are diagnosed simply by blood pressure measurement during routine physical examinations.
Several physical signs of hypertension dis-cussed in the following sections result directly from elevated pressure, including left ventri-cular hypertrophy and retinopathy. In addition, hypertension complicated by atherosclerosis can manifest by arterial bruits, particularly in the carotid and femoral arteries.
Organ Damage Caused by Hypertension
Target organ complications of hypertension refl ect the degree of chronic blood pres-sure elevation. Such organ damage can be attributed to (1) the increased workload of the heart and (2) arterial damage resulting from the combined effects of the elevated pressure itself (weakened vessel walls) and accelerated atherosclerosis (Fig. 13.7). Ab-normalities of the vasculature that result from elevated pressure include smooth muscle hy-pertrophy, endothelial cell dysfunction, and fatigue of elastic fi bers. Chronic hypertensive trauma to the endothelium promotes athero-sclerosis possibly by disrupting normal pro-tective mechanisms, such as the secretion of nitric oxide. Arteries lined by atherosclerotic plaque may thrombose or may serve as a source of cholesterol emboli that occlude distal vessels, causing organ infarction (such as cerebrovascular occlusion, resulting in stroke). In addition, atherosclerosis of large arteries hinders their elasticity, resulting in
77237_ch13.indd 31377237_ch13.indd 313 8/11/10 8:22:24 AM8/11/10 8:22:24 AM

Chapter 13
314
systolic pressure spikes that can further trau-matize endothelium or provoke events such as aneurysm rupture.
The major target organs for the destructive complications of chronic hypertension are the heart, the cerebrovascular system, the aorta and peripheral vascular system, the kidney, and the retina (Table 13.3). Left untreated, ap-
proximately 50% of hypertensive patients die of coronary artery disease or congestive heart failure, about 33% succumb to stroke, and 10% to 15% die from complications of renal failure.
Heart
The major cardiac effects of hypertension re-late to the increased afterload against which the heart must contract and accelerated atherosclerosis within the coronary arteries.
Left Ventricular Hypertrophy and Diastolic Dysfunction
The high arterial pressure (heightened af-terload) increases the wall tension of the left ventricle, which compensates through hyper-trophy. Concentric hypertrophy (without dilata-tion) is the normal pattern of compensation, although conditions that elevate blood pressure by virtue of increased circulating volume (e.g., primary aldosteronism) may instead cause eccentric hypertrophy with chamber dilatation (see Chapter 9). Left ventricular hypertrophy (LVH) results in increased stiffness of the left ventricle with diastolic dysfunction, manifested
Table 13.3. Target Organ Damage in Hypertension
Organ System Manifestations
Heart • Left ventricular hypertrophy• Heart failure• Myocardial ischemia and
infarction
Cerebrovascular • Stroke
Aorta and peripheral vascular
• Aortic aneurysm and/or dissection
• Arteriosclerosis
Kidney • Nephrosclerosis• Renal failure
Retina • Arterial narrowing• Hemorrhages, exudates,
papilledema
Figure 13.7. Pathogenesis of the major consequences of arterial hypertension. LVH, left ventricular hypertrophy.
77237_ch13.indd 31477237_ch13.indd 314 8/11/10 8:22:24 AM8/11/10 8:22:24 AM
Hypertension
315
by elevation of LV fi lling pressures that can re-sult in pulmonary congestion.
Physical fi ndings of LVH may include a heaving LV impulse on chest palpation, indica-tive of increased muscle mass. It is frequently accompanied by a fourth heart sound, as the left atrium contracts into the stiffened left ven-tricle (see Chapter 2).
LVH is one of the strongest predictors of cardiac morbidity in hypertensive patients. The degree of hypertrophy correlates with the development of congestive heart failure, an-gina, arrhythmias, myocardial infarction, and sudden cardiac death.
Systolic Dysfunction
Although LVH initially serves a compensatory role, later in the course of systemic hyper-tension, the increased LV mass may be insuf-fi cient to balance the high wall tension caused by the elevated pressure. As LV contractile capacity deteriorates, fi ndings of systolic dys-function become evident (i.e., reduced CO and pulmonary congestion). Systolic dysfunction is also provoked by the accelerated development of coronary artery disease with resultant periods of myocardial ischemia.
Coronary Artery Disease
Chronic hypertension is a major contributor to the development of myocardial ischemia and infarction. These complications refl ect the com-bination of accelerated coronary atherosclero-sis (decreased myocardial oxygen supply) and the high systolic workload (increased oxygen demand). In addition, hypertensives have a higher incidence of postmyocardial infarction complications such as rupture of the ventri-cular wall, LV aneurysm formation, and con-gestive heart failure. In fact, 60% of patients who die of transmural myocardial infarctions have a history of hypertension.
Cerebrovascular System
Hypertension is the major modifi able risk fac-tor for strokes, also termed cerebrovascular accidents (CVAs). Although diastolic pressure
is important, it is the magnitude of the systolic pressure that has been most closely linked to CVAs. The presence of isolated systolic hyper-tension more than doubles a person’s risk for this complication.
Hypertension-induced strokes can be hemorrhagic or, more commonly, athero-thrombotic. Hemorrhagic CVAs result from rupture of microaneurysms induced in cere-bral parenchymal vessels by long-standing hypertension. Atherothrombotic (also called thromboembolic) CVAs arise when portions of atherosclerotic plaque within the carotids or major cerebral arteries, or thrombi that form on those plaques, break off, and em-bolize to smaller distal vessels. Additionally, intracerebral vessels may be directly occluded by local atherosclerotic plaque rupture and thrombosis.
Occlusion of small penetrating brain arter-ies can result in multiple tiny infarcts. As these lesions soften and are absorbed by phagocytic cells, small (3 mm diameter) cavities form, termed lacunae. These lacunar infarctions are seen almost exclusively in patients with long-standing hypertension and are usually local-ized to the penetrating branches of the middle and posterior circulation of the brain.
The generalized arterial narrowing found in hypertensive patients reduces collateral fl ow to ischemic tissues and imposes structural requirements for higher perfusion pressure to maintain adequate tissue fl ow. This leaves the hypertensive patient vulnerable to cerebral infarcts in areas supplied by the distal ends of arterial branches (“watershed” infarcts) if blood pressure should fall suddenly.
Effective treatment of hypertension dimin-ishes the risk of stroke and has contributed to a 50% reduction in deaths attributed to cerebro-vascular events in recent decades.
Aorta and Peripheral Vasculature
The accelerated atherosclerosis associated with hypertension may result in plaque formation and narrowing throughout the arterial vas-culature. In addition to the coronary arteries, lesions most commonly appear within the aorta and the major arteries to the lowerextremities, neck, and brain.
77237_ch13.indd 31577237_ch13.indd 315 8/11/10 8:22:25 AM8/11/10 8:22:25 AM

Chapter 13
316
Chronic hypertension may lead to the de-velopment of aneurysms, particularly of the abdominal aorta. An abdominal aortic aneu-rysm (AAA) represents prominent dilatation of the vessel, usually located below the level of the renal arteries, contributed to by the mechanical stress of the high pressure on an arterial wall already weakened by medial damage and atherosclerosis (see Chapter 15). Aneurysms greater than 6 cm in diameter have a very high likelihood of rupture within 2 years if not surgically corrected.
Another life-threatening vascular conse-quence of high blood pressure is aortic dis-section (see Chapter 15). Elevated blood pressure, especially in the highest ranges, ac-celerates degenerative changes in the media of the aorta. When the weakened wall is further exposed to high pressure, the intima may tear, allowing blood to dissect into the aortic media and propagate in either direction
within the vessel wall, “clipping off” and ob-structing major branch vessels along the way (including coronary or carotid arteries). The mortality rate of aortic dissection is greater than 90% unless treated emergently, usually by surgical repair if the proximal aorta is in-volved. Rigorous control of hypertension is essential.
Kidney
Hypertension-induced kidney disease (nephro-sclerosis) is a leading cause of renal failure that results from damage to the organ’s vascu-lature. Histologically, the vessel walls become thickened with a hyaline infi ltrate, known as hyaline arteriolosclerosis (Fig. 13.8). Greater levels of hypertension can induce smooth muscle hypertrophy and even necrosis of cap-illary walls, termed fi brinoid necrosis. These changes result in reduced vascular supply and
Figure 13.8. Histologic effects of chronic hypertension on the kidney. The arteriolar walls are thickened by hyaline infi ltrate (short arrows). The glomeruli(long arrow) appear partially sclerosed because of reduced vascular supply. (Courtesy of Dr. Helmut G. Rennke, Brigham and Women’s Hospital, Boston, MA.)
77237_ch13.indd 31677237_ch13.indd 316 8/11/10 8:22:25 AM8/11/10 8:22:25 AM
Hypertension
317
subsequent ischemic atrophy of tubules and, to a lesser extent, glomeruli. Because intact nephrons can usually compensate for those damaged by patchy ischemia, mild hyper-tension rarely leads to renal insuffi ciency in the absence of other insults to the kidney. However, malignant levels of hypertension can infl ict permanent damage leading to chronic renal failure.
One of the consequences of hypertensive renal failure is perpetuation of elevated blood pressure. For example, progressive renal dys-function compromises the ability of the kidney to regulate blood volume, which contributes further to chronic hypertension.
Retina
The retina is the only location where systemic arteries can be directly visualized by physi-cal examination. High blood pressure induces abnormalities that are collectively termed hypertensive retinopathy. Although vision may be compromised when the damage is ex-tensive, more commonly the changes serve as an asymptomatic clinical marker for the sever-ity of hypertension and its duration.
Severe hypertension that is acute in onset (e.g., uncontrolled and/or malignant hyper-tension) may burst small retinal vessels, caus-ing hemorrhages, exudation of plasma lipids, and areas of local infarction. If ischemia of the optic nerve develops, patients may describe generalized blurred vision. Retinal ischemia caused by hemorrhage leads to more patchy loss of vision. Papilledema, or swelling of the optic disk with blurring of its margins, may arise from high intracranial pressure when the blood pressure reaches malignant levels and cerebrovascular autoregulation begins to fail.
Chronically elevated blood pressure results in a different set of retinal fi ndings. Papilledema is absent, but vasoconstriction results in arte-rial narrowing, and medial hypertrophy thick-ens the vessel wall, which “nicks” (indents) crossing veins. With more severe chronic hy-pertension, arterial sclerosis is evident as an increased refl ection of light through the oph-thalmoscope (termed “copper” or “silver” wiring). Although these changes are not in themselves of major functional importance,
they indicate that the patient has had long-standing, poorly controlled hypertension.
HYPERTENSIVE CRISIS
A hypertensive crisis is a medical emergency characterized by a severe elevation of blood pressure. In the past, this type of elevation was usually a consequence of inadequate blood pressure treatment. Now a hyper-tensive crisis is more often caused by an acute hemodynamic insult (e.g., acute renal disease) superimposed on a chronic hyper-tensive state. As a result of rapid pathologic changes (fi brinoid necrosis) within the blood vessels and kidneys, a spiraling increase in blood pressure evolves. Further volume ex-pansion and vasoconstriction occur as renal perfusion drops and serum renin and angio-tensin levels rise.
Severe blood pressure elevation results in increased intracranial pressure, and patients may present with hypertensive encephalo-pathy manifested by headache, blurred vi-sion, confusion, somnolence, and some-times coma. When hypertension results in acute damage to retinal vessels, accelerated-malignant hypertension is said to be present. Funduscopic examination shows the effects of the rapid pressure rise as hemorrhages, exu-dates, and sometimes papilledema, as described earlier. The increased load on the left ventricle during a hypertensive crisis may precipitate an-gina (because of increased myocardial oxygen demand) or pulmonary edema.
A hypertensive crisis requires rapid therapy to prevent permanent vascular complications. Correction of blood pressure is generally fol-lowed by reversal of the acute pathologic changes, including papilledema and retinal ex-udation, although renal damage often persists.
TREATMENT OF HYPERTENSION
The therapeutic approach to the hypertensive patient should be infl uenced by two consider-ations. First, a single elevated blood pressure measurement does not establish the diagnosis of hypertension because blood pressure var-ies considerably from day to day. Moreover, blood pressure measurement in the hospital or
77237_ch13.indd 31777237_ch13.indd 317 8/11/10 8:22:25 AM8/11/10 8:22:25 AM

Chapter 13
318
doctor’s offi ce may be affected by the “white coat” effect resulting from patient anxiety. The average of multiple readings taken at two or three offi ce visits and/or in the home provides a more reliable basis for labeling a patient as hypertensive. There is also evidence that automatic ambulatory blood pressure mea-surements, taken over the course of 24 hours while the patient follows a daily routine, are more predictive of cardiovascular mortality than traditional in-clinic measurements.
Second, although even mild hypertension is a major public health problem because of its high prevalence, for the person with stage 1 hypertension, the risks are small. For example, the additional risk of a stroke is approximately 1 in 850 per year. Hence, observation over time to determine whether the low-level hyperten-sion persists, or whether lifestyle changes can reduce the pressure, is often a recommended alternative to immediate drug therapy. This is especially true in the absence of other cardio-vascular risk factors such as smoking, diabetes, or high serum cholesterol. However, for patients with established cardiovascular disease or for those who have other major atherosclerotic risk factors, a more aggressive approach to pharmacologic therapy is usually warranted to reduce the risk burden.
For most hypertensive patients, drug ther-apy is ultimately the most effective way to pre-vent future complications, but that should not deter consideration of other benefi cial lifestyle changes.
Nonpharmacologic Treatment
Certain lifestyle modifi cations have been shown to be effective in lowering blood pressure and should be considered in the treatment plan for any patient with hypertension.
Weight Reduction
Studies have consistently found obesity and hypertension to be highly correlated, especially when the obesity is of a central (abdominal) distribution. Blood pressure reduction follows weight loss in a large portion of hypertensive patients who are more than 10% above their ideal weights. Each 10 kg of weight loss is
associated with a 5 to 20 mm Hg fall in systolic blood pressure.
Exercise
Sedentary normotensive people have a 20% to 50% higher risk of developing hypertension than their more active peers. Regular aerobic exercise, such as walking, jogging, or bicy-cling, has been shown to contribute to blood pressure reduction over and above any result-ing weight loss. A hypertensive patient who becomes physically conditioned manifests a lower resting HR and reduced levels of cir-culating catecholamines than before training, suggesting a fall in sympathetic tone.
Diet
In addition to caloric restriction for weight loss, changes in the composition of a patient’s diet may be important for blood pressure re-duction. For example, a diet high in fruits, veg-etables, and low-fat dairy products has been shown to signifi cantly reduce blood pressure.
Sodium
Salt restriction for people with high blood pressure is a controversial issue, but there are several epidemiologic and clinical trials that sup-port the benefi t of moderating sodium intake. In normotensive persons, excess salt ingestion is simply excreted by the kidneys, but approxi-mately 50% of patients with EH are found to have blood pressures that vary with sodium intake, suggesting a defect in natriuresis. Sensitivity to sodium levels is more common in African-American and elderly hypertensive patients. Because low-salt diets tend to increase the effectiveness of antihypertensive medications in general, the current recommendation is to limit salt intake to �6 g of sodium chloride (�2.3 g sodium) per day, which is one third less than the average U.S. consumption.
Potassium
Total body potassium content tends to decrease when a person eats a diet low in fruits and veg-etables or takes potassium-wasting diuretics.
77237_ch13.indd 31877237_ch13.indd 318 8/11/10 8:22:25 AM8/11/10 8:22:25 AM

Hypertension
319
Potassium defi ciency has several theoretical ef-fects that may raise blood pressure and contrib-ute to adverse cardiovascular outcomes, such that dietary supplements are routinely recom-mended to help replete low serum K� levels. There is no convincing evidence that prescrib-ing potassium supplements to a normokalemic hypertensive patient will lower blood pressure.
Alcohol
The chronic excessive intake of alcoholic bev-erages correlates with high blood pressure and resistance to antihypertensive medications. Moreover, experimental evidence shows that blood pressure (especially systolic) may rise acutely following alcohol consumption. The reason for this link remains incompletely un-derstood, but decreasing chronic alcohol in-take has been shown to lower blood pressure.
Other
Low calcium intake and magnesium depletion have been associated with elevated blood pres-sure, but the responsible mechanisms and the implications for therapy are unclear. Caffeine ingestion transiently increases blood pressure (as much as 5 to 15 mm Hg after two cups of coffee), but routine use does not seem to pro-duce chronic pressure elevation.
Smoking Cessation
Cigarette smoking transiently increases blood pressure, likely because of the effect of nicotine on autonomic ganglia, and is a risk factor for the development of sustained hypertension. In addition, the atherogenic effect of smoking may contribute to the development of renovas-cular hypertension. Cigarette usage is associ-ated with many other health hazards, and all patients should be discouraged from smoking.
Relaxation Therapy
Blood pressure frequently rises under condi-tions of stress. In addition, essential hyper-tensive patients and their relatives often show higher-than-normal basal sympathetic tone and exaggerated autonomic responses to mental
stress. Hence, relaxation techniques have been advocated as a method to control hypertension. Available methods include biofeedback and meditation. The effectiveness of such therapy has not been consistently demonstrated in clin-ical trials and seems to depend on the patient’s attitude and long-term compliance.
In summary, nonpharmacologic therapy of-fers a wide range of options that do not have the expense and potential side effects of pre-scribed drug use. The effectiveness of these therapies should come as no surprise, given the extent to which environmental factors play a role in hypertension. Therefore, behavior-based interventions are recommended as fi rst-line therapy in any patient whose hypertension is not an immediate danger.
Pharmacologic Treatment
Antihypertensive medications are the standard means to lower chronically elevated blood pressure and are indicated if nonpharmaco-logic treatment proves inadequate. More than 100 drug preparations are available to treat hypertension, but fortunately the most com-monly used medications fall into four classes: diuretics, sympatholytics, vasodilators, and drugs that interfere with the renin–angiotensin system (Table 13.4). The individual actions of these groups on the physiologic abnormali-ties in hypertension are shown in Figure 13.9. The pharmacology and use of antihyperten-sive drugs are described in greater detail in Chapter 17.
Diuretics have been in use for many decades to treat hypertension. They reduce circulatory volume, CO, and mean arterial pressure and are most effective in patients with mild to moderate hypertension who have normal renal function. They are especially ef-fective in African-American or elderly persons, who tend to be salt sensitive. In clinical trials, diuretics have reduced the risk of strokes and cardiovascular events in hypertensive patients and are inexpensive compared with other agents. Thiazide diuretics (e.g., hydrochloro-thiazide) and potassium-sparing diuretics (e.g., spironolactone) promote Na+ excretion in the distal nephron (see Chapter 17). Loop diuretics
77237_ch13.indd 31977237_ch13.indd 319 8/11/10 8:22:25 AM8/11/10 8:22:25 AM

Chapter 13
320
Table 13.4. Classes of Antihypertensive Medications
Drug Class Examples (See Chapter 17) Physiologic Action
Diuretics Thiazides ↓ Circulating volume Potassium-sparing diureticsLoop diuretics
Sympatholytics -Blockers ↓ Heart rate, cardiac contractility and renin secretion
Combined α- and -blockers Same as -blocker plus vascular smooth muscle relaxation
Central �2-agonists ↓ Sympathetic tonePeripheral �1-antagonists Relaxation of vascular smooth
muscle
Vasodilators Calcium channel blockers ↓ Peripheral vascular resistance Direct vasodilators (e.g., hydralazine, minoxidil)
↓ Peripheral vascular resistance
Renin–angiotensin–aldosterone system antagonists
Angiotensin-converting enzyme inhibitors
↓ Peripheral vascular resistance ↓ Sodium retention
Angiotensin II receptor blockers
Direct renin inhibitors
Figure 13.9. Physiologic effects of antihypertensive medications. Notice that some antihypertensive medications work at multiple sites. CCB, calcium channel blockers; HR, heart rate; RAS blockers, renin–angiotensin system blockers (i.e., angiotensin-converting enzyme inhibitors and angiotensin II receptor blockers); SV, stroke volume.
Blood Pressure
Cardiac Output Peripheral Resistance
HR SVCirculatingregulators
Directinnervation
Contractility Venousreturn
Bloodvolume
Venoustone
• β-Blockers• Some CCB
• RAS blockers• α1-Blockers• Central α2-agonists
• α1-Blockers• Central α2-agonists
• CCB and direct vasodilators
• β-Blockers• CCB
• Diuretics• RAS blockers
• RAS blockers• CCB• α1-Blockers
77237_ch13.indd 32077237_ch13.indd 320 8/11/10 8:22:25 AM8/11/10 8:22:25 AM

Hypertension
321
(e.g., furosemide) are generally too potent and their actions too short-lived for use as antihy-pertensive agents; however, they are useful in lowering blood pressure in patients with renal insuffi ciency, who often do not respond to other diuretics.
Thiazides, the most commonly used di-uretics in hypertension, may result in adverse metabolic side effects, including elevation of serum glucose, cholesterol, and triglyc-eride levels. In addition, hypokalemia, hy-peruricemia, and decreased sexual function are potential side effects. However, when diuretics are prescribed in low dosages, it is often possible to accrue the desired anti-hypertensive effect while minimizing ad-verse complications.
Sympatholytic agents include (1) -blockers, (2) central �-adrenergic agonists, and (3) systemic �-adrenergic-blocking drugs. �-Blockers are believed to lower blood pres-sure through several mechanisms, including (1) reducing CO through a decrease in HR and a mild decrease in contractility and (2) decreas-ing the secretion of renin (and therefore levels of angiotensin II), which leads to a decrease in TPR. -Blockers are less effective than diuretics in elderly and African-American hypertensive patients. Adverse effects of -blockers include bronchospasm (because of bronchiolar 2-receptor blockade), fatigue, impotence, and hy-perglycemia. They may also adversely alter lipid metabolism. Most -blockers cause an increase in serum triglyceride levels and a decrease in “good” HDL cholesterol levels. However, -blockers with intrinsic sympathomimetic ac-tivity (see Chapter 17) or those with combined �- and -blocking properties (such as labetalol) do not adversely affect HDL levels.
Centrally acting �2-adrenergic agonists, such as methyldopa and clonidine, reduce sym-pathetic outfl ow to the heart, blood vessels, and kidneys. These are now rarely used owing to their high frequency of side effects (e.g., dry mouth, sedation). Systemic �1-antagonists, such as prazosin, terazosin, and doxazosin, cause a decrease in TPR through relaxation of vascular smooth muscle. They may be useful for hypertension in some older men because the drugs also improve symptoms of prostatic enlargement. However, they are otherwise not
often recommended for treatment of hyperten-sion because a major clinical trial showed that an �1-antagonist was associated with a greater number of adverse cardiovascular events than a diuretic.
Peripheral vasodilators include calcium channel blockers, hydralazine, and minoxidil. Calcium channel blockers reduce the infl ux of Ca�� responsible for cardiac and vascular smooth muscle contraction, thus reducing car-diac contractility and TPR (see Chapter 17). Clinical trials in patients with hypertension have shown that calcium channel blockers reduce the risk of myocardial infarction and stroke. Thus, long-acting (i.e., sustained-release drugs taken once a day) members of this group are frequently used to treat hypertension. The shorter-acting calcium channel blocker prepara-tions are no longer used for this purpose; they are less convenient and have actually been as-sociated with adverse cardiovascular outcomes (see Chapter 6).
Hydralazine and minoxidil lower blood pressure by directly relaxing vascular smooth muscle of precapillary resistance vessels. How-ever, this action can result in a refl ex increase in HR, so that combined -blocker therapy is frequently necessary. The use of these di-rect vasodilators in treating hypertension has waned with the advent of newer agents with fewer side effects.
Drugs that interfere with the renin– angiotensin–aldosterone system include ACE inhibitors, angiotensin II receptor blockers, and direct renin inhibitors. ACE inhibitors decrease blood pressure by blocking the conversion of angiotensin I to angiotensin II (see Fig. 17.6), thereby reducing the vasopressor effect of angio-tensin II and the secretion of aldosterone. As a result, peripheral vascular resistance falls and sodium retention by the kidney declines. An ad-ditional antihypertensive effect of ACE inhibi-tors occurs via an increase in the concentration of the circulating vasodilator bradykinin (see Fig. 17.6). ACE inhibitors are important drugs that have been shown to reduce mortality rates in patients following an acute myocardial infarc-tion, in patients with chronic symptomatic sys-tolic heart failure (see Chapter 9), and even in people at high risk for developing cardiovascular disease. The drugs also slow the deterioration of
77237_ch13.indd 32177237_ch13.indd 321 8/11/10 8:22:25 AM8/11/10 8:22:25 AM
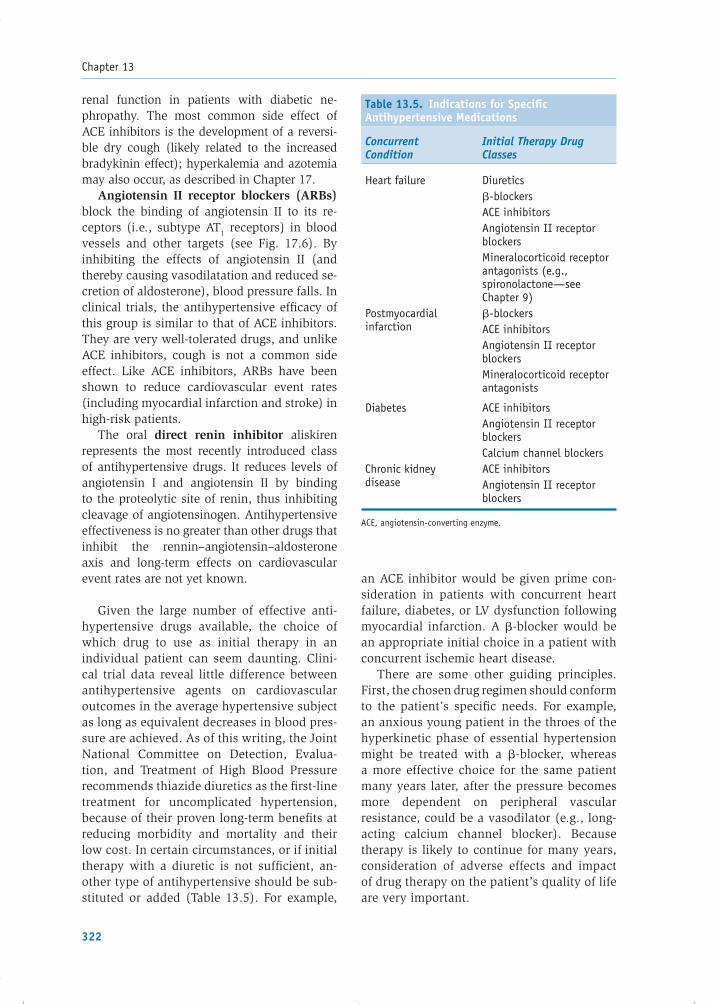
Chapter 13
322
renal function in patients with diabetic ne-phropathy. The most common side effect of ACE inhibitors is the development of a reversi-ble dry cough (likely related to the increased bradykinin effect); hyperkalemia and azotemia may also occur, as described in Chapter 17.
Angiotensin II receptor blockers (ARBs) block the binding of angiotensin II to its re-ceptors (i.e., subtype AT1 receptors) in blood vessels and other targets (see Fig. 17.6). By inhibiting the effects of angiotensin II (and thereby causing vasodilatation and reduced se-cretion of aldosterone), blood pressure falls. In clinical trials, the antihypertensive effi cacy of this group is similar to that of ACE inhibitors. They are very well-tolerated drugs, and unlike ACE inhibitors, cough is not a common side effect. Like ACE inhibitors, ARBs have been shown to reduce cardiovascular event rates (including myocardial infarction and stroke) in high-risk patients.
The oral direct renin inhibitor aliskiren represents the most recently introduced class of antihypertensive drugs. It reduces levels of angiotensin I and angiotensin II by binding to the proteolytic site of renin, thus inhibiting cleavage of angiotensinogen. Antihypertensive effectiveness is no greater than other drugs that inhibit the rennin–angiotensin–aldosterone axis and long-term effects on cardiovascular event rates are not yet known.
Given the large number of effective anti-hypertensive drugs available, the choice of which drug to use as initial therapy in an individual patient can seem daunting. Clini-cal trial data reveal little difference between antihypertensive agents on cardiovascular outcomes in the average hypertensive subject as long as equivalent decreases in blood pres-sure are achieved. As of this writing, the Joint National Committee on Detection, Evalua-tion, and Treatment of High Blood Pressure recommends thiazide diuretics as the fi rst-line treatment for uncomplicated hypertension, because of their proven long-term benefi ts at reducing morbidity and mortality and their low cost. In certain circumstances, or if initial therapy with a diuretic is not suffi cient, an-other type of antihypertensive should be sub-stituted or added (Table 13.5). For example,
an ACE inhibitor would be given prime con-sideration in patients with concurrent heart failure, diabetes, or LV dysfunction following myocardial infarction. A -blocker would be an appropriate initial choice in a patient with concurrent ischemic heart disease.
There are some other guiding principles. First, the chosen drug regimen should conform to the patient’s specifi c needs. For example, an anxious young patient in the throes of the hyperkinetic phase of essential hypertension might be treated with a -blocker, whereas a more effective choice for the same patient many years later, after the pressure becomes more dependent on peripheral vascular resistance, could be a vasodilator (e.g., long-acting calcium channel blocker). Because therapy is likely to continue for many years, consideration of adverse effects and impact of drug therapy on the patient’s quality of life are very important.
Table 13.5. Indications for Specifi c Antihypertensive Medications
Concurrent Condition
Initial Therapy Drug Classes
Heart failure Diuretics-blockersACE inhibitorsAngiotensin II receptor blockersMineralocorticoid receptor antagonists (e.g., spironolactone—see Chapter 9)
Postmyocardial infarction
-blockersACE inhibitorsAngiotensin II receptor blockersMineralocorticoid receptor antagonists
Diabetes ACE inhibitorsAngiotensin II receptor blockersCalcium channel blockers
Chronic kidney disease
ACE inhibitorsAngiotensin II receptor blockers
ACE, angiotensin-converting enzyme.
77237_ch13.indd 32277237_ch13.indd 322 8/11/10 8:22:25 AM8/11/10 8:22:25 AM

Hypertension
323
Another principle of antihypertensive drug therapy concerns the use of multiple agents. The effects of one drug, acting at one physio-logic control point, can be defeated by natural compensatory mechanisms. For example, the drop in renal perfusion by a direct vasodilator can activate the renin–angiotensin system, prompting the kidney to retain more volume, thereby blunting the antihypertensive benefi t. Combination drug therapy is aimed at prevent-ing such an action by using agents acting at different complementary sites. In this exam-ple, a direct vasodilator is often paired with a low-dose diuretic to avoid the undesired vol-ume expansion effect.
In conclusion, hypertension emerges as a tremendously important clinical problem because of its prevalence and potentially devastating consequences. The evaluation and treatment of a patient with hypertension require methodical consideration of the ways in which normal cardiovascular physiology may have gone awry. Because most patients still fall into the idiopathic category of essen-tial hypertension there is still much room for creative thought and research in this area.
SUMMARY
1. Hypertension is defi ned as a chronic dia-stolic blood pressure �90 mm Hg and/or systolic blood pressure �140 mm Hg.
2. Hypertension is of unknown etiology in the vast majority of patients (EH). Second-ary hypertension may arise from diverse causes, including (a) renal abnormali-ties (e.g., renal parenchymal disease and renal artery stenosis); (b) coarctation of the aorta; and (c) endocrine abnormalities (e.g., pheochromocytoma, primary or sec-ondary aldosteronism, Cushing syndrome, and thyroid abnormalities).
3. Most hypertensive patients remain asymp-tomatic until complications arise. Poten-tial complications include (a) stroke, (b) myocardial infarction, (c) heart failure, (d) aortic aneurysm and dissection, (e) renal damage, and (f) retinopathy.
4. Treatment of hypertension includes life-style and dietary improvements, and
pharmacologic therapy. The most com-monly used antihypertensive drugs include diuretics, ACE inhibitors, angiotensin re-ceptor blockers, long-acting calcium chan-nel blockers, and -blockers.
Acknowledgments
Contributors to the previous editions of this chapter were Payman Zamani, MD; Rajeev Malhotra, MD; Rahul Deshmukh, MD; Rajesh S. Magrulkar, MD; Allison McDonough, MD; Peter A. Nigrovic, MD; Thomas J. Moore, MD; Gordon H. Williams; and Leonard S. Lilly, MD.
Additional Reading
Chobanian AV. The hypertension paradox—more uncontrolled disease despite improved therapy. N Engl J Med. 2009;361:878–887.
Chobanian AV, Bakris GL, Black HR, et al. The sev-enth report of the Joint National Committee on Prevention, Detection, Evaluation, and Treatment of High Blood Pressure: the JNC 7 report. JAMA. 2003;289:2560–2571.
Cutler JA, Sorlie PD, Wolz M, et al. Trends in hypertension prevalence, awareness, treatment, and control rates in United States adults be-tween 1988–1994 and 1999–2004. Hypertension. 2008;52:818–827.
Dolan E, Stanton A, Thijs L, et al. Superiority of ambulatory over clinic blood pressure measure-ment in predicting mortality. Hypertension. 2005;46:156–161.
Ernst ME, Moser M. Use of diuretics in patients with hypertension. N Engl J Med. 2009;361:2153–2164.
Messerli FH, Williams B, Ritz E. Essential hyper-tension. Lancet. 2007;370:591–603.
Raman SV. The hypertensive heart: an integrated understanding informed by imaging. J Am Coll Cardiol. 2010;55:91–96.
Shih PA, O’Connor DT. Hereditary determinants of human hypertension: strategies in the setting of genetic complexity. Hypertension. 2008;51:1456–1464.
Wellcome Trust Case Control Consortium. Genome-wide association study of 14,000 cases of seven common diseases and 3,000 shared controls. Nature. 2007;447:661–678.
77237_ch13.indd 32377237_ch13.indd 323 8/11/10 8:22:25 AM8/11/10 8:22:25 AM

324
C H A P T E R
14Diseases of the PericardiumYin RenLeonard S. Lilly
ANATOMY AND FUNCTION ACUTE PERICARDITISEtiologyPathogenesisPathologyClinical FeaturesDiagnostic StudiesTreatmentPERICARDIAL EFFUSIONEtiologyPathophysiologyClinical FeaturesDiagnostic StudiesTreatment
CARDIAC TAMPONADEEtiologyPathophysiologyClinical FeaturesDiagnostic StudiesTreatmentCONSTRICTIVE PERICARDITISEtiology and PathogenesisPathologyPathophysiologyClinical FeaturesDiagnostic StudiesTreatment
thin fi lm of pericardial fl uid slightly separates the two layers and decreases the friction be-tween them.
The pericardium appears to serve three functions: (1) it fi xes the heart within the me-diastinum and limits its motion, (2) it prevents extreme dilatation of the heart during sudden rises of intracardiac volume, and (3) it may function as a barrier to limit the spread of infection from the adjacent lungs. However, patients with complete absence of the peri-cardium (either congenitally or after surgical removal) are generally asymptomatic, casting doubt on its actual importance in normal phys-iology. Yet like the unnecessary appendix, the pericardium can become diseased and cause great harm.
Diseases of the pericardium form a spec-trum that ranges from benign, self-limited
pericarditis to life-threatening cardiac tampon-ade. The clinical manifestations of these disor-ders and the approaches to their management can be predicted from an understanding of pericardial anatomy and pathophysiology, as presented in this chapter.
ANATOMY AND FUNCTION
The pericardium is a two-layered sac that encircles the heart. The inner serosal layer ( visceral pericardium) adheres to the outer wall of the heart and is refl ected back on itself, at the level of the great vessels, to line the tough fi brous outer layer (parietal pericardium). A
77237_ch14.indd 32477237_ch14.indd 324 8/11/10 8:22:57 AM8/11/10 8:22:57 AM

Diseases of the Pericardium
325
In the healthy heart, intrapericardial pres-sure varies during the respiratory cycle from �5 mm Hg (during inspiration) to �5 mm Hg (during expiration) and nearly equals the pressure within the pleural space. How-ever, pathologic changes in pericardial stiff-ness, or the accumulation of fl uid within the pericardial sac, may profoundly increase this pressure.
ACUTE PERICARDITIS
The most common affl iction of the pericardium is acute pericarditis, which refers to infl am-mation of its layers. Many disease states and etiologic agents can produce this syndrome (Table 14.1), the most frequent of which are described here.
Etiology
Infectious
Idiopathic and Viral Pericarditis
Acute pericarditis is most often of idiopathic origin, meaning that the actual cause is un-known. However, serologic studies have demonstrated that many such episodes are actually caused by viral infection, especially by echovirus or coxsackievirus group B. Al-though a viral origin could be confi rmed in infected patients by comparing antiviral titers of acute and convalescent serum, this is rarely done in the clinical setting because the pa-tient has usually recovered by the time those results would be available. Thus, idiopathic
and viral pericarditis are considered simi-lar clinical entities, and the terms are used interchangeably.
Other viruses known to cause pericarditis include those responsible for infl uenza, va-ricella, mumps, hepatitis B, and infectious mononucleosis. Pericarditis is the most com-mon manifestation of cardiovascular disease in patients with AIDS, arising from HIV infec-tion itself or from superimposed tuberculous or other bacterial infections in this immuno-compromised population.
Tuberculous Pericarditis
Although tuberculosis remains a worldwide problem, its incidence in the United States is low. It is, however, an important cause of pericarditis in immunosuppressed patients. Tuberculous pericarditis arises from reacti-vation of the organism in mediastinal lymph nodes, with spread into the pericardium. It can also extend directly from a site of tuber-culosis within the lungs, or the organism can arrive at the pericardium by hematogenous dissemination.
Nontuberculous Bacterial Pericarditis (Purulent Pericarditis)
Bacterial pericarditis is a fulminant illness but is rare in otherwise healthy persons; it is most likely to occur in immunocompromised patients, including those with severe burns and malignancies. Pneumococci and staphylo-cocci are responsible most frequently, whereas gram-negative infection occurs less often. Mechanisms by which bacterial invasion of the pericardium develops include (1) perforat-ing trauma to the chest (e.g., stab wound); (2) contamination during chest surgery; (3) exten-sion of an intracardiac infection (i.e., infective endocarditis); (4) extension of pneumonia or a subdiaphragmatic infection; and (5) hematog-enous spread from a remote infection.
Noninfectious
Pericarditis Following Myocardial Infarction
There are two forms of pericarditis associ-ated with acute myocardial infarction (MI).
Table 14.1. Most Common Causes of Acute Pericarditis
Infectious Viral Tuberculosis Pyogenic bacteria
Noninfectious Postmyocardial infarction Uremia Neoplastic disease Radiation-induced Connective tissue diseases Drug-induced
77237_ch14.indd 32577237_ch14.indd 325 8/11/10 8:22:57 AM8/11/10 8:22:57 AM

Chapter 14
326
The early type occurs within the first few days after an MI. It likely results from in-flammation extending from the epicardial surface of the injured myocardium to the adjacent pericardium; therefore, it is more common in patients with transmural (as opposed to subendocardial) infarctions. The prognosis following acute MI is not affected by the presence of pericarditis; its major importance is in distinguishing it from the pain of recurrent myocardial ischemia. This form of pericarditis occurs in fewer than 5% of patients with acute MI who are treated with acute reperfusion strategies (see Chapter 7) but it is more common in those who are not (and who, therefore, sustain larger infarctions).
The second form of post-MI pericarditis is known as Dressler syndrome, which can de-velop 2 weeks to several months following an acute infarction. Its cause is unknown, but it is thought to be of autoimmune origin, pos-sibly directed against antigens released from necrotic myocardial cells. A clinically simi-lar form of pericarditis may occur weeks to months following heart surgery (termed post-pericardiotomy pericarditis).
Uremic Pericarditis
Pericarditis is a serious complication of chronic renal failure, but its pathogenesis in this setting is unknown. Studies have shown no correlation between the plasma level of nitrogen waste products and the incidence of pericarditis, and it may even develop in pa-tients during the fi rst few months of dialysis therapy.
Neoplastic Pericarditis
Tumor involvement of the pericardium most commonly results from metastatic spread or local invasion by cancer of the lung, breast, or lymphoma. Primary tumors of the pericardium are rare. Neoplastic effusions are usually large and hemorrhagic and fre-quently lead to cardiac tamponade, a life-threatening complication described later in the chapter.
Radiation-Induced Pericarditis
Pericarditis may complicate radiation therapy to the thorax (e.g., administered for the treat-ment of certain tumors), especially if the cu-mulative dose has exceeded 4,000 centigray. Radiation-induced damage causes a local in-fl ammatory response that can result in peri-cardial effusions and ultimately fi brosis. Cytologic examination of the pericardial fl uid helps to distinguish radiation-induced peri-cardial damage from that of tumor invasion.
Pericarditis Associated with Connective Tissue Diseases
Pericardial involvement is common in many connective tissue diseases, including systemic lupus erythematosus (SLE), rheumatoid ar-thritis, and progressive systemic sclerosis. For example, 20% to 40% of patients with SLE ex-perience clinically detectable pericarditis during the course of the disease. Customary treatment of the underlying connective tissue disease usually ameliorates the pericarditis as well.
Drug-Induced Pericarditis
Several pharmaceutical agents have been re-ported to cause pericarditis as a side effect, often by inducing a systemic lupus-like syndrome(Table 14.2). These drugs include the antiarrhyth-mic procainamide and the vasodilator hydrala-zine. Drug-induced pericarditis usually abates when the causative agent is discontinued.
Table 14.2. Examples of Drug-Induced Pericarditis
Related to drug-induced SLE-like syndrome Procainamide Hydralazine Methyldopa Isoniazid Phenytoin
Not related to drug-induced SLE-like syndrome Anthracycline antineoplastic agents (doxorubi-
cin, daunorubicin) Minoxidil
SLE, systemic lupus erythematosus.
77237_ch14.indd 32677237_ch14.indd 326 8/11/10 8:22:57 AM8/11/10 8:22:57 AM

Diseases of the Pericardium
327
Pathogenesis
Similar to other infl ammatory processes, pericarditis is characterized by three stages: (1) local vasodilation with transudation of protein-poor, cell-free fl uid into the pericar-dial space; (2) increased vascular permeabil-ity, with leak of protein into the pericardial space; and (3) leukocyte exudation, initially by neutrophils, followed later by mononu-clear cells.
The leukocytes are of critical importance because they help contain or eliminate the offending infectious or autoimmune agent. However, metabolic products released by these cells may prolong infl ammation, cause pain and local cellular damage, and mediate somatic symptoms such as fever. Therefore, the immune response to pericardial injury may signifi cantly contribute to tissue damage and symptomatology.
Pathology
The pathologic appearance of the pericardium depends on the underlying cause and sever-ity of infl ammation. Serous pericarditis is characterized by scant polymorphonuclear leukocytes, lymphocytes, and histiocytes. The exudate is a thin fl uid secreted by the meso-thelial cells lining the serosal surface of the pericardium. This likely represents the early infl ammatory response common to all types of acute pericarditis.
Serofi brinous pericarditis is the most commonly observed morphologic pattern in patients with pericarditis. The pericardial ex-udate contains plasma proteins, including fi -brinogen, yielding a grossly rough and shaggy appearance (termed “bread and butter” peri-carditis). Portions of the visceral and parietal pericardium may become thickened and fused. Occasionally, this process leads to a dense scar that restricts movement and diastolic fi lling of the cardiac chambers, as described later in the chapter.
Suppurative (or purulent) pericarditis is an intense infl ammatory response associated most commonly with bacterial infection. The serosal surfaces are erythematous and coated
with purulent exudate. Hemorrhagic peri-carditis refers to a grossly bloody form of peri-cardial infl ammation and is most often caused by tuberculosis or malignancy.
Clinical Features
History
The most frequent symptoms of acute peri-carditis are chest pain and fever (Table 14.3). The pain may be severe and usually localizes to the retrosternal area and left precordium; it may also radiate to the back and ridge of the left trapezius muscle. What differentiates it from myocardial ischemia or infarction is that the pain of pericarditis is typically sharp, pleu-ritic (it is aggravated by inspiration and cough-ing), and positional (e.g., sitting and leaning forward often lessen the discomfort). Dyspnea is common during acute pericarditis but is not exertional and probably results from a reluc-tance of the patient to breathe deeply because of pleuritic pain.
Patients with idiopathic or viral peri-carditis are typically young and previously healthy. Pericarditis of other causes should be suspected in patients with the underlying conditions listed in Table 14.1 who develop the typical sharp, pleuritic chest pains and fever.
Physical Examination
A scratchy pericardial friction rub is com-mon in acute pericarditis and is believed to be produced by the movement of the infl amed pericardial layers against one another. Aus-cultation of the rub is best heard using the diaphragm of the stethoscope with the patient leaning forward while exhaling (which brings the pericardium closer to the chest wall and
Table 14.3. Clinical Features of Acute Pericarditis
Pleuritic chest painFeverPericardial friction rubECG abnormalities
ECG, electrocardiogram.
77237_ch14.indd 32777237_ch14.indd 327 8/11/10 8:22:57 AM8/11/10 8:22:57 AM

Chapter 14
328
stethoscope). In its full form, the rub consists of three components, corresponding to the phases of greatest cardiac movement: ventri-cular contraction, ventricular relaxation, and atrial contraction. Characteristically, the peri-cardial rub is evanescent, coming and going from one examination to the next.
Diagnostic Studies
The presence of pleuritic, positional chest pain and the characteristic pericardial friction rub implicate the presence of acute pericarditis. However, certain laboratory studies are help-ful to confi rm the diagnosis and to assess for impending complications.
The electrocardiogram (ECG) is abnormal in 90% of patients with acute pericarditis and helps to distinguish it from other forms of car-diac disease, such as an acute MI. The most important ECG pattern, which refl ects infl am-mation of the adjacent myocardium, consists of diffuse ST segment elevation in most of the ECG leads, usually with the exception of aVR and V1 (Fig. 14.1). In addition, PR segment de-pression in several leads is often evident, re-fl ecting abnormal atrial repolarization related to atrial epicardial infl ammation. These ab-normalities are in contrast to the ECG of acute ST-segment elevation MI, in which the ST seg-ments are elevated only in the leads overlying
the region of infarction, and PR depression is not expected.
Blood studies typically reveal signs of acute infl ammation, including an increased white blood cell count (usually a mild lympho cytosis in acute viral/idiopathic peri-carditis) and elevation of the erythrocyte sedimentation rate. Some patients with acute pericarditis also demonstrate elevated serum cardiac biomarkers (e.g., cardiac troponins), suggesting infl ammation of the neighboring myocardium.
Further testing in acute pericarditis often includes echocardiography to evaluate for the presence and hemodynamic signifi cance of a pericardial effusion. Additional studies that may be useful in individual cases to defi ne the cause of pericarditis include (1) purifi ed pro-tein derivative (PPD) skin test for tuberculosis, (2) serologic tests (antinuclear antibodies and rheumatoid factor) to screen for connective tissue diseases, and (3) a careful search for malignancy, especially of the lung and breast (physical examination supplemented by chest radiography and mammography). The yield of diagnostic pericardiocentesis (removal of peri-cardial fl uid through a needle) in uncompli-cated acute pericarditis is low and should be reserved for patients with very large effusions or evidence of cardiac chamber compression, as discussed later in the chapter.
Figure 14.1. Electrocardiogram in acute pericarditis. Diffuse ST segment elevation is present. Also notice depres-sion of the PR segment (arrow).
77237_ch14.indd 32877237_ch14.indd 328 8/11/10 8:22:57 AM8/11/10 8:22:57 AM

Diseases of the Pericardium
329
Treatment
Idiopathic or viral pericarditis is a self-limited disease that usually runs its course in 1 to 3 weeks. Management consists of rest, to reduce the interaction of the infl amed pericardial layers, and pain relief by analgesic and anti-infl ammatory drugs (aspirin, ibuprofen, and other nonsteroidal anti-infl ammatory agents). Colchicine, a drug with anti-infl ammatoryproperties usually used to treat gout, may be useful as an additional agent in acute peri-carditis. It has been shown to decrease the recurrence rate after an initial episode. Oral corticosteroids are effective for severe or re-current pericardial pain but should not be used in uncomplicated cases because of po-tentially signifi cant side effects and because even gradual withdrawal of this form of therapy often leads to recurrent symptoms of pericarditis.
The forms of pericarditis related to MI are treated in a similar fashion, with rest and aspirin. Other nonsteroidal anti-infl ammatory agents are often avoided immediately follow-ing an MI because of experimental evidence linking them to delayed healing of the infarct.
Purulent pericarditis requires more aggres-sive treatment, including catheter drainage of the pericardium and intensive antibiotic therapy. Nevertheless, even with such ther-apy, the mortality rate is very high. Tubercu-lous pericarditis requires prolonged multidrug antituberculous therapy. Pericarditis in the setting of uremia often resolves following in-tensive dialysis. Neoplastic pericardial disease usually indicates widely metastatic cancer, and therapy is unfortunately only palliative.
PERICARDIAL EFFUSION
Etiology
The normal pericardial space contains 15 to50 mL of pericardial fl uid, a plasma ultrafi ltrate secreted by the mesothelial cells that line the serosal layer. A larger volume of fl uid may ac-cumulate in association with any of the forms of acute pericarditis previously discussed.
In addition, noninfl ammatory serous effu-sions may result from conditions of (1) increased
capillary permeability (e.g., severe hypothyro-idism); (2) increased capillary hydrostatic pressure (e.g., congestive heart failure); or (3) decreased plasma oncotic pressure (e.g., cirrhosis or the nephrotic syndrome). Chylous effusions may occur in the presence of lymphatic obstruction of pericardial drainage, most commonly caused by neoplasms and tuberculosis.
Pathophysiology
Because the pericardium is a relatively stiff structure, the relationship between its internal volume and pressure is not linear, as shown in curve A in Figure 14.2. Notice that the ini-tial portion of the curve is nearly fl at, indicat-ing that at the low volumes normally present within the pericardium, a small increase in volume leads to only a small rise in pressure. However, when the intrapericardial volume expands beyond a critical level (see Fig. 14.2, arrow), a dramatic increase in pressure is in-cited by the nondistensible sac. At that point, even a minor increase in volume can translate into an enormous compressive force on the heart.
Three factors determine whether a peri-cardial effusion remains clinically silent or whether symptoms of cardiac compression ensue: (1) the volume of fl uid, (2) the rate at which the fl uid accumulates, and (3) the com-pliance characteristics of the pericardium.
A sudden increase of pericardial volume, as may occur in chest trauma with intrap-ericardial hemorrhage, results in marked elevation of pericardial pressure (see Fig. 14.2, steep portion of curve A) and the po-tential for severe cardiac chamber compres-sion. Even lesser amounts of fl uid may cause signifi cant elevation of pressure if the peri-cardium is pathologically noncompliant and stiff, as may occur in the presence of tumor or fi brosis of the sac. In contrast, if the peri-cardial effusion accumulates slowly, over weeks to months, the pericardium gradually stretches, such that the volume–pressure re-lationship curve shifts toward the right (see Fig. 14.2, curve B). With this adaptation, the pericardium can accommodate larger vol-umes without marked elevation of intraperi-cardial pressure.
77237_ch14.indd 32977237_ch14.indd 329 8/11/10 8:22:58 AM8/11/10 8:22:58 AM

Chapter 14
330
Clinical Features
A spectrum of possible symptoms is associated with pericardial effusions. For example, the pa-tient with a large effusion may be asymptom-atic, may complain of a dull constant ache in the left side of the chest, or may present with fi ndings of cardiac tamponade, as described later in the chapter. In addition, the effusion may cause symptoms resulting from compres-sion of adjacent structures, such as dysphagia (diffi cult swallowing because of esophageal compression), dyspnea (shortness of breath resulting from lung compression), hoarseness (due to recurrent laryngeal nerve compres-sion), or hiccups (resulting from phrenic nerve stimulation).
On examination (Table 14.4), a large peri-cardial fl uid “insulates” the heart from the
chest wall, and the heart sounds may be muffl ed. In fact, a friction rub that had been present during the acute phase of pericardi-tis may disappear if a large effusion develops and separates the infl amed layers from one another. Dullness to percussion of the left lung over the angle of the scapula may be present (known as the Ewart sign) owing to compressive atelectasis by the enlarged peri-cardial sac.
Diagnostic Studies
The chest radiograph may be normal if only a small pericardial effusion is present. How-ever, if more than approximately 250 mL has accumulated, the cardiac silhouette enlarges in a globular, symmetric fashion. In large ef-fusions, the ECG may demonstrate reduced voltage of the complexes. In the presence of very large effusions, the height of the QRS complex may vary from beat to beat (electri-cal alternans), a result of a constantly chang-ing electrical axis as the heart swings from side to side within the large pericardial vol-ume (Fig. 14.3).
Table 14.4. Clinical Features of Large Pericardial Effusion
Soft heart soundsReduced intensity of friction rubEwart sign (dullness over posterior left lung)
Figure 14.2. Schematic representation of the volume–pressure relation-ship of the normal pericardium. A. At the very lowest levels, a small rise in volume results in a small rise in pressure. However, when the limits of pericardial stretch are reached (arrow), the curve becomes very steep, and a further small rise in intrapericardial volume results in signifi cantly in-creased pressure. B. Chronic slow accumulation of volume allows the pericar-dium to gradually stretch over time; thus, the curve shifts to the right and much larger volumes are accommodated at lower pressures. (Modifi ed from Freeman GL, LeWinter MM. Pericardial adaptations during chronic dilation in dogs. Circ Res. 1984;54:294.)
77237_ch14.indd 33077237_ch14.indd 330 8/11/10 8:22:58 AM8/11/10 8:22:58 AM

Diseases of the Pericardium
331
Figure 14.3. Electrical alternans. Rhythm strip of lead V1 showing alternating height of the QRS complex from beat to beat, due to shifting of the cardiac axis as the heart swings within a large pericardial effusion.
One of the most useful laboratory tests in the evaluation of an effusion is echocardiogra-phy (Fig. 14.4), which can identify pericardial collections as small as 20 mL. This noninvasive technique can quantify the volume of pericar-dial fl uid, determine whether ventricular fi ll-ing is compromised, and when necessary, help direct the placement of a pericardiocentesis needle.
Treatment
If the cause of the effusion is known, therapy is directed toward the underlying disorder (e.g., intensive dialysis for uremic effusion). If the cause is not evident, the clinical state of the patient determines whether pericardiocen-tesis (removal of pericardial fl uid) should be undertaken. An asymptomatic effusion, even of large volume, can be observed for long peri-ods without specifi c intervention. However, if serial examination demonstrates a precipitous
rise in pericardial volume or if hemodynamic compression of the cardiac chambers becomes evident, then pericardiocentesis should be per-formed for therapeutic drainage and for analy-sis of the fl uid.
CARDIAC TAMPONADE
At the opposite end of the spectrum from the asymptomatic pericardial effusion is cardiac tamponade. In this condition, pericardial fl uid accumulates under high pressure, compresses the cardiac chambers, and severely limits fi ll-ing of the heart. As a result, ventricular stroke volume and cardiac output decline, potentially leading to hypotensive shock and death.
Etiology
Any etiology of acute pericarditis (seeTable 14.1) can progress to cardiac tampon-ade, but the most common causes are neoplas-tic, postviral, and uremic pericarditis. Acute hemorrhage into the pericardium is also an im-portant cause of tamponade, which can result (1) from blunt or penetrating chest trauma,(2) from rupture of the left ventricular (LV) free wall following MI (see Chapter 7), or(3) as a complication of a dissecting aortic an-eurysm (see Chapter 15).
Pathophysiology
As a result of the surrounding tense pericar-dial fl uid, the heart is compressed, and the di-astolic pressure within each chamber becomes elevated and equal to the pericardial pressure. The pathophysiologic consequences of this are illustrated in Figure 14.5. Because the compro-mised cardiac chambers cannot accommodate
Figure 14.4. Two-dimensional echocardiogram (paraster-nal short-axis view) of a pericardial effusion (PE) surrounding the heart. LV, left ventricle.
LVPE
77237_ch14.indd 33177237_ch14.indd 331 8/11/10 8:22:58 AM8/11/10 8:22:58 AM

Chapter 14
332
normal venous return, the systemic and pul-monary venous pressures rise. The increase of systemic venous pressure results in signs of right-sided heart failure (e.g., jugular venous distention), whereas elevated pulmonary ve-nous pressure leads to pulmonary congestion. In addition, reduced fi lling of the ventricles during diastole decreases the systolic stroke volume, and the cardiac output declines.
These derangements trigger compensatory mechanisms aimed at maintaining tissue per-fusion, initially through activation of the sym-pathetic nervous system (e.g., elevation of the heart rate). Nonetheless, failure to evacuate the effusion leads to inadequate perfusion of vital organs, shock, and ultimately death.
Clinical Features
Cardiac tamponade should be suspected in any patient with known pericarditis, pericardial effusion, or chest trauma who
develops signs and symptoms of systemic vas-cular congestion and decreased cardiac output(Table 14.5). The key physical fi ndings include (1) jugular venous distention; (2) systemic hy-potension; and (3) a “small, quiet heart” on physical examination, a result of the insulat-ing effects of the effusion. Other signs include sinus tachycardia and pulsus paradoxus (de-scribed later). Dyspnea and tachypnea refl ect pulmonary congestion and decreased oxygen delivery to peripheral tissues.
If tamponade develops suddenly, symptoms of profound hypotension are evident, including confusion and agitation. However, if the effusion
Figure 14.5. Pathophysiology of cardiac tamponade and constrictive pericarditis. The symptoms and signs (boxes) arise from impaired diastolic fi lling of the ventricles in both conditions.
Table 14.5. Clinical Features of Cardiac Tamponade
Jugular venous distentionHypotension with pulsus paradoxusQuiet precordium on palpationSinus tachycardia
Cardiac tamponade Constrictive pericarditis
Pulmonaryrales
Reflex tachycardia
Hypotension
Jugular venous distention
Hepatomegaly ascites
Peripheral edema
77237_ch14.indd 33277237_ch14.indd 332 8/11/10 8:22:59 AM8/11/10 8:22:59 AM

Diseases of the Pericardium
333
develops more slowly, over a period of weeks, then fatigue (caused by low cardiac output) and peripheral edema (owing to right-sided heart failure) may be the presenting complaints.
Pulsus paradoxus is an important physical sign in cardiac tamponade that can be recog-nized at the bedside using a standard blood pressure cuff. It refers to a decrease of systolic blood pressure (more than 10 mm Hg) during normal inspiration (see Box 14.1).
Pulsus paradoxus is not really “paradoxical”; it is just an exaggeration of appropriate cardiac physiology. Normally, expansion of the thorax during inspiration causes the intrathoracic pres-sure to become more negative compared with the expiratory phase. This facilitates systemic venous return to the chest and augments fi ll-ing of the right ventricle (RV). The transient increase in RV size shifts the interventricular septum toward the left, which diminishes left ventricular fi lling. As a result, in normal per-sons, LV stroke volume and systolic blood pres-sure decline slightly following inspiration.
In cardiac tamponade, this situation is exaggerated because both ventricles share a reduced, fi xed volume as a result of external compression by the tense pericardial fl uid. In this case, the inspiratory increase of right ventricular volume and bulging of the inter-ventricular septum toward the left have a pro-portionally greater effect on the limitation of
LV fi lling. Thus, in tamponade there is a more substantial reduction of LV stroke volume (and therefore systolic blood pressure) follow-ing inspiration.
Pulsus paradoxus may also be manifested by other conditions in which inspiration is exaggerated, including severe asthma and chronic obstructive airway disease.
Diagnostic Studies
Echocardiography is the most useful noninva-sive technique to evaluate whether pericardial effusion has led to cardiac tamponade physiol-ogy. An important indicator of high-pressure pericardial fl uid is compression of the RV and right atrium during diastole (see Fig. 3.12). In addition, echocardiography can differentiate between cardiac tamponade and other causes of low cardiac output, such as ventricular con-tractile dysfunction. The defi nitive diagnostic procedure for cardiac tamponade is cardiac catheterization with measurement of intra-cardiac and intrapericardial pressures, usually combined with therapeutic pericardiocentesis, as described in the next section.
Treatment
Removal of the high-pressure pericardial fl uid is the only intervention that reverses
Measurement of Pulsus Paradoxus at the BedsideBOX 14.1
Pulsus paradoxus is an exaggeration of the normal decline in systolic blood pressure that occurs with inspiration. It can be measured at the bedside using a manual sphygmomanometer. First, infl ate the sphygmomanometer to a level greater than the patient’s systolic pressure. As the cuff is slowly defl ated, carefully listen for the appearance of the fi rst Korotkoff sounds. This level marks the maximum systolic pressure and occurs during expiration. If the pressure is held at that level (i.e., if you stop defl ating the cuff) in a patient with pulsus paradoxus, the Korotkoff sounds will drift in and out, audible with expiration, and absent with inspiration. That is, the systolic pressure will fall during inspiration to a level below the cuff’s pressure and no sound will be heard during that time. Next, slowly defl ate the cuff and continue listening. When the cuff pressure falls to the level just below the patient’s systolic pressure during inspiration, the Korotkoff sounds stop drifting in and out (i.e., they are audible during both inspiration and expiration). Pulsus paradoxus is calculated as the difference between the initial systolic pressure (when the intermittent Korotkoff sounds are fi rst heard) and this pressure (when the sounds are fi rst audible throughout the respiratory cycle). In the presence of cardiac tamponade, this pressure difference is �10 mm Hg.
77237_ch14.indd 33377237_ch14.indd 333 8/11/10 8:22:59 AM8/11/10 8:22:59 AM

Chapter 14
334
the life-threatening physiology of this condi-tion. Pericardiocentesis is best performed in the cardiac catheterization laboratory, where the hemo -dynamic effect of fl uid removal can be assessed. The patient is positioned head up at a 45° angle to promote pooling of the effusion, and a needle is inserted into the pericardial space through the skin, usually just below the xiphoid process (which is the safest location to avoid piercing a coronary artery). A catheter is then threaded into the pericardial space and con-nected to a transducer for pressure measure-ment. Another catheter is threaded through a systemic vein into the right side of the heart, and simultaneous recordings of intracardiac and intrapericardial pressures are compared. In tamponade, the pericardial pressure is el-evated and is equal to the diastolic pressures within all of the cardiac chambers, refl ect-ing the compressive force of the surroundingeffusion.
In addition, the right atrial pressure tracing, which is equivalent to the jugular venous pul-sation observed on physical examination, dis-plays a characteristic abnormality (Fig. 14.6).During early diastole in a normal person, as the right ventricular pressure falls and the tri-cuspid valve opens, blood quickly fl ows from the right atrium into the RV, leading to a rapid decline in the right atrial pressure tracing(y descent). In tamponade, however, the peri-cardial fl uid compresses the right ventricle and prevents its rapid expansion. Thus, the right atrium cannot empty quickly, and the y de-scent is blunted.
Following successful pericardiocentesis, the pericardial pressure falls to normal and is no longer equal to the diastolic pressures within the heart chambers, which also de-cline to their normal levels. After initial as-piration of fl uid, the pericardial catheter may be left in place for 1 to 2 days to allow more complete drainage.
When pericardial fl uid is obtained for di-agnostic purposes, it should be stained and cultured for bacteria, fungi, and acid-fast ba-cilli (tuberculosis), and cytologic examination should be performed to evaluate for malig-nancy. Other common measurements of peri-cardial fl uid include cell counts (e.g., white cell count is elevated in bacterial infections
and other infl ammatory conditions) and pro-tein and lactate dehydrogenase (LDH) levels. If the concentration ratio of pericardial protein to serum protein is �0.5, or that of pericar-dial LDH to serum LDH is �0.6, then the fl uid is consistent with an exudate; otherwise, it is more likely a transudate. When tuberculosis is suspected, it is also useful to measure the level of adenosine deaminase in the pericar-dial fl uid. Studies have indicated that an el-evated level is highly sensitive and specifi c for tuberculosis.
If cardiac tamponade recurs following pericardiocentesis, the procedure can be re-peated. In some cases, a more defi nitive surgi-cal undertaking (removal of part or all of the
Figure 14.6. Schematic diagrams of right atrial (or jugu-lar venous) pressure recordings. A. Normal. The initial a wave represents atrial contraction. The v wave refl ects passive fi lling of the atrium during systole, when the tri-cuspid valve is closed. After the tricuspid valve opens, the right atrial pressure falls ( y descent) as blood empties into the right ventricle. B. Cardiac tamponade. High-pressure pericardial fl uid compresses the heart, impairing right ven-tricular fi lling, so that the y descent is blunted. C. Con-strictive pericarditis. The earliest phase of diastolic fi lling is not impaired so that the y descent is not blunted. The y descent appears accentuated because it descends from a higher than normal right atrial pressure. The right atrial c wave (described in Chapter 2) is not shown.
77237_ch14.indd 33477237_ch14.indd 334 8/11/10 8:22:59 AM8/11/10 8:22:59 AM

Diseases of the Pericardium
335
the right heart ceases. Thus, systemic venous pressure rises, and signs of right-sided heart failure ensue. In addition, the impaired fi ll-ing of the left ventricle causes a reduction in stroke volume and cardiac output, which leads to lower blood pressure.
Clinical Features
The symptoms and signs of constrictive peri-carditis usually develop over months to years. They result from (1) reduced cardiac output (fatigue, hypotension, and refl ex tachycardia) and (2) elevated systemic venous pressures (jugular venous distention, hepatomegaly with ascites, and peripheral edema). Because the most impressive physical fi ndings are often the insidious development of hepatomegaly and ascites, patients may be mistakenly sus-pected of having hepatic cirrhosis or an intra-abdominal tumor. However, careful inspection of the elevated jugular veins can point to the correct diagnosis of constrictive pericarditis.
On cardiac examination, an early diastolic “knock” may follow the second heart in pa-tients with severe calcifi c constriction. It rep-resents the sudden cessation of ventricular diastolic fi lling imposed by the rigid peri-cardial sac.
In contrast to cardiac tamponade, pericar-dial constriction results in pulsus paradoxus less frequently. Recall that in tamponade, this fi nding refl ects inspiratory augmentation of RV fi lling, at the expense of LV fi lling. How-ever, in constrictive pericarditis, the negative intrathoracic pressure generated by inspiration is not easily transmitted through the rigid peri-cardial shell to the right-sided heart chambers; therefore, inspiratory augmentation of RV fi ll-ing is more limited. Rather, when a patient with severe pericardial constriction inhales, the negative intrathoracic pressure draws blood toward the thorax, where it cannot be accommodated by the constricted right-sided cardiac chambers. As a result, the increased venous return accumulates in the intratho-racic systemic veins, causing the jugular veins to become more distended during inspiration (Kussmaul sign). This is the opposite of nor-mal physiology, in which inspiration results in a decline in jugular venous pressure, as
pericardium) is required to prevent reaccumu-lation of the effusion.
CONSTRICTIVE PERICARDITIS
The other major potential complication of pericardial diseases is constrictive pericarditis. This is a condition not frequently encountered but is important to understand, because it can masquerade as other more common disorders. In addition, it is an affl iction that may cause profound symptoms yet is often fully correct-able if recognized.
Etiology and Pathogenesis
In the early part of the 20th century, tubercu-losis was the major cause of constrictive peri-carditis, but that is much less common today in industrialized societies. The most frequent cause now is “idiopathic” (i.e., months to years following presumed idiopathic or viral acute pericarditis). However, any etiology of pericarditis can lead to this complication.
Pathology
Following an episode of acute pericarditis, any pericardial effusion that has accumulated usu-ally undergoes gradual resorption. However, in patients who later develop constrictive peri-carditis, the fl uid undergoes organization, with subsequent fusion of the pericardial layers, followed by fi brous scar formation. In some patients, calcifi cation of the adherent layers ensues, further stiffening the pericardium.
Pathophysiology
The pathophysiologic abnormalities in con-strictive pericarditis occur during diastole; systolic contraction of the ventricles is usually normal. In this condition, a rigid, scarred pericardium encircles the heart and inhibits normal fi lling of the cardiac cham-bers. For example, as blood passes from the right atrium into the right ventricle during diastole, the RV size expands and quickly reaches the limit imposed by the constrict-ing pericardium. At that point, further fi lling is suddenly arrested, and venous return to
77237_ch14.indd 33577237_ch14.indd 335 8/11/10 8:22:59 AM8/11/10 8:22:59 AM

Chapter 14
336
venous return is drawn into the heart. Thus, typical fi ndings in pericardial disease can be summarized as follows:
Diagnostic Studies
The chest radiograph in constrictive pericardi-tis shows a normal or mildly enlarged cardiac silhouette. Calcifi cation of the pericardium can be detected in some patients with severe chronic constriction. The ECG generally shows only nonspecifi c ST and T-wave abnormalities, although atrial arrhythmias are common.
Echocardiographic evidence of constriction is subtle. The pericardium, if well imaged, is thickened. The ventricular cavities are small and contract vigorously, but ventricular fi lling terminates abruptly in early diastole, as the chambers reach the limit imposed by the sur-rounding rigid shell. Aberrant diastolic motion of the interventricular septum and alterations of LV infl ow velocities by Doppler also refl ect the abnormal pattern of diastolic fi lling.
Computed tomography or magnetic reso-nance imaging is superior to echocardiogra-phy in the assessment of pericardial anatomy and thickness. The presence of normal peri-cardial thickness (�2 mm) by these modali-ties makes constrictive pericarditis a less likely diagnosis.
The diagnosis of constrictive pericarditis can be confi rmed by cardiac catheterization, which reveals four key features:
1. Elevation and equalization of the diastolic pressures in each of the cardiac chambers.
2. An early diastolic “dip and plateau” confi g-uration in the right and left ventricular trac-ings (Fig. 14.7). This pattern refl ects blood fl ow into the ventricles at the very onset of diastole, just after the tricuspid and mitral valves open, followed by sudden cessation of fi lling as further expansion of the ven-tricles is arrested by the surrounding rigid pericardium.
3. A prominent y descent in the right atrial pressure tracing (see Fig. 14.6). After the tricuspid valve opens, the right atrium quickly empties into the RV (and its pres-sure rapidly falls) during the very brief period before fi lling is arrested. This is in contrast to cardiac tamponade, in which the external compressive force throughout the cardiac cycle prevents rapid ventricular fi lling, even in early diastole, such that the y descent is blunted.
4. During the respiratory cycle, there is discor-dance in the RV and LV systolic pressures (the RV systolic pressure rises with inspira-tion, while that of the LV declines). This is explained as follows: in normal persons, the negative intrathoracic pressure induced by inspiration causes the systolic pres-sure of both ventricles to decline slightly. In contrast, in constrictive pericarditis, the heart is isolated from the rest of the tho-rax by the surrounding rigid shell. In this circumstance, negative intrathoracic pres-sure induced by inspiration decreases the pressure in the pulmonary veins but not in the left-sided cardiac chambers. This causes a decline in the pressure gradient
Constrictive Cardiac Pericarditis TamponadePulsus paradoxus � ���Kussmaul sign ��� �
Figure 14.7. Schematic tracings of left ventricular (LV) and right ventricular (RV) pressures in constrictive peri-carditis. Early diastolic ventricular fi lling abruptly halts as the volume in each ventricle quickly reaches the limit im-posed by the constricting pericardium. Throughout most of diastole, the LV and RV pressures are abnormally elevated and equal.
100
80
60
RV
Time
LV
ECG
Pre
ssur
e (m
m H
g)
40
20
Plateau
Early diastolicfilling wave
77237_ch14.indd 33677237_ch14.indd 336 8/11/10 8:22:59 AM8/11/10 8:22:59 AM

Diseases of the Pericardium
337
driving blood back to the left side of the heart from the pulmonary veins, such that left ventricle fi lling is diminished. Less ven-tricular fi lling reduces the stroke volume and results in a lower LV systolic pressure (and is the likely mechanism of pulsus para-doxus in some patients with constrictive pericarditis). Simultaneously, because the two ventricles share a fi xed space limited by the rigid pericardium, the reduced LV volume allows the interventricular septum to shift toward the left, which enlarges the RV (this reciprocal behavior is termed ven-tricular interdependence). The subsequent increase in RV fi lling augments systolic pressure during inspiration. During expira-tion, the situation is reversed, with the RV systolic pressure declining and that of the LV increasing.
The clinical and hemodynamic fi ndings of constrictive pericarditis are often similar to those of restrictive cardiomyopathy (see Chapter 10), another uncommon condition. Distinguishing between these two syndromes is important because pericardial constric-tion is often correctable, whereas most cases of restrictive cardiomyopathy have very lim-ited effective treatments (Table 14.6). An
endomyocardial biopsy is sometimes neces-sary to distinguish between these (the biopsy results are normal in constriction but usually abnormal in restrictive cardiomyopathy; see Chapter 10).
Treatment
The only effective treatment of severe con-strictive pericarditis is surgical removal of the pericardium. Symptoms and signs of constric-tion may not resolve immediately because of the associated stiffness of the neighboring outer walls of the heart, but subsequent clini-cal improvement is the rule in patients with otherwise intact cardiac function.
SUMMARY
1. Acute pericarditis is most often of idio-pathic or viral cause and is usually a self-limited illness. More serious forms of peri-carditis arise from the conditions listed in Table 14.1.
2. Common fi ndings in acute pericarditis in-clude (a) pleuritic chest pain; (b) fever; (c) pericardial friction rub; and (d) diffuse ST segment elevation on the ECG, often ac-companied by PR segment depression.
Table 14.6. Differences Between Constrictive Pericarditis and Restrictive Cardiomyopathy
Feature Constrictive Pericarditis Restrictive Cardiomyopathy
Chest radiography
• Pericardial calcifi cations Yes (25–30% of patients) Absent
CT or MRI
• Thickened pericardium Yes No
Echocardiography
• Thickened pericardium Yes (but diffi cult to visualize) No
• Respiratory cycle effect on transvalvular Doppler velocities
Exaggerated variations Normal
Cardiac catheterization
• Equalized LV and RV diastolic pressures Yes Often, LV � RV
• Elevated PA systolic pressure Uncommon Common
• Effect of inspiration on systolic pressures Discordant : LV↓, RV↑ Concordant: LV↓, RV↓
Endomyocardial biopsy Normal Abnormal (e.g., amyloid)
CT, computed tomography; LV, left ventricle; MRI, magnetic resonance imaging; PA, pulmonary artery; RV, right ventricle.
77237_ch14.indd 33777237_ch14.indd 337 8/11/10 8:22:59 AM8/11/10 8:22:59 AM

Chapter 14
338
3. Complications of pericarditis include cardiac tamponade (accumulation of pericardial fl uid under high pressure, which com-presses the cardiac chambers) and constric-tive pericarditis (restricted fi lling of the heart because of surrounding rigid pericardium).
Acknowledgments
Contributors to the previous editions of this chap-ter were Yanerys Ramos, MD; Angela Fowler, MD; Kathy Glatter, MD; Thomas G. Roberts, MD; Alan Braverman, MD; and Leonard S. Lilly, MD.
Additional Reading
ESC Committee for Practice Guidelines. Guidelines on the diagnosis and management of pericar-dial diseases, executive summary. Eur Heart J. 2004;25:587–610.
Dal-Bianco JP, Sengupta PP, Mookadam F, et al. Role of echocardiography in the diagnosis of constrictive pericarditis. J Am Soc Echocardiogr. 2009;22:24–33.
Imazio M, Bobbio M, Cecchi E, et al. Colchicine in ad-dition to conventional therapy for acute pericardi-tis: results of the COlchicine for acute Pericarditis (COPE) trial. Circulation. 2005;112:2012–2016.
Khandaker MH, Espinosa RE, Nishimura RA, et al. Pericardial disease: Diagnosis and management. Mayo Clin Proc. 2010;85:572–593.
Little WC, Freeman GL. Pericardial disease. Circula-tion. 2006;113:1622–1632.
Roy CL, Minor MA, Brookhart MA,et al. Does this patient with a pericardial effusion have cardiac tamponade? N Engl J Med. 2007;297:1810–1818.
Shabetai R. The Pericardium. Boston, MA: KluwerAcademic; 2003.
Spodick DH. Risk prediction in pericarditis: who to keep in hospital? Heart. 2008;94:398–399.
77237_ch14.indd 33877237_ch14.indd 338 8/11/10 8:22:59 AM8/11/10 8:22:59 AM

339
C H A P T E R
15Diseases of the Peripheral VasculatureFan LiangMark A. Creager
DISEASES OF THE AORTAAortic AneurysmsAortic Dissection
PERIPHERAL ARTERY DISEASESPeripheral Atherosclerotic Vascular DiseaseAcute Arterial OcclusionVasculitic Syndromes
VASOSPASM: RAYNAUD PHENOMENONVENOUS DISEASEVaricose VeinsVenous Thrombosis
Disease states of the peripheral vasculature interfere with these essential functions.
Peripheral vascular diseases result from pro-cesses that can be grouped into three catego-ries: (1) structural changes in the vessel wall secondary to degenerative conditions, infection, or infl ammation that lead to dilatation, aneu-rysm, dissection, or rupture; (2) narrowing of the vascular lumen caused by atherosclerosis, thrombosis, or infl ammation; and (3) spasm of vascular smooth muscle. These processes can occur in isolation or in combination.
DISEASES OF THE AORTA
The aorta is the largest conductance vessel of the vascular system. In adults, its diameter is approx-imately 3 cm at its origin at the base of the heart. The ascending aorta, 5 to 6 cm in length, leads to the aortic arch, from which arise three major branches: the brachiocephalic (which bifurcates
P eripheral vascular disease is an umbrella term that includes a number of diverse
pathologic entities that affect arteries, veins, and lymphatics. Although this terminology makes a distinction between the “central” coronary and “peripheral” systemic vessels, the vasculature as a whole comprises a dynamic, integrated, and multifunctional organ system that does not naturally comply with this se-mantic division.
Blood vessels serve many critical functions. First, they regulate the differential distribution of blood and delivery of nutrients and oxy-gen to tissues. Second, blood vessels actively synthesize and secrete vasoactive substances that regulate vascular tone, and antithrom-botic substances that maintain the fl uidity of blood and vessel patency (see Chapters 6and 7). Third, the vessels play an integral role in the transport and distribution of im-mune cells to traumatized or infected tissues.
77237_ch15.indd 33977237_ch15.indd 339 8/11/10 8:23:35 AM8/11/10 8:23:35 AM

Chapter 15
340
into the right common carotid and subclavian arteries), the left common carotid, and the left subclavian arteries. As the descending aorta continues beyond the arch, its diameter narrows to approximately 2 to 2.5 cm in healthy adults. As the aorta pierces the diaphragm, it becomes the abdominal aorta, providing arteries to the
abdominal viscera before bifurcating into the left and right common iliac arteries, which supply the pelvic organs and lower extremities.
The aorta, like other arteries, is composed of three layers (Fig. 15.1). At the luminal sur-face, the intima is composed of endothelial cells overlying the internal elastic lamina. The
A
B
C
IntimaMedia
Adventitia
IntimaMediaAdventitia
SaccularFusiform
Hole in intimaand media
Hematomacontained by adventitia or
perivascular clot
Aortic wall
lum
en
Falseaneurysm(pseudo-
aneurysm)
TrueAneurysms
Normal
Figure 15.1. Classifi cation of aortic aneurysms. A. The normal arterial wall consists of three layers: the intima, the media, and the adventitia. B. True aneurysms represent localized dilatation of all three layers of the arterial wall. Fusiform aneurysms involve the entire circumference of the aorta, whereas saccular aneurysms are a localized bulge of only a portion of the circumference.C. A false aneurysm (or pseudoaneurysm) is actually a hole in the intima and media, with hematoma contained by a thin layer of adventitia or perivascular clot.
77237_ch15.indd 34077237_ch15.indd 340 8/11/10 8:23:35 AM8/11/10 8:23:35 AM

Diseases of the Peripheral Vasculature
341
endothelial layer is a functional interface be-tween the vasculature and circulating blood cells and plasma. The media is composed of smooth muscle cells and a matrix that includes collagen and elastic fi bers. Collagen provides tensile strength that enables the vessels to withstand high-pressure loads. Elastin is capa-ble of stretching to 250% of its original length and confers a distensible quality on vessels that allows them to recoil under pressure. The adventitia is primarily composed of collagen fi bers, perivascular nerves, and vasa vasorum, a rich vascular network that supplies oxygen-ated blood to the aorta.
The aorta is subject to injury from mechani-cal trauma because it is continuously exposed to high pulsatile pressure and shear stress. The predominance of elastin in the media (2:1 over collagen) allows the aorta to expand during systole and recoil during diastole. The recoil of the aorta against the closed aortic valve con-tributes to the distal propagation of blood fl ow during the phase of left ventricular relaxation. With advancing age, the elastic component of the aorta and its branches degenerates, and as collagen becomes more prominent, the arter-ies stiffen. Systolic blood pressure, therefore, tends to rise with age because less energy is dissipated into the aorta during left ventricular contraction.
Diseases of the aorta most commonly ap-pear as one of three clinical conditions: aneu-rysm, dissection, or obstruction.
Aortic Aneurysms
An aneurysm is an abnormal localized dilata-tion of an artery. In the aorta, aneurysms are distinguished from diffuse ectasia, which is a generalized yet lesser increase of the aortic diameter. Ectasia develops in older patients as elastic fi ber fragments, smooth muscle cells decrease in number, and acid mucopolysac-charide ground substance accumulates within the vessel wall.
The term aneurysm is applied when the diameter of a portion of the aorta has in-creased by at least 50% compared with nor-mal. A true aneurysm represents a dilatation of all three layers of the aorta, creating a large bulge of the vessel wall. True aneurysms are
characterized as either fusiform or saccu-lar, depending on the extent of the vessel’s circumference within the aneurysm (see Fig. 15.1). A fusiform aneurysm, the more common type, is characterized by symmetri-cal dilation of the entire circumference of a segment of the aorta. A saccular aneurysm is a localized outpouching involving only a por-tion of the circumference.
In contrast, a pseudoaneurysm, or false aneurysm, is a contained rupture of the ves-sel wall that develops when blood leaks out of the vessel lumen through a hole in the intimal and medial layers and is contained by a layer of adventitia or perivascular organized throm-bus (see Fig. 15.1). Pseudoaneurysms develop at sites of vessel injury caused by infection or trauma, such as puncture of the vessel during surgery or percutaneous catheterization. They are very unstable and are prone to rupture completely.
Aneurysms may be confi ned to the abdomi-nal aorta (most common), the thoracic aorta, or involve both locations. They may also ap-pear in peripheral and cerebral arteries.
Etiology and Pathogenesis of True Aortic Aneurysms
The etiology of aortic aneurysm formation var-ies depending on the location of the lesion. As-cending thoracic aortic aneurysms typically are characterized by cystic medial degeneration (also termed cystic medial necrosis), a con-dition of degeneration and fragmentation of elastic fi bers, with subsequent accumulation of collagenous and mucoid material within the medial layer. Cystic medial necrosis occurs normally with aging, but is also associated with hypertension. Additionally, it develops in certain inherited disorders of connective tissue that affect the structural integrity of the aortic wall, including Marfan syndrome, Loeys–Dietz syndrome, and the vascular form of Ehlers–Danlos syndrome (type IV). Marfan syn-drome is caused by missense mutations of the fi brillin-1 gene (FBN1), which impair formation of functional microfi brils in elastin. Abnormal fi brillin-1 also limits the binding and inactiva-tion of transforming growth factor � (TGF-�), a signaling molecule that regulates cellular
77237_ch15.indd 34177237_ch15.indd 341 8/11/10 8:23:35 AM8/11/10 8:23:35 AM

Chapter 15
342
proliferation and differentiation. Loeys–Dietz syndrome is an autosomal dominant disorder caused by genetic mutations of TGF-� recep-tors. While thoracic aortic aneursyms have been associated with both increased activity of TGF-� and mutations of its receptors, the mechanism by which aberrant TGF-� signal-ing alters vascular integrity is not yet known. Ehlers–Danlos type IV syndrome results from mutations encoding type III procollagen. Cys-tic medial necrosis also characterizes familial thoracic aortic aneurysms and those associ-ated with bicuspid aortic valves.
Aneurysms of the descending thoracic and abdominal aorta are usually associated with atherosclerosis and its risk factors, including smoking, hypertension, dyslipidemia, male gender, and advanced age. However, it is un-likely that atherosclerosis alone is responsible for such aneurysm development. Rather, im-portant contributions appear to derive from genetic predisposition (on a polygenetic basis), local vessel infl ammation, and an imbalance between synthesis and degradation of extracel-lular matrix proteins. For example, the break-down of elastin and collagen is contributed to by specifi c proteases (e.g., elastase, collagenase) and matrix metalloproteinases derived from infl ammatory cells and vascular endothelial and smooth muscle cells. Aneurysm formation is also associated with markers of infl amma-tion, including C-reactive protein (CRP) and cytokines such as interleukin 6 (IL-6). Levels of both CRP and IL-6 have been shown to cor-relate with the size of aneurysms, and infl am-matory cells such as B and T lymphocytes and macrophages are frequently found on histo-logic examination. Angiotensin II, via its effect on infl ammation and oxidative stress, has also been implicated in experimental models of ab-dominal aortic aneurysms.
Infrequent causes of aortic aneurysms (Table 15.1) include weakness of the media from infections of the vessel wall by Salmo-nella species, staphylococci, streptococci, tu-berculosis, syphilis, or fungi. Infl ammatory diseases such as Takayasu arteritis or giant cell arteritis (both described later in the chapter) may similarly weaken the vessel and result in aneurysm formation.
Clinical Presentation and Diagnosis
Most aneurysms are asymptomatic, though some patients, especially those with abdomi-nal aortic aneurysms, may be aware of a pul-satile mass. Others present with symptoms related to compression of neighboring struc-tures by an expanding aneurysm. Thoracic aortic aneurysms may compress the trachea or mainstem bronchus, resulting in cough, dyspnea, or pneumonia. Compression of the esophagus can result in dysphagia, and in-volvement of the recurrent laryngeal nerve may lead to hoarseness. Aneurysms of the ascending aorta may dilate the aortic ring, re-sulting in aortic regurgitation and symptoms of congestive heart failure. Abdominal aortic aneurysms may cause abdominal or back pain or nonspecifi c gastrointestinal symptoms.
Aortic aneurysms are often fi rst suspected when dilatation of the vessel is observed on chest or abdominal radiographs, particularly if the wall is calcifi ed. Aneurysms of the abdominal aorta or of the large peripheral arteries may also be discovered by careful palpation during physical examination. The diagnosis is confi rmed by ultrasonography, contrast-enhanced computed tomography (CT), or magnetic resonance angiography (Fig. 15.2).
The most devastating consequence of an aortic aneurysm is rupture, which can be fatal. An aneurysm may leak slowly or burst suddenly, resulting in profound blood loss and hypotension. Thoracic aortic aneu-rysms may rupture into the pleural space,
Table 15.1. Conditions Associated with True Aortic Aneurysms
1. Cystic medial necrosis (usually affects ascending thoracic aorta)
• Marfan syndrome • Loeys–Dietz syndrome • Ehlers–Danlos syndrome (type IV) • Bicuspid aortic valve 2. Atherosclerosis/degenerative (usually affects
descending thoracic and abdominal aorta)3. Infections of arterial wall4. Vasculitis • Takayasu arteritis • Giant cell arteritis
77237_ch15.indd 34277237_ch15.indd 342 8/11/10 8:23:35 AM8/11/10 8:23:35 AM

Diseases of the Peripheral Vasculature
343
mediastinum, or bronchi. Abdominal aortic aneurysms may rupture into the retroperito-neal space or abdominal cavity or erode into the intestines, resulting in massive gastro-intestinal bleeding.
Natural history studies have shown that the risk of rupture is related to the size of the an-eurysm, as predicted by Laplace’s relationship (i.e., wall tension is proportional to the prod-uct of pressure and radius). The mean rates of thoracic and abdominal aortic aneurysms ex-pansion are 0.1 and 0.4 cm/year, respectively. Thoracic aneurysms rupture at an annual rate of 2% for aneurysms �5 cm in diameter, 3% for aneurysms 5 to 5.9 cm, and 7% for aneu-rysms �6 cm. Abdominal aneurysms �4 cm, 4 to 4.9 cm, and 5 to 5.9 cm have annual rates of rupture of 0.3%, 1.5%, and 6.5%, respec-tively. Abdominal aneurysms �6 cm have a markedly higher risk of rupture.
Treatment
Treatment of an aortic aneurysm is based on its size and the patient’s overall medical con-dition. Once an aneurysm is identifi ed, its di-mensions should be closely monitored through repeated imaging every 6 to 12 months. In general, surgical treatment is considered for
ascending aortic aneurysms �5.5 to 6.0 cm. Ascending aortic aneurysms in patients with Marfan syndrome (in whom the risk of com-plications is greater) should be considered for surgical repair if the diameter is �5 cm. Surgical repair is generally recommended for descending thoracic aortic aneurysms mea-suring 6.5 to 7.0 cm, for abdominal aortic aneurysms measuring 5.5 cm or more, and for smaller aneurysms that enlarge at a rate �1.0 cm�year.
The mortality associated with elective sur-gical repair of thoracic aortic aneurysms is 3% to 5%. Patients are maintained on cardiopul-monary bypass as the aneurysm is resected and replaced with a prosthetic Dacron graft. Patients with aneurysms involving multiple aortic segments have staged repairs, in which one segment is corrected at a time. Some pa-tients may be candidates for minimally inva-sive repair, in which a transluminally placed endovascular stent graft is positioned across the aneurysm.
Surgical repair of abdominal aortic aneu-rysms involves placement of a prosthetic graft. The operative mortality for such procedures at high-volume institutions is 1% to 2%. Per-cutaneous endovascular repair of infrarenal abdominal aortic aneurysms with stent grafts can be performed in selected patients with less acute morbidity, and results appear to be simi-lar to that of surgical repair.
Medical management, including risk-factor reduction (e.g., smoking cessation), is currently recommended for patients with small aneurysms. �-Blockers may reduce the expansion rate of thoracic aortic aneurysms in patients with Marfan syndrome; it is not clear whether they are effective for other causes or types of aneurysms. Angiotensin II receptor antagonists, which also inhibit TGF-�, are undergoing clinical trials in Marfan syndrome.
Aortic Dissection
Aortic dissection is a life-threatening condi-tion in which blood from the vessel lumen passes through a tear in the intima into the medial layer and spreads along the artery. Other related acute syndromes include aortic
Figure 15.2. Abdominal aortic aneurysm. Computed to-mographic angiogram (CTA) of an abdominal aortic aneu-rysm, indicated by the arrow. (Courtesy of Dr. Frank Rybicki, Brigham and Women’s Hospital, Boston, MA.)
77237_ch15.indd 34377237_ch15.indd 343 8/11/10 8:23:35 AM8/11/10 8:23:35 AM

Chapter 15
344
intramural hematoma, penetrating aortic ulcer, and aortic rupture. Acute intramural hematoma is a variant of aortic dissection characterized by a hemorrhage in the wall of the aorta with-out evidence of an intimal tear. A penetrating atherosclerotic ulcer results from erosion of a plaque into the aortic wall. Aortic rupture may be a complication of aortic dissection, intra-mural hematoma, penetrating atherosclerotic ulcer, or result from trauma.
Etiology, Pathogenesis, and Classifi cation
Aortic dissection is thought to arise from a cir-cumferential or transverse tear in the intimal layer of the vessel wall that allows blood from the lumen, under the driving force of the sys-temic pressure, to enter into the media and propagate along the plane of the muscle layer. Another postulated origin of aortic dissection relates to rupture of vasa vasorum with hemor-rhage into the media, forming a hematoma in the arterial wall that subsequently tears through the intima and into the vessel’s lumen.
Any condition that interferes with the nor-mal integrity of the elastic or muscular com-ponents of the medial layer can predispose to aortic dissection. Such degeneration may arise from chronic hypertension, aging, and�or cys-tic medial degeneration (which, as described earlier, is a feature of certain hereditary con-nective tissue disorders, such as Marfan syndrome and Ehlers–Danlos syndrome). In addition, traumatic insult to the aorta (e.g., blunt chest trauma or accidental vessel dam-age during intra-arterial catheterization or car-diac surgery) can also initiate dissection.
Aortic dissection is most common in the sixth and seventh decades and occurs more frequently in men. More than two thirds of patients have a history of hypertension. Dissection most com-monly involves the ascending thoracic aorta (65%) and descending thoracic aorta (20%), while the aortic arch (10%) and abdominal aortic (5%) segments are less commonly affected.
Dissections are commonly classifi ed into two categories (Stanford types A and B), depend-ing on their location and extent (Fig. 15.3). In a
Type AType B
Figure 15.3. Aortic dissection. Type A involves the ascending aorta, whereas type B does not. (Modifi ed with permission from Cotran RS, Kumar V, Robbins SL. Robbin’s Pathologic Basis of Disease. Philadelphia: WB Saunders; 1989.)
77237_ch15.indd 34477237_ch15.indd 344 8/11/10 8:23:37 AM8/11/10 8:23:37 AM
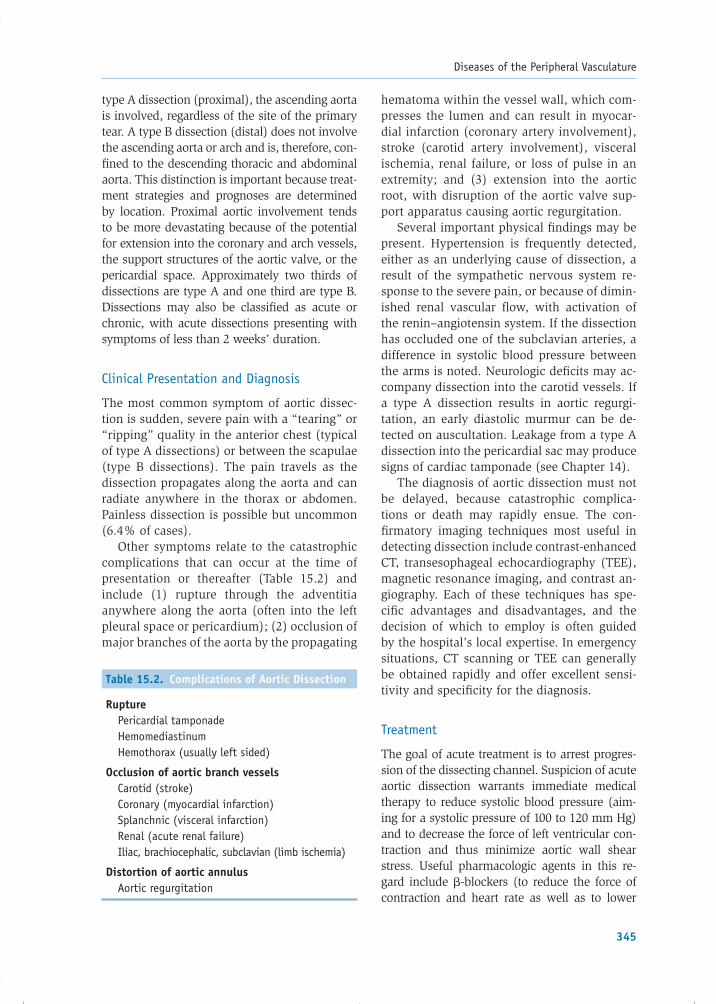
Diseases of the Peripheral Vasculature
345
Table 15.2. Complications of Aortic Dissection
Rupture Pericardial tamponade Hemomediastinum Hemothorax (usually left sided)
Occlusion of aortic branch vessels Carotid (stroke) Coronary (myocardial infarction) Splanchnic (visceral infarction) Renal (acute renal failure) Iliac, brachiocephalic, subclavian (limb ischemia)
Distortion of aortic annulus Aortic regurgitation
type A dissection (proximal), the ascending aorta is involved, regardless of the site of the primary tear. A type B dissection (distal) does not involve the ascending aorta or arch and is, therefore, con-fi ned to the descending thoracic and abdominal aorta. This distinction is important because treat-ment strategies and prognoses are determined by location. Proximal aortic involvement tends to be more devastating because of the potential for extension into the coronary and arch vessels, the support structures of the aortic valve, or the pericardial space. Approximately two thirds of dissections are type A and one third are type B. Dissections may also be classifi ed as acute or chronic, with acute dissections presenting with symptoms of less than 2 weeks’ duration.
Clinical Presentation and Diagnosis
The most common symptom of aortic dissec-tion is sudden, severe pain with a “tearing” or “ripping” quality in the anterior chest (typical of type A dissections) or between the scapulae (type B dissections). The pain travels as the dissection propagates along the aorta and can radiate anywhere in the thorax or abdomen. Painless dissection is possible but uncommon (6.4% of cases).
Other symptoms relate to the catastrophic complications that can occur at the time of presentation or thereafter (Table 15.2) and include (1) rupture through the adventitia anywhere along the aorta (often into the left pleural space or pericardium); (2) occlusion of major branches of the aorta by the propagating
hematoma within the vessel wall, which com-presses the lumen and can result in myocar-dial infarction (coronary artery involvement), stroke (carotid artery involvement), visceral ischemia, renal failure, or loss of pulse in an extremity; and (3) extension into the aortic root, with disruption of the aortic valve sup-port apparatus causing aortic regurgitation.
Several important physical fi ndings may be present. Hypertension is frequently detected, either as an underlying cause of dissection, a result of the sympathetic nervous system re-sponse to the severe pain, or because of dimin-ished renal vascular fl ow, with activation of the renin–angiotensin system. If the dissection has occluded one of the subclavian arteries, a difference in systolic blood pressure between the arms is noted. Neurologic defi cits may ac-company dissection into the carotid vessels. If a type A dissection results in aortic regurgi-tation, an early diastolic murmur can be de-tected on auscultation. Leakage from a type A dissection into the pericardial sac may produce signs of cardiac tamponade (see Chapter 14).
The diagnosis of aortic dissection must not be delayed, because catastrophic complica-tions or death may rapidly ensue. The con-fi rmatory imaging techniques most useful in detecting dissection include contrast-enhanced CT, transesophageal echocardiography (TEE), magnetic resonance imaging, and contrast an-giography. Each of these techniques has spe-cifi c advantages and disadvantages, and the decision of which to employ is often guided by the hospital’s local expertise. In emergency situations, CT scanning or TEE can generally be obtained rapidly and offer excellent sensi-tivity and specifi city for the diagnosis.
Treatment
The goal of acute treatment is to arrest progres-sion of the dissecting channel. Suspicion of acute aortic dissection warrants immediate medical therapy to reduce systolic blood pressure (aim-ing for a systolic pressure of 100 to 120 mm Hg)and to decrease the force of left ventricular con-traction and thus minimize aortic wall shear stress. Useful pharmacologic agents in this re-gard include �-blockers (to reduce the force of contraction and heart rate as well as to lower
77237_ch15.indd 34577237_ch15.indd 345 8/11/10 8:23:38 AM8/11/10 8:23:38 AM

Chapter 15
346
blood pressure) and vasodilators such as sodium nitroprusside (to rapidly reduce blood pressure). In proximal (type A) dissections, early surgical correction has been shown to improve outcomes compared with medical therapy alone. Surgical therapy involves repairing the intimal tear, sutur-ing the edges of the false channel, and if neces-sary, inserting a synthetic aortic graft.
In contrast, patients with uncomplicated type B dissections are initially managed with aggressive medical therapy alone; early surgi-cal intervention does not improve the outcome in these patients. Surgery is indicated, however, if there is clinical evidence of propagation of the dissection, compromise of major branches of the aorta, impending rupture, or continued pain. Percutaneous catheter-based repair with endo-vascular stent grafts has been used successfully in selected stable patients with type B dissec-tions. The graft seals the entry site of the dissec-tion, resulting in thrombosis of the false lumen.
PERIPHERAL ARTERY DISEASES
Peripheral artery disease (PAD) is defi ned by the presence of a fl ow-limiting lesion in an ar-tery that provides blood supply to the limbs. The major causes of such arterial stenosis or occlusion are atherosclerosis, thromboembo-lism, and vasculitis. The clinical presentation of these disorders results from decreased per-fusion to the affected extremity.
Peripheral AtheroscleroticVascular Disease
Etiology and Pathogenesis
The most common cause of PAD is atherosclero-sis. It is a prevalent vascular disorder, affecting approximately 4% of persons over the age of 40 and 15% to 20% of those over the age of 70. The pathology of atherosclerotic PAD is iden-tical to that of coronary artery disease (CAD), and the major coronary risk factors (e.g., ciga-rette smoking, diabetes mellitus, dyslipidemia, and hypertension) are also associated with PAD. Approximately 40% of patients with PAD actually have clinically signifi cant CAD. As a consequence of the systemic nature of athero-sclerosis, patients with PAD have a twofold to fi vefold increased risk of cardiovascular death
compared with patients who do not have this condition. Thus, detection of PAD is useful in identifying patients at increased risk of adverse cardiovascular events.
The pathophysiology of atherosclerotic PAD is also similar to that of CAD. Ischemia of the af-fected region occurs when the balance between oxygen supply and demand is upset; exercise raises the demand for blood fl ow in the limbs’ skeletal muscle, and a stenosed or obstructed artery cannot provide an adequate supply. Rest improves symptoms as the balance between oxygen supply and demand is restored.
Recall from Chapter 6 that the degree of blood fl ow reduction relates closely to the extent of vessel narrowing, the length of the stenosis, and blood viscosity. Poiseuille’s equa-tion describes this relationship:
Q � �P�r 4
______ 8L
in which Q � fl ow, �P � pressure drop across the stenosis, r � vessel radius, � � blood vis-cosity, and L � length of stenosis. Thus, the degree of vessel narrowing by the stenosis (i.e., the change in r) has the greatest impact on fl ow. For example, if the radius is reduced by one half, the fl ow will be reduced to 1�16th of its baseline. The equation also indicates that for stenoses of the same length and radius, higher fl ow rates correspond to greater pressure drops across the stenoses. That is, as the fl ow veloc-ity increases across a stenotic vessel, the blood turbulence results in a loss of kinetic energy. The result is a decline in perfusion pressure distal to the stenosis.
During exercise, products of skeletal mus-cle metabolism (e.g., adenosine) act locally to dilate arterioles. The resulting decrease in vascular resistance serves to increase blood fl ow to the active muscle (recall that fl ow � pressure resistance). In turn, the increased fl ow stimulates healthy arterial endothelium to release vasodilating factors such as nitric oxide, thereby increasing the radii of upstream conduit vessels. However, in PAD, obstructed arteries cannot respond to the vasodilating stimuli, thereby limiting fl ow increases. In addition, dysfunctional atherosclerotic en-dothelium does not release normal amounts of vasodilating substances (see Chapter 6). Thus,
77237_ch15.indd 34677237_ch15.indd 346 8/11/10 8:23:38 AM8/11/10 8:23:38 AM

Diseases of the Peripheral Vasculature
347
the physical properties of a stenosis and the reduced vasodilator activity imposed by dis-eased endothelium prevent adequate blood fl ow from reaching distal tissues and contrib-ute to ischemia.
Hemodynamic changes alone cannot ac-count for the dramatic reductions in exercise capacity experienced by PAD patients; changes in muscle structure and function are also seen. One such change is the denervation and drop-out of muscle fi bers, which is thought to occur as an adaptation to intermittent ischemia. The loss of such fi bers can explain the reduced muscle strength and atrophy that occur in PAD patients. Even viable muscle fi bers in affected limbs may show abnormalities of mitochon-drial oxidative metabolism.
In summary, atherosclerotic lesions produce stenoses in peripheral conduit vessels and limit blood fl ow to the affected extremity. Mecha-nisms normally in place to compensate for in-creased demand, such as endogenous release of vasodilators during exercise and recruitment
of microvessels, fail in the face of endothe-lial dysfunction and diminished fl ow veloc-ity. Thus, states of increased oxygen demand are not met with adequate supply, producing limb ischemia. Adaptations to ischemia in-clude changes in muscle fi ber metabolism and muscle fi ber dropout. Together, these physical and biochemical changes result in weak lower limbs that suffer ischemic discomfort during exercise. Severe peripheral atherosclerosis may reduce limb blood fl ow to such an extent that it cannot satisfy resting metabolic requirements. This results in critical limb ischemia, which may progress to tissue necrosis and gangrene that may threaten viability of the extremity.
Clinical Presentation and Diagnosis
PAD may affect the aorta or the iliac, femoral, popliteal, and tibioperoneal arteries (Fig. 15.4). Patients with PAD may therefore develop but-tock, thigh, or calf discomfort precipitated by walking and relieved by rest. This classic
Figure 15.4. An angiogram demonstrating atherosclerotic disease of the iliac vessels. Notice the severe stenosis of the left external iliac artery (arrow).
77237_ch15.indd 34777237_ch15.indd 347 8/11/10 8:23:38 AM8/11/10 8:23:38 AM

Chapter 15
348
symptom of exertional limb fatigue and pain is known as claudication. In severe PAD, pa-tients may experience pain at rest, usually affecting the feet or toes. The chronically re-duced blood fl ow in this case predisposes the extremity to ulceration, infection, and skin necrosis (Fig. 15.5). Patients who smoke or have diabetes mellitus are at high risk of these complications.
The location of claudication corresponds to the diseased artery, with the femoral and popliteal arteries being the most common sites (Table 15.3). The arteries of the upper extremi-ties are less frequently affected, but brachio-cephalic or subclavian artery disease can cause arm claudication.
Physical examination generally reveals loss of pulses distal to the stenotic segment. Bruits (swishing sounds auscultated over a region of turbulent blood fl ow) may be audible in the abdo-men (because of stenoses within the mesenteric or renal arteries) or over iliac, femoral, or subcla-vian arterial stenoses. In patients with chronic severe ischemia, the lack of blood perfusion results in muscle atrophy, pallor, cyanotic discol-oration, hair loss, and occasionally gangrene and necrosis of the foot and digits.
Ischemic ulcers resulting from PAD often begin as small traumatic wounds in areas of increased pressure or in regions prone to in-jury, such as the tips of toes and lateral malleo-lus (see Fig. 15.5A). These often painful ulcers fail to heal owing to the inadequate blood supply. Diabetic patients with peripheral sen-sory neuropathies are particularly susceptible to ulcers at sites of trauma or pressure from ill-fi tting footwear. Ischemic ulcers can be dis-tinguished from venous insuffi ciency ulcers, which develop more proximally and on the medial portion of the leg. Venous ulcers are also associated with reddish-brown pigmenta-tion and varicose veins (see Fig. 15.5B).
In the evaluation of PAD, it is helpful to measure the ratio of blood pressure in the ankles to that in the arms (termed the ankle-brachial index [ABI]) using a blood pressure cuff and a Doppler instrument to detect blood
Figure 15.5. Ulcerations caused by vascular insuffi ciency. A. Arterial insuffi ciency. Ulceration (arrow) affecting the great toe in a patient with severe peripheral artery disease. B. Venous insuffi ciency ulcer near the medial malleolus of the right leg. Notice the pigmentation of the surrounding skin.
Table 15.3. Relation of Stenotic Siteto Claudication Symptoms
SiteLocation of
Claudication Symptoms
Distal aorta or iliac arteries
Buttocks, hips, thighs, or calves
Femoral or popliteal arteries
Calves
Subclavian or axillary arteries
Arms
77237_ch15.indd 34877237_ch15.indd 348 8/11/10 8:23:38 AM8/11/10 8:23:38 AM

Diseases of the Peripheral Vasculature
349
fl ow. A normal ABI is �1.0 (i.e., the ankle pres-sure is equal to, or slightly greater than, that in the arms). An index �0.9 is diagnostic of PAD and may be associated with symptoms of claudication, whereas an index �0.5 is often observed in patients with rest pain and severe arterial compromise of the affected extrem-ity. Other testing to assess peripheral perfu-sion includes limb segmental systolic pressure measurements (using pneumatic cuffs placed along the extremity) and pulse volume record-ings (i.e., graphical measurement of volume changes in segments of the extremity with each pulse). Duplex ultrasonography is a com-monly used noninvasive method to visualize and assess the extent of arterial stenoses and the corresponding reductions in blood fl ow. Other more advanced imaging studies (e.g., magnetic resonance angiography, computed tomographic angiography, or intra-arterial con-trast angiography) are obtained when revascu-larization procedures are planned.
Treatment
For all patients with PAD, antiplatelet therapy and risk factor modifi cation (including smok-ing cessation, lipid lowering, and control of diabetes and hypertension) are important in reducing the likelihood of coronary events. Platelet inhibitors such as aspirin have been shown to reduce cardiovascular morbidity and mortality in patients with PAD. It has not been established if antiplatelet agents reduce symp-toms or prevent thrombotic complications of PAD itself.
Specifi c treatment of PAD includes sup-portive care of the feet to prevent trauma or restriction of blood fl ow. Exercise, particularly walking, improves endurance in part by in-creasing metabolic effi ciency in the skeletal muscle of the legs. A formal exercise program is considered fi rst-line therapy in the manage-ment of PAD.
Certain medical therapies are sometimes use-ful in the treatment of claudication. Cilostazol is a selective phosphodiesterase inhibitor that increases cyclic adenosine monophosphate and has vasodilator and platelet- inhibiting prop-erties; it has been shown to improve exercise capacity in patients with PAD. Pentoxifylline is
a drug purported to improve the deformability of red and white blood cells and may improve claudication symptoms in some patients. Con-versely, most vasodilator drugs (see Chapter 17) are not helpful in relieving claudication.
More effective medical therapies for PAD are on the horizon. Advances in angiogenesis research and ongoing clinical trials provide hope that pharmacologic revascularization with angiogenic growth factors, such as vascu-lar endothelial growth factor and basic fi bro-blast growth factor, may be possible.
Mechanical revascularization is indicated when medical therapy has failed for patients with disabling claudication and as fi rst-line therapy in cases of severe limb ischemia. In advanced cases, therapy is directed at healing ischemic ulcerations and preventing limb loss. Catheter-based interventions, such as percu-taneous transluminal angioplasty and stent implantation, can be performed on selected patients with low morbidity. Surgical proce-dures include bypass operations to circumvent the occluded arteries using saphenous vein or prosthetic grafts. However, amputation may be necessary if blood fl ow cannot be satisfactorily reestablished to maintain limb viability.
Acute Arterial Occlusion
Acute arterial occlusion is caused either by em-bolization from a cardiac or proximal vascular site or by thrombus formation in situ. The origin of arterial emboli is most often the heart, usually resulting from disorders involving intracardiac stasis of fl ow (Table 15.4). Emboli may also orig-inate from thrombus or atheromatous material overlying a segment of the aorta. Rarely, arterial emboli originate from the venous circulation. If a venous clot travels to the right-heart chambers and is able to pass through an abnormal intracar-diac communication (e.g., an atrial septal defect), it then enters the systemic arterial circulation (a condition known as a paradoxical embolism). Primary arterial thrombus formation may appear at sites of endothelial damage or atherosclerotic stenoses, or within bypass grafts.
The extent of tissue damage from thrombo-embolism depends on the site of the occluded artery, the duration of occlusion, and the de-gree of collateral circulation serving the tissue
77237_ch15.indd 34977237_ch15.indd 349 8/11/10 8:23:39 AM8/11/10 8:23:39 AM

Chapter 15
350
beyond the obstruction. Common symptoms and signs that may develop from reduced blood supply include pain, pallor, paralysis, paresthesia, and pulselessness (termed the “fi ve Ps”). A sixth P, poikilothermia (cool-ness), is also often manifest.
Patients with a proven acute arterial oc-clusion should be treated with anticoagulant agents such as heparin (followed by warfarin) to prevent propagation of the clot and to reduce the likelihood of additional embolic events. A revascularization procedure (catheter-based thrombolysis or thrombectomy, surgical em-bolectomy, or bypass surgery) is indicated if limb viability is at risk.
Atheroembolism is the condition of peri-pheral arterial occlusion by atheromatous ma-terial (i.e., cholesterol, platelets, and fi brin) derived from more proximal vascular sites, such as atherosclerotic lesions or aneurysms. The emboli lodge distally, resulting in occlusion of small arteries in the muscle and skin. Patients typically present with acute pain and tender-ness at the involved site. Occlusion of digital vessels may result in the “blue toe” syndrome, culminating in gangrene and necrosis. Other fi ndings may include livedo reticularis (pur-plish mottling of involved skin), kidney failure (caused by renal atheroembolism), and intes-tinal ischemia. Although an estimated 50% to 60% of cases are spontaneous, atheroembolism may occur after intra-arterial procedures (e.g.,
cardiac catheterization) when atherosclerotic material is unintentionally dislodged from the proximal vasculature. Ischemia resulting from atheroemboli is diffi cult to manage because the heterogeneous composition and distribu-tion of emboli often precludes surgical removal or thrombolytic therapy. Surgical intervention to remove or bypass the source of emboli may be necessary to prevent recurrences.
Vasculitic Syndromes
Vasculitis (vessel wall infl ammation) results from immune complex deposition or cell-mediated immune reactions directed against the vessel wall. Immune complexes activate the complement cascade with subsequent release of chemoattractants and anaphylatoxins that direct neutrophil migration to the vessel wall and in-crease vascular permeability. Neutrophils injure the vessel by releasing lysosomal contents and producing toxic oxygen-derived free radicals. In cell-mediated immune reactions, T lymphocytes bind to vascular antigens and release lympho-kines that attract additional lymphocytes and macrophages to the vessel wall. These infl am-matory processes can cause end-organ ischemia through vascular necrosis or local thrombosis.
The cause of most of the vasculitic syn-dromes is unknown, but they often can be dis-tinguished from one another by the pattern of involved vessels and by histologic characteris-tics (Table 15.5).
Takayasu arteritis is a chronic vasculitis of unknown etiology that targets the aorta and its major branches. The estimated annual incidence is 1.2 to 2.6 cases per million. Between 80% and 90% of affected persons are women, with onset typically between the ages of 10 and 40. Most reported cases have been from Asia and Africa, but it is a worldwide disease. Patients typically present with systemic complaints such as malaise and fever; focal symptoms are related to infl ammation of the affected vessel and in-clude cerebrovascular ischemia (brachiocepha-lic or carotid artery involvement), myocardial ischemia (coronary artery), arm claudication (brachiocephalic or subclavian artery), or hy-pertension (renal artery). The carotid and limb pulses are diminished or absent in nearly 85% of patients at the time of diagnosis; hence, this
Table 15.4. Origins of Arterial Emboli
Cardiac origin Stagnant left atrial fl ow (e.g., atrial fi brillation,
mitral stenosis) Left ventricular mural thrombus (e.g., dilated
cardiomyopathy, myocardial infarction, ven-tricular aneurysm)
Valvular lesions (endocarditis, thrombus on prosthetic valve)
Left atrial myxoma (mobile tumor in left atrium)
Aortic origin Thrombus material overlying atherosclerotic
segment
Venous origin Paradoxical embolism travels through intracar-
diac shunt
77237_ch15.indd 35077237_ch15.indd 350 8/11/10 8:23:39 AM8/11/10 8:23:39 AM

Diseases of the Peripheral Vasculature
351
condition is often termed “pulseless” disease. Takayasu arteritis is also an uncommon cause of aortic aneurysm or aortic dissection. Histologic examination of affected vessels reveals continu-ous or patchy granulomatous infl ammation with lymphocytes, histiocytes, and multinucleated giant cells, resulting in intimal proliferation, dis-ruption of the elastic lamina, and fi brosis. Anti-endothelial antibodies may also play a role in the disease. Steroid and cytotoxic drugs may reduce vascular infl ammation and alleviate symptoms of Takayasu arteritis. Surgical bypass of obstructed vessels may be helpful in severe cases. The 5-year survival rate is 80% to 90%.
Giant cell arteritis (also termed temporalarteritis) is a chronic vasculitis of medium-sized to large arteries that most commonly involves the cranial vessels or the aortic arch and its branches. It is an uncommon disease, with an in-cidence of 24 per 100,000, and the typical onset is after age 50; 65% of patients are female. Giant cell arteritis may be associated with the infl am-matory condition known as polymyalgia rheu-matica. Histologic fi ndings in affected vessels include lymphocyte and macrophage infi ltration, intimal fi brosis, and focal necrosis, with granulo-mas containing multinucleated giant cells.
Symptoms and signs of giant cell arteritis depend on the distribution of affected arteries and may include diminished temporal pulses, prominent headache (temporal artery involve-ment), or facial pain and claudication of the jaw while chewing (facial artery involvement). Ophthalmic artery arteritis leads to impaired vision, with permanent partial or complete loss in 15% to 20% of patients. In giant cell arteritis, the erythrocyte sedimentation rate and CRP are invariably elevated as markers
of infl ammation. Ultrasound examination can support the diagnosis by demonstrating a hy-poechoic halo around the involved arterial lumen with vessel stenosis and/or occlusion. The diagnosis can be confi rmed by biopsy of an involved vessel, usually a temporal artery, but treatment should not wait for biopsy re-sults. High-dose systemic steroids are effective in treating vasculitis and preventing visual complications. Giant cell arteritis usually has a self-limited course of 1 to 5 years.
Thromboangiitis obliterans (Buerger dis-ease) is a segmental infl ammatory disease of small and medium-sized arteries, veins, and nerves involving the distal vessels of the upper and lower extremities. It is most prevalent in the Far and Middle East and has a very strong association with cigarette smoking. It is most common in men younger than age 45; only 10% to 25% of patients are female. There is an increased incidence of human leukocyte antigen A9 (HLA-A9) and HLA-B5 in affected persons.
Thromboangiitis obliterans presents with a triad of symptoms and signs: distal arterial occlusion, Raynaud phenomenon (described in the next section), and migrating superfi cial vein thrombophlebitis. Arterial occlusion re-sults in arm and foot claudication as well as ischemia of the digits. Traditional laboratory markers of infl ammation and autoimmune disease are usually not detected. Arterio-graphic features of involved arteries include areas of stenosis interspersed with normal-appearing vessels with more severe disease distally, collateral vessels with a “corkscrew” appearance around the stenotic regions, and lack of atherosclerosis in proximal arteries. The diagnosis can be established by tissue
Table 15.5. Vasculitic Syndromes
Type Arteries Commonly Affected Histology
Takayasu arteritis Aorta and its branches Granulomatous arteritis with fi brosis; signifi cant luminal narrowing
Giant cell arteritis Medium to large size (especially cranial vessels, as well as aortic arch and its branches)
Lymphocyte infi ltration, intimal fi brosis, granuloma formation
Thromboangiitis obliterans(Buerger disease)
Small size (especially distal arteries of extremities)
Infl ammation and thrombosis withoutnecrosis
77237_ch15.indd 35177237_ch15.indd 351 8/11/10 8:23:39 AM8/11/10 8:23:39 AM

Chapter 15
352
biopsy, although this is rarely needed. Biopsy specimens of affected vessels reveal an occlu-sive, highly cellular, infl ammatory thrombus, with limited involvement of the vessel wall and preservation of the internal elastic lamina (Fig. 15.6). The most important treatment for thromboangiitis obliterans is smoking cessa-tion, which usually prevents progression of the disease and its complications. Debride-ment of necrotic tissue may be necessary in advanced cases. Revascularization is not usu-ally an option because of the distal location of the arterial lesions.
VASOSPASM: RAYNAUD PHENOMENON
Raynaud phenomenon is a vasospastic disease of the digital arteries that occurs in susceptible people when exposed to cool temperatures or sometimes during emotional stress. Vasospasm is an extreme vasoconstrictor response that temporarily obliterates the vascular lumen, in-hibiting blood fl ow. Typically, such episodes are characterized by a triphasic color response. First, the fi ngers and/or toes blanch to a distinct white as blood fl ow is interrupted (Fig. 15.7). The second phase is characterized by cyanosis, related to local accumulation of desaturated he-moglobin, followed by a third phase of ruddy color as blood fl ow resumes. The color response may be accompanied by numbness, paresthe-sias, or pain of the affected digits.
This condition may occur as an isolated dis-order, termed primary Raynaud phenomenon or Raynaud disease. Patients are predomi-
nantly women between the ages of 20 and 40.Primary Raynaud phenomenon most often manifests in the fi ngers, but 40% of patients also have involvement of the toes. The prog-nosis of primary Raynaud phenomenon is rela-tively benign, with only a minority reporting a worsening of symptoms over time.
Secondary Raynaud phenomenon may ap-pear as a component of other conditions. Com-mon causes include connective tissue diseases (e.g., scleroderma and systemic lupus ery-thematosus) and arterial occlusive disorders. Other causes of secondary Raynaud phenom-enon include carpal tunnel syndrome, thoracic outlet syndrome, blood dyscrasias, certain drugs, and thermal or vibration injury.
Even in healthy vessels, cold exposure nor-mally produces a vasoconstrictor response. Cooling stimulates the sympathetic nervous system, resulting in local discharge of norepi-nephrine, which binds to vascular adrenergic receptors. In the fi ngers and toes, only vaso-constricting �-receptors are present; other re-gional circulations have both constrictor and dilator adrenergic responses. Thus, a modest vasoconstriction of the digits results when healthy people are exposed to cooling. In con-trast, in Raynaud phenomenon, cold exposure induces severe vasoconstriction.
A variety of mechanisms have been pro-posed to explain the vasospastic response to cold and stress in patients with primary Raynaud phenomenon, including an exag-gerated sympathetic discharge in response to cold, heightened vascular sensitivity to adrenergic stimuli, or excessive release of vasoconstrictor stimuli, such as serotonin, thromboxane, and endothelin. In patients with secondary Raynaud phenomenon caused by connective tissue diseases or arterial oc-clusive disease, the digital vascular lumen is largely obliterated by sclerosis or infl amma-tion, resulting in lower intraluminal pressure and greater susceptibility to sympathetically mediated vasoconstriction.
Treatment of Raynaud phenomenon in-volves avoiding cold environments, dress-ing in warm clothes, and wearing insulated gloves or footwear. There has also been somesuccess in preventing vasospasm with phar-macologic agents that relax vascular tone,
Figure 15.6. Histologic section of an artery displaying thromboangiitis obliterans. Endothelial cell and fi broblast proliferation appears in the vessel wall, and thrombus is present in the vessel lumen (arrow).
77237_ch15.indd 35277237_ch15.indd 352 8/11/10 8:23:39 AM8/11/10 8:23:39 AM
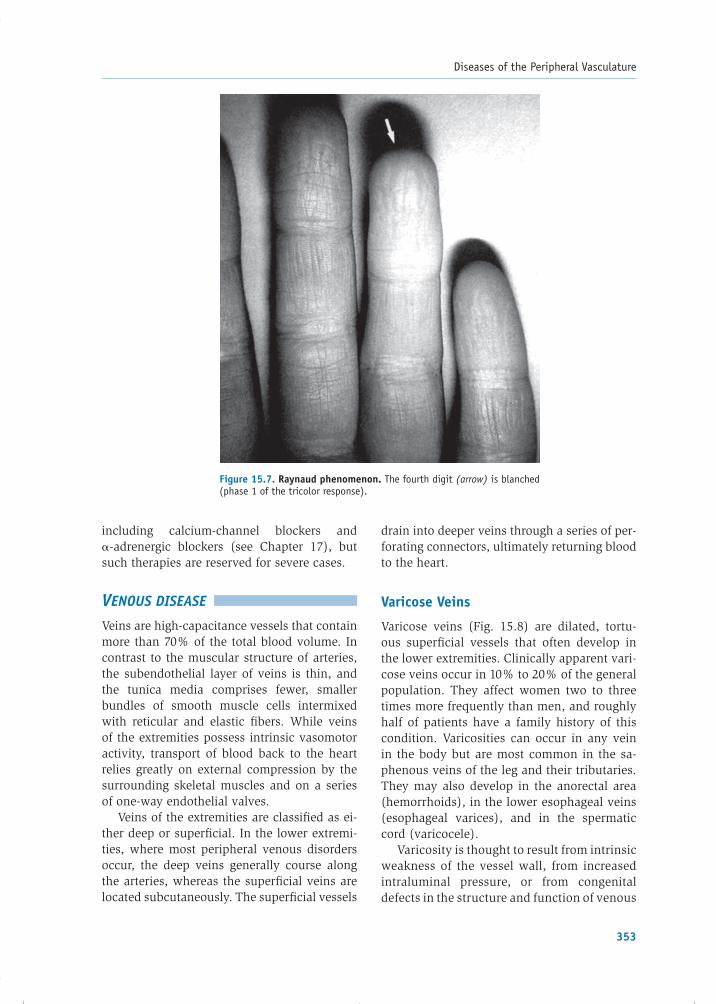
Diseases of the Peripheral Vasculature
353
including calcium-channel blockers and �-adrenergic blockers (see Chapter 17), but such therapies are reserved for severe cases.
VENOUS DISEASE
Veins are high-capacitance vessels that contain more than 70% of the total blood volume. In contrast to the muscular structure of arteries, the subendothelial layer of veins is thin, and the tunica media comprises fewer, smaller bundles of smooth muscle cells intermixed with reticular and elastic fi bers. While veins of the extremities possess intrinsic vasomotor activity, transport of blood back to the heart relies greatly on external compression by the surrounding skeletal muscles and on a series of one-way endothelial valves.
Veins of the extremities are classifi ed as ei-ther deep or superfi cial. In the lower extremi-ties, where most peripheral venous disorders occur, the deep veins generally course along the arteries, whereas the superfi cial veins are located subcutaneously. The superfi cial vessels
drain into deeper veins through a series of per-forating connectors, ultimately returning blood to the heart.
Varicose Veins
Varicose veins (Fig. 15.8) are dilated, tortu-ous superfi cial vessels that often develop in the lower extremities. Clinically apparent vari-cose veins occur in 10% to 20% of the general population. They affect women two to three times more frequently than men, and roughly half of patients have a family history of this condition. Varicosities can occur in any vein in the body but are most common in the sa-phenous veins of the leg and their tributaries. They may also develop in the anorectal area (hemorrhoids), in the lower esophageal veins (esophageal varices), and in the spermatic cord (varicocele).
Varicosity is thought to result from intrinsic weakness of the vessel wall, from increasedintraluminal pressure, or from congenitaldefects in the structure and function of venous
Figure 15.7. Raynaud phenomenon. The fourth digit (arrow) is blanched (phase 1 of the tricolor response).
77237_ch15.indd 35377237_ch15.indd 353 8/11/10 8:23:39 AM8/11/10 8:23:39 AM

Chapter 15
354
valves. Varicose veins in the lower extremities are classifi ed as either primary or secondary. Primary varicose veins originate in the super-fi cial system, and factors that lead to their development include pregnancy, prolonged standing, and obesity. During pregnancy or prolonged standing, the high venous pres-sure within the legs contributes to varicosi-ties when there is underlying weakness of the vessel walls. In obese patients, the adipose tissue surrounding vessel walls offers less structural support to veins than lean mass. Secondary varicose veins occur when an ab-normality in the deep venous system is the cause of superfi cial varicosities. These may develop in the setting of deep venous insuf-fi ciency or occlusion, or when the perforating veins are incompetent. In such cases, deep venous blood is shunted retrogradely through perforating channels into superfi cial veins, increasing intraluminal pressure and vol-ume and causing dilatation and varicosity formation.
Many people with varicose veins are asymptomatic but seek treatment for cosmetic reasons. When symptoms do develop, they in-clude a dull ache, “heaviness,” or a pressure sensation in the legs after prolonged standing. Superfi cial venous insuffi ciency may result when venous valves are unable to function normally in the dilated veins. This can cause swelling and skin ulceration that is particularly severe near the ankle. Stasis of blood within varicose veins can promote superfi cial vein thrombosis, and varicosities can also rupture, causing a localized hematoma.
Varicose veins are usually treated conserva-tively. Patients should elevate their legs while supine, avoid prolonged standing, and wear ex-ternal compression stockings that counterbal-ance the increased venous hydrostatic pressure. Small symptomatic varicosities are sometimes treated by injection of a sclerosing agent into the vein. Laser treatments can be used to improve the cosmetic appearance of small affected ves-sels. Endovenous laser therapy, radiofrequency
Figure 15.8. A patient with extensive venous varicosities of the right leg.
77237_ch15.indd 35477237_ch15.indd 354 8/11/10 8:23:40 AM8/11/10 8:23:40 AM

Diseases of the Peripheral Vasculature
355
ablation procedures, and surgical vein ligation and removal are used for patients who are very symptomatic, suffer recurrent superfi cial vein thrombosis, or develop skin ulcerations.
Venous Thrombosis
The term venous thrombosis or thrombophle-bitis is used to describe thrombus formation within a superfi cial or deep vein and the in-fl ammatory response in the vessel wall that it incites. Thrombi in the lower extremities are classifi ed by location as either deep venous thrombi or superfi cial venous thrombi.
Initially, the venous thrombus is composed principally of platelets and fi brin. Later, red blood cells become interspersed within the fi brin, and the thrombus tends to propagate in the direction of blood fl ow. The changes in the vessel wall can be minimal or can include granulocyte infi ltration, loss of endothelium, and edema. Thrombi may diminish or obstruct
vascular fl ow, or they may dislodge and form thromboemboli.
Deep Venous Thrombosis and Pulmonary Embolism
Epidemiology, Etiology, and Pathophysiology
Deep venous thrombosis (DVT) occurs most commonly in the veins of the calves but may also develop initially in more proximal veins such as the popliteal, femoral, and iliac vessels. If left untreated, 20% to 30% of DVTs that occur in the calves may propagate to these proximal veins. The two major consequences of DVT are pulmonary embolism (PE) (venous thrombo-embolism) and postphlebitic syndrome.
PE supervenes when a clot, most often from a DVT in the proximal veins of the lower ex-tremities, dislodges and travels through the inferior vena cava and right-heart chambers, fi nally reaching and obstructing a portion of the pulmonary vasculature (Fig. 15.9). PE is
Figure 15.9. Pulmonary angiogram displaying a massive pulmonary embolism. There is a large fi lling defect in the left main pulmonary artery (arrow), additional fi lling defects in the lower pulmonary artery branches, and a paucity of vessels in the left midlung region (a result of obstructed fl ow).
77237_ch15.indd 35577237_ch15.indd 355 8/11/10 8:23:40 AM8/11/10 8:23:40 AM

Chapter 15
356
common (incidence of approximately 600,000 per year in the United States) and is often fatal, with an untreated mortality rate of 30% to 40%. In patients with PE, gas exchange is often impaired because of the associated ana-tomic dead space and ventilation–perfusion mismatches that ensue in the lungs. As a re-sult, the alveolar–arterial oxygen gradient in-creases and hypoxemia may occur. Pulmonary vascular resistance may rise as a consequence of the mechanical obstruction, and because vasoactive and bronchoconstrictive media-tors released by platelets within emboli induce constriction of the pulmonary vasculature and bronchospasm, respectively. The increased pulmonary vascular resistance may lead to elevation of right ventricular (RV) wall stress, dilatation, and contractile failure, compromis-ing cardiac output.
Postphlebitic syndrome, or chronic deep venous insuffi ciency, results from venous val-vular damage and�or persistent occlusion by DVT. This may lead to chronic leg swelling, stasis pigmentation, and skin ulcerations.
In 1856, Virchow described a triad of factors that predispose to venous thrombosis: (1) sta-sis of blood fl ow, (2) hypercoagulability, and (3) vascular damage. Stasis disrupts laminar fl ow and brings platelets into contact with the endothelium. This allows coagulation factors to accumulate and retards the infl ux of clot-ting inhibitors. Factors that slow venous fl ow and induce stasis include immobilization (e.g., prolonged bed rest after surgery, or sitting in a car or an airplane for a long trip), cardiac failure, and hyperviscosity syndromes (Table 15.6).
Various clinical disorders cause systemic hypercoagulability, including resistance of coagulation factor V to activated protein C, a prothrombin gene mutation, and inherited defi ciencies of antithrombin, protein C, and protein S. Pancreatic, lung, stomach, breast, and genitourinary tract adenocarcinomas are associated with a high prevalence of venous thrombosis. This is thought to occur in part because necrotic tumor cells release thrombo-genic factors. Other conditions that contribute to hypercoagulability are listed in Table 15.6.
Vascular damage, either by external injury or by intravenous catheters, can denude the
endothelium and expose subendothelial colla-gen. Exposed collagen acts as a substrate for the binding of von Willebrand factor and plate-lets and initiates the clotting cascade, leading to clot formation. Less severe damage can cause endothelial dysfunction that contributes to thrombosis by disrupting the production of vasodilating and antiplatelet substances (e.g., nitric oxide and prostacyclin) and antithrom-botic molecules such as thrombomodulin and heparan sulfate.
The risk of venous thrombosis is particu-larly high after fractures of the spine, pelvis, and bones of the lower extremities. The risk following bone fracture may be related to sta-sis of blood fl ow, increased coagulability, and possibly traumatic endothelial damage. In ad-dition, venous thrombosis occurs frequently in patients following surgical procedures, partic-ularly major orthopedic operations.
Women have a several-fold increase in the incidence of venous thrombus formation dur-ing late pregnancy and the early postpartum
Table 15.6. Conditions that Predispose to DVT and Pulmonary Embolism
Stasis of blood fl ow Prolonged inactivity (following surgery, pro-
longed travel) Immobilized extremity (following bone fracture) Heart failure (with systemic venous congestion) Hyperviscosity syndromes (e.g., polycythemia
vera)
Hypercoagulable states Inherited disorders of coagulation Resistance to activated protein C (Factor V
Leiden) Prothrombin gene mutation (PT G20210A) Antithrombin defi ciency Defi ciency of protein C or protein S Antiphospholipid antibodies/lupus anticoagu-
lant Neoplastic disease (e.g., pancreatic, lung, stom-
ach, or breast cancers) Pregnancy and oral contraceptive use Myeloproliferative diseases Smoking
Vascular damage Instrumentation (e.g., intravenous catheters) Trauma
77237_ch15.indd 35677237_ch15.indd 356 8/11/10 8:23:41 AM8/11/10 8:23:41 AM

Diseases of the Peripheral Vasculature
357
period. In the third trimester, the fetuscompresses the inferior vena cava and can cause stasis of blood fl ow, and high levels of circulating estrogen may induce a hyperco-agulable state. Oral contraceptives and other pharmacologic estrogen products may also predispose to thrombus formation.
Clinical Presentation
Patients with DVT may be asymptomatic, or they may describe calf or thigh discomfort par-ticularly when standing or walking, or report unilateral leg swelling. The physical signs of proximal DVT include edema of the involved leg and occasionally localized warmth and erythema. Tenderness may be present over the course of the phlebitic vein, and a deep venous cord (induration along the thrombosed vessel) is occasionally palpable. Calf pain produced by dorsifl exion of the foot (Homans’ sign) is a nonspecifi c and unreliable sign of DVT.
Patients with PE may experience dyspnea, pleuritic chest pain (due to pleural irritation), hemoptysis, cough, or syncope (due to reduced cardiac output). Signs may include tachypnea, bronchospasm, and evidence of elevated pul-monary artery pressure, including an accentu-ated pulmonic component of the second heart sound and jugular venous distention.
Diagnosis
The primary laboratory tests for the diagno-sis of DVT include measurement of the serum D-dimer level and venous compression ultra-sonography. D-dimer, a byproduct of fi brin degradation that can be measured in a periph-eral blood sample, is highly sensitive for the diagnosis of DVT and/or acute PE. Because D-dimer may also be elevated in many other conditions (such as cancer, infl ammation, in-fection, and necrosis), a positive test result is not specifi c for DVT. Thus, a normal D-dimer value can help exclude the presence of DVT, but an elevated level does not confi rm the di-agnosis.
Venous compression duplex ultrasonogra-phy is a readily available noninvasive tech-nique that is 95% sensitive for the diagnosis of symptomatic DVT in a proximal vein but only
75% sensitive for diagnosing symptomatic calf vein thrombi. This technique uses real-time ultrasound scanning to image the vein and pulsed Doppler ultrasound to assess blood fl ow within it (Fig. 15.10). Criteria used for di-agnosis of DVT with duplex ultrasonography include the inability to compress the vein with direct pressure (suggesting the presence of an intraluminal thrombus), direct visualization of the thrombus, and absence of blood fl ow within the vessel.
Other diagnostic techniques are sometimes used. For example, magnetic resonance venog-raphy can aid in the diagnosis of proximal DVT, particularly pelvic vein thrombi, which are diffi cult to detect by ultrasound. Contrast venography is an invasive imaging technique that can provide a defi nitive diagnosis. Radio-contrast material is administered into a foot vein, and images are obtained as the contrast ascends through the venous system of the leg. DVT is diagnosed by the presence of a fi lling defect (see Fig. 15.10).
Additional tests are useful in the evalua-tion of suspected PE. The most common elec-trocardiographic abnormality in patients with PE is sinus tachycardia; there may be evidence of RV strain (e.g., inverted T waves in leads V1–V4, or an “S1–Q3–T3” pattern: a prominent S wave in lead I, Q wave in lead III, inverted T wave in lead III). RV strain may also cause elevated serum levels of cardiac-specifi c tro-ponins or B-type natriuretic peptide (described in Chapters 7 and 9, respectively). Arterial blood gas analysis may show decreased arte-rial oxygenation, but is insensitive to the di-agnosis of PE. The preferred test to confi rm the diagnosis is computed tomographic angiog-raphy (CTA; see Fig. 3.20). For patients who cannot tolerate CTA, such as those with renal insuffi ciency or hypersensitivity to radioiodi-nated contrast agents, radionuclide ventilation-perfusion (V/Q) lung scanning is often ob-tained instead. Catheter-based pulmonary an-giography is performed in selective cases to confi rm the diagnosis.
Treatment
In patients with DVT, elevation of the affected ex-tremity above the level of the heart helps reduce
77237_ch15.indd 35777237_ch15.indd 357 8/11/10 8:23:41 AM8/11/10 8:23:41 AM

Chapter 15
358
edema and tenderness, and anticoagulationprevents extension of the thrombus and PE. In patients with established PE, urgent anticoagu-lation is instituted to prevent recurrent embo-lism. Initial anticoagulation usually consists of subcutaneous low molecular weight heparin (LMWH). Intravenous unfractionated heparin is a cost-effective alternative that has been used successfully for this purpose for many years, although some studies have shown superior outcomes with LMWH, which is also more convenient to administer (see Chapter 17). Warfarin, an oral anticoagulant, is prescribed for long-term management and is usually con-tinued for 6 months or more, depending on the underlying cause of DVT. Catheter-based thrombolysis may be useful for selected pa-tients with iliofemoral deep vein thrombosis.
In patients with proximal DVT or established PE who cannot be treated with anticoagulants (e.g., because of a bleeding disorder), an intra-vascular fi lter can be percutaneously inserted into the inferior vena cava to prevent emboli from reaching the lungs. Occasionally, systemic thrombolytic therapy or surgical pulmonary embolectomy is undertaken for patients with massive PE.
Treatment of patients with calf vein thrombo-sis (i.e., thrombus confi ned to below the knee) is more controversial because pulmonary emboli from that site are uncommon. Some physicians advocate serial noninvasive monitoring to de-termine if the thrombus propagates into proxi-mal veins, whereas others treat such thrombosis with heparin (unfractionated or low molecular weight) followed by warfarin for 3 to 6 months.
Figure 15.10. Diagnostic imaging of deep venous thrombosis. A. Normal venogram. Contrast material was injected into a foot vein and fi lls the leg veins in this radiograph. B. Venogram demonstrating extensive thrombosis of the deep calf veins, popliteal vein, and femoral vein. Arrow indicates a fi lling defect in the femoral vein due to the presence of thrombus. The deep calf veins are fi lled with thrombus and cannot be visualized. C. Ultrasound indicating deep venous thrombosis. The thrombus appears as an echogenic area (arrow) within the femoral vein (V). A healthy vein would be easily compressible by the ultrasound transducer. This vein, however, has the same diameter at baseline (top panel) and after compression (bottom panel), confi rming the presence of thrombus within it. Art, artery.
77237_ch15.indd 35877237_ch15.indd 358 8/11/10 8:23:41 AM8/11/10 8:23:41 AM
Diseases of the Peripheral Vasculature
359
Prophylaxis against DVT is mandatory in clinical situations in which the risk of develop-ing the condition is high, such as during bed rest following surgery. Prophylactic measures include subcutaneous unfractionated heparin or LMWH, fondaparinux (see Chapter 17), low-dose oral warfarin, compression stockings, and/or intermittent external pneumatic com-pression of the legs to prevent venous stasis.
Superfi cial Thrombophlebitis
Superfi cial thrombophlebitis is a benign disor-der associated with infl ammation and throm-bosis of a superfi cial vein, just below the skin. It may occur, for example, as a complication of an in-dwelling intravenous catheter. It is char-acterized by erythema, tenderness, and edema over the involved vein. Treatment consists of local heat and rest of the involved extremity. Aspirin or other anti-infl ammatory medica-tions may relieve the associated discomfort. Unlike DVT, superfi cial thrombophlebitis does not lead to PE.
SUMMARY
1. Aortic aneurysms are of two types: true aneurysms and false (pseudo) aneurysms. True aneurysms are caused by degenerative changes in the aortic wall. Cystic medial necrosis is associated with ascending tho-racic aortic aneurysms, and atherosclerosis is commonly found in descending thoracic and abdominal aortic aneurysms. A false aneurysm represents a hole in the arterial intima and media contained by a layer of adventitia or perivascular clot.
2. Symptoms of aortic aneurysms relate to compression of adjacent structures (back pain, dysphagia, respiratory symptoms) or blood leakage. The most severe conse-quence is aneurysm rupture. An aneurysm can be repaired either with an open surgical procedure or by insertion of an endovascu-lar graft.
3. An aortic dissection results from a tear in the intima that allows blood to enter into the medial layer, often in the setting of ad-vanced age, hypertension, or other causes of medial degeneration (cystic medial
necrosis). Type A (proximal) aortic dissec-tions involve the ascending aorta, whereas type B dissections are confi ned to the de-scending aorta. The former are more com-mon, more devastating, and require surgical treatment. Type B dissections are often man-aged by medical therapy alone.
4. PAD is a common atherosclerotic disease of large and medium-sized arteries, often resulting in claudication of the limbs. It is treated by risk factor modifi cation, ex-ercise, antiplatelet agents, and sometimes cilostazol, a selective phosphodiesterase inhibitor. Catheter-based or surgical revas-cularization procedures are implemented in patients with disabling symptoms or critical limb ischemia.
5. Acute arterial occlusion results from throm-bus formation in situ or from arterial embo-lism. The latter arises from thrombus within the heart, from proximal arterial sites, or paradoxically from the systemic veins in the presence of an intracardiac shunt (e.g., atrial septal defect). Therapeutic options include anticoagulation, thrombolysis, and surgical or endovascular interventions.
6. Vasculitic syndromes are infl ammatory dis-eases of blood vessels that impair arterial fl ow and result in localized and systemic symptoms. They are distinguished from one another by the pattern of vessel in-volvement and morphologic fi ndings (see Table 15.5).
7. Raynaud phenomenon is an episodic vasos-pasm of arteries that supply the digits of the upper and lower extremities. It may be a primary condition (Raynaud disease) or may appear in association with other disor-ders such as connective tissue diseases or blood dyscrasias.
8. Varicose veins are dilated tortuous vessels that may present cosmetic problems. Oc-casionally, they cause discomfort, become thrombosed, or lead to venous insuffi -ciency. Initial management is conservative, with periodic leg elevation and compression stockings. Severe symptomatic varicose veins can be treated with radiofrequency ablation, laser therapy, or surgical ligation and removal.
77237_ch15.indd 35977237_ch15.indd 359 8/11/10 8:23:41 AM8/11/10 8:23:41 AM

Chapter 15
360
9. Venous thrombosis results from stasis of blood fl ow, hypercoagulability, and vas-cular damage. The major complication of DVT is PE. A chronic complication is venous insuffi ciency causing chronic leg swelling and skin ulceration.
10. D-dimer assay and venous compression ultrasonography are the primary tools used to diagnose DVT. Anticoagulation therapy with LMWH or unfractionated intravenous heparin (UFH), followed by oral warfarin, is the usual treatment.
11. PE can be confi rmed by CT angiography or ventilation–perfusion scintigraphy. Antico-agulant therapy (LMWH or UFH) comprises standard therapy. If anticoagulants are con-traindicated, an inferior vena cava fi lter can be inserted to prevent recurrent PE.
Acknowledgments
Contributors to the previous editions of this chapter were Arash Mostaghimi, MD; Mary Beth Gordon, MD; Geoffrey McDonough, MD; Michael Diminick, MD; Stuart Kaplan, MD; Jesse Salmeron, MD; and Mark A. Creager, MD.
Additional Reading
Creager MA, Dzau VJ, Loscalzo J, eds. Vascular Med-icine: A Companion to Braunwald’s Heart Disease. Philadelphia, PA: Elsevier Saunders; 2006.
Creager MA, Loscalzo J. Vascular diseases of the extremities. In: Longo DL, Fauci AS, Kasper D, et al., eds. Harrison’s Principles of Internal Medi-cine. 18th ed. New York: McGraw-Hill; In press.
Creager MA, Loscalzo J. Diseases of the aorta. In: Longo DL, Fauci AS, Kasper D, et al., eds. Harrison’s Principles of Internal Medicine. 18th ed. New York: McGraw-Hill. In press.
Elefteriades JA, Farkas EA. Thoracic aortic aneu-rysm. J Am Coll Cardiol. 2010;55:841–857.
Golledge J, Eagle KA. Acute aortic dissection. Lancet. 2008;372:55–66.
Gornik HL, Creager MA, Diseases of the aorta. In: Topol E, ed. Textbook of Cardiovascular Medicine. 3rd ed. Philadelphia, PA: Lippincott Williams & Wilkins; 2007:1473–1495.
Hirsch AT, Haskal ZJ, Hertzer NR, et al. ACC/AHA 2005 guidelines for the management of patients with peripheral arterial disease (lower extremity, renal, mesenteric, and abdominal aortic). J Am Coll Cardiol. 2006; 47:1239–1312.
Isselbacher, EM. Thoracic and abdominal aortic an-eurysms. Circulation. 2005;111:816–828.
Kay NS, Kasthuri RS. Current treatment of venous thromboembolism. Arterioscler Thromb Vasc Biol. 2010;30:372–375.
Konstantinides, S. Clinical practice: acute pul-monary embolism. N Engl J Med. 2008;359:2804–2813.
Norgren L, Hiatt WR, Dormandy JA, et al. Inter-society consensus for the management of pe-ripheral arterial disease (TASC II). J Vasc Surg. 2007;45:S5–S67.
Raju S, Neglen P. Clinical practice. Chronic venous insuffi ciency and varicose veins. N Engl J Med. 2009;360:2319–2327.
Ramanath VS, Oh JK, Sundt TM III, et al. Acute aortic syndromes and thoracic aortic aneurysm. Mayo Clin Proc. 2009;84:465–481.
77237_ch15.indd 36077237_ch15.indd 360 8/11/10 8:23:41 AM8/11/10 8:23:41 AM

361
C H A P T E R
16Congenital Heart DiseaseDavid D. BergDavid W. Brown
NORMAL DEVELOPMENT OF THE CARDIOVASCULAR SYSTEMDevelopment of the Heart TubeFormation of the Heart LoopSeptationDevelopment of the Cardiac Valves
FETAL AND TRANSITIONAL CIRCULATIONSFetal CirculationTransitional Circulation
COMMON CONGENITAL HEART LESIONSAcyanotic LesionsCyanotic Lesions
EISENMENGER SYNDROME
factors, maternal illness, or ingestion of toxins during pregnancy can contribute to cardiac malformations. However, specifi c etiologies remain unknown in most cases.
The survival of children with congenital heart disease has also improved dramatically in recent decades, largely because of better di-agnostic and interventional techniques. How-ever, the lifelong needs of affected patients include guidance regarding physical activity, pregnancy, and employment.
Formation of the cardiovascular system begins during the third week of embryonic development. Soon after, a unique circulation develops that allows the fetus to mature in the uterus, using the placenta as the primary organ of gas, nutrient, and waste exchange. At birth, the fetal lungs infl ate and become functional, making the placenta unnecessary and dramatically altering circulation patterns to allow the neonate to adjust to life outside
Congenital heart diseases are the most common form of birth defects and are
the leading cause of death from birth ab-normalities in the fi rst year of life. These conditions affect approximately 8 of 1,000 live births, and an estimated 1 million peo-ple in the United States have congenital heart lesions. Some abnormalities are se-vere and require immediate medical atten-tion, whereas many are less pronounced and have minimal clinical consequences. Although congenital heart defects are present at birth, milder defects may remain inappar-ent for weeks, months, or years and, not in-frequently, escape detection until adulthood.
The past half-century has witnessed tre-mendous growth in our understanding of the pathophysiology of congenital heart diseases and substantial improvements in the ability to evaluate and treat those affl icted. Research has shown that genetic mutations, environmental
77237_ch16.indd 36177237_ch16.indd 361 8/11/10 8:24:20 AM8/11/10 8:24:20 AM

Chapter 16
362
the womb. Given the remarkable complex-ity of these processes, it is easy to envision ways that cardiovascular malfunctions could develop.
This chapter begins with an overview of fetal cardiovascular development and then de-scribes the most common forms of congenital heart disease.
NORMAL DEVELOPMENT OF THE CARDIOVASCULAR SYSTEM
By the third week of gestation, the nutrient and gas exchange needs of the rapidly grow-ing embryo can no longer be met by diffusion alone, and the tissues begin to rely on the developing cardiovascular system to deliver these substances over long distances.
Development of the Heart Tube
In the middle of the third week of embryogene-sis, mesodermal cells proliferate at the cranial end of the early embryonic disc. They eventu-ally form two longitudinal cell clusters known as angioblastic cords. These cords canalize and become paired endothelial heart tubes(Fig. 16.1). Lateral embryonic folding gradu-ally causes these two tubes to oppose one an-other and allows them to fuse in the ventral midline, forming a single endocardial tube byday 22. From inside to outside, the layers of this primitive heart tube are an endothelial lin-ing that becomes the endocardium, a layer of gelatinous connective tissue (cardiac jelly), and a thick muscular layer that is derived from the splanchnic mesoderm and develops into the myocardium. The endocardial tube is continu-ous with the aortic arch system rostrally and with the venous system caudally. The primitive heart begins to beat around day 22 or 23, caus-ing blood to circulate by the beginning of the fourth week. The space overlying the develop-ing cardiac area eventually becomes the peri-cardial cavity, housing the future heart.
Formation of the Heart Loop
As the tubular heart grows and elongates, it develops a series of alternate constrictions and dilations, creating the fi rst sign of the
primitive heart chambers—the truncus arte-riosus, the bulbus cordis, the primitive ven-tricle, the primitive atrium, and the sinus venosus (Fig. 16.2). Continued growth and elongation within the confi ned pericardial cavity force the heart tube to bend on itself on day 23, eventually forming a U-shaped
Figure 16.1. Embryonic transverse sections illustrating fusion of the two heart tubes into a single endocardial heart tube. A. 18 days. B. 21 days. C. 22 days.
Dorsal aorta
Endocardial heart tube
Foregut
A
B
C
Fusing endocardial heart tubes
Endocardial heart tube
Foregut
Pericardialcavity
77237_ch16.indd 36277237_ch16.indd 362 8/11/10 8:24:20 AM8/11/10 8:24:20 AM

Congenital Heart Disease
363
loop with the round end pointing ventrally and to the right by day 28. The result of this looping is placement of the atrium and sinus venosus above and behind the trun-cus arteriosus, bulbus cordis, and ventricle (Fig. 16.3). At this point, neither defi nitive septa between the developing chambers nor defi nitive valvular tissue have formed. The connection between the primitive atrium and ventricle is termed the atrioventricular (AV) canal. In time, the AV canal becomes two separate canals, one housing the tricus-pid valve and the other the mitral valve. The sinus venosus is eventually incorporated into the right atrium, forming both the coronary sinus and a portion of the right atrial wall. The bulbus cordis and truncus arteriosus contribute to the future ventricular outfl ow
tracts, forming parts of the proximal aorta and pulmonary artery.
Septation
Septation of the developing atrium, AV canal, and ventricle occurs between the fourth and sixth weeks. Although these events are de-scribed separately here, they actually occur simultaneously.
Septation of the Atria
The primary atrial septum, also known as the septum primum, begins as a ridge of tissue on the roof of the common atrium that grows downward into the atrial cavity (Fig. 16.4). As the septum primum advances, it leaves a
Figure 16.2. The straight heart tube at approximately 22 days. The structures that will ulti-mately form from each segment are listed in brackets.
[Right and left atria]
[Aorta, pulmonary artery]
[Outlet of ventricles]
[Inlet of ventricles]
[Part of right atrium]
Figure 16.3. Formation of the heart loop. A,B. By day 24, continued growth and elongation within the confi ned peri-cardial space necessitate bending of the heart tube on itself, forming a U-shaped loop that points ventrally and to the right. C. Looping eventually places the atria above and behind the primitive ventricles.
Primitiverightatrium
Primitiverightventricle
Primitiveleftatrium
Conus cordis
Primitiveleftventricle
Primitiveatrium
Truncusarteriosus
Truncusarteriosus Bulbus
cordis
Bulboventricularsulcus
A B C
77237_ch16.indd 36377237_ch16.indd 363 8/11/10 8:24:20 AM8/11/10 8:24:20 AM

Chapter 16
364
large opening known as the ostium primum between the crescent-shaped leading edge of the septum and the endocardial cushions sur-rounding the AV canal. The ostium primum allows passage of blood between the form-ing atria. Eventually, the septum primum fuses with the superior aspect of the endo-cardial cushions (described in more detail in the next section), obliterating the ostium primum. However, before closure of the os-tium primum is complete, small perforations appear in the center of the septum primum that ultimately coalesce to form the ostium secundum, preserving a pathway for blood fl ow between the atria (see Fig. 16.4). Fol-lowing closure of the ostium primum, a sec-ond, more muscular membrane, the septum secundum, begins to develop immediately to the right of the superior aspect of the septum primum. This septum grows downward and overlaps the ostium secundum. The septum secundum eventually fuses with the endocar-dial cushions, although only in a partial fash-ion, leaving an oval-shaped opening known as the foramen ovale. The superior edge of
the septum primum then gradually regresses, leaving the lower edge to act as a “fl ap-like” valve that allows only right-to-left fl ow through the foramen ovale (Fig. 16.5). During gestation, blood passes from the right atrium to the left atrium because the pressure in the fetal right atrium is greater than that in the left atrium. This pressure gradient changes direction postnatally, causing the valve to close, as described later.
Septation of the Atrioventricular Canal
Growth of the endocardial cushions contrib-utes to atrial septation and, as described later, to the membranous portion of the interven-tricular septum. Endocardial cushions initially begin as swellings of the gelatinous connective tissue layer within the AV canal. They are then populated by migrating cells from the primi-tive endocardium and subsequently transform into mesenchymal tissue. Tissue growth oc-curs primarily in the horizontal plane, result-ing in septation of the AV canal through the continued growth of the lateral, superior, and
Septumsecundum
Septumprimum
Endocardial cushion
Ostiumprimum
A B
C D
Ostiumsecundum
Interventricularforamen
Septumsecundum
Septumsecundum
Foramenovale
Septumprimum
Septumprimum
Ostiumsecundum
Interventricularseptum
muscular
Interventricularforamen
Interventricularseptum
membranous
Figure 16.4. Atrial septal formation at 30 days (A), 33 days (B), and 37 days (C) of develop-ment as well as in the newborn (D). As the septum primum grows toward the ventricles, the open-ing between it and the AV canal is the ostium primum. Before the ostium primum completely closes, perforations within the upper portion of the septum primum form the ostium secundum. A second ridgeof tissue, the septum secundum, grows downward to the right of the septum primum, partially covering the ostium secundum. The foramen ovale is an opening of the septum secundum that is covered by the “fl ap valve” of the lower septum primum. (Modifi ed from Moss AJ, Adams FH. Heart Disease in Infants, Children, and Adolescents. Baltimore, MD: Williams & Wilkins; 1968:16.)
77237_ch16.indd 36477237_ch16.indd 364 8/11/10 8:24:21 AM8/11/10 8:24:21 AM
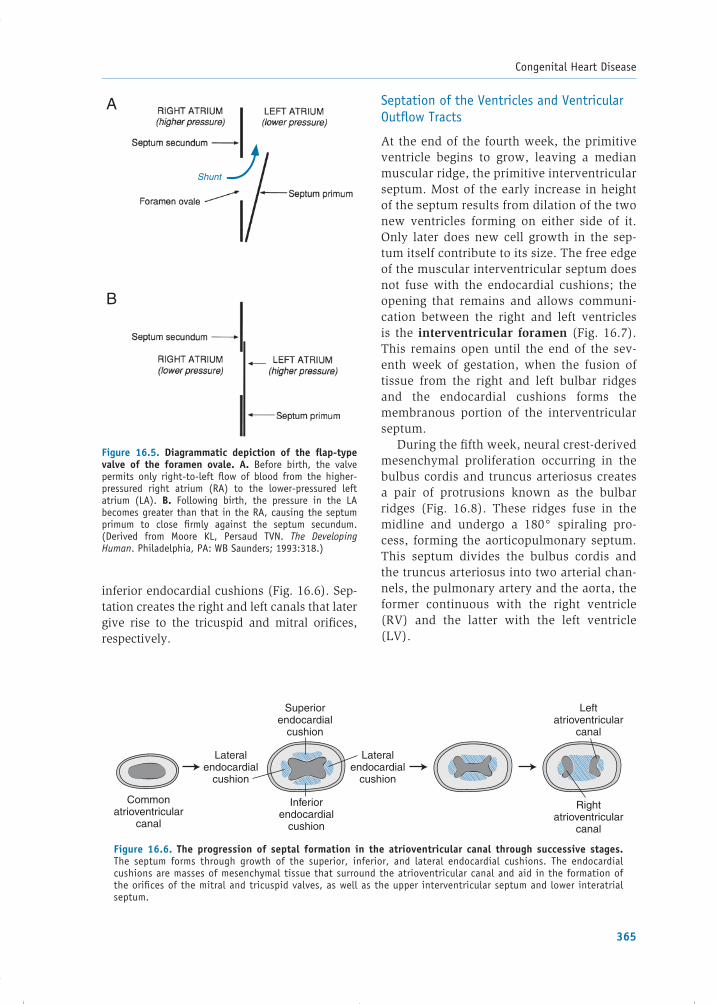
Congenital Heart Disease
365
inferior endocardial cushions (Fig. 16.6). Sep-tation creates the right and left canals that later give rise to the tricuspid and mitral orifi ces, respectively.
Septation of the Ventricles and Ventricular Outfl ow Tracts
At the end of the fourth week, the primitive ventricle begins to grow, leaving a median muscular ridge, the primitive interventricular septum. Most of the early increase in height of the septum results from dilation of the two new ventricles forming on either side of it. Only later does new cell growth in the sep-tum itself contribute to its size. The free edge of the muscular interventricular septum does not fuse with the endocardial cushions; the opening that remains and allows communi-cation between the right and left ventricles is the interventricular foramen (Fig. 16.7). This remains open until the end of the sev-enth week of gestation, when the fusion of tissue from the right and left bulbar ridges and the endocardial cushions forms the membranous portion of the interventricular septum.
During the fi fth week, neural crest-derived mesenchymal proliferation occurring in the bulbus cordis and truncus arteriosus creates a pair of protrusions known as the bulbar ridges (Fig. 16.8). These ridges fuse in the midline and undergo a 180° spiraling pro-cess, forming the aorticopulmonary septum. This septum divides the bulbus cordis and the truncus arteriosus into two arterial chan-nels, the pulmonary artery and the aorta, the former continuous with the right ventricle (RV) and the latter with the left ventricle (LV).
Figure 16.5. Diagrammatic depiction of the fl ap-type valve of the foramen ovale. A. Before birth, the valve permits only right-to-left fl ow of blood from the higher-pressured right atrium (RA) to the lower-pressured left atrium (LA). B. Following birth, the pressure in the LA becomes greater than that in the RA, causing the septum primum to close fi rmly against the septum secundum. ( Derived from Moore KL, Persaud TVN. The Developing Human. Philadelphia, PA: WB Saunders; 1993:318.)
Shunt
A
B
Figure 16.6. The progression of septal formation in the atrioventricular canal through successive stages. The septum forms through growth of the superior, inferior, and lateral endocardial cushions. The endocardial cushions are masses of mesenchymal tissue that surround the atrioventricular canal and aid in the formation of the orifi ces of the mitral and tricuspid valves, as well as the upper interventricular septum and lower interatrial septum.
Rightatrioventricular
canal
Lateralendocardial
cushion
Lateralendocardial
cushion
Superiorendocardial
cushion
Inferiorendocardial
cushion
Commonatrioventricular
canal
Leftatrioventricular
canal
77237_ch16.indd 36577237_ch16.indd 365 8/11/10 8:24:21 AM8/11/10 8:24:21 AM

Chapter 16
366
Development of the Cardiac Valves
Semilunar Valve Development (Aortic and Pulmonary Valves)
The semilunar valves start to develop just before the completion of the aorticopulmo-nary septum. The process begins when three outgrowths of subendocardial mesenchymal tissue form around both the aortic and pul-monary orifi ces. These growths are ultimately shaped and excavated by the joint action of programmed cell death and blood fl ow to create the three thin-walled cusps of both the aortic and pulmonary valves.
Atrioventricular Valve Development (Mitral and Tricuspid Valves)
After the endocardial cushions fuse to form the septa between the right and left AV ca-nals, the surrounding subendocardial mes-enchymal tissue proliferates and develops outgrowths similar to those of the semi-lunar valves. These are also sculpted by pro-grammed cell death that occurs within the inferior surface of the nascent leafl ets and in the ventricular wall. This process leaves behind only a few fi ne muscular strands to connect the valves to the ventricular wall(Fig. 16.9). The superior portions of these strands eventually degenerate and are re-placed by strings of dense connective tissue, becoming the chordae tendineae.
Figure 16.7. The interventricular septum and the in-terventricular foramen. (Derived from Moore KL, Persaud TVN. The Developing Human. Philadelphia, PA: WB Saunders; 1993:325.)
Interventricularforamen
Muscularinterventricularseptum
Figure 16.8. Formation of the aorticopulmonary septum occurs via fusion of the bulbar ridges, resulting in divi-sion of the bulbus cordis and truncus arteriosus into the aorta and pulmonary artery (A, 5 weeks; B, 6 weeks; C, 7 weeks). The bulbus cordis becomes the right ventricular outfl ow tract. Fusion of tissue from the endocardial cush-ions, the aorticopulmonary septum, and the muscular inter-ventricular septum creates the membranous interventricular septum. (Derived from Moore KL, Persaud TVN. The Develop-ing Human. Philadelphia, PA: WB Saunders; 1993:322.)
Aorta
A
Pulmonaryartery
Left bulbarridge
Interventricularforamen
Muscularpart ofinterventricularseptum
Right bulbarridge
Fused endocardialcushions
Pulmonaryartery
Aorticopulmonaryseptum
Muscularpart ofinterventricularseptum
B
Interventricularforamen
Left atrio-ventricularcanal
Right atrio-ventricularcanal
Endocardial cushion
C
Rightventricle
Membranouspart ofinterventricularseptum
77237_ch16.indd 36677237_ch16.indd 366 8/11/10 8:24:21 AM8/11/10 8:24:21 AM

Congenital Heart Disease
367
that establish the normal blood fl ow pattern of a newborn infant.
Fetal Circulation
In fetal life, oxygenated blood leaves the pla-centa through the umbilical vein (Fig. 16.10). Approximately half of this blood is shunted through the fetal ductus venosus, bypassing the hepatic vasculature and proceeding di-rectly into the inferior vena cava (IVC). The remaining blood passes through the portal vein to the liver and then into the IVC through the hepatic veins. IVC blood is therefore a mixture of well-oxygenated umbilical venous blood and the blood of low oxygen tension re-turning from the systemic veins of the fetus. Because of this mixture, the oxygen tension of inferior vena caval blood is higher than that of blood returning to the fetal right atrium from the superior vena cava. This distinc-tion is important because these two streams of blood are partially separated within the right atrium to follow different circulatory paths. The consequence of this separation is that the fetal brain and myocardium receive blood of relatively higher oxygen content, whereas the more poorly oxygenated blood is diverted to the placenta (via the descending aorta and umbilical arteries) for subsequent oxygenation.
Most IVC blood entering the right atrium is directed to the left atrium through the fora-men ovale. This intracardiac shunt of rela-tively well-oxygenated blood is facilitated by the inferior border of the septum secundum, termed the crista dividens, which is positioned such that it overrides the opening of the IVC into the right atrium. This shunted blood then mixes with the small amount of poorly oxygen-ated blood returning to the left atrium through the fetal pulmonary veins (remember that the lungs are not ventilated in utero; the develop-ing pulmonary tissues actually remove oxygen from the blood). From the left atrium, blood fl ows into the LV and is then pumped into the ascending aorta. This well-oxygenated blood is distributed primarily to three territories: (1) ap-proximately 9% enters the coronary arteries and perfuses the myocardium, (2) 62% trav-els in the carotid and subclavian vessels to the upper body and brain, and (3) 29% passes
Figure 16.9. Proliferation of mesenchymal tissue sur-rounding the atrioventricular canals forms the atrioven-tricular valves. A, B, C. Progression of the process, including degeneration of myocardium and replacement by connective tissue that forms the chordae tendineae; their muscular at-tachments to the ventricular wall are the papillary muscles. (Derived from Moore KL, Persaud TVN. The Developing Human. Philadelphia, PA: WB Saunders; 1993:325.)
Interventricularforamen
Lumen of leftventricle
A
Developing mitralvalve
Membranous partof interventricularseptum
BTrabeculae carneae
C
Mitral valve
Chordae tendineae
Papillary muscle
Ventricular conductionsystem
Atrioventricular node
FETAL AND TRANSITIONAL CIRCULATIONS
The fetal circulation elegantly serves the needs of in utero development. At birth, the circu-lation automatically undergoes modifi cations
77237_ch16.indd 36777237_ch16.indd 367 8/11/10 8:24:21 AM8/11/10 8:24:21 AM

Chapter 16
368
into the descending aorta to the rest of the fetal body.
The remaining well-oxygenated inferior vena caval blood entering the right atrium mixes with poorly oxygenated blood from the superior vena cava and passes to the RV. In the fetus, the RV is the actual “work-horse” of the heart, providing two thirds of the total cardiac output. This output fl ows
into the pulmonary artery and from there either through the ductus arteriosus into the descending aorta (88% of RV output) or through the pulmonary arteries and into the lungs (12% of RV output). This unequal distribution of right ventricular outfl ow is actually quite effi cient. Bypassing the lungs is desired because the fetal lungs are fi lled with amniotic fl uid and are incapable of gas
Placenta
Umbilicalarteries
Urinarybladder
Internal iliacartery
Lung
Superior vena cava
Right atrium
Inferior vena cava
Umbilicus
Umbilical vein
Portal vein
Foramen ovale
Arch of aorta
Pulmonary trunk
Left atrium
Descending aorta
Low
Ductus venosus
Pulmonary veins
Ductus arteriosus
Legs
Portal sinus
Right hepaticvein
Left hepatic vein
Sphincter
Medium
High
Oxygen saturationof blood:
Figure 16.10. The fetal circulation. Arrows indicate the direction of blood fl ow. Three shunts (duc-tus venosus, foramen ovale, and ductus arteriosus) allow most of the blood to bypass the lungs and liver during fetal life but cease to function shortly after birth. (Modifi ed from Moore KL, Persaud TVN. The Developing Human. Philadelphia, PA: WB Saunders; 1993:344.)
77237_ch16.indd 36877237_ch16.indd 368 8/11/10 8:24:21 AM8/11/10 8:24:21 AM

Congenital Heart Disease
369
exchange. The low oxygen tension of this fl uid causes constriction of the pulmonary vessels, which increases pulmonary vascular resistance and facilitates shunting of blood through the ductus arteriosus to the sys-temic circulation. From the descending aorta, blood is distributed to the lower body and to the umbilical arteries, leading back to the placenta for gas exchange.
Transitional Circulation
Immediately following birth, the neonate rap-idly adjusts to life outside the womb. The newly functioning lungs replace the placenta as the organ of gas exchange, and the three shunts (ductus venosus, foramen ovale, and ductus arteriosus) that operated during gesta-tion close. This shift in the site of gas exchange and the resulting changes in cardiovascular architecture allow the newborn to survive independently.
As the umbilical cord is clamped or con-stricts naturally, the low-resistance placen-tal fl ow is removed from the arterial system, resulting in an increase in systemic vascular resistance. Simultaneously, pulmonary vas-cular resistance falls for two reasons: (1) the mechanical infl ation of the lungs after birth stretches the lung tissues, causing pulmonary artery expansion and wall thinning, and (2) vasodilatation of the pulmonary vasculature occurs in response to the rise in blood oxygen tension accompanying aeration of the lungs. This reduction in pulmonary resistance results in a dramatic rise in pulmonary blood fl ow. It is most marked within the fi rst day after birth but continues for the next several weeks until adult levels of pulmonary resistance are achieved.
As pulmonary resistance falls and more blood travels to the lungs through the pulmo-nary artery, venous return from the pulmonary veins to the left atrium also increases, causing left atrial pressure to rise. At the same time, cessation of umbilical venous fl ow and con-striction of the ductus venosus cause a fall in IVC and right atrial pressures. As a result, the left atrial pressure becomes greater than that in the right atrium, and the valve of the fora-men ovale is forced against the septum secun-
dum, eliminating the previous fl ow between the atria (see Fig. 16.5).
With oxygenation now occurring in the newborn lungs, the ductus arteriosus becomes superfl uous and closes. During fetal life, a high circulating level of prostaglandin E1 (PGE1) is generated in response to relative hypoxia, which causes the smooth muscle of the ductus arteriosus to relax, keeping it pat-ent. After birth, PGE1 levels decline as the oxygen tension rises and the ductus there-fore constricts. The responsiveness of the ductus to vasoactive substances depends on the gestational age of the fetus. The ductus often fails to constrict in premature infants, resulting in the congenital anomaly known as patent ductus arteriosus (described later in the chapter).
With the anatomic separation of the circula-tory paths of the right and left sides of the heart now complete, the stroke volume of the LV in-creases and that of the RV decreases, equaliz-ing the cardiac output from both ventricles. The augmented pressure and volume load placed on the LV induces the myocardial cells of that chamber to hypertrophy, while the decreased pressure and volume loads on the RV result in gradual regression of RV wall thickness.
COMMON CONGENITAL HEART LESIONS
Congenital heart defects are generally well tolerated before birth. The fetus benefi ts from shunting of blood through the ductus arterio-sus and the foramen ovale, allowing the bypass of most defects. It is only after birth, when the neonate has been separated from the maternal circulation and the oxygenation it provides, and the fetal shunts have closed, that congenital heart defects usually become manifest.
Congenital heart lesions can be categorized as cyanotic or acyanotic. Cyanosis refers to a blue-purple discoloration of the skin and mu-cous membranes caused by an elevated blood concentration of deoxygenated hemoglobin (at least 4 g/dL, which usually corresponds to an arterial O2 saturation of approximately 80% to 85%). In congenital heart disease, cyanosis results from defects that allow poorly oxygen-ated blood from the right side of the heart to be shunted to the left side, bypassing the lungs.
77237_ch16.indd 36977237_ch16.indd 369 8/11/10 8:24:21 AM8/11/10 8:24:21 AM

Chapter 16
370
Acyanotic lesions include intracardiac or vascular stenoses, valvular regurgitation, and defects that result in left-to-right shunt-ing of blood. Large left-to-right shunts at the atrial, ventricular, or great vessel level (all described in the following sections) cause the pulmonary artery volume and pressure to in-crease and can be associated with the later development of pulmonary arteriolar hyper-trophy and increased resistance to fl ow. Over time, the elevated pulmonary resistance may force the direction of the original shunt to re-verse, causing right-to-left fl ow to supervene, accompanied by the physical fi ndings of hypoxemia and cyanosis. The development of pulmonary vascular disease as a result of a chronic large left-to-right shunt is known as Eisenmenger syndrome and is described later in the chapter.
Patients with congenital heart disease are susceptible to infective endocarditis. Chapter 8 describes the pathophysiology of endocarditis and summarizes the appropriate selection of patients for antibiotic prophylaxis prior to pro-cedures that can result in bacteremia.
Acyanotic Lesions
Atrial Septal Defect
An atrial septal defect (ASD) is a persistent opening in the interatrial septum after birth that allows direct communication between the left and right atria. ASDs are relatively com-mon, occurring with an incidence of 1 in 1,500 live births. They can occur anywhere along the atrial septum, but the most common site is at the region of the foramen ovale, termed an ostium secundum ASD (Fig. 16.11). This de-fect arises from inadequate formation of the septum secundum, excessive resorption of the septum primum, or a combination.
Less commonly, an ASD appears in the inferior portion of the interatrial septum, ad-jacent to the AV valves. Named as ostium pri-mum defect, this abnormality results from the failure of the septum primum to fuse with the endocardial cushions.
A third type of atrial septal abnormality is termed a sinus venosus defect and is closely re-lated to ASDs but is morphologically distinct. This condition represents an “unroofi ng” defect
Figure 16.11. Atrial septal defect (ASD), ostium secundum type. A. The arrow indicates shunted fl ow from the left atrium (LA) toward the right atrium (RA). B. Schematic representation of blood fl ow through an uncomplicated ASD, resulting in enlargement of the RA, right ventricle (RV), and pulmonary artery (PA). Ao, aorta; IVC, inferior vena cava; LV, left ventricle; SVC, superior vena cava.
Ao
PA
RA
IVC
SVC
LA
LV
RV
A B
ASD
RALA
RV LV
PA Ao
77237_ch16.indd 37077237_ch16.indd 370 8/11/10 8:24:21 AM8/11/10 8:24:21 AM

Congenital Heart Disease
371
with absence of normal tissue between the right pulmonary vein(s) and the right atrium but is technically not a defi ciency of the anatomic atrial septum (i.e., frequently the atrial septum itself is fully intact). As sinus venosus defects are often large and result in fl ow from the right pulmonary veins and left atrium into the right atrium, the pathophysiology is similar to that of a true ASD.
Another condition related to ASDs is patent foramen ovale (PFO), which is thought to be present in �20% of the general population. It too is not a true ASD (i.e., no atrial septal tis-sue is “missing”), but represents persistence of normal fetal anatomy. As described earlier, the foramen ovale typically functionally closes in the days after birth, and it permanently seals by the age of 6 months through fusion of the atrial septa. A PFO remains when this fusion fails to occur.
A PFO is usually clinically silent because the one-way valve, though not sealed, remains functionally closed since the left atrial pressure is higher than that in the right atrium. However, a PFO takes on signifi cance if the right atrial pressure becomes elevated (e.g., in states of pulmonary hypertension or right-heart failure), resulting in pathologic right-to-left intracardiac shunting. In that case, deoxygenated blood passes directly into the arterial circulation. Oc-casionally, a PFO can be implicated in a patient who has suffered a systemic embolism (e.g., a stroke). This situation, termed paradoxical em-bolism, occurs when thrombus in a systemic vein breaks loose, travels to the right atrium, passes across the PFO to the left atrium (if right-heart pressures are elevated, at least transiently), and then into the systemic arterial circulation.
Pathophysiology
In the case of an uncomplicated ASD, oxy-genated blood from the left atrium is shunted into the right atrium, but not vice versa. Flow through the defect is a function of its size and the fi lling properties (compliance) of the ven-tricles into which the atria pass their contents. Normally after birth, right ventricular compli-ance becomes greater than that of the LV owing to the regression of right ventricular wall thick-ness, facilitating a left-to-right directed shunt. The result is volume overload and enlargement
of the right atrium and RV (see Fig. 16.11B). If right ventricular compliance decreases over time (because of the excessive load), the left-to-right shunt may lessen. Occasionally, if severe pulmonary vascular disease develops (e.g., Eisenmenger syndrome), the direction of the shunt may actually reverse (causing right-to-left fl ow), such that desaturated blood enters the systemic circulation, resulting in hypoxemia and cyanosis.
Symptoms
Most infants with ASDs are asymptomatic. The condition is typically detected by the presence of a murmur on routine physical examination during childhood or adolescence. If symptoms do occur, they include dyspnea on exertion, fatigue, and recurrent lower respiratory tract infections. The most common symptoms in adults are decreased stamina and palpitations due to atrial tachyarrhythmias resulting from right atrial enlargement.
Physical Examination
A prominent systolic impulse may be palpated along the lower-left sternal border, represent-ing contraction of the dilated RV (termed an RV heave). The second heart sound (S2) dem-onstrates a widened, fi xed splitting pattern (see Chapter 2), because the normal respiratory variation in systemic venous return is countered by reciprocal changes in the volume of blood shunted across the ASD. The increased volume of blood fl owing across the pulmonary valve often creates a systolic murmur at the upper-left sternal border. A mid-diastolic murmur may also be present at the lower-left sternal border owing to the increased fl ow across the tricuspid valve. Blood traversing the ASD itself does not produce a murmur because of the absence of a signifi -cant pressure gradient between the two atria.
Diagnostic Studies
On chest radiographs, the heart is usually en-larged because of right atrial and right ven-tricular dilatation, and the pulmonary artery is prominent with increased pulmonary vascular markings. The electrocardiogram (ECG) shows
77237_ch16.indd 37177237_ch16.indd 371 8/11/10 8:24:22 AM8/11/10 8:24:22 AM

Chapter 16
372
right ventricular hypertrophy, often with right atrial enlargement and incomplete or complete right bundle branch block. In patients with the ostium primum type of ASD, left axis devia-tion is common and is thought to be a result of displacement and hypoplasia of the left bundle branch’s anterior fascicle. Echocardiography demonstrates right atrial and right ventricular enlargement; the ASD may be visualized di-rectly, or its presence may be implied by the demonstration of a transatrial shunt by Doppler fl ow interrogation. The magnitude and direction of shunt fl ow and an estimation of right ventri-cular systolic pressure can be determined.
Given the high sensitivity of echocardiography, it is rarely necessary to perform cardiac cath-eterization to confi rm the presence of an ASD. Catheterization may be useful to assess pulmo-nary vascular resistance and to diagnose con-current coronary artery disease in older adults. In a normal person undergoing cardiac cath-eterization, the oxygen saturation measured in the right atrium is similar to that in the supe-rior vena cava. However, an ASD with left-to-right shunting of well-oxygenated blood causes
the saturation in the right atrium to be much greater than that of the superior vena cava.
Treatment
Most patients with ASDs remain asymptom-atic. However, if the volume of shunted blood is hemodynamically signifi cant (even in the absence of symptoms), elective surgical repair is recommended to prevent the development of heart failure or pulmonary vascular disease. The defect is repaired by direct suture closure or with a pericardial or synthetic patch. In chil-dren and young adults, morphologic changes in the right heart often return to normal after repair. Percutaneous ASD repair, using a clo-sure device deployed via an intravenous cath-eter, is a less invasive alternative to surgery in selected patients with secundum ASDs.
Ventricular Septal Defect
A ventricular septal defect (VSD) is an abnor-mal opening in the interventricular septum (Fig. 16.12). VSDs are relatively common, having an
Figure 16.12. Ventricular septal defect (VSD). A. The arrow indicates shunted fl ow from the left ventricle (LV) toward the right ventricular (RV) outfl ow tract. B. Schematic representation of blood fl ow through an uncomplicated VSD. The dashed lines represent increased blood return to the left side of the heart as a result of the shunt, which causes enlargement primarily of the left atrium (LA) and LV. Ao, aorta; IVC, inferior vena cava; PA, pulmonary artery; RA, right atrium; SVC, superior vena cava.
Ao
PA
RA
IVC
SVC
LA
LV
RV
A B
VSD
RA LA
RV LV
PA Ao
77237_ch16.indd 37277237_ch16.indd 372 8/11/10 8:24:22 AM8/11/10 8:24:22 AM

Congenital Heart Disease
373
incidence of 1.5 to 3.5 per 1,000 live births. They are most often located in the membra-nous (70%) and muscular (20%) portions of the septum. Rare VSDs occur just below the aortic valve or adjacent to the AV valves.
Pathophysiology
The hemodynamic changes that accompany VSDs depend on the size of the defect and the relative resistances of the pulmonary and sys-temic vasculatures. In small VSDs, the defect itself offers more resistance to fl ow than the pulmonary or systemic vasculature; thus, the magnitude of the shunt depends on the size of the hole. Conversely, with larger “nonrestric-tive” defects, the volume of the shunt is deter-mined by the relative pulmonary and systemic vascular resistances. In the perinatal period, the pulmonary vascular resistance approximates the systemic vascular resistance, and minimal shunting occurs between the two ventricles. After birth, however, as the pulmonary vascu-lar resistance falls, an increasing left-to-right shunt through the defect develops. When this shunt is large, the RV, pulmonary circulation, left atrium, and LV experience a relative vol-ume overload. Initially, the increased blood re-turn to the LV augments stroke volume (via the Frank–Starling mechanism); but over time, the increased volume load can result in chamber dilatation, systolic dysfunction, and symptoms of heart failure. In addition, the augmented circulation through the pulmonary vasculature can cause pulmonary vascular disease as early as 2 years of age. As pulmonary vascular re-sistance increases, the intracardiac shunt may reverse its direction (Eisenmenger syndrome), leading to systemic hypoxemia and cyanosis.
Symptoms
Patients with small VSDs typically remain symptom free. Conversely, 10% of infants with VSDs have large defects and will develop early symptoms of congestive heart failure, includ-ing tachypnea, poor feeding, failure to thrive, and frequent lower respiratory tract infections. Patients with VSDs complicated by pulmonary vascular disease and reversed shunts may present with dyspnea and cyanosis. Bacterial
endocarditis (see Chapter 8) can develop, re-gardless of the size of the VSD.
Physical Examination
The most common physical fi nding is a harsh holosystolic murmur that is best heard at the left sternal border. Smaller defects tend to have the loudest murmurs because of the great turbulence of fl ow that they cause. A systolic thrill can commonly be palpated over the region of the murmur. In addition, a mid-diastolic rumble can often be heard at the apex owing to the increased fl ow across the mitral valve. If pulmonary vascular disease develops, the holosystolic murmur diminishes as the pressure gradient across the defect decreases. In such patients, an RV heave, a loud pul-monic closure sound (P2), and cyanosis may be evident.
Diagnostic Studies
On chest radiographs, the cardiac silhouette may be normal in patients with small defects, but in those with large shunts, cardiomegaly and prominent pulmonary vascular markings are present. If pulmonary vascular disease has developed, enlarged pulmonary arteries with peripheral tapering may be evident. The ECG shows left atrial enlargement and left ventricu-lar hypertrophy in those with a large shunt, and right ventricular hypertrophy is usually evident if pulmonary vascular disease is pres-ent. Echocardiography with Doppler studies can accurately determine the location of the VSD, identify the direction and magnitude of the shunt, and provide an estimate of right ventricular systolic pressure. Cardiac catheter-ization demonstrates increased oxygen satura-tion in the RV compared with the right atrium, the result of shunting of highly oxygenated blood from the LV into the RV.
Treatment
By age 2, at least 50% of small and moderate-sized VSDs undergo suffi cient partial or com-plete spontaneous closure to make intervention unnecessary. Surgical correction of the defect is recommended in the fi rst few months of life
77237_ch16.indd 37377237_ch16.indd 373 8/11/10 8:24:22 AM8/11/10 8:24:22 AM

Chapter 16
374
for children with congestive heart failure or pulmonary vascular disease. Moderate-sized defects without pulmonary vascular disease but with signifi cant left-to-right shunting can be corrected later in childhood. Less-invasive catheter-based treatments are also used in se-lected patients.
Patent Ductus Arteriosus
The ductus arteriosus is the vessel that connects the left pulmonary artery to the descending aorta during fetal life. Patent ductus arteriosus (PDA) results when the ductus fails to close after birth, resulting in a persistent connection between the great vessels (Fig. 16.13). It has an overall incidence of about 1 in 2,500 to 5,000 live term births. Risk factors for its presence in-clude fi rst trimester maternal rubella infection, prematurity, and birth at a high altitude.
Pathophysiology
As described earlier, the smooth muscle of the ductus arteriosus usually constricts after birth
owing to the sudden rise in blood oxygen ten-sion and a reduction in the level of circulating prostaglandins. Over the next several weeks, intimal proliferation and fi brosis result in per-manent closure. Failure of the ductus to close results in a persistent shunt between the de-scending aorta and the left pulmonary artery. The magnitude of fl ow through the shunt de-pends on the cross-sectional area and length of the ductus itself as well as the relative re-sistances of the systemic and pulmonary vas-culatures. Prenatally, when the pulmonary vascular resistance is high, blood is diverted away from the immature lungs to the aorta. As the pulmonary resistance drops postna-tally, the shunt reverses direction and blood fl ows from the aorta into the pulmonary cir-culation instead. Because of this left-to-right shunt, the pulmonary circulation, left atrium, and LV become volume overloaded. This can lead to left ventricular dilatation and left-sided heart failure, whereas the right heart remains normal unless pulmonary vascular disease en-sues. If the latter does develop, Eisenmenger syndrome results, with reversal of the shunt
Figure 16.13. Patent ductus arteriosus (PDA). A. The arrow indicates shunted fl ow from the descending aorta (Ao) toward the pulmonary artery (PA). B. Schematic representation of blood fl ow through an un-complicated PDA. The dashed lines represent increased blood return to the left side of the heart as a result of the shunt, which causes enlargement of the left atrium (LA), left ventricle (LV), and Ao. IVC, inferior vena cava; RA, right atrium; RV, right ventricle; SVC, superior vena cava.
Ao
PA
RA
IVC
SVC
LA
LV
RV
A B
PDA
RA LA
RV LV
PA Ao
77237_ch16.indd 37477237_ch16.indd 374 8/11/10 8:24:22 AM8/11/10 8:24:22 AM

Congenital Heart Disease
375
causing blood to fl ow from the pulmonary artery, through the ductus, to the descending aorta. The resulting fl ow of desaturated blood to the lower extremities causes cyanosis of the feet; the upper extremities are not cyanotic, because they receive normally saturated blood from the proximal aorta.
Symptoms
Children with small PDAs are generally asymptomatic. Those with large left-to-right shunts develop early congestive heart failure with tachycardia, poor feeding, slow growth, and recurrent lower respiratory tract infec-tions. Moderate-sized lesions can present with fatigue, dyspnea, and palpitations in adolescence and adult life. Atrial fi brillation may occur owing to left atrial dilatation. Tur-bulent blood fl ow across the defect can set the stage for endovascular infection, similar to endocarditis, but more accurately termed endarteritis.
Physical Examination
The most common fi nding in a patient with a left-to-right shunt through a PDA is a con-tinuous, machine-like murmur (see Fig. 2.10), heard best at the left subclavicular region. The murmur is present throughout the car-diac cycle because a pressure gradient exists between the aorta and pulmonary artery in both systole and diastole. However, if pulmo-nary vascular disease develops, the gradient between the aorta and the pulmonary artery decreases, leading to diminished fl ow through the PDA, and the murmur becomes shorter (the diastolic component may disappear). If Eisenmenger syndrome develops, lower ex-tremity cyanosis and clubbing may be present on examination as poorly oxygenated blood is shunted to the descending aorta.
Diagnostic Studies
With a large PDA, the chest radiograph shows an enlarged cardiac silhouette (left atrial and left ventricular enlargement) with prominent pulmonary vascular markings. In adults, cal-cifi cation of the ductus may be visualized.
The ECG shows left atrial enlargement and left ventricular hypertrophy when a large shunt is present. Echocardiography with Doppler imag-ing can visualize the defect, demonstrate fl ow through it, and estimate right-sided systolic pressures. Cardiac catheterization is usually unnecessary for diagnostic purposes. When performed in patients with a left-to-right shunt, it demonstrates a step up in oxygen satura-tion in the pulmonary artery compared with the RV, and angiography shows the abnormal fl ow of blood through the PDA.
Treatment
In the absence of other congenital cardiac abnormalities or severe pulmonary vascular disease, a PDA should generally be therapeuti-cally occluded. Although many spontaneously close during the fi rst months after birth, this rarely occurs later. Given the constant risk of endarteritis and the minimal complications of corrective procedures, even a small asymp-tomatic PDA is commonly referred for closure. For neonates and premature infants with con-gestive heart failure, a trial of prostaglandin synthesis inhibitors (e.g., indomethacin) can be administered in an attempt to constrict the ductus. Defi nitive closure can be accomplished by surgical division or ligation of the ductus or by transcatheter techniques in which an oc-cluding device is placed.
Congenital Aortic Stenosis
Congenital aortic stenosis (AS) is most often caused by abnormal structural development of the valve leafl ets (Fig. 16.14). It occurs in5 of 10,000 live births and is four times as common in males as in females. Twenty per-cent of patients have an additional abnormal-ity, most commonly coarctation of the aorta (discussed later). The aortic valve in congeni-tal AS usually has a bicuspid leafl et structure instead of the normal three-leafl et confi gura-tion, causing an eccentric stenotic opening through which blood is ejected. Most bicuspid aortic valves are actually nonobstructive at birth and therefore only rarely result in con-genital AS. More often, bicuspid valves be-come progressively stenotic over a great many
77237_ch16.indd 37577237_ch16.indd 375 8/11/10 8:24:22 AM8/11/10 8:24:22 AM

Chapter 16
376
years, as the leafl ets progressively fi brose and calcify, and represent a common cause of AS in adults (see Chapter 8).
Pathophysiology
Because the valvular orifi ce is signifi cantly narrowed, left ventricular systolic pressure must increase to pump blood across the valve into the aorta. In response to this increased pressure load, the LV hypertrophies. The high-velocity jet of blood that passes through the stenotic valve may impact the proximal aortic wall and contribute to dilatation of that vessel.
Symptoms
The clinical picture of AS depends on the se-verity of the lesion. Fewer than 10% of infants experience symptoms of heart failure before age 1, but if they do, they manifest tachy-cardia, tachypnea, failure to thrive, and poor
feeding. Most older children with congenital AS are asymptomatic and develop normally. When symptoms do occur, they are similar to those of adult AS and include fatigue, exer-tional dyspnea, angina pectoris, and syncope (see Chapter 8).
Physical Examination
Auscultation reveals a harsh crescendo–decrescendo systolic murmur, loudest at the base of the heart with radiation to the neck. It is often preceded by a systolic ejection click (see Chapter 2), especially when a bicuspid valve is present. Unlike the murmurs of ASD, VSD, or PDA, the murmur of congenital AS is characteristically present from birth because it does not depend on the postnatal decline in pulmonary vascular resistance. With ad-vanced disease, the ejection time becomes longer, causing the peak of the murmur to occur later in systole. In severe disease, the signifi cantly prolonged ejection time causes a
Figure 16.14. Congenital aortic valve stenosis. A. The jagged arrow traverses the narrowed aortic valve.B. Schematic representation of obstructed fl ow through the narrowed aortic valve (jagged arrow). Left ventricular (LV) hypertrophy results from the chronically increased pressure load. Poststenotic dilatation of the aorta (Ao) is common. IVC, inferior vena cava; LA, left atrium; PA, pulmonary artery; RA, right atrium; RV, right ventricle; SVC, superior vena cava.
Ao
PA
RA
IVC
SVC
LA
LV
RV
A B
RA LA
RV LV
PA Ao
77237_ch16.indd 37677237_ch16.indd 376 8/11/10 8:24:22 AM8/11/10 8:24:22 AM

Congenital Heart Disease
377
delay in closure of the aortic valve such that A2 occurs after P2—a phenomenon known as reversed splitting of S2 (see Chapter 2).
Diagnostic Studies
The chest radiograph of an infant with AS may show an enlarged LV and a dilated ascending aorta. The ECG often shows left ventricular hypertrophy. Echocardiography identifi es the abnormal structure of the aortic valve and the degree of left ventricular hypertrophy. Dop-pler assessment can accurately measure the pressure gradient across the stenotic valve and allow calculation of the valve area. Cardiac catheterization confi rms the pressure gradient across the valve.
Treatment
In its milder forms, congenital AS does not need to be corrected but should be followed closely as the degree of stenosis may worsen over time. Severe obstruction of the aortic valve during infancy may mandate immediate repair. Transcatheter balloon valvuloplasty is
the fi rst line of intervention, but surgical re-pair may be necessary if valvuloplasty fails to relieve the obstruction or if signifi cant aortic regurgitation results from balloon dilation. Often, valvuloplasty in infancy is only pal-liative, and repeat catheter balloon dilation or surgical revision is needed later.
Pulmonic Stenosis
Obstruction to right ventricular outfl ow may occur at the level of the pulmonic valve (e.g., from congenitally fused valve commissures), within the body of the RV (in the RV outfl ow tract), or in the pulmonary artery. Valvular pulmonic stenosis is the most frequent form (Fig. 16.15).
Pathophysiology
The consequence of pulmonic stenosis is im-pairment of right ventricular outfl ow, which leads to increased RV pressures and chamber hypertrophy. The clinical course is determined by the severity of the obstruction. Although mild pulmonic stenosis rarely progresses and
Figure 16.15. Congenital pulmonary valve stenosis. A. The jagged arrow traverses the narrowed pulmo-nary valve. B. Schematic representation of obstructed fl ow through the narrowed pulmonary valve (jagged arrow). Right ventricular hypertrophy results from the chronically increased pressure load. Ao, aorta; IVC, inferior vena cava; LA, left atrium; LV, left ventricle; PA, pulmonary artery; RA, right atrium; RV, right ventricle; SVC, superior vena cava.
Ao
PA
RA
IVC
SVC
LA
LV
RV
A B
RALA
RV LV
PA Ao
77237_ch16.indd 37777237_ch16.indd 377 8/11/10 8:24:22 AM8/11/10 8:24:22 AM
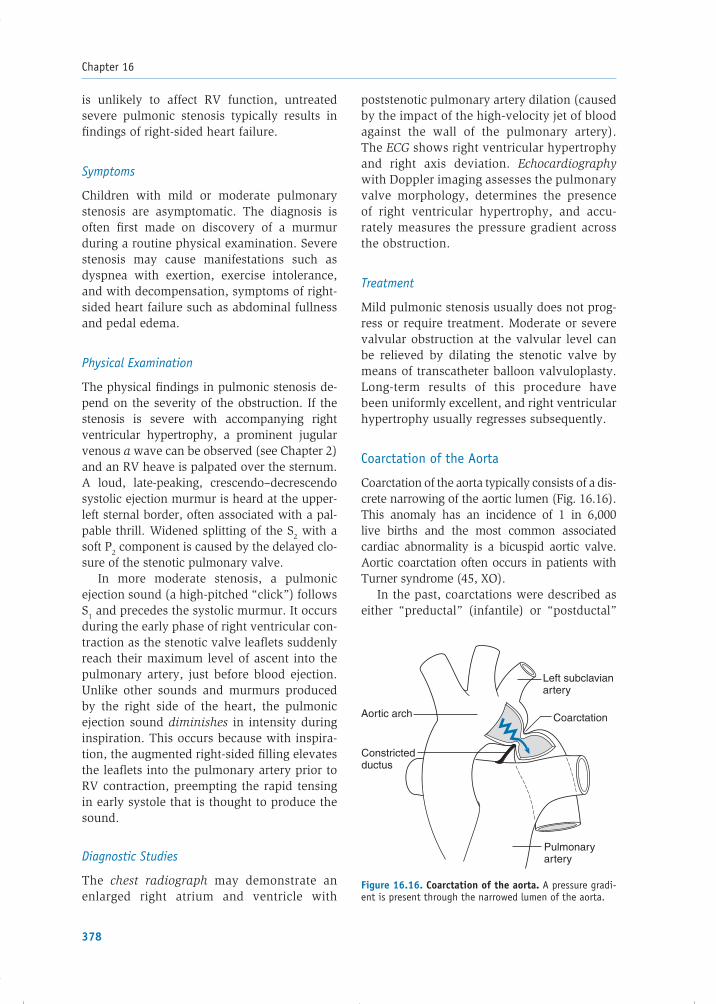
Chapter 16
378
is unlikely to affect RV function, untreated severe pulmonic stenosis typically results in fi ndings of right-sided heart failure.
Symptoms
Children with mild or moderate pulmonary stenosis are asymptomatic. The diagnosis is often fi rst made on discovery of a murmur during a routine physical examination. Severe stenosis may cause manifestations such as dyspnea with exertion, exercise intolerance, and with decompensation, symptoms of right-sided heart failure such as abdominal fullness and pedal edema.
Physical Examination
The physical fi ndings in pulmonic stenosis de-pend on the severity of the obstruction. If the stenosis is severe with accompanying right ventricular hypertrophy, a prominent jugular venous a wave can be observed (see Chapter 2) and an RV heave is palpated over the sternum. A loud, late-peaking, crescendo–decrescendo systolic ejection murmur is heard at the upper-left sternal border, often associated with a pal-pable thrill. Widened splitting of the S2 with a soft P2 component is caused by the delayed clo-sure of the stenotic pulmonary valve.
In more moderate stenosis, a pulmonic ejection sound (a high-pitched “click”) follows S1 and precedes the systolic murmur. It occurs during the early phase of right ventricular con-traction as the stenotic valve leafl ets suddenly reach their maximum level of ascent into the pulmonary artery, just before blood ejection. Unlike other sounds and murmurs produced by the right side of the heart, the pulmonic ejection sound diminishes in intensity during inspiration. This occurs because with inspira-tion, the augmented right-sided fi lling elevates the leafl ets into the pulmonary artery prior to RV contraction, preempting the rapid tensing in early systole that is thought to produce the sound.
Diagnostic Studies
The chest radiograph may demonstrate an enlarged right atrium and ventricle with
poststenotic pulmonary artery dilation (caused by the impact of the high-velocity jet of blood against the wall of the pulmonary artery). The ECG shows right ventricular hypertrophy and right axis deviation. Echocardiography with Doppler imaging assesses the pulmonary valve morphology, determines the presence of right ventricular hypertrophy, and accu-rately measures the pressure gradient across the obstruction.
Treatment
Mild pulmonic stenosis usually does not prog-ress or require treatment. Moderate or severe valvular obstruction at the valvular level can be relieved by dilating the stenotic valve by means of transcatheter balloon valvuloplasty. Long-term results of this procedure have been uniformly excellent, and right ventricular hyper trophy usually regresses subsequently.
Coarctation of the Aorta
Coarctation of the aorta typically consists of a dis-crete narrowing of the aortic lumen (Fig. 16.16). This anomaly has an incidence of 1 in 6,000live births and the most common associated cardiac abnormality is a bicuspid aortic valve. Aortic coarctation often occurs in patients with Turner syndrome (45, XO).
In the past, coarctations were described as either “preductal” (infantile) or “postductal”
Figure 16.16. Coarctation of the aorta. A pressure gradi-ent is present through the narrowed lumen of the aorta.
Left subclavian artery
CoarctationAortic arch
Constricted ductus
Pulmonary artery
77237_ch16.indd 37877237_ch16.indd 378 8/11/10 8:24:22 AM8/11/10 8:24:22 AM

Congenital Heart Disease
379
(adult-type) based on the location of the aortic narrowing in relation to the ductus arteriosus. These terms have been largely abandoned be-cause the vast majority of coarctations are ac-tually juxtaductal (i.e., “next to” the ductus) and etiologic differences between the preduc-tal and postductal categories have not been substantiated.
While the actual pathogenesis of aortic coarctation has not been defi ned, one theory contends that reduced antegrade blood fl ow through the left side of the heart and ascending aorta during fetal life leads to hypoplastic de-velopment of the aorta (“no fl ow, no grow”). Another theory is that ectopic muscular ductus arteriosus tissue extends into the aorta during fetal life and constricts following birth at the same time the ductus is caused to close. More recent evidence suggests that aortic coarcta-tion may be just one manifestation of a more diffuse aortic disease.
Pathophysiology
Because of the impedance of aortic narrow-ing in coarctation, the LV faces an increased afterload. Blood fl ow to the head and upper extremities is preserved because the vessels supplying these areas usually branch off the aorta proximal to the obstruction, but fl ow to the descending aorta and lower extremi-ties may be diminished. If coarctation is not corrected, compensatory alterations include(1) development of left ventricular hyper-trophy and (2) dilatation of collateral blood vessels from the intercostal arteries that by-pass the coarctation and provide blood to the more distal descending aorta. Eventually, these collateral vessels enlarge and can erode the undersurface of the ribs.
Symptoms
Patients with severe coarctation usually pres-ent very shortly after birth with symptoms of heart failure. Infants may also exhibit differ-ential cyanosis if the ductus arteriosus fails to constrict and remains patent. The upper half of the body, supplied by the LV and the ascend-ing aorta, is perfused with well-oxygenated blood; however, the lower half appears cyano-
tic because it is largely supplied by right-to-left fl ow of poorly oxygenated blood from the pul-monary artery, across the PDA, and into the descending aorta.
When the coarctation is less severe, a pa-tient may be asymptomatic or experience only mild weakness or pain in the lower extremi-ties following exercise (i.e., claudication). In asymptomatic cases, coarctation may be suspected by the fi nding of upper extremity hypertension later in life (see Chapter 13).
Physical Examination
On examination, the femoral pulses are weak and delayed. An elevated blood pressure in the upper body is the most common fi nding. If the coarctation occurs distal to the take-off of the left subclavian artery, the systolic pressure in the arms is greater than that in the legs. If the coarctation occurs proximal to the takeoff of the left subclavian artery, the systolic pressure in the right arm may exceed that in the left arm. A systolic pressure in the right arm that is 15 to 20 mm Hg greater than that in a leg is suffi cient to suspect coarcta-tion, because normally the systolic pressure in the legs is higher than that in the arms. A midsystolic ejection murmur (caused by fl ow through the coarctation) may be audible over the chest and/or back. A prominent tortuous collateral arterial circulation may create con-tinuous murmurs over the chest in adults.
Diagnostic Studies
In adults with uncorrected coarctation of the aorta, chest radiography generally reveals notching of the inferior surface of the posterior ribs owing to enlarged intercostal vessels sup-plying collateral circulation to the descending aorta. An indented aorta at the site of coarc-tation may also be visualized. The ECG shows left ventri cular hypertrophy resulting from the pressure load placed on that chamber. Doppler echo cardiography confi rms the diagnosis of coarctation and assesses the pressure gradient across the lesion. Magnetic resonance imaging demonstrates in detail the length and severity of coarctation (see Fig. 16.17). Diagnostic catheter-ization and angiography are rarely necessary.
77237_ch16.indd 37977237_ch16.indd 379 8/11/10 8:24:22 AM8/11/10 8:24:22 AM

Chapter 16
380
Treatment
In neonates with severe obstruction, prosta-glandin infusion is administered to keep the ductus arteriosus patent, thus maintaining blood fl ow to the descending aorta before surgery is undertaken. In children, elective repair is usually performed to prevent sys-temic hypertension. Several effective surgical procedures are available, including excision of the narrowed aortic segment with end-to-end reanastomosis and direct repair of the coarcta-tion, sometimes using synthetic patch material. For older children, adults, and patients with recurrent coarctation after previous repair, transcatheter interventions (balloon dilatation with or without stent placement) are usually successful.
Cyanotic Lesions
Tetralogy of Fallot
Tetralogy of Fallot results from a single de-velopmental defect: an abnormal anterior and cephalad displacement of the infundibular (outfl ow tract) portion of the interventricular septum. As a consequence, four anomalies arise that characterize this condition, as shown in Figure 16.18: (1) a VSD caused by anterior
malalignment of the interventricular septum, (2) subvalvular pulmonic stenosis because of obstruction from the displaced infundibular septum (often with valvular pulmonic stenosis), (3) an overriding aorta that receives blood from both ventricles, and (4) right ventricular hypertrophy owing to the high-pressure load placed on the RV by the pulmonic stenosis. Tetralogy of Fallot is the most common form of cyanotic congenital heart disease after in-fancy, occurring in 5 of 10,000 live births and is often associated with other cardiac defects, including a right-sided aortic arch (25% of patients), ASD (10% of patients), and less often, anomalous origin of the left coronary artery. A microdeletion in chromosome 22 (22q11) has been identifi ed in patients with a syndrome that includes tetralogy of Fallot as one of the cardiovascular manifestations (see Box 16.1).
Figure 16.17. Magnetic resonance imaging of coarcta-tion of the aorta. This lateral view demonstrates coarcta-tion, manifest as a focal aortic narrowing (white arrow). AA, ascending aorta; DA, descending aorta; LA, left atrium; RA, right atrium; TAA, transverse aortic arch.
Figure 16.18. Tetralogy of Fallot is characterized by four associated anomalies. (1) A ventricular septal defect, (2) obstruction to right ventricular outfl ow (jagged arrow), (3) an overriding aorta that receives blood from both ven-tricles, and (4) right ventricular hypertrophy. Ao, aorta; IVC, inferior vena cava; LA, left atrium; LV, left ventricle; PA, pulmonary artery; RA, right atrium; RV, right ventricle; SVC, superior vena cava.
Ao
PA
RA
IVC
SVC
LA
LVRV
Right ventricular hypertrophy
Ventricularseptal defect
77237_ch16.indd 38077237_ch16.indd 380 8/11/10 8:24:22 AM8/11/10 8:24:22 AM

Congenital Heart Disease
381
Pathophysiology
Increased resistance by the subvalvular pul-monic stenosis causes deoxygenated blood re-turning from the systemic veins to be diverted from the RV, through the VSD, to the LV, and into the systemic circulation, resulting in sys-temic hypoxemia and cyanosis. The magni-tude of shunt fl ow across the VSD is primarily a function of the severity of the pulmonary stenosis, but acute changes in systemic and
pulmonary vascular resistances can affect it as well.
Symptoms
Children with tetralogy of Fallot often experi-ence dyspnea on exertion. “Spells” may occur following exertion, feeding, or crying when systemic vasodilatation results in an increased right-to-left shunt. Manifestations of such spells include irritability, cyanosis, hyperventilation,
BOX 16.1 Genetic Abnormalities in Congenital Heart Disease
Progress in the understanding of genetic infl uences on cardiac development and congenital heart disease is proceeding at a brisk pace, aided by the Human Genome Project. Although nearly all cardiac congenital anomalies can occur as isolated fi ndings, the clustering of certain forms with heritable syndromes and known genetic abnormalities provides clues to the underlying basis of certain defects. Among infants with Down syndrome (trisomy 21), the incidence of congenital heart defects is nearly 40%. Many of these are common abnormalities such as ASDs, VSDs, and PDAs. There is also a high incidence of a rarer condition known as common atrioventricular canal, which consists of a large primum ASD and VSD and a common (undivided) atrioventricular valve. These central heart structures are usually formed by the endocardial cushions and cells of neural crest origin, which are known to have abnormal migration patterns in patients with trisomy 21. Turner syndrome (45, XO) is another heritable condition associated with congenital heart disease. Left-sided obstructive congenital heart lesions are common in patients with this syndrome, includ-ing bicuspid aortic valve, coarctation of the aorta, and occasionally hypoplastic left heart syndrome (underdevelopment of the left ventricle and aorta). The specifi c genes responsible for these abnormali-ties have not yet been elucidated. In contrast, discrete gene abnormalities have been identifi ed in other syndrome-associated forms of congenital heart disease. Many patients with Williams syndrome (characterized by mental retardation, hypercalcemia, renovascular hypertension, facial abnormalities, and short stature) have supravalvular aortic stenosis, and some have a more diffuse arteriopathy of the aorta as well as pulmonary artery obstruction. The genetic abnormality in Williams syndrome is a deletion on chromosome 7 (7q11.23), a region that includes the elastin gene. Abnormalities in the production of elastin, a critical component of the arterial wall, may be responsible for the observed arteriopathy. DiGeorge syndrome (characterized by pharyngeal defects, hypocalcemia due to absent parathyroid glands, and T-cell dysfunction secondary to hypoplasia of the thymus) is associated with congenital abnormalities of the cardiac outfl ow tracts, including tetralogy of Fallot, truncus arteriosus (a large VSD over which a single large outfl ow vessel arises), and interrupted aortic arch. Most patients with DiGeorge syndrome have a microdeletion within chromosome 22 (22q11), a region that contains the TBX1 gene. This gene encodes a transcription factor that appears to play a critical role in developmental patterning of the cardiac outfl ow tracts. Several other transcription factors involved in heart development likely contribute to congenital heart disease. Some families with heritable forms of ASDs have mutations in the transcription factor gene Nkx2.5. An associated transcription factor gene GATA4 appears to collaborate with Nkx2.5 and has also been implicated in familial septal defect syndromes. Mutations in TBX5, yet another transcription factor gene, are responsible for Holt–Oram syndrome (also known as the heart–hand syndrome), an autosomal dominant disorder whose characteristic cardiac defects include secundum ASDs and VSDs. Further deciphering of the genome will undoubtedly improve understanding of cardiac development and the molecular defects that lead to congenital heart abnormalities.
77237_ch16.indd 38177237_ch16.indd 381 8/11/10 8:24:24 AM8/11/10 8:24:24 AM

Chapter 16
382
and occasionally syncope or convulsions. Children learn to alleviate their symptoms by squatting down, which is thought to increase systemic vascular resistance by “kinking” the femoral arteries, thereby decreasing the right-to-left shunt and directing more blood from the RV to the lungs.
Physical Examination
Children with tetralogy of Fallot and moderate pulmonary stenosis often have mild cyanosis, most notably of the lips, mucous membranes, and digits. Infants with severe pulmonary steno-sis may present with profound cyanosis in the fi rst few days of life. Chronic hypoxemia caused by the right-to-left shunt commonly results in clubbing of the fi ngers and toes. Right ventri-cular hypertrophy may be appreciated on physi-cal examination as a palpable heave along the left sternal border. The S2 is single, composed of a normal aortic component; the pulmonary component is soft and usually inaudible. A sys-tolic ejection murmur heard best at the upper-left sternal border is created by turbulent blood fl ow through the stenotic right ventricular out-fl ow tract. There is usually no distinct murmur related to the VSD, because it is typically large and thus generates little turbulence.
Diagnostic Studies
Chest radiography demonstrates prominence of the RV and decreased size of the main pul-monary artery segment, giving the appearance of a “boot-shaped” heart. Pulmonary vascular markings are typically diminished because of decreased fl ow through the pulmonary circulation. The ECG shows right ventricular hypertrophy with right axis deviation. Echocar-diography details the right ventricular outfl ow tract anatomy, the malaligned VSD, right ventri-cular hypertrophy, and other associated defects, as does cardiac catheterization.
Treatment
Before defi nitive surgical correction of tetral-ogy of Fallot was developed, several forms of palliative therapy were undertaken. These involved creating anatomic communications
between the aorta (or one of its major branches) to the pulmonary artery, establishing a left-to-right shunt to increase pulmonary blood fl ow. Such procedures are occasionally used today in infants for whom defi nitive repair is planned at an older age. Complete surgical cor-rection of tetralogy of Fallot involves closure of the VSD and enlargement of the subpulmo-nary infundibulum with the use of a pericardial patch. Elective repair is usually recommended at 6 to 12 months of age to decrease the like-lihood of future complications. Most patients who have undergone successful repair grow to become asymptomatic adults. However, anti-biotic prophylaxis to prevent endocarditis is re-quired in some patients (see Chapter 8).
Transposition of the Great Arteries
In transposition of the great arteries (TGA), each great vessel inappropriately arises from the opposite ventricle; that is, the aorta origi-nates from the RV and the pulmonary artery originates from the LV (Fig. 16.19). This anom-aly accounts for approximately 7% of congenital heart defects, affecting 40 of 100,000 live births.
Figure 16.19. Transposition of the great arteries. The aorta (Ao) and pulmonary artery (PA) arise abnormally from the right ventricle (RV) and left ventricle (LV), respectively. IVC, inferior vena cava; LA, left atrium; RA, right atrium; SVC, superior vena cava.
Ao
PA
RA
IVC
SVC
LA
LV
RV
77237_ch16.indd 38277237_ch16.indd 382 8/11/10 8:24:24 AM8/11/10 8:24:24 AM

Congenital Heart Disease
383
Whereas tetralogy of Fallot is the most com-mon etiology of cyanosis after infancy, TGA is the most common cause of cyanosis in the neonatal period.
The precise cause of transposition remains unknown. Historically, failure of the aortico-pulmonary septum to spiral in a normal fashion during fetal development was considered the underlying problem. It has also been suggested that the defect may be the result of abnormal growth and absorption of the subpulmonary and subaortic infundibuli during the division of the truncus arteriosus. Normally, reabsorp-tion of the subaortic infundibulum places the forming aortic valve posterior and inferior to the pulmonary valve and in continuity with the LV. In TGA, the process of infundibular reabsorption may be reversed, placing the pulmonary valve over the LV instead.
Pathophysiology
TGA separates the pulmonary and systemic circulations by placing the two circuits in parallel rather than in series. This arrange-ment forces desaturated blood from the sys-temic venous system to pass through the RV and then return to the systemic circulation through the aorta without undergoing normal oxygenation in the lungs. Similarly, oxygen-ated pulmonary venous return passes through the LV and then back through the pulmonary artery to the lungs without imparting oxygen to the systemic circulation. The result is an extremely hypoxic, cyanotic neonate. Without intervention to create mixing between the two circulations, TGA is a lethal condition.
TGA is compatible with life in utero because fl ow through the ductus arteriosus and fora-men ovale allows communication between the two circulations. Oxygenated fetal blood fl ows from the placenta through the umbilical vein to the right atrium, and then most of it trav-els into the left atrium through the foramen ovale. The oxygenated blood in the left atrium passes into the LV and is pumped out the pul-monary artery. Most of the pulmonary artery fl ow travels through the ductus arteriosus into the aorta, instead of the high-resistance pul-monary vessels, such that oxygen is provided to the developing tissues.
After birth, normal physiologic closure of the ductus and the foramen ovale elimi-nates the shunt between the parallel circula-tions and, without intervention, would result in death because oxygenated blood does not reach the systemic tissues. However, if the ductus arteriosus and foramen ovale remain patent (either naturally or with exogenous prostaglandins or surgical intervention), com-munication between the parallel circuits is maintained, and suffi ciently oxygenated blood may be provided to the brain and other vital organs.
Symptoms and Physical Examination
Infants with transposition appear blue, with the intensity of the cyanosis dependent on the degree of intermixing between the parallel cir-cuits. In most cases, generalized cyanosis is apparent on the fi rst day of life and progresses rapidly as the ductus arteriosus closes. Palpa-tion of the chest reveals a right ventricular impulse at the lower sternal border as the RV faces systemic pressures. Auscultation may re-veal an accentuated S2, which refl ects closure of the anteriorly placed aortic valve just under the chest wall. Prominent murmurs are un-common and may signal an additional defect.
Diagnostic Studies
Chest radiography is usually normal, although the base of the heart may be narrow owing to the more anterior–posterior orientation of the aorta and pulmonary artery. The ECG demonstrates right ventricular hypertrophy, refl ecting the fact that the RV is the systemic “high-pressure” pumping chamber. The de-fi nitive diagnosis of transposition can be made by echocardiography, which demonstrates the abnormal orientation of the great vessels.
Treatment
TGA is a medical emergency. Initial treatment includes maintenance of the ductus arterio-sus by prostaglandin infusion and creation of an interatrial communication using a balloon catheter (termed the Rashkind procedure). Such intervention allows adequate mixing of
77237_ch16.indd 38377237_ch16.indd 383 8/11/10 8:24:24 AM8/11/10 8:24:24 AM

Chapter 16
384
the two circulations until defi nitive correc-tive surgery can be performed. The current corrective procedure of choice is the “arterial switch” operation (Jatene procedure), which involves transection of the great vessels above the semilunar valves and origin of the coronary arteries. The great vessels are then reversed to the natural confi guration, so the aorta arises from the LV and the pulmonary artery arises from the RV. The coronary arteries are then relocated to the new aorta.
EISENMENGER SYNDROME
Eisenmenger syndrome is the condition of severe pulmonary vascular obstruction that results from chronic left-to-right shunting through a congenital cardiac defect. The el-evated pulmonary vascular resistance causes reversal of the original shunt (to the right-to-left direction) and systemic cyanosis.
The mechanism by which increased pulmo-nary fl ow causes this condition is unknown. Histologically, the pulmonary arteriolar media hypertrophies and the intima proliferates, reducing the cross-sectional area of the pul-monary vascular bed. Over time, the vessels become thrombosed, and the resistance of the pulmonary vasculature rises, causing the origi-nal left-to-right shunt to decrease. Eventually, if the resistance of the pulmonary circulation exceeds that of the systemic vasculature, the direction of shunt fl ow reverses.
With reversal of the shunt to the right-to-left direction, symptoms arise from hypoxemia, including exertional dyspnea and fatigue. Reduced hemoglobin saturation stimulates the bone marrow to produce more red blood cells (erythrocytosis), which can lead to hyper-viscosity, symptoms of which include fatigue, headaches, and stroke (caused by cerebro-vascular occlusion). Infarction or rupture of the pulmonary vessels can result in hemoptysis.
On examination, a patient with Eisen-menger syndrome appears cyanotic with digital clubbing. A prominent a wave in the jugular venous pulsation refl ects elevated right-sided pressure during atrial contraction. A loud P2 is common. The murmur of the inciting left-to-right shunt is usually absent, because the original pressure gradient across
the lesion is negated by the elevated right-heart pressures.
Chest radiography in Eisenmenger syn-drome is notable for proximal pulmonary artery dilatation with peripheral tapering. Cal-cifi cation of the pulmonary vasculature may be seen. The ECG demonstrates right ventri-cular hypertrophy and right atrial enlargement. Echocardiography with Doppler studies can usually identify the underlying cardiac defect and quantitate the pulmonary artery systolic pressure.
Treatment includes the avoidance of activi-ties that can exacerbate the right-to-left shunt. These include strenuous physical activity, high altitude, and the use of peripheral vasodilator drugs. Pregnancy is especially dangerous; the rate of spontaneous abortion is 20% to 40% and the incidence of maternal mortality is �45%. Supportive measures for Eisenmenger syndrome include prompt treatment of infec-tions, management of rhythm disturbances, and phlebotomy for patients with symptom-atic erythrocytosis.
Although there are no remedies that reverse the disease process in Eisenmenger syndrome, pulmonary vasodilator therapy can provide symptomatic relief and improve the patient’s quality of life. Effective agents include endo-thelin receptor antagonists, prostacyclin ana-logs, and phosphodiesterase inhibitors. The only effective long-term strategy for severely affected patients is lung or heart–lung trans-plantation. Fortunately, with the dramatic ad-vances that have been made in the detection and early correction of severe congenital heart defects, Eisenmenger syndrome has become less common.
SUMMARY
1. The signifi cance of congenital heart lesions can be predicted from an understanding of cardiovascular embryonic development and the transition to postnatal circulatory pathways.
2. Cardiac malformations occur in 0.8% of live births. Such lesions can be grouped into cyanotic or acyanotic defects, depend-ing on whether the abnormality results in
77237_ch16.indd 38477237_ch16.indd 384 8/11/10 8:24:25 AM8/11/10 8:24:25 AM

Congenital Heart Disease
385
pulmonary-to-systemic (right-to-left) shunt-ing of blood.
3. Acyanotic defects often result in either vol-ume overload (ASD, VSD, PDA) or pressure overload (AS, pulmonic stenosis, coarcta-tion of the aorta). Chronic volume overload resulting from a large left-to-right shunt can ultimately result in increased pulmonary vascular resistance, reversal of the direc-tion of shunt fl ow, and subsequent cyano-sis (Eisenmenger syndrome).
4. Among the most common cyanotic defects are tetralogy of Fallot and TGA.
Acknowledgments
Contributors to the previous editions of this chap-ter were Vijay G. Sankaran, MD; Yi-Bin Chen, MD; Douglas W. Green, MD; Lakshmi Halasyamani, MD; Andrew Karson, MD; Raymond Tabibiazar, MD; Michael D. Freed, MD; Richard Liberthson, MD; and David W. Brown, MD.
Additional Reading
Allen HD, Driscoll DJ, Shaddy RE, et al., eds. Moss and Adams’ Heart Disease in Infants, Children, and Adolescents. 7th ed. Baltimore, MD: Lippincott Williams & Wilkins; 2007.
Bruneau BG. The developmental genetics of con-genital heart disease. Nature. 2008;451:943–948.
Dhanantwari P, Lee E, Krishnan A, et al. Human cardiac development in the fi rst trimester. Circu-lation. 2009;120:343–351.
Keane JF, Lock JE, Fyler DC, et al., eds. Nadas’ Pediatric Cardiology. 2nd ed. Philadelphia, PA: WB Saunders; 2006.
Moore KL, Persaud TVN. The Developing Human: Clinically Oriented Embryology. 8th ed. Philadelphia, PA: WB Saunders; 2007.
Park MK. Pediatric Cardiology for Practitioners.5th ed. St. Louis, MO: Mosby; 2008.
Perloff JK. The Clinical Recognition of Congeni-tal Heart Disease. 5th ed. Philadelphia, PA: WB Saunders; 2003.
Pierpont ME, Basson CT, Benson DW Jr, et al. Genetic basis for congenital heart defects: current knowl-edge: a scientifi c statement from the American Heart Association Congenital Cardiac Defects Committee, Council on Cardiovascular Disease in the Young: endorsed by the American Academy of Pediatrics. Circulation. 2007;115:3015–3038.
Rudolph AM. Congenital Diseases of the Heart: Clinical-Physiological Considerations. 3rd ed. Chichester, UK: Wiley-Blackwell; 2009.
Sadler TW. Langman’s Medical Embryology. 11th ed. Philadelphia, PA: Lippincott Williams & Wilkins; 2009.
Warnes CA, Williams RG, Bashore TM, et al. ACC/AHA 2008 Guidelines for the management of adults with congenital heart disease: executive summary. J Am Coll Cardiol. 2008;52:1890–1947.
77237_ch16.indd 38577237_ch16.indd 385 8/11/10 8:24:25 AM8/11/10 8:24:25 AM

386
C H A P T E R
17Cardiovascular DrugsCyrus K. YaminChristopher A. MillerElliott M. AntmanGary R. StrichartzLeonard S. Lilly
INOTROPIC DRUGS AND VASOPRESSORSCardiac Glycosides (Digitalis)Sympathomimetic AminesPhosphodiesterase-3 InhibitorsVasopressin
VASODILATOR DRUGSAngiotensin-Converting Enzyme InhibitorsAngiotensin II Type 1 Receptor AntagonistsDirect-Acting VasodilatorsCalcium Channel BlockersOrganic NitratesNatriuretic PeptidesPhosphodiesterase-5 Inhibitor—Sildenafi l
ANTIADRENERGIC DRUGSCentral Adrenergic Inhibitors (CNS �2-agonists)Sympathetic Nerve-Ending AntagonistsPeripheral �-Adrenergic Receptor Antagonists�-Adrenergic Receptor Antagonists
ANTIARRHYTHMIC DRUGSClass IA AntiarrhythmicsClass IB Antiarrhythmics
Class IC AntiarrhythmicsClass II AntiarrhythmicsClass III AntiarrhythmicsClass IV AntiarrhythmicsAdenosine
DIURETICSLoop DiureticsThiazide DiureticsPotassium-Sparing Diuretics
ANTITHROMBOTIC DRUGSPlatelet InhibitorsAnticoagulant Drugs
LIPID-REGULATING DRUGSHMG CoA Reductase InhibitorsBile Acid–Binding AgentsCholesterol Absorption InhibitorsNiacinFibrates
INOTROPIC DRUGS AND VASOPRESSORS
Inotropic drugs are used to increase the force of ventricular contraction when myocardial systolic function is impaired. The pharmaco-logic agents in this category include the car-diac glycosides, sympathomimetic amines, and
This chapter reviews the physiologic basis and clinical use of cardiovascular drugs. Al-
though a multitude of drugs are available to treat cardiac disorders, these agents can be grouped by their pharmacologic actions into a small num-ber of categories. Additionally, many drugs are useful in more than one form of heart disease.
77237_ch17.indd 38677237_ch17.indd 386 8/11/10 8:25:26 AM8/11/10 8:25:26 AM

Cardiovascular Drugs
387
phosphodiesterase-3 inhibitors. Although they work through different mechanisms, they are all thought to enhance cardiac contraction by in-creasing the intracellular calcium concentration, thus augmenting actin and myosin interactions. The hemodynamic effect is to shift a depressed ventricular performance curve (Frank–Starling curve) in an upward direction (Fig. 17.1), so that for a given ventricular fi lling pressure, stroke vol-ume and cardiac output are increased.
Cardiac Glycosides (Digitalis)
The cardiac glycosides are called “digitalis” because the drugs of this class are based on extracts of the foxglove plant, Digitalis purpu-rea. The most commonly used member of this group is digoxin.
Mechanism of Action
The two desired effects of digoxin are (1) to improve contractility of the failing heart (me-chanical effect) and (2) to prolong the refrac-tory period of the atrioventricular (AV) node in patients with supraventricular arrhythmias (electrical effect).
Mechanical Effect
The action by which digoxin improves contrac-tility appears to be inhibition of the sarcolemmal Na�K�-ATPase “pump,” normally responsible for maintaining transmembrane Na� and K�
gradients. By binding to and inhibiting this pump, digitalis causes the intracellular [Na�] to rise. As shown in Figure 17.2, an increase in in-tracellular sodium content reduces Ca�� extru-sion from the cell by the Na�–Ca�� exchanger. Consequently, more Ca�� is pumped into the sarcoplasmic reticulum, and when subsequent action potentials excite the cell, a greater-than-normal amount of Ca�� is released to the myofi laments, thereby enhancing the force of contraction. The magnitude of the positive inotropic effect correlates with the degree of Na�K�-ATPase inhibition.
Electrical Effect
The major therapeutic electrical effect of digoxin occurs at the AV node, where it slows conduction velocity and increases refractoriness (Table 17.1). Digoxin has modest direct effects on the electrical properties of cardiac tissue directly, but more importantly,
Left ventricular end-diastolic pressure
Pulmonary congestion
Normal
Heart failure
Inotropictherapy
Diuretictherapy
Car
diac
Out
put
Hyp
oten
sion
Figure 17.1. Ventricular performance (Frank–Starling) curve. In heart failure, the curve is displaced downward, so that at a given left ventricular end-diastolic pressure (LVEDP), the cardiac output is lower than in a normal heart. Diuretics reduce LVEDP but do not change the position of the curve; thus, pulmonary conges-tion improves but cardiac output may fall. Inotropic drugs shift the curve upward, toward normal, so that at any LVEDP, the cardiac output is greater.
77237_ch17.indd 38777237_ch17.indd 387 8/11/10 8:25:27 AM8/11/10 8:25:27 AM

Chapter 17
388
it modifi es autonomic nervous system output by enhancing vagal tone and reducing sympathetic activity. As a result, digitalis decreases the frequency of transmission of atrial impulses through the AV node to the ventricles. This is benefi cial in reducing the rate of ventricular stimulation in patients with rapid supraventricular tachycardias such as atrial fi brillation or atrial fl utter. In addition, by enhancing the refractoriness of the AV node, digoxin may convert supraventricular reentrant arrhythmias to normal rhythm.
However, if digoxin concentrations rise into the toxic range, further enhancement of vagal tone and more extreme inhibition of the Na�K�-ATPase pump can result in adverse electrophysiologic effects. For example, in atrial and ventricular Purkinje fi bers, a high digoxin concentration has three important ac-tions that may lead to dangerous arrhythmias (Fig. 17.3):
1. Less negative resting potential. Inhibition of the Na�K�-ATPase causes the resting po-tential to become less negative. Since the Na�K�-ATPase normally removes three Na� ions from the cell in exchange for two in-
wardly moving K� ions, inhibition of the pump results in a decrease of this outward current and a resulting depolarization of the cell. Consequently, there is a voltage-dependent partial inactivation of the fast Na� channels, which leads to a slower rise of phase 0 depolarization and reduction in conduction velocity (see Fig. 1.17). The slowed conduction, if present heteroge-neously among neighboring cells, enhances the possibility of reentrant arrhythmias.
2. Decreased action potential duration. At high digitalis concentrations, the cardiac action potential shortens. This relates in part to the digitalis-induced elevated intra-cellular [Ca��], which increases the activity of a Ca��-dependent K� channel. The open-ing of this channel promotes K� effl ux and more rapid repolarization. In addition, high intracellular [Ca��] inactivates the Ca�� channels, decreasing the inward depolar-izing Ca�� current. The decrease in action potential duration and the associated short-ened refractory period increase the time during which cardiac fi bers are responsive to external stimulation, allowing greater opportunity for propagation of arrhythmic impulses.
3. Enhanced automaticity. Digoxin enhances cellular automaticity and may generate ectopic rhythms by two mechanisms:
a. The less negative membrane resting potential may induce phase 4 gradual depolarization, even in nonpacemaker cells (see Chapter 11), and an action potential is triggered each time the threshold voltage is reached.
b. The digoxin-induced increase in intracellular [Ca��] may trigger delayed afterdepolariza-tions (see Fig. 17.3). If an afterdepolariza-tion reaches the threshold voltage, an action potential (ectopic beat) is generated. Ectopic beats may lead to additional afterdepolariza-tions and self-sustaining arrhythmias such as ventricular tachycardia.
In addition, the augmented direct and in-direct vagal effects of toxic doses of digitalis slow conduction through the AV node, such that high degrees of AV block, including com-plete heart block, can occur. Thus, digoxin in
DIGITALIS
Figure 17.2. Mechanism of action of digitalis (inotropic effect). A. Digitalis inhibits the sarcolemmal Na�K�-ATPase, causing intracellular [Na�] to rise. B. Increased cytosolic [Na�] reduces the transmembrane Na� gradient; thus, the Na��Ca� exchanger drives less Ca�� out of the cell. C. The increased [Ca��] is stored in the sarcoplasmic reticulum, such that with subsequent action potentials, greater-than-normal Ca�� is released to the contractile elements in the cytoplasm, intensifying the force of contraction.
77237_ch17.indd 38877237_ch17.indd 388 8/11/10 8:25:28 AM8/11/10 8:25:28 AM

Cardiovascular Drugs
389
toxic concentrations may lead to several types of rhythm disorders (see Table 17.1).
Clinical Uses
The most common use of digoxin historically has been as an inotropic agent to treat heart failure caused by decreased ventricular contractility (see Chapter 9). Digoxin increases the force of contraction and augments cardiac output, thereby improving left ventricular emptying, reducing left ventricular size, and decreasing the elevated ventricular fi lling pressures typical of patients with systolic dysfunction. It is not benefi cial in forms of
heart failure associated with normal ventricular contractility (i.e., heart failure with preserved ejection fraction).
Once the mainstay of therapy in conges-tive heart failure (CHF), the use of digitalis has waned in the face of newer, more effec-tive therapies (as discussed later in this chap-ter; see also Chapter 9). Nonetheless, digitalis continues to be useful in treating patients with CHF complicated by atrial fi brillation (it has the added benefi t of slowing the ventricular heart rate), or when symptoms do not respond adequately to angiotensin-converting enzyme (ACE) inhibitors, �-blockers, and diuretics.
Table 17.1. Electrophysiologic Effects of Digitalis
Region Mechanism of Action Effect
Therapeutic effects AV node Vagal effect
↓ Conduction velocity↑ Effective refractory period
• ↓ Rate of transmission of atrial impulses to the ventricles in supraventricular tachyarrhythmias
• ↓ Conduction velocity and ↑ refractory period may interrupt reentrant circuits passing through the AV node
Toxic effects Sinoatrial node
Atrium
AV node
AV junction (between AV node
and His bundle)
Purkinje fi bers and ventricular muscle
↑ Vagal effect and direct suppression
Delayed afterdepolarizations (triggered activity), ↑ slope
of phase 4 depolarization (↑ automaticity)
Variable effects on conduction velocity and ↑ refractory period
(can fragment conduction and lead to reentry)
Direct and vagal-mediated conduction block
Delayed afterdepolarizations (triggered activity), ↑ slope
of phase 4 depolarization (↑ automaticity)
Delayed afterdepolarizations (triggered activity), ↓ conduction
velocity and ↑ refractory period (can lead to reentry)
↑ Slope of phase 4 depolarization (↑ automaticity)
• Sinus bradycardia• Sinoatrial block (impulse not
transmitted from SA node to atrium)
• Atrial premature beats• Nonreentrant SVT (ectopic rhythm)
• Reentrant PSVT
• AV block (fi rst, second, or third degree)
• Accelerated junctional rhythm
• Ventricular premature beats
• Ventricular tachycardia
AV, atrioventricular; PSVT, paroxysmal supraventricular tachycardia.
77237_ch17.indd 38977237_ch17.indd 389 8/11/10 8:25:29 AM8/11/10 8:25:29 AM

Chapter 17
390
Unlike ACE inhibitors and �-blockers, digoxin does not prolong the life expectancy of pa-tients with chronic heart failure, though it may improve their quality of life.
The second most common use of digoxin is as an antiarrhythmic agent in the treatment of atrial fi brillation, atrial fl utter, and parox-ysmal supraventricular tachycardia (PSVT). In atrial fi brillation and fl utter, digitalis reduces the number of impulses transmitted across the AV node, thereby slowing the ventricular rate. Digitalis may terminate reentrant supraventric-ular tachycardias, likely through enhancement of vagal tone, which slows impulse conduc-tion, prolongs the effective refractory period, and can therefore interrupt reentrant circuits that pass through the AV node.
The use of digoxin as an antiarrhythmic has become less common because other agents such as �-blockers, calcium channel blockers (CCBs), and amiodarone are often more effective.
Pharmacokinetics and Toxicity
Digoxin is excreted unchanged by the kidney. A series of loading doses is necessary to raise the drug’s concentration into the therapeu-tic range. If a loading dose is not given, the steady-state concentration is established in approximately 7 days. The maintenance dosage
depends on the patient’s ability to excrete the drug (i.e., renal function).
The potential for digitalis toxicity is sig-nifi cant because of a low toxic-to-therapeutic drug concentration ratio. Although many side effects are minor, life-threatening arrhythmias may result. Extracardiac signs of acute digitalis toxicity are often gastrointestinal (e.g., nausea, vomiting, anorexia), thought to be mediated by the action of digoxin on the area postrema of the brain stem. Cardiac toxicity includes sev-eral types of arrhythmias (see Table 17.1) that may precede extracardiac warning symptoms. The most frequently encountered rhythm dis-turbance is the development of ventricular extrasystoles. As described above, various de-grees of AV block may occur because of the direct and vagal effects on AV nodal conduc-tion. Digitalis toxicity is also a cause of non-reentrant types of supraventricular tachycardia (i.e., those caused by enhanced automaticity or delayed afterdepolarizations).
Many factors contribute to digitalis in-toxication, the most common of which is hypokalemia, often caused by the concur-rent administration of diuretics. Hypokalemia exacerbates digitalis toxicity because it further inhibits the Na�K�-ATPase pump. Other con-ditions that promote digitalis toxicity include hypomagnesemia and hypercalcemia. In ad-dition, the concurrent administration of other drugs (e.g., amiodarone) may raise the serum digoxin concentration by altering its clearance or volume of distribution.
The treatment of digitalis-induced tachyar-rhythmias includes administration of potas-sium (if hypokalemia is present) and often intravenous lidocaine (discussed later in the chapter). High-grade AV block may require temporary pacemaker therapy. In patients with severe intoxication, administration of digoxin-specifi c antibodies may be life saving.
Sympathomimetic Amines
Sympathomimetic amines are inotropic drugs that bind to cardiac �1-receptors. Stimulation of these receptors increases the activity of adenylate cyclase, causing increased formation of cyclic adenosine monophosphate (cAMP; Fig. 17.4). Increased cAMP activates protein
A
B
C
Figure 17.3. Direct effects of digitalis on the Purkinje cell action potential. The solid tracing represents depolar-ization and repolarization of a normal cell; the dashed trac-ing demonstrates the effects of digitalis. A. The maximum diastolic potential is less negative, and there is an increase in the slope of phase 4 depolarization, endowing the cell with intrinsic automaticity, and the potential for ectopic rhythms. B. Because depolarization of the cell occurs at a more positive voltage, there is partial inactivation of fast sodium channels, the rate of rise of phase 0 is decreased, and conduction velocity is slowed, which, if present het-erogeneously among neighboring cells, produces conditions for reentry. C. Delayed afterdepolarizations may develop at high concentrations of digitalis in association with the in-creased intracellular calcium concentration and can result in triggered tachyarrhythmias.
77237_ch17.indd 39077237_ch17.indd 390 8/11/10 8:25:29 AM8/11/10 8:25:29 AM

Cardiovascular Drugs
391
kinases, which promote intracellular calcium infl ux by phosphorylating L-type calcium channels. The increased calcium entry triggers a corresponding rise in Ca�� release from the sarcoplasmic reticulum, which enhances the force of contraction. Intravenous dopamine and dobutamine are commonly used sympath-omimetic amines in the treatment of acute heart failure. Norepinephrine, epinephrine, and isoproterenol are prescribed in special circumstances, as described in the following paragraphs. Table 17.2 summarizes the recep-tor actions and major hemodynamic effects of these agents.
Dopamine is an endogenous catecholamine and the precursor of norepinephrine. It pos-sesses an unusual combination of actions that makes it attractive in the treatment of heart failure associated with hypotension and poor renal perfusion. There are various types of re-ceptors with different affi nities for dopamine. At low dosages, �2 �g/kg/min, dopamine interacts primarily with dopaminergic recep-tors distributed in the renal and mesenteric vascular beds. Stimulation of these receptors causes local vasodilation and increases renal blood fl ow and glomerular fi ltration, facilitat-ing diuresis.
Adenylatecyclase
Inactiveproteinkinases
Activeproteinkinases
Myocyte
GS protein
ATPcAMP
AMP
PD
Figure 17.4. Mechanism by which �-adrenergic stimulation increases intracellular Ca��. �1-Receptor stimulation acts through G proteins (guanine nucleotide regulatory proteins) to activate adenylate cyclase. The latter increases cyclic adenosine monophos-phate (cAMP) production, which mediates protein kinase phosphorylation of cellular proteins, including ion channels. Phosphorylation of the slow Ca�� channel increases calcium infl ux. cAMP is degraded by phosphodiesterase (PD).
Table 17.2. Sympathomimetic Drug Effects
Drug
Receptor Stimulation
D1 ( ↑ Renal Perfusion)
� (Vasoconstriction)
�1 ( ↑ Contractility)
�2 (Vasodilation)
DopamineDobutamineNorepinephrineEpinephrineIsoproterenol
+a
0000
++++b
+++++++++b
0
++++++++++++++++++++
+++0++
++++
alow dosebhigh dose
77237_ch17.indd 39177237_ch17.indd 391 8/11/10 8:25:29 AM8/11/10 8:25:29 AM

Chapter 17
392
Medium dosages of dopamine, 2 to 10 �g/kg/min, increase inotropy by stimulation of cardiac �1-receptors directly and indirectly by promoting release of norepinephrine from sympathetic nerve terminals. This action in-creases heart rate, cardiac contractility, and stroke volume, all of which augment cardiac output.
At high dosages, �10 �g/kg/min, dopamine also stimulates systemic �-receptors, thereby causing vasoconstriction and elevating sys-temic resistance. High-dose dopamine is in-dicated in hypotensive states such as shock. However, these doses are inappropriate in most patients with cardiac failure because the peripheral vasoconstriction increases the resis-tance against which the heart must contract (i.e., higher afterload), further impairing left ventricular output.
The major toxicity of dopamine arises in patients who are treated with high-dose therapy. The most important side effects are acceleration of the heart rate and tachy-arrhythmias.
Dobutamine is a synthetic analog of dop-amine that stimulates �1-, �2-, and �-receptors. It increases cardiac contractility by virtue of the �1 effect but does not increase peripheral resistance because of the balance between �-mediated vasoconstriction and �2-mediated vasodilation. Thus, it is useful in the treatment of heart failure not accompanied by hypoten-sion. Unlike dopamine, dobutamine does not stimulate dopaminergic receptors (i.e., no renal vasodilating effect), nor does it facilitate the release of norepinephrine from peripheral nerve endings. Like dopamine, it is useful for short-term therapy (�1 week), after which time it loses its effi cacy, presumably because of downregulation of adrenergic receptors. The major adverse effect is the provocation of tachyarrhythmias.
Norepinephrine is an endogenous cat-echolamine synthesized from dopamine in adrenergic postganglionic nerves and in adre-nal medullary cells (where it is both a fi nal product and the precursor of epinephrine). Through its �1 activity, norepinephrine has positive inotropic and chronotropic effects. Acting at peripheral �-receptors, it is also a potent vasoconstrictor. The increase in total
peripheral resistance causes the mean arterial blood pressure to rise.
With this combination of effects, norepi-nephrine is useful in patients suffering from “warm shock,” in which the combination of cardiac contractile dysfunction and peripheral vasodilation lowers blood pressure. However, the intense vasoconstriction elicited by this drug makes it less attractive than others in treating most other cases of shock. Norepi-nephrine’s side effects include precipitation of myocardial ischemia (because of the aug-mented force of contraction and increased af-terload) and tachyarrhythmias.
Epinephrine, the predominant endoge-nous catecholamine produced in the adrenal medulla, is formed by the decarboxylation of norepinephrine. As indicated in Table 17.2, epinephrine is an agonist of �-, �1-, and �2-receptors. Administered as an intravenous infusion at low dosages, its stimulation of the �1-receptor increases ventricular con-tractility and speeds impulse generation. As a result, stroke volume, heart rate, and cardiac output increase. However, at this dosage range, �2-mediated vasodilation may reduce total peripheral resistance and blood pressure.
At higher dosages, epinephrine is a potent vasopressor because �-mediated constriction dominates over �2-mediated vasodilation. In this case, the effects of positive inotropy, positive chronotropy, and vasoconstric-tion act together to raise the arterial blood pressure.
Epinephrine is therefore used most often when the combination of inotropic and chro-notropic stimulation is desired, such as in the setting of cardiac arrest. The �-associated vasoconstriction may also help support blood pressure in that setting. The most common toxic effect is the precipitation of tachyar-rhythmias. Epinephrine should be avoided in patients receiving �-blocker therapy, because unopposed �-mediated vasoconstriction could produce signifi cant hypertension.
Isoproterenol is a synthetic epinephrine analog. Unlike norepinephrine and epineph-rine, it is a “pure” �-agonist, having activity almost exclusively at �1- and �2-receptors, with almost no �-receptor effect. In the heart,
77237_ch17.indd 39277237_ch17.indd 392 8/11/10 8:25:29 AM8/11/10 8:25:29 AM

Cardiovascular Drugs
393
isoproterenol has positive inotropic and chronotropic effects, thereby increasing car-diac output. In peripheral vessels, stimulation of �2-receptors results in vasodilation and re-duced peripheral resistance, which may cause blood pressure to fall.
Isoproterenol is sometimes used in emer-gency circumstances to increase the heart rate in patients with bradycardia or heart block (e.g., as a temporizing measure before pace-maker implantation). It may also be useful in patients with systolic dysfunction and slow heart rates with high systemic vascular re-sistance (a situation sometimes encountered after cardiac surgery in patients who had pre-viously been receiving �-blocker therapy). Isoproterenol should be avoided in patients with myocardial ischemia, in whom the in-creased heart rate and inotropic stimulation would further increase myocardial oxygen consumption.
Phosphodiesterase-3 Inhibitors
Milrinone is an example of a nondigitalis, noncatecholamine inotropic agent. It exerts its positive inotropic actions by inhibiting phosphodiesterase type 3 in cardiac myocytes (see Fig. 17.4). This inhibition reduces the breakdown of intracellular cAMP, the ultimate result of which is enhanced Ca�� entry into the cell and increased force of contraction. Additionally, in vascular smooth muscle, phosphodiesterase-induced augmentation of cAMP results in beneficial vasodilation (in vascular tissue, cAMP inhibits myosin light chain kinase and cross-bridge formation between myosin heads and actin filaments).
Milrinone is sometimes used in the treat-ment of acute heart failure when there has been insuffi cient improvement with conven-tional vasodilators, inotropic agents, and di-uretics. It has the potential for serious adverse effects, including provocation of ventricular arrhythmias, and chronic milrinone therapy is associated with increased mortality. Its use is therefore limited to hospitalized patients for short-term therapy.
Table 17.3 summarizes the actions and toxicities of commonly used inotropic drugs.
Vasopressin
Vasopressin, the endogenous antidiuretic hormone secreted by the posterior pituitary, primarily functions to maintain water balance (see Chapter 9). It also acts as a potent nonadrenergic vasoconstrictor when administered intravenously at higher-than-natural doses, by directly stimulating vascular smooth muscle V1 receptors. It has proved useful for maintaining blood pressure in patients with vasodilatory shock, as may occur in septic states. It may also be benefi cial during cardiac arrest advanced life support because it increases coronary perfusion pressure, augments blood fl ow to vital organs, and improves the likelihood of successful resuscitation in patients with ventricular fi brillation.
VASODILATOR DRUGS
Vasodilator drugs play a central role in the treatment of heart failure and hypertension. As described in Chapter 9, the fall in cardiac output in heart failure triggers important com-pensatory pathways, including the adrenergic nervous system and the renin–angiotensin–aldosterone system (see Fig. 9.9). As a re-sult of activating these pathways, two potent natural vasoconstrictors are released into the circulation: norepinephrine and angiotensin II (AII). These hormones bind to receptors in arterioles and veins, where they cause vas-cular smooth muscle contraction. Initially, such vasoconstriction is benefi cial in heart failure because it maximizes left ventricular preload (increased venous tone enhances ve-nous return) and helps to maintain systemic blood pressure (because of arterial constric-tion).
However, venous constriction may ulti-mately cause excessive venous return to the heart, with a rise in the pulmonary capillary hydrostatic pressure and development of pul-monary congestion. In addition, excessive arteriolar constriction increases the resistance against which the left ventricle must contract and therefore ultimately impedes forward car-diac output. Vasodilator therapy is directed at modulating the excessive constriction of veins and arterioles, thus reducing pulmonary
77237_ch17.indd 39377237_ch17.indd 393 8/11/10 8:25:29 AM8/11/10 8:25:29 AM

Chapter 17
394
c ongestion and augmenting forward cardiac output (see Fig. 9.10).
Vasodilators are also useful antihyperten-sive drugs. Recall from Chapter 13 that blood pressure is the product of cardiac output and total peripheral resistance (BP CO TPR). Vasodilator drugs decrease arteriolar resistance and therefore lower elevated blood pressure.
Individual vasodilator drug classes act at specifi c vascular sites (Fig. 17.5). Nitrates, for example, are primarily venodilators, whereas hy-dralazine is a pure arteriolar dilator. Some drugs, such as the ACE inhibitors, �-blockers, sodium nitroprusside, and nesiritide, are balanced vaso-dilators that act on both sides of the circulation.
Angiotensin-Converting Enzyme Inhibitors
The renin–angiotensin system plays a critical role in cardiovascular homeostasis. The major effector of this pathway (Fig. 17.6) is AII, which
is formed by the cleavage of angiotensin I by ACE. All the actions of AII known to affect blood pressure control are mediated by its bind-ing to AII receptors of the angiotensin II type 1 (AT1) subtype (see Fig. 13.6). Interaction with this receptor generates a series of intracellular reactions that causes, among other effects, va-soconstriction and the adrenal release of aldos-terone, which promotes Na� reabsorption from the distal nephron. As a result of these actions on vascular tone and sodium homeostasis, AII plays a major role in blood pressure and blood volume regulation. By blocking the formation of AII, ACE inhibitors decrease the systemic arterial pressure, facilitate natriuresis (e.g., by decreasing aldosterone production and reduc-ing Na� reabsorption from the distal nephron), and reduce adverse ventricular remodeling (see Chapter 9).
Another action of ACE inhibitors, which likely contributes to their hemodynamic
Table 17.3. Commonly Used Inotropic Drugs
Drug Mechanism of Action Major Adverse Effects
Cardiac glycosides Digoxin Inhibition of sarcolemmal
Na�K�-ATPaseEnhanced vagal tone
Gastrointestinal: nausea, vomitingCardiac: atrial, nodal, and ventricular tachyarrhythmias;
high-degree AV block
Sympathomimetic amines Dopamine
Dobutamine
Low dosage (�2 �g/kg/min): D1 receptor stimulation results
in mesenteric and renal arterial dilatation (facilitates diuresis)
Medium dosage (2–10 �g/kg/min): �1-receptor stimulation and
release of norepinephrine from sympathetic nerve terminals (inotropic effect)
High dosage (�10 �g/kg/min): �-receptor stimulation
(peripheral vasoconstriction)�1-, �2-, and �-receptor stimulation
Tachycardia, arrhythmias, hypertension
Tachyarrhythmias
Phosphodiesterase inhibitors Milrinone Increased intracellular cAMP due
to inhibition of its breakdown by phosphodiesterase
Gastrointestinal: nausea, vomitingCardiac: arrhythmias
AV, atrioventricular; cAMP, cyclic adenosine monophosphate; D1, dopamine 1.
77237_ch17.indd 39477237_ch17.indd 394 8/11/10 8:25:29 AM8/11/10 8:25:29 AM

Cardiovascular Drugs
395
effects, is related to bradykinin (BK) metabo-lism (Fig. 17.6). The natural vasodilator BK is normally degraded to inactive metabolites by ACE. Because ACE inhibitors impede that deg-radation, BK accumulates and contributes to the antihypertensive effect, likely by stimulat-ing the endothelial release of nitric oxide and biosynthesis of vasodilating prostaglandins.
Clinical Uses
Hypertension
In hypertensive patients, ACE inhibitors lower blood pressure with little change in cardiac out-put or heart rate. One might assume that because this class of drug interferes with the renin–angiotensin system, it would be effective only
Nesiritide
Arteriolar Dilators(↑Cardiac output)
Mixed VasodilatorsVenodilators
(↓Pulmonary congestion)
Figure 17.5. Examples of vasodilator drugs and their sites of action: the venous bed, the arterio-lar bed, or both. ACE, angiotensin-converting enzyme; ARB, angiotensin receptor blocker.
Figure 17.6. The renin–angiotensin system. Angiotensin-converting enzyme (ACE) generates an-giotensin II, which results in actions that include vasoconstriction, sodium retention, and increased sympathetic activity. ACE inhibitors and angiotensin II type 1 (AT1) receptor antagonists impair these effects. ACE also promotes the degradation of the natural vasodilator bradykinin; thus, ACE inhibition—but not AT1 receptor inhibition—results in accumulation of bradykinin and enhanced vasodilation.
ANGIOTENSIN-CONVERTING
ENZYME
Actions impaired by ACE inhibitoror AT1 receptor antagonist
AT1receptor
antagonistACE
inhibitor
Actions enhancedby ACE inhibitor
Vasodilation
77237_ch17.indd 39577237_ch17.indd 395 8/11/10 8:25:29 AM8/11/10 8:25:29 AM

Chapter 17
396
in patients with “high-renin” hypertension, but that is not the case. Rather, they are effective in most hypertensive patients, regardless of serum renin levels. The reason for this is not clear but may relate to the additional antihypertensive ef-fects of BK and vasodilatory prostaglandins pre-viously described. In addition, renin– angiotensin activity has been demonstrated within tissues outside the circulation, including the walls of the vasculature, where ACE inhibitors may exert a vasodilatory effect independent of the circulat-ing renin concentration.
ACE inhibitors increase renal blood fl ow, usually without altering the glomerular fi ltra-tion rate (GFR), because of dilation of both the afferent and efferent glomerular arteri-oles. Used alone, ACE inhibitors show simi-lar antihypertensive effi cacy as diuretics and �-blockers, but unlike the latter drugs, they do not adversely affect serum glucose or lipid concentrations. ACE inhibitors are often rec-ommended therapy in diabetic hypertensive patients, because the drugs slow the develop-ment of diabetic nephropathy (a syndrome of progressive renal deterioration, proteinuria, and hypertension) through favorable effects on intraglomerular pressure.
Heart Failure
In heart failure, ACE inhibitors reduce periph-eral vascular resistance (decrease afterload), reduce cardiac fi lling pressures (decrease pre-load), and increase cardiac output. The rise in cardiac output usually matches the fall in peripheral resistance such that blood pressure tends not to fall (remember, BP CO TPR), except in patients with intravascular volume depletion as might result from overly vigorous diuretic therapy. The augmented cardiac out-put reduces the drive for compensatory neuro-hormonal stimulation in CHF (see Chapter 9), such that elevated levels of norepinephrine fall. In addition, clinical trials have shown that ACE inhibitors signifi cantly improve sur-vival in patients with chronic heart failure and following myocardial infarction. Some studies have shown that ACE inhibition also reduces the risk of myocardial infarction and death in patients with chronic vascular disease, includ-ing coronary artery disease (CAD), even if left ventricular function is not impaired.
The available ACE inhibitors are listed in Table 17.4. The primary excretory pathway of most of these agents is through the kidney, so their dosages should generally be reduced in patients with renal dysfunction.
Adverse Effects
Hypotension
This is a rare side effect when ACE inhibitors are used to treat hypertension. It is more likely to occur in heart failure patients in whom in-travascular volume depletion has resulted from vigorous diuretic use. Such patients have signifi -cant activation of the renin–angiotensin system; therefore, blood pressure is largely maintained by the vasoconstricting actions of circulating AII. The administration of an ACE inhibitor in that setting may result in hypotension because of the sudden reduction of AII levels. This side effect is avoided by temporarily reducing the diuretic regimen and starting the ACE inhibitor at a low dosage.
Table 17.4. Drugs That Interfere withthe Renin–Angiotensin System
Drug Major EliminationPathway
ACE inhibitors Benazepril Renal Captopril Renal Enalapril Renal Fosinopril Hepatic/renal Lisinopril Renal Moexipril Hepatic/renal Perindopril Renal Quinapril Renal Ramipril Renal Trandolapril Hepatic/renal
Angiotensin II receptor antagonists Candesartan Hepatic/renal Eprosartan Hepatic/renal Irbesartan Hepatic/renal Losartan Hepatic/renal Olmesartan Hepatic/renal Telmisartan Hepatic Valsartan Hepatic/renal
77237_ch17.indd 39677237_ch17.indd 396 8/11/10 8:25:30 AM8/11/10 8:25:30 AM

Cardiovascular Drugs
397
Hyperkalemia
Because ACE inhibitors indirectly reduce the serum aldosterone concentration, the serum potassium concentration may rise, but only rarely into the clinically important hyper-kalemic range. Conditions that can further increase serum potassium levels and may re-sult in dangerous hyperkalemia during ACE inhibitor use include renal insuffi ciency, diabetes (owing to hyporeninemic hypoal-dosteronism, a condition often present in elderly diabetics), and concomitant use of potassium-sparing diuretics.
Renal Insuffi ciency
Administration of an ACE inhibitor to patients with intravascular volume depletion may re-sult in hypotension, decreased renal perfusion, and azotemia. Correction of volume depletion, or reduction of the ACE inhibitor dosage, usu-ally corrects this complication.
ACE inhibitor therapy can also precipitate renal failure in patients with bilateral renal artery stenosis because such patients rely on high efferent glomerular arteriolar resistance (which is highly dependent on AII) to main-tain intraglomerular pressure and fi ltration. Administering an ACE inhibitor abruptly de-creases efferent arteriolar tone and glomerular hydrostatic pressure and may therefore worsen GFR in this setting.
Cough
Irritation of the upper airways resulting in a dry cough is reported in up to 20% of patients receiving ACE inhibitor therapy. Its mechanism has not been established but may relate to the increased BK concentration provoked by ACE inhibitors. This side effect may last weeks after the drug is discontinued.
Other Effects
Very rare adverse reactions to ACE inhibitors include angioedema and agranulocytosis. ACE inhibitors should not be used in pregnancy because they have been shown to cause fetal injury.
Angiotensin II Type 1 Receptor Antagonists
AT1 receptor antagonists, also termed angio-tensin receptor blockers (ARBs), are a second group of drugs that interfere with the renin–angiotensin system. There are at least two distinct types of AII receptors: AT1 and AT2. All the actions of AII known to affect blood pressure control (e.g., vasoconstriction, aldos-terone release, renal Na� reabsorption, and sympathetic nervous system stimulation) are mediated by its binding to receptors of the AT1 subtype. The AT2 receptor subtype is abundant during fetal development and has been located in some adult tissues, but its precise actions are unknown.
ARBs compete with AII for AT1 receptors and therefore inhibit AII-mediated effects (see Fig. 17.6), thus lowering the blood pressure of hypertensive patients. ARBs provide a more substantial blockade of the renin–angiotensin system than ACE inhibitors, because the lat-ter do not completely block formation of AII (some AI is converted to AII by circulating enzymes other than ACE). Unlike ACE inhibi-tors, the AT1 receptor antagonists do not affect serum BK levels.
The available ARBs are listed in Table 17.4. Each of these is excreted primarily in the bile but most are also partly excreted in the urine. Trials have demonstrated that ARBs are as ef-fective as ACE inhibitors in treating hyperten-sion, and they are among the best tolerated antihypertensive drugs. As with ACE inhibi-tors, the blood pressure–lowering effect of ARBs is enhanced by concurrent use of a thi-azide diuretic. Also like ACE inhibitors, ARBs have the potential side effects of hypotension and hyperkalemia (owing to reduced aldoster-one levels). Unlike ACE inhibitors, ARBs typi-cally do not cause cough.
In the setting of moderate to severe heart fail-ure, ARBs display hemodynamic benefi ts simi-lar to those of ACE inhibitors (see Chapter 9). Thus, ARBs are generally recommended in heart failure for patients who are intolerant of ACEinhibitors (e.g., because of ACE inhibitor–induced cough). Studies in patients with type 2 diabetes have demonstrated that ARBs slow the progression of kidney disease, an effect that also has been demonstrated with ACE inhibitors.
77237_ch17.indd 39777237_ch17.indd 397 8/11/10 8:25:30 AM8/11/10 8:25:30 AM

Chapter 17
398
In addition to ACE inhibitors and ARBs, other antagonists of the renin–angiotensin system in the treatment of hypertension include the di-rect renin inhibitor aliskiren (see Chapter 13)and aldosterone receptor antagonists (de-scribed later in this chapter).
Direct-Acting Vasodilators
Hydralazine, minoxidil, sodium nitroprus-side, and fenoldopam are examples of direct-acting vasodilators (Table 17.5). Hydralazine and minoxidil are used primarily as long-term oral vasodilators, whereas nitroprusside and fenoldopam are administered intravenously in more acute settings.
Hydralazine is a potent and direct arterio-lar dilator that acts at the level of the precap-illary arterioles and has no effect on systemic veins. The cellular mechanism of its effect is unknown. The fall in blood pressure follow-ing arteriolar dilation results in a baroreceptor-mediated increase in sympathetic outfl ow and cardiac stimulation (e.g., refl ex tachycardia), which could precipitate myocardial ischemia in patients with underlying CAD. Therefore, hy-dralazine is often combined with a �-blocker to blunt this undesired response.
As newer drugs have emerged, hydralazine is now used only occasionally as an antihyper-tensive, often in combination with other drugs.
It is sometimes prescribed concurrently with the venodilator isosorbide dinitrate to treat heart failure in patients with systolic dysfunc-tion. This combination improves symptoms in patients with mild-to-moderate heart failure and has been shown to reduce morbidity and mortality rates (see Chapter 9).
Hydralazine possesses low bioavailability be-cause of extensive fi rst-pass hepatic metabolism. However, such metabolism depends on whether the patient displays fast or slow hepatic acetyla-tion; on average, 50% of Americans are fast and 50% are slow acetylators. Slow acetylators show less hepatic degradation, higher bioavailability, and increased antihypertensive effects, whereas fast acetylators demonstrate the opposite re-sponses. Hydralazine has a short half-life (2 to 4 hours) in the circulation, but its effect persists as long as 12 hours because the drug binds avidly to vascular tissues.
The most common side effects of hydralazine include headache (increased cerebral vasodila-tion), palpitations (refl ex tachycardia), fl ushing (increased systemic vasodilation), nausea, and anorexia. In addition, a syndrome similar to sys-temic lupus (characterized by arthralgias, myalgia, skin rashes, and fever) may develop, especially in patients who are slow acetylators.
Minoxidil also results in arteriolar vaso-dilation without signifi cant venodilation. Its mechanism of action involves an increase in
Table 17.5. Direct Vasodilators
Drug Clinical Use Route of Administration Major Adverse Effects
Hydralazine • Hypertension (chronicand acute therapy)
• CHF
Oral, intravenous bolus, intramuscular
• Hypotension, tachycardia• Headache, fl ushing• Angina• Drug-induced lupus
Minoxidil • Chronic therapy of hypertension
Oral • Refl ex tachycardia• Na� retention• Hypertrichosis
Nitroprusside • Hypertensive emergencies
• Acute CHF
Intravenous infusion • Hypotension• Cyanide and thiocyanate
toxicity
Fenoldopam • Hypertensive emergencies
Intravenous infusion • Hypotension• Increased intraocular
pressure
CHF, congestive heart failure.
77237_ch17.indd 39877237_ch17.indd 398 8/11/10 8:25:30 AM8/11/10 8:25:30 AM

Cardiovascular Drugs
399
potassium channel permeability, which results in smooth muscle cell hyperpolarization and relaxation. Like other agents that selectively cause arteriolar dilation, refl ex adrenergic stimulation leads to increased heart rate and contractility, an undesired effect that can be blunted by coadministration of a �-blocker. In addition, decreased renal perfusion often re-sults in fl uid retention, so that a diuretic usu-ally must be administered concurrently.
Minoxidil’s primary clinical indication is in the treatment of severe or intractable hyper-tension. It is especially useful in patients with renal failure who are often refractory to other antihypertensive regimens. It is well absorbed from the gastrointestinal tract and is metabo-lized primarily by hepatic glucuronidation, but approximately one fi fth is excreted unchanged by the kidney. Although it has a short half-life, its pharmacologic effects persist even after serum drug concentration falls, probably be-cause, like hydralazine, the drug binds avidly to vascular tissues.
Side effects of minoxidil, in addition to re-fl ex sympathetic stimulation and fl uid reten-tion, include hypertrichosis (excessive hair growth) and occasional pericardial effusion (unknown mechanism).
Sodium nitroprusside, a potent dilator of both arterioles and veins, is administered in-travenously to treat hypertensive emergencies and, in intensive care settings, for blood pres-sure control. It is also prescribed for preload and afterload modulation in severe CHF. So-dium nitroprusside is a complex of iron, cyanide groups, and a nitroso moiety, and its metabo-lism by red blood cells results in the liberation of nitric oxide (Fig. 17.7). Nitric oxide causes
vasodilation through activation of guanylate cy-clase in vascular smooth muscle (as described later in this chapter; see also Chapter 6).
Sodium nitroprusside’s hemodynamic ef-fects result from its ability to decrease arterial resistance and to increase venous capacitance. In patients with normal left ventricular func-tion, it can actually decrease cardiac output because of the reduction in venous return (see Fig. 9.10). However, in a patient with impaired left ventricular contractile function, the de-creased systemic resistance induced by sodium nitroprusside (i.e., decreased afterload) aug-ments forward cardiac output, while venous dilation reduces return of blood to the heart. The latter decreases pulmonary capillary hy-drostatic pressure and improves symptoms of pulmonary congestion.
Sodium nitroprusside is often the treat-ment of choice for hypertensive emergencies because of its great potency and rapid action. A �-blocker is often administered concurrently to counteract the refl ex increase in sympathetic outfl ow that may occur with this drug.
Sodium nitroprusside is administered by continuous intravenous infusion. Its onset of action begins within 30 seconds, and its peak effect is achieved in 2 minutes. Its effectiveness dissipates within minutes of its discontinuation. After sodium nitroprusside is metabolized into nitric oxide and cyanide, the liver, in the pres-ence of a sulfhydryl donor, transforms cyanide into thiocyanate; the thiocyanate, in turn, is excreted by the kidney. Thiocyanate accumula-tion and toxicity, manifested by blurred vision, tinnitus, disorientation, and/or nausea, may occur with continued use, especially in the set-ting of renal impairment. Thus, it is important
Figure 17.7. Sodium nitroprusside is a complex of iron, cyanide (CN), and a nitroso group. Erythrocyte metabolism liberates CN and the active vasodilator nitric oxide. The CN is metabolized in the liver to thiocyanate, which is eliminated by the kidneys.
77237_ch17.indd 39977237_ch17.indd 399 8/11/10 8:25:30 AM8/11/10 8:25:30 AM

Chapter 17
400
to monitor serum levels of thiocyanate if so-dium nitroprusside is administered for more than 24 hours. In addition, excessive infusion rates of sodium nitroprusside, or a defi ciency in hepatic thiosulfate stores, can result in le-thal cyanide toxicity, the early signs of which include metabolic acidosis, headache, and nau-sea, followed by loss of consciousness.
Fenoldopam is a rapidly acting potent arte-riolar vasodilator administered intravenously to treat severe hypertension. It is a selective agonist of peripheral dopamine 1 (D1) recep-tors, the activation of which results in arterio-lar vasodilation through a cAMP-dependent mechanism. Unlike other intravenous antihy-pertensive agents, it benefi cially maintains or enhances renal perfusion, and its activation of renal tubular D1 receptors facilitates natriuresis. Unlike dopamine, fenoldopam does not stimu-late �- or �-adrenergic receptors.
Fenoldopam is administered by continu-ous intravenous infusion. Its onset of action is rapid, achieving 50% of maximal effect within 15 minutes and steady state in 30 to 60 minutes. It is metabolized by the liver to inactive sub-stances that are excreted through the kidney. It has a rapid offset of action after discontinuation (an elimination half-life of �10 minutes), which is a desirable effect that minimizes the risk of excessive blood pressure reduction during the treatment of hypertensive emergencies. These pharmacologic properties also make fenoldo-pam useful for controlling hypertension in the postoperative setting. However, nitroprusside works even faster and remains more popular for this purpose. Unlike nitroprusside, fenoldopam does not cause thiocyanate toxicity. The most common side effects are headache, dizziness, and tachycardia. Fenoldopam also increases intraocular pressure (probably by slowing aqueous humor drainage) and should therefore be avoided in patients with glaucoma.
Calcium Channel Blockers
The CCBs are discussed here as a group, but differences exist among the drugs of this class. The common property of CCBs is their ability to impede the infl ux of Ca�� through mem-brane channels in cardiac and smooth muscle cells. Two principal types of voltage-gated
Ca�� channels have been identifi ed in cardiac tissue, termed L and T. The L-type channel is responsible for the Ca�� entry that maintains phase 2 of the action potential (the “plateau” in Fig. 1.14). The T-type Ca�� channel likely plays a role in the initial depolarization of nodal tissues. It is the L-type channel that is antagonized by currently available CCBs.
Mechanisms of Action
The cellular mechanism of CCBs has been partly delineated. Increased concentrations of intracellular Ca�� lead to augmented contractile force in both myocardium and vascular smooth muscle. At both sites, the net effect of Ca�� channel blockade is to decrease the amount of Ca�� available to the contractile proteins within these cells, which translates into vasodilation of vascular smooth muscle and a negative ino-tropic effect in cardiac muscle.
Vascular Smooth Muscle
Contraction of vascular smooth muscle depends on the cytoplasmic Ca�� concentration, which is regulated by the transmembrane fl ow of Ca�� through voltage-gated channels during depolar-ization. Intracellular Ca�� interacts with calmod-ulin to form a Ca��–calmodulin complex. This complex stimulates myosin light chain kinase, which phosphorylates myosin light chains and leads to cross-bridge formation between myosin heads and actin, causing smooth muscle con-traction. CCBs promote relaxation of vascular smooth muscle by inhibiting Ca�� entry through the voltage-gated channels. Other organs pos-sessing smooth muscle (including gastrointes-tinal, uterine, and bronchiolar tissues) are also susceptible to this relaxing effect.
Cardiac Cells
As described in Chapter 1, cardiac muscle also depends on Ca�� infl ux during depolarization for contractile protein interactions, but by a different mechanism than that in vascular smooth muscle. Ca�� entry into the cardiac cell during depolarization triggers additional intracellular Ca�� release from the sarcoplas-mic reticulum, leading to contraction. By
77237_ch17.indd 40077237_ch17.indd 400 8/11/10 8:25:30 AM8/11/10 8:25:30 AM

Cardiovascular Drugs
401
blocking Ca�� entry, CCBs interfere with exci-tation–contraction coupling and decrease the force of contraction. Because the pacemaker tissues of the heart (e.g., sinoatrial [SA] and AV node) are the most dependent on the in-ward Ca�� current for depolarization, one would expect that CCBs would reduce the rate of sinus fi ring and AV nodal conduction. Some, but not all, CCBs have this property (Table 17.6). The effect on cardiac conduc-tion appears to depend not only on whether the specifi c CCB reduces the inward Ca�� cur-rent, but also on whether it delays recovery of the Ca�� channel to its preactivated state. Verapamil and diltiazem have this property,
whereas nifedipine and the other dihydro-pyridine CCBs do not.
Clinical Uses
As a result of their actions on vascular smooth muscle and cardiac cells, CCBs are useful in several cardiovascular disorders through the mechanisms summarized in Table 17.7. In angina pectoris, they exert benefi cial effects by reducing myocardial oxygen consump-tion as well as by potentially increasing oxy-gen supply through coronary dilatation. The latter effect is also useful in the management of coronary artery vasospasm.
Table 17.6. Calcium Channel Blockers
Drug VasodilationNegative
Inotropic EffectSuppress AV Node
Conduction Major Adverse Effects
Verapamil + +++ +++ • Hypotension• Bradycardia, AV block• Constipation
Diltiazem ++ ++ ++ • Hypotension• Peripheral edema• Bradycardia
Dihydropyridines Amlodipine Felodipine Isradipine Nicardipine Nifedipine Nisoldipine
+++ 0 to + 0 • Hypotension• Headache, fl ushing• Peripheral edema
AV, atrioventricular
Table 17.7. Clinical Effects of Calcium Channel Blockers
Condition Mechanism
Angina pectoris ↓ Myocardial oxygen consumption ↓ Blood pressure (↓ afterload) ↓ Contractility ↓ Heart rate (verapamil and diltiazem)
↑ Myocardial oxygen supply ↑ Coronary dilatation
Coronary artery spasm Coronary artery vasodilation
Hypertension Arteriolar smooth muscle relaxation
Supraventricular arrhythmias (Verapamil and diltiazem): decrease conduction velocity and increase refractoriness of atrioventricular node
77237_ch17.indd 40177237_ch17.indd 401 8/11/10 8:25:30 AM8/11/10 8:25:30 AM

Chapter 17
402
CCBs are often used to treat hypertension. More so than �-blockers or ACE inhibitors, CCBs are particularly effective in elderly patients. Nife-dipine and the other dihydropyridines are the most potent vasodilators of this class.
CCBs are usually administered orally, and once-a-day formulations are available for these agents. Routes of excretion vary. For example, nifedipine and verapamil are eliminated primar-ily in the urine, whereas diltiazem is excreted through the liver. Common side effects (see Table 17.6) include hypotension (owing to excessive vasodilation) and ankle edema (caused by local vasodilation of peripheral vascular beds). Since verapamil and diltiazem may result in bradyar-rhythmias, they should be used with caution in patients already receiving �-blocker therapy.
The safety of short-acting CCBs has been called into question. In several observational studies, a higher incidence of myocardial infarction or death has been reported in pa-tients with hypertension or coronary disease taking such agents. In contrast, these adverse outcomes have not been demonstrated with long-acting CCBs (i.e., formulations meant for once-a-day ingestion). Thus, the long-acting versions should generally be prescribed for ex-tended use. Also, recall from Chapter 6 that �-blockers and/or nitrates are preferred over CCBs for initial therapy in patients with CAD.
Organic Nitrates
The nitrates constitute one of the oldest treat-ments of angina pectoris. They are also used in acute ischemic syndromes and in heart failure. The main physiologic action of the nitrates is vasodilation, particularly of the systemic veins.
Mechanism of Action
Nitrates produce vascular smooth muscle relax-ation. The proposed mechanism involves the conversion of the administered drug to nitric oxide at or near the plasma membrane of vascu-lar smooth muscle cells (Fig. 17.8). Nitric oxide, in turn, activates guanylate cyclase to produce cyclic guanosine monophosphate (cGMP), and the intracellular accumulation of cGMP leads to smooth muscle relaxation. This mechanism of vascular smooth muscle relaxation is similar to that associated with nitroprusside and endog-enous endothelial-derived nitric oxide.
Hemodynamic Effects and Clinical Uses
At low doses, nitroglycerin, the prototypical or-ganic nitrate, produces greater dilation of veins than of arterioles. The venodilation results in venous pooling, diminished venous return, and hence decreased right and left ventricular fi lling. Systemic arterial resistance is generally
ENDOTHELIAL-DEPENDENTVASODILATORS
(e.g., ACh, serotonin)
Figure 17.8. Organic nitrates incite vascular smooth muscle (SM) re-laxation by conversion to nitric oxide (NO) at or near the cell mem-brane. Nitroprusside and endothelial-dependent vasodilators also promote NO delivery to vascular smooth muscle and cause relaxation. In the SM, NO stimulates formation of cyclic guanosine monophosphate (cGMP), which mediates relaxation.
77237_ch17.indd 40277237_ch17.indd 402 8/11/10 8:25:30 AM8/11/10 8:25:30 AM

Cardiovascular Drugs
403
unaffected, but cardiac output may fall be-cause of the diminished preload, especially in patients with intravascular volume deple-tion (see Fig. 9.10). Arterial dilation occurs to some extent in the coronary arteries and may also occur in the facial vessels and the menin-geal arterioles, giving rise to the side effects of fl ushing and headache, respectively.
At high doses, nitrates can result in wide-spread arteriolar dilation, which may result in systemic hypotension and refl ex tachycardia. However, the increase in heart rate is not typi-cally manifest in patients with heart failure, because decreasing afterload in that situation may actually improve cardiac output and re-duce the sympathetic drive.
The major use of nitrates is in the treatment of angina pectoris through venodilation leading to reduced left ventricular preload. The smaller left ventricular size lowers ventricular wall stress and myocardial oxygen consumption, which al-leviates the oxygen imbalance in ischemic states. Nitrates are also useful in patients with coronary artery spasm (Prinzmetal variant angina) by di-lating the coronary arterioles.
Agents and Pharmacokinetics
Many formulations of nitrates are available. When the relief of acute angina is the objec-tive, rapid onset of action is essential. How-ever, in the long-term prevention of anginal attacks in a patient with chronic CAD, dura-tion of action and predictability of effect are more crucial than the speed of drug effect.
Sublingual nitroglycerin tablets or sprays are used in the treatment of acute angina at-tacks. The peak action of these agents occurs within 3 minutes, because they are rapidly absorbed into the bloodstream via the oral mucosa; their effect, however, diminishes rap-idly, falling off within 15 to 30 minutes, as the drug is deactivated in the liver. These forms of nitroglycerin are also effective when taken prophylactically, immediately before situations known by the patient to produce angina (e.g., before walking up a hill).
Long-acting nitrates are used to prevent chest discomfort in the chronic management of CAD and must be given in suffi cient dosage to saturate the liver’s deactivating capacity. For
this purpose, oral doses of sustained-release nitroglycerin, isosorbide dinitrate, or isosor-bide mononitrate are used. These agents have a duration of action of 2 to 14 hours. Trans-dermal nitroglycerin patches or nitroglycerin paste applied to the skin also deliver a sustained release of nitroglycerin. Of note, the effi cacy of long-acting nitrate therapy is attenuated by the rapid development of drug tolerance with con-tinuous use. For this reason, it is important that the dosing regimens allow a drug-free interval of several hours each day to maintain effi cacy.
Intravenous nitroglycerin is administered by continuous infusion. This form is most use-ful in the treatment of hospitalized patients with unstable angina or acute heart failure.
Adverse Effects
The most common adverse effects of the ni-trates include hypotension, refl ex tachycardia, headache, and fl ushing.
Natriuretic Peptides
As described in Chapter 9, natriuretic peptides are secreted from atrial and ventricular myo-cardium in patients with heart failure. Among their benefi cial physiologic effects, these pep-tides promote vasodilation and result in sodium and water excretion. The pharmacologic agent nesiritide (human recombinant B-type natri-uretic peptide) replicates these effects and is available for intravenous administration to hos-pitalized patients with decompensated heart failure. It results in vasodilation, augmented cardiac output, and reduction of the undesired activation of the renin–angiotensin and sympa-thetic nervous systems that are typical in heart failure. In some patients, it promotes diuresis.
Nesiritide binds to G protein–coupled re-ceptors in multiple tissues, including the blood vessels (resulting in vasodilation), kidneys, and adrenals. In the kidney, natriuresis is a conse-quence of several effects of the drug. An aug-mented GFR results from dilation of the afferent renal arterioles and constriction of the efferent renal arterioles, thereby increasing the fi ltered load of sodium. In the proximal tubule, AII-me-diated sodium uptake is inhibited. Because the proximal tubule is where the vast majority of
77237_ch17.indd 40377237_ch17.indd 403 8/11/10 8:25:30 AM8/11/10 8:25:30 AM

Chapter 17
404
sodium is reabsorbed (as described later in the chapter), this interruption in uptake results in sodium excretion. In the distal tubule, natriuretic peptides appear to further reduce sodium reab-sorption through epithelial sodium channels. In the adrenal zona glomerulosa, the drug inhibits aldosterone synthesis, which leads to enhanced sodium excretion in the distal nephron.
Despite these benefi ts, the clinical role of nesiritide is still being defi ned, because its use has not been shown to improve survival in heart failure patients and in one study was actually associated with increased mortality.
Phosphodiesterase-5 Inhibitor—Sildenafi l
Sildenafi l, a phosphodiesterase type 5 inhibi-tor used to treat erectile dysfunction, has been shown to decrease pulmonary vascular resis-tance in patients with primary pulmonary hy-pertension (PPH). It inhibits the breakdown of cGMP in the pulmonary vasculature, which enhances vasodilation and oxygenation. Other phosphodiesterase inhibitors have not been shown to be effective in PPH. When combined with nitrates, sildenafi l can cause severe hy-potension; therefore, these groups of drugs should not be prescribed concurrently.
ANTIADRENERGIC DRUGS
Drugs that interfere with the sympathetic ner-vous system act at various sites, including the central nervous system (CNS), postganglionic sympathetic nerve endings, and peripheral �- and �-receptors (Fig. 17.9).
Normally, when a sympathetic nerve is stim-ulated, norepinephrine is released, which tra-verses the synapse and stimulates postsynaptic �- and �-receptors. Norepinephrine within the synapse can also bind to presynaptic �- and �2-receptors, providing a feedback mechanism that modulates further release of the hormone. The �-receptor increases, and the �2-receptor inhib-its further, norepinephrine release.
The consequences of receptor stimulation depend on the organ involved (Table 17.8). The effect of �1-receptor stimulation on vascular smooth muscle is vasoconstriction, whereas �2 stimulation causes vasodilation. In the CNS, �2
stimulation inhibits sympathetic outfl ow to the periphery, thereby contributing to vasodilation.
Central Adrenergic Inhibitors (CNS �2-Agonists)
�2-Receptors are located in the presynaptic neurons of the CNS. When stimulated by an �2-agonist, they lead to diminished sympa-thetic outfl ow from the medulla. This action reduces peripheral vascular resistance and decreases cardiac stimulation, resulting in a fall in blood pressure and heart rate. CNS �2-agonists were once among the most com-monly used antihypertensive drugs but have largely given way to better tolerated agents. They are not suffi ciently potent to serve as vasodilators in the treatment of heart failure.
The drugs in this group are listed in Fig-ure 17.9. They are all available as oral prepa-rations, and clonidine can also be prescribed as a skin patch that is applied and left in place for 1 week at a time, facilitating drug compli-ance. Side effects of CNS �2-agonists include sedation, dry mouth, bradycardia, and, if the drug is stopped suddenly, the possibility of a sudden, paradoxical rise in blood pressure.
Sympathetic Nerve-Ending Antagonists
Reserpine was the fi rst drug found to interfere with the sympathetic nervous system. It inhib-its the uptake of norepinephrine into storage vesicles in postganglionic and central neurons, leading to norepinephrine degradation. The antihypertensive effect results from the deple-tion of catecholamines, which causes the force of myocardial contraction and total peripheral resistance to decrease.
Reserpine’s CNS toxicity represents its chief drawback. It often produces sedation and can impair concentration. The most serious poten-tial toxicity is psychotic depression. Newer, better tolerated antihypertensive agents have largely supplanted the use of reserpine and other sympathetic nerve-ending antagonists.
Peripheral �-Adrenergic Receptor Antagonists
Peripheral �-antagonists (Table 17.9) are divided into those that act on both �1- and �2-receptors,
77237_ch17.indd 40477237_ch17.indd 404 8/11/10 8:25:30 AM8/11/10 8:25:30 AM

Cardiovascular Drugs
405
and those that inhibit �1 alone. �1-Selective re-ceptor antagonists (prazosin, terazosin, dox-azosin) are occasionally prescribed in the treatment of hypertension. Their selectivity for the �1-receptor explains their ability to produce less refl ex tachycardia than nonselective agents. Normally, drug-induced vasodilation results in baroreceptor-mediated stimulation of the sympa-thetic nervous system and an undesired increase in heart rate. This effect is amplifi ed by drugs that block the presynaptic �2-receptor, because feedback inhibition of norepinephrine release is prevented. However, �1-selective agents do not block the negative feedback on the �2-receptor.
Thus, further norepinephrine release and refl ex sympathetic side effects are blunted.
Historically, the principal indication for �1-antagonists has been in the treatment of hy-pertension. However, in a large prospective, randomized trial, patients treated with the �1-antagonist doxazosin experienced more adverse cardiac outcomes than those treated with a thi-azide diuretic. Thus, �1-antagonists have fallen out of favor in the management of hypertension. Terazosin and doxazosin are mainly used today to treat the symptoms of benign prostatic hyper-plasia, because the drugs also benefi cially relax prostatic smooth muscle tone.
Alpha-methyldopa
Figure 17.9. Sites of action of the antiadrenergic drugs. Note that receptors at the sympathetic nerve-ending bind norepinephrine (NE) and provide feedback: the �-receptor stimulates, and the �2-receptor inhibits, further NE release. CNS, central nervous system.
77237_ch17.indd 40577237_ch17.indd 405 8/11/10 8:25:30 AM8/11/10 8:25:30 AM

Chapter 17
406
Phentolamine and phenoxybenzamine are nonselective �-blockers. They are used in the treatment of pheochromocytoma, a tumor that abnormally secretes catecholamines into the circulation (see Chapter 13). Otherwise, these drugs are rarely used because the �2-blockade impairs the normal feedback inhibition of nor-epinephrine release, an undesired effect, as in-dicated earlier.
�-Adrenergic Receptor Antagonists
The �-adrenergic antagonists are used for a number of cardiovascular conditions, includ-ing ischemic heart disease, hypertension, heart failure, and tachyarrhythmias.
Because catecholamines increase inotropy, chronotropy, and conduction velocity in the
heart, it follows that �-receptor antagonists decrease inotropy, slow the heart rate, and de-crease conduction velocity. When stimulation of the �-receptors is low, as in a normal resting person, the effect of blocking agents is likewise mild. However, when the sympathetic nervous system is activated (e.g., during exercise), these antagonists can substantially diminish catecholamine-mediated effects.
The �-blockers can be distinguished from one another by specifi c properties (Table 17.10): (1) the relative affi nity of the drug for �1- and �2-receptors, (2) whether partial �-agonist activity is present, (3) whether the drug also has vasodilator properties (e.g., via �1-receptor blockade), and (4) differences in pharmacokinetic properties. The goal of �1-selective agents is to achieve myocardial receptor blockade, with less effect on
Table 17.9. �-Receptor Antagonists
Mechanism/Drug Indications Major Adverse Effects
Selective peripheral �1-blockade Prazosin Terazosin Doxazosin
• Hypertension• Benign prostatic hyperplasia
• Postural hypotension• Headache, dizziness
Nonselective �-blockade Phentolamine Phenoxybenzamine
• Pheochromocytoma • Postural hypotension• Refl ex tachycardia• Arrhythmias
Table 17.8. Responses to Adrenergic Receptor Stimulation
Receptor Type Distribution Response
�1 Vascular smooth muscle (arterioles and veins) Vasoconstriction
�2 Presynaptic adrenergic nerve terminals Inhibition of NE releaseVascular smooth muscle (coronary and renal arterioles) Vasoconstriction
�1 Heart Increases heart rateIncreases contractilitySpeeds AV node conduction
Kidney (JG cells) Increases renin releasePresynaptic adrenergic nerve terminals Increases NE releaseAdipose tissue Stimulates lipolysis
�2 Vascular smooth muscle (arterioles, except skin and cerebral)
Vasodilation
Bronchial smooth muscle BronchodilationLiver Stimulates glycogenolysis
AV, atrioventricular; NE, norepinephrine.
77237_ch17.indd 40677237_ch17.indd 406 8/11/10 8:25:31 AM8/11/10 8:25:31 AM

Cardiovascular Drugs
407
bronchial and vascular smooth muscle (tissues that exhibit �2-receptors), thus producing less bronchospasm and vasoconstriction in susceptible patients. Agents with partial �-agonist effects (also termed intrinsic sympathomimetic activity) tend to slow the heart rate less than other �-blockers.
During short-term use, nonselective �-antagonists tend to reduce cardiac output be-cause they decrease heart rate and contractility as well as slightly increase peripheral resistance (via �2-receptor blockade). �-Antagonists that have partial agonist activity (such as pindolol) or those that possess some �-blocking activity (such as labetalol) can actually lower periph-eral resistance by interacting with their respec-tive �2- and �-receptors.
Clinical Uses
Ischemic Heart Disease
The benefi cial effects of �-blockers in isch-emic heart disease are related to their ability to decrease myocardial oxygen demand. They reduce the heart rate, blood pressure (after-load), and contractility. The negative inotro-pic effect is directly related to blockade of the cardiac �-receptor, which results in decreased calcium infl ux into the myocyte (see Fig. 17.4). �-Blockers also improve survival following acute myocardial infarction. Agents with intrinsic sym-pathomimetic activity are less benefi cial in this regard than �-blockers without it.
Hypertension
�-Blockers are effective antihypertensive agents. Despite their widespread use in this capacity, the mechanisms responsible for blood pres-sure lowering are not completely understood. With initial use, the antihypertensive action is thought to result from a decrease in cardiac output, in association with slowing of the heart rate and mild decrease in contractility. However, with chronic administration, other mechanisms are likely at work, including re-duced renal secretion of renin and possibly CNS effects.
Heart Failure
The negative inotropic effect of �-blockade would be expected to worsen heart failure symptoms in patients with underlying left ven-tricular systolic dysfunction. However, trials in patients with all classes of clinically stable heart failure have actually shown a survival benefi t with chronic �-blocker administration using carvedilol, metoprolol, or bisoprolol (see Chapter 9). The mechanism may relate to blunting of the cardiotoxic effects of exces-sive circulating catecholamines. Because of the potential risk of transiently worsening heart failure in tenuous patients, �-blocker therapy should be started at low dosage, augmented slowly, and carefully monitored.
Other conditions that benefi t from �-blocker therapy include tachyarrhythmias (as discussed
Table 17.10. �-Adrenergic Blockers
Activity Nonselective �-Blockers �1-Selective �-Blockers
No �-agonist activity Carvedilola
Labetalola
PropranololNadololTimolol
AtenololBetaxololBisoprololEsmololb
MetoprololNebivololc
�-Agonist activity CarteololPenbutololPindolol
Acebutolol
aAlso has �1-adrenergic–blocking properties.bAdministered intravenously only.cAlso has vasodilating properties, likely mediated by nitric oxide.
77237_ch17.indd 40777237_ch17.indd 407 8/11/10 8:25:31 AM8/11/10 8:25:31 AM

Chapter 17
408
later in the chapter) and hypertrophic cardio-myopathy (see Chapter 10).
Adverse Effects
Fatigue may occur during �-blocker therapy and is most likely a CNS side effect. �-Blockers with less lipid solubility (e.g., nadolol) do not penetrate the blood–brain barrier and may have fewer CNS adverse effects than more lipid-soluble drugs, such as propranolol. Other potential adverse effects relate to the predictable consequences of �-blockade:
1. �2-Blockade associated with use of nonse-lective agents (or large doses of �1-selective blockers) can exacerbate bronchospasm, worsening preexisting asthma or chronic obstructive lung disease.
2. The impairment of AV nodal conduction by �1-blockade can cause conduction blocks.
3. �2-Blockade can precipitate arterial va-sospasm, which can result in Raynaud phenomenon or worsen symptoms of pe-ripheral vascular disease.
4. Abrupt withdrawal of a �-antagonist after chronic use could precipitate myocardial ischemia in patients with CAD.
5. Undesirable reduction of high-density li-poprotein (HDL) cholesterol and elevation of triglycerides can occur through an un-known mechanism. This effect appears to be less pronounced with �-blockers that have partial �-agonist activity or combined �- and �-blocking properties.
6. �2-Blockade may impair recovery from hy-poglycemia in diabetics suffering an insulin reaction. In addition, �-blockers may mask the sympathetic warning signs of hypogly-cemia, such as tachycardia. If �-blockers are used in diabetics, �1-selective agents are generally preferred.
Other potential side effects include insomnia, depression, and impotence. Finally, �-antagonists should be used with caution in combination with nondihydropyridine CCBs (verapamil or diltiazem), because both types of drugs can impair myocardial contractility and AV nodal conduction, possibly precipitating heart failure or AV conduction blocks.
ANTIARRHYTHMIC DRUGS
Drug therapy is a common approach to treat cardiac tachyarrhythmias. However, antiar-rhythmic drugs are among the most dan-gerous pharmacologic agents because of potential serious adverse effects. Therefore, a thorough understanding of their mechanisms of action, indications, and toxicities is of par-ticular importance.
Although a number of classifi cation systems for these agents exist, antiarrhythmic drugs are commonly separated into four groups based on their primary electrophysiologic mechanisms of action (Table 17.11):
1. Class I drugs block the fast sodium channel responsible for phase 0 depolarization of the action potential. They are further divided into three subtypes based on the degree of sodium channel blockade and the effect of the drug on the cell’s action potential duration.
2. Class II drugs are �-adrenergic receptor an-tagonists (�-blockers).
3. Class III drugs block potassium channels responsible for repolarization, thereby pro-longing the action potential with little effect on the rise of phase 0 depolarization.
4. Class IV drugs block the L-type calcium channel.
Drugs that do not conveniently fi t into these classes (and are discussed separately) include adenosine and the digitalis glycosides.
Regardless of the class, the goal of anti-arrhythmic therapy is to abolish the mecha-nisms by which tachyarrhythmias occur (see Chapter 11). These mechanisms are (1) in-creased automaticity of pacemaker or non-pacemaker cells, (2) reentrant pathways, and (3) triggered activity.
In the case of arrhythmias caused by in-creased automaticity, treatment is aimed at lowering the maximum frequency at which car-diac action potentials can occur by (1) reduc-ing the slope of spontaneous phase 4 diastolic depolarization and/or (2) prolonging the effec-tive refractory period. These actions reduce or extinguish abnormally high rates of fi ring.
Antiarrhythmic drugs inhibit reentrant rhythms by a different mechanism. The initiation of a reentrant circuit relies on a region
77237_ch17.indd 40877237_ch17.indd 408 8/11/10 8:25:31 AM8/11/10 8:25:31 AM

Cardiovascular Drugs
409
of unidirectional block and slowed conduction (Fig. 17.10). For a reentrant rhythm to sustain itself, the length of time it takes for an impulse to propagate around the circuit must exceed the effective refractory period of the tissue. If an impulse returns to an area of myocardium that was depolarized moments earlier but has not yet recovered excitability, it cannot restimulate that tissue. Thus, one strategy to stop reentry is to lengthen the tissue’s refractory period. When the refractory period is pharmacologically
prolonged, a propagating impulse confronts inactive sodium channels, cannot conduct fur-ther, and is extinguished.
A second means to interrupt reentrant circuits is to additionally impair impulse prop-agation within the already slowed retrograde limb. This is accomplished via pharmacologic blockade of the Na� channels responsible for phase 0 depolarization. Such blockade fully abolishes the compromised impulse conduc-tion within the retrograde limb and breaks the self-sustaining loop.
The elimination of the third type of tachyarrhythmia, triggered activity, requires suppression of early and delayed after depolarizations.
An ideal pharmacologic agent would sup-press ectopic foci and interrupt reentrant loops without affecting normal conduction path-ways. Unfortunately, when the concentrations of antiarrhythmic drugs exceed their narrow therapeutic ranges, even normal electrical ac-tivity may become suppressed. In addition, most antiarrhythmic drugs have the potential to aggravate rhythm disturbances (termed
Table 17.11. Classifi cation of Antiarrhythmic Drugs
Class General Mechanism Examples
I IA
Na+ channel blockade Moderate block (↓↓ phase 0 upstroke rate; prolonged AP duration)
QuinidineProcainamideDisopyramide
IB Mild block (↓phase 0 upstroke rate; shortened AP duration) LidocaineMexiletine
IC Marked block (↓↓↓ phase 0 upstroke rate; no change in AP duration)
FlecainidePropafenone
II �-Adrenergic receptor blockade PropranololEsmololMetoprolol
III K� channel blockade (prolongation of action potential duration) AmiodaroneDronedaroneSotalolIbutilideDofetilide
IV Ca�� channel antagonists VerapamilDiltiazem
AP, action potential.
A.Prolong
refractoryperiod
B.Impair conduction
even more
Figure 17.10. Two strategies to interrupt reentry.A. Prolonging the tissue refractory period causes return-ing impulses to fi nd the tissue unexcitable. B. Further impairing conduction causes the impulse to “die out” in the slow retrograde limb of the circuit.
77237_ch17.indd 40977237_ch17.indd 409 8/11/10 8:25:31 AM8/11/10 8:25:31 AM

Chapter 17
410
proarrhythmic effect). For example, this may occur when an antiarrhythmic drug prolongs the action potential and induces early afterde-polarizations, resulting in a triggered-type of arrhythmia, such as torsades de pointes (see Chapter 12). Drug-induced proarrhythmia oc-curs most often in patients with left ventricu-lar dysfunction or in those with an increased QT interval (a sign that the action potential is already prolonged).
Class IA Antiarrhythmics
Mechanisms of Action
Effect on Reentrant Arrhythmias
Class IA agents produce moderate blockade of the fast sodium channels, thus slowing the rate of phase 0 depolarization and reducing tissue conduction velocities. If impaired suffi ciently within a reentrant circuit, the impulse will die out within the already slowed retrograde limb, aborting the rhythm. In addition, class IA agents prolong the cell’s action potential and the refractory period (largely via blockade of potassium channels responsible for repolariza-tion). Thus, an impulse traveling in the reen-trant loop encounters unexcitable tissue and is extinguished.
Effect on Arrhythmias Caused by Increased Automaticity
As shown in Figure 17.11, class IA agents raise the threshold value and, perhaps by inhibition of pacemaker channels, they depress the slope of phase 4 depolarization. As a result, it takes longer to reach threshold and fi re the action potential. These effects are most pronounced at Purkinje fi bers and abnormal ectopic pacemakers.
Effect on the Electrocardiogram
Because the conduction velocity is decreased and the action potential duration and repo-larization are prolonged, the effect of class IA agents is to mildly prolong the QRS and QT intervals (Table 17.12). At higher dos-ages, the drugs may substantially lengthen these intervals, potentially setting the stage for afterdepolarizations and drug-induced arrhythmias.
Clinical Uses
Class IA drugs are effective in treating reen-trant and ectopic supraventricular and ven-tricular tachycardias (Table 17.13). However, their use has declined because of the devel-opment of more effective and less proar-rhythmic strategies, as discussed later in the chapter.
Specifi c Class IA Drugs
Quinidine displays the electrophysiologic ef-fects inherent to class IA agents but also has anticholinergic properties that may augment conduction at the AV node, thus antagonizing its direct suppressant effect. Because quinidine is metabolized primarily by the liver, its dos-age must be reduced in patients with hepatic dysfunction.
Noncardiac and cardiac side effects occur frequently during quinidine therapy. The most common are related to the gastrointes-tinal tract, including nausea, vomiting, and diarrhea. Cinchonism refers to CNS toxicity by quinidine manifested by tinnitus, confu-sion, hearing loss, and visual disturbances. Quinidine can cause excessive prolongation of the QT interval, which may lead to the life-threatening ventricular tachyarrhythmia tor-sades de pointes, described in Chapter 12.
The electrophysiologic effects of procain-amide are similar to those of quinidine, though it does not prolong the action potential (and therefore QT interval) as much. Procainamide has mild ganglionic blocking effects that may cause peripheral vasodilation and a negative cardiac inotropic effect.
Procainamide is available for oral or parenteral administration and is primarily used when IV delivery of a class IA drug is desired. More than 50% of the drug is ex-creted unchanged in the urine; the remain-der undergoes acetylation by the liver to form N-acetyl procainamide (NAPA), which is subsequently excreted by the kidneys. In renal failure, or in patients who are rapid acetylators, high serum levels of NAPA may accumulate. NAPA shares procainamide’s ability to prolong the action potential and refractory period, but it does not alter the
77237_ch17.indd 41077237_ch17.indd 410 8/11/10 8:25:31 AM8/11/10 8:25:31 AM

Cardiovascular Drugs
411
rate of phase 4 depolarization or the slope of phase 0 upstroke of the action potential.
Noncardiac side effects of procainamide are common and include fever and rash. Approximately one third of patients develop a systemic lupus–like syndrome after 6 months of therapy, manifested by arthral-gias, rash, and connective tissue inflamma-tion. It most often occurs among patients who are slow acetylators and is reversible on cessation of drug therapy. As a result of
A
B
Figure 17.11. Electrophysiologic effects of the class I antiarrhythmic drugs. A. Effect on the Purkinje cell action potential. B. Effect on pacemaker cell action potential.
Table 17.12. Effect of Antiarrhythmic Drugson Electrocardiographic Intervals
Class PR QRS QT
IA 0 ↑ ↑IB 0 0 0 or ↓IC ↑ ↑ 0 or ↑II 0 or ↑ 0 0III 0 or ↑ 0 or ↑ ↑IV ↑ 0 0
77237_ch17.indd 41177237_ch17.indd 411 8/11/10 8:25:31 AM8/11/10 8:25:31 AM

Chapter 17
412
these side effects, procainamide is generally reserved for short-term use.
Disopyramide’s electrophysiologic and antiarrhythmic effects are similar to those of quinidine. However, disopyramide has a greater anticholinergic effect, so that common side effects include constipation, urinary re-tention, and exacerbation of glaucoma. More so than quinidine or procainamide, disopyra-mide has a pronounced negative inotropic ef-fect and must be used with caution in patients with left ventricular systolic dysfunction. However, its negative inotropic property ren-ders it a useful antiarrhythmic agent for pa-tients who have hypertrophic cardiomyopathy with dynamic outfl ow tract obstruction (see Chapter 10).
Disopyramide is administered orally. The primary excretory pathway is via the kid-neys, and toxic levels may accumulate in patients with renal insufficiency. QT pro-longation and precipitation of ventricular arrhythmias (including torsades de pointes) can occur.
Class IB Antiarrhythmics
Class IB drugs inhibit the fast sodium channel, but unlike IA agents, they typically shorten the action potential duration and the refractory pe-riod. Such shortening is attributed to blockade of small sodium currents that normally con-tinue through phase 2 of the action potential.
Class IB drugs at therapeutic concentrations do not substantially alter the electrical activ-ity of normal tissue; rather, they preferentially act on diseased or ischemic cells. Conditions present during ischemia—such as acidosis, faster rates of cell stimulation, and increased extracellular potassium concentration (and consequently a less negative diastolic mem-brane potential)—increase the ability of class IB drugs to block the sodium channel. This blockade promotes conduction block in isch-emic cells by reducing the slope of phase 0 depolarization and slowing the conduction velocity, thus inhibiting reentrant arrhythmias (see Fig. 17.11). The automaticity of ectopic pacemakers is also suppressed by decreasing phase 4 spontaneous depolarization and (in the case of some drugs of this class) by raising the threshold potential. In addition, intrave-nous lidocaine, a member of this class, sup-presses delayed afterdepolarizations.
The most common use of class IB drugs is in the suppression of ventricular arrhythmias, especially those that appear in association with ischemia or digitalis toxicity. Conversely, they have little effect on atrial tissue at thera-peutic concentrations because of the shorter action potential duration of atrial cells, which allows less time for the drug to bind and block the Na� channel. Thus, these agents are in-effective in atrial fi brillation, atrial fl utter, and supraventricular tachycardias.
Because the QT interval is not prolonged by class IB drugs, early afterdepolarizations do not occur, and torsades de pointes is not an expected complication.
Specifi c Class IB Drugs
Lidocaine is used to suppress some ventricular arrhythmias in hospitalized patients. It is admin-istered intravenously only, because oral admin-istration results in unpredictable plasma levels.
Table 17.13. Common Clinical Usesof Antiarrhythmic Drugs
Class Use
IA • Atrial fi brillation and fl utter• PSVT• Ventricular tachycardia
IB • Ventricular tachycardia• Digitalis-induced arrhythmias
IC • Atrial fi brillation and PSVT
II • Atrial or ventricular premature beats• PSVT• Atrial fi brillation and fl utter• Ventricular tachycardia
III • Ventricular tachycardia (amiodarone and sotalol)• Atrial fi brillation and fl utter• Bypass tract–mediated PSVT
IV • PSVT• Atrial fi brillation and fl utter (↓ VR)• Multifocal atrial tachycardia (↓ VR)
PSVT, paroxysmal supraventricular tachycardia (e.g., AV nodal reentrant tachycardia); VR, ventricular rate.
77237_ch17.indd 41277237_ch17.indd 412 8/11/10 8:25:32 AM8/11/10 8:25:32 AM

Cardiovascular Drugs
413
As a result of rapid distribution and hepatic me-tabolism, lidocaine must be administered as a continuous infusion following two or three load-ing boluses. The half-life of the drug depends greatly on hepatic blood fl ow. Reduced fl ow (as in heart failure or in older individuals) or intrinsic liver disease can greatly increase serum lidocaine concentrations and toxic effects; there-fore, the infusion rate should be lowered in such patients.
The most common side effects of lidocaine are not cardiac; rather, they are related to the CNS and include confusion, paresthesias, diz-ziness, and seizures. These effects are dosage related and can be prevented by monitoring serum levels of the drug or preemptively re-ducing the infusion rate when liver disease or decreased hepatic blood fl ow is suspected.
Mexiletine is structurally similar to lido-caine and shares its electrophysiologic prop-erties, but mexiletine is administered orally. Ninety percent of mexiletine is metabolized in the liver to inactive products, and the dosage of the drug should be reduced in pa-tients with hepatic dysfunction. Dose-related side effects of mexiletine are common, espe-cially of the CNS (dizziness, tremor, slurred speech) and the gastrointestinal tract (nau-sea, vomiting).
Class IC Antiarrhythmics
The class IC drugs are the most potent sodium channel blockers. They markedly decrease the upstroke of the action potential and conduction velocity in atrial, ventricular, and Purkinje fi -bers (see Fig. 17.11). Although they have little effect on the duration of the action potential or refractory period of Purkinje fi bers, they signifi -cantly prolong the refractory period within the AV node and in accessory bypass tracts.
The group IC agents were originally devel-oped to treat ventricular arrhythmias. However, that use has diminished because studies have shown an increased mortality rate in patients taking class IC drugs for ventricular ectopy fol-lowing myocardial infarction and in those who have survived cardiac arrest. In patients with underlying left ventricular dysfunction, class IC drugs can precipitate heart failure. Thus, drugs of this subclass should be avoided in patients
who have other underlying heart abnormali-ties, such as CAD or ventricular dysfunction. Class IC drugs have been shown to be bene-fi cial (and generally safe) in the treatment of supraventricular arrhythmias in patients who have otherwise structurally normal hearts (see Table 17.13).
Flecainide is well absorbed after oral ad-ministration. Approximately 40% of the drug is excreted unchanged in the urine, and the remainder is converted to inactive metabolites by the liver. Cardiac toxicities include the ag-gravation of ventricular arrhythmias and pre-cipitation of CHF in patients with underlying left ventricular dysfunction. Noncardiac side effects are referable to the CNS and include confusion, dizziness, and blurred vision.
The electrophysiologic properties of pro-pafenone are similar to those of fl ecainide, but additionally it exhibits weak �-adrenergic block-ing activity. Propafenone is metabolized by the liver, but because the level of genetic variation is high, a patient’s dosage must be titrated by observing the drug’s effect. Extra cardiac side effects are not common and include dizziness and disturbances of taste.
Class II Antiarrhythmics
The class II drugs are �-adrenergic receptor antagonists, which are used in the manage-ment of both supraventricular and ventricu-lar arrhythmias. Most of their antiarrhythmic properties can be attributed to inhibition of cardiac sympathetic activity. Additional actions of some �-blockers, such as �1-cardioselectivity or a membrane-stabilizing effect, seem to make no contribution to antiarrhythmic activity.
Chapter 11 describes how �-adrenergic stim-ulation results in a more rapid upslope of phase 4 depolarization and an increased fi ring rate of the SA node. �-Adrenergic antagonists in-hibit these effects, thus reducing automaticity (Fig. 17.12). This action extends to the cardiac Purkinje fi bers, where arrhythmias due to en-hanced automaticity are inhibited. In addition, because afterdepolarizations may be caused by excessive catecholamines, �-blockers may prevent triggered arrhythmias induced by that mechanism. �-Blockers also increase the effec-tive refractory period of the AV node.
77237_ch17.indd 41377237_ch17.indd 413 8/11/10 8:25:32 AM8/11/10 8:25:32 AM

Chapter 17
414
�-Blockers may also have a benefi cial an-tiarrhythmic effect by decreasing myocardial oxygen demand, thus reducing myocardial ischemia. Several drugs from this group have been shown to reduce mortality following myo-cardial infarction (see Chapter 7), which may in part relate to their antiarrhythmic effect. Since the AV nodal conduction time is prolonged by �-blockers, the PR interval on the ECG may be-come prolonged (see Table 17.12). The QRS and QT intervals are usually unaffected.
Clinical Uses
�-Blockers are most useful in suppressing tachyar-rhythmias induced by excessive catecholamines (e.g., during exercise or emotional stimulation). They are also frequently used to slow the ven-tricular rate in atrial fl utter and fi brillation by impairing conduction and increasing the refrac-toriness of the AV node. In addition, �-blockers may terminate reentrant supraventricular ar-rhythmias in which the AV node constitutes one limb of the reentrant pathway.
�-Blockers are effective in suppressing ven-tricular premature beats and other ventricu-lar arrhythmias, especially when induced by exercise. They are also effective in treating ventricular arrhythmias related to prolongation
of the QT interval because, unlike group IA agents, they do not lengthen that interval.
Class III Antiarrhythmics
Class III drugs are structurally dissimilar from one another but share the property of signifi -cantly prolonging the action potential of Purkinje and ventricular muscle fi bers (Fig. 17.13), pre-dominantly by blocking the outward K� current of phase 3 repolarization. Unlike class I agents, class III antiarrhythmics generally have littleeffect on phase 0 depolarization or conduction velocity.
Amiodarone is a powerful antiarrhythmic with many potential adverse reactions. Its major therapeutic effect is to prolong the action poten-tial duration and refractoriness of all cardiac re-gions. However, it also shares actions with each of the other antiarrhythmic classes. The slope of phase 0 depolarization may be depressed through sodium channel blockade (class I ef-fect), it exerts a �-blocking effect (class II), and also demonstrates weak calcium channel block-ade (class IV). As a result, the electrophysio-logic effects of amiodarone are to decrease the sinus node fi ring rate, suppress automaticity, interrupt reentrant circuits, and prolong the PR, QRS, and QT intervals on the ECG.
Phase
Figure 17.12. Electrophysiologic effects of the class II antiarrhythmic drugs on the pacemaker cell action potential.
77237_ch17.indd 41477237_ch17.indd 414 8/11/10 8:25:32 AM8/11/10 8:25:32 AM

Cardiovascular Drugs
415
In addition, amiodarone is a vasodilator (be-cause of �-receptor and calcium channel block-ing effects) and a negative inotrope (�-blocker and CCB effects). The resulting vasodilation is more prominent than the negative inotropic effect, so that cardiac output does not usually suffer in patients treated with this drug.
Amiodarone is more effective than most other antiarrhythmic drugs for a wide spec-trum of ventricular and supraventricular tach-yarrhythmias. These include atrial fi brillation, atrial fl utter, ventricular tachycardia, ventricu-lar fl utter, and supraventricular tachycardias, including those involving bypass tracts. It is a fi rst-line agent for the emergency treatment of ventricular arrhythmias during cardiac re-suscitation (including ventricular fi brillation and ventricular tachycardia refractory to elec-trical shocks) and is more effective than lido-caine for this purpose. It is commonly used to treat arrhythmias in patients with ventricular systolic dysfunction because it causes fewer proarrhythmic complications in that popula-tion than other agents. In addition, low-dose amiodarone is effective for long-term suppres-sion of atrial fi brillation and fl utter.
Amiodarone is absorbed slowly from the gastrointestinal tract, requiring 5 to 6 hours to reach peak plasma concentrations. It is highly lipophilic, is extensively sequestered in tissues, and undergoes very slow hepatic metabolism.
Its elimination half-life is long and variable, averaging 25 to 60 days. The drug is excreted by the biliary tract, lacrimal glands, and skin but not by the kidney; thus, its dosage does not need to be adjusted in patients with renal fail-ure. However, because the drug’s action has a delayed onset and very long duration, its effects cannot be altered quickly if side effects ensue.
There are numerous potential adverse re-actions of amiodarone. The most serious is pulmonary toxicity, manifest by pneumoni-tis leading to pulmonary fi brosis. Its origin is unclear but may represent a hypersensitivity reaction and, if recognized early, is reversible.
Other life-threatening side effects of amio-darone relate to cardiac toxicity: symptomatic bradycardia and aggravation of ventricular arrhythmia each occur in approximately 2% of patients. Because amiodarone signifi cantly prolongs the QT interval, early afterdepolariza-tions and torsades de pointes can occur, but this happens only rarely. Intravenously admin-istered amiodarone occasionally causes pro-nounced hypotension.
Abnormalities of thyroid function are com-mon during amiodarone treatment, because the drug contains a signifi cant iodine load and because it inhibits the peripheral conversion of T4 to T3. During the fi rst few weeks of ther-apy, it is common to observe transient abnor-malities of thyroid biochemical tests without
Figure 17.13. Electrophysiologic effects of the class III antiarrhythmic drugs on the Purkinje cell action potential.
77237_ch17.indd 41577237_ch17.indd 415 8/11/10 8:25:32 AM8/11/10 8:25:32 AM

Chapter 17
416
clinical fi ndings of thyroid disease: serum TSH and T4 rise, and serum T3 falls. Over time, some patients develop overt hypothyroidism (owing mostly to the antithyroid effects of iodine) or hyperthyroidism (because of either an iodine effect in iodine-defi cient communities or a direct thyroid infl ammatory process incited by amiodarone in susceptible patients).
Gastrointestinal side effects of amiodarone include anorexia, nausea, and elevation of liver function tests, all of which improve with lower doses of the drug. Neurologic side effects in-clude proximal muscle weakness, peripheral neuropathy, ataxia, tremors, and sleep distur-bances. Corneal microdeposits can be detected in patients receiving chronic amiodarone ther-apy, but these rarely affect vision.
As a result of these potential adverse ef-fects, ECGs, thyroid and liver function blood tests, chest radiographs, and sometimes pul-monary function studies are performed on a regular basis in patients receiving chronic ther-apy. Amiodarone interacts with, and increases the activity of, certain drugs including warfa-rin and digoxin, such that the dosages of those agents must be adjusted. Because amiodarone prolongs the QT interval, other drugs that do the same should be used with caution.
Dronedarone, a noniodinated analog of amiodarone, is a recently introduced agent for the treatment of atrial fi brillation and fl ut-ter. While it is not as potent an antiarrhyth-mic drug, it lacks amiodarone’s pulmonary, thyroid, and liver toxicities. Similar to amio-darone, it blocks potassium, sodium, and L-type calcium channels, and inhibits �- and �-adrenergic receptors. It is administered orally and reaches a steady state in 4 to 8 days, much faster than oral amiodarone. Dronedarone can increase the QT interval but only rarely results in torsades de pointes. The major side effects are gastrointestinal: nausea, vomiting, and diarrhea. Dronedarone is contraindicated in patients with advanced heart failure (NYHA class IV) and those with moderate heart failure (NYHA class II to III) and recent decompensa-tion, as increased mortality has been demon-strated with the drug’s use in such patients.
Sotalol is a nonselective �-blocker, but it is used in practice as an oral antiarrhythmic drug because of its additional class III properties. It
prolongs the duration of the action potential, increases the refractory period of atrial and ventricular tissue, and inhibits conduction in accessory bypass tracts. The phase 0 upstroke velocity is not altered in the usual dosage range. It is effective in the treatment of both supraventricular and ventricular arrhythmias.
Because sotalol is excreted exclusively by the kidneys, its dosage should be adjusted in the presence of renal disease. Potential side effects include those of the �-blockers described earlier. Because the drug prolongs the QT interval, the most serious potential adverse effect is provoking torsades de pointes. This complication occurs in approximately 2% of patients and is more com-mon in patients with a history of heart failure and in women (for unknown reasons).
Dofetilide is another oral class III agent that blocks the outward potassium current, caus-ing prolongation of the action potential dura-tion and an increase in the effective refractory period. It is used in the management of atrial fi brillation and atrial fl utter. QT prolongation complicated by torsades de pointes is the major potential adverse effect. Dofetilide is excreted by the kidney, and its dose must be adjusted in patients with renal failure.
Ibutilide is a class III drug used intrave-nously for the acute conversion of atrial fi -brillation or atrial fl utter of recent onset. This agent prolongs the action potential duration and increases atrial and ventricular refracto-riness. Unlike other class III drugs, its major mechanism relates to activation of a slow in-ward sodium current that prolongs the plateau (phase 2) of the action potential. In clinical trials, the success rate for conversion of atrial fl utter is approximately 60%, but only 30% for those in atrial fi brillation.
Because ibutilide prolongs the QT interval, torsades de pointes can be precipitated, espe-cially in patients with underlying ventricular dysfunction. Therefore, careful electrocardio-graphic monitoring is necessary for several hours after drug administration.
Class IV Antiarrhythmics
Class IV drugs exert their electrophysiologic effects by selective blockade of L-type cardiac calcium channels and include verapamil and
77237_ch17.indd 41677237_ch17.indd 416 8/11/10 8:25:32 AM8/11/10 8:25:32 AM

Cardiovascular Drugs
417
diltiazem, but not nifedipine or the other di-hydropyridine CCBs. They are most potent in tissues in which the action potential depends on calcium currents, such as the SA and AV nodes. Within nodal tissue, calcium channel blockade decreases the rate of rise of phase 0 depolarization and conduction velocity, and lengthens the refractory period of the AV node (Fig. 17.14). These agents also raise the threshold potential at the SA node. The re-sulting clinical effects are: (1) the heart rate slows; (2) transmission of rapid atrial im-pulses through the AV node to the ventricles decreases, thus slowing the ventricular rate in atrial fi brillation and atrial fl utter; and(3) reentrant rhythms traveling through the AV node may terminate.
A primary use of class IV drugs is for the treatment of reentrant supraventricular tachy-cardias (e.g., AV nodal reentrant tachycardia). At one time, intravenous verapamil was the treatment of choice for acute episodes of such rhythms, but intravenous adenosine (described in the next section) has assumed that role.
The pharmacology and toxicities of CCBs were presented earlier in this chapter. The most important side effect of verapamil and diltiazem, when administered intravenously, is hypotension. In addition, these agents
should be avoided, or used cautiously, in pa-tients receiving �-blocker therapy, because the combined negative inotropic and chronotropic effects may precipitate heart failure and/or sig-nifi cant bradycardia.
Adenosine
Adenosine is an endogenous nucleoside with a very short half-life. Administered intrave-nously, it is the most effective drug for the rapid termination of reentrant SVT, such as AV nodal reentrant tachycardia.
Adenosine has substantial electrophysio-logic effects on specialized conduction tissues, especially the SA and AV nodes. By binding to specifi c adenosine receptors, it activates po-tassium channels (Fig. 17.15). The resultant increase in the outward potassium current hy-perpolarizes the membrane, which suppresses spontaneous depolarization of the SA node and slows conduction through the AV node. In addition, adenosine decreases the intracellular cAMP concentration by inhibiting adenylate cyclase. The result is a decrease in the inward pacemaker current (If) and the inward calcium current (see Fig. 17.15). Thus, the net effect of adenosine is to slow the SA node fi ring rate and to decrease AV nodal conduction. By
↑Threshold potential of SA node ↓Heart rate
Figure 17.14. Electrophysiologic effects of the class IV antiarrhythmic drugs on the pacemaker cell action potential.
77237_ch17.indd 41777237_ch17.indd 417 8/11/10 8:25:32 AM8/11/10 8:25:32 AM

Chapter 17
418
inducing transient AV nodal block, adenosine terminates reentrant pathways that include the AV node as part of the circuit. Ventricular myo-cytes are relatively immune to these effects, in part because the specifi c potassium chan-nels responsive to adenosine are not present in those cells.
With a half-life of only 10 seconds, adenos-ine has very transient side effects (headache, chest pain, fl ushing, bronchoconstriction). Because methylxanthines (caffeine, theophyl-line) competitively antagonize the adenosine receptor, higher doses of adenosine may be necessary in patients using those substances. Conversely, dipyridamole inhibits the break-down of adenosine and amplifi es its effect.
DIURETICS
Diuretics are most often used to treat heart failure and hypertension. In heart failure, enhanced renal reabsorption of sodium and water, with subsequent expansion of the ex-tracellular volume, contributes to peripheral edema and pulmonary congestion. Diuretics eliminate excess sodium and water through
renal excretion and are therefore a cornerstone of therapy (see Chapter 9). In the treatment of hypertension, diuretics similarly reduce intra-vascular volume and in some cases promote vascular dilatation. To better understand these intended functions of diuretics, the section be-gins with a brief review of normal renal trans-port of sodium and water.
In the kidney, the rate of glomerular fi ltra-tion typically averages 135 to 180 L/day in normal adults. Most of the fi ltered Na� is re-absorbed by the renal tubules, leaving only a small quantity in the fi nal urine (Fig. 17.16). Approximately 65% to 70% of the fi ltered Na� is reabsorbed isosmotically in the proximal tu-bule by active transport. In the thick ascending limb of the loop of Henle, an additional 25% of the fi ltered sodium is reabsorbed, through a Na�–K� cotransport system coupled to the uptake of two Cl� ions. Because this region is impermeable to the reabsorption of water, it is the site of hypotonic tubular fl uid formation, and the surrounding interstitium becomes hy-pertonic. In the distal convoluted tubule, an additional small fraction of NaCl is reabsorbed (approximately 5%). In the cortical collecting
Figure 17.15. Mechanism of antiarrhythmic action of adenosine. Stimulation of the myo-cyte adenosine receptor activates potassium channels, and the resultant outward K� current hyperpolarizes the membrane, resulting in decreased automaticity. Adenosine also inhibits membrane adenylate cyclase activity. The subsequent decline in cAMP has two pertinent effects: the inward pacemaker current (If) is diminished and the production of active protein kinases is lessened, leading to a reduction of the inward Ca�� current. These effects contribute to decreased automaticity and slowed conduction through the AV node. Xanthines compete for the receptor, blocking adenosine’s effects. Conversely, dipyridamole interferes with cellular uptake and degradation of adenosine and therefore amplifi es its effect.
G proteins
ADENOSINE DIPYRIDAMOLE
XANTHINES
Adenylatecyclase
ATPcAMP (↓)
Inactiveproteinkinases
Activeproteinkinases (↓)
Myocyte
Adenosinereceptor
K+
If
77237_ch17.indd 41877237_ch17.indd 418 8/11/10 8:25:32 AM8/11/10 8:25:32 AM

Cardiovascular Drugs
419
duct, Na� permeability is modulated by analdosterone-sensitive mechanism, such that Na� is reabsorbed into the tubular cells in the presence of aldosterone, creating a lumen-negative potential difference that enhances K� and H� excretion. Approximately 1% to 2% of sodium reabsorption takes place at this location.
Most of the distal tubule is impermeable to water. In the collecting tubule, however, water permeability and reabsorption are promoted by antidiuretic hormone and driven by the osmotic gradient between the tubule and the hypertonic interstitium. Therefore, substances that interfere with antidiuretic hormone, such as ethanol, have diuretic actions.
The three most commonly used groups of di-uretics are loop diuretics, thiazide diuretics, and potassium-sparing diuretics (Table 17.14 and Fig. 17.16). These classes are distinguished by the site of the kidney tubule where they act and by their potency. Loop diuretics impair absorp-tion in the thick ascending limb of the loop of Henle, thiazide diuretics act on the distal tubule and collecting segment, and potassium-sparing
diuretics act on the aldosterone-sensitive region of the cortical collecting tubule. Members of a fourth group, the carbonic anhydrase inhibitors, are weak diuretics rarely used in the treatment of hypertension or heart failure. They act at the proximal convoluted tubule, resulting in a loss of bicarbonate (and sodium) in the urine.
Loop Diuretics
These agents are so named because they act principally on the thick ascending limb of the loop of Henle. They are powerful diuretics that result in the excretion of 20% to 25% of the fi ltered Na� load through inhibition of the Na�–2Cl�–K� cotransport system. Because in-hibition at this site impairs the generation of a hypertonic interstitium, the gradient for pas-sive water movement out of the collecting duct is diminished and water diuresis results.
Loop diuretics are of great importance in the acute management of pulmonary edema (ad-ministered intravenously) and in the treatment of chronic heart failure or peripheral edema
Carbonicanhydraseinhibitors
Loopdiuretics
Thiazides
K++-sparing
diuretics
Figure 17.16. Schematic diagram of the renal tubules. Approximately 70% of fi ltered sodium is reabsorbed in the proximal convoluted tubule, 25% in the thick ascending limb of the loop of Henle, 5% in the distal convoluted tubule, and 1% to 2% in the cortical collecting tubule (mediated by the action of aldosterone). Antidiuretic hormone (ADH) increases the permeability of the distal nephron for water. Diuretics are secreted into the proximal convoluted tubule and act at the sites shown.
77237_ch17.indd 41977237_ch17.indd 419 8/11/10 8:25:32 AM8/11/10 8:25:32 AM

Chapter 17
420
(taken orally). Unlike other diuretics, they tend to be effective in the setting of impaired renal function. In addition to the diuretic effect, and even preceding it, drugs of this class may induce venous vasodilation, which is also benefi cial in reducing venous return to the heart and pulmo-nary congestion (see Chapter 9). The mecha-nism of venous vasodilation appears to involve drug-induced prostaglandin and nitric oxide gen-eration from endothelial cells, which act to relax vascular smooth muscle (see Chapter 6).
The most common side effects of the loop diuretics are intravascular volume deple-tion, hypokalemia, and metabolic alkalosis. Hypokalemia arises because (1) these agents impair the reabsorption of sodium in the loop of Henle, such that an increased amount of Na� is delivered to the distal tubule, where it prompts greater-than-normal exchange for potassium (and therefore more K� excretion
into the urine) and (2) diuretic-induced intra-vascular volume depletion activates the renin–angiotensin system. The subsequent rise in aldosterone promotes additional Na�–K�
exchange.Metabolic alkalosis during loop diuretic
therapy results from two mechanisms: (1) in-creased H� secretion into the distal tubule (and therefore into the urine) due to the secondary hyperaldosteronism described earlier and (2) contraction alkalosis, in which reduced intra-vascular volume promotes increased sodium bicarbonate reabsorption by the proximal tu-bule (see Fig. 17.16).
Additional side effects may also occur dur-ing continued loop diuretic therapy. Hypo-magnesemia may result, because magnesium reabsorption depends on NaCl transport in the thick ascending limb of the loop of Henle, the action blocked by these drugs. Ototoxicity
Table 17.14. Commonly Used Diuretics
DiureticMethod of
AdministrationOnset of Action
(Hours)Duration of
Action (Hours)Potential Adverse
Effects
Thiazides Chlorothiazide
Hydrochlorothiazide Chlorthalidone Metolazone Indapamide
POIVPOPOPOPO
10.25
221
1–2
6–1221224
12–2416–36
Hypokalemia, hypomagnesemia, hyponatremia, hypercalcemia, hyperglycemia, hyperuricemia, hypercholesterolemia, hypertriglyceridemia, metabolic alkalosis
Loop diuretics Furosemide
Bumetanide
Torsemide
Ethacrynic acid
POIVPOIVPOIVIV
15 minutes
0.5–10.25<1
10 minutes0.25
62
4–60.5–16–86–83
Hypotension, hypokalemia, hypomagnesemia, hyperglycemia, hyperuricemia, metabolic alkalosis
K�-sparing diuretics Spironolactone Eplerenone Triamterene Amiloride
POPOPOPO
>24>2422
2–3 days24
12–1624
Hyperkalemia, GI disturbances; gynecomastia (spironolactone only)
GI, gastrointestinal; IV, intravenous; PO, by mouth.
77237_ch17.indd 42077237_ch17.indd 420 8/11/10 8:25:32 AM8/11/10 8:25:32 AM

Cardiovascular Drugs
421
(cranial nerve VIII toxicity) occasionally de-velops, impairing hearing and vestibular func-tion. It is thought to arise from electrolyte disturbances of the endolymphatic system, most likely because of Na�–2Cl�–K� cotrans-port inhibition by the diuretic at that site.
The most commonly used loop diuretic is furosemide, the oral form of which demon-strates reliable gastrointestinal absorption but a short duration of action (4 to 6 hours) that limits its usefulness in the chronic treatment of hypertension. Bumetanide is similar to fu-rosemide and shares its actions and adverse effects but has greater potency and bioavail-ability. It also appears to have a lower inci-dence of ototoxicity than the other drugs of this class. Bumetanide is sometimes useful in heart failure patients when edema is refractory to other agents and in some patients allergic to furosemide. Torsemide is also similar to fu-rosemide, with more complete bioavailability. Ethacrynic acid is the only nonsulfonamide loop diuretic, so it can be prescribed to patients with sulfonamide intolerance. It is otherwise not widely used because of its high incidence of ototoxicity.
Thiazide Diuretics
Thiazides and related compounds (chlortha-lidone, indapamide, and metolazone) are commonly used diuretics because they dem-onstrate excellent gastrointestinal absorption when administered orally and are usually well tolerated. Though less potent than the loop di-uretics, their sustained action makes them use-ful in chronic conditions such as hypertension and mild CHF.
Thiazides act at the distal tubule, where they block the reabsorption of approximately 3% to 5% of the fi ltered sodium (see Fig. 17.16). Na� reabsorption at this site is medi-ated through a Na�–Cl� cotransporter on the luminal membrane. The thiazides inhibit this carrier by a mechanism that has not been elucidated but may involve competition for the Cl� site. The antihypertensive effect is initially associated with a decrease in cardiac output due to reduced intravascular volume with unchanged peripheral resistance. With long-term thiazide use, however, cardiac out-
put often returns to normal as vasodilation leads to a reduction in vascular resistance. Indapamide is unique among this class in that it displays a particularly prominent va-sodilating effect.
Thiazides are typically administered orally. Diuresis occurs after 1 to 2 hours, but the full antihypertensive effect of continued therapy may not emerge for up to 12 weeks (possibly related to the vasodilator mecha-nism alluded to in the previous paragraph). Chlorothiazide, the parent compound, has low lipid solubility and hence low bioavail-ability: higher doses are therefore required to achieve therapeutic levels compared with the more commonly used hydrochlorothiaz-ide. Chlorthalidone is slowly absorbed and hence has a long duration of action. Meto-lazone, unlike other drugs of this class, is sometimes effective in patients with reduced renal function.
Clinically, the thiazides differ from the loop diuretics in that they are less potent, have a longer duration of action, and (with the excep-tion of metolazone) demonstrate poor diuretic effi cacy in the setting of impaired renal func-tion: generally, they are not effective when the GFR is �25 mL/min.
Thiazides serve as a cornerstone of antihy-pertensive therapy because of their low cost, effectiveness, and proven benefi ts in reducing the risk of stroke and cardiac events. They are sometimes used in heart failure, generally for patients with mild chronic congestive symp-toms. In addition, they can be added to loop diuretic therapy for patients who have become refractory to the diuretic effect of the latter. Since they act on sequential segments of the renal tubule, the combination produces a more profound natriuretic effect than either agent used alone.
Among the most important potential ad-verse effects of thiazides are (1) hypokalemia and metabolic alkalosis, which result from increased Na� delivery to the distal tubule, where exchange for K� and H� takes place, and from volume contraction and secondary hyperaldosteronism, as previously described for the loop diuretics; (2) hyponatremia, dur-ing prolonged treatment because of continued Na� excretion in the setting of chronic free
77237_ch17.indd 42177237_ch17.indd 421 8/11/10 8:25:33 AM8/11/10 8:25:33 AM

Chapter 17
422
water consumption; (3) hyperuricemia (and possible precipitation of gout) owing to de-creased clearance of uric acid; (4) hypergly-cemia, because of either impaired pancreatic insulin release or decreased peripheral glucose utilization; (5) alterations in serum lipids (at least transiently), characterized by increased low-density lipoprotein (LDL) cholesterol and triglycerides; and (6) weakness, fatigability, and paresthesias, which can occur with long-term use because of volume depletion and hy-pokalemia. In addition, serum calcium levels often rise slightly during thiazide therapy, but this is rarely clinically signifi cant.
Potassium-Sparing Diuretics
These are relatively weak diuretics that an-tagonize physiologic Na� reabsorption at the distal convoluted tubule and cortical collect-ing tubule. Potassium-sparing agents reduce K� excretion; thus, unlike other diuretics, hy-pokalemia is not a side effect. They are used when maintenance of serum potassium levels is crucial and in states characterized by aldos-terone excess (e.g., primary or secondary hy-peraldosteronism). Two types of drugs make up this group: (1) aldosterone antagonists (e.g., spironolactone and eplerenone) and(2) direct inhibitors of Na� permeability in the collecting duct, which act independently of al-dosterone (e.g., triamterene and amiloride).
Na� and K� exchange in the collecting tu-bules accounts for only a small percentage of sodium reuptake, so diuretic effectiveness is modest when these agents are used alone. They are often used in combination with the loop or thiazide classes for additive diuretic ef-fect and to prevent hypokalemia.
Spironolactone is a synthetic steroid that competes for the cytoplasmic aldosterone receptor, thereby inhibiting the aldosterone-sensitive Na� channel in the kidney. Because Na� reabsorption through the sodium chan-nel is inhibited, no lumen-negative potential exists to drive K� and H� ion excretion at the distal nephron sites; thus, K� and H� ions are retained in the circulation. Spironolactone also displays benefi cial cardiac antiremodel-ing effects in patients with heart failure (see Chapter 9). In a trial of patients with severe
heart failure, spironolactone (added to an ACE inhibitor and a loop diuretic) improved heart failure symptoms and reduced mortal-ity rates.
The most serious potential complication of spironolactone is hyperkalemia, result-ing from the impaired excretion of that ion. Thus, caution should be observed when ad-ministering K� supplements, ACE inhibitors, or ARBs concurrently with potassium-sparing diuretics because they could contribute to this complication. Spironolactone also displays antiandrogenic activity that may produce gynecomastia in men and menstrual irregu-larities in women.
Eplerenone is a more specifi c inhibitor of the aldosterone receptor that does not have the systemic antiandrogenic effects of spironolactone. Like spironolactone, it is used in the treatment of hypertension and chronic systolic heart failure. In patients with clini-cal evidence of heart failure following a myo-cardial infarction, eplerenone has also been shown to improve survival when added to usual care.
Triamterene and amiloride are structur-ally related potassium-sparing diuretics that act independently of aldosterone. At the distal tubules, they inhibit the reabsorption of Na�, which subsequently diminishes the excretion of K� and H�. Triamterene is metabolized by the liver, and its active product is secreted into the proximal tubule by the organic cat-ion transport system. Amiloride is secreted directly into the proximal tubule and appears unchanged in the urine. As with spironolac-tone, the most important potential adverse effect of these drugs is hyperkalemia.
ANTITHROMBOTIC DRUGS
Platelets and the coagulation proteins play a key role in the pathogenesis of many car-diovascular disorders, including acute coro-nary syndromes, deep venous thrombosis, and thrombi that may complicate atrial fibrillation, dilated cardiomyopathy, or me-chanical prosthetic heart valves. Therefore, the modulation of platelet function and of the coagulation pathway is often critically important in cardiovascular therapeutics.
77237_ch17.indd 42277237_ch17.indd 422 8/11/10 8:25:33 AM8/11/10 8:25:33 AM

Cardiovascular Drugs
423
The formation of a thrombus, whether in normal hemostasis or in pathologic clot for-mation, requires three events: (1) exposure of circulating blood elements to thrombogenic material (e.g., unmasking of subendothelial collagen after atherosclerotic plaque rupture); (2) activation and aggregation of platelets; and (3) triggering of the coagulation cascade, ultimately resulting in a fi brin clot. Hemosta-sis effected by platelets and the coagulation system is closely interlinked: activated plate-lets accelerate the coagulation pathway, and certain coagulation proteins (e.g., thrombin) contribute to platelet aggregation.
This section focuses fi rst on drugs that in-terfere with platelet function and then on those that inhibit the coagulation cascade. Fibrin-olytic agents, which dissolve clots that have already formed, are described in Chapter 7.
Platelet Inhibitors
Platelets are responsible for primary hemosta-sis by a three-part process: (1) adhesion to the site of injury, (2) release reaction (secretion of platelet products and activation of key surface receptors), and (3) aggregation. For example, following blood vessel injury, platelets quickly adhere to exposed subendothelial collagen by means of membrane glycoprotein (GP) recep-tors, a process that depends on von Wille-brand factor. Following adhesion to the vessel wall, platelets release the preformed contents of their granules in response to agonists (in-cluding collagen and thrombin) that bind to platelet receptors. Among these prepackaged substances are adenosine diphosphate (ADP), serotonin, fi brinogen, growth factors, and pro-coagulants. Concurrently within the activated platelet, there is de novo synthesis and secre-tion of thromboxane A2 (TXA2), a powerful va-soconstrictor (Fig. 17.17).
Certain agonists, including ADP, throm-bin, and TXA2, stimulate platelets to aggre-gate and form the primary hemostatic plug as additional platelets are recruited from the circulation. During this process, the platelet membrane GP IIb/IIIa receptors undergo a critical conformational change. This altera-tion allows the previously inactive GP IIb/IIIa receptor to bind fi brinogen molecules, an
action that tightly links platelets to one an-other and constitutes the fi nal common path-way of platelet aggregation. The developing clump of platelets is stabilized and tethered to the site of injury by a mesh of fi brin, which is produced by the simultaneous activation of the coagulation protein cascade.
Platelet activation is regulated to a great ex-tent by release of stored Ca�� from the plate-let-dense tubular system. This action results in an increase in cytosolic calcium concentra-tion, with activation of protein kinases and phosphorylation of intraplatelet regulatory proteins. The augmented cytosolic Ca�� also stimulates phospholipase A2 (PLA2), causing the release of arachidonic acid, the precursor of TXA2 (see Fig. 17.17).
The critical release of calcium is modu-lated by several factors. Acting at their respec-tive platelet membrane receptors, thrombin and other agonists generate intermediaries that stimulate the release of calcium from the dense tubules. TXA2 increases the intracellular Ca�� by binding to its platelet receptor, which inhibits the activity of adenylate cyclase and thereby reduces cAMP formation, an action that augments the release of Ca�� from the dense tubules (see Fig. 17.17). Conversely, en-dothelial cell-derived prostacyclin (PGI2) stim-ulates adenylate cyclase activity and increases platelet cAMP concentration, which inhibits Ca�� release from the dense tubular system.
Antiplatelet drugs interfere with platelet function at various points along the sequence of activation and aggregation (see Fig. 17.17). The most commonly used antiplatelet drug is aspirin, but the roles of newer antiplate-let drugs, especially the thienopyridines and GP IIb/IIIa receptor antagonists, have rapidlyexpanded.
Aspirin
As described in the previous section, TXA2 is an important mediator of platelet activation and clot formation. Aspirin (acetylsalicylic acid) acts by irreversibly acetylating (and thus blocking the action of) cyclooxygenase, an enzyme essential to TXA2 production from arachidonic acid (see Fig. 17.17). Theform of the enzyme found in platelets is
77237_ch17.indd 42377237_ch17.indd 423 8/11/10 8:25:33 AM8/11/10 8:25:33 AM

Chapter 17
424
cyclooxygenase 1 (COX-1), which is effectively inhibited by the nonselective action of aspirin (but it is not inhibited by selective COX-2 antagonists, such as celecoxib). Because platelets lack nuclei and therefore cannot synthesize new proteins (including cyclooxygenase), aspirin permanently disables TXA2 production in exposed cells.
The prostaglandin PGI2, a major antagonist of TXA2 that is produced by endothelial cells, shares a dependency on cyclooxygenase activ-ity for its formation, and aspirin, at high doses, impairs its synthesis as well. Unlike platelets, however, endothelial cells are able to gener-ate new cyclooxygenase to replace what has been deactivated by acetylation. Thus, when used at low doses, aspirin effectively inhibits
platelet TXA2 synthesis without signifi cantly interfering with the presence and benefi cial actions of PGI2.
Because the antiplatelet effect of aspirin is limited to inhibition of TXA2 formation, plate-let aggregation induced by other factors (e.g., ADP) is not signifi cantly impeded. Thus, aspi-rin is not a “complete” antithrombotic agent.
Clinical Uses
Aspirin has many proven clinical benefi ts in pa-tients with cardiovascular disease (Table 17.15). In individuals with unstable angina, acute myo-cardial infarction, or a history of myocardial in-farction, aspirin reduces the incidence of future fatal and nonfatal coronary events. Similarly, in
PLA2
Arachidonicacid
ATPcAMP IP3
Granulesecretion Cytoskeletal
reorganization
Activation ofglycoprotein
IIb/IIIareceptor
DENSETUBULES
Cyclooxygenase
PLATELETACTIVATION
TXA2
PLC PIP2
ADP ThrombinSerotoninProstacyclin TXA2
Gs Gi Gi
P2Y12 P2Y1AC
Ca++Ca++
– +
–+
GP IIb/IIIaRECEPTOR
ANTAGONISTS(prevent fibrinogen
binding)
ASPIRIN
–
THIENOPYRIDINES
–
DIPYRIDAMOLE+
–
Figure 17.17. Platelet activation is mediated by cytosolic Ca��. Factors that promote and inhibit calcium release from the platelet-dense tubules are shown. Thrombin and serotonin, acting at their specifi c receptors, stimulate the formation of inositol triphosphate (IP3) from phosphatidylinositol diphosphate (PIP2) by phospholipase C (PLC). IP3 subsequently enhances the intracellular release of calcium. Thromboxane A2 (TXA2) also facilitates calcium release. It inhibits adenyl cyclase (AC) and reduces cyclic adenosine monophosphate (cAMP) formation. Because cAMP normally prevents Ca�� release from the dense tubules, the reduction of this effect by TXA2 increases Ca�� release into the cytosol. Conversely, endothelial-derived prostacyclin has the opposite effect. It reduces intraplatelet calcium release because it stimulates AC activity and cAMP formation. ADP also stimulates calcium release via its two receptors (see text for details). Calcium promotes the action of phospholipase A2 (PLA2), which generates the precursors of TXA2 from the cell membrane. Plate-let activation modulated by [Ca��] ultimately results in granule secretion, cytoskeletal reorganization, and the critical conformational change in glycoprotein IIb/IIIa receptors that is necessary for platelet aggregation. The sites of action of commonly used antiplatelet drugs are shown in color.
77237_ch17.indd 42477237_ch17.indd 424 8/11/10 8:25:33 AM8/11/10 8:25:33 AM

Cardiovascular Drugs
425
patients with chronic stable angina without a history of myocardial infarction, aspirin less-ens the occurrence of subsequent myocardial infarction and mortality. In patients who have suffered a minor stroke or transient cerebral ischemic attack, aspirin reduces the rate of future stroke and cardiovascular events. Addi-tionally, aspirin lowers the likelihood of graft occlusion in patients who have undergone coronary artery bypass surgery.
Less clear is the benefi t of aspirin for pri-mary prevention (i.e., in individuals without a history of cardiovascular events or symp-toms). When tested in a large cohort of healthy American middle-aged men, aspirin was as-sociated with a reduced incidence of nonfatal myocardial infarction but an increased rate of nonfatal hemorrhagic stroke and gastroin-testinal bleeding; there was no effect on total vascular mortality. Subsequent meta-analyses
of clinical trials have similarly concluded that aspirin is effective for primary prevention of myocardial infarction in patients with coro-nary risk factors, but it also increases the risk of hemorrhagic stroke. In the prospective, pri-mary prevention trial known as the Women’s Health Initiative, aspirin lowered the risk of ischemic stroke in women but did not reduce the incidence of MI or death from cardiovascu-lar disease. Thus, whereas aspirin plays an ex-tremely important role in patients with known cardiovascular disease, it is not evident that otherwise healthy people should routinely take aspirin for “ cardiovascular protection.”
Current recommendations are that aspirin (at a dosage of 75 to 325 mg/day) be admin-istered to patients with clinical manifestations of coronary disease in the absence of contrain-dications (i.e., aspirin allergy or complications described in the next section). It should not
Table 17.15. Cardiovascular Uses of Antithrombotic Drugs
DrugChronic Angina
Unstable Angina/NSTEMI STEMI DVT
Mechanical Heart Valve
Atrial Fibrillation PCI HIT
Platelet inhibitors Aspirin + + + (1) (2) + Thienopyridines + + (3) GP IIb/IIIa antagonists
+ (4) +
Dipyridamole (5)
Anticoagulants UFH + + + (6) (6) + LMWH + + + Direct thrombin inhibitors
(7) + +
Fondaparinux (8) + Warfarin (9) + + +
(1) Sometimes used in combination with warfarin.
(2) If patient has a low risk of stroke, or if warfarin is contraindicated.
(3) When intracoronary stent is implanted.
(4) If PCI undertaken.
(5) Sometimes used in combination with warfarin for recurrent embolism.
(6) For hospitalized patients unable to take warfarin.
(7) If undergoing PCI.
(8) Emerging use.
(9) For 3–6 months after MI if large akinetic segment is present.
DVT, deep venous thrombosis; HIT, heparin-induced thrombocytopenia; LMWH, low molecular weight heparin; NSTEMI, non–ST elevation myocardial infarction (MI); PCI, percutaneous coronary intervention; STEMI, ST-elevation MI; UFH, unfractionated heparin.
77237_ch17.indd 42577237_ch17.indd 425 8/11/10 8:25:33 AM8/11/10 8:25:33 AM

Chapter 17
426
be prescribed routinely for primary preven-tion purposes in completely healthy individu-als. However, pending the results of ongoing research, many physicians believe it is appro-priate to recommend aspirin use in men and women older than age 50 who have at least one major atherosclerosis risk factor (see Chapter 5).In addition, the American Diabetes Association recommends that all diabetics with at least one other coronary risk factor take aspirin for car-diovascular protection. Finally, aspirin is not as benefi cial as warfarin (described later in the chapter) for the prevention of stroke in high-risk patients with atrial fi brillation.
Adverse Effects
The most common adverse effects of aspirin are related to the gastrointestinal system, in-cluding dyspepsia and nausea, which often can be ameliorated by lowering the dosage and/or using enteric-coated or buffered tab-lets. More serious potential side effects include gastrointestinal bleeding, hemorrhagic strokes, allergic reactions, and asthma exacerbation in aspirin-sensitive patients. Because aspirin is excreted by the kidneys and competes with uric acid for the renal proximal tubule organic anion transporter, it may also occasionally ex-acerbate gout.
Thienopyridines
The thienopyridines inhibit ADP-mediated ac-tivation of platelets (see Fig. 17.17). Normally, extracellular ADP activates platelets by bind-ing to two types of surface purinoceptors. The fi rst (termed P2Y1) acts through phospholi-pase C to increase intraplatelet [Ca��], which potentiates platelet activation. The second purinoceptor (P2Y12) is linked to an inhibi-tory G protein and reduces cAMP production when activated, thus also raising intraplatelet [Ca��] (see Fig. 17.17). ADP-induced platelet aggregation requires that ADP simultaneously activate both P2Y1 and P2Y12 purinoceptors. The thienopyridines, after conversion to active metabolites in the liver, irreversibly block P2Y12 by binding directly to it or to a nearby membrane protein. As a result, plate-let aggregation is inhibited.
Clopidogrel, ticlopidine, and prasugrel are the thienopyridines approved for clinical use. All are well absorbed orally and have good bioavail-ability. Meta-analyses of the use of ticlopidine or clopidogrel in patients at risk for coronary syndromes have concluded that these drugs are modestly superior to aspirin in reducing the risk of myocardial infarction, stroke, or vascular deaths, but at an increased risk of side effects and at a higher economic cost. Studies evaluat-ing the combination of aspirin plus clopidogrel in patients with unstable angina, non–ST eleva-tion myocardial infarction (NSTEMI) and ST-elevation myocardial infarction (STEMI) have demonstrated a signifi cant benefi t in cardiovas-cular outcomes compared with aspirin alone, though at an increased bleeding risk.
Thienopyridines are currently used as antiplatelet substitutes in patients allergic to aspirin and to prevent thrombotic com-plications following percutaneous coronary stenting (see Chapter 6). The combination of clopidogrel plus aspirin is also approved for patients with unstable angina, NSTEMI, or STEMI to reduce the rate of recurrent cardiac events (see Chapter 7).
Side effects of the thienopyridines include bleeding, dyspepsia, and diarrhea. In addition, the use of ticlopidine has been limited by po-tentially life-threatening adverse reactions: se-vere neutropenia (occurring in 0.8% to 2.5% of patients) and thrombotic thrombocytopenic purpura (in approximately 0.02% of treated patients). These hematologic effects are much rarer with clopidogrel, which is currently the preferred agent of this class.
Clopidogrel is a prodrug that requires cyto-chrome P450-mediated biotransformation to the active metabolite, which contributes to the drug’s delayed onset of action and to variability in its antiplatelet effect. For example, patients with common reduced-function polymorphisms of the cytochrome P450 2C19 (CYP2C19) gene demonstrate weakened platelet inhibition and less clinical benefi t. In addition, studies have implicated proton pump inhibitors (e.g., omeprazole) as drugs that can interfere with hepatic CYP2C19 activation of clopidogrel and its cardiovascular benefi t.
Newer drugs address these shortcomings. For example, prasugrel, another thienopyridine, is
77237_ch17.indd 42677237_ch17.indd 426 8/11/10 8:25:33 AM8/11/10 8:25:33 AM
Cardiovascular Drugs
427
metabolized to an active form more readily than clopidogrel and has a more potent antiplatelet ef-fect. Compared to clopidogrel, it has been shown to further reduce the risk of future myocardial infarction in patients with ACS who undergo percutaneous coronary intervention. This ben-efi t comes with an increased risk of bleeding, a complication that is more likely to occur in patients who are elderly, those with prior cere-brovascular disease, and individuals with a low body weight.
A limitation of the thienopyridines, including clopidogrel and prasugrel, is that they are irre-versible platelet inhibitors. If a thienopyridine-treated patient with an ACS requires coronary artery bypass surgery, a waiting period of sev-eral days is necessary to allow adequate return of platelet function to prevent perioperative bleeding complications. As a result, a newer generation of reversible platelet P2Y12 ADP re-ceptor blockers is in active development.
Glycoprotein IIb/IIIa Receptor Antagonists
The GP IIb/IIIa receptor antagonists constitute one of the most potent classes of antiplate-let agents. This group reversibly inhibits the critical and fi nal common pathway of platelet aggregation—the binding of activated platelet GP IIb/IIIa receptors to fi brinogen and von Willebrand factor. As a result, platelets are in-hibited from “sticking” to one another, impair-ing the formation of a hemostatic plug. Three types of GP IIb/IIIa receptor antagonists have been developed: (1) monoclonal antibodies (e.g., abciximab, which is the Fab fragment of a chimeric human–mouse monoclonal anti-body); (2) synthetic peptide antagonists (e.g., eptifi batide); and (3) synthetic nonpeptide antagonists (e.g., tirofi ban). As described in Chapters 6 and 7, the GP IIb/IIIa antagonists signifi cantly improve outcomes of patients un-dergoing percutaneous coronary interventions and in high-risk acute coronary syndromes.
All the GP IIb/IIIa receptor inhibitors in current use must be given intravenously. Oral GP IIb/IIIa receptor inhibitors have been de-veloped but have not demonstrated benefi cial outcomes in clinical trials.
The major side effects of the GP IIb/IIIa re-ceptor inhibitors are bleeding (in 1% to 10%
of patients) and thrombocytopenia (in ap-proximately 2% of patients treated with ab-ciximab and less commonly with the other agents). Abciximab has a short plasma half-life(30 minutes); thus, its effects can be reversed by discontinuing the drug or by administer-ing a platelet transfusion. Because the other GP IIb/IIIa receptor antagonists have longer half-lives, they may continue to inactivate transfused platelets. Nonetheless, bleeding complications are infrequent using current protocols and careful dosing.
Dipyridamole
The antiplatelet drug dipyridamole is occasion-ally prescribed to patients who are intolerant to aspirin, but it is not as effective. Its mechanism of antiplatelet action is unclear, but it may act in part by increasing platelet cAMP levels, either by inhibiting the enzyme phosphodiesterase or by blocking cellular uptake and destruction of endogenous adenosine. As a result, cytosolic [Ca��] falls, which inhibits platelet aggrega-tion (see Fig. 17.17). By itself, dipyridamole has no proven cardiac benefi ts. It is sometimes prescribed in combination with warfarin for an augmented antithrombotic effect in patients with recurrent thromboembolism from pros-thetic heart valves, but the pairing of aspirin plus warfarin is more effective. The combina-tion of dipyridamole plus aspirin is effective at prevention of recurrent strokes in patients with prior cerebrovascular symptomatology and is approved for that purpose.
Anticoagulant Drugs
Anticoagulant drugs (see Table 17.15) inter-fere with the coagulation cascade and impair secondary hemostasis. Because the fi nal step in both the intrinsic and extrinsic coagulation pathways is the formation of a fi brin clot by the action of thrombin, major goals of antico-agulant therapy are to inhibit the activation of thrombin by factor Xa (e.g., using unfrac-tionated heparin [UFH], low molecular weight forms of heparin, or fondaparinux), to inhibit thrombin itself (e.g., UFH or direct thrombin inhibitors), or to decrease the production of functional prothrombin (e.g., warfarin).
77237_ch17.indd 42777237_ch17.indd 427 8/11/10 8:25:33 AM8/11/10 8:25:33 AM

Chapter 17
428
Unfractionated Heparin
UFH is a heterogeneous mixture of glycosamin-oglycans. Although it has little anticoagulant action by itself, it associates with antithrombin (AT) in the circulation, greatly increasing its effect. AT is a natural protein that inhibits the action of thrombin and other clotting factors. When UFH complexes with AT, the affi nity of AT for thrombin increases 1,000-fold, mark-edly reducing thrombin’s ability to generate fi brin from fi brinogen. The UFH–AT complex also inhibits activated factor X, additionally contributing to the anticoagulant action. Fur-thermore, UFH has antiplatelet properties by binding to, and blocking the action of, von Willebrand factor.
UFH is administered parenterally because it is not absorbed from the gastrointestinal tract. For most acute indications, an intravenous bolus is followed by a continuous infusion of the drug. The bioavailability of UFH varies from patient to patient because it is a heterogeneous collection of molecules that bind to plasma pro-teins, macrophages, and endothelial cells. The dosage–effect relationship is often not predict-able; thus, frequent blood samples are required to monitor the degree of anticoagulation (most commonly, measurement of the activated par-tial thromboplastin time), so that the infusion rate can be adjusted accordingly.
The usual cardiovascular settings in which in-travenous UFH is indicated include (1) unstable angina and NSTEMI (see Chapter 6), (2) acute myocardial infarction after fi brinolytic therapy or if an extensive wall motion abnormality is pres-ent (see Chapter 7), and (3) pulmonary embo-lism or deep venous thrombosis (see Chapter 15). Among hospitalized or bed-ridden patients not receiving intravenous heparin, fi xed low dosages of subcutaneous UFH are often administered to prevent deep venous thrombosis.
The most important side effect of heparin is bleeding. An overdose of UFH can be treated with intravenous protamine sulfate, which forms a stable complex with UFH and immedi-ately reverses the anticoagulation effect.
Heparin-induced thrombocytopenia (HIT) is another potential major adverse effect and can occur in two forms. The more common type, thought to result from direct heparin-
induced platelet aggregation, occurs in up to 15% of patients and is usually asymptomatic, dose dependent, and self-limited. This mild HIT rarely causes severe reductions in platelet counts and usually does not require cessation of heparin.
The less common, much more dangerous form of HIT is immune-mediated, a condition that affects 3% of UFH-treated patients. It can lead to life-threatening bleeding and, paradoxi-cally, to thrombosis. Thrombosis is caused by the formation of antibodies directed against heparin–platelet complexes, resulting in platelet activation, aggregation, and clot production. In the immune-mediated form of HIT, the platelet count can fall markedly and is not dependent on the dose of heparin. Therapy requires im-mediate cessation of heparin and substitution by alternate antithrombotic therapy to prevent further clotting (e.g., a direct thrombin inhibi-tor, described later in the chapter).
Patients receiving long-term UFH therapy are also prone to a dose-dependent form of osteoporosis through an unclear mechanism.
Low Molecular Weight Heparins
Some of the shortcomings of UFH (e.g., short half-life and unpredictable bioavailability) have been addressed by the development of low molecular weight heparins (LMWHs), examples of which are enoxaparin, dalteparin, and tinzaparin. As the name implies, LMWH molecules are smaller than UFH (approximately one third the size). These agents also interact with AT, but unlike UFH, the LMWH–AT complex preferentially inhibits factor Xa more than thrombin (thrombin inhibition requires heparin molecules larger than those in LMWHs). Selectively inhibiting factor Xa upstream in the coagulation cascade has a multiplier effect in preventing downstream formation of thrombin.
Advantages of LMWHs over UFH include (1) inhibition of platelet-bound factor Xa, con-tributing to a more prominent anticoagulant effect; (2) less binding to plasma proteins and endothelial cells, resulting in more predictable bioavailability and a longer half-life; (3) fewer bleeding complications; and (4) a lower inci-dence of immune-mediated HIT.
77237_ch17.indd 42877237_ch17.indd 428 8/11/10 8:25:33 AM8/11/10 8:25:33 AM

Cardiovascular Drugs
429
From a practical standpoint, the major ad-vantages of LMWH formulations are the ease of use and more consistent level of anticoagu-lation. They can be administered as subcuta-neous injections once or twice a day in fi xed doses, without the frequent blood monitor-ing required for UFH. In rare cases in which monitoring the anticoagulant effect is neces-sary (e.g., in patients with renal dysfunction, because LMWHs are cleared via the kidneys), a factor Xa inhibition assay is used.
In clinical trials, LMWH therapy is at least as effective as UFH in preventing deep venous thrombosis and treating unstable angina. It also has a better safety profi le than UFH, with lower rates of bleeding, thrombocytopenia, and osteoporosis. LMWHs should not, how-ever, be used in patients with a history of HIT, and unlike UFH, the effects of LMWHs can-not be completely reversed by protamine. Cur-rent clinical indications for LMWH therapy are(1) prophylaxis against deep venous thrombo-sis following hip, knee, or abdominal surgery; (2) treatment of deep venous thrombosis (with or without pulmonary embolism); and (3) man-agement of acute coronary syndromes.
Direct Thrombin Inhibitors
The anticoagulation effects of UFH and LMWH are limited because their activity depends, at least in part, on AT, and they inhibit only cir-culating thrombin. The large heparin–AT com-plex cannot inactivate thrombin that is already bound to fi brin within a clot. In contrast, the direct thrombin inhibitors (lepirudin, bivaliru-din, argatroban, and others) inhibit thrombin activity independently of AT and are effective against both circulating and clot-bound throm-bin. They do not cause thrombocytopenia and are used to maintain anticoagulation and pre-vent thrombosis in patients with HIT. Bivali-rudin is approved for use as an anticoagulant in patients with unstable angina undergoing percutaneous coronary intervention. All direct thrombin inhibitors are potent anticoagulants and the major adverse effect is bleeding.
Fondaparinux
The anticoagulant fondaparinux is a synthetic pentasaccharide that specifi cally inhibits factor
Xa, thereby reducing thrombin activation. Like heparin, fondaparinux binds to AT with high affi nity, greatly increasing AT’s ability to in-activate factor Xa. Unlike UFH, fondaparinux does not inactivate formed thrombin, nor does it interfere with platelet actions or cause HIT. It is administered by subcutaneous injection, and its half-life is suffi ciently long (17 to 21 hours) that it can be prescribed just once a day. There are no known antidotes to its anti-coagulant effect.
Fondaparinux is currently approved for pre-vention of deep venous thrombosis after cer-tain surgical procedures and as treatment for deep venous thrombosis and pulmonary em-bolism.
Warfarin
Warfarin is an oral agent prescribed for long-term anticoagulation. It acts by antagonizing an enzyme (vitamin K epoxide reductase) that is required for usual vitamin K metabo-lism. Normally, the reduced form of vitamin K promotes the carboxylation of a glutamic acid residue within specifi c coagulation fac-tors (factors II, VII, IX, and X), an action that is necessary for the factors to subsequently bind calcium, become functional, and partici-pate in coagulation (Fig. 17.18). By interfering with the formation of reduced vitamin K, war-farin indirectly inhibits carboxylation of the coagulation factors, rendering them inactive. Because certain natural coagulation inhibitors (protein C and protein S) are also vitamin K dependent, warfarin impairs their functions as well, which in some cases may counteract the drug’s anticoagulant effect.
Warfarin’s action has a delayed onset of 2 to 7 days; thus, if immediate anticoagulation is needed, UFH or LMWH must be prescribed concurrently at fi rst (known as anticoagulant “bridging”). The half-life of warfarin is long (37 hours), and the drug’s dosage must be individualized to achieve a therapeutic ef-fect while minimizing the risk of bleeding complications. The extent of anticoagulation is monitored by measuring the prothrombin time in blood samples, reported as an inter-national normalized ratio (INR). There are two target ranges of anticoagulant intensity.
77237_ch17.indd 42977237_ch17.indd 429 8/11/10 8:25:33 AM8/11/10 8:25:33 AM

Chapter 17
430
For patients at greatest risk of pathologic thrombosis (e.g., those with certain types of mechanical heart valves), the desired INR is 2.5 to 3.5. For others (e.g., those with un-complicated atrial fi brillation), the target INR is usually 2.0 to 3.0.
Many factors infl uence the anticoagula-tion effect of warfarin and require altera-tions in its dosage. For example, liver disease and heart failure each reduce the warfarin requirement, whereas a high dietary inges-tion of foods containing vitamin K (e.g., green leafy vegetables) increases the re-
quired dose. Similarly, many pharmaceuti-cals alter warfarin’s anticoagulation effect(Table 17.16). Finally, the combined use of warfarin with aspirin or other antiplate-let agents increases the risk of a bleedingcomplication.
If serious bleeding arises during warfarin therapy, the drug’s effect can be reversed within hours by the administration of vi-tamin K (or even more quickly by trans-fusing fresh-frozen plasma, which directly replenishes functional circulating clotting factors). In patients with mechanical heart
Table 17.16. Drugs That Alter the Anticoagulation Effect of Warfarin
Reduced Anticoagulation Effect Increased Anticoagulation Effect
Hepatic enzyme induction Hepatic enzyme inhibition Barbiturates Amiodarone Rifampin Cephalosporins Carbamazepine Cimetidine Nafcillin ErythromycinWarfarin malabsorption Fluconazole Cholestyramine Isoniazid Sucralfate Ketoconazole
Metronidazole Propafenone Trimethoprim–sulfamethoxazoleDisplacement from protein-binding sites Allopurinol Gemfi brozil PhenytoinAltered vitamin K production by gut fl ora Ciprofl oxacin Piperacillin
Oxidizedform of
vitamin K
Reducedform of
vitamin K
Precursors offactors II, VII, IX, X
Carboxylatedfactors II, VII, IX, X(able to bind Ca++)WARFARIN
Epoxidereductase
–
Figure 17.18. Mechanism of action of warfarin. Normally, coagu-lation factors II, VII, IX, and X are converted to functional forms by carboxylation in the liver, in the presence of reduced vitamin K. During this reaction, vitamin K undergoes oxidation and must be regenerated back to the reduced state for the sustained synthesis of functional clotting factors. Warfarin inhibits the formation of reduced vitamin K by antagonizing the enzyme epoxide reductase, such that the conversion of the coagulation factors does not occur and they remain nonfunctional.
77237_ch17.indd 43077237_ch17.indd 430 8/11/10 8:25:33 AM8/11/10 8:25:33 AM

Cardiovascular Drugs
431
valves, vitamin K should be avoided unless life-threatening bleeding occurs, because of the possibility of rebound valve thrombosis. Warfarin is teratogenic and should not be taken during pregnancy, especially during the fi rst trimester.
Given the many limitations and inconve-nience of warfarin use, much current effort is directed toward the development of new anticoagulants (including oral direct throm-bin inhibitors and factor Xa antagonists) en-dowed with more predictable pharmacologic properties.
LIPID-REGULATING DRUGS
As described in Chapter 5, abnormal serum lipid levels play a critical role in the patho-genesis of atherosclerosis. Drugs that improve lipid abnormalities are cardioprotective; they inhibit the progression (and may induce re-gression) of atherosclerosis, improve cardio-vascular outcomes, and, in high-risk patients, reduce mortality rates.
HMG CoA Reductase Inhibitors
The HMG CoA reductase inhibitors, commonly known as “statins,” are the most effective drugs for reducing LDL cholesterol. By vir-tue of their potency, excellent tolerability, and mortality benefi ts, they are widely prescribed. The available agents of this group, in increas-ing order of potency, are fl uvastatin, lovasta-tin, pravastatin, simvastatin, atorvastatin, and rosuvastatin (Table 17.17).
Statins are competitive inhibitors of the en-zyme HMG CoA reductase, a rate-controlling factor in cholesterol biosynthesis (Fig. 17.19). By inhibiting cholesterol production in the liver, statins lower serum LDL cholesterol through three mechanisms: (1) the reduced intrahepatic cholesterol content induces in-creased expression of the LDL receptor gene, causing a greater number of LDL receptors to appear on the surface of the hepatocyte, which facilitates the binding and clearance of LDL from the circulation; (2) circulating LDL precursors (known as very low density
Table 17.17. Lipid-Regulating Drugs
ClassLDL Effect
(%)HDL Effect
(%)Triglyceride Effect (%) Adverse Effects
HMG CoA reductase inhibitors (in increasing order of potency) Fluvastatin Lovastatin Pravastatin Simvastatin Atorvastatin Rosuvastatin
↓ 20–55 ↑ 5–15 ↓ 7–30 Transaminitis, myopathy
Bile acid–binding agents Cholestyramine Colestipol Colesevelam
↓ 15–30 ↑ 3–5 May ↑ Constipation, bloating
Cholesterol absorption inhibitor Ezetimibe
↓ 15–20 ↑ 1–2 ↓ 0–5 Rare allergic reaction
Niacin ↓ 5–25 ↑ 15–35 ↓ 20–50 Flushing, hepatotoxicity, hyperglycemia, hyper-
uricemia, exacerbation of peptic ulcer disease
Fibric acid derivatives Fenofi brate Gemfi brozil
↓ 0–20 or ↑ 0–10
↑ 10–20 ↓ 20–50 Nausea, gallstones
77237_ch17.indd 43177237_ch17.indd 431 8/11/10 8:25:35 AM8/11/10 8:25:35 AM

Chapter 17
432
lipoprotein [VLDL] remnants and intermediate-density lipoprotein particles) are cleared more rapidly from the circulation because of their cross-recognition with the hepatic LDL recep-tor; and (3) hepatic VLDL production falls due to the reduced availability of intracellular cho-lesterol for lipoprotein assembly. Because the catabolism of VLDL in the circulation ultimately forms LDL, lowering VLDL production also decreases circulating LDL levels. The reduced production of VLDL is also likely responsible for the triglyceride-lowering effect of statins, because this lipoprotein is the major carrier of triglycerides in the circulation.
The overall effect is that statins reduce serum LDL levels by 20% to 55%, depending on which agent is used. Statins also decrease plasma triglyceride levels by 7% to 30%, and by an unclear mechanism, HDL levels increase by 5% to 15%.
The lowering of LDL reduces the lipid con-tent of atherosclerotic lesions and promotes plaque stability. This lessens the vulnerabil-ity of plaque to rupture, thus decreasing the likelihood of thrombus formation and vas-cular occlusion. In addition to their lipid-modulating properties, statins have other po-tentially cardioprotective effects. They improve
�
LDL LDL
LPL
VLDLremnants
Chylomicrons
VLDL(mostly TG)
Fibrates
NiacinCholesterol
Cholesterol
Bile acids
Bile acid–binding agents
HMGCOA
StatinsTG
Ezetimibe
Hepatocyte
Intestine
Figure 17.19. Major sites of action of lipid-regulating drugs. The sta-tins inhibit cholesterol biosynthesis in the liver by competing with the enzyme HMG CoA reductase. This action depletes intrahepatic choles-terol stores, which results in increased expression of surface low-density lipoprotein (LDL) receptors. The latter enhance clearance of LDL and very low density lipoprotein (VLDL) remnants from the circulation. The lower intrahepatic cholesterol content leads to reduction in VLDL synthesis. Ezetimibe selectively inhibits cholesterol uptake in the small intestine, thereby reducing chylomicron production and cholesterol delivery to the liver. Bile acid–binding agents interrupt the enterohepatic circulation of bile acids in the intestine, causing more hepatic cholesterol to be diverted to new bile acid production. In response to reduced availability of intrahepatic cholesterol, LDL receptor expression and LDL clearance increase. Among its effects, niacin inhibits VLDL production. It also in-creases lipoprotein lipase (LPL) activity, thus promoting triglyceride (TG) clearance from circulating VLDL particles. Niacin raises circulating high-density lipoprotein (HDL) by impairing hepatic uptake of apo AI, a major HDL apoprotein (not shown). Fibrates enhance VLDL catabolism by in-creasing the synthesis of lipoprotein lipase via peroxisome proliferator–activated receptor � (PPAR-�), a nuclear transcription factor. They also raise HDL by stimulating the production of HDL-associated apoproteins (not shown).
77237_ch17.indd 43277237_ch17.indd 432 8/11/10 8:25:35 AM8/11/10 8:25:35 AM
Cardiovascular Drugs
433
endothelial function as evidenced by enhanced synthesis of nitric oxide. They further promote plaque stability by inhibiting monocyte pen-etration into the arterial wall and reducing macrophage secretion of metalloproteinases, enzymes that degrade and weaken the fi brous caps of plaques. Statins also diminish the vul-nerability of lipoproteins to oxidation, thus in-hibiting the unregulated uptake of modifi ed LDL cholesterol by macrophages (see Chapter 5). Fi-nally, they appear to suppress infl ammation, a key component of atherogenesis.
Statins are widely prescribed for patients with CAD, because major trials have shown that they substantially reduce mortality, car-diac events, and strokes in this population, whether LDL cholesterol is elevated or even in the “normal” range. In studies of patients not known to have CAD, statin therapy has been shown to reduce coronary events in high-risk individuals—those with elevated LDL choles-terol levels or those with average total choles-terol but low HDL values.
Statins are well-tolerated drugs. Mild gas-trointestinal upset occasionally occurs. The most signifi cant potential adverse effects are hepatotoxicity and myopathy (skeletal muscle toxicity), and these are rare. Hepatotoxicity is dose related and occurs in fewer than 1% of pa-tients. Those affected may experience fatigue, anorexia, and weight loss. More commonly, the patient is asymptomatic, but routine labo-ratory studies show an increase in transami-nase levels (ALT, AST). Symptoms disappear almost immediately after the drug is discon-tinued, but transaminase levels may remain el-evated for weeks. The risk of statin-associated hepatic toxicity is higher in patients who drink excessive amounts of alcohol.
Myopathy, typically involving the proxi-mal leg or arm muscles symmetrically, can range from vague aches to intense myalgias and muscle weakness, and rarely may lead to rhabdomyolysis (destruction of muscle) with myoglobinuria and renal failure. While benign muscle aches are reported in 2% to 10% of patients on statins, signifi cant myositis (de-fi ned as an elevated serum level of muscle-derived creatine kinase �10 times the upper limit of normal) develops in �0.5%. However, the incidence of muscle injury is increased by
concomitant therapy with certain other drugs, including other lipid-lowering agents (i.e., nia-cin and the fi bric acid derivatives) and drugs that inhibit the 3A4 isoform of cytochrome P-450, which is responsible for the hepatic metabolism of many statins. Such agents in-clude macrolide antibiotics (e.g., erythromy-cin, clarithromycin), azole antifungal drugs (e.g., ketoconazole, itraconazole), and many HIV protease inhibitors. Notably, pravastatin, rosuvastatin, and fl uvastatin are not substan-tially dependent on the cytochrome P-450 3A4 isoform for their metabolism and may be less likely to cause myopathy in combination with these other drugs.
Bile Acid–Binding Agents
This group includes the resins cholestyramine and colestipol and the hydrophilic polymercolesevelam. These drugs are large, highly pos-itively charged molecules that bind bile acids (which are negatively charged) in the intes-tine and prevent their normal reabsorption to the liver through the enterohepatic circulation (see Fig. 17.19). To make up for the loss, more hepatic cholesterol is converted into newly produced bile acids. This action depletes in-trahepatic cholesterol stores, thus stimulating the production of LDL receptors. Similar to the effect of the statins, an increased number of hepatic LDL receptors bind a greater amount of circulating LDL, reducing the circulating concentration of the lipoprotein. However, un-like statins, new hepatic cholesterol production is also stimulated by the reduced intrahepatic cholesterol content. The boost in cholesterol synthesis augments VLDL production, which likely explains the commonly observed rise in serum triglyceride levels during therapy with a bile acid–binding agent.
In one of the fi rst drug trials of patients with hypercholesterolemia, cholestyramine signifi cantly reduced the risk of fatal and non-fatal myocardial infarctions. However, drugs of this class are diffi cult for patients to take (e.g., cholestyramine and colestipol are unappeal-ing gritty powders that must be mixed with liquids) and their potency is inferior to that of statins. Thus, the bile acid–binding agents are only occasionally used today, mainly as
77237_ch17.indd 43377237_ch17.indd 433 8/11/10 8:25:35 AM8/11/10 8:25:35 AM

Chapter 17
434
second-line lipid-regulating drugs, in combi-nation with statin therapy. Because they can cause elevations of the serum triglyceride level, they should be avoided in patients with hypertriglyceridemia.
The bile acid–binding agents interfere with the absorption of fat-soluble vitamins and cer-tain drugs (e.g., warfarin, digoxin, propranolol, and thyroid hormones). Thus, other medica-tions should be consumed 1 hour before or 3 to 4 hours after these agents. The main side effects are gastrointestinal: bloating, constipation, and nausea. Because bile acid–binding agents are not absorbed into the circulation, they do not cause systemic side effects.
Cholesterol Absorption Inhibitors
Ezetimibe, the fi rst member of this class of agents, is a selective inhibitor of cholesterol uptake at the brush border of epithelial cells in the small intestine. It acts by competitively in-hibiting a transporter known as the Niemann–Pick C1–like 1 protein. Normally, a portion of dietary and biliary cholesterol taken up in this manner is esterifi ed and incorporated into chylomicrons, which then enter into the cir-culation and are transported to the liver (seeBox 5.1). By inhibiting cholesterol uptake (see Fig. 17.19), ezetimibe results in reduced chylomicron production and therefore less cholesterol delivery to the liver. The reduced cholesterol content stimulates compensatory hepatic production of LDL receptors, which augment clearance of circulating LDL particles. The net result is lowering of circulating LDL (and therefore serum cholesterol levels).
Used alone at standard dosage, ezetimibe reduces LDL cholesterol by about 18%. When combined with statin therapy, more potent LDL lowering ensues. Ongoing trials are as-sessing whether LDL reduction by ezetimibe translates into improved clinical outcomes.
Unlike bile acid–binding agents, side ef-fects from ezetimibe therapy are rare. When combined with a statin, the incidence of transaminase elevation is only slightly greater than that of statin therapy alone. The addition of ezetimibe to a statin regime does not ap-pear to signifi cantly increase the risk of statin-associated myopathy.
Niacin
Niacin is one of the oldest lipid-regulating drugs and has favorable effects on all the cir-culating lipid fractions. It is the most effective agent available for raising HDL cholesterol (by 15% to 35%), and it reduces LDL choles-terol (by 5% to 25%) and triglyceride levels (by 20% to 50%). Furthermore, unlike most other lipid-lowering drugs, niacin substantially reduces the circulating level of lipoprotein(a), an LDL-like lipoprotein that carries an inde-pendent risk of cardiovascular disease (see Chapter 5).
Niacin modifi es lipid levels through mul-tiple mechanisms. It inhibits the release of fatty acids from adipose tissue. As a result, fewer fatty acids are transported to the liver and hepatic triglyceride synthesis declines. Impaired triglyceride production by the liver reduces VLDL secretion into the circula-tion; consequently, less LDL is formed (seeFig. 17.19). Niacin also enhances the clearance of triglycerides from circulating VLDL by pro-moting the activity of lipoprotein lipase at adi-pose and muscle cells. The net effect of these actions is a reduction in serum triglyceride and LDL levels. Niacin is thought to raise circulat-ing HDL cholesterol levels by decreasing the hepatic uptake of its apoprotein, apo AI, thus reducing clearance of HDL particles from the circulation. This mechanism does not disturb hepatic retrieval (and disposal) of cholesterol from the HDL particles.
In a major study of niacin in men who had experienced a prior myocardial infarction (the Coronary Drug Project), niacin reduced the risk of future cardiac events and lowered the mor-tality rate in long-term follow-up. That study was performed before the better tolerated and more effective statin drugs were available. Nia-cin is now mainly used to treat patients with low serum HDL levels and/or elevated serum triglycerides.
Niacin has several common side effects. Transient cutaneous fl ushing episodes occur in most patients. These episodes are prostaglan-din mediated and can be minimized by taking aspirin prior to the niacin dose. Gastrointes-tinal side effects include nausea and exacer-bation of peptic ulcer disease. Hepatotoxicity
77237_ch17.indd 43477237_ch17.indd 434 8/11/10 8:25:35 AM8/11/10 8:25:35 AM

Cardiovascular Drugs
435
can occur, manifested by fatigue, weakness, and elevated serum transaminases (ALT, AST). Niacin should be used cautiously in diabetic patients because it can contribute to insulin resistance and hyperglycemia. It also raises serum uric acid levels and can precipitate gout in susceptible patients. Rare cases of myopa-thy have been reported with niacin therapy. The incidence is increased when niacin is pre-scribed concurrently with a statin.
Fibrates
The fi bric acid derivatives, or fi brates, include gemfi brozil and fenofi brate. They are the most powerful agents to reduce serum triglyceride levels (by up to 50%), and they raise HDL cho-lesterol levels (by up to 20%). However, their effect on LDL cholesterol is more variable and less benefi cial than other lipid-altering drugs (see Table 17.17).
A large study of men with hypercholes-terolemia, but no known coronary disease, showed that gemfi brozil reduced the number of subsequent myocardial infarctions, with-out benefi ting the total death rate. In another study of men with known CAD, normal LDL levels, and low HDL levels, the rate of coro-nary events was decreased, but again total mortality was not signifi cantly affected. In a 5-year study of patients with type 2 diabetes, fenofi brate reduced the incidence of nonfatal myocardial infarction but not the total cardio-vascular mortality.
Fibrates are thought to exert their antilipid effects through interactions with peroxisome proliferator–activated receptor � (PPAR-�), a nuclear transcription factor. Activation of PPAR-� leads to a decrease in triglycerides, at least in part by augmenting fatty acid oxidation and increasing the synthesis of lipoprotein lipase (see Fig. 17.19). The latter results in increased VLDL catabolism, which may actually raise the circulating LDL level, especially in patients with baseline hypertriglyceridemia. Fibrates are be-lieved to augment HDL cholesterol levels via PPAR-� activation of the gene for apoprotein AI, a key constituent of HDL particles.
Fibrates are primarily used to lower triglyc-eride levels and raise HDL cholesterol levels. They are metabolized by hepatic glucuronida-
tion with subsequent renal excretion. Thus, they should be avoided or prescribed at lower dosages for patients with impaired liver orkidney function.
Fibrates are generally well tolerated. Poten-tial side effects include dyspepsia, gallstones, and myalgias. When used in combination with a statin, the risk of rhabdomyolysis is increased. Therefore, if these drugs are pre-scribed concurrently, it is recommended that the serum creatine kinase (a marker of muscle infl ammation or necrosis) be monitored every several months. Fibrates augment the effect of warfarin by displacing it from albumin-binding sites, possibly necessitating a decrease in the anticoagulant dosage. They also enhance the effects of oral hypoglycemic drugs.
Table 17.17 summarizes the expected re-sults and potential side effects of the com-monly used lipid-altering drugs.
SUMMARY
This chapter has presented an overview of the most commonly used cardiovascular drugs. These agents are covered in greater detail in the references listed in the section “Additional Reading.” It is hoped that the tables, fi gures, and brief explanations presented here will be useful to the reader now, and again when con-sidering the basic pathophysiology of heart disease while caring for patients.
Acknowledgments
Contributors to the previous editions of this chap-ter were Martin W. Schoen, MD; Mark Friedberg, MD; Andrew C. Hecht, MD; Steven N. Kalkanis, MD; Steven P. Leon, MD; Chiadi E. Ndumele, MD; David Sloane, MD; Ralph A. Kelly, MD; Gary R. Strichartz, MD; Elliott M. Antman MD; and Leonard S. Lilly, MD.
Additional Reading
Antman EM. Cardiovascular Therapeutics: A Com-panion to Braunwald’s Heart Disease. 3rd ed. Philadelphia, PA: Elsevier Saunders; 2006.
Bangalore S, Messerli FH, Kostis JB, et al. Cardio-vascular protection using beta-blockers: a critical review of the evidence. J Am Coll Cardiol. 2007;50:563–572.
77237_ch17.indd 43577237_ch17.indd 435 8/11/10 8:25:35 AM8/11/10 8:25:35 AM

Chapter 17
436
Berger JS, Roncaglioni MC, Avanzini F, et al. Aspirin for the primary prevention of cardiovascular events in women and men. JAMA. 2006;295:306–313.
Cattaneo M. New P2Y12 inhibitors. Circulation. 2010;121:171–179.
DeBacker D, Biston P, Devriendt J, et al. Comparison of dopamine and norepinephrine in the treatment of shock. N Engl J Med. 2010;362:779–789.
Ernst ME, Moser M. Use of diuretics in patients with hypertension. N Engl J Med. 2009;361:2153–2164.
Ho PM, Maddox TM, Wang L, et al. Risk of adverse outcomes associated with concomitant use of clopi-dogrel and proton pump inhibitors following acute coronary syndrome. JAMA. 2009;301:937–944.
Joy TR, Hegele RA. Narrative review: statin-related myopathy. Ann Intern Med. 2009;150:858–868.
Lafuente-Lafuente C, Mouly S, Longas-Tejero MA, et al. Antiarrhythmic drugs for maintaining sinus
rhythm after cardioversion of atrial fi brillation. Arch Intern Med. 2006;166:719–728.
Marin F, Gonzalex-Conejero R, Capranzano P, et al. Pharmacogenetics in cardiovascular anti-thrombotic therapy. J Am Coll Cardiol. 2009;54:1041–1057.
Maron BA, Leopold JA. Aldosterone receptor antag-onists: effective but often forgotten. Circulation. 2010;121:934–939.
Mega JL, Close SL, Wiviott SD, et al. Cytochrome P-450 polymorphisms and response to clopi-dogrel. N Engl J Med. 2009;360:354–362.
Opie LH, Gersh BJ, eds. Drugs for the Heart. 7th ed. Philadelphia, PA: W.B. Saunders; 2009.
Patel C, Yan G-X, Kowey PR. Dronedarone. Circula-tion. 2009;120:636–644.
Ram CVS. Angiotensin receptor blockers: current status and future prospects. Am J Med. 2008;121:656–663.
77237_ch17.indd 43677237_ch17.indd 436 8/11/10 8:25:35 AM8/11/10 8:25:35 AM

437
Index
AAbciximab, 427Abdominal aortic aneurysm, 316Accessory tracts
concealed, 293impulse conduction and, 272–273
ACE (see Angiotensin-converting enzyme (ACE))ACE inhibitors (see Angiotensin-converting enzyme
(ACE) inhibitors)Acetylcholine (ACh), 138bACh (see Acetylcholine (ACh))Acoustic shadowing, 52Actin, 23Action potential
cardiac cells, 12, 18–21digitalis effects, 388early afterdepolarizations-triggered, 269myocytes, 19pacemaker cells, 20, 263refractory period, 21–22spontaneous, 262triggered activity, 268–269unidirectional block of, 270–272
Acute arterial occlusion, 349–350Acute bacterial endocarditis (ABE), 209Acute cholecystitis, 173tAcute coronary syndromes (ACS)
angina pectoris (see Angina pectoris)causes of, 166, 167tclinical features of, 171cocaine abuse and, 166description of, 161diagnosis of
creatine kinase levels, 176echocardiography, 176electrocardiography, 174, 174–175, 175fi ndings to support, 174troponin levels, 175–176
differential diagnosis of, 173tfrequency of, 161hemostasis, 162myocardial infarction (see Myocardial infarction)nonatherosclerotic causes of, 166, 167tpathogenesis of, 162–167pathologic and pathophysiologic fi ndings
cellular changes, 167, 168
contractility and compliance impairments, 170description of, 167early changes, 167, 168, 170tfunctional changes, 170–171gross changes, 168ischemic preconditioning, 170–171late changes, 168, 170, 170tstunned myocardium, 170ventricular remodeling, 171
treatment ofdescription of, 176–177in-patient measures, 176–177schematic diagram of, 177
triggers for, 165vasoconstriction associated with, 142
Acute pulmonary edema, 242Acute rheumatic fever (ARF), 190–192, 192t, 197Adenosine, 137, 152, 289Adenosine diphosphate (ADP), 137Adenosine triphosphate (ATP), 137, 144, 167Adenovirus, 245Adolescents, with mild hypertrophic
cardiomyopathy, 255ADP (see Adenosine diphosphate (ADP))�2-Adrenergic receptors, 155�1-Adrenergic receptors, 155�-Adrenergic stimulation, 25–27, 26Adventitia, 113, 114Afterdepolarizations, 268–269Afterload
alterations in, 222, 223defi nition of, 217, 219t, 220–221
Agatson score, 68Aggregation of platelets, 142Alcoholic cardiomyopathy, 246Amiloride, 422Amiodarone, 240, 249, 256, 414–416Amlodipine, 155Amyloidosis, 257 (see also Restrictive
cardiomyopathy)Aneurysms, aortic (see Aortic aneurysms)Angina pectoris
aortic stenosis-related, 203defi nition of, 136tdifferential diagnosis of, 173tdiscovery of, 135
Page numbers in italics denote fi gures; those followed by “t” denote tables; those followed by “b” denote boxes.
77237_ind.indd 43777237_ind.indd 437 8/11/10 8:26:38 AM8/11/10 8:26:38 AM

Index
438
electrocardiogram effects, 410, 411telectrophysiologic effects of, 411mechanisms of action, 410procainamide, 326, 410–412quinidine, 410
class IBclinical uses of, 412, 412telectrophysiologic effects of, 411lidocaine, 412–413mexiletine, 413
class ICclinical uses, 412t, 413description of, 413electrophysiologic effects of, 411fl ecainide, 413propafenone, 413
classifi cation of, 408, 409tclass II (see also Β-blockers)
clinical uses, 412t, 414description, 413electrophysiologic effects of, 414mechanism of action, 413–414
class IIIamiodarone, 240, 414–416clinical uses of, 412tdescription, 414dofetilide, 416dronedarone, 416ibutilide, 416sotalol, 416
class IVclinical uses of, 412tdiltiazem, 417electrophysiologic effects of, 417verapamil, 416–417
description of, 408reentrant rhythms inhibition, 408–409triggered activity treated using, 409–410
Anticoagulantsdescription of, 427direct thrombin inhibitors, 429fondaparinux, 429heparin (see Heparin)warfarin, 429–431, 430t
Antidiuretic hormone, 229Antihypertensive therapy, 130, 319–323Antiplatelet drugs
aspirinacute coronary syndromes treated
using, 178clinical uses, 424–426, 425tdescription of, 423–424myocardial infarction treated using, 178side effects of, 426ST-segment elevation myocardial infarction treated
using, 180description of, 178, 423dipyridamole, 152, 427glycoprotein IIb/IIIa receptor antagonists,
178–179, 427thienopyridines, 426–427
Angina pectoris (contd.)fi xed-threshold, 146heart failure caused by, 203–204hypertrophic cardiomyopathy and, 254natural history of, 153prevention of, 154–156treatment of
acute episodes, 153–154, 154tcoronary artery bypass graft surgery, 158,
158–159, 159tpercutaneous coronary interventions, 157–158, 159tpercutaneous transluminal coronary angioplasty,
157–158revascularization, 157–159
unstable (see Unstable angina)variable-threshold, 146variant
characteristics of, 146defi ned, 136tpathophysiologic fi ndings, 145
Angioblastic cords, 362, 362Angiography
contrast, 61–62, 62coronary, 152, 152coronary artery, 62magnetic resonance, 69
Angiotensin-converting enzyme (ACE), 229Angiotensin-converting enzyme (ACE)
inhibitors, 249description of, 394–395hypertension, 322indications
heart failure, 237–238, 396hypertension, 395–396myocardial infarction, 157, 182
renal blood fl ow effects, 396renin–angiotensin system interactions, 396trenovascular hypertension, 311side effects, 396–397sites of action, 395
Angiotensin II, 229, 309hypertension treated using, 322
Angiotensin II receptor blockers (ARB), 249characteristics, 397heart failure treated using, 238indications, 397–398renin–angiotensin system interactions, 396ttypes of, 396t
Ankle-brachial index, 348Antiadrenergic drugs
�-blockers (see Β-blockers)central adrenergic inhibitors, 404description, 404, 405, 406tperipheral �-receptor antagonists, 404–406, 406tsite of action, 405sympathetic nerve-ending antagonists, 404
Antiarrhythmic drugs, 256adenosine, 417–418, 418class IA
clinical uses of, 410, 412tdisopyramide, 412
77237_ind.indd 43877237_ind.indd 438 8/11/10 8:26:38 AM8/11/10 8:26:38 AM

Index
439
evaluation of, 204hemodynamic profi le of, 203incidence of, 375–376natural history of, 204pathology of, 202pathophysiology of, 202, 202–204, 203, 376physical examination of, 204, 376–377radiographic fi ndings, 47, 49tsymptoms of, 203–204, 376systolic ejection murmur caused by, 37–38, 38treatment of, 204, 377
Aortic valveanatomy of, 5area of, 204development of, 366replacement of, 204
APB (see Atrial premature beats (APB))Apo B-100, 121b, 132Apolipoproteins, 120bApoptosis
in heart failure, 231in myocardial infarction, 168
ARB (see Angiotensin II receptor blockers (ARB))Argatroban, 429Arrhythmias
anticholinergic drugs for, 275atrial fi brillation (see Atrial fi brillation)atrial fl utter, 285–287atrial premature beats, 185, 285, 285atrioventricular nodal reentrant tachycardia, 289–291atrioventricular reentrant tachycardias, 291conduction block and, 269–270defi nition of, 261, 279, 284differential diagnosis, 284escape rhythms, 281, 281–282genetic mutations, 296b–297bheart failure secondary to, 231impulse formation and conduction alterations, 262mechanisms of, 274tmultifocal atrial tachycardia, 293–294, 294myocardial infarction-related, 184–185pacemakers for, 275paroxysmal supraventricular tachycardias,
288–293sick sinus syndrome, 280, 281sinus bradycardia, 87, 185, 279–280, 280sinus tachycardia
characteristics of, 284–285defi nition of, 87electrocardiographic fi ndings, 284–285, 285in heart failure, 234myocardial infarction-related, 185
supraventricular, 185torsades de pointes, 295, 298, 298–299types of, 280tventricular fi brillation, 299, 299ventricular premature beats, 294, 294–295ventricular tachycardia, 295, 295–298, 297b
Arrhythmogenic right ventricular dysplasia (ARVD), 296b
Arterial insuffi ciency, 348
Antithrombin, 162, 163, 179Antithrombotic drugs
anticoagulants (see Anticoagulants)description of, 422–423platelet inhibitors (see Antiplatelet drugs)
Aortaabdominal, 340anatomy of, 339–341, 340ascending, 339descending, 340dilatation of, 46, 47diseases of, 339–346hypertension effects, 316
Aortic aneurysmscharacteristics of, 341classifi cation of, 340clinical presentation of, 342–343defi nition of, 341description of, 341diagnosis of, 342–343etiology of, 341–342, 342tfalse, 340, 341familial factors, 342illustration of, 340rupture of, 342–343treatment of, 343
Aortic dissectionclassifi cation of, 344, 344–345clinical presentation of, 345complications of, 345tdefi nition of, 343–344differential diagnosis of, 173tetiology of, 344–345hypertension effects, 316mortality rate, 316pathogenesis of, 344–345treatment of, 345–346type A, 344, 344type B, 344, 344
Aortic ejection click, 35Aortic regurgitation
acute, 205, 205assessment of, 206cardiac catheterization fi ndings, 207causes of, 205tcharacteristics of, 214tchronic, 205, 205–206clinical manifestations of, 206echocardiographic fi ndings, 56tetiology of, 205pathophysiology of, 205, 205–206radiographic fi ndings, 49ttreatment of, 207
Aortic stenosiscardiac catheterization fi ndings, 64t, 204characteristics of, 214tclinical manifestations of, 204, 375–376diagnostic studies, 377echocardiographic fi ndings, 56telectrocardiographic fi ndings, 204etiology of, 202
77237_ind.indd 43977237_ind.indd 439 8/11/10 8:26:38 AM8/11/10 8:26:38 AM

Index
440
schematic diagram of, 116thrombus formation caused by, 164–165
Atherosclerotic plaquecellular debris in, 122–123characteristics of, 122–123, 124complications of, 125–127description of, 113development stages, 117fatty streak transition into, 119, 122foam cells, 119rupture of, 123–125, 124, 164–165schematic diagram of, 116stable vs. unstable, 124thrombogenic potential of, 123, 124, 125
Atorvastatin, 431, 431tATP (see Adenosine triphosphate (ATP))Atria
contraction of, 32digitalis effects, 389tdilatation of, 45–46gallop of, 36left (see Left atrium)right (see Right atrium)septation of, 363–364, 364
Atrial fi brillationcardioversion for, 288defi nition of, 287in dilated cardiomyopathy, 248, 249, 250electrocardiographic fi ndings, 287in heart failure, 239in hypertrophic cardiomyopathy, 253, 254, 256mechanism of, 287mitral stenosis effects, 194myocardial infarction-related, 185in restrictive cardiomyopathy, 257treatment of, 288
Atrial fl utter, 285–287, 286Atrial gallop, 36Atrial “kick,” 254Atrial premature beats (APB), 185, 285, 285Atrial septal defect
diagnostic studies, 372incidence of, 370ostium primum, 370ostium secundum, 370pathophysiology of, 371physical examination of, 371sinus venosus, 371–372site of, 370–371symptoms of, 371treatment of, 372
Atrioventricular blockfi rst-degree, 282, 282high-grade, 283, 283second-degree, 282–283, 282–283third-degree, 283–284, 284
Atrioventricular canal, 364–365, 365Atrioventricular dissociation, 284Atrioventricular nodal cells, 262Atrioventricular nodal reentrant tachycardia (AVNRT),
289–291
Arterial wallanatomy of, 113–114, 114endothelial cells, 114–115endothelium of, 114extracellular matrix, 115leukocyte adherence to, 114vascular smooth muscle cells, 115
Arteries (see also specifi c artery)acute occlusion of, 349–350coronary (see Coronary arteries)emboli of, 350tnitrate-induced dilation, 403occlusive disease of (see Occlusive arterial
diseases)Raynaud phenomenon, 352–353, 353wall (see Arterial wall)
Arteriolesconstriction of, 228–229description of, 113dilation of, 346
Arteriovenous O2 (AVO2) difference, 61Aschoff body, 191, 191Aspirin
acute coronary syndromes treated using, 178clinical uses, 424–426, 425tdescription of, 423–424myocardial infarction treated using, 178side effects of, 426ST- segment elevation myocardial infarction treated
using, 180Atheroembolism, 350Atherosclerosis
arterial wall (see Arterial wall)causes of, 113complications of, 113, 125–127, 126defi ned, 113Framingham Heart Study, 127pathogenesis of
endothelial dysfunction, 117, 117–118fatty streak, 116, 117, 119, 120, 122leukocytes, 118–119lipoproteins, 118smooth muscle cells, 119, 122
physical activity effects, 131plaque formation (see Atherosclerotic plaque)risk factors
C-reactive protein, 132description of, 127diabetes mellitus, 130–131dyslipidemia, 127–128effective control of, 133estrogen status, 131genetics, 133homocysteine, 132hypertension, 130infection, 133infl ammatory markers, 132lipoprotein (a), 132metabolic syndrome, 131nonmodifi able, 127tobacco smoking, 130
77237_ind.indd 44077237_ind.indd 440 8/11/10 8:26:38 AM8/11/10 8:26:38 AM

Index
441
Blood pressureankle-brachial index, 348calculation of, 227, 302classifi cation of, 302tdiastolic, 302, 302trefl exes, 304regulation of, 302–303renal component of, 303systolic, 302, 302tvariations of, 304
Blood vesselsacetylcholine effects, 138barterioles
constriction of, 228–229description of, 113dilation of, 346
functions of, 339peripheral vascular resistance-based hypertension
and, 307veins, 353
Bradyarrhythmias (see also Arrhythmias)anticholinergic drugs for, 275conduction block and, 269–270defi nition of, 279escape rhythms, 281, 281–282impulse formation and conduction alterations, 262mechanisms of, 274tpacemakers for, 275sick sinus syndrome, 280, 281sinus bradycardia, 87, 185, 279–280, 280treatment of, 274–275types of, 280t
Bradycardia–tachycardia syndrome, 280, 281Brugada syndrome, 296bBruits, 348“Bubble study,” 53Buerger disease, 351–352, 351t, 352Bulbus cordis, 363Bumetanide, 420t, 421Bundle branch, 7Bundle of His, 7, 23, 262Bundle of Kent, 272Bypass tract, 291 (see also Accessory tracts)
CCABG (see Coronary artery bypass graft (CABG))Cachexia, 234Calcium channel blockers (see also Antiarrhythmic)
cardiac cell effects, 400–401cellular mechanism of, 400clinical effects of, 401–402, 401tdescription of, 400dihydropyridines, 155diltiazem, 155, 401, 401t, 402indications
angina pectoris, 155–156, 178hypertension, 321hypertrophic cardiomyopathy, 255–256myocardial infarction, 178
nifedipine, 401, 401t, 402
Atrioventricular nodeanatomy of, 7cells of, 20digitalis effects, 387, 389t
Atrioventricular reentrant tachycardias (AVRT), 291
Atrioventricular valve development, 366Atropine, 275Auscultation of heart
technique for, 35, 35Austin Flint murmur, 207Automaticity
abnormal, 268depressed, 279description of, 262digitalis effect, 388ionic basis of, 262–263, 268latent pacemakers, 267–268sinoatrial node, 266–267suppression of, 264–265
Autonomic nervous system, 266AVNRT (see Atrioventricular nodal reentrant
tachycardia (AVNRT))AVO2 difference (see Arteriovenous O2 (AVO2)
difference)AVRT (see Atrioventricular reentrant tachycardias
(AVRT))
BBacterial pericarditis, 325–326Barlow syndrome, 201Baroreceptor refl ex, 304Bernoulli equation, 54Bile acid-binding agents, 431t, 433–434Biliary colic, 149tBisferiens pulse, 206tBivalirudin, 179, 429Biventricular pacing, 240�-Blockers, 249, 253, 255 (see also Antiarrhythmic
drugs, class II)characteristics, 406–407, 407tcontraindications, 155, 177–178description of, 406–407hypertension, 320indications, 239
angina pectoris, 155, 177–178aortic dissection, 345heart failure, 407–408hypertension, 407ischemic heart disease, 407myocardial infarction, 177–178ST-segment elevation myocardial infarction, 180
side effects, 408side effects of, 155toxicity, 408types of, 407tvasospasm precipitated by, 408
Blood, oxygen-carrying capacity of, 136, 367Blood pool imaging (see Radionuclide
ventriculography (RVG))
77237_ind.indd 44177237_ind.indd 441 8/11/10 8:26:38 AM8/11/10 8:26:38 AM

Index
442
Cardiac jelly, 362Cardiac magnetic resonance imaging, 249Cardiac output
calculation of, 61, 302defi nition of, 219tFick method for measuring, 61heart failure effects, 227, 228mediators of, 219thermodilution method for measuring, 60–61
Cardiac resynchronization therapy, 249Cardiac rhythm, 87Cardiac silhouette, 45–46Cardiac tamponade
clinical features, 332–333, 332tdiagnosis of, 333echocardiographic evaluations, 55, 55etiology of, 331pathophysiology of, 331–332, 332treatment of, 333–335
Cardiac transplantation (see Heart transplantation)Cardiac troponins, 250Cardiogenic shock, 185–186Cardiomyopathy
anatomic appearance of, 245classifi cation of, 244dilated (see Dilated cardiomyopathy)echocardiographic fi ndings, 53, 55, 56thypertrophic (see Hypertrophic cardiomyopathy (HCM))restrictive (see Restrictive cardiomyopathy)
Cardiothoracic ratio, 45Cardiovascular system development
description of, 362heart loop, 362–363, 363heart tube, 362, 363septation, 363–366
Cardioversionatrial fi brillation treated using, 288tachyarrhythmias treated using, 277
Carotid sinus massage, 276Carvedilol, 239Catecholaminergic polymorphic VT, familial, 297bCatecholamines, 25–26, 140, 312Catheter ablation, 277Central adrenergic inhibitors, 404Cephalization of vessels, 46Cerebrovascular accidents, 315Cervical radiculitis, 149tCGMP (see Cyclic guanosine monophosphate (cGMP))Chemokines, 114Chest pain, 149tChest radiography (see Radiography)Cheyne–Stokes respiration, 234Chlamydia pneumoniae, 133Chlorothiazide, 420t, 421Chlorthalidone, 420t, 421Cholesterol
absorption inhibitors, 431t, 434functions of, 128intracellular content of, 128myocardial ischemia risks and, 128pathways of, 120b–121b
Calcium channel blockers (contd.)nondihydropyridine, 155vascular smooth muscle, 400verapamil, 155, 401, 401t, 402
Calcium channels, 23–25Calcium-induced calcium release (CICR), 23–25, 24Carbonic anhydrase inhibitors, 419Carcinoid syndrome, 207Cardiac catheterization, 249, 255
blood fl ow measurement using, 60–61catheter insertion and guidance, 57characteristics of, 73tcomplications associated with, 62contrast angiography performed cocurrently with,
61–62, 62description of, 56–57history of, 56–57indications
aortic regurgitation, 207aortic stenosis, 204, 377atrial septal defect, 372constrictive pericarditis, 336description of, 64tmitral regurgitation, 200mitral stenosis, 195patent ductus arteriosus, 374tetralogy of Fallot, 382ventricular septal defect, 375
pressure measurement usingpulmonary artery pressure, 59–60, 59tpulmonary artery wedge pressure, 59t, 60right atrium, 57, 57–59, 58b, 59tright ventricle, 57, 58b, 59, 59ttechnique for, 57tracings, 58b
Cardiac cellsaction potential of, 18–21automaticity of, 262–263calcium channel blockers effect, 400–401calcium ion movements in, 24depolarization of, 22–23, 75–78impulse transport in, 75–78ion channels of, 13–16pacemaker, 20–21potassium concentration in, 17repolarization of, 77, 77–78resting potential of, 16–18resting state of, 75types of, 12–13
Cardiac conduction system, 82–86, 184tcomponents of, 7
Cardiac cyclecoronary artery compression during, 137description of, 28–31jugular venous pulse fl uctuations during, 30b
Cardiac death, sudden, 250, 254, 256Cardiac function determinants
pressure–volume loops, 221–224stroke volume (see Stroke volume)
Cardiac imaging (see Imaging)Cardiac index, 61
77237_ind.indd 44277237_ind.indd 442 8/11/10 8:26:38 AM8/11/10 8:26:38 AM

Index
443
ventricular outfl ow tracts septation, 365ventricular septation, 365
in Holt–Oram syndrome, 381bincidence of, 361patent foramen ovale, 371survival rates, 361tetralogy of Fallot, 380–382transitional circulation, 369transposition of the great arteries, 382–384in Turner syndrome, 381bin Williams syndrome, 381b
Congenital long-QT syndromes, 296bCongestive heart failure (see Heart failure)Conn syndrome, 312Constrictive pericarditis
cardiac catheterization evaluations, 336clinical features of, 335–336diagnostic studies for, 336–337echocardiographic evaluations, 55–56etiology of, 335pathogenesis of, 335pathology of, 335pathophysiology of, 335restrictive cardiomyopathy, 337ttreatment of, 337
Continuity equation, 54, 54Continuous murmurs, 41, 41, 42tContractile cycle, 23–25, 25Contractility
alterations in, 223–224defi nition of, 219timpairment in, 223principles of, 140, 217, 219, 221
Contraction bands, 168, 169Contrast angiography, 61–62, 62Contrast echocardiography, 53Contrast-enhanced MRI, 70–71, 72Coronary angiography, 152Coronary arteries, 8–9
anatomy, 9anatomy of, 140–141angiography, 62external compression of, 137ischemic heart disease pathophysiology and,
141–143narrowing of, 141noninvasive imaging of, 151–152spasm of, 146stenosis of
description of, 141revascularization of, 157–159
tone of, 137, 139, 140vasoconstriction of, 140, 142vasodilatation of, 141
Coronary artery bypass graft (CABG), 158, 158–159, 159t
Coronary artery diseasecardiac catheterization fi ndings, 64tcontrast angiography fi ndings, 63coronary angiography evaluations, 152, 152echocardiographic evaluations, 54–55
Cholesterol effl ux regulatory protein, 121bCholestyramine, 430t, 431t, 433Cholinergic signaling, 26, 26–27Chordae tendineae, 4, 5, 196, 197Chylomicrons, 120bCigarette smoking
atherosclerosis and, 130hypertension and, 319
Cilostazol, 349Circulation
fetal, 367–369, 368transitional, 369
CK (see Creatine kinase (CK))Claudication, 348, 348tClopidogrel, 178, 182Coagulation necrosis, 168Coarctation of the aorta
clinical features of, 378, 378diagnostic studies of, 379hypertension caused by, 311incidence on, 378pathophysiology of, 379physical examination of, 379symptoms of, 379treatment of, 380
Cocaineacute coronary syndromes and, 166hypertension and, 309
Colesevelam, 431t, 433Colestipol, 431t, 433Collagen, 115, 341Color Doppler analysis, 54Compliance, 221–222Computed tomography, 152
description of, 67–69, 68, 69, 70, 73tdescription of, 336electron beam, 68multidetector, 68, 70spiral, 67
Concentration gradient, 13Conduction blocks
defi nition of, 269–670myocardial infarction and, 185
Congenital heart diseaseacyanotic, 369–370circulation, 367–369cyanotic, 380–382in DiGeorge syndrome, 381bin Down syndrome, 381bEisenmenger syndrome, 370, 384fetal circulation, 367–369, 368genetic abnormalities associated with, 381bheart development
aorticopulmonary septum, 365atrial septum, 363–364atrioventricular canal septation,
364–365, 365heart loop formation, 362–363, 363heart tube, 362, 363septation, 363–366valves, 366
77237_ind.indd 44377237_ind.indd 443 8/11/10 8:26:38 AM8/11/10 8:26:38 AM

Index
444
phase 4, 262–263ventricular, 82–86, 84–85, 90
Diabetes mellitusatherosclerosis risks and, 130–131glucose assessments in, 131
Diastole, 28, 29Diastolic current theory, 100Diastolic depolarization, 265Diastolic dysfunction, 170
heart failure caused by, 225, 226hypertension and, 314–315treatment of, 241
Diastolic murmursclassifi cation of, 40early, 40, 40, 42tgrading of, 37mid-to-late, 40, 40–41, 42t
Diastolic rumble, 195Diet
hypertension treated by, 318lipoprotein reductions, 128
Dietary Approaches to Stop Hypertension (DASH), 130DiGeorge syndrome, 381bDigitalis
action potential effect, 388atrioventricular node effect, 387, 389tautomaticity effect, 388clinical uses of, 389–390electrical effect, 387–389, 389tindications
antiarrhythmia, 390atrial fi brillation, 288, 390heart failure, 239, 389–390
mechanical effect, 387mechanism of action, 387–389, 388pharmacokinetics, 390Purkinje cell effects, 390toxicity, 390
Digital subtraction angiography (DSA), 62Digoxin
mitral stenosis treated using, 195Dihydropyridines, 155Dilated cardiomyopathy, 244
anatomic appearance of, 245cardiac enlargement in, 245clinical manifestations of, 248conditions associated with, 245diagnostic studies, 248–249echocardiographic fi ndings, 56texamples of, 246tfamilial forms of, 246, 247tmutations in genes coding for, 247tmyocyte damage in, 245pathology of, 246pathophysiology of, 246–248, 248physical examination, 248prognosis, 245–246, 250transverse section of heart, 247treatment
angiotensinconverting enzyme inhibitor, 249�-blocker, 249
Coronary artery disease (contd.)endothelial-dependent vasodilation impairments, 142hypertension and, 315mortality rates, 153nitrates for, 154, 155peripheral arterial disease and, 346radionuclide exercise tests for, 151
Coronary blood fl owdeterminants of, 137, 139–140during diastole, 136–137vasoconstriction effects, 165
Coronary magnetic resonance angiography, 69Coronary stents, 157, 158Coronary vascular resistance
description of, 137, 138–140neural factors that affect, 140regulation of, 137, 139–140
Coronary veins, 9–10Corrigan pulse, 206tCostochondral syndrome, 149tCough, 397COX-1, Cyclooxygenase 1 (COX–1)Coxsackievirus group B, 245C-reactive protein, 132Creatine kinase (CK), 176Cyclic AMP (cAMP), 26Cyclic guanosine monophosphate (cGMP), 138bCyclooxygenase 1 (COX-1), 424Cytochrome-P450, 426, 433Cytokines, 132Cytosol, 24, 25
DD-dimer, 357Deep venous thrombosis
calf vein, 358clinical presentation of, 357D-dimer measurements, 357description of, 355diagnosis of, 357epidemiology of, 355heparin for, 357natural history of, 355pathogenesis of, 355–357postpartum, 356predisposing conditions, 356, 356tprophylaxis against, 359pulmonary embolism secondary to, 355, 356risk factors, 356treatment of, 357–359venography evaluations, 357venous compression duplex ultrasonography, 357warfarin for, 358
Defi brillation, 277Delayed afterdepolarizations, 268–269, 269Delta wave, 273De Musset sign, 206tDepolarization
cardiac cells, 75–78diastolic, 265
77237_ind.indd 44477237_ind.indd 444 8/11/10 8:26:38 AM8/11/10 8:26:38 AM

Index
445
coarctation of the aorta, 379constrictive pericarditis, 336coronary artery disease, 54–55Eisenmenger syndrome, 384mitral regurgitation, 56tmitral stenosis, 56tmyocardial infarction, 56t, 176patent ductus arteriosus, 375pericardial disease, 55–56pericardial effusion, 331, 331pericarditis, 328–329pulmonic stenosis, 378tetralogy of Fallot, 383transposition of the great arteries, 384valvular lesions, 54ventricular assessment, 53, 53–54ventricular septal defect, 375
M-mode, 49stress, 55three-dimensional (3-D), 53transesophageal, 51–53, 52transthoracic, 50, 50–51two-dimensional (2-D)
apical views, 50, 51description of, 49–50, 50indications, 53, 55–56parasternal view, 50, 51subcostal view, 50, 51
Ectopic beat, 267–268Ectopic pacemakers, 264Ectopic rhythms
description of, 268digitalis effects, 388
Edemaacute pulmonary, 242of myocardium, 168peripheral, 233
EDHF (see Endothelium-derived hyperpolarizing factor (EDHF))
EDP (see End-diastolic pressure (EDP))EDRF (see Endothelium-derived relaxing
factor (EDRF))EDV (see End-diastolic volume (EDV))EF (see Ejection fraction (EF))Eisenmenger syndrome, 370, 384Ejection clicks, 34–35Ejection fraction (EF), 53
defi nition of, 219theart failure caused by
preserved (see Diastolic dysfunction)reduced (see Systolic dysfunction)
Elastin, 113, 115, 341Electrocardiogram (ECG), 248–249
abnormal fi ndings, 106–112calibration of machine, 86–87, 103tcardiac cell impulse physiology, 75–78description of, 75Eisenmenger syndrome, 384heart beat recordings, 82, 82heart rate assessments, 87, 88, 103theart rhythm assessments, 87, 103t
cardiac transplantation, 250diuretics, 249goals, 249medical treatment of heart failure, 249prevention and treatment of arrhythmias, 249–250prevention of thromboembolic events, 250spironolactone, 249
types of, 246tventricular dilatation associated with, 246viral myocarditis and, 245
Diltiazem, 155, 417Dipyridamole, 152, 427Disopyramide, 256, 412Diuretics
description of, 418heart failure treated using, 236–237hypertension treated using, 319loop, 419–421, 420tmechanisms of action, 418–419potassium-sparing, 420t, 422thiazide, 237, 420t, 421–422types of, 420t
Dobutamine, 152, 391t, 392, 394tDopamine, 391–392, 391t, 394tDoppler
aortic regurgitation evaluations, 207indications
aortic stenosis, 204mitral regurgitation, 200
transesophageal, 213transthoracic, 212
Doppler imaging, 51, 51, 54Down syndrome, 381bDoxazosin, 321, 405, 406tDressler syndrome, 187, 326Drug-eluting stents, 158DSA (see Digital subtraction angiography (DSA))Ductus arteriosus
defi nition of, 368, 368–369patent (see Patent ductus arteriosus)
Ductus venosus, 367Duplex ultrasonography, 349Duroziez sign, 206tDyspnea, 148, 194, 232, 235, 327
EEarly afterdepolarizations, 268, 268–269EBCT (see Electron beam computed tomography (EBCT))ECG (see Electrocardiogram (ECG))Echocardiography, 249, 255
contrast, 53description of, 49Doppler
description of, 51, 51indications
aortic regurgitation, 56taortic stenosis, 56tatrial septal defect, 372cardiac tamponade, 333cardiomyopathy, 53, 55, 56t
77237_ind.indd 44577237_ind.indd 445 8/11/10 8:26:38 AM8/11/10 8:26:38 AM

Index
446
ischemic heart disease pathophysiology and, 141–143
platelets and, interaction between, 143vasoactive substances produced by, 139
Endothelin-1, 139–140, 230Endothelium
acetylcholine effects, 139anatomy of, 114dysfunction of, 117, 117–118, 165permeability of, 118vascular smooth muscle relaxation, 139vasoactive substances derived from, 139, 139
Endothelium-derived hyperpolarizing factor (EDHF), 139
Endothelium-derived relaxing factor (EDRF), 138b
End-systolic pressure-volume relation (ESPVR), 222
End-systolic volume (ESV), 222Epicardium, 4Epinephrine, 391t, 392Eplerenone, 239, 422Epsilon wave, 296bEptifi batide, 427Escape beat, 267Escape rhythms
defi nition of, 267, 281junctional, 281, 281–282ventricular, 281, 281–282
Esophageal spasm, 149t, 173tESPVR (see End-systolic pressure-volume
relation (ESPVR))Essential hypertension
abnormalities in, 305defi nition of, 301epidemiology of, 304–305experimental fi ndings in, 305genetics of, 304–305insulin and, 305–306natural history of, 306–308obesity and, 306prevalence of, 306severity of, 317
Estrogenatherosclerosis risks and, 131hormone replacement therapy, 131
ESV (see End-systolic volume (ESV))Ethacrynic acid, 420t, 421Ewart sign, 330Excitation-contraction coupling
�-adrenergic signaling, 25–26, 26calcium ion movements during, 24cholinergic signaling, 26, 26–27description of, 23
Exercisehypertension treated by, 318lipoprotein reductions, 128myocardial oxygen supply and demand
during, 136Exercise stress test, angina pectoris evaluations,
150–151
Electrocardiogram (ECG) (contd.)indications
angina pectoris, 149–150, 174, 174–175, 175aortic stenosis, 204arrhythmogenic right ventricular dysplasia, 296batrial fi brillation, 287atrial premature beats, 285, 285Brugada syndrome, 296binfective endocarditis, 212–213left bundle branch block, 94, 95mitral regurgitation, 200mitral stenosis, 195mitral valve prolapse, 202myocardial infarction, 97–98, 100, 101sinus bradycardia, 108–109sinus tachycardia, 283–284, 284ventricular hypertrophy, 109, 111
leadsbipolar, 79, 79–80, 80tchest, 80, 81, 83, 85electrical activity magnitude and direction, 81placement positions for, 78, 78–79, 79unipolar, 79, 79, 80t
mean QRS axis, 87–92, 89–91normal fi ndings, 104–105paper for, 86, 86, 87pericardial effusion, 331pericarditis, 328–329PR interval, 87, 89t, 103tP wave
abnormalities of, 92, 92defi nition of, 82
QRS complexabnormalities of, 92–98, 103tbundle branch blocks fi ndings, 93–97, 94description of, 82escape rhythm fi ndings, 281, 281–282myocardial infarction fi ndings, 97–98shapes of, 82–83, 83ventricular hypertrophy fi ndings, 92–93, 93ventricular tachycardia fi ndings, 295
QRS interval, 87, 89t, 103tQT interval, 87, 89t, 103tST interval
deviations of, 98–102, 101, 103televations of, 150
transposition of the great arteries, 384T wave
abnormalities of, 98–102, 103tdefi nition of, 82
ventricular septal defect, 375Electron beam computed tomography (EBCT), 68End-diastolic pressure (EDP), 220, 220–221End-diastolic volume (EDV), 220, 220–221, 222Endocardium
description of, 2injury of, 210
Endomyocardial biopsy, transvenous, 258Endothelial cells
dysfunction of, 117, 117–118, 142, 143functions of, 114, 115
77237_ind.indd 44677237_ind.indd 446 8/11/10 8:26:38 AM8/11/10 8:26:38 AM

Index
447
GGadolinium-enhanced magnetic resonance imaging,
70–71, 72Gastroesophageal refl ux, 149tGATA4, 381bG-cyclase (see Guanylyl cyclase (G-cyclase))Gemfi brozil, 431t, 435Genetic abnormalities
arrhythmias, 296b–297bcongenital heart disease and, 381b
Genetic predisposition, atherosclerosis risks and, 133Giant cell arteritis, 351, 351tGlucocorticoids, 312Glycoprotein (GP) IIb/IIIa receptor antagonists,
178–179, 423, 427G protein, 25–26G protein–coupled receptors, 403Great vessels
dilatation of, 45–46transposition of, 382, 382–384
Guanylate cyclase, 399, 402Guanylyl cyclase (G-cyclase), 138b
HHDL (see High-density lipoprotein (HDL))Heart
activation sequence for, 82–86anteroposterior view of, 2apex of, 1–2auscultation of, 35, 35base of, 2cardiac skeleton of, 2endocardium, 2epicardium, 4and great vessels, anterior and posterior view of, 3myocardium, 2, 4physiology of, 217–224surface anatomy of, 2
Heart developmentaorticopulmonary septum, 365atrial septum, 363–364atrioventricular canal septation, 364–365, 365heart loop formation, 362–363, 363heart tube, 362, 363septation, 363–366valves, 366ventricular outfl ow tracts septation, 365ventricular septation, 365
Heart failure, 248, 249acute, 241–242aortic stenosis-related, 203–204apoptosis in, 231atrial fi brillation associated with, 239cardiac catheterization fi ndings, 64tcardiac function determinants
pressure–volume loops, 221–224stroke volume (see Stroke volume)
cardiac output decreases caused by, 227, 228Cheyne–Stokes respiration associated with, 234clinical manifestations of, 232–235
Extracellular matrix, 115Extra diastolic heart sounds, 35–36, 42tExtra systolic heart sounds, 34–35, 42tExtremities, 353Ezetimibe, 434
FFalse aortic aneurysms, 340, 341Familial catecholaminergic polymorphic VT,
297bFamilial hypercholesterolemia, 128Fast sodium ion channels, 13–16
gating of, 16mechanism of, 17bstructure of, 14three-dimensional schematic of, 15
Fatty streakdescription of, 116, 117fi brous plaque transition of, 119, 122illustration of, 122
Fenofi brate, 435Fenoldopam, 398t, 400Fetal circulation
description of, 367–369schematic diagram of, 368transition to normal circulation, 369
Fibrates, 431t, 435Fibrin clots, lysis of, 163Fibrinolytic therapy
blood fl ow restoration using, 181contraindications, 181ST- segment elevation myocardial infarction treated
using, 180–182, 181Fibromuscular dysplasia, 311Fibrosis, 170Fick method, 61First-degree atrioventricular block, 282, 282First heart sounds
characteristics of, 42tdescription of, 29, 31intensity of, 31, 31tproduction of, 31–32
Fixed splitting, 33, 34Flecainide, 413Fluoro-18 deoxyglucose, 66Fluvastatin, 431, 431t, 433Foam cell formation, 119, 122Fondaparinux, 179Foramen ovale
defi nition of, 364, 364patent, 371
Fourth heart sound, 36Framingham Heart Study, 127Frank–Starling mechanism, 246–247Frank–Starling relationship
description of, 198, 217, 219, 220, 221heart failure, 227, 227
Free fatty acids (FFA), 120Furosemide, 420t, 421Fusiform aneurysm, 341
77237_ind.indd 44777237_ind.indd 447 8/11/10 8:26:38 AM8/11/10 8:26:38 AM

Index
448
Heart soundsextra diastolic, 35–36, 42textra systolic, 34–35, 42tfi rst (see First heart sounds)fourth, 36“gallops,” 36myocardial infarction, 173pericardial knock, 36second (see Second heart sounds)third, 35–36
Heart transplantationdilated cardiomyopathy treated using, 250heart failure treated using, 240
Heart valvesaortic (see Aortic valve)embryologic development of, 366mitral (see Mitral valve)prosthetic, 51, 208, 208–209pulmonary (see Pulmonary valve)
Hemiblocks, 95Hemorrhagic pericarditis, 327Hemostasis, 162Heparan sulfate, 162Heparin
deep venous thrombosis treated with, 358low molecular weight, 179, 428–429myocardial infarction treated using, 179ST- segment elevation myocardial infarction
treated using, 180unfractionated, 178, 428unstable angina treated using, 180
Heparin-induced thrombocytopenia (HIT), 428Hereditary amyloidosis, 257 (see also Amyloidosis)Hibernating myocardium, 144
nuclear imaging fi ndings, 65, 67tHigh-density lipoprotein (HDL), 120bHill sign, 206tHis–Purkinje system, 7–8HIT (see Heparin-induced thrombocytopenia (HIT))HMG-CoA reductase, 121b, 128HMG-CoA reductase inhibitors (see also Statins)
description of, 128, 431mechanisms of action, 431–433types of, 431, 431t
Holosystolic murmurs (see Pansystolic murmurs)
Holt–Oram syndrome, 381bHomocysteine, 132Hormone replacement therapy, 131Hydralazine, 238, 321, 326, 398, 398tHydrochlorothiazide, 420t, 421Hypercoagulability, 356, 356tHyperglycemia, 422Hyperkalemia, 397Hyperpolarization, 265Hyperpolarizing current, 265Hypertension
accelerated-malignant, 317antihypertensive therapy, 130arterial narrowing associated with, 315atherosclerosis risk and, 130
Heart failure (contd.)compensatory mechanisms
adrenergic nervous system, 228–229antidiuretic hormone, 229description of, 226–227Frank–Starling mechanism, 227, 227natriuretic peptides, 229–230neurohormonal alterations, 227–230, 228renin–angiotensin–aldosterone system, 229ventricular hypertrophy and remodeling, 230
defi nition of, 216description of, 216laboratory tests and fi ndings, 234–235left-sided
acute pulmonary edema associated with, 242characteristics of, 226
mitral regurgitation associated with, 234myocyte loss and cellular dysfunction secondary to,
230–231New York Heart Association classifi cation of, 233torthopnea associated with, 232pathophysiology of
description of, 224–225diastolic dysfunction, 225, 226systolic dysfunction, 225, 225–226, 238
physiology of, 217–224precipitating factors, 231, 231twith preserved EF, 225, 226prevalence of, 216–217prognosis, 235radiographic fi ndings, 48, 49twith reduced EF, 225, 225–226right-sided, 226, 226tsigns and symptoms of, 232–234, 232tsinus tachycardia fi ndings, 234stages of, 233ttachyarrhythmias effect, 231treatment of, 241
aldosterone antagonist therapy, 239–240angiotensin-converting enzyme inhibitors, 237–238�-adrenergic agonists, 238–239biventricular pacing, 240cardiac transplantation, 240digitalis, 239diuretics, 236–237goals of, 235–236inotropic drugs, 238–239nitrates, 237phosphodiesterase inhibitors, 239resynchronization therapy, 240spironolactone, 239vasodilators, 237–238
tricuspid regurgitation associated with, 234wall stress increases, 220–221
Heart loop, 362–363, 363Heart murmurs (see Murmurs)Heart rate
electrocardiogram assessments of, 87, 88, 103t
myocardial oxygen demand and, 140parasympathetic nervous system effects, 266
77237_ind.indd 44877237_ind.indd 448 8/11/10 8:26:38 AM8/11/10 8:26:38 AM

Index
449
smoking cessation, 319sympatholytic agents, 321vasodilators, 321weight reduction, 318
Hypertensive crisis, 317Hypertensive encephalopathy, 317Hypertensive retinopathy, 317Hypertrophic cardiomyopathy (HCM), 244
anatomic appearance of, 245angina pectoris associated with, 254atrial fi brillation associated with, 253, 254, 256clinical fi ndings, 254diagnostic studies, 255echocardiographic fi ndings, 56tetiology, 250–251genetic counseling for patients with, 256genetic testing in, 255murmurs, 255
effects of maneuvers on, 254tmutations in genes coding for, 247tpathology, 251pathophysiology, 252, 253
HCM with outfl ow obstruction, 252–254HCM without outfl ow tract obstruction, 252
physical examination, 254–255postmortem heart specimen, 251prognosis, 256–257risk factors for sudden death due to, 254surgical therapy in, 256treatment, 255–256two-dimensional echocardiographic
fi ndings, 53ventricular fi brillation in, 254
Hypertrophic myocardium, light microscopy of, 251Hypertrophy, ventricular
concentric, 230eccentric, 230hypertension and, 314–315left, 92–93, 93QRS complex abnormalities associated with, 92–93,
93, 109, 111radiographic fi ndings, 45right, 92, 93wall stress effects, 140, 230
Hyperuricemia, 422Hypokalemia, 390, 420, 421Hyponatremia, 421–422Hypotension, 396
IIbutilide, 416ICAM-1 (see Intercellular adhesion molecule 1
(ICAM-1))ICD therapy, in hypertrophic cardiomyopathy, 256IDL (see Intermediate-density lipoprotein (IDL))IL-6 (see Interleukin-6 (IL-6))Imaging
cardiac catheterization (see Cardiac catheterization)computed tomography, 67–69, 68, 69, 70, 73t, 336echocardiography (see Echocardiography)
consequences of, 313coronary artery disease caused by, 315defi nition of, 301–302essential
abnormalities in, 305defi nition of, 301epidemiology of, 304–305experimental fi ndings in, 305genetics of, 304–305insulin and, 305–306natural history of, 306–308obesity and, 306prevalence of, 306severity of, 317
incidence of, 301mild, 318nephrosclerosis, induced by, 316organ damage caused by
aorta, 315cerebrovascular system, 315description of, 314–315diastolic dysfunction, 314–315heart, 314kidneys, 316–317left ventricular hypertrophy, 314–315overview of, 314tretina, 317systolic dysfunction, 315vasculature abnormalities, 313–314
pulmonary, 47, 404renovascular, 310–311secondary
adrenocortical hormone excess, 312–313coarctation of the aorta, 311defi nition of, 301–302description of, 308tevaluation of, 309laboratory tests, 309medications, 309pheochromocytoma, 312renal parenchymal disease, 310thyroid hormone abnormalities, 313
signs and symptoms of, 313stroke caused by, 314–315treatment of
ACE inhibitors, 321alcohol reduction, 319angiotensin II receptor blockers, 322antihypertensive medications, 319–323, 322t�-blockers, 321, 407calcium channel blockers, 321centrally acting �2-adrenergic agonists, 321dietary changes, 318diuretics, 319exercise, 318hydralazine, 398, 398tnonpharmacologic treatment, 318–319pharmacologic treatment, 319–323potassium levels, 318–319relaxation therapy, 319salt restriction for, 318
77237_ind.indd 44977237_ind.indd 449 8/11/10 8:26:38 AM8/11/10 8:26:38 AM

Index
450
heart failure treated using, 238–239mechanism of action, 387–389phosphodiesterase-3 inhibitors, 393pulmonary edema treated using, 242sympathomimetic amines (see Sympathomimetic
amines)vasopressin, 393
Inotropic state (see Contractility)Insulin, 305Insulin resistance, 305Intercalated disk, 11Intercellular adhesion molecule 1 (ICAM-1), 118Interleukin-6 (IL-6), 115Intermediate-density lipoprotein (IDL), 120b, 128Internal jugular (IJ) veins, 30bInternal mammary artery grafts, 158Interventricular septum (IVS), 5–7, 251Intima
anatomy of, 113, 114, 340functions of, 113leukocyte adherence to, 118lipoprotein retention in, 118
Intra-aortic balloon pump, 186Intracardiac pressure tracings, 58bInward rectifi er potassium channels, 17Ion channels
description, 13energetics of, 13fast sodium, 13–14, 16, 17bgating, 13permeability of, 13–16selectivity, 13structure of, 14, 15voltage sensitive, 13
Iron chelation therapy, 258Ischemic heart disease
adaptations, 347chest pain associated with, 149tcholesterol levels and, 128consequences of, 144–147electrocardiographic fi ndings, 149–150exercise stress test for, 150–151factors contributing to, 254myocardial effects, 143–144nuclear imaging fi ndings, 67tpathophysiology of, 141–143
endothelial cell dysfunction, 142–143fi xed vessel narrowing, 141–142myocardial oxygen alterations, 144
prevention of, 156–157recurrent, 154–156silent
characteristics of, 146–147defi ned, 136tdescription of, 135
treatment ofacute episodes, 153–154, 154tcoronary artery bypass graft surgery, 158,
158–159, 159tpercutaneous coronary interventions,
157–158, 159t
Imaging (contd.)magnetic resonance angiography, 69magnetic resonance imaging
applications of, 69–70characteristics of, 73tcontrast-enhanced, 70–71, 72principles of, 69–71
nuclearcharacteristics of, 73tdescription of, 62myocardial metabolism assessments, 66–67myocardial perfusion assessments, 62–63, 65–66pharmacologic agents, 66positron emission tomography, 66–67, 73tradioisotopes, 62–63, 65radionuclide ventriculography, 66stress studies, 65–66
Immune responseendothelial cell role in, 114
Implantable cardioverter-defi brillator (ICD), 249tachyarrhythmias treated using, 277
Impulseblockade of, 269–272conduction of
accessory tracts, 272–273altered, 269–273process of, 22reentry, 270–273, 271system for, 7–8
formation ofabnormal automaticity, 268automaticity, 262–263description of, 262escape rhythms, 267latent pacemakers assumption of, 267–268overdrive suppression, 264–265pacemakers, 263–264triggered activity, 268–269
Indapamide, 420t, 421Infective endocarditis (IE), 256
acute, 211causes of, 210tclassifi cation of, 209–210description of, 209–210echocardiographic fi ndings, 212–213electrocardiographic fi ndings, 212–213infl ammatory response to, 212microorganisms associated with, 211t, 213, 213tmortality rates, 209murmur associated with, 211pathogenesis of, 210–211prophylaxis, 213, 213tprosthetic valves and, 209skin manifestations of, 212subacute, 211treatment of, 213, 213t
Inferior vena cava, 367–368Infl ammatory mediators, 119Inotropic drugs, 253
description of, 386–387digitalis (see Digitalis)
77237_ind.indd 45077237_ind.indd 450 8/11/10 8:26:38 AM8/11/10 8:26:38 AM

Index
451
depolarization of, 83, 85diastolic dysfunction, 170dilatation of, 205enlargement of, 197, 200interior structures of, 6
Lepirudin, 429Leukocytes
pericarditis and, 327recruitment of, 118–119
Levine sign, 147Lidocaine, 412–413Lipid-regulating drugs
bile acid-binding agents, 431t, 433–434cholesterol absorption inhibitors, 431t, 434fi brates, 431t, 435HMG-CoA reductase inhibitors (see HMG-CoA
reductase inhibitors)niacin, 431t, 434–435sites of action, 432
Lipoprotein (a), 132Lipoprotein lipase, 120b–121bLipoprotein(s)
atherosclerosis and, 118, 127–130classifi cation of, 118high-density, 120bintermediate-density, 120b, 128low-density (see Low-density lipoproteins (LDL))lowering of, 128–130, 129oxidation of, 118reduction methods
diet, 128exercise, 128lipid-regulating drugs (see Lipid-regulating drugs)statins, 128–130, 129
transport of, 120b–121bvery low density
atherosclerosis risks and, 128characteristics of, 120b
LMWH (see Low molecular weight heparin (LMWH))Local metabolites, 142Lovastatin, 431, 431t, 433Low-density lipoproteins (LDL)
atherosclerosis risks and, 127–128characteristics of, 118familial hypercholesterolemia, 128serum levels of, 128subclasses of, 128
Low molecular weight heparin (LMWH), 178 (see also Heparin)
Lown–Ganong–Levine syndrome, 293LPFB (see Left posterior fascicular block (LPFB))Lymphatic vessels, 10
MMagnetic resonance angiography (MRA), 69Magnetic resonance imaging (MRI)
applications of, 69–70characteristics of, 73tcontrast-enhanced, 70–71, 72principles of, 69–71
percutaneous transluminal coronary angioplasty, 157–158
pharmacologic agents, 153–156revascularization, 157–159
Ischemic preconditioning, 170–171Isoelectric complex, 91Isometric contraction, 217Isoproterenol, 391t, 392–393Isosorbide dinitrate, 238, 398, 403Isosorbide mononitrate, 403Isovolumetric contraction, 222Isovolumetric relaxation, 222
JJaneway lesions, 212Jones criteria for rheumatic fever, 191, 192tJugular venous pulsations, 30bJunctional escape rhythms, 281, 281–282JUPITER trial, 132
KKerley B lines, 49, 235Kidneys
glomerular fi ltration rate, 418hypertension effects, 316–317tubules of, 419, 419
Kussmaul sign, 258, 335
LLactate dehydrogenase, 334LAFB (see Left anterior fascicular block (LAFB))Laplace’s relationship, 140Latent pacemaker, 264Late systolic murmurs, 38, 40, 42tLBBB (see Left bundle branch block (LBBB))LCAT (see Lecithin cholesterol acyltransferase (LCAT))Lecithin cholesterol acyltransferase (LCAT), 121bLeft anterior descending coronary artery, 8, 9Left anterior fascicular block (LAFB), 95, 96Left atrial pressure (LAP), 61Left atrium
anatomy of, 5compliance of, 198, 219tinterior structures of, 6mitral stenosis pathophysiology, 194pressure measurement, 198pressure measurements, 57
Left bundle branch, 7Left bundle branch block (LBBB)
description of, 34electrocardiographic fi ndings, 94, 95QRS complex abnormalities associated with, 95
Left main coronary artery, 8Left posterior fascicular block (LPFB), 96, 97Left-to-right shunting, 370Left ventricle
anatomy of, 5aneurysm of, 187
77237_ind.indd 45177237_ind.indd 451 8/11/10 8:26:38 AM8/11/10 8:26:38 AM

Index
452
natural history of, 194opening snap associated with, 35, 195open mitral commissurotomy, 196pathology of, 192pathophysiology of, 192–194, 193percutaneous balloon mitral valvuloplasty, 196pulmonary artery pressure in, 192, 194pulmonary capillary wedge pressure associated
with, 60radiographic fi ndings, 46, 49t, 195treatment of, 195–196
Mitral valveanatomy of, 5development of, 367echocardiographic evaluation of, 195opening of, 35prolapse, 201–202regurgitation of (see Mitral regurgitation)replacement of, 201
M-mode echocardiography, 49Möbitz block
type I, 282, 282–283type II, 283, 283
Moderator band, 4Monocyte chemotactic protein 1 (MCP-1), 118MRA (see Magnetic resonance angiography (MRA))MRI (see Magnetic resonance imaging (MRI))99mTc-sestamibi, 65Müller sign, 206tMultidetector computed tomography, 68, 70Multifocal atrial tachycardia (MAT), 293–294, 294Murmurs (see also Hypertrophic cardiomyopathy
(HCM), murmurs)continuous, 41, 42tdefi nition of, 36descriptive terms for, 36–37diastolic (see Diastolic murmurs)infective endocarditis, 211location of, 37of LV outfl ow obstruction, 254maximum intensity locations for, 43mechanisms of, 36in mitral stenosis, 195of mitral valve regurgitation, 248pitch of, 37shape of, 37squatting position and, 255standing position and, 255systolic (see Systolic murmurs)timing of, 36of tricuspid valve regurgitation, 248
Myocardial biopsy, 255Myocardial cells
depolarization of, 265, 266gap junctions, 263–264repolarization of, 265
Myocardial infarctionangiotensin-converting enzyme inhibitors, 157�-Blockers for, 155catecholamine release secondary to, 172cell death mechanisms, 168
Magnetic resonance venography, 357MAT (see Multifocal atrial tachycardia (MAT))MCP-1 (see Monocyte chemotactic protein 1 (MCP-1))Mean arterial pressure (MAP), 61Mean pulmonary artery pressure (MPAP), 61Mean QRS axis, 87–92, 89–91Media
anatomy of, 113, 114, 340degeneration of, 341
Membrane potential, 263, 268Mesenchymal tissue, 367Metabolic acidosis, 400Metabolic syndrome, 131Metolazone, 420t, 421Metoprolol, 239Mexiletine, 413MIBI (see 99mTc-sestamibi)Milrinone, 393, 394tMineralocorticoids, 312Minoxidil, 321, 398–399, 398tMitral regurgitation
acute, 197, 198–199cardiac catheterization fi ndings, 64tcharacteristics of, 214tchronic, 197, 199clinical manifestations of, 199–200description of, 32Doppler color fl ow mapping of, 51echocardiographic fi ndings, 56t, 200electrocardiographic fi ndings, 200etiology of, 196–197in heart failure, 234hemodynamic profi le of, 198left ventricle enlargement and, 197natural history of, 200–201pansystolic murmur caused by, 39pathophysiology of, 197, 197–199physical examination fi ndings, 199–200pulmonary capillary wedge pressure associated
with, 60radiographic fi ndings, 49t, 200regurgitant fraction in, 198rheumatic fever and, 197treatment of, 200–201
Mitral stenosisacute rheumatic fever and, 192cardiac catheterization fi ndings, 64t, 195characteristics of, 214tclinical manifestations of, 194–195complications of, 194description of, 32diagnostic fi ndings, 194diastolic murmurs caused by, 40–41dyspnea associated with, 194echocardiographic fi ndings, 56t, 195electrocardiographic fi ndings, 195etiology of, 192evaluation of, 194–195hemodynamic profi le of, 193left atrium effects, 192murmurs associated with, 195
77237_ind.indd 45277237_ind.indd 452 8/11/10 8:26:38 AM8/11/10 8:26:38 AM

Index
453
contractility of, 140, 217, 219, 219t, 221edema of, 168hibernating, 65, 67t, 144ischemia effects, 143–144metabolism, 66–67necrosis, 173, 175perfusion, 62–63, 65–66stunned, 144, 170viability assessments, 66
Myocytesaction potential of, 19active transporters of, 12calcium levels in, 168contractile proteins, 23, 23–25, 25cotransporters of, 12description of, 10destruction of, 230–231injured, 168ion channels of, 12, 24loss of, 230–231permeability of, 18potassium channels of, 17–18refractory period, 21, 21–22relaxation of, 26repolarization of, 77, 77–78resting potential of, 18, 22tubular systems of, 11ultrastructure of, 10
Myofi brils, 10Myomectomy, 256Myopathy, 433Myosin, 23Myosin-binding protein C, 250�-Myosin heavy chain (�-MHC), 250
gene, mutations in, 251
NNational Cholesterol Education Program, 128Native pacemakers, 264Natriuretic peptides, 229–230, 403–404NBTE (see Nonbacterial thrombotic
endocarditis (NBTE))Neoplastic pericarditis, 326Nephrosclerosis, hypertension-induced, 316Nesiritide, 238, 394, 403–404New York Heart Association (NYHA)
heart failure classifi cation of, 233tNiacin, 431t, 434–435Niemann-Pick C1–like 1 protein, 434Nifedipine, 155Nitrates, 256
adverse effects, 403agents, 403heart failure, 237hemodynamic effects, 402–403indications
angina pectoris, 154, 155, 178coronary artery disease, 154, 155myocardial infarction, 178
mechanism of action, 402, 402
chest pain associated with, 173clinical features of, 174tcomplications of
arrhythmias, 184–185description of, 183, 183Dressler syndrome, 187myocardial dysfunction, 185–186papillary muscle rupture, 186pericarditis, 187, 326recurrent ischemia, 183, 184right ventricular infarction, 186thromboembolism, 187ventricular aneurysm, 187ventricular free wall rupture, 186ventricular septal rupture, 186–187
defi ned, 136tdiagnosis of
creatine kinase levels, 176echocardiography, 176electrocardiographic fi ndings, 97–98, 100–102electrocardiography, 175serum markers, 175troponin levels, 175–176
echocardiographic fi ndings, 56theart sounds, 173localization of, 97tnon–Q-wave, 162, 171nuclear imaging fi ndings, 67tpain associated with, 172prevention of, 156–157Q-wave, 98, 100, 162, 171risk stratifi cation and management, 187–188signs and symptoms of, 172–173, 172tsubendocardial, 167transmural, 167, 170ttreatment of
anti-ischemic agents, 177–178antithrombotic agents, 178–179, 182aspirin, 178, 180�-blockers, 177–178, 180calcium channel blockers, 178clopidogrel, 178conservative vs. early invasive approaches,
179–180description of, 177fi brinolytic agents, 180–182, 181heparin, 179, 180nitrates, 178percutaneous coronary intervention, 182statins, 182–183
ventricular remodeling, 171Myocardial ischemia (see Ischemic heart disease)Myocardial oxygen supply and demand
alterations in, 143–144descriptions of, 136determinants of, 137, 140–141
Myocardial perfusion, assessment of, 66Myocarditis, viral, 245Myocardium
blood vessels of, 167coagulative necrosis of, 167
77237_ind.indd 45377237_ind.indd 453 8/11/10 8:26:38 AM8/11/10 8:26:38 AM

Index
454
OOcclusive arterial diseases
acute arterial occlusion, 349–350peripheral artery disease (see Peripheral artery
disease)vasculitic syndromes (see Vasculitic syndromes)
Ohm’s law, 141Opening snap, associated with mitral stenosis, 195Open mitral commissurotomy, 196Oral anticoagulation therapy, 250Orthopnea, 232Orthostatic hypotension in restrictive
cardiomyopathy, 257Orthostatic lightheadedness, 254Osler nodes, 212Ostium primum, 364Ostium secundum, 364, 370Overdrive suppression, 264–265
PPacemaker, 249
latent, 264, 267–268native, 264permanent, 275temporary, 275
Pacemaker cellsaction potential of, 20, 263anatomic connections, 265description of, 262electrical coupling of, 265membrane potential of, 263repolarization phase, 263sinoatrial node, 262voltage gated, 267
Pacemaker currentalterations in, 263, 264defi nition of, 262
Pacing, 240Pansystolic murmurs, 38, 39, 42tPapillary muscle
anatomy of, 4rupture of, 186
Papilledema, 317Paradoxical embolism, 349Paradoxical splitting, 33, 34Parietal pericardium, 2, 2, 324Paroxysmal nocturnal dyspnea (PND), 232Paroxysmal supraventricular tachycardias (PSVT)
characteristics of, 288–293Wolff–Parkinson–White syndrome and, 291–292,
291–293Partially occlusive thrombus, 162Parvovirus B19, 245Patch-clamp recordings, 12Patent ductus arteriosus
diagnostic studies, 375incidence of, 374pathophysiology of, 374–375physical examination, 375
Nitrates (contd.)nitroglycerin (see Nitroglycerin)pharmacokinetics, 403vascular smooth muscle effects, 402
Nitric oxide (NO)actions of, 138b, 139description of, 117platelet effects, 164relaxation effects of, 142
Nitric oxide synthase, 138bNitroglycerin
intravenous, 403sublingual
angina pectoris managed using, 148, 154description of, 138bhemodynamic effects, 402–403pharmacokinetics, 403
transdermal, 403Nkx2.5, 381bNO (see Nitric oxide (NO))Nocturnal cough, 232Nonbacterial thrombotic endocarditis
(NBTE), 210Non-Q-wave myocardial infarction,
162, 171Non-ST-segment elevation myocardial infarction
(NSTEMI)description of, 161, 166, 172electrocardiography fi ndings, 174treatment of
angiotensin-converting enzyme inhibitors, 182anti-ischemic agents, 177–178antithrombotic agents, 178–179�-blockers, 177–178calcium channel blockers, 178clopidogrel, 178conservative vs. early invasive approaches,
179–180heparin, 179nitrates, 178statins, 182–183
Nontuberculous bacterial pericarditis, 325Norepinephrine, 391t, 392NSTEMI (see Non-ST-segment elevation myocardial
infarction (NSTEMI))Nuclear imaging
angina pectoris evaluations, 151characteristics of, 73tdescription of, 62ischemic heart disease evaluations, 151myocardial assessments
metabolism, 66–67perfusion, 62–63, 65–66
pharmacologic agents, 66positron emission tomography,
66–67, 73tradioisotopes, 62–63, 65radionuclide ventriculography, 66stress studies, 65–66
NYHA (see New York Heart Association (NYHA))
77237_ind.indd 45477237_ind.indd 454 8/11/10 8:26:38 AM8/11/10 8:26:38 AM

Index
455
visceral, 324volume–pressure relationship of, 330
Peripartum cardiomyopathy, 246Peripheral �-adrenergic receptor antagonists,
404–406, 406tPeripheral artery disease
claudication associated with, 348, 348tclinical presentation of, 347–349description of, 346diagnosis of, 347–349etiology of, 346–347exercise capacity reduction, 346–347ischemic ulcers caused by, 346, 348pathogenesis of, 346–347physical examination of, 348treatment of, 349
Peripheral edema, 233Peripheral pruning, 47, 49Peripheral vascular diseases
defi nition of, 339occlusive arterial diseases (see Occlusive
arterial diseases)Raynaud phenomenon, 352–353, 353
Permanent pacemaker, 275Peroxisomal proliferation activating receptor-�
(PPAR-�), 128PET (see Positron emission tomography (PET))Phenoxybenzamine, 406, 406tPhentolamine, 406, 406tPheochromocytoma, 312Phlebotomy, 258Phosphodiesterase inhibitors, 239
type 3, 393, 394ttype 5, 404
Phospholamban, 26Phospholipase A2, 423Physiologic splitting, 32, 33PISA (see Proximal isovelocity surface area (PISA))Plateau, 19Platelet-derived growth factor (PDGF), 122Platelet(s)
activation of, 165aggregation of, 142, 165endogenous inhibition of, 164endothelial cells and, interaction between, 143nitric oxide effects, 164vasoconstricting actions of, 142
Pleural effusions, 46, 48, 49PND (see Paroxysmal nocturnal dyspnea (PND))Pneumonia, 173tPneumothorax, 173tPoiseuille’s law, 141, 346Polymorphic ventricular tachycardia, 269, 272,
276, 296bPositron emission tomography (PET), 66, 73tPosteroanterior radiographs
cardiac silhouette, 46description of, 45, 46
Postpericardiotomy pericarditis, 326Postphlebitic syndrome, 356
symptoms of, 375treatment of, 375
PCW (see Pulmonary capillary wedge pressure (PCW))
PDGF (see Platelet-derived growth factor (PDGF); Platelet-derived growth factor (PDGF))
Peptic ulcer disease, 149tPercutaneous balloon mitral valvuloplasty, 196Percutaneous coronary intervention (PCI)
angina pectoris treated using, 157–158, 159tischemic heart disease treated using,
157–158, 159tST- segment elevation myocardial infarction
treated using, 182Percutaneous septal ablation, 256Percutaneous transluminal coronary angioplasty,
157–158Perfusion pressure, 137Pericardial effusion
clinical features of, 330, 330tdiagnostic studies of, 330–331echocardiographic evaluations, 55etiology of, 329pathophysiology of, 329treatment of, 331
Pericardial friction rub, 327–328Pericardial knock, 36Pericardiocentesis, 328, 334Pericarditis
causes of, 325tchest pain associated with, 149tclinical features of, 327–328, 327tconnective tissue diseases associated with, 326diagnostic studies of, 328differential diagnosis of, 173tdrug-induced, 326, 326techocardiographic evaluations, 55–56electrocardiogram in, 328, 328etiology of, 325–326hemorrhagic, 327idiopathic, 325myocardial infarction related, 325–326myocardial infarction-related, 187neoplastic, 326nontuberculous bacterial, 325pathogenesis of, 327pathology of, 327purulent, 325radiation-induced, 326serofi brinous, 327serous, 327suppurative, 327treatment of, 329tuberculous, 325uremic, 326viral, 325
Pericardiumanatomy of, 1–2, 2, 324functions of, 324–325parietal, 324
77237_ind.indd 45577237_ind.indd 455 8/11/10 8:26:39 AM8/11/10 8:26:39 AM

Index
456
radiographic fi ndings of, 378symptoms of, 378systolic ejection murmur caused by, 38–39treatment of, 378
Pulse pressure, 206, 206tPulsus alternans, 234Pulsus paradoxus, 333, 335Purkinje fi bers, 7–8, 23Purulent pericarditis, 325, 329PVR (see Pulmonary vascular resistance (PVR))
QQRS interval, 87, 89t, 103t, 250QT interval
congenital long-QT syndromes, 296b–297bdescription of, 87, 89t, 103t
Quadruple rhythm, 36Quincke sign, 206tQuinidine, 410Q-wave myocardial infarction, 162, 171Q waves, 255
RRadiography
cardiac silhouette, 45–46characteristics of, 73tfrontal view, 45, 45indications
aortic regurgitation, 207atrial septal defect, 371coarctation of the aorta, 379constrictive pericarditis, 336mitral stenosis, 195
lateral view, 45, 45posteroanterior view of, 45–46, 46principles of, 44–45pulmonary manifestations, 46, 49
Radionuclide ventriculography (RVG), 66Ranolazine, 156RAP (see Right atrial pressure (RAP))Raynaud phenomenon, 352–353, 353RBBB (see Right bundle branch block (RBBB))Reactive oxygen species, 117, 118Reentry
interruption of, 276mechanisms of, 270–272, 271
Renal insuffi ciency, 396, 412Renal parenchymal disease, 310Renin–angiotensin–aldosterone system
drug interactions, 396theart failure-related compensatory response, 229inhibition of, 237schematic diagram of, 310, 395
Renovascular hypertension, 310–311Repolarization
in congenital long-QT syndromes, 296bdelayed afterdepolarizations, 268–269, 269description of, 77, 77–78, 102
Resting state, 75
Potassium equilibrium potential, 18PPAR-� (see Peroxisomal proliferation activating
receptor-� (PPAR-�))Pravastatin, 431, 431t, 433Prazosin, 405, 406tPreganglionic parasympathetic fi bers, 8Pregnancy, peripartum cardiomyopathy
during, 246Preload
alterations in, 222defi nition of, 219tdescription of, 217, 219–220reduction method, 242
Pressure natriuresis, 303Pressure–volume loops, 221, 221–224Primary aldosteronism, 312Primary pulmonary hypertension, 404PR interval
description of, 87, 89t, 103tfi rst-degree atrioventricular block, 282
Proarrhythmia, 276Procainamide, 326, 326t, 410–412Propafenone, 413Prostacyclin, 139, 164Prosthetic heart valves, 51, 208, 208–209Protamine sulfate, 428Protein C, 163Protein S, 163Proximal isovelocity surface area (PISA), 54Pseudoaneurysm, 186, 341Pulmonary artery, 46, 46
catheter, 60pressure, 59–60, 59t, 194wedge pressure, 59t, 60
Pulmonary blood fl ow, 46Pulmonary capillary hydrostatic pressure, 225Pulmonary capillary wedge pressure
(PCW), 60Pulmonary edema, 242Pulmonary embolism, 173t, 231, 355, 356tPulmonary hypertension
primary, 404radiographic fi ndings, 47
Pulmonary valveanatomy, 4–5development of, 366regurgitation of, 40, 208stenosis of (see Pulmonic stenosis)
Pulmonary vascular resistance (PVR)calculation of, 61perinatal, 373postnatal changes, 374
Pulmonary vasculature, 46, 47, 369Pulmonary venous pressure, 46Pulmonic ejection click, 35Pulmonic regurgitation, 208Pulmonic stenosis, 208
diagnostic studies of, 378pathophysiology of, 377–378physical examination of, 378radiographic fi ndings, 49t
77237_ind.indd 45677237_ind.indd 456 8/11/10 8:26:39 AM8/11/10 8:26:39 AM
Index
457
Sick sinus syndrome (SSS), 280, 281Sildenafi l, 404Silent ischemia, 135, 136t, 146–147Simvastatin, 431, 431tSingle photon emission computed tomography
(SPECT), 63, 64, 73tSinoatrial node
anatomy, 7automaticity alterations, 266–267pacemaker cells of, 262suppression of, 267
Sinus, defi nition of, 87Sinus bradycardia
defi nition of, 87, 279etiology of, 279management of, 280myocardial infarction-related, 185
Sinus rhythm, 87, 250, 258Sinus tachycardia
characteristics of, 284–285defi nition of, 87electrocardiographic fi ndings, 284–285, 285in heart failure, 234myocardial infarction-related, 185
Sinus venosus, 362, 363Sinus venosus defect, 370–371Smoking
atherosclerosis and, 130hypertension and, 319
Smooth muscle cells, vascularatherosclerotic role of, 119, 122description of, 115
Sodium nitroprusside, 138b, 398t, 399, 399–400
Sotalol, 416SPECT (see Single photon emission computed
tomography (SPECT))Spiral CT, 67–68, 69Spironolactone, 249, 422Splitting of second heart sound
fi xed, 33, 34paradoxical, 33, 34physiologic, 32, 33widened, 33, 33–34
Squatting position and murmurs, 255 (see also Murmurs)
SREBP (see Sterol regulatory element binding protein (SREBP))
SSS (see Sick sinus syndrome (SSS))Stable angina
causes of, 144, 145coronary angiography evaluations, 152defi nition of, 136tdiagnostic studies for, 149–153differential diagnosis of, 148, 149telectrocardiographic fi ndings, 149, 150exercise echocardiography evaluations, 151–152exercise stress test for, 150, 151frequency of, 148history-taking fi ndings, 147–149location of, 147
Restrictive cardiomyopathy, 244anatomic appearance of, 245clinical fi ndings, 257–258constrictive pericarditis vs., 337tdiagnostic studies, 258echocardiographic fi ndings, 56texamples of, 257tpathophysiology, 257, 258physical examination, 258treatment, 258
Retinopathy, hypertensive, 317Rheumatic fever, 190–192, 192t
mitral regurgitation and, 197Right atrial pressure (RAP), 61Right atrium
anatomy of, 2, 4–5, 5pressure measurements, 57, 57–59, 58b, 59t
Right bundle branch, 7Right bundle branch block (RBBB)
electrocardiographic fi ndings, 94, 95QRS complex abnormalities associated with,
93, 94, 95Right-to-left shunting, 371Right ventricle
anatomy of, 4–5, 226failure of, 226infarction of, 186–187pressure measurements, 57, 58b, 59, 59t
Right ventricular heave, 234Rosuvastatin, 431, 431t, 433Roth spots, 212RVG (see Radionuclide ventriculography (RVG))Ryanodine receptors, 24
SSalt restriction, 258Sarco(endo)plasmic reticulum Ca�� ATPase
(SERCA), 25Sarcolemma, 11, 12–13Sarcomeres, 10–11Sarcoplasmic reticulum (SR), 11–12SBE (see Subacute bacterial endocarditis (SBE))Secondary aldosteronism, 312Second-degree atrioventricular block, 282–283,
282–283Second heart sound
abnormalities of, 32–33in atrial septal defect, 371characteristics of, 42tdescription of, 29, 31production of, 32splitting of, 32–34, 33, 377
Semilunar valves, 366Senile amyloidosis, 257 (see also Amyloidosis)Septum primum, 363, 364Septum secundum, 364Serofi brinous pericarditis, 327Serous pericarditis, 327Serum electrolytes, 249Shunting, 370
77237_ind.indd 45777237_ind.indd 457 8/11/10 8:26:39 AM8/11/10 8:26:39 AM

Index
458
epinephrine, 391t, 392isoproterenol, 391t, 392–393norepinephrine, 391t, 392
Syncope, 254Syndrome X, 147Systemic vascular resistance (SVR), 61Systole
blood fl ow during, 136–137description of, 28–29, 29, 31
Systolic dysfunctiondescription of, 170heart failure caused by, 225, 225–226hypertension and, 315treatment of (see Heart failure, treatment of)
Systolic murmursclassifi cation of, 37, 38grading of, 37late, 38, 40, 42tpansystolic, 38, 39, 42tsystolic ejection murmurs, 38, 39, 42t
TTachyarrhythmias (see also Arrhythmias)
atrial fi brillation (see Atrial fi brillation)atrial fl utter, 285–287atrial premature beats, 185, 285, 285defi nition of, 284differential diagnosis, 284impulse formation and conduction alterations, 262mechanisms of, 274ttachycardia (see Tachycardia)treatment of
cardioversion, 277catheter ablation, 277defi brillation, 277implantable cardioverter defi brillators, 277pharmacologic, 276vagotonic maneuvers, 276
types of, 280tTachycardia
atrioventricular nodal reentrant, 289–291atrioventricular reentrant, 291concealed accessory pathways, 293ectopic trial, 293multifocal atrial, 293–294, 294paroxysmal supraventricular, 288–293sinus
characteristics of, 284–285defi nition of, 87electrocardiographic fi ndings, 284–285, 285in heart failure, 234myocardial infarction-related, 185
ventricular, 295, 295–298, 297bTachypnea, 234, 242Takayasu arteritis, 342, 342t, 350TBX1, 381bT cells, 118, 164Technetium-99m, 63TEE (see Transesophageal echocardiography (TEE))Temporary pacemaker, 275
Stable angina (contd.)natural history of, 153nitroglycerin for, 148nuclear studies for, 151oxygen supply inadequacies associated with, 146pathophysiologic fi ndings, 145physical examination fi ndings, 148, 149precipitants of, 148quality of, 147risk factors, 148signs and symptoms of, 147–148treatment of, 153, 154t
Standing position and murmurs, 255 (see also Murmurs)
Staphylococcus aureus endocarditis, 209Statins, 128–130, 129, 156, 182–183 (see also HMG-
CoA reductase inhibitors)“Steal” phenomenon, 66Stents, coronary, 157, 158Sterol regulatory element binding protein
(SREBP), 121bStethoscopes, 31, 31Streptokinase, 180Stress echocardiography, 55, 151–152Stress nuclear imaging studies, 65Stress tests, 150–153Stroke volume
afterload, 217, 219t, 220–221contractility, 219t, 221defi nition of, 219tpreload, 217, 219–220, 219t
ST-segment elevation myocardial infarction (STEMI)description of, 162, 172electrocardiography fi ndings, 174treatment of
angiotensin-converting enzyme inhibitors, 182antithrombotic agents, 182�-blockers, 180description of, 180fi brinolytic agents, 180–182, 181heparin, 180percutaneous coronary intervention, 182statins, 182–183
Stunned myocardium, 144, 170Subacute bacterial endocarditis (SBE), 209Subendocardial infarcts, 167Sudden death, 250, 254, 256
implantable cardioverter defi brillators for, 277Summation gallop, 36Superoxide anion, 118Suppurative pericarditis, 327Supraventricular arrhythmias, 185Surgical therapy in hypertrophic cardiomyopathy, 256SVR (see Systemic vascular resistance (SVR))Swan–Ganz catheter, 57Sympatholytic agents, 321Sympathomimetic amines
cAMP formation, 390defi nition, 390dobutamine, 391t, 392, 394tdopamine, 391–392, 391t, 394t
77237_ind.indd 45877237_ind.indd 458 8/11/10 8:26:39 AM8/11/10 8:26:39 AM

Index
459
opening of, 35stenosis of, 58, 207
Triggered activitydescription of, 268–269treatment of, 409–410
Triglycerides, 120bTropomyosin, 23Troponins (Tn), 23
defi ned, 175I, 175myocardial necrosis detection by, 176myocardial necrosis diagnosed by, 175–176T, 175
Truncus arteriosus, 363TS (see Tricuspid stenosis (TS))TTE (see Transthoracic echocardiography (TTE))T tubules, 11Tuberculous pericarditis, 325Tumor necrosis factor-� (TNF-�), 115Turner syndrome, 378, 381bTwo-dimensional (2-D) echocardiography
apical views, 50, 51description of, 49–50, 50indications
coronary artery disease, 55pericardial disease, 55–60ventricular assessments, 53, 53–54
parasternal view, 50, 51subcostal view, 50, 51
UUnfractionated heparin, 178, 428 (see also Heparin)Unidirectional block, 270–272Unstable angina
characteristics of, 146clinical features of, 174tclinical presentation of, 171–172complications of, 183defi nition of, 136tdiagnosis of, 174pathophysiologic fi ndings, 145treatment of
anti-ischemic agents, 177–178antithrombotic agents, 178–179�-blockers, 177–178calcium channel blockers, 178clopidogrel, 178conservative vs. early invasive approaches,
179–180heparin, 179nitrates, 178
Uremic pericarditis, 326
VValsalva maneuver, 254–255 (see also Hypertrophic
cardiomyopathy (HCM))Valvular heart disease
mitral valve prolapse, 201–202pulmonic regurgitation, 40, 208
Terazosin, 405, 406tTerminal cisternae, 11Tetralogy of Fallot, 380–382TFPI (see Tissue factor pathway inhibitor (TFPI))Thallium-201 (201Tl)
imaging, 62, 65Thermodilution method, 60–61Thiazide diuretics, 237Thienopyridines, 178Third-degree atrioventricular block, 283–284, 284Third heart sound, 35–36Three-dimensional (3-D) echocardiography, 53
(see also Echocardiography)Thrombin, 163, 165Thromboembolism, 187Thrombogenic potential, 123, 124, 125Thrombolysis in Myocardial Infarction (TIMI) risk
score, 179–180Thrombolytic therapy, 178–179, 182 (see also
Fibrinolytic therapy)Thrombomodulin, 163Thrombophlebitis, superfi cial, 359Thrombosis
antithrombotic agents, 162–164consequences of, 166formation of, 165–166partially occlusive, 162pathogenesis of, 164–166, 166signifi cance of, 165–166, 166
Thromboxane (TXA2), 178, 423Ticlopidine, 426TIMI risk score (see Thrombolysis in Myocardial
Infarction (TIMI) risk score)Tirofi ban, 427Tissue factor pathway inhibitor (TFPI), 162Tissue plasminogen activator (tPA), 163, 180,
181, 182Titin, 23TNF-� (see Tumor necrosis factor-� (TNF-�))Torsades de pointes, 295, 298, 298–299Torsemide, 420t, 421Total peripheral resistance (TPR), 227TPA (see Tissue plasminogen activator (tPA))TPR (see Total peripheral resistance (TPR))Trabeculae carneae, 4Transesophageal echocardiography (TEE), 51–53,
52, 213Transmural infarcts, 167, 170tTransposition of the great arteries,
382–384Transthoracic echocardiography (TTE), 50,
50–51, 212Traube sign, 206tTriamterene, 422Tricuspid regurgitation, 39, 234Tricuspid regurgitation (TR), 207–208Tricuspid stenosis (TS), 207Tricuspid valve
anatomy of, 4development of, 366insuffi ciency of, 64t
77237_ind.indd 45977237_ind.indd 459 8/11/10 8:26:39 AM8/11/10 8:26:39 AM

Index
460
outfl ow tractsseptation of, 365
remodeling, 171right (see Right ventricle)septal rupture, 186–187septation of, 365two-dimensional echocardiography assessments,
53, 53–54wall stress, 140, 220–221, 230
Ventricular ectopic beatsmyocardial infarction-related, 185
Ventricular end-diastolic volume, 224Ventricular escape rhythms, 281, 281–282Ventricular fi brillation
characteristic of, 299, 299in hypertrophic cardiomyopathy, 254, 255
Ventricular fi llingin dilated cardiomyopathy, 248in hypertrophic cardiomyopathy, 255in restrictive cardiomyopathy, 257, 258
Ventricular free wall rupture, 186Ventricular hypertrophy
concentric, 230eccentric, 230hypertension and, 314–315left, 92–93, 93QRS complex abnormalities associated with, 92–93,
93, 109, 111radiographic fi ndings, 45right, 92, 93wall stress effects, 140, 230
Ventricular myocardial cellshistology of, 10–11
Ventricular premature beats (VPB), 294, 294–295Ventricular septal defect
clinical features of, 372, 372–373diagnostic studies of, 373left-to-right shunting associated with, 373pansystolic murmurs caused by, 39pathophysiology of, 373physical examination of, 373symptoms of, 373treatment of, 373–374
Ventricular septal rupture, 186–187Ventricular stroke volume, 223–224Ventricular tachycardia, 295, 295–298, 297bVenturi forces, 252–253Verapamil, 155, 253Very low density lipoproteins (VLDL)
atherosclerosis risks and, 128characteristics of, 120b
Viral myocarditis, 245Visceral pericardium, 1, 2VLDL (see Very low density lipoproteins (VLDL))Voltage-sensitive gating, 13VPB (see Ventricular premature beats (VPB))
WWall stress, 220–221, 230Warfarin, 250, 358
Valvular heart disease (contd.)pulmonic stenosis, 208tricuspid regurgitation, 39, 207–208tricuspid stenosis, 58, 207
Valvular lesions, echocardiographic fi ndings, 54Variant angina
characteristics of, 146defi nition of, 136tpathophysiologic fi ndings, 145
Varicose veins, 353–355, 354Vascular cell adhesion molecule 1 (VCAM-1), 118Vascular endothelial growth factor, 349Vascular smooth muscle cells
atherosclerotic role of, 119, 122description of, 115
Vasculitic syndromescharacteristics of, 351tdescription of, 350giant cell arteritis, 351, 351tTakayasu arteritis, 350thromboangiitis obliterans, 351–352, 351t
Vasoconstrictiondescription of, 138b, 140inappropriate, 142platelet, 142torsional stress caused by, 165
Vasodilatation, 142, 164Vasodilators, 256
angiotensin-converting enzyme inhibitors (see Angiotensin-converting enzyme (ACE) inhibitors)
angiotensin II receptor blockers (see Angiotensin II receptor blockers (ARB))
description of, 138b, 139–140, 142, 143direct-acting, 398–400, 398tfenoldopam, 398t, 400heart failure treated using, 237–238hydralazine, 321, 326, 398, 398tmechanism of action, 393–394minoxidil, 321, 398–399, 398tnesiritide, 238, 394, 403–404nitrates (see Nitrates)sites of action, 395sodium nitroprusside, 138b, 398t, 399, 399–400
Vasopressin, 393VCAM-1 (see Vascular cell adhesion molecule 1
(VCAM-1))Veins, 353–355, 354Venography, 357Venous compression duplex ultrasonography, 357Venous insuffi ciency, 348Venous thrombosis (see Deep venous thrombosis)Venous vasodilators, 237Ventricles of heart
contraction of, 29depolarization, 82–86, 84–85, 90description of, 4–5free wall rupture, 186gallop of, 36heart failure-related compensatory response, 230nuclear imaging assessments, 67t
77237_ind.indd 46077237_ind.indd 460 8/11/10 8:26:39 AM8/11/10 8:26:39 AM

Index
461
XX-rays (see Radiography)
YYellow softening, 170
ZZona glomerulosa, 404
Wavy myofi bers, 168Wenckebach block, 282, 282Wide complex tachycardias, 297tWidened splitting, 33, 33–34Williams syndrome, 381bWolff-Parkinson-White (WPW) syndrome, 272–273,
291–292, 291–293WPW syndrome (see Wolff-Parkinson-White (WPW)
syndrome)
77237_ind.indd 46177237_ind.indd 461 8/11/10 8:26:39 AM8/11/10 8:26:39 AM