Embed Size (px)
Citation preview
deep decarbonizationpathways to
in China
CN 20 15 Report
Publishers : Teresa Ribera, Jeffrey Sachs Managing editors : Henri Waisman, Laura Segafredo, Roberta Pierfederici Copy editing : Courtney Lee AdamsGraphic design : Ivan Pharabod, Christian Oury, Eva Polo Campos
Deep Decarbonization Pathways ProjectThe Deep Decarbonization Pathways Project (DDPP), an initiative of the Sustainable Develop-ment Solutions Network (SDSN) and the Institute for Sustainable Development and International Relations (IDDRI), aims to demonstrate how countries can transform their energy systems by 2050 in order to achieve a low-carbon economy and significantly reduce the global risk of catastrophic climate change. Built upon a rigorous accounting of national circumstances, the DDPP defines transparent pathways supporting the decarbonization of energy systems while respecting the specifics of national political economy and the fulfillment of domestic devel-opment priorities. The project currently comprises 16 Country Research Teams, composed of leading research institutions from countries representing about 70% of global GHG emissions and at very different stages of development. These 16 countries are: Australia, Brazil, Canada, China, France, Germany, India, Indonesia, Italy, Japan, Mexico, Russia, South Africa, South Korea, the United Kingdom, and the United States.
Published by Sustainable Development Solutions Network (SDSN) and Institute for Sustainable Development and International Relations (IDDRI)
The full report is available at deepdecarbonization.org
DisclaimerThis report was written by a group of independent experts who have not been nominated by their governments. Any views expressed in this report do not necessarily reflect the views of any government or organization, agency or program of the United Nations.
Copyright © 2015 SDSN - IDDRI
This copyrighted material is not for commercial use or dissemination (print or electronic). For personal, corporate or public policy research, or educational purposes, proper credit (bibliographical reference and/or corresponding URL) should always be included.
Cite this report as Teng, F et al. (2015). Pathways to deep decarbonization in China, SDSN - IDDRI.
The National Center for Climate Change Strategy and International Cooperation (NCSC) is an institutional organiza-tion directly subordinate to the National Development and Reform Commission (NDRC) and the only national-level research center that works on climate change strategy and international cooperation. NCSC conducts systematic studies on climate change strategic planning, policies and regulations, international negotiation and cooperation, statistics and assessment, carbon market management and information consulting. There are more than 70 re-searchers working in NCSC, who have accumulated wide international views and rich experiences with a long-term involvement into many international and national key studies on environmental economy, energy and climate change.
Institute of Energy, Environment and Economy (3E) was established in 1980 in Tsinghua University. 3E is a pioneer and a top think tank in terms of research on energy systems analysis and climate change in China. 3E has more than 30 full time researchers working on energy and climate change model, energy strategy and planning, low carbon development, international climate regime, new and renewable energy, energy efficiency and energy conservation.
The Institute for Sustainable Development and International Relations (IDDRI) is a non-profit policy research insti-tute based in Paris. Its objective is to determine and share the keys for analyzing and understanding strategic issues linked to sustainable development from a global perspective. IDDRI helps stakeholders in deliberating on global governance of the major issues of common interest: action to attenuate climate change, to protect biodiversity, to enhance food security and to manage urbanization, and also takes part in efforts to reframe development pathways.
The Sustainable Development Solutions Network (SDSN) was commissioned by UN Secretary-General Ban Ki-moon to mobilize scientific and technical expertise from academia, civil society, and the private sector to support of prac-tical problem solving for sustainable development at local, national, and global scales. The SDSN operates national and regional networks of knowledge institutions, solution-focused thematic groups, and is building SDSNedu, an online university for sustainable development.
Acknowledgements
The China 2015 DDPP report has benefited from discussion with many experts in various institutes. In particular, the authors would like to thank the experts involved in various consultation workshops that have provided valuable input to this study. The team also would like to thank the financial support provided by the Children’s Investment Fund Foundation (CIFF) and German Development Institute and the support provided by the IDDRI and DDPP secretariat. The team is grateful for Heri Waisman and Thomas Spencer for their helpful comments on the draft report.
Country report authorsNCSC: Qiang LIU, Yi CHEN, Chuan TIAN, Xiaoqi ZHENG
Tsinghua: Fei TENG, Alun GU, Xi YANG, Xin WANG
This report was jointly prepared by National Center for Climate Strategy and International Cooperation (NCSC) and Institute of Energy, Environment and Economy, Tsinghua University
September 2015
1 Pathways to deep decarbonization in China � 2015 report
Executive summary 3
1. Country Profile 5
1.1. The national context for deep decarbonization and sustainable development 5
1.2. GHG emissions: Current levels and drivers and past trends 7
2. National deep decarbonization pathways 10
2.1. Assumptions of economic and social development 10
2.2. Illustrative Deep Decarbonization Pathway for China: High-level characterization 11
3. Characterization of sectors 15
3.1. Power sector 15
3.2. End-use sectors 16
4. Key factor analysis 21
4.1. Replacing coal with electricity 21
4.2. Electrification rate of the transport sector 21
4.3. The development of CCUS 22
5. Challenges, opportunities, and enabling conditions 24
6. The change of narrative: From cost to benefit 26
7. Policy recommendation 27
Standardized DDPP graphics for China scenarios 31
CN – Central Scenarios 32
CN – High EV 34
CN – Low CCS 36
Contents
deep decarbonizationpathways to
in China

Pathways to deep decarbonization in China � 2015 report 2
3 Pathways to deep decarbonization in China � 2015 report
Executive summary
This China country report by the country team in the Deep decarbonization pathway project (DDPP) summarize the key findings of the technical pathways developed by the Chinese team, with a view to achieve deep reduction in the longer term for China. The forthcoming Paris climate conference will lay out a foundation for the future international climate regime building upon the intended nationally determined contributions (INDC) submitted by various Parties. As the largest developing countries, China is also in the frontline to combat with climate change. This country report start by summarizing the national circumstance of China which set an important narrative to understand China’s mitigation policies. Decision makers in China are facing multiple challenges including further develop its economy to enter into high income stage, secure its energy system to power ongoing urbanization and industrialization, improve air quality to enhance public health and local environment and control carbon emission to manage the long-term climate risk. To cope with climate change is no longer regarded as a cost, but rather an opportunity to help China deliver those social economic objective in terms of better growth, better environment and better energy infrastructure. From that perspective, a low carbon pathway is largely consistent with China’s domestic interest. A deep decarbonization pathway therefor is developed in this report to illustrate the possible trajectory that lead China to a low carbon future. A more detailed analysis is also conducted at sector level to analyze the possible technical solution for the transition towards a deep decarbonization pathway. We also consider three key factors which may have important impact on the deep decarbonization pathway of China, including the replacement for coal with electricity in industry sector, the penetration rate of electric cars in transportation sector and the potential of carbon capture, utilization and storage (CCUS). The DDPP is illustrative for China and associated challenges are also identified which includes the uncertain GDP growth in the future, the adjustment of economic structure and change of development mode, the development of non-fossil fuel

Pathways to deep decarbonization in China � 2015 report 4
Executive summary
in energy sector and behavior change in the urbanization process. All those factors suggest a strong policy response is needed for China to such transition towards a deep decarbonization pathways. Finally we provide several policy recommendation which we believe is necessary for China to decaronize its economy and energy system. Firstly, China need to gradually promote the transition from carbon in-tensity control towards total emission control. Secondly, this policy intervention will create space to internalize the cost of carbon and China should rely more on market based measure to guide the action of various stakeholders. The market and internalization of carbon cost will increase the competitiveness of low carbon technology and accelerate the transition to a low carbon energy system. Thirdly, the reform is required for Chinese statistical system to improve accountability and progress track. Last but not least, the consumer behavior should be carefully consider during the policy design.
Country Profile
5 Pathways to deep decarbonization in China � 2015 report
1Country Profile
1.1 The national context for deep decarbonization and sustainable development
As a result of China’s rapid economic growth, its carbon emissions per capita have nearly quad-rupled since 1990. In 2007, China surpassed the US as the world’s largest CO2 emitter,1 and as of 2013 the country accounts for about 27% of world GHG emissions. However, according to most indicators, China remains a developing country: Its income per capita remains well be-low that of developed countries (even in eastern China, where the level of development is much higher than the national average).China’s future development needs are expected to drive up both its energy consumption and its CO2 emissions. Considering China’s increasing-ly large share of global emissions, the country’s active engagement in addressing climate change is a prerequisite to establish emissions guidelines compatible with the predicted 2-degree temper-ature increase by the end of the century. Howev-er, China’s rapidly increasing energy consumption, which is dominated by coal usage, has created additional environmental problems, including lo-cal air pollution and depletion of water resources, as well as surging CO2 emissions. In light of the urgent need to tackle climate change and other serious local environmental issues, China needs to transit to a low-carbon development pathway while meeting its domestic development needs.
a) Growing China’s economy is still at the top of the political agenda.For a number of pragmatic reasons, the government of China remains focused on economic growth.
First, China still needs to grow its economy in order to alleviate poverty, despite three decades of miraculous development. As of 2008, nearly 13% of the total population – approximately 170 million people – were still living on less than US$2.00 (2005 PPP) a day, the poverty line drawn by the World Bank.Second, local governments in China, especially those in the western provinces, need to maintain high economy growth in order to generate suf-ficient revenue to cover the costs of various re-sponsibilities required by upper level governments including (but not limited to) social security, edu-cation, medical care, public security, environmen-tal protection, and rural and urban infrastructure. The current taxation system concentrates the ma-jority of tax revenue in the budgets of the central government, but the transfer payments do not ensure distribution of adequate financial resourc-es to where they are needed. It is an open secret that local governments have to generate their own revenue by encouraging business growth and investment as well as infrastructure development.Third, local government officials are highly mo-tivated to expand the economy rapidly, because their individual promotion is closely linked to the growth rates they achieve. The need to transition to a more sustainable development pattern is consistent with the concept of “the new normal” in China’s economy, which refers to a new pattern of economic growth amid the maturing of the Chinese economy. Adapting to “the new normal” is a strategic choice by the government to help the economy maintain steady and healthy develop-ment despite a slower growth rate. Under the new normal, China will shift from high-speed growth to moderately high growth. A growth model that
1
1 In this report, CO2 emissions (carbon emissions) refers to fossil-fuel CO2 emissions
Country Profile
Pathways to deep decarbonization in China � 2015 report 6
relies on blind investment, unscrupulous use of resources, and neglect of environmental protec-tion will gradually be eliminated, and the growth model’s focus will shift from quantity and speed to quality and efficiency.
b) Ongoing urbanization and industrializa-tion processes have long-term implications for China’s emission trajectories and energy consumption.Industrial production coupled with economic growth has boosted China’s massive urbaniza-tion at a rate and on a scale unprecedented in the world. Each year, millions of rural workers move into cities, motivated by the prospect of higher wages. In 2011, China’s urban population exceeded its rural population for the first time in history; by 2030, another 330 million people are expected to move into cities. These new urban residents will increase the demand for infrastructure, building materials and consumer goods. Consequently, more energy will be con-sumed and more carbon will be emitted, but ad-vancement in energy efficiency and non-fossil fuels fails to keep pace with the increase of en-ergy consumption needs. On average in 2012, China’s urban residents consumed 1.4 times more direct energy than its rural residents;2
that gap further increases when the energy embedded in goods is taken into considera-tion. These urbanization trends have long-term implications for climate policy. Rising urban demand necessitates investments in capacity that may lock in energy-intensive infrastruc-ture and industrial arrangements that will prove difficult to alter in the near future. In parts of western and central China, where the process of economic growth has been particularly pro-nounced in recent years, this lock-in effect on an energy- and emission-intensive path is al-ready taking place.
c) Balancing energy security and environ-mental protection is a significant challenge for China’s energy systemChina’s energy system faces many problems, three of which are particularly prominent: (1) Barriers to transitioning to new energy sourc-es. Ch ina’s total energy demand continues to grow. Although investment in renewable energy and energy conservation has devel-o ped rapidly in recent years, total energy demand has increased even fas ter, leading to increases in the consumption of coal, oil, and other fossil fuels. Specifically, under a coal-dominated natural resource endowment, which makes coal much cheaper than other energies, it’s difficult for China to diversify its energy supply. (2) Fossil-fuel-related pollution. Increased us-age of fossil fuel energy has caused serious problems for the environment, an issue that has attracted more and more attention. The thick fog and haze that fills the air of Beijing, Tianjin, and Hebei province is caused by both coal combustion and vehicle exhaust emissions and contains dangerous levels of particulate matter (PM 2.5).(3) Increasing d epend ence on foreign ener-gy. China’s growing energy demand has also caused China to rely more and more on foreign sources of energy. By 2020, the share of im-ported oil is expected to reach 70%, and the share of imported natural gas, 50%, creating problems for China’s energy security and trade balance. Conflicts and geopolitical tensions in energy supply countries could cause temporary shortages and rising prices, posing a risk to the stability of China’s economy. China could reduce its dependence on foreign energy by producing more coal domestically, but th is would cause other problems, especially those related to environment concerns.
2 Data are retrieved from China’s energy statistical yearbook 2013
Country Profile
7 Pathways to deep decarbonization in China � 2015 report
d) Air quality has become the number one cause of social instability in China, and the way China controls its air pollution will have a significant impact on efforts to address global climate change.China’s poor air quality has become the number one cause of social unrest and a threat to political stability. It is also causing millions of premature deaths every year and costing billions dollars in environmental damage. Fine particles — includ-ing soot, organics, and sulphates — have a severe effect on human health and are implicated in climate change. They are emitted by combustion and industrial processes and formed via the reac-tions of gaseous pollutants. If China’s proposed air quality standard were achieved everywhere in the country, there would be far-reaching benefits beyond the protection of human health, includ-ing a slowdown of greenhouse gas emissions. (Air and mercury pollution in the entire Northern Hemisphere would also fall.)On February 29th 2012, China’s State Council approved its first national environmental stand-ard for limiting the amount of PM2.5 particles3 in the air to an annual average of 35 micrograms per cubic metre by the end of 2015, consistent with the recommendations of the World Health Organization. In September 2013, the State Council unveiled its long-awaited “Atmospheric Pollution Prevention Action Plan” in response to the severe air pollution that has increasing-ly damaged China. The goal of the new plan is to improve the air quality of the entire country by 2017, while imposing strict air-pollution-re-duction guidelines in three key industrial areas surrounding Beijing, Shanghai, and Guangzhou. The way in which air quality in China is con-trolled will affect global climate in complicated ways. On one hand, reducing soot emissions by cutting coal use or using cleaner stoves will de-crease radiative forcing and thus limit warming,
benefiting both the climate and public health. A stricter emissions standard for diesel vehicles, which produce soot, is another win-win solution. On the other hand, reductions in SO2 emissions from power plants would reduce atmospheric sulphate concentrations, thereby increasing ra-diative forcing and imposing a short-term detri-mental effect on the climate. A multi-pollutant abatement strategy that considers how to con-trol various pollutants and sources must there-fore be developed.
e) China’s INDC SubmissionChina was the first emerging economy to submit its Intended Nationally Determined Contribution (INDC). It did so on the last day of June 2015. China’s submission includes four key points: first, China’s emission level is to peak by around 2030 (consistent with the joint announcement China made with the US in November 2014); second, China’s carbon intensity (emissions per unit of GDP) is to fall by 60%-65% from the 2005 level by 2030; third, China’s share of non-fossil fuel primary energy (including nuclear, renewables, and hydro) is to rise to around 20% by 2030; and, finally, China’s stock of forests is to increase by around 4.5 billion cubic meters by 2030.
1.2 GHG emissions: Current levels and drivers and past trends
Over the last decade, the Government of China has recognized climate change as a major issue related to the overall situation of economic and social development, and has incorporated an active response to climate change into its medium and long-term economic and social development plans. In 2006, China introduced an obligatory target of a 20% decrease in ener-gy consumption per unit GDP in 2010 relative to 2005. In 2007 a national plan to combat cli-
3 Particles that measure less than 2.5 micrometres in diameter
Country Profile
Pathways to deep decarbonization in China � 2015 report 8
mate change among developing countries was developed and implemented. in 2009 China officially pledged to reduce CO2 emissions per unit of GDP by 40% to 45% from 2005 to 2020 before the United Nations Climate Change Conference (UNFCCC) in Copenhagen (COP15) . Since the 11th Five-Year Plan (2005 to 2010), China has accelerated transformation of its economic development model and has made remarkable progress in controlling greenhouse gas emissions through the implementation of notable measures favouring adjustments of the industrial and energy s tructure, energy savings, improvements in energy efficiency, and increase of carbon sequestration. During the period of the 11th Five-Year Plan, China achieved its energy-saving targets, with energy consumption per unit of GDP in 2010 dropping 19.1% from 2005, which led to a decrease of CO2 emissions of more than 1.46 billion tons. In the three years preceding the 12th Five-Year Plan (2011 to 2013), energy consumption per unit of GDP was cumulatively reduced by 9.03% and carbon intensity was reduced by 10.68%. Through the end of 2013, carbon intensity in China has accumulatively declined 28.5% as compared with 2005 levels. Water and electricity capacity has been increased, wind power capacity has been increased, and China leads the world in solar water heater collector area, rural biogas users, and artificial forestation area. From the period of the 6th Five-Year Plan (1981 to 1985) to the period of the 11th Five-Year Plan (2005 to 2010), energy intensity reduc-tion has always been the leading factor in the decrease of carbon emissions intensity. During the period of the 11th Five-Year Plan, techno-logical renovation and upgrading of traditional light and heavy industries has been constantly strengthened; the intensity of energy per unit of added value in key energy-intensive indus-tries has decreased by 23.4%, 15.1%, 35.8%,
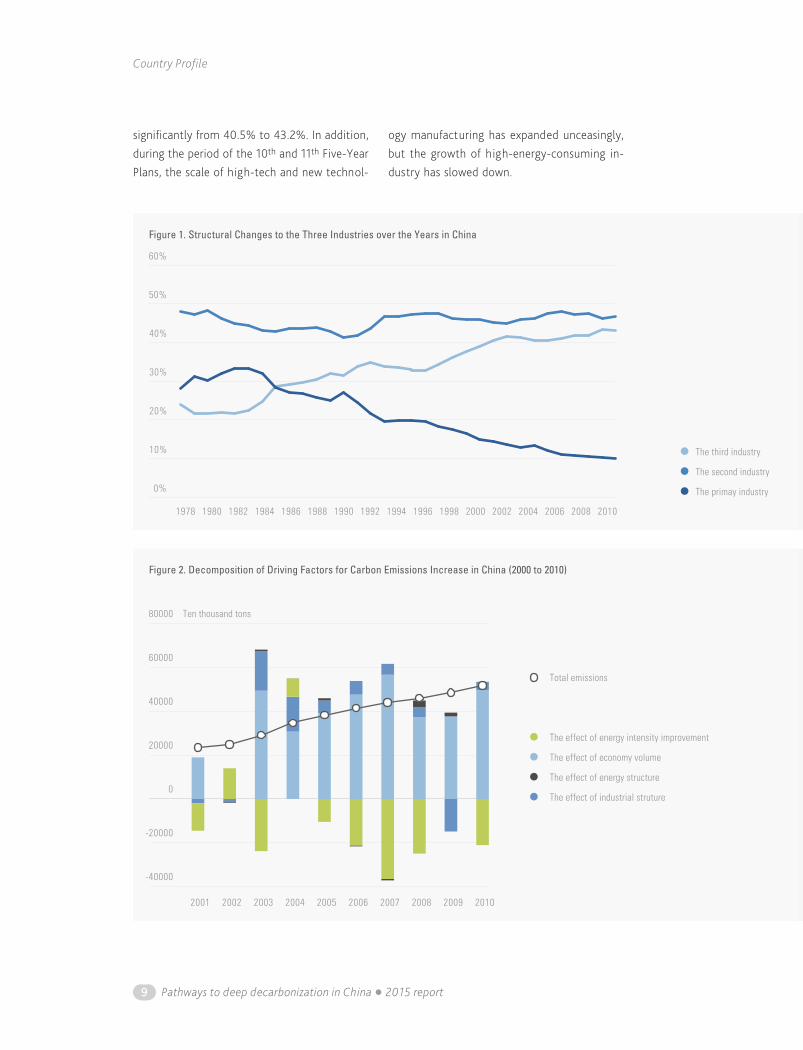
and 52%, for iron and steel, non-ferrous met-als, petrochemical and chemicals, and build-ing materials respectively; the comprehensive energy consumption of steel per ton, cement clinker, ethylene, and synthetic ammonia have respectively decreased by 12.8%, 12%, 11.6%, and 14.3%; the unit energy consumption of some products has become aligned with in-ternational standards; and advanced capacity proportion of high-energy performance of key industries has increased significantly. However, the energy-intensity effect in the period of the 11th Five-Year Plan was relatively weak be-cause of structural effects, whereby potential energy-intensity e ffects were cancelled out by the sharp rise and subsequent decline in the proportion of energy-intensive industries which followed China’s entry into the WTO. Since 1978, the proportion of added value from primary industry (including agriculture and forest sectors) has continuously decreased in parallel with a continuous increase of the service sector and a rather constant trend of industry sector above 40% (see Figure 1). Compared to devel-oped countries, which have already achieved industrialization, the proportion of the added value from the secondary industry sector (in-cluding major industry sectors) in China remains relatively high, and standard economic develop-ment theory would anticipate further structural adjustments with a decrease of secondary indus-try sectors and a rise of third industry (includ-ing service sectors in the economy) activities. In addition to technological progress and improve-ments in energy efficiency, further acceleration of this adjustment in the industrial structure is an important driver for China to reduce CO2 emissions in the future, given the much lower emission intensity of service activities.Recently, during the period of the 11th Five-Year Plan, the share of secondary industry sec-tor has decreased from 47.4% to 46.7%, while the third industry sector activity has increased
Country Profile
9 Pathways to deep decarbonization in China � 2015 report
significantly from 40.5% to 43.2%. In addition, during the period of the 10th and 11th Five-Year Plans, the scale of high-tech and new technol-
ogy manufacturing has expanded unceasingly, but the growth of high-energy-consuming in-dustry has slowed down.
The third industry
The second industry
The primay industry0%
10%
20%
30%
40%
50%
60%
20102008200620042002200019981996199419921990198819861984198219801978
Figure 1. Structural Changes to the Three Industries over the Years in China
The effect of energy intensity improvement
The effect of economy volume
The effect of energy structure
The effect of industrial struture
-40000
-20000
0
20000
40000
60000
80000
2001 2002 2003 2004 2005 2006 2007 2008 2009 2010
Total emissions
Ten thousand tons
Figure 2. Decomposition of Driving Factors for Carbon Emissions Increase in China (2000 to 2010)
National deep decarbonization pathways
Pathways to deep decarbonization in China � 2015 report 10
According to the Kaya equation, there are four key driving factors for carbon emissions: Eco-nomic growth, economic structure (the shift from energy-intensive sectors to energy-light sectors), energy intensity (energy use per unit of GDP within the sector), and emissions per unit of energy use. The decomposition analysis displayed in Figure 2 shows that, over the peri-od of the 10th and 11th Five-Year Plans, the CO2 emissions in China increased by 2,853 million tons, with a dominant upward push coming from economic growth (+3,497 million tons)
and smaller ones from industrial structure (410 million tons) and energy structure (+36 million tons). However, significant reductions of en-ergy intensity have also provided a significant downward push to national emissions (–1,091 million tons)4. Changes in energy structure have had little effect on emissions. Economic growth has always been the key factor affecting carbon emissions, and major improvements in energy intensity only partly offset its effect, wh ich is why we s till observe increases in emissions.
2National deep decarbonization pathways
2.1 Assumptions of economic and social development
China’s economic, demographic, and social development – including GDP, population, and urbanization rates – are important drivers of the future emissions pathway. To establish these im-portant parameters, China relies on assumptions from a combination of expert judgment and the relevant literature.As a developing country, China is still in the progress of industrialization and urbanization and striving to improve the living standard of people, while putting more attention on the quality of economy growth to achieve the sus-tainable development. In 2014, the economy of China experiences a lowest growth in last 24 years. It is therefore anticipated that China’s
future economy will enter into a new era de-scribed as the “the new normal,” an adjustment period during which the country will transition from an input intensive development model to a more sustainable and high-efficiency eco-nomic pattern, making it possible to combine rapid and sound economic development with a gradual slowdown of economic growth. This is reflected in the assumptions of GDP per capita in the national deep decarbonization pathway scenario, which average at 4.8% over the period 2010–2050, with a gradual decline of growth rates from 7.2% over the period 2010–2020 to 2.8% over the period 2040–2050 (see second line in Table 1).We adopt the UN’s 2012 population projection as a reference, adjusting it downward in the mid to long term to account the miscalculation in the UN’s figures for China’s population in 2013 and 2014. The adjusted projected population peaks at around 2030, with a population about 1,420 million and gradually declines to 1,353 million by 2050 (first line in Table 1).
2
4 Results are from Tsinghua University, 2014
1
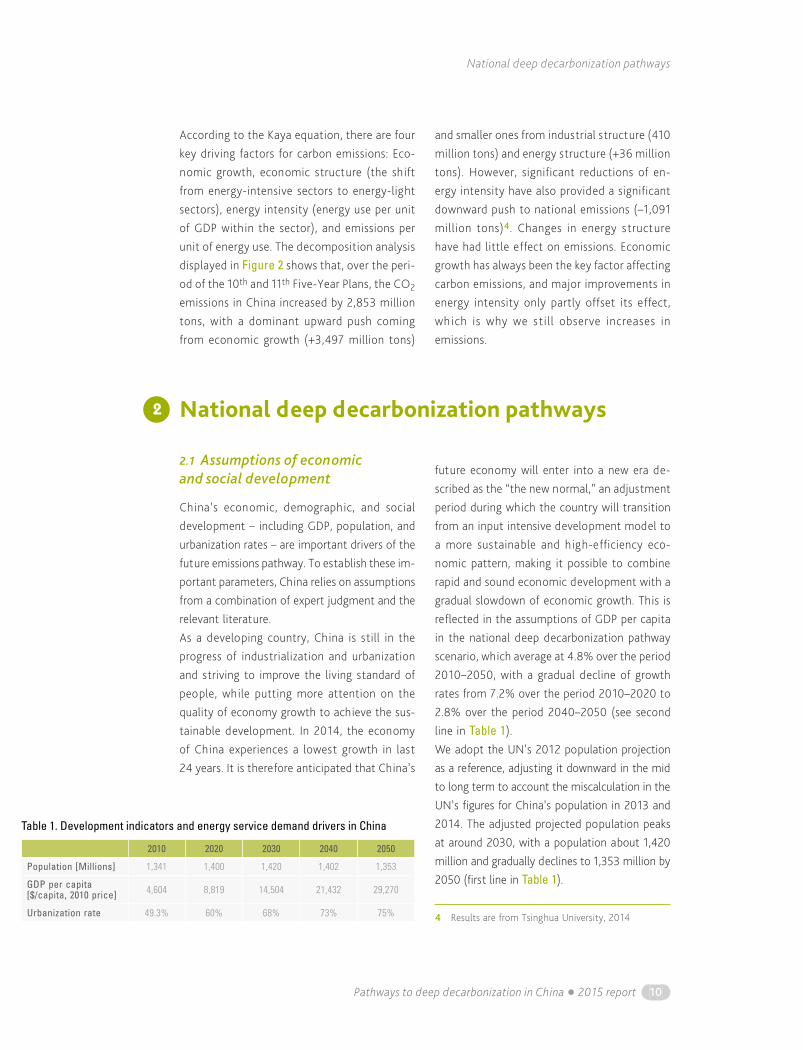
Table 1. Development indicators and energy service demand drivers in China
2010 2020 2030 2040 2050
Population [Millions] 1,341 1,400 1,420 1,402 1,353
GDP per capita [$/capita, 2010 price] 4,604 8,819 14,504 21,432 29,270
Urbanization rate 49.3% 60% 68% 73% 75%
National deep decarbonization pathways
11 Pathways to deep decarbonization in China � 2015 report
China’s urbanization goes hand in hand with its fast economic growth. The accelerating ur-banization process is depicted in a government working report5 as the most important aspect of social development, enabling the rise of people’s living standards and in turn pushing up energy use. As China enters its later stage of industri-alization in the near future, urbanization is ex-pected to become the main impetus of energy. Judging from China’s urbanization trend and an overview of other relevant research, it is assumed that the urbanization rate of China will rise con-tinuously from its current rate of 49.3% in 2010 to 75% by 2050 (third line in Table 1).
2.2 Illustrative Deep Decarbonization Pathway for China: High-level characterization
The illustrative DDPP pathway is analysed using Strategy Analysis on Climate Change in China model (SACC) developed by National Centre for Climate Change Strategy and International Co-operation (NCSC). It attempts to study China’s future energy production and consumption and carbon emissions at 10-year intervals extending from 2010 through 2050. The service demand, energy structure, and energy-related technology progress of end-use sectors, including industry, transportation, and the building sector, are de-termined by both scenario survey and expert opinion. Power consumption is given by com-bining the power demand in end-use sectors, and related carbon emissions are calculated by optimizing the technology options for power generation under a cost-minimization condition.The DDPP pathway combines an acceleration of
economic structural evolution, effective control of service demand, promotion of low-carbon en-ergy development (including the development of natural gas and non-fossil fuels), and deploy-ment of low-carbon technologies such as carbon capture, utilization, and storage (CCUS) in a con-text of continued economic growth.
a) Energy trends As described in the “Two 100-Year Goals”6 by central government, China is dedicated to build-ing a “moderately prosperous society in all re-spects” by 2021 as the CPC celebrates its 100th anniversary, and building an “affluent, strong, civilized, and harmonious socialist modern coun-try” by the 100th anniversary of the People’s Re-public of China in 2049. Against this backdrop, both GDP per capita and absolute GDP are ex-pected to increase by more than 6 times from 2010 to 2050, while primary energy consump-tion is projected to reach a maximum of about 4,610 MToe7 around the year 2040 (1.86 times its level in 2010), before a slight decline to 1.76 times (4,358 MToe) the 2010 level in 2050. (The trends for final energy consumption are very sim-ilar, with a peak in 2040 at 1.77 times its 2010 level, before a slight decline to 1.62 times its 2010 level in 2050). These trends feature a sig-nificant decoupling of energy consumption from economic growth, thanks to China’s continuous efforts on energy efficiency, as measured by a 47% and 73% reduction of energy intensity per unit of GDP in 2030 and 2050, respectively.The industry sector is projected to remain the largest end-use energy consumer over the whole period; its final energy consumption increases by 39% from 2010 to 2050, but it
5 Report on the Work of the Government (2015), delivered at the Third Session of the 12th National People’s Congress by Premier Li Keqiang, http://english.gov.cn/archive/publications/2015/03/05/content_281475066179954.htm
6 “Two 100-Year Goals” were two goals first brought forward in the Report to the Eighteenth National Congress of the Communist Party of China, which was delivered by the then chairman Hu Jintao on Nov 8h, 2012.
7 In this report, the conversion of electricity is based on electrothermal equivalent (86.0 toe/Gwh) in final energy consumption and fossil fuel equivalent (which is coal consumption used to per kWh of electricity) for primary energy consumption.
National deep decarbonization pathways
Pathways to deep decarbonization in China � 2015 report 12
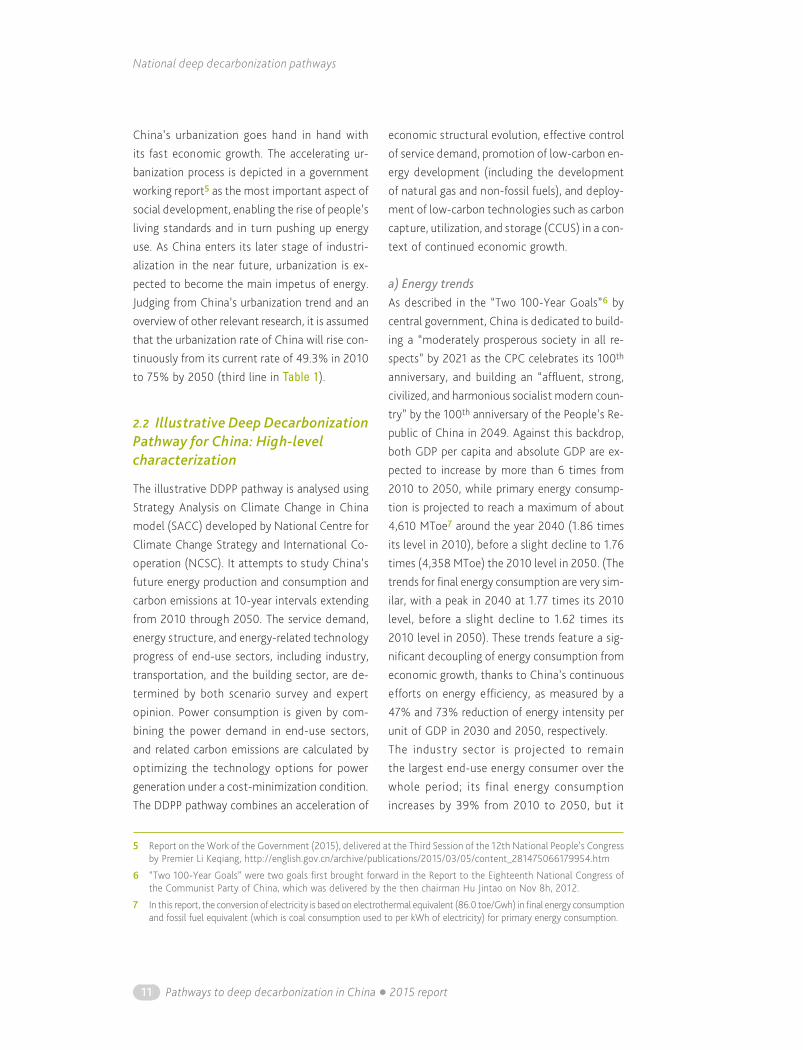
represents a declining share of the economy, from 67% in 2010 to 58% in 2050, as oth-er sectors accelerate their increase in share. Transportation and buildings, the two major sectors closely related with urbanization, will go through enormous increases in energy de-mand, with final energy consumption in 2050 increasing by 130% and 92%, respectively, from 2010 levels. The shift in energy-use ratio reflects the change in the economic-industrial structure during China’s industrialization and urbanization process. However, since China is entering into the later stage of industrializa-tion, the economy structure will become more
optimized along with the increasing share of service industry, which is much less energy-in-tensive. On the other hand, the promotion of people’s living s tandards and expansion of service and consumption needs during Chi-na’s urbanization process will s till generate enormous energy consumption needs, gradu-ally surpassing industrialization as the biggest driver of increased energy use.Along with the change in economic and indus-trial structure, the energy mix will be gradually turned towards clean and low-carbon energies. Electricity will gradually become a major en-ergy source with a tripling of electricity con-sumption, from 3,936 Twh in 2010 to 11,772 Twh in 2050, and the electrification rate grows from 18% in 2010 to 34% in 2050 . In 2050, electricity consumption per capita is projected at about 8700 Kwh, close to the 2010 average level of consumption in developed countries. Non-fossil electricity will dominate electricity production, with the ratio climbing to 72%, thanks to the enormous growth of wind and solar, along with steady growth of nuclear and hydro power. These developments of domestic non-fossil fuels are in line with national targets, reaching about 15% and 20% in primary energy consumption in 2020 and 2030, respectively, and will accelerate once the technologies are mature and affordable, especially after 2030. The ratio of non-fossil fuel in the primary en-ergy consumption is projected to reach 42% in 2050.As China deepens strategic cooperation with central Asian countries under the “One Belt and One Road” framework and pushes forward na-tional gas and oil pipeline construction projects with Russia and other countries, China’s will have a more diversified and secure energy supply of oil and natural gas. With sufficient sources, natural gas consumption under the DDPP pathway will increase to about 8,000 m3 in 2050, accounting for about 17% of primary energy consumption.
Buildings
Industry
Transport
Figure 3. Final energy consumption in 2010 and 2050, by sector
1833Mtoe
2968Mtoe
2010 2050
0%
5%
10%
15%
20%
25%
35%
30%
34%
Figure 4. Electri�cation rate in �nal energy consumption
20502040203020202010
National deep decarbonization pathways
13 Pathways to deep decarbonization in China � 2015 report
Coal use is projected to reach a maximum of around 4.1 billion tonnes around 2020 and to plateau for about 10 years before experiencing a decrease in parallel with rapid development of non-fossil fuels and natural gas. In 2050, the proportion of coal in primary energy con-sumption is projected to drop to 27% in 2050, about the same level as in the US and Germany in 2010.
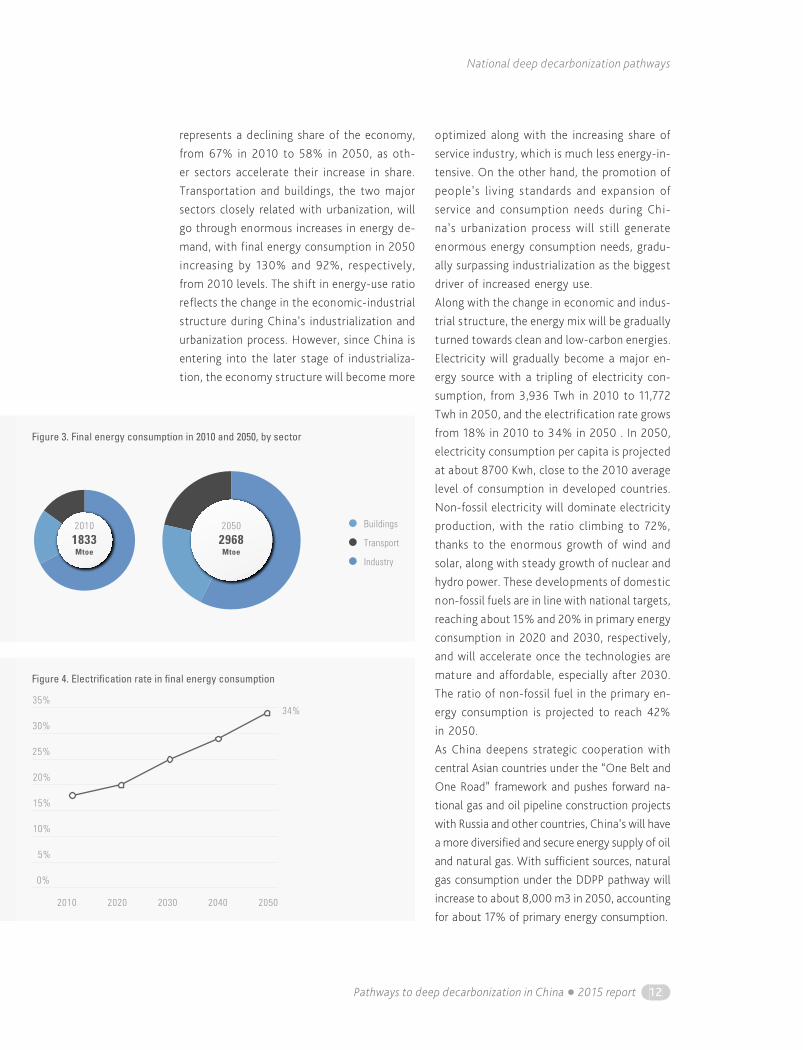
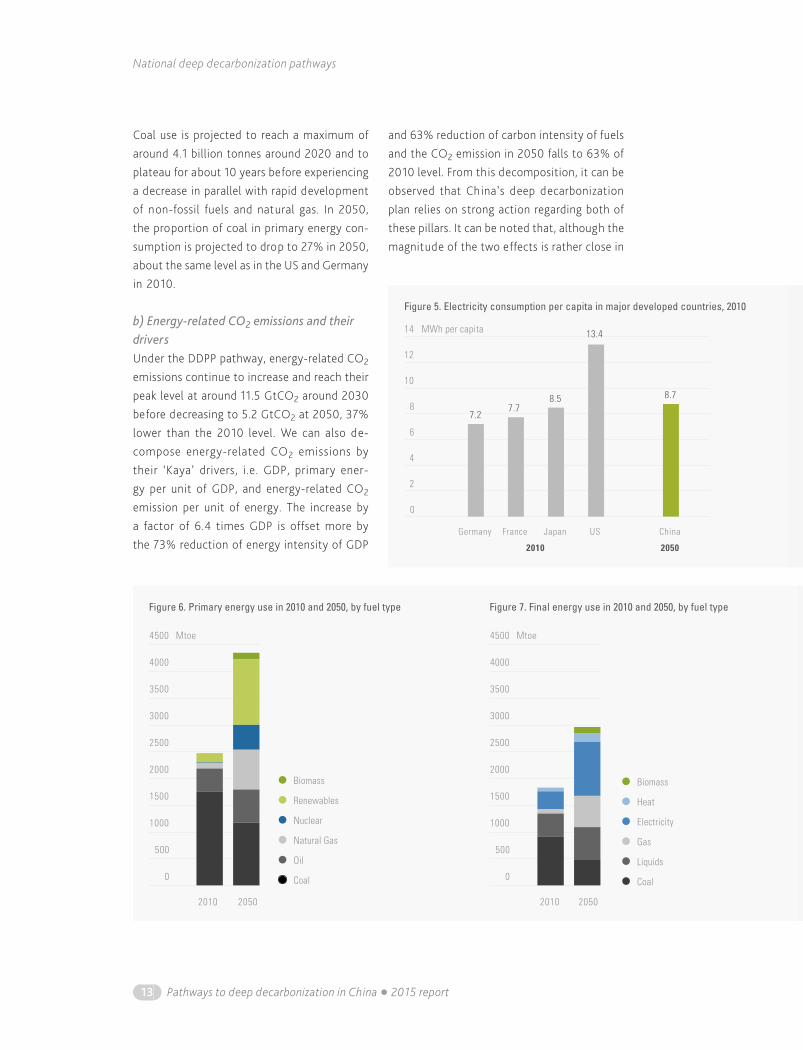
b) Energy-related CO2 emissions and their driversUnder the DDPP pathway, energy-related CO2 emissions continue to increase and reach their peak level at around 11.5 GtCO2 around 2030 before decreasing to 5.2 GtCO2 at 2050, 37% lower than the 2010 level. We can also de-compose energy-related CO2 emissions by their ‘Kaya’ drivers, i.e. GDP, primary ener-gy per unit of GDP, and energy-related CO2 emission per unit of energy. The increase by a factor of 6.4 times GDP is offset more by the 73% reduction of energy intensity of GDP
and 63% reduction of carbon intensity of fuels and the CO2 emission in 2050 falls to 63% of 2010 level. From this decomposition, it can be observed that China’s deep decarbonization plan relies on strong action regarding both of these pillars. It can be noted that, although the magnitude of the two effects is rather close in
USJapanFranceGermany China
2010 2050
8.7
13.4
8.57.7
7.2
4
2
0
6
8
10
12
14
Figure 5. Electricity consumption per capita in major developed countries, 2010
MWh per capita
Biomass
Heat
Electricity
Gas
Liquids
Coal
Biomass
Renewables
Nuclear
Natural Gas
Oil
Coal
2010 2050 2010 2050
500
0
1000
1500
2000
2500
3000
3500
4500
4000
Mtoe
500
0
1000
1500
2000
2500
3000
3500
4500
4000
Mtoe
Figure 6. Primary energy use in 2010 and 2050, by fuel type Figure 7. Final energy use in 2010 and 2050, by fuel type
National deep decarbonization pathways
Pathways to deep decarbonization in China � 2015 report 14
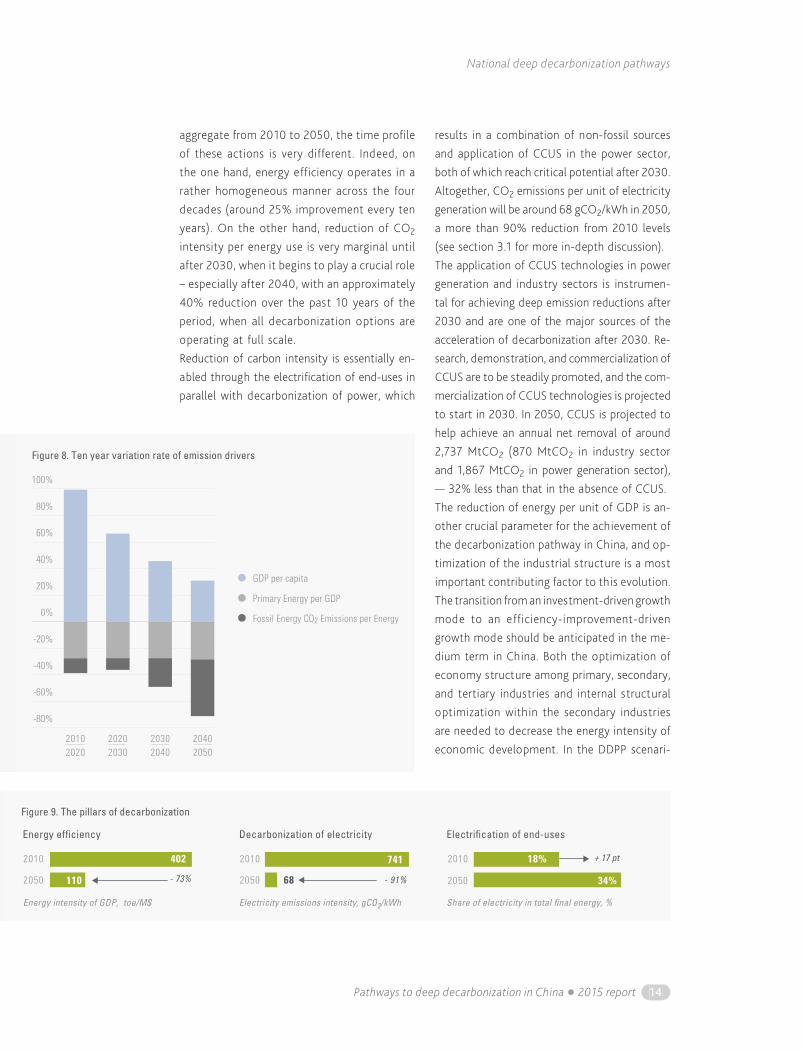
aggregate from 2010 to 2050, the time profile of these actions is very different. Indeed, on the one hand, energy efficiency operates in a rather homogeneous manner across the four decades (around 25% improvement every ten years). On the other hand, reduction of CO2 intensity per energy use is very marginal until after 2030, when it begins to play a crucial role – especially after 2040, with an approximately 40% reduction over the past 10 years of the period, when all decarbonization options are operating at full scale. Reduction of carbon intensity is essentially en-abled through the electrification of end-uses in parallel with decarbonization of power, which
results in a combination of non-fossil sources and application of CCUS in the power sector, both of which reach critical potential after 2030. Altogether, CO2 emissions per unit of electricity generation will be around 68 gCO2/kWh in 2050, a more than 90% reduction from 2010 levels (see section 3.1 for more in-depth discussion). The application of CCUS technologies in power generation and industry sectors is instrumen-tal for achieving deep emission reductions after 2030 and are one of the major sources of the acceleration of decarbonization after 2030. Re-search, demonstration, and commercialization of CCUS are to be steadily promoted, and the com-mercialization of CCUS technologies is projected to start in 2030. In 2050, CCUS is projected to help achieve an annual net removal of around 2,737 MtCO2 (870 MtCO2 in industry sector and 1,867 MtCO2 in power generation sector), — 32% less than that in the absence of CCUS.The reduction of energy per unit of GDP is an-other crucial parameter for the achievement of the decarbonization pathway in China, and op-timization of the industrial structure is a most important contributing factor to this evolution. The transition from an investment-driven growth mode to an efficiency-improvement-driven growth mode should be anticipated in the me-dium term in China. Both the optimization of economy structure among primary, secondary, and tertiary industries and internal structural optimization within the secondary industries are needed to decrease the energy intensity of economic development. In the DDPP scenari-
-80%
-60%
-40%
-20%
0%
20%
40%
60%
80%
100%
20202030
20302040
20402050
20102020
GDP per capita
Primary Energy per GDP
Fossil Energy CO2 Emissions per Energy
Figure 8. Ten year variation rate of emission drivers
2010
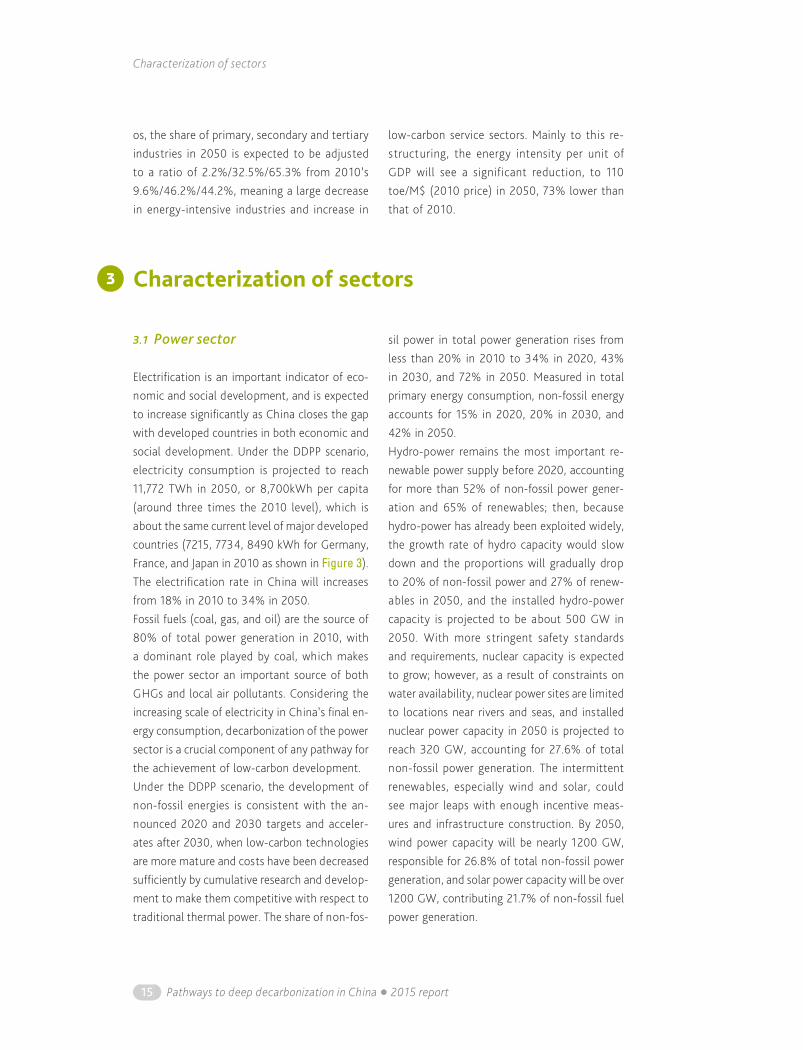
2050 - 73% - 91%
+ 17 pt2010
2050
2010
2050
402 741 18%
34%68110
Energy ef�ciency
Energy intensity of GDP, toe/M$
Decarbonization of electricity
Electricity emissions intensity, gCO2/kWh Share of electricity in total �nal energy, %
Electri�cation of end-uses
Figure 9. The pillars of decarbonization
Characterization of sectors
15 Pathways to deep decarbonization in China � 2015 report
os, the share of primary, secondary and tertiary industries in 2050 is expected to be adjusted to a ratio of 2.2%/32.5%/65.3% from 2010’s 9.6%/46.2%/44.2%, meaning a large decrease in energy-intensive industries and increase in
low-carbon service sectors. Mainly to this re-structuring, the energy intensity per unit of GDP will see a significant reduction, to 110 toe/M$ (2010 price) in 2050, 73% lower than that of 2010.
3Characterization of sectors
3.1 Power sector
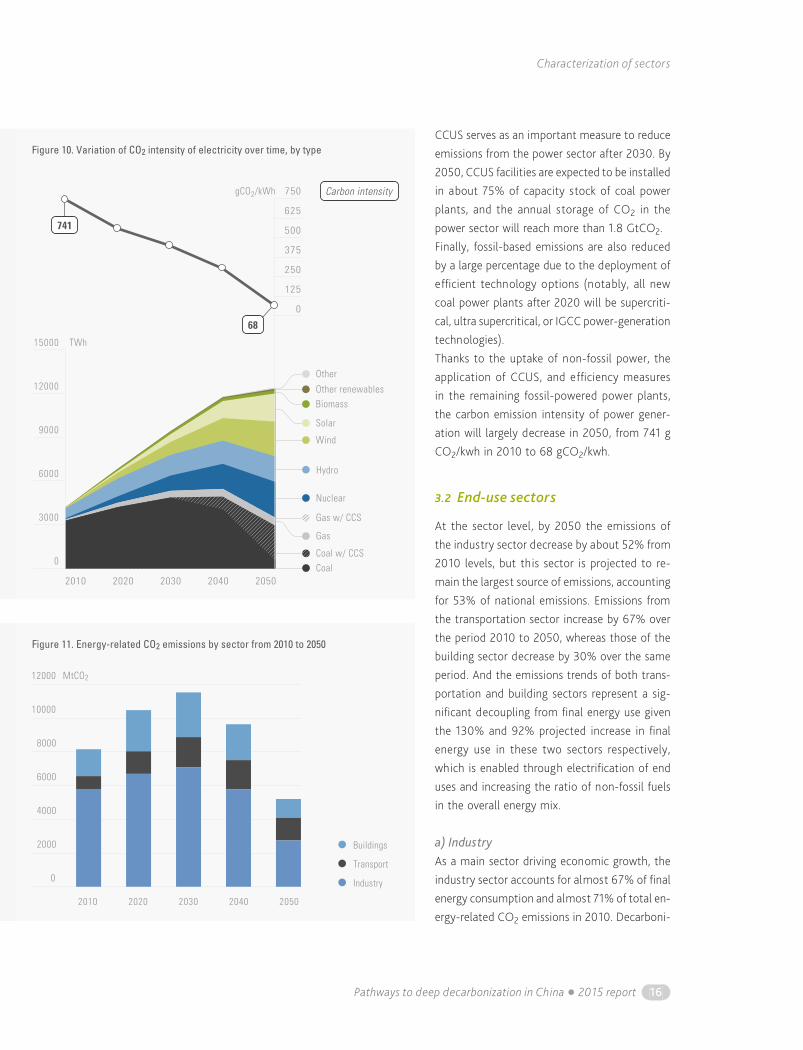
Electrification is an important indicator of eco-nomic and social development, and is expected to increase significantly as China closes the gap with developed countries in both economic and social development. Under the DDPP scenario, electricity consumption is projected to reach 11,772 TWh in 2050, or 8,700kWh per capita (around three times the 2010 level), which is about the same current level of major developed countries (7215, 7734, 8490 kWh for Germany, France, and Japan in 2010 as shown in Figure 3). The electrification rate in China will increases from 18% in 2010 to 34% in 2050.Fossil fuels (coal, gas, and oil) are the source of 80% of total power generation in 2010, with a dominant role played by coal, which makes the power sector an important source of both GHGs and local air pollutants. Considering the increasing scale of electricity in China’s final en-ergy consumption, decarbonization of the power sector is a crucial component of any pathway for the achievement of low-carbon development. Under the DDPP scenario, the development of non-fossil energies is consistent with the an-nounced 2020 and 2030 targets and acceler-ates after 2030, when low-carbon technologies are more mature and costs have been decreased sufficiently by cumulative research and develop-ment to make them competitive with respect to traditional thermal power. The share of non-fos-
sil power in total power generation rises from less than 20% in 2010 to 34% in 2020, 43% in 2030, and 72% in 2050. Measured in total primary energy consumption, non-fossil energy accounts for 15% in 2020, 20% in 2030, and 42% in 2050. Hydro-power remains the most important re-newable power supply before 2020, accounting for more than 52% of non-fossil power gener-ation and 65% of renewables; then, because hydro-power has already been exploited widely, the growth rate of hydro capacity would slow down and the proportions will gradually drop to 20% of non-fossil power and 27% of renew-ables in 2050, and the installed hydro-power capacity is projected to be about 500 GW in 2050. With more stringent safety standards and requirements, nuclear capacity is expected to grow; however, as a result of constraints on water availability, nuclear power sites are limited to locations near rivers and seas, and installed nuclear power capacity in 2050 is projected to reach 320 GW, accounting for 27.6% of total non-fossil power generation. The intermittent renewables, especially wind and solar, could see major leaps with enough incentive meas-ures and infrastructure construction. By 2050, wind power capacity will be nearly 1200 GW, responsible for 26.8% of total non-fossil power generation, and solar power capacity will be over 1200 GW, contributing 21.7% of non-fossil fuel power generation.
3
Characterization of sectors
Pathways to deep decarbonization in China � 2015 report 16
CCUS serves as an important measure to reduce emissions from the power sector after 2030. By 2050, CCUS facilities are expected to be installed in about 75% of capacity stock of coal power plants, and the annual storage of CO2 in the power sector will reach more than 1.8 GtCO2. Finally, fossil-based emissions are also reduced by a large percentage due to the deployment of efficient technology options (notably, all new coal power plants after 2020 will be supercriti-cal, ultra supercritical, or IGCC power-generation technologies).Thanks to the uptake of non-fossil power, the application of CCUS, and efficiency measures in the remaining fossil-powered power plants, the carbon emission intensity of power gener-ation will largely decrease in 2050, from 741 g CO2/kwh in 2010 to 68 gCO2/kwh.
3.2 End-use sectors
At the sector level, by 2050 the emissions of the industry sector decrease by about 52% from 2010 levels, but this sector is projected to re-main the largest source of emissions, accounting for 53% of national emissions. Emissions from the transportation sector increase by 67% over the period 2010 to 2050, whereas those of the building sector decrease by 30% over the same period. And the emissions trends of both trans-portation and building sectors represent a sig-nificant decoupling from final energy use given the 130% and 92% projected increase in final energy use in these two sectors respectively, which is enabled through electrification of end uses and increasing the ratio of non-fossil fuels in the overall energy mix.
a) Industry As a main sector driving economic growth, the industry sector accounts for almost 67% of final energy consumption and almost 71% of total en-ergy-related CO2 emissions in 2010. Decarboni-
375
500
625
125
250
0
750gCO2/kWh
TWh
9000
6000
3000
0
12000
15000
2010 2020 2030 2040 2050
Coal w/ CCS
Gas w/ CCS
Coal
Other
Other renewablesBiomass
Solar
Wind
Hydro
Nuclear
Gas
Figure 10. Variation of CO2 intensity of electricity over time, by type
Carbon intensity
741
68
20502040203020202010
12000
10000
8000
6000
4000
2000
0
Buildings
MtCO2
Industry
Transport
Figure 11. Energy-related CO2 emissions by sector from 2010 to 2050
Characterization of sectors
17 Pathways to deep decarbonization in China � 2015 report
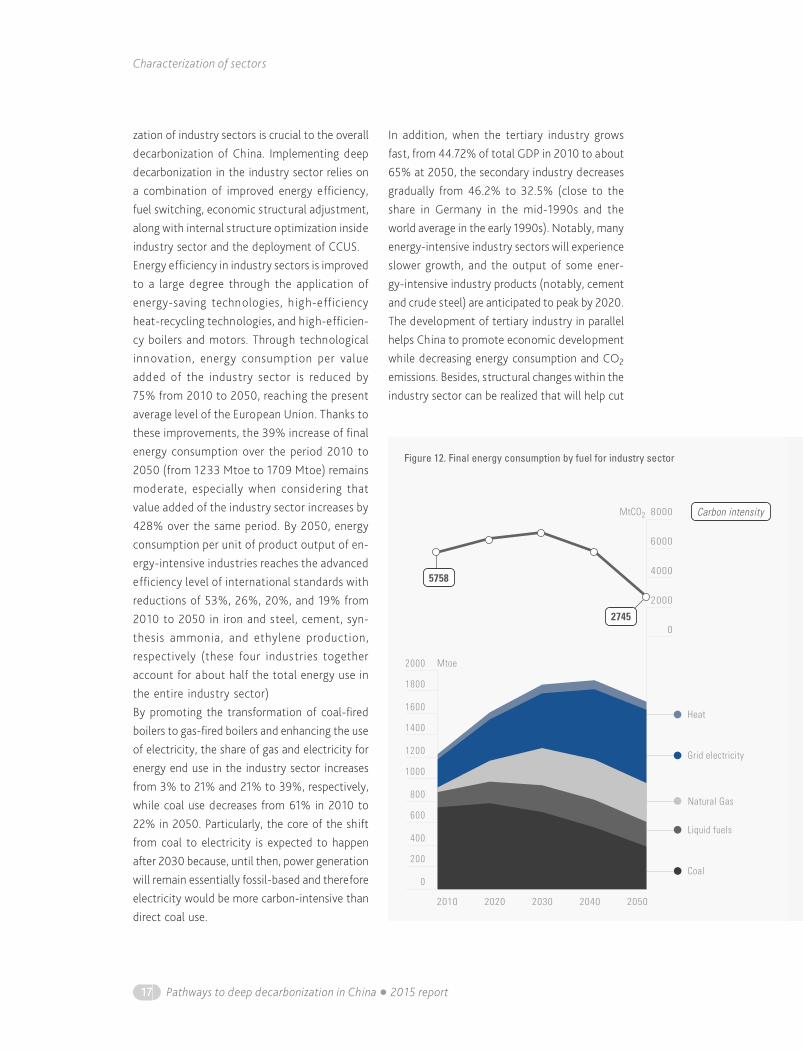
zation of industry sectors is crucial to the overall decarbonization of China. Implementing deep decarbonization in the industry sector relies on a combination of improved energy efficiency, fuel switching, economic structural adjustment, along with internal structure optimization inside industry sector and the deployment of CCUS.Energy efficiency in industry sectors is improved to a large degree through the application of energy-saving technologies, h igh-efficiency heat-recycling technologies, and high-efficien-cy boilers and motors. Through technological innovation, energy consumption per value added of the industry sector is reduced by 75% from 2010 to 2050, reaching the present average level of the European Union. Thanks to these improvements, the 39% increase of final energy consumption over the period 2010 to 2050 (from 1233 Mtoe to 1709 Mtoe) remains moderate, especially when considering that value added of the industry sector increases by 428% over the same period. By 2050, energy consumption per unit of product output of en-ergy-intensive industries reaches the advanced efficiency level of international standards with reductions of 53%, 26%, 20%, and 19% from 2010 to 2050 in iron and steel, cement, syn-thesis ammonia, and ethylene production, respectively (these four industries together account for about half the total energy use in the entire industry sector)By promoting the transformation of coal-fired boilers to gas-fired boilers and enhancing the use of electricity, the share of gas and electricity for energy end use in the industry sector increases from 3% to 21% and 21% to 39%, respectively, while coal use decreases from 61% in 2010 to 22% in 2050. Particularly, the core of the shift from coal to electricity is expected to happen after 2030 because, until then, power generation will remain essentially fossil-based and therefore electricity would be more carbon-intensive than direct coal use.
In addition, when the tertiary industry grows fast, from 44.72% of total GDP in 2010 to about 65% at 2050, the secondary industry decreases gradually from 46.2% to 32.5% (close to the share in Germany in the mid-1990s and the world average in the early 1990s). Notably, many energy-intensive industry sectors will experience slower growth, and the output of some ener-gy-intensive industry products (notably, cement and crude steel) are anticipated to peak by 2020. The development of tertiary industry in parallel helps China to promote economic development while decreasing energy consumption and CO2 emissions. Besides, structural changes within the industry sector can be realized that will help cut
4000
6000
2000
0
8000MtCO2
Mtoe
1200
800
400
0
1600
2000
1000
600
200
1400
1800
2010 2020 2030 2040 2050
Coal
Heat
Grid electricity
Natural Gas
Liquid fuels
Figure 12. Final energy consumption by fuel for industry sector
Carbon intensity
5758
2745
Characterization of sectors
Pathways to deep decarbonization in China � 2015 report 18
down CO2 emission: notably, the development of strategic industries, like energy-saving and environmentally friendly industries, new energy industry and upgraded information technolo-gy, the control of overcapacity in main industry outputs in iron and steel and cement sectors through improvements in examination and ap-proval systems, and the phasing out out-dat-ed production capacity by raising standards for industrial equipment and production capacity.The deep decarbonisation pathway for the in-dustry sector also relies on the large-scale de-ployment of CCUS. If CCUS is deployed appropri-ately on a commercialized scale after 2030 in key industry sector, it is expected to capture 20%
of total CO2 emissions in the industry sector in 2050, 70% of which occurs in energy-intensive industries (cement, iron and steel, chemicals, and petrochemicals).Thanks to these combined measures, the CO2 emissions per unit of energy consumption of the industry sector will be reduced by 70% in 2050 (half the current level in the European Union). CCUS is a crucial factor in this projection, since the reduction in CO2 emissions per unit of en-ergy consumption in the industry sector would only reach 50% in the absence of CCUS. The projected result of CCUS deployment is that CO2 emissions from fuel combustion in industry sec-tor peaks around 2025 at about 7.2 GtCO2 and decreases to less than 2.7 GtCO2, nearly 52% lower than the 2010 level.
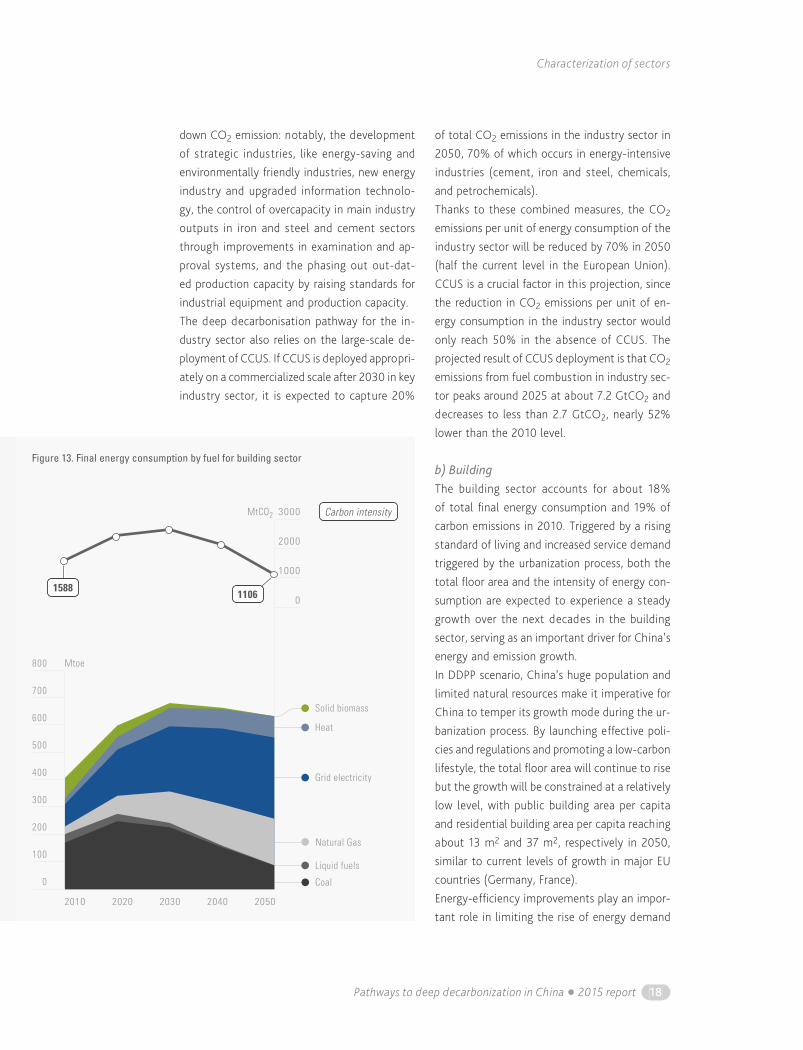
b) Building The building sector accounts for about 18% of total final energy consumption and 19% of carbon emissions in 2010. Triggered by a rising standard of living and increased service demand triggered by the urbanization process, both the total floor area and the intensity of energy con-sumption are expected to experience a steady growth over the next decades in the building sector, serving as an important driver for China’s energy and emission growth. In DDPP scenario, China’s huge population and limited natural resources make it imperative for China to temper its growth mode during the ur-banization process. By launching effective poli-cies and regulations and promoting a low-carbon lifestyle, the total floor area will continue to rise but the growth will be constrained at a relatively low level, with public building area per capita and residential building area per capita reaching about 13 m2 and 37 m2, respectively in 2050, similar to current levels of growth in major EU countries (Germany, France).Energy-efficiency improvements play an impor-tant role in limiting the rise of energy demand
Liquid fuels
Natural Gas
Grid electricity
Heat
Solid biomass
Coal
2010 2020 2030 2040 2050
600
400
200
0
800
500
300
100
700
Mtoe
MtCO2
1000
2000
0
3000
Figure 13. Final energy consumption by fuel for building sector
1106 1588
Carbon intensity
Characterization of sectors
19 Pathways to deep decarbonization in China � 2015 report
and CO2 emission in the building sector. Energy efficiency for buildings will be improved by both continuously retrofitting of existing buildings with energy-saving features and increasing the proportion of green and low-carbon building in newly constructed buildings. In DDPP scenario, while most (>90%) of existing buildings being retrofitted before 2050, all the newly construct-ed buildings will be enforced to be built accord-ing to the latest standards for energy saving after 2020. The thermal insulation of heating pipeline network also will be significantly improved. By all these means, the energy consumption for heat-ing per unit area in northern urban areas will be reduced by half from 2010 to 2050. Thanks to the development of energy-efficient cooling systems, lighting system, and appliances, there will be significant improvement to the efficien-cy of household appliances. For example, the energy efficiency of regular and central air con-ditioners would increase by 66% and 75% from now to 2050. The energy mix will also be greatly optimized. Clean and low-carbon energies, including heat, natural gas, electricity, and distributed renewa-bles will be popularized and implemented. Elec-tricity will become the major types of energy, accounting for 47% of final energy use, of which about 57% is used for specific uses including appliances, cooling and lighting and 43% for substitutable uses including heating, hot water supply and cooking, and natural gas increases to 27% of final energy, with both energy types showing a significant increase from their 2010 shares of usage (24% for electricity and 8% for gas). At the same time, the proportion of coal in final energy consumption is expected to decrease from 42% in 2010 to 13% in 2050.An important point to keep in mind is that an important part of China’s emissions are linked
to the process of early demolition of buildings8. China’s buildings have an estimated average life-time of 30 to 40 years, much shorter than their international counterparts. Early demolition of buildings and infrastructures increases rates of material intensity and embodied energy, and will be a source of increasing emissions during Chi-na’s urbanization process if not properly handled. Therefore, it is necessary to implement measures such as better urban planning and strict regu-lations to reasonably control the demolition of buildings and other infrastructures, so as to reduce material consumption intensity and im-prove the reuse of waste construction materials. Final energy consumption in the building sector continually rises to 659 Mtoe in 2030 and then gradually falls to 632 Mtoe in 2050, which are, respectively, 2 and 1.9 times the 2010 levels. At the same time, total carbon emissions from the building sector peak around 2030 at 2652 Mt CO2 and then significantly decrease in 2050 to about 1106 Mt CO2, 30% lower than in 2010, notably due to electrification and the rapid de-carbonization of the power generation sector, as discussed in section 3.1.
c) Transport The transport sector in 2010 accounts for 15% of total final energy consumption and 10% of total energy-related CO2 emissions in 2010. Accom-panying the increased demand for mobility and rising living standards, transportation demand is expected to rise quickly. It is therefore crucial to control the energy use and carbon intensity of the transport sector in order to achieve the low-carbon development of China. In general, the achievement of low-carbon transport relies on a shift in the transport sector’s structure, improvements in energy efficiency, and optimi-zation of the energy structure.
8 A rough estimation made by China Academy of Building Research shows that the demolition and construction process accounts for about 1.5% of national emissions, and that embedded emissions for materials is above 10%.
Characterization of sectors
Pathways to deep decarbonization in China � 2015 report 20
Low-carbon modes of transportation, such as rail and water transport, should be encouraged to help ach ieve low-carbon transportation development. For freight transportation, water transport is encouraged and extended in the future, and accounts for 45% in 2050 of total freight transportation9. Railway transportation would remain the main transport mode for passengers, and will account for 25% in 2050 of total passenger mobility, up from 18% in 2010. Public transit and slow-traffic systems (including bicycles, walks and related infra-structure) must be developed in large- and medium-scale cities, and the number of pub-lic transit vehicles per ten thousand people
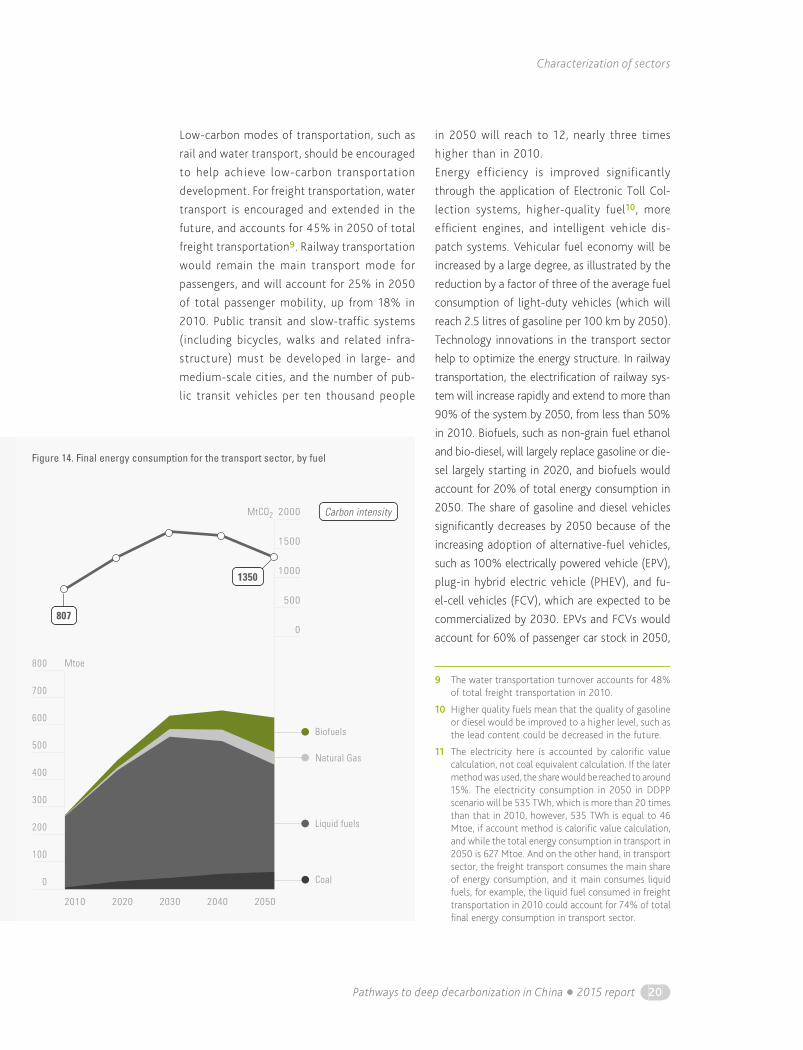
in 2050 will reach to 12, nearly three times higher than in 2010.Energy efficiency is improved significantly through the application of Electronic Toll Col-lection systems, higher-quality fuel10, more efficient engines, and intelligent vehicle dis-patch systems. Vehicular fuel economy will be increased by a large degree, as illustrated by the reduction by a factor of three of the average fuel consumption of light-duty vehicles (which will reach 2.5 litres of gasoline per 100 km by 2050).Technology innovations in the transport sector help to optimize the energy structure. In railway transportation, the electrification of railway sys-tem will increase rapidly and extend to more than 90% of the system by 2050, from less than 50% in 2010. Biofuels, such as non-grain fuel ethanol and bio-diesel, will largely replace gasoline or die-sel largely starting in 2020, and biofuels would account for 20% of total energy consumption in 2050. The share of gasoline and diesel vehicles significantly decreases by 2050 because of the increasing adoption of alternative-fuel vehicles, such as 100% electrically powered vehicle (EPV), plug-in hybrid electric vehicle (PHEV), and fu-el-cell vehicles (FCV), which are expected to be commercialized by 2030. EPVs and FCVs would account for 60% of passenger car stock in 2050,
Liquid fuels
Natural Gas
Biofuels
Coal
2010 2020 2030 2040 2050
600
400
200
0
800
500
300
100
700
Mtoe
MtCO2
1000
1500
500
0
2000
Figure 14. Final energy consumption for the transport sector, by fuel
1350
807
Carbon intensity
9 The water transportation turnover accounts for 48% of total freight transportation in 2010.
10 Higher quality fuels mean that the quality of gasoline or diesel would be improved to a higher level, such as the lead content could be decreased in the future.
11 The electricity here is accounted by calorific value calculation, not coal equivalent calculation. If the later method was used, the share would be reached to around 15%. The electricity consumption in 2050 in DDPP scenario will be 535 TWh, which is more than 20 times than that in 2010, however, 535 TWh is equal to 46 Mtoe, if account method is calorific value calculation, and while the total energy consumption in transport in 2050 is 627 Mtoe. And on the other hand, in transport sector, the freight transport consumes the main share of energy consumption, and it main consumes liquid fuels, for example, the liquid fuel consumed in freight transportation in 2010 could account for 74% of total final energy consumption in transport sector.
Key factor analysis
21 Pathways to deep decarbonization in China � 2015 report
and electricity consumption in the transport sec-tor will see rapid growth, from 24 TWh in 2010 to 535 TWh in 2050, accounting for only 7.3%11 of total final energy consumption in 2050.The total final energy consumption of the trans-port sector will rise gradually and peak at 653 Mtoe around 2040, then gradually fall to 627 Mtoe in
2050, 2.4 and 2.3 times their 2010 levels, respec-tively. The energy-related carbon emissions of the transport sector peaks at 1.78 Gt CO2 around 2030, nearly 15% of total energy-related CO2 emissions. The CO2 emissions intensity of energy consump-tion in transport will be reduced by 30%, from 3.0 tCO2/toe in 2010 to 2.1 tCO2/toe in 2050.
4Key factor analysis
4.1 Replacing coal with electricity
Using electricity to replace coal is seen as an effective carbon emission reduction choice in the long term. However, whether this is an efficient strategy to reduce CO2 emissions depends on the CO2 emission per unit electricity consump-tion, as determined by the electricity-generation structure. Without deploying any CCUS, elec-tricity is less carbon-intensive than coal only when the share of fossil fuel in total electricity generation is less than 33% (the proportion of coal-fired and gas-fired electricity generation in the total electricity mix). Regardless of whether or not CCUS are deployed, replacing coal with electricity will help to cut down CO2 emissions as long as the CO2 emission per unit of electricity consumption is less than 0.31 kgCO2/kwh.12
In the DDPP scenario, the share of fossil fuel in total electricity generation is about 57% in 2030 and decreases to about 44% in 2040. In the DDPP scenario, the CO2 emissions per unit of energy provided by electricity is 2.5 times higher than direct coal in 2010; this number decreases to 1.5 in 2030, and passes below 1 just before 2040 (0.96 in 2040) before declining further to 0.2 in 2050, with large-scale deployment of
CCUS. Without any CCUS, the number in 2050 will instead be 0.4. Therefore, in the DDPP pathway, replacing coal with electricity in the industry sector becomes an adequate strategy to reduce carbon emissions in the late 2030s.This trade-off is tested in the following two sen-sitivity analyses.
4.2 Electrification rate of the transport sector
The electrification rate of the transport sector in 2050 can increase faster than that planned by the Central DDPP scenario by applying more EPVs and FCVs, if appropriate policies and sup-porting measures are implemented. In addi-tion to the policies already in place, such as the “energy efficiency and development of a new-energy-vehicle industry” plan, new poli-cies, innovations, and measures will be launched to promote the development of EPVs and FCVs. These can include preferential policies, like in-creased subsidies for buying or using EPVs or FCVs, exempting EPVs and FCVs from the lottery for car plates, low or no highway tolls for EPVs and FCVs, etc. Technological improvements will be crucial, notably regarding energy-storage
4
12 We compare the CO2 emission per unit of energy consumed by coal and electricity by a simple calculation of multiplying the emission factor of coal (around 2.5 gCO2/gce) by the standard coal coefficient of electricity (0.1229 gce/kwh).
Key factor analysis
Pathways to deep decarbonization in China � 2015 report 22
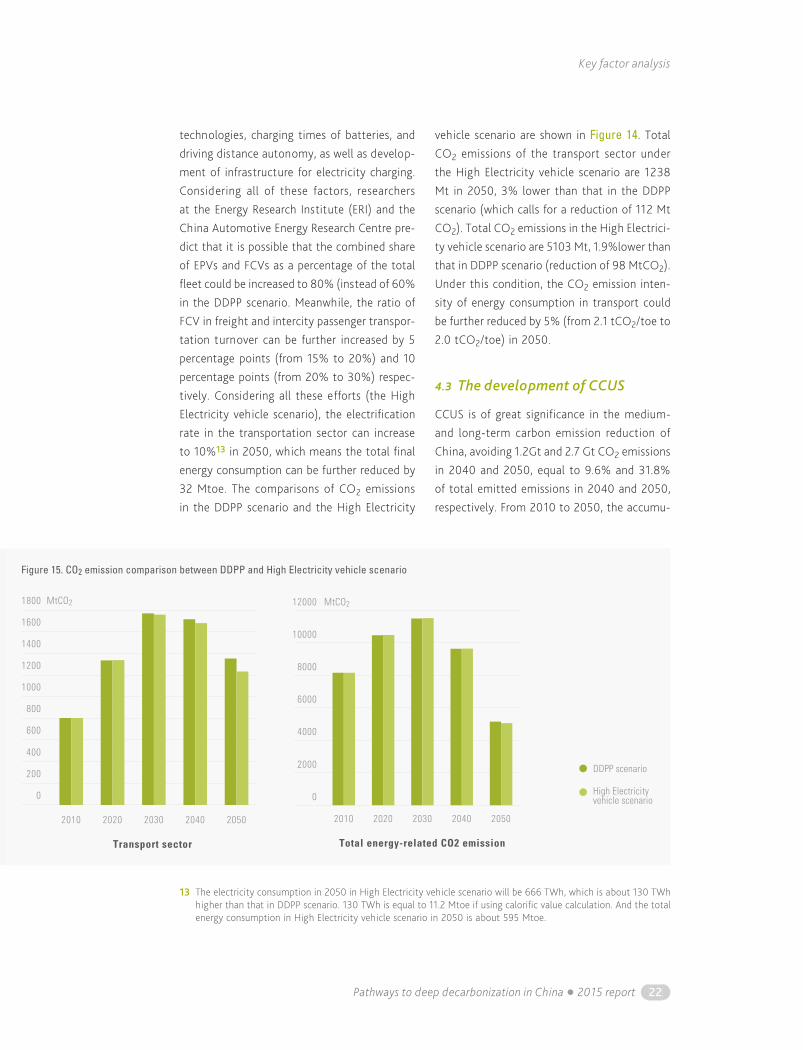
technologies, charging times of batteries, and driving distance autonomy, as well as develop-ment of infrastructure for electricity charging. Considering all of these factors, researchers at the Energy Research Institute (ERI) and the China Automotive Energy Research Centre pre-dict that it is possible that the combined share of EPVs and FCVs as a percentage of the total fleet could be increased to 80% (instead of 60% in the DDPP scenario. Meanwhile, the ratio of FCV in freight and intercity passenger transpor-tation turnover can be further increased by 5 percentage points (from 15% to 20%) and 10 percentage points (from 20% to 30%) respec-tively. Considering all these efforts (the High Electricity vehicle scenario), the electrification rate in the transportation sector can increase to 10%13 in 2050, which means the total final energy consumption can be further reduced by 32 Mtoe. The comparisons of CO2 emissions in the DDPP scenario and the High Electricity
vehicle scenario are shown in Figure 14. Total CO2 emissions of the transport sector under the High Electricity vehicle scenario are 1238 Mt in 2050, 3% lower than that in the DDPP scenario (which calls for a reduction of 112 Mt CO2). Total CO2 emissions in the High Electrici-ty vehicle scenario are 5103 Mt, 1.9%lower than that in DDPP scenario (reduction of 98 MtCO2). Under this condition, the CO2 emission inten-sity of energy consumption in transport could be further reduced by 5% (from 2.1 tCO2/toe to 2.0 tCO2/toe) in 2050.
4.3 The development of CCUS
CCUS is of great significance in the medium- and long-term carbon emission reduction of China, avoiding 1.2Gt and 2.7 Gt CO2 emissions in 2040 and 2050, equal to 9.6% and 31.8% of total emitted emissions in 2040 and 2050, respectively. From 2010 to 2050, the accumu-
Figure 15. CO2 emission comparison between DDPP and High Electricity vehicle scenario
600
800
1000
1200
0
200
400
1400
1600
1800
2010 2020 2030 2040 2050
Transport sector
DDPP scenario
MtCO2MtCO2
High Electricityvehicle scenario
4000
6000
8000
0
2000
10000
12000
2010 2020 2030 2040 2050
Total energy-related CO2 emission
13 The electricity consumption in 2050 in High Electricity vehicle scenario will be 666 TWh, which is about 130 TWh higher than that in DDPP scenario. 130 TWh is equal to 11.2 Mtoe if using calorific value calculation. And the total energy consumption in High Electricity vehicle scenario in 2050 is about 595 Mtoe.
Key factor analysis
23 Pathways to deep decarbonization in China � 2015 report
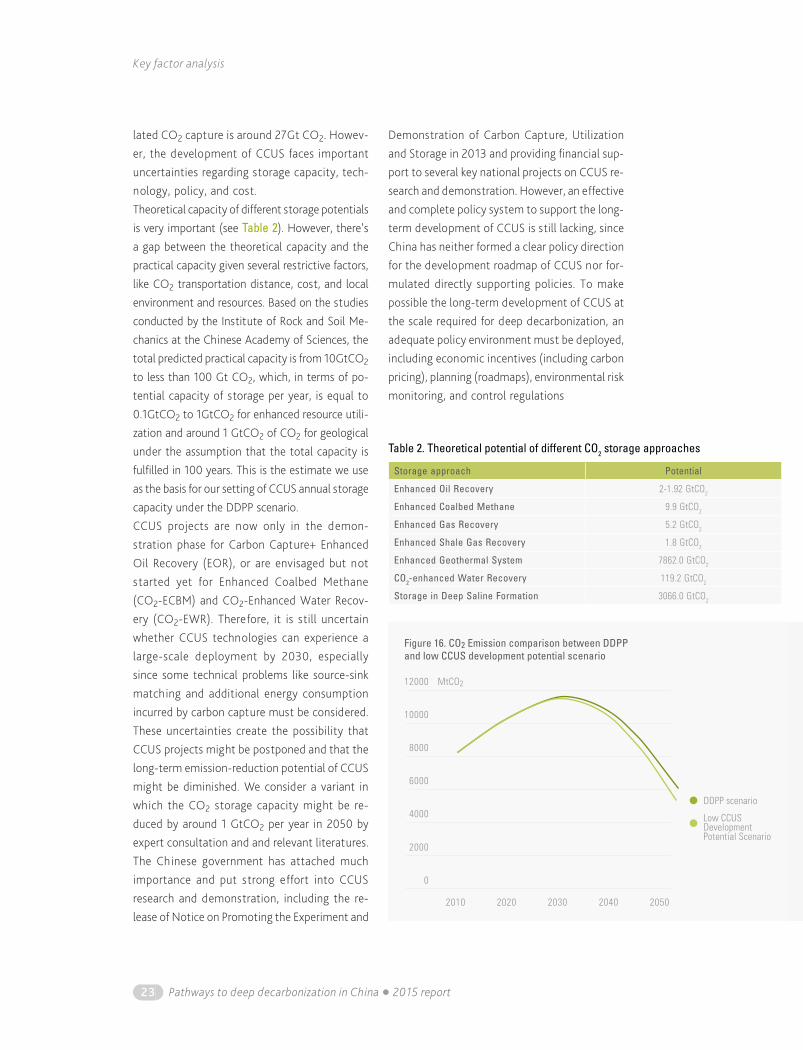
lated CO2 capture is around 27Gt CO2. Howev-er, the development of CCUS faces important uncertainties regarding storage capacity, tech-nology, policy, and cost. Theoretical capacity of different storage potentials is very important (see Table 2). However, there’s a gap between the theoretical capacity and the practical capacity given several restrictive factors, like CO2 transportation distance, cost, and local environment and resources. Based on the studies conducted by the Institute of Rock and Soil Me-chanics at the Chinese Academy of Sciences, the total predicted practical capacity is from 10GtCO2 to less than 100 Gt CO2, which, in terms of po-tential capacity of storage per year, is equal to 0.1GtCO2 to 1GtCO2 for enhanced resource utili-zation and around 1 GtCO2 of CO2 for geological under the assumption that the total capacity is fulfilled in 100 years. This is the estimate we use as the basis for our setting of CCUS annual storage capacity under the DDPP scenario.CCUS projects are now only in the demon-stration phase for Carbon Capture+ Enhanced Oil Recovery (EOR), or are envisaged but not started yet for Enhanced Coalbed Methane (CO2-ECBM) and CO2-Enhanced Water Recov-ery (CO2-EWR). Therefore, it is still uncertain whether CCUS technologies can experience a large-scale deployment by 2030, especially since some technical problems like source-sink matching and additional energy consumption incurred by carbon capture must be considered. These uncertainties create the possibility that CCUS projects might be postponed and that the long-term emission-reduction potential of CCUS might be diminished. We consider a variant in which the CO2 storage capacity might be re-duced by around 1 GtCO2 per year in 2050 by expert consultation and and relevant literatures.The Chinese government has attached much importance and put strong effort into CCUS research and demonstration, including the re-lease of Notice on Promoting the Experiment and
Demonstration of Carbon Capture, Utilization and Storage in 2013 and providing financial sup-port to several key national projects on CCUS re-search and demonstration. However, an effective and complete policy system to support the long-term development of CCUS is still lacking, since China has neither formed a clear policy direction for the development roadmap of CCUS nor for-mulated directly supporting policies. To make possible the long-term development of CCUS at the scale required for deep decarbonization, an adequate policy environment must be deployed, including economic incentives (including carbon pricing), planning (roadmaps), environmental risk monitoring, and control regulations2
Table 2. Theoretical potential of different CO2 storage approaches
Storage approach Potential
Enhanced Oil Recovery 2-1.92 GtCO2
Enhanced Coalbed Methane 9.9 GtCO2
Enhanced Gas Recovery 5.2 GtCO2
Enhanced Shale Gas Recovery 1.8 GtCO2
Enhanced Geothermal System 7862.0 GtCO2
CO2-enhanced Water Recovery 119.2 GtCO2
Storage in Deep Saline Formation 3066.0 GtCO2
Figure 16. CO2 Emission comparison between DDPPand low CCUS development potential scenario
DDPP scenario
Low CCUSDevelopmentPotential Scenario
4000
6000
8000
0
2000
10000
12000 MtCO2
2010 2020 2030 2040 2050
Challenges, opportunities, and enabling conditions
Pathways to deep decarbonization in China � 2015 report 24
Regarding cost, the emission sink potential of CCUS is set based on an assumption of carbon price of $70/ tCO2 in DDPP scenario. It can be questioned whether such carbon price levels can be reached soon enough (i.e., within the next decade) but CCUS deployment can also be pro-moted under low-carbon prices by virtue of EOR if the revenue from the recovered oil exceeds the cost of CO2 transport and storage, making the net cost of CCUS+EOR negative. 14,15
In addition to the above-mentioned uncertain-ties, the development potential of CCUS also re-
lies on the construction of relevant infrastructure, such as carbon transportation pipelines.In light of the uncertainties regarding storage po-tential, technology, policy, and cost, the more re-alistic storage capacity of CCUS will be around 1.5 GtCO2 per year (instead of 2.7 Gt CO2 per year) by 2050 and CCUS technology will be applied more widely in EOR, with some application in deep sa-line formation storage. Under this assumption, the total CO2 emission in 2050 is expected to be 843.4 MtCO2 higher than in the DDPP scenario (15% Mt higher, see figure above).
5Challenges, opportunities, and enabling conditionsThe DDPP pathway demonstrates a potential low-carbon pathway for China’s social and eco-nomic development. However, considering both international and domestic circumstances, there are still a number of uncertainties and challeng-es to the achievement of the DDPP scenario in China must be highlighted.
a) GDP growth. GDP growth is an important parameter de-termining energy consumption needs and CO2 emissions, and realization of peak CO2 emissions requires that the decrease of CO2 emissions per GDP must be higher than in-crease of the GDP growth rate. China saw an average GDP growth above 10% during 1990 to 2010, which gradually fell to 7% in 2014 – the lowest in the past 24 years. Considering that China is now entering an “economic new normal”, expectations regarding China’s future economy growth are still controversial. The Chinese central government is confident of
maintaining a GDP growth rate around 7%, which will be still much higher in the future than that of developed countries. (The GDP growth rate in developed countries varies from 2% to 3%). In order to achieve CO2 emission peak by 2030, it is necessary to transit to a low-carbon pathway that emphasizes quality of life rather than speed of development.
b) Future adjustment of the industrial struc-ture and change of development mode.China’s energy consumption per unit of GDP is twice the average level of the world, which means there is a significant potential for the re-duction of energy intensity. However, the decline cannot depend only on improvement of tech-nology development. Notably, energy-intensive industries in China feature a relatively low-ef-ficiency gap with developed countries (10% to 20%). Therefore, the reduction of energy con-sumption per GDP in China would rely essentially on adjustments to the industrial structure and
5
14 R.T. Dahowski, et al. Pacific Northwest National Laboratory. A $70/Tco2 Greenhouse gas mitigation backstop for China’s industrial and electric power sectors: insights from a comprehensive CCS cost curve. 2012
15 R.T Dahowski, et al. Pacific Northwest National Laboratory. Examining CCS deployment potential in China via application of an integrated CCS cost curve. 2013
Challenges, opportunities, and enabling conditions
25 Pathways to deep decarbonization in China � 2015 report
changes in the mode of development towards light industry and the service industry. However, export manufacturing goods have been an important component of China’s economic growth, responsible for about 25% of energy con-sumption. Given that adjustments to the structure of exports are not an easy task, manufacturing exports (and associated emissions) are expected to remain important in the long run. Resolution of these uncertainties regarding carbon emissions reductions requires further investigation.
c) Decrease of emissions factor of per unit energy consumption. As shown in the foregoing analysis, the rapid development of non-fossil fuel and natural gas play important roles in lowering the emissions factor of per unit energy consumption. China has declared its non-fossil fuel development target to be 20% of primary energy in 2030, which means that 800-1000 Mtoe fossil fuels will be replaced with non-fossil fuels by then. After 2030, most hydro power resources will have been exploited and the further increase of non-fossil fuel will mainly depend on wind, solar energy, and nuclear power. Sustainable develop-ment of wind and solar must resolve issues such as long-distance transmission of power and pow-er grid stability with a high ratio of renewables, and the development of nuclear also confronts barriers such as safety concerns. Such a rapid pace of growth in the development of non-fos-sil fuels development can be sustained only by continuing supportive policies and enhancing the implementation of such policies.
d) Controlling the increase of service de-mand during China’s urbanization process. China’s per capita energy consumption remains significantly lower than the level of developed countries (one-third of the US level and 60% of the levels of Europe and Japan), as a result of different lifestyles and lower living standards. En-
ergy consumption and emissions per capita will increase in parallel with the urbanization process in China. China’s population is expected to con-tinue growing in the next 15 to 20 years, and with a substantial segment of the population migrat-ing from rural to urban areas in order to pursue better living conditions. In this context, if the service demands in building and transportation sector are not properly guided, energy consump-tion and emissions will increase at a faster pace, resulting in a later peak of CO2 emissions and higher overall levels of CO2 emissions. Under the DDPP pathway, the average floor area per capita will not exceed the level of major EU countries, and car ownership will be about half the level of Japan. Effective controls of such trends will not be easily realized and will require effective rules, regulations and markets and guiding and the pro-motion of a low-carbon life consciousness.
e) CCUS technology development. CCUS is a key technology to reduce CO2 emis-sion in the mid to long term, and it brings about 31.8% reduction of total CO2 emissions in 2050 under the DDPP scenario, with an accumulative CO2 capture of around 27 Gt from 2010 to 2050. However, based on the current status of CCUS technology, it still faces a lot of challenges in-cluding unclear national strategies and policies, lack of financing, concern about the integrity of storage, uncertainty of technology innovations, etc. In order to accelerate the implementation of CCUS technologies, it is necessary to strengthen international cooperation with other countries with good experience in developing technologies and lowering costs, accelerate the demonstra-tion project by mobilizing both domestic and international funds, develop a coordinated plan for accelerated development of the technology in the wider possible markets, carry out more research on the integrity of CO2 storage, and reinforce the education of the public to improve acceptability of these solutions.
The change of narrative: From cost to benefit
Pathways to deep decarbonization in China � 2015 report 26
6The change of narrative: From cost to benefitTraditionally, the climate issue has been closely linked with development in China. Carbon emis-sions control has long been interpreted as a limit to the development of China’s economy, and most of researchers’ and decision makers’ at-tention has been focused on the cost associated with carbon emissions reduction. However such old thinking is now changing in China, due to the combined pressure of slowing economic devel-opment, more serious energy security concerns, and the challenge of improving air quality. The slowing down of growth makes China interested in new driving forces for its economy. The new energy industry and low-carbon infrastructure is now considered to be an emerging industry that can drive future growth. China has become the top investor in wind turbine, solar PV, nu-clear energy, and high-speed railway systems. Those technologies are all linked to a low-carbon transition that may bring more business oppor-tunities for Chinese enterprises. Promotion of a low-carbon transition is no longer regarded as a costly effort, driven mainly by international pressure. Instead, it is considered as an oppor-tunity, a means for propelling China’s growth and for avoiding the middle-income trap16. The increasing concerns of air quality and energy se-curity are also causing decision makers to hedge those risks by improving energy efficiency and reducing dependence on fossil fuels.Along with rapid industrialization and urbaniza-tion, China is facing serious environmental pol-lution. Although China has made tremendous efforts to limit air pollution, these measures have not kept up with the growth of its economy and fossil-fuel use. We find that the air pollution in China is closely related to long-term extensive use of coal and other fossil fuel and to the exten-
sive economy growth mode. As China’s industri-alization, urbanization, and energy consumption continue to increase, pressure to control air pol-lution also continue to increase. Attributable to stricter control policies in recent years, PM2.5 concentration in 2030 is projected to decrease significantly nationwide, but it is hard for cities in the Yangtze River Delta and the Beijing-Tian-jin-Hebei region to meet compliance require-ments. Advanced end-of-pipe control measures are available to achieve acceptable levels of air quality, but some key cities need to restructure their energy and industry sectors in order to better comply with control policies. Therefore, accelerated transformation of its economic de-velopment mode and energy structure is of great significance for China’s future clean air.The th inking in China about climate action has changed. Addressing climate change is no longer seen as a threat to development but rather as an opportunity for better growth. However, it is unclear how China can achieve a low carbon transition. China has been tran-sitioning to a market economy, but still has many regulations. The challenge faced by the Chinese government in the future will be how to make the market play a constructive role in bringing about a low-carbon transition, re-ducing the need for command-and-control regulation. Th is calls for the elaboration of a complex policy package, able to articulate different types of policy instruments to trig-ger the most e fficient way the low-carbon transformations in all aspects of the Chinese socio-economic system.Under a peak carbon emissions and coal con-sumption scenario, with integrated measures of structural adjustment and advanced end-of-pipe
6
16 This describes a situation where in a country stagnate after reaching middle income status (5000-10000$ per capita) but don’t go to the level of advanced countries..
Policy recommendation
27 Pathways to deep decarbonization in China � 2015 report
control, air-quality modelling results show that air quality in China’s major cities could meet na-tional Grade II standards by 2030. With further optimization of energy and industrial structure on the basis of the End-Of-Pipe scenario, SO2, NOx, PM2.5, VOC and NH3 emissions will de-crease by 78%, 77%, 79%, 52%, and 42%, re-spectively, from 2010 levels. Under the DDPP scenario, compared with ex-isting policies and measures, various measures for further energy-saving will be taken, includ-ing changes in the mode of economic devel-opment, changes of lifestyle, energy structure adjustment, and incentives for the application of advanced technologies. With optimization of the economic structure, the emerging17 and tertiary industries will develop rapidly, and ad-vanced technologies will be widely used to save energy. The DDPP scenario demonstrates the feasibility of many transformations, compared to the Business As Usual scenario, aligning the low-carbon objective with development prior-
ities, including i) lower total energy demand, ii) improvements to the energy structure, iii) a cap in coal consumption and a reduction of the share of coal in energy consumption to nearly 50% in 2030, with coal use concentrated in the electricity and heating sectors with advanced end-of-pipe control and limitation of coal use in small facilities, iv) a rise of the share of nat-ural gas and non-fossil fuel to more than 35%, notably through prioritization of natural gas in the residential sector or as a substitute to coal, v) a curbing of the production in energy-inten-sive industries, confining to mainly to domestic demand, with a peak of production of energy-in-tensive products near 2020 (notably the pro-duction of steel and cement in 2030 is estimat-ed to be lower than 2010), vi) improved energy efficiency, in line with the advanced standards of developed countries, making industrial pro-duction more efficient and more clean, vii) en-ergy-saving standards in new buildings and for public consumption .
7Policy recommendation
Promote the transition from carbon intensi-ty control to total carbon emissions control gradually. As China has set the goal of peaking around 2030, setting carbon-intensity reduction targets for each year and for every five years is inadequate for controlling carbon emission as the economy continues to grow. A transition to total carbon emissions control is necessary in order to realize absolute carbon emissions reduction. In the short- and medium term, when the focus is on reversing the rapid increase in carbon emis-sions by 2020, it would be useful to set manda-tory national carbon emissions standards for key
products, industries, and sectors to pilot carbon emissions control in these areas. Meanwhile, aim-ing at peaking around 2030, it will be necessary to establish an allocation of allowance manage-ment system in order to set up the total carbon emissions control scheme by2030, and the allow-ance of each province, autonomous region, and municipality must be determined accordingly. In the long term, focused on achieving a steady decrease of carbon emissions before 2050, an economy-wide total-carbon-emission-control regulatory system and implementing scheme must be established.
7
17 Including advanced equipment industry, information industry, biomedical industry, aviation industry, new material industry, new energy industry and energy saving and environmental friendly industry.

Policy recommendation
Pathways to deep decarbonization in China � 2015 report 28
Rely more on market-based measures by developing a reasonable pricing system based on GHG emissions. Market-based mechanisms can be more effective than admin-istrative measures in reducing GHG emissions and lowering emissions-reduction costs in some sectors, and are positioned as important meas-ures in some sectors in EU’s GHG emissions-re-duction strategy. Considering China’s process of marketization, it is necessary to build a national carbon market during the 13th Five-Year Period, based on current carbon cap-and-trade pilots; to establish detailed and effective regulations of enforcement; and to continue to improve it af-terwards. The population, GDP, and total energy consumption in these seven pilots are 18%, 27%, and 23% of that of China respectively in 2010, covering more than 20 industries and with total allowances of 1.2GtCO2 per year. In order to re-alize the transformation from pilots to a national carbon market, a series of national administra-tive measures and rules should be launched and national allowance allocation method should be developed. In parallel, the optimization of policy designs will have to be continued, notably through the use of fiscal subsidies and pollutant discharge fees. In light of sources of pollution that are difficult to regulate with a carbon mar-ket, such as private vehicles existing fossil fuel subsidies, such as the oil consumption subsidy, should be gradually eliminated, and a sectorial carbon tax mechanism should be established to realize GHG reduction for these sources. Along with modernization of energy production and consumption, it is necessary for government to extend energy system reforms, especially elec-tricity market reform, so as to let the market play the dominant role in resource allocation and build an energy-pricing system that reflects the environmental costs of their externalities, which is also crucial for the effective and ef-ficient implementation of a carbon market in China.
Strengthen capacity building in statisti-cal and accounting systems and improve assessment and appraisal systems. Lack-ing consistency in energy statistical data on the national, provincial, and sectorial level has been a major barrier in setting reasonable but ambitious emissions control targets. In 2014, China set up a statistical indicator system for addressing climate change and a statistics-re-porting system for climate change departments. It is highly recommended that China accelerates the establishment of comprehensive guidance on data sources and methodologies on both the provincial and sectorial levels (especially for key industries) before 2020, and enhance its MRV system on the basis of existed MRV guidelines issued by National Development and Reform Commission of China. In the long-term perspec-tive, it is essential to assess the performance of emissions-reduction policies and measures with an appropriate performance appraisal system, so as to clearly follow the efforts in adjusting the in-dustrial structure, saving energy, and optimizing the energy resource mix in order to successfully achieve goals for emissions reduction on the na-tional, provincial and sectorial levels.
Advocate low-carbon consumption and promote broad participation by the public. As China concludes its process of industrializa-tion around 2020, urbanization will be the main driving force of energy consumption and GHG growth in the long run while the living standard continues to improve. Therefore, it’s highly im-portant to promote a low-carbon-consumption lifestyle throughout the whole society. By gain-ing experience and learning lessons from all kinds of low-carbon-consumption pilots by 2020, the low-carbon consumption concept should be pro-moted through multiple channels and the media. To promote GHG-related information disclosure and low-carbon goods and services supply, a car-bon disclosure mechanism should be established
Policy recommendation
29 Pathways to deep decarbonization in China � 2015 report
that enforces compulsory carbon labels and car-bon footprint information on key products and sectors, followed by a gradual extension to all sectors. In addition, dedicated investments in low-carbon infrastructure and services should be expanded to provide adequate infrastructur-al context for low-carbon development, e.g., by developing public recreational facilities, opti-mizing slow-traffic systems, and traffic transfer systems. Emphasizing a low-carbon operation and management mode after 2030, smart and low-carbon communities should be developed through information-based processes, such as Internet of Things and the intelligent house, and low-carbon property management should be promoted through the use of electronic and intelligent service platforms. Furthermore, the economy incentives should be strengthened to promote the low-carbon consumption, such as the adoption of low-carbon-oriented ener-gy-pricing mechanism and carbon tax.

Pathways to deep decarbonization in China � 2015 report 30
31 Pathways to deep decarbonization in China � 2015 report
Standardized DDPP graphics for China scenarios
Standardized DDPP graphics for China scenariosCN – Central Scenarios
CN – High EV
CN – Low CCS
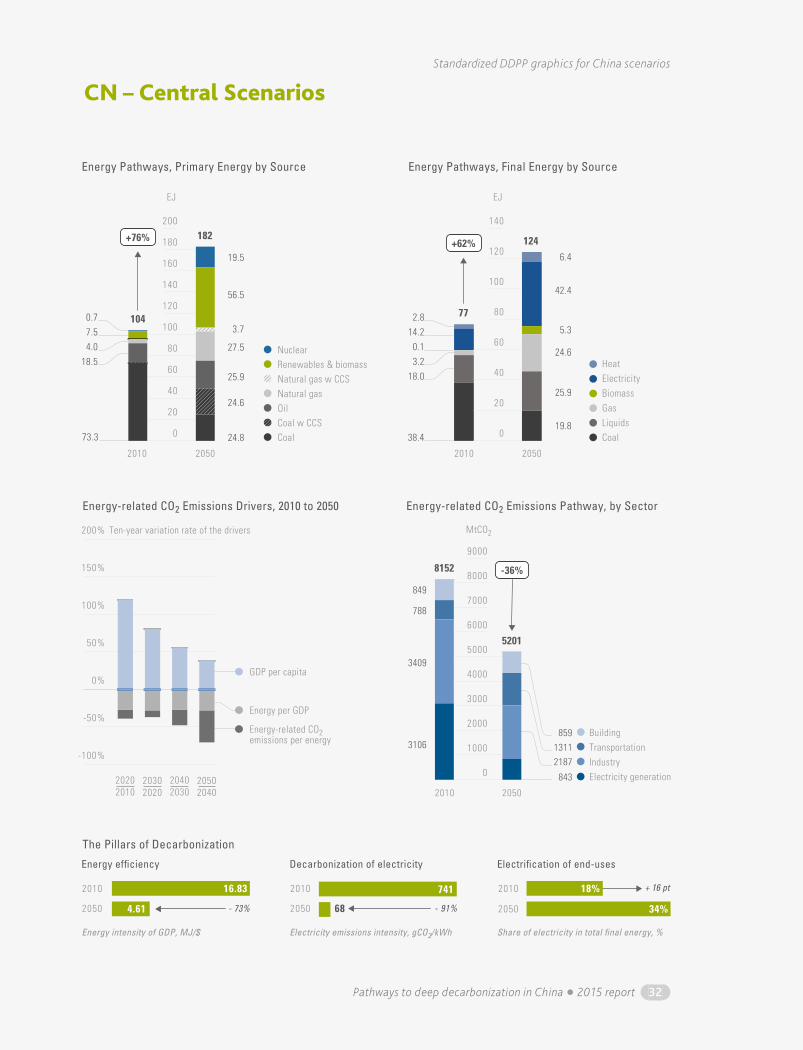
Pathways to deep decarbonization in China � 2015 report 32
Standardized DDPP graphics for China scenarios
20
0
100
40
60
80
20
0
40
60
20
0
40
60
30
0
120
90
60
160
30
0
120
90
60
160
60
30
0
90
Biofuel
Districtheating
Pipeline gasLiquid fossilCoal
Solid biomassFinal elec.
Natural gas
Nuclear
Hydro
Wind
Solar PVBiomassOther
Coal
Natural gas w/ CCS
Coal w/ CCS
Energy Supply Pathways, by Resource
2010 2020 2030 2040 2050
Electricity
Energy Use Pathways for Each Sector, by Fuel, 2010 – 2050
EJ
EJ EJ
gCO2/MJ gCO2/MJ
gCO2/MJ
Final elec.
Pipeline gas
Liquid fossil
Pipeline gasLiquid fuels
Pipeline gas w/ccs
Coal w/ccs
Final elec.
Steam
Coal
2010 2030 20502010 2030 20502010 2030 2050
Industry Buildings Transportation
9000
6000
3000
0
12000
15000 TWh
gCO2/kWh
375
500
625
125
250
0
750
38
115
42
71
51
68
741
112
Carbon intensity
0%
-50%
-100%
50%
100%
150%
200%
200
120
160
180
140
100
60
80
40
20
0
EJ
140
120
100
60
80
40
20
0
EJ
2000
1000
0
3000
5000
4000
6000
7000
8000
9000
MtCO2
2010
2050
13112187
859
843
2010 2050
- 73% - 91%
+ 16 pt2010
2050
2010
2050
16.83 741 18%
34%684.61
Energy ef�ciency
Energy intensity of GDP, MJ/$
Decarbonization of electricity
Electricity emissions intensity, gCO2/kWh Share of electricity in total �nal energy, %
Electri�cation of end-uses
The Pillars of Decarbonization
20202010
20302020
20402030
20502040
+76% +62%
2010 2050
Energy Pathways, Primary Energy by Source
Energy-related CO2 Emissions Drivers, 2010 to 2050
ElectricityHeat
BiomassGasLiquidsCoal
2010 2050
Ten-year variation rate of the drivers
CHN - Central ScenariosDonec id elit non mi porta gravida at eget curabitur blandit tempus porttitor metus. Maecenas faucibus mollis interdum.
42.4
6.4
5.3
24.6
25.9
19.8
Energy-related CO2 Emissions Pathway, by Sector
Energy Pathways, Final Energy by Source
104
182
849
788
3409
3106
-36%
7.50.7
18.54.0
73.3
14.22.8
0.13.2
18.0
38.4
Electricity generationIndustryTransportationBuilding
Coal w CCS
Natural gasNatural gas w CCS
Oil
Renewables & biomassNuclear
Coal
3.7
56.5
19.5
27.5
24.6
25.9
24.8
GDP per capita
Energy per GDP
Energy-related CO2emissions per energy
77
124
8152
5201
CN – Central Scenarios
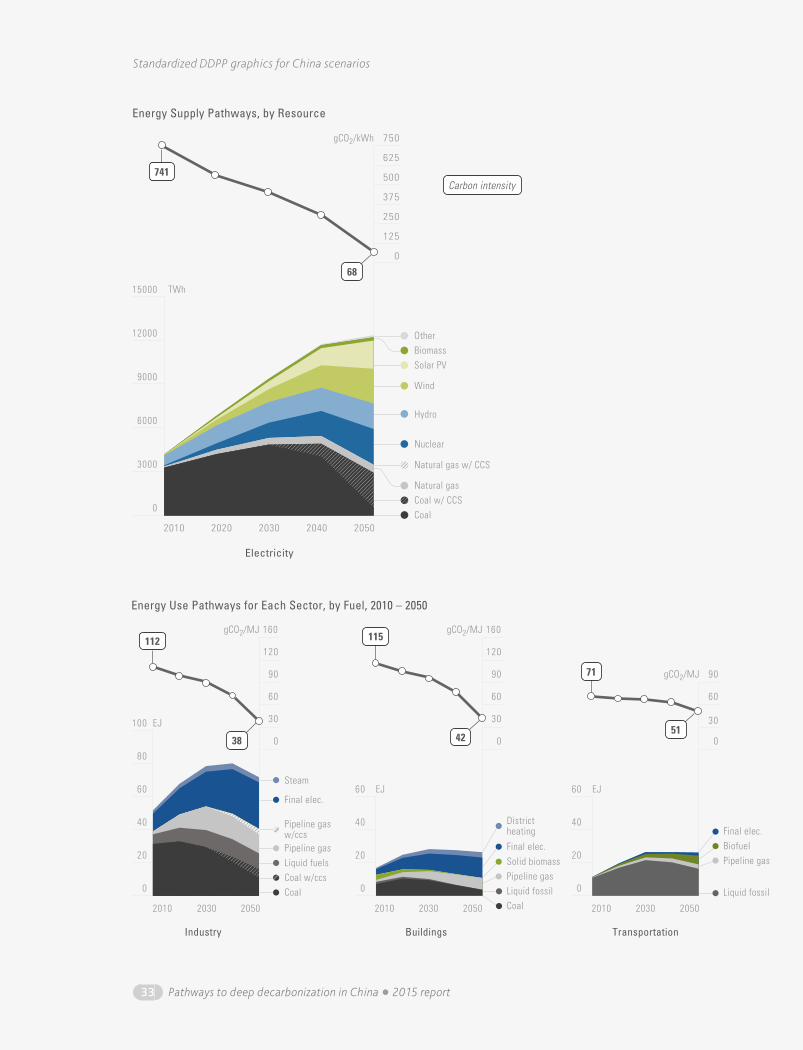
33 Pathways to deep decarbonization in China � 2015 report
Standardized DDPP graphics for China scenarios
20
0
100
40
60
80
20
0
40
60
20
0
40
60
30
0
120
90
60
160
30
0
120
90
60
160
60
30
0
90
Biofuel
Districtheating
Pipeline gasLiquid fossilCoal
Solid biomassFinal elec.
Natural gas
Nuclear
Hydro
Wind
Solar PVBiomassOther
Coal
Natural gas w/ CCS
Coal w/ CCS
Energy Supply Pathways, by Resource
2010 2020 2030 2040 2050
Electricity
Energy Use Pathways for Each Sector, by Fuel, 2010 – 2050
EJ
EJ EJ
gCO2/MJ gCO2/MJ
gCO2/MJ
Final elec.
Pipeline gas
Liquid fossil
Pipeline gasLiquid fuels
Pipeline gas w/ccs
Coal w/ccs
Final elec.
Steam
Coal
2010 2030 20502010 2030 20502010 2030 2050
Industry Buildings Transportation
9000
6000
3000
0
12000
15000 TWh
gCO2/kWh
375
500
625
125
250
0
750
38
115
42
71
51
68
741
112
Carbon intensity
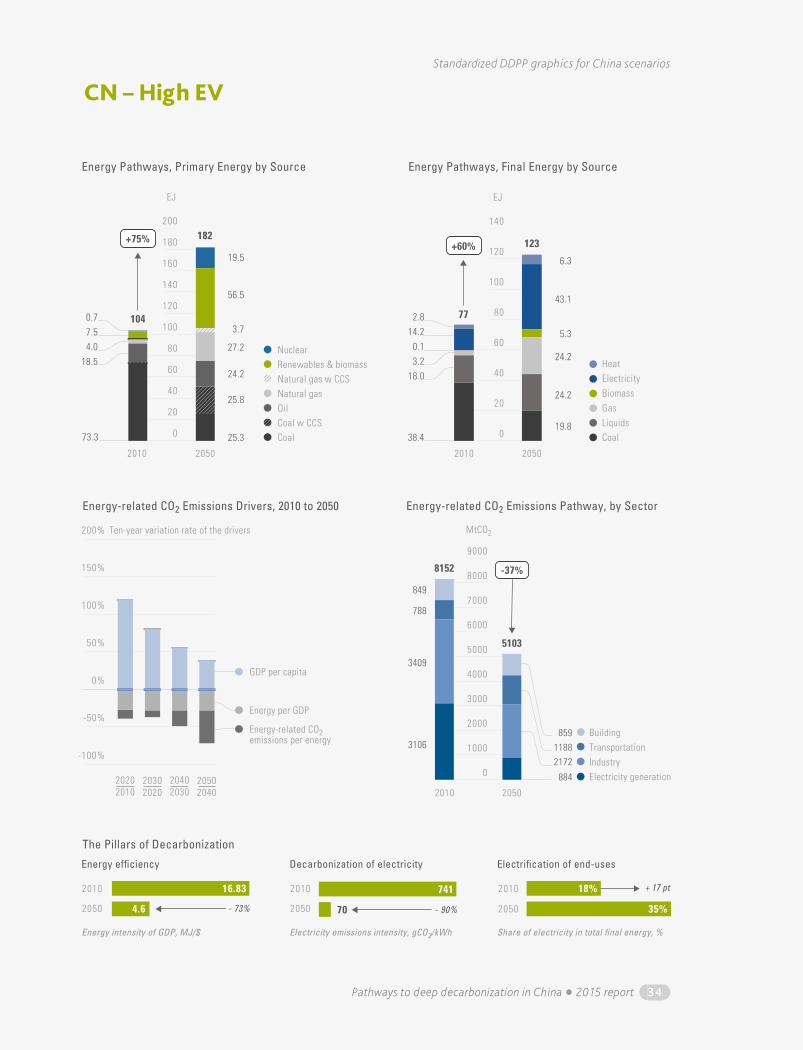
Pathways to deep decarbonization in China � 2015 report 34
Standardized DDPP graphics for China scenarios
20
0
40
60
20
0
40
60
30
0
120
90
60
160
30
0
120
90
60
160
60
30
0
90
Wind
Solar PVBiomassOther
Natural gas
Nuclear
Hydro
Coal
Natural gas w/ CCS
Coal w/ CCS
Energy Supply Pathways, by Resource
2010 2020 2030 2040 2050
Electricity
Energy Use Pathways for Each Sector, by Fuel, 2010 – 2050
gCO2/MJ gCO2/MJ
gCO2/MJ
2010 2030 20502010 2030 20502010 2030 2050
Industry Buildings Transportation
9000
6000
3000
0
12000
15000 TWh
gCO2/kWh
375
500
625
125
250
0
750
Biofuel
Districtheating
Pipeline gasLiquid fossilCoal
Solid biomassFinal elec.
EJ
EJ
EJ
Final elec.
Pipeline gasLiquid fossil
Pipeline gasLiquid fuels
Pipeline gas w/ccs
Coal w/ccs
Final elec.
Steam
Coal
38
115
42
71
50
70
741
112
Carbon intensity
0%
-50%
-100%
50%
100%
150%
200%
200
120
160
180
140
100
60
80
40
20
0
EJ
140
120
100
60
80
40
20
0
EJ
2000
1000
0
3000
5000
4000
6000
7000
8000
9000
MtCO2
Energy-related CO2emissions per energy
Energy per GDP
GDP per capita
849
788
3409
3106
-37%
14.22.8
0.13.2
18.0
2010
2050
11882172
859
884
2010 2050
- 73% - 90%
+ 17 pt2010
2050
2010
2050
16.83 741 18%
35%704.6
Energy ef�ciency
Energy intensity of GDP, MJ/$
Decarbonization of electricity
Electricity emissions intensity, gCO2/kWh Share of electricity in total �nal energy, %
Electri�cation of end-uses
The Pillars of Decarbonization
20202010
20302020
20402030
20502040
+60%
2010 2050
Energy Pathways, Primary Energy by Source
Energy-related CO2 Emissions Drivers, 2010 to 2050
ElectricityHeat
BiomassGasLiquidsCoal
2010 2050
Ten-year variation rate of the drivers
CHN - High EVDonec id elit non mi porta gravida at eget curabitur blandit tempus porttitor metus. Maecenas faucibus mollis interdum.
43.1
6.3
5.3
24.2
24.2
19.8
Energy-related CO2 Emissions Pathway, by Sector
Energy Pathways, Final Energy by Source
73.3 38.4
Electricity generationIndustryTransportationBuilding
+75%
104
182
7.50.7
18.54.0
3.7
56.5
19.5
27.2
25.8
24.2
25.3Coal w CCS
Natural gasNatural gas w CCS
Oil
Renewables & biomassNuclear
Coal
8152
5103
77
123
CN – High EV

35 Pathways to deep decarbonization in China � 2015 report
Standardized DDPP graphics for China scenarios
20
0
40
60
20
0
40
60
30
0
120
90
60
160
30
0
120
90
60
160
60
30
0
90
Wind
Solar PVBiomassOther
Natural gas
Nuclear
Hydro
Coal
Natural gas w/ CCS
Coal w/ CCS
Energy Supply Pathways, by Resource
2010 2020 2030 2040 2050
Electricity
Energy Use Pathways for Each Sector, by Fuel, 2010 – 2050
gCO2/MJ gCO2/MJ
gCO2/MJ
2010 2030 20502010 2030 20502010 2030 2050
Industry Buildings Transportation
9000
6000
3000
0
12000
15000 TWh
gCO2/kWh
375
500
625
125
250
0
750
Biofuel
Districtheating
Pipeline gasLiquid fossilCoal
Solid biomassFinal elec.
EJ
EJ
EJ
Final elec.
Pipeline gasLiquid fossil
Pipeline gasLiquid fuels
Pipeline gas w/ccs
Coal w/ccs
Final elec.
Steam
Coal
38
115
42
71
50
70
741
112
Carbon intensity
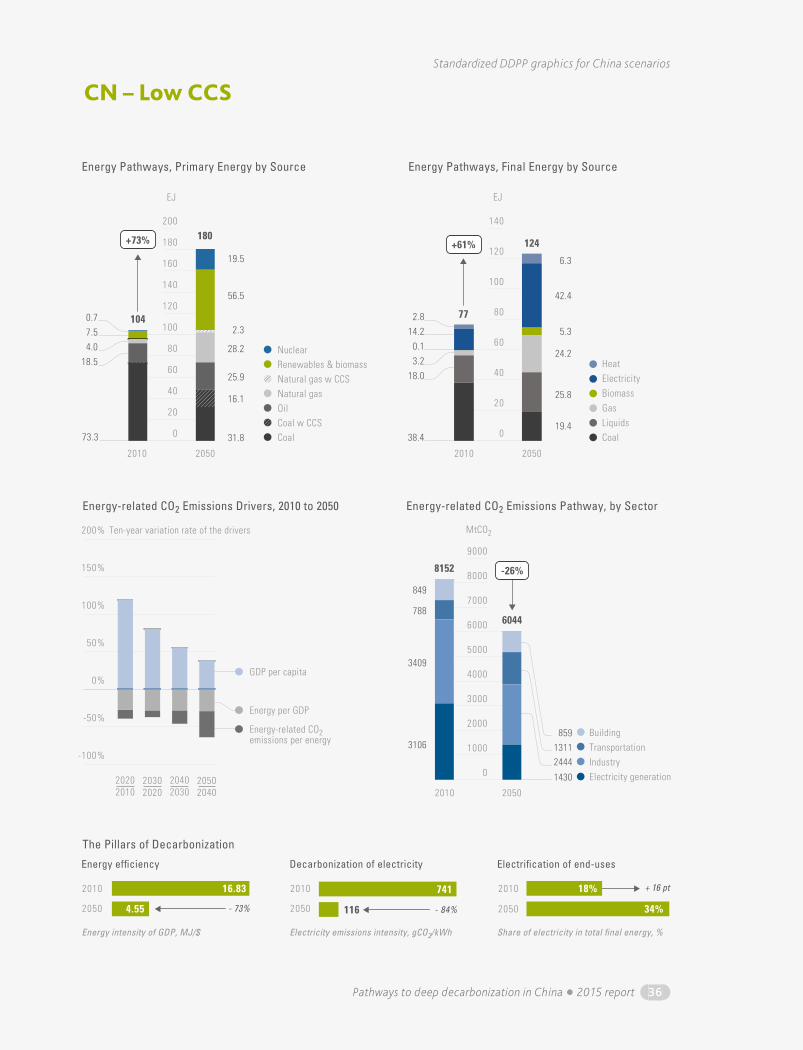
Pathways to deep decarbonization in China � 2015 report 36
Standardized DDPP graphics for China scenarios
20
0
100
40
60
80
20
0
40
60
20
0
40
60
30
0
120
90
60
160
30
0
120
90
60
160
60
30
0
90
WindSolar PVBiomassOther
Natural gas
Nuclear
Hydro
Coal
Natural gas w/ CCS
Coal w/ CCS
Energy Supply Pathways, by Resource
2010 2020 2030 2040 2050
Electricity
Energy Use Pathways for Each Sector, by Fuel, 2010 – 2050
gCO2/MJ gCO2/MJ
gCO2/MJ
2010 2030 20502010 2030 20502010 2030 2050
Industry Buildings Transportation
9000
6000
3000
0
12000
15000 TWh
gCO2/kWh
375
500
625
125
250
0
750
Biofuel
Districtheating
Pipeline gasLiquid fossilCoal
Solid biomassFinal elec.
EJ
EJ EJ
Final elec.
Pipeline gas
Liquid fossil
Pipeline gasLiquid fuels
Pipeline gas w/ccs
Coal w/ccs
Final elec.
Steam
Coal
48
115
48
71
52
116
741
112
Carbon intensity
0%
-50%
-100%
50%
100%
150%
200%
200
120
160
180
140
100
60
80
40
20
0
EJ
140
120
100
60
80
40
20
0
EJ
2000
1000
0
3000
5000
4000
6000
7000
8000
9000
MtCO2
Energy-related CO2emissions per energy
Energy per GDP
GDP per capita
849
788
3409
3106
-26%
13112444
859
1430
14.22.8
0.13.2
18.0
+61%
42.4
6.3
5.3
24.2
25.8
19.4
2010
2050
2010 2050
- 73% - 84%
+ 16 pt2010
2050
2010
2050
16.83 741 18%
34%1164.55
Energy ef�ciency
Energy intensity of GDP, MJ/$
Decarbonization of electricity
Electricity emissions intensity, gCO2/kWh Share of electricity in total �nal energy, %
Electri�cation of end-uses
The Pillars of Decarbonization
20202010
20302020
20402030
20502040
2010 2050
Energy Pathways, Primary Energy by Source
Energy-related CO2 Emissions Drivers, 2010 to 2050
ElectricityHeat
BiomassGasLiquidsCoal
2010 2050
Ten-year variation rate of the drivers
CHN - Low CCSDonec id elit non mi porta gravida at eget curabitur blandit tempus porttitor metus. Maecenas faucibus mollis interdum.
Energy-related CO2 Emissions Pathway, by Sector
Energy Pathways, Final Energy by Source
73.3 38.4
Electricity generationIndustryTransportationBuilding
+73%
104
180
7.50.7
18.54.0
2.3
56.5
19.5
28.2
16.1
25.9
31.8Coal w CCS
Natural gasNatural gas w CCS
Oil
Renewables & biomassNuclear
Coal
8152
6044
77
124
CN – Low CCS

37 Pathways to deep decarbonization in China � 2015 report
Standardized DDPP graphics for China scenarios
20
0
100
40
60
80
20
0
40
60
20
0
40
60
30
0
120
90
60
160
30
0
120
90
60
160
60
30
0
90
WindSolar PVBiomassOther
Natural gas
Nuclear
Hydro
Coal
Natural gas w/ CCS
Coal w/ CCS
Energy Supply Pathways, by Resource
2010 2020 2030 2040 2050
Electricity
Energy Use Pathways for Each Sector, by Fuel, 2010 – 2050
gCO2/MJ gCO2/MJ
gCO2/MJ
2010 2030 20502010 2030 20502010 2030 2050
Industry Buildings Transportation
9000
6000
3000
0
12000
15000 TWh
gCO2/kWh
375
500
625
125
250
0
750
Biofuel
Districtheating
Pipeline gasLiquid fossilCoal
Solid biomassFinal elec.
EJ
EJ EJ
Final elec.
Pipeline gas
Liquid fossil
Pipeline gasLiquid fuels
Pipeline gas w/ccs
Coal w/ccs
Final elec.
Steam
Coal
48
115
48
71
52
116
741
112
Carbon intensity

Pathways to deep decarbonization in China � 2015 report 38
Standardized DDPP graphics for China scenarios