Embed Size (px)
Citation preview

the
Orthopaedicforum
Patients with Staged Bilateral Total Joint Arthroplastyin Registries
Immortal Time Bias and Methodological Options
Stephanie L. van der Pas, PhD, Rob G.H.H. Nelissen, MD, PhD, and Marta Fiocco, PhD
Investigation performed at the Leiden University Medical Center and the Mathematical Institute of Leiden University, Leiden, the Netherlands
Background: In arthroplasty data, patients with staged bilateral total joint arthroplasty (TJA) pose a problem in statisticalanalysis. Subgroup analysis, in which patients with unilateral and bilateral TJA are studied separately, is some-times considered an appropriate solution to the problem; we aim to show that this is not true because of immortal timebias.
Methods:We reviewed patients who underwent staged (at any time) bilateral TJA. The logical fallacy leading to immortaltime bias is explained through a simple artificial data example. The cumulative incidences of revision and death arecomputed by subgroup analysis and by landmark analysis based on hip replacement data from the Dutch ArthroplastyRegister and on simulated data sets.
Results: For patients who underwent unilateral TJA, subgroup analysis can lead to an overestimate of the cumulativeincidence of death and an underestimate of the cumulative incidence of revision. The reverse conclusion holds forpatients who underwent staged bilateral TJA. Analysis of these patients can lead to an underestimate of the cumulativeincidence of death and an overestimate of the cumulative incidence of revision. Immortal time bias can be prevented byusing landmark analysis.
Conclusions: When examining arthroplasty registry data, patients who underwent staged bilateral TJA shouldbe analyzed with caution. An appropriate statistical method to address the research question should beselected.
Worldwide, >3 million total hip and knee arthroplasties areperformed annually, and this number is predicted to increasesubstantially within the next decades1,2. In general, outcome is
measured in terms of mortality, complications, or revision ratedifferences between implants. Data on total joint arthroplasties(TJAs) are collected in an increasing number of arthroplasty
Disclosure: S.L. van der Pas received funding from the Netherlands Organization for Scientific Research. R.G.H.H. Nelissen received funding from the LRRDutch Arthritis Foundation. The sources of funding had no role in the collection, analysis, or interpretation of the data, in the preparation of themanuscript,or in its submission for publication. The Disclosure of Potential Conflicts of Interest forms are provided with the online version of the article (http://links.lww.com/JBJS/D433).
e82(1)
COPYRIGHT � 2017 BY THE JOURNAL OF BONE AND JOINT SURGERY, INCORPORATED
J Bone Joint Surg Am. 2017;99:e82(1-8) d http://dx.doi.org/10.2106/JBJS.16.00854

registries around the world, and the resulting data have provento be valuable in improving the outcome of TJA3. However,because patients tend to have additional TJAs during the follow-up period, these “new” primary TJAs will interfere with analysisbased on the first primary TJA. The number of patients withbilateral TJA is not negligible. In the Netherlands in 2014, 80%of procedures were in patients who had not had a previoustotal hip arthroplasty, and 20% of procedures were in patientswho had undergone a prior total hip arthroplasty on the con-tralateral side; in Sweden, 20.5% of patients underwent astaged bilateral procedure between 1992 and 2014; and inNorway, 23.6% of patients underwent a bilateral procedurewithin 10 years4-6.
A basic principle in survival analysis is that subgroupsthat are defined by patient characteristics not known at thestart of follow-up (e.g., receiving a second TJA) can only becompared with the greatest caution. The reason is immortaltime bias, a well-known phenomenon in observational stud-ies, resulting from flawed statistical analysis7,8. Immortal timerefers to a period of follow-up during which the study out-come, which may be death or another event, cannot occur. Itwas first described in the context of heart transplant data,when it was noted that the observed improved survival ofpatients with heart transplants was a result of selection bias:only patients who survived long enough to receive a hearttransplant were included in the transplant group9. Analysesof arthroplasty data risk being affected by immortal time biasas well. Immortal time bias arises when patients with stagedbilateral TJA are studied as a separate subgroup, becauseonly those patients who survive long enough to receive thesecond implant are observed. The bias occurs when either re-
vision of 1 of the implants or death is taken as an end point.This is a different methodological problem than that of com-peting risks, although competing risks should be accountedfor as well.
Problems with the statistical analysis of arthroplasty datathat include patients with staged bilateral TJA, who are funda-mentally different from patients with unilateral TJA, have beennoted. The focus so far has been on the dependence between 2TJAs in 1 patient, and not on the time-dependent bilateralstatus. No consensus has been achieved on how to analyze thesedata in a methodologically sound way10. A review of papers in 7high-impact orthopaedic journals showed that 42% of clinicalstudies with multiple observations per patient used these ob-servations inappropriately11. One recommendation by Bryantet al.11 was to analyze patients with bilateral TJA as a separatesubgroup, which is done in practice5,12,13, or exclude them fromthe analysis14. However, both methods may lead to misinter-pretation because of immortal time bias.
The aim of this article is to explain why subgroup analysisis inappropriate for estimating revision rates in TJA and tosuggest alternative statistical techniques. Which of the methodsis appropriate depends on the research question. Landmarkanalysis is explained in detail because it is a relatively newmethod that is not commonly applied to arthroplasty data,even though it is designed to prevent immortal time bias. Itis especially well-suited for research questions in which pa-tients who have undergone unilateral and staged bilateral TJAare compared, and also for comparisons of subgroups withinthe patient population that has undergone staged bilateralTJA. A second type of research question concerns analysesof the entire population of arthroplasty patients, with no
Fig. 1
Cumulative incidence of revision and death for patients <50 years old and >80 years old with TJA, estimated by the Aalen-Johansen estimator with
data from the Dutch Arthroplasty Register (6,361 patients <50 years old; 21,891 patients >80 years old). Each patient’s first total hip arthroplasty
was used. The competing risk is negligible for the youngest patients, but very strong for the older patients.
e82(2)
THE JOURNAL OF BONE & JOINT SURGERY d J B J S .ORG
VOLUME 99-A d NUMBER 15 d AUGUST 2, 2017PATIENTS WITH STAGED BILATERAL TOTAL JOINT ARTHROPLASTY IN
REGISTRIES

particular interest in patients who have undergone bilateralarthroplasty. This type of research question is more commonthan the first; leaving out the patients who have undergonebilateral arthroplasty is not appropriate in this case either. Wealso review some statistical methods for this second type ofresearch question.
Materials and MethodsWe demonstrate the mechanism behind immortal time bias and its potentialconsequences on 3 data sets: an artificial data example, simulated data sets, anddata from the Dutch Arthroplasty Register. The analyses are for total hip ar-throplasty, but the same reasoning holds for any joint of which there are at least2 (e.g., knees, shoulders, and ankles). We only consider patients with staged (atany time during follow-up of the index TJA) bilateral TJA because data regard-ing patients who undergo bilateral TJA in 1 stage (i.e., within 1 surgical session)do not contribute to immortal time bias.
Competing RisksA patient may die before experiencing revision of the implant. If this competingrisk of death is not accounted for, the risk of revision surgery will be over-estimated
10,15,16. This is especially important for arthroplasty analyses, given the
age of most patients (average age at index surgery in the Netherlands is 69 yearsfor total hip arthroplasty and 68 years for total knee arthroplasty)
4. The need for
competing risks is illustrated in Figure 1, which shows a strong competing riskof death for patients >80 years old. Methods to determine competing risksfor unadjusted and adjusted analyses include the Aalen-Johansen estimator,the Fine-Gray regression, or the cause-specific Cox regression
15,17.
Fig. 2
Visualization of the artificial data example. The circles denote patients who will have only 1 implant, while the squares indicate patients who will have
a procedure on the contralateral side at the 2-year mark. The green symbols indicate event-free patients, the black symbols indicate patients who
die before experiencing revision, and the orange symbols indicate patients in whom the prosthesis has been revised. The subgroup analysis ignores
the fact that some patients will have died before realizing their potential of becoming bilateral; therefore, some patients who would have potentially
undergone a procedure on the contralateral side will be considered in the unilateral group.
Fig. 3
Using the same data as shown in Fig. 2, a landmark time is chosen. In this case, it is after the patients have a bilateral procedure. All patients who died or
had revision surgery before the landmark time are excluded from the analysis.
TABLE I Simulation Parameters and Observed Average Numberof Patients with Bilateral TJA in Each Setting*
Percentage ofPotentially BilateralPatients (Bernoulli)
Average No. ofObserved Patientswith Bilateral TJA
30% 2,462 (25 %)
20% 1,641 (16%)
10% 820 (8%)
*Common simulation parameters were used as follows. No. of pa-tients: 10,000. No. of data sets: 2,000. Distribution of time to revision:Weibull, shape = 1.8, scale = 20 (average of 2,704 revisions). Distri-bution of time to death: Weibull, shape = 1.2, scale = 20 (average of3,601deaths).Distributionof time tobilateral status:exponential, rate=1/3. Distribution of time of follow-up: uniform, between 0 and 30 years.
e82(3)
THE JOURNAL OF BONE & JOINT SURGERY d J B J S .ORG
VOLUME 99-A d NUMBER 15 d AUGUST 2, 2017PATIENTS WITH STAGED BILATERAL TOTAL JOINT ARTHROPLASTY IN
REGISTRIES

Artificial Data ExampleThe underlying mechanism of immortal time bias is illustrated through anartificial example, in which 50% of patients will require surgery on the contra-lateral side exactly 2 years after the index surgery. The first-placed implants inpatients with unilateral and bilateral TJA are compared. The implants of allpatients behave the same: they have a 30% probability of revision after exactly3 years. Furthermore, each patient has a 20% probability of dying after 1 year(Fig. 2). All percentages are chosen for illustrative purposes and are not meantto be realistic. We also consider a second scenario with 5% mortality, 20%bilateral procedures, and 5% revision procedures; we assume independencefor all events.
Landmark AnalysisLandmark analysis allows for a comparison of patients who underwent unilat-eral and staged bilateral TJA without the risk of immortal time bias
18,19. The
first step is to choose a landmark time (e.g., 2 years). The choice of landmarktime should be guided by the research question and should be long enough thatboth subgroups have sufficientmembers for analysis. Only patients who are stillalive and have not experienced revision at the landmark time are included in theanalysis. This ensures a fair comparison between the 2 groups because bothneed to survive for the same minimum amount of time in order to be includedin the analysis.
The next step is to create the subgroups: patients who have under-gone a procedure on the contralateral side by the landmark time and patientswho have undergone a unilateral procedure at the landmark time. As eachpatient’s status is only considered at the landmark time, the latter groupincludes patients who may receive a second implant after the landmark time(Fig. 3).
When the landmark subgroups have been made, the appropriate sta-tistical method can be applied
15,17. The interpretation of the resulting models is
conditional on the landmark time. Thus, conclusions can be drawn for com-parisons between patients with unilateral and staged bilateral TJA, conditionalon the fact that these patients were still alive and did not undergo revision untilafter the landmark time. This is a limitation to this method, which will bedescribed further in the Discussion section.
TABLE II Numbers of Patients and Events Included in the Analysis of the Dutch Arthroplasty Registry Data
No. of Patients No. of Revisions No. of Deaths
Subgroup: 0-1.5 yr 10,393 169 355
Subgroup: 1.5-3 yr 3,674 104 100
Landmark: 0-1.5 yr 5,990 46 171
Subgroup: 1.5-3 yr 2,908 23 75
TABLE III Results of the Subgroup Analysis of the Artificial Data Example*
Scenario 1 Scenario 2
20% Mortality at 1 Yr 5% Mortality at 1 Yr
50% Bilateral Status at 2 Yr 20% Bilateral Status at 2 Yr
30% Revision at 3 Yr 5% Revision at 3 Yr
Cumulative incidence of revision at 3 yr
True 24% 4.8%
Estimated (unilateral TJA) 20% 4.7%
Estimated (staged bilateral TJA) 30% 5.0%
Cumulative incidence of death at 3 yr
True 20% 5%
Estimated (unilateral TJA) 33% 6.2%
Estimated (staged bilateral TJA) 0% 0%
*TJA = total joint arthroplasty.
Fig. 4
Simulation results. Basedon2,000simulation replicates, the percentages
of false positives for a difference in cumulative incidence of revision or
death at a significance level of 5% are shown.
e82(4)
THE JOURNAL OF BONE & JOINT SURGERY d J B J S .ORG
VOLUME 99-A d NUMBER 15 d AUGUST 2, 2017PATIENTS WITH STAGED BILATERAL TOTAL JOINT ARTHROPLASTY IN
REGISTRIES
Simulation StudyTwo thousand data sets that each consisted of 10,000 patients in 3 settings (for atotal of 6,000 data sets) were generated: 10%, 20%, or 30% of these patientswould potentially undergo bilateral TJA. The simulation parameters are shownin Table I.
In all scenarios, there was no difference in the risk of revision for thefirst prosthesis of patients with unilateral or staged bilateral TJA. All of thepatients had the same risk of death. These mechanisms are unlikely to berealistic, but serve to illustrate clearly the potential bias that is induced byperforming a subgroup analysis.
The 2 groups under comparison are patients with unilateral TJA andthose with staged bilateral TJA. For the landmark analysis, a landmark time of3 years was used. The cumulative incidences were estimated by the Aalen-Johansen estimator, and a 2-sided hypothesis test was performed
17,20. As a result
of the construction of the simulated data, every significant test result is a falsepositive.
Dutch Arthroplasty Registry DataSo far, the discussion has focused on comparing patients with unilateral andstaged bilateral TJA. However, the bias is not limited to this situation alone; itmay occur in any comparison based on patient characteristics that develop overtime (e.g., undergoing bilateral TJA within a specified number of years). De-spite this bias, such comparisons are carried out in practice
6,12,21. We illustrate
this phenomenon with data from the Dutch Arthroplasty Registry22. All pa-
tients who underwent the first primary total hip arthroplasty between 2007and 2014 and had a staged procedure on the contralateral side within, at most,3 years of the first total hip arthroplasty were included, except after diagnosesof trauma or a tumor. In total, 14,067 patients with staged bilateral TJA wereanalyzed.
Two groups were compared: patients who had a staged bilateral TJAwithin 1.5 years and those who had them 1.5 to 3 years after the first arthro-
plasty. The landmark analysis was performed at the 3-year landmark point.The numbers of patients and events included in this analysis are shown inTable II.
In both analyses, the Aalen-Johansen estimator of the unadjusted cu-mulative incidences was calculated
17. A 2-sided hypothesis test was performed
at the 5% level20.
ResultsArtificial Data ExampleThe results of the artificial data example are shown in Table III.With subgroup analysis, the cumulative incidence of revision isunderestimated, and the cumulative incidence of death is over-estimated, for patients with unilateral TJA. The reverse conclu-sion holds for patients with staged bilateral TJA. In patients
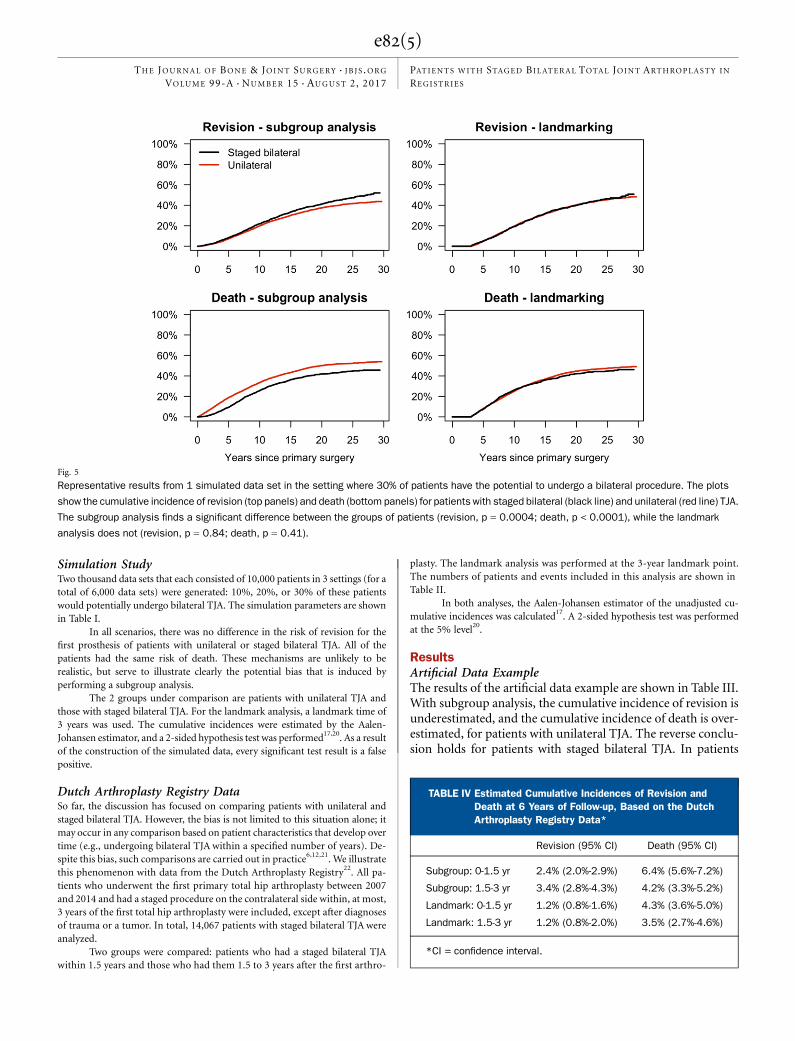
Fig. 5
Representative results from 1 simulated data set in the setting where 30% of patients have the potential to undergo a bilateral procedure. The plots
show the cumulative incidence of revision (top panels) and death (bottom panels) for patients with staged bilateral (black line) and unilateral (red line) TJA.
The subgroup analysis finds a significant difference between the groups of patients (revision, p = 0.0004; death, p < 0.0001), while the landmark
analysis does not (revision, p = 0.84; death, p = 0.41).
TABLE IV Estimated Cumulative Incidences of Revision andDeath at 6 Years of Follow-up, Based on the DutchArthroplasty Registry Data*
Revision (95% CI) Death (95% CI)
Subgroup: 0-1.5 yr 2.4% (2.0%-2.9%) 6.4% (5.6%-7.2%)
Subgroup: 1.5-3 yr 3.4% (2.8%-4.3%) 4.2% (3.3%-5.2%)
Landmark: 0-1.5 yr 1.2% (0.8%-1.6%) 4.3% (3.6%-5.0%)
Landmark: 1.5-3 yr 1.2% (0.8%-2.0%) 3.5% (2.7%-4.6%)
*CI = confidence interval.
e82(5)
THE JOURNAL OF BONE & JOINT SURGERY d J B J S .ORG
VOLUME 99-A d NUMBER 15 d AUGUST 2, 2017PATIENTS WITH STAGED BILATERAL TOTAL JOINT ARTHROPLASTY IN
REGISTRIES

with staged bilateral TJA, the cumulative incidence of revisionis overestimated, and the cumulative incidence of death isunderestimated.
Simulation StudyThe percentages of false positives resulting from all analyses areshown in Figure 4. Figure 5 illustrates the results and is repre-sentative of all simulated data sets.
Dutch Arthroplasty Registry DataThe subgroup analysis finds a significant difference between thegroups of patients (revision, p = 0.001; death, p < 0.0001); thelandmark analysis does not (revision, p = 0.89; death, p = 0.50).The cumulative incidences at 6 years of follow-up are shownin Table IV, and the results are illustrated in Figure 6.
DiscussionGeneralWhen the outcome of interest is revision of a joint prosthesis,the statistical analysis is complicated by 2 issues: the presence ofpatients with staged bilateral TJA and the competing risk ofdeath. Immortal time bias lies at their intersection. In general,immortal time bias can occur when “responder” and “nonre-sponder” groups are studied, but a responder needs to survivelong enough to be able to respond. With arthroplasty data,when the outcome of interest is revision, the bias is subtle.Revision of the first hip does not prevent a patient from join-
ing the staged bilateral group, and thus there is no obviousimmortal time bias. However, there is the competing risk ofdeath. The resulting bias is explained via the artificial dataexample.
Artificial Data Example and Simulation StudyThe artificial data example shows the basic mechanism behindimmortal time bias. As illustrated in Figure 2, when the uni-lateral and staged bilateral subgroups are created at the end offollow-up, patients who would have undergone a procedureon the contralateral side at the 2-year mark but died beforerealizing that potential are observed to be unilateral. Thisleads to an estimate of a zero probability of death for patientswith staged bilateral TJA, while the cumulative incidence ofdeath is overestimated for patients with a unilateral TJA. Thereverse happens for revision: the cumulative incidence of re-vision is overestimated for patients with staged bilateral TJAbecause their deaths are not observed, while it is underesti-mated for patients with unilateral TJA because the risk setis made artificially large with the inclusion of patients whowould have required a staged bilateral procedure if they hadnot died before the second surgery could take place.
The main advantage of a simulation study is that we candecide on an underlying truth, and then study the effects of thesubgroup and landmark approaches. The simulation studyshows that a subgroup analysis can be misleading, leading tomore false detections of a difference than a landmark analysis.
Fig. 6
The cumulative incidence of revision and death for patients with staged bilateral TJA. The data are from the Dutch Arthroplasty Registry (14,067
patients were included in the subgroup analysis; 8,898 patients were included in the landmark analysis). The cumulative incidence of revision of
the first implant (top panels) and death (bottompanels) for patientswho had bilateral TJAwithin 1.5 years (red line) and between1.5 and3 years (black line)
is shown. The panels on the left and on the right show the results from a subgroup analysis and from the landmark analysis with a 3-year landmark
time, respectively.
e82(6)
THE JOURNAL OF BONE & JOINT SURGERY d J B J S .ORG
VOLUME 99-A d NUMBER 15 d AUGUST 2, 2017PATIENTS WITH STAGED BILATERAL TOTAL JOINT ARTHROPLASTY IN
REGISTRIES

The estimate of the cumulative incidence of death is moreaffected than the estimate of the cumulative incidence of revi-sion. Immortal time bias increases as the percentage of patientswith bilateral TJA increases, as is to be expected.
The severity of the effect of immortal time bias depends onthe revision, on the mortality and bilaterality rates, and also onthe research question. With 5% revision, 5% mortality, and 20%bilaterality, the bias in the artificial data example is inconsequen-tial for the cumulative incidence of revision, but still relativelylarge for death. Moreover, significant differences in implant sur-vival between 2 groups can be very small, even <1%, when thefollow-up is short. In such a case, even a small bias may be largeenough to give the false impression of a difference betweensubgroups when there actually is none. In addition, the Swed-ish Hip Arthroplasty Register reports 23-year revision rates ofup to 38.5% for men who are 50 to 59 years old at the indexsurgery5. After such a long follow-up, immortal time bias maysignificantly affect analyses; thus, clinical results withoutproper statistical analysis should be interpreted with caution.
Dutch Arthroplasty Register DataThe analysis of the total hip arthroplasty data from the DutchArthroplasty Registry shows the potential effects on outcomeestimates of performing a subgroup analysis. The detection of adifference in mortality and implant survival between patientswho require a staged bilateral procedure within 1.5 years orafter 1.5 to 3 years may be caused by immortal time bias. Thepatients whose second implant is placed after 1.5 years need tosurvive longer to be able to be included in the analysis thanpatients whose second implant is placed within 1.5 years. Thelower left panel of Figure 6 should alert the researcher to thepotential bias in the subgroup analysis since no deaths are ob-served within the first 2 years in patients who have the secondprocedure 1.5 to 3 years later.
The landmark analysis finds no difference in the cumu-lative incidences of death and revision for both groups of pa-tients with staged bilateral TJA. The result should be carefullyinterpreted, however, because the research question is a con-ditional one: the analysis estimates the cumulative incidencefor those patients who survive for at least 3 years and do notundergo revision within that time. Figure 6 shows that thecumulative incidence of revision resulting from the landmarkanalysis is much lower than that in the subgroup analysis be-cause revisions before the landmark time are not included.Thus, we cannot tell whether there truly is no difference be-tween the 2 subgroups or whether there is a difference thatdisappears before the 3-year landmark time.
Limitations of Landmark Analysis and Alternative MethodsThe main advantages of landmark analysis are that it avoidsimmortal time bias and it is simple to implement. On theother hand, the main disadvantage is that the conclusionsonly hold for those patients who are still alive and have notundergone revision up until the landmark time point. How-ever, this does not need to be a disadvantage since the result-ing answer will be of interest to a patient who has survived for
some time without a revision since the index TJA. Excluding thefirst few postoperative months or even years from analysis maynot be satisfactory in a situation where mortality or revision riskare high immediately following surgery. Therefore, we reviewsome alternative suggestions, and we distinguish between 2 typesof research questions: questions related to all patients within thecohort and questions in which patients with bilateral TJA, inparticular, are studied.
We first consider methods for research questions pertain-ing to all patients. Two reviews of arthroplasty studies found thatit is commonly believed that the patients who have undergonebilateral TJA do not greatly affect the results of the analyses;thus, the dependence of their observations is often ignored10,11.Recommendations from these reviews are to (1) use statisticalmethods that model the correlation within patients, (2) excludethe second limb, (3) randomly choose 1 limb per patient with abilateral procedure, or (4) analyze patients with a bilateralprocedure as a subgroup. Options 1 and 4 do not accountfor the time between the 2 surgeries and are only suitable forpatients with a 1-stage bilateral procedure, and option 3 mayintroduce bias through the dependence on the particularsample. Option 2, only using the first TJA per patient, seemsmost appropriate, as this removes all dependence issues andensures that all patients are on the same time scale. A draw-back is that not all data are used, but this is not necessarilyproblematic in registry studies where the number of obser-vations can be in the hundreds of thousands.
There is a fifth option, which is to include every obser-vation, perform the analysis as if all joints are independent, andthen perform some sensitivity analysis. This is the recommen-dation of Ranstam et al.10; indeed, when the question is aboutall patients with TJA, when revision and mortality are low andsample sizes are large, incorrectly assuming independence maynot be of any consequence. For example, the mortality rate forpatients <50 years old is very low (Fig. 1), in which case immor-tal time bias is likely negligible.
However, when the research question is concerned withpatients with bilateral TJA, caution is warranted. The main poten-tial pitfalls lie in the time dependence of a patient’s bilateral status.Extra care needs to be taken when the proportion of patients withbilateral TJA is high and when patients with unilateral TJA requirea staged procedure on the contralateral side at a relatively long timeafter the first TJA surgery. If landmark analysis is not suitable foranswering the research question, an appropriate method for mod-eling the path that a patient may take from unilateral to bilateralTJA or via revision and/or death is a multistate model17,18. Multi-statemodels that have been applied to theAustralianNational JointReplacement Registry are able to incorporate the complicated de-pendence structures that are often present in arthroplasty data23,24.
Analyses of arthroplasty data in which patients withstaged bilateral TJA are excluded show overestimates of surgi-cal risks because of a difference in these risks between patientswith unilateral TJA and those with staged bilateral TJA25. Thispaper shows that immortal time bias can be added to the list ofarguments against this practice. In any analysis of arthroplastyregistry data, researchers should carefully consider the impact
e82(7)
THE JOURNAL OF BONE & JOINT SURGERY d J B J S .ORG
VOLUME 99-A d NUMBER 15 d AUGUST 2, 2017PATIENTS WITH STAGED BILATERAL TOTAL JOINT ARTHROPLASTY IN
REGISTRIES

of immortal time bias on their results and select the statisticalmethod accordingly. nNOTE: The authors thank the patients and the staff of all of the hospitals that have contributed datato the Dutch Arthroplasty Register. We also thank the Dutch Arthroplasty Register for facilitatingthis research by making the data available for this study.
Stephanie L. van der Pas, PhD1,2
Rob G.H.H. Nelissen, MD, PhD3
Marta Fiocco, PhD1,2
1Mathematical Institute of Leiden University, Leiden, the Netherlands
2Department of Medical Statistics, Leiden University Medical Center,Leiden, the Netherlands
3Department of Orthopaedic Surgery, Leiden University Medical Center,Leiden, the Netherlands
E-mail address for S.L. van der Pas: [email protected]
ORCID iD for S.L. van der Pas: 0000-0002-2448-5378
References
1. Pabinger C, Geissler A. Utilization rates of hip arthroplasty in OECD countries.Osteoarthritis Cartilage. 2014 Jun;22(6):734-41. Epub 2014 Apr 26.2. Pabinger C, Lothaller H, Geissler A. Utilization rates of knee-arthroplasty inOECD countries. Osteoarthritis Cartilage. 2015 Oct;23(10):1664-73. Epub 2015May 29.3. Graves SE. The value of arthroplasty registry data. Acta Orthop. 2010 Feb;81(1):8-9.4. LROI. Arthroplasty in the picture. 2014. http://www.lroi.nl/base/downloads/lroi-report-2014-english.pdf.5. The Swedish Hip Arthroplasty Register. Annual report 2014. http://registercentrum.blob.core.windows.net/shpr/r/Annual-report-2014-BJv-q8pil.pdf.6. Lie SA, Engesaeter LB, Havelin LI, Gjessing HK, Vollset SE. Dependency issues insurvival analyses of 55,782 primary hip replacements from 47,355 patients. StatMed. 2004 Oct 30;23(20):3227-40.7. Levesque LE, Hanley JA, Kezouh A, Suissa S. Problem of immortal time bias incohort studies: example using statins for preventing progression of diabetes. BMJ.2010 Mar 12;340:b5087.8. Suissa S. Immortal time bias in observational studies of drug effects. Pharma-coepidemiol Drug Saf. 2007 Mar;16(3):241-9.9. Gail MH. Does cardiac transplantation prolong life? A reassessment. Ann InternMed. 1972 May;76(5):815-7.10. Ranstam J, Karrholm J, Pulkkinen P, Makela K, Espehaug B, Pedersen AB,Mehnert F, Furnes O; NARA Study Group. Statistical analysis of arthroplasty data. II.Guidelines. Acta Orthop. 2011 Jun;82(3):258-67.11. Bryant D, Havey TC, Roberts R, Guyatt G. Howmany patients? Howmany limbs?Analysis of patients or limbs in the orthopaedic literature: a systematic review.J Bone Joint Surg Am. 2006 Jan;88(1):41-5.12. Visuri T, Turula KB, Pulkkinen P, Nevalainen J. Survivorship of hip prosthesis inprimary arthrosis: influence of bilaterality and interoperative time in 45,000 hipprostheses from the Finnish endoprosthesis register. Acta Orthop Scand. 2002Jun;73(3):287-90.13. Buchholz HW, Heinert K, Wargenau M. Follow-up of hip endoprostheses fol-lowing completion of true stress conditions over a 10-year period. Z Orthop IhreGrenzgeb. 1985 Sep-Oct;123(5):815-20.
14. Gillam MH, Ryan P, Graves SE, Miller LN, de Steiger RN, Salter A. Competingrisks survival analysis applied to data from the Australian Orthopaedic AssociationNational Joint Replacement Registry. Acta Orthop. 2010 Oct;81(5):548-55.15. Keurentjes JC, Fiocco M, Schreurs BW, Pijls BG, Nouta KA, Nelissen RGHH.Revision surgery is overestimated in hip replacement. Bone Joint Res. 2012 Oct 1;1(10):258-62.16. Lacny S, Wilson T, Clement F, Roberts DJ, Faris PD, Ghali WA, Marshall DA.Kaplan-Meier survival analysis overestimates the risk of revision arthroplasty:a meta-analysis. Clin Orthop Relat Res. 2015 Nov;473(11):3431-42.17. Putter H, Fiocco M, Geskus RB. Tutorial in biostatistics: competing risks andmulti-state models. Stat Med. 2007 May 20;26(11):2389-430.18. Cortese G, Andersen PK. Competing risks and time-dependent covariates. BiomJ. 2010 Feb;52(1):138-58.19. van Houwelingen HC. Dynamic prediction by landmarking in event history anal-ysis. Scand J Stat. 2007;34:70-5.20. Gray RJ. A class of K-sample tests for comparing the cumulative incidence ofa competing risk. Ann Stat. 1988;16(3):1141-54.21. Mollenhoff G, Walz M, Muhr G, Rehn J. Bilateral hip joint endoprosthesis: thetime interval as a prognostic parameter? Unfallchirurg. 1994 Aug;97(8):430-4.22. van Steenbergen LN, Denissen GA, Spooren A, van Rooden SM, van OosterhoutFJ, Morrenhof JW, Nelissen RG; Steenbergen van LN. More than 95% completenessof reported procedures in the population-based Dutch Arthroplasty Register. ActaOrthop. 2015;86(4):498-505. Epub 2015 Mar 11.23. Gillam MH, Ryan P, Salter A, Graves SE. Multi-state models and arthroplastyhistories after unilateral total hip arthroplasties: introducing the Summary Notationfor Arthroplasty Histories. Acta Orthop. 2012 Jun;83(3):220-6. Epub 2012 May 4.24. Gillam MH, Lie SA, Salter A, Furnes O, Graves SE, Havelin LI, Ryan P. Theprogression of end-stage osteoarthritis: analysis of data from the Australian andNorwegian joint replacement registries using a multi-state model. OsteoarthritisCartilage. 2013 Mar;21(3):405-12. Epub 2012 Dec 26.25. Ravi B, Croxford R, Hawker G. Exclusion of patients with sequential primarytotal joint arthroplasties from arthroplasty outcome studies biases outcomeestimates: a retrospective cohort study. Osteoarthritis Cartilage. 2013 Dec;21(12):1841-8. Epub 2013 Sep 4.
e82(8)
THE JOURNAL OF BONE & JOINT SURGERY d J B J S .ORG
VOLUME 99-A d NUMBER 15 d AUGUST 2, 2017PATIENTS WITH STAGED BILATERAL TOTAL JOINT ARTHROPLASTY IN
REGISTRIES


![WELCOME [arthroplasty-conference.org]arthroplasty-conference.org/pdf/(IAC-2020)ARTHROPLASTY-PROGRA… · KEYNOTE LECTURERS: Wael Barsoum President of Cleveland Clinic, Florida, USA](https://img.pdfslide.net/doc/110x75/5edc4a09ad6a402d6666e51c/welcome-arthroplasty-arthroplasty-iac-2020arthroplasty-progra-keynote-lecturers.jpg)