Embed Size (px)
Citation preview

7/30/2019 patrec
http://slidepdf.com/reader/full/patrec 1/13
Pattern Recognition 36 (2003) 279–291
www.elsevier.com/locate/patcog
The importance of being random: statistical principlesof iris recognition
John Daugman∗
The Computer Laboratory, University of Cambridge, Cambridge CB3 0FD, UK
Received 21 December 2001
Abstract
The statistical variability that is the basis of iris recognition is analysed in this paper using new large databases. The principle
underlying the recognition algorithm is the failure of a test of statistical independence on iris phase structure encoded by
multi-scale quadrature wavelets. Combinatorial complexity of this phase information across dierent persons spans about 249
degrees-of-freedom and generates a discrimination entropy of about 3:2 bits= mm2 over the iris, enabling real-time identiÿcation
decisions with great enough accuracy to support exhaustive searches through very large databases. This paper presents the
results of 9.1 million comparisons among several thousand eye images acquired in trials in Britain, the USA, Japan and Korea.
? 2002 Pattern Recognition Society. Published by Elsevier Science Ltd. All rights reserved.
Keywords: Statistical variability; Epigenesis; Wavelets; Texture; Iris recognition; Decision theory
1. Introduction
Randomness plays a crucial role in many sciences, and
increasingly also for technologies. In biology, random vari-
ation by mutation is the engine of evolution; in physics,
random state variables are key to quantum mechanics and
to thermodynamics; and in the information sciences, ran-
dom sequences are central to theories of cryptography, data
compressibility, and algorithmic complexity. Many methods
exist for measuring and describing the randomness of vari-
ables or patterns. Perhaps the most interesting of these arethe proposals by the Russian mathematician Kolmogorov
[1] that the complexity of a random sequence is equal to the
length of the shortest program that can generate it, and that
a pattern is deÿned to be algorithmically random if it is its
own shortest possible description.
Biometric identiÿcation systems all rely upon forms
of random variation among persons. The more com-
plex the randomness the better, because more dimensions
∗ Tel.: +44-1223-334501; fax: +44-1223-334678.
E-mail address: [email protected] (J. Daugman).
of independent variation produce signatures having
greater uniqueness. But while seeking to maximize the
between-person variability, biometric templates must also
have minimal within-person variability across time and
changing conditions of capture. In the case of face recogni-
tion, for example, diculties arise from the fact that faces
are changeable social organs displaying a variety of expres-
sions, as well as being active 3D objects whose projected
images vary with pose and viewing angle, illumination,
accoutrements, and age. Against this within-person (same
face) variability, between-person variability is limited be-cause dierent faces possess the same canonical set of fea-
tures, always in basically the same canonical geometry. As
is easily illustrated, see Refs. [2,3], the variability among
frontal images of any given face even just from illumination
alone can be much larger than the variability among images
of dierent faces captured with ÿxed expression; and it has
been noted that for images taken at least 1 yr apart, even
the best face recognition algorithms have error rates from
43% [4] to 50% [5].
For all of these reasons, iris patterns become interesting
as an alternative approach to reliable visual recognition of
persons, when imaging can be done at distances of about a
0031-3203/02/$22.00 ? 2002 Pattern Recognition Society. Published by Elsevier Science Ltd. All rights reserved.
PII: S 0 0 3 1 - 3 2 0 3 ( 0 2 ) 0 0 0 3 0 - 4

7/30/2019 patrec
http://slidepdf.com/reader/full/patrec 2/13
280 J. Daugman / Pattern Recognition 36 (2003) 279– 291
Fig. 1. Examples of iris patterns, imaged monochromatically with
NIR illumination in the 700 –900 nm band at distances of about35 cm. The outline overlays show results of the iris and pupil
localization and eyelid detection steps. The bit streams are the
results of demodulation with complex-valued 2D Gabor wavelets
to encode iris patterns as a sequence of phasor quadrants.
meter or less, and especially when there is a need to search
very large databases. Although small (11 mm) and some-
times problematic to image, the iris has the great mathe-
matical advantage that its pattern variability among dierent
persons is enormous. In addition, as an internal (yet exter-nally visible) organ of the eye, the iris is well protected
from the environment, and stable over time. As a planar
object, its image is relatively insensitive to angle of illumi-
nation, and changes in viewing angle cause only reversible
ane transformations; even the non-ane pattern distortion
caused by pupillary dilation is readily reversible. Finally,
the ease of localizing eyes in faces, and the distinctive
annular shape of the iris, facilitate reliable and precise iso-
lation of this feature and the creation of a size-invariant
representation.
The iris begins to form in the third month of gestation [6]
and the structures creating its pattern are largely complete by
the eighth month, although pigment accretion can continue
into the ÿrst postnatal years. Its complex pattern can contain
many distinctive features such as arching ligaments, furrows,
ridges, crypts, rings, corona, freckles, and a zigzag collarette,
some of which may be seen in the two irises in Fig. 1. The
striated trabecular meshwork of elastic pectinate ligament
creates the predominant texture under visible light, whereasin the near-infrared (NIR) wavelengths used for unobtrusive
imaging at distances of up to 1 m, deeper and somewhat
more slowly modulated stromal features dominate the iris
pattern. In NIR wavelengths, even darkly pigmented irises
reveal rich and complex features.
Methods for encoding and recognizing iris patterns were
ÿrst described in 1993 by Daugman [7]. These algorithms,
released as executables, have been the basis of all iris recog-
nition systems so far deployed in public trials, including
those by British Telecom, US Sandia Labs, UK National
Physical Laboratory, The National Biometric Test Center
of SJSU, EyeTicket, Siemens, Unisys, LG, IriScan, Irid-ian, Sensar, and Sarno. All of these organizations have re-
ported a false match rate of zero in all of their tests, some of
which involved millions of dierent iris pairings. High vol-
ume deployments have now begun at international airports
Heathrow, Schiphol, Frankfurt, and Charlotte. This paper
describes how the algorithms work and explains improve-
ments over the author’s original 1993 methods; presents new
data on the statistical properties and singularity of iris pat-
terns based on 9.1 million comparisons; and discusses future
developments that are needed.
2. Localizing and isolating an iris
To capture the rich details of iris patterns, an imaging
system should resolve a minimum of 50 pixels in iris radius.
In the ÿeld trials to date, a resolved iris radius of 100–140
pixels has been more typical. Monochrome CCD cameras
(480 × 640) have been used because NIR illumination
in the 700–900 nm band was required for imaging to be
invisible to humans. Some imaging platforms deployed a
wide-angle camera for coarse localization of eyes in faces,
to steer the optics of a narrow-angle pan= tilt camera that
acquired higher resolution images of the eyes. But most
of the imaging was done without active pan= tilt cameraoptics, instead exploiting visual feedback via a mirror or
video image to enable cooperating Subjects to position their
own eyes within the ÿeld of view of a single narrow-angle
camera.
Focus assessment was performed in real-time (faster than
video frame rate) by measuring the total high-frequency
power in the 2D Fourier spectrum of each frame, and seek-
ing to maximize this quantity either by moving an active
lens or by providing audio feedback to Subjects to adjust
their range appropriately. Images passing a minimum focus
criterion were then analysed to ÿnd the iris, with precise lo-
calization of its boundaries using a coarse-to-ÿne strategy

7/30/2019 patrec
http://slidepdf.com/reader/full/patrec 3/13
J. Daugman / Pattern Recognition 36 (2003) 279– 291 281
terminating in single-pixel precision estimates of the cen-
tre coordinates and radius of both the iris and the pupil.
Although the results of the iris search greatly constrain the
pupil search, concentricity of these boundaries cannot be as-
sumed. Very often the pupil centre is nasal, and inferior, to
the iris centre. Its radius can range from 0.1 to 0.8 of the
iris radius. Thus, all three parameters deÿning the pupillarycircle must be estimated separately from those of the iris.
A very eective integrodierential operator for determining
these parameters is
max(r;x0 ;y0)
G (r ) ∗9
9r
r;x0 ;y0
I ( x; y)
2r d s
; (1)
where I ( x; y) is an image as in Fig. 1 containing an eye.
The operator searches over the image domain ( x; y) for the
maximum in the blurred partial derivative with respect to
increasing radius r of the normalized contour integral of
I ( x; y) along a circular arc d s of radius r and centre coordi-nates ( x0; y0). The symbol ∗ denotes convolution and G (r )
is a smoothing function such as a Gaussian of scale . The
complete operator behaves in eect as a circular edge detec-
tor, blurred at a scale set by , which searches iteratively for
a maximum contour integral derivative with increasing ra-
dius at successively ÿner scales of analysis through the three
parameter space of centre coordinates and radius ( x0; y0; r )
deÿning a path of contour integration.
The operator in Eq. (1) serves to ÿnd both the pupillary
boundary and the outer (limbus) boundary of the iris, al-
though the initial search for the limbus should incorporate
evidence of an interior pupil to improve its robustness since
the limbic boundary itself usually has extremely soft con-
trast when long-wavelength NIR illumination is used. Once
the coarse-to-ÿne iterative searches for both these bound-
aries have reached single pixel precision, then a similar ap-
proach to detecting curvilinear edges is used to localize both
the upper and lower eyelid boundaries. The path of contour
integration in Eq. (1) is changed from circular to arcuate,
with spline parameters ÿtted by standard statistical estima-
tion methods to describe optimally the available evidence
for each eyelid boundary. The result of all these localization
operations is the isolation of iris tissue from all other image
regions, as illustrated in Fig. 1 by the graphical overlays on
these two eyes.
3. Iris feature encoding by 2D wavelet demodulation
Each isolated iris pattern is then demodulated (see Ref.
[8]) to extract its phase information using quadrature 2D
Gabor wavelets (see Refs. [9–11]). This encoding process is
illustrated in Fig. 2. It amounts to a patch-wise phase quan-
tization of the iris pattern, by identifying in which quad-
rant of the complex plane each resultant phasor lies when a
given area of the iris is projected onto complex-valued 2D
Gabor wavelets:
h{ Re;Im} = sgn{ Re; Im}
I (; )e−i!(Â0−)
e−(r 0−)2=2
×e−(Â0−)2=ÿ2
d d; (2)
where h{ Re;Im} can be regarded as a complex-valued bit
whose real and imaginary parts are either 1 or 0 (sgn) de-
pending on the sign of the 2D integral; I (; ) is the raw
iris image in a dimensionless polar coordinate system that is
size- and translation-invariant, and which also corrects for
pupil dilation as explained in a later section; and ÿ are the
multi-scale 2D wavelet size parameters, spanning an 8-fold
range from 0.15 to 1:2 mm on the iris; ! is wavelet fre-
quency, spanning three octaves in inverse proportion to ÿ;
and (r 0; Â0) represent the polar coordinates of each region of
iris for which the phasor coordinates h{ Re;Im} are computed.
Such a phase quadrant coding sequence is illustrated for two irises by the bit streams pictured in Fig. 1. A desirable
feature of the phase code explained in Fig. 2 is that it is a
cyclic or Gray code: in rotating between any adjacent phase
quadrants, only a single bit changes, unlike a binary code
in which two bits may change, making some errors arbi-
trarily more costly than others. Altogether 2048 such phase
bits (256 bytes) are computed for each iris, but in a ma-
jor improvement over the earlier Daugman [7] algorithms,
now an equal number of masking bits are also computed to
signify whether any iris region is obscured by eyelids, con-
tains any eyelash occlusions, specular reections, boundary
artifacts of hard contact lenses, or poor signal-to-noise ratio
and thus should be ignored in the demodulation code asartifact.
Only phase information is used for recognizing irises be-
cause amplitude information is not very discriminating, and
it depends upon extraneous factors such as imaging con-
trast, illumination, and camera gain. The phase bit settings
which code the sequence of projection quadrants as shown
in Fig. 2 capture the information of wavelet zero-crossings,
as is clear from the sign operator in Eq. (2). The extraction
of phase has the further advantage that phase angles are
assigned regardless of how poor the image contrast may
be, as illustrated by the extremely out-of-focus image in
Fig. 3. Its phase bit stream has statistical properties suchas run lengths similar to those of the code for the properly
focused eye images in Fig. 1. (Fig. 3 also illustrates the
robustness of the iris- and pupil-ÿnding operators, and the
eyelid detection operators, despite poor focus.) The beneÿt
which arises from the fact that phase bits are set also for
a poorly focused image as shown here, even if based only
on random CCD noise, is that dierent poorly focused
irises never become confused with each other when their
phase codes are compared. By contrast, images of dier-
ent faces look increasingly alike when poorly resolved,
and may be confused with each other by face recognition
algorithms.

7/30/2019 patrec
http://slidepdf.com/reader/full/patrec 4/13
282 J. Daugman / Pattern Recognition 36 (2003) 279– 291
Phase-Quadrant Demodulation Code
[0, 0] [1, 0]
[1, 1][0, 1]
Re
Im
Fig. 2. The phase demodulation process used to encode iris patterns. Local regions of an iris are projected (Eq. (2)) onto quadrature 2D
Gabor wavelets, generating complex-valued projection coecients whose real and imaginary parts specify the coordinates of a phasor in
the complex plane. The angle of each phasor is quantized to one of the four quadrants, setting two bits of phase information. This process
is repeated all across the iris with many wavelet sizes, frequencies, and orientations, to extract 2048 bits.
Fig. 3. Illustration that even for poorly focused eye images, the
bits of a demodulation phase sequence are still set, primarily by
random CCD noise. This prevents poorly focused eye images from
resembling each other in the pattern matching stage, in the way that,
e.g., poorly resolved face images look alike and can be confused
with each other.
4. The test of statistical independence: combinatorics
of phase sequences
The key to iris recognition is the failure of a test
of statistical independence, which involves so many
degrees-of-freedom that this test is virtually guaranteed to
pass whenever the phase codes for two dierent eyes are
compared, but it uniquely fails when any eye’s phase code
is compared with another version of itself.
The test of statistical independence is implemented by thesimple Boolean exclusive-OR operator (XOR) applied to
the 2048 bit phase vectors that encode any two iris patterns,
masked (AND’ed) by both of their corresponding mask bit
vectors to prevent non-iris artifacts from inuencing iris
comparisons. The XOR operator ⊗ detects disagreement be-
tween any corresponding pair of bits, while the AND oper-
ator ∩ ensures that the compared bits are both deemed to
have been uncorrupted by eyelashes, eyelids, specular re-
ections, or other noise. The norms ( ) of the resultant bit
vector and of the AND’ed mask vectors are then measured
in order to compute a fractional Hamming distance (HD) as
a measure of the dissimilarity between any two irises, whose

7/30/2019 patrec
http://slidepdf.com/reader/full/patrec 5/13
J. Daugman / Pattern Recognition 36 (2003) 279– 291 283
0.0 0.1 0.2 0.3 0.4 0.5 0.6 0.7 0.8 0.9 1.0
1 0 0 , 0 0 0
3 0 0 , 0 0 0
5 0 0 , 0 0 0
Hamming Distance
C o u n t
Binomial Distribution of IrisCode Hamming Distances
9,060,003 different iris comparisons
Solid curve: binomial PDF,
N=249 degrees-of-freedom, p=0.5
mean = 0.499, stnd.dev. = 0.0317
min = 0.334, max = 0.664
Fig. 4. Distribution of Hamming distances obtained from all 9.1 million possible comparisons between dierent pairs of irises in the database.
The histogram forms a perfect binomial distribution with p = 0:5 and N = 249 degrees-of-freedom, as shown by the solid curve (Eq. (4)).
The data implies that it is extremely improbable for two dierent irises to disagree in less than about a third of their phase information.
two phase code bit vectors are denoted {codeA, codeB} and
whose mask bit vectors are denoted {maskA, maskB}:
HD =(codeA ⊗ codeB) ∩ maskA ∩ maskB
maskA ∩ maskB: (3)
The denominator tallies the total number of phase bits thatmattered in iris comparisons after artifacts such as eyelashes
and specular reections were discounted, so the resulting
HD is a fractional measure of dissimilarity; 0 would repre-
sent a perfect match. The Boolean operators ⊗ and ∩ are
applied in vector form to binary strings of length up to the
word length of the CPU, as a single machine instruction.
Thus, for example, on an ordinary 32-bit machine, any two
integers between 0 and 4 billion can be XOR’ed in a single
machine instruction to generate a third such integer, each
of whose bits in a binary expansion is the XOR of the cor-
responding pair of bits of the original two integers. This
implementation of Eq. (3) in parallel 32-bit chunks enablesextremely rapid comparisons of iris codes when searching
through a large database to ÿnd a match. On a 300 MHz
CPU, such exhaustive searches are performed at a rate of
about 100,000 irises= s.
Since any given bit in the phase code for an iris is equally
likely to be 1 or 0, and since dierent irises are uncorre-
lated, the expected proportion of agreeing bits between the
codes for two dierent irises is HD = 0:500. The histogram
in Fig. 4 shows the distribution of HDs obtained from 9.1
million comparisons between dierent pairings of iris im-
ages acquired by licensees of these algorithms in the UK,
the USA, Japan, and Korea. There were 4258 dierent iris
images, including 10 each of one subset of 70 eyes. Ex-
cluding those duplicates of (700 × 9) same-eye compar-
isons, and not double-counting pairs, and not comparing any
image with itself, the total number of unique pairings be-
tween dierent eye images whose HDs could be computed
was ((4258 × 4257 − 700 × 9)= 2) = 9; 060; 003. Their ob-served mean HD was p = 0:499 with the standard devia-
tion = 0:0317; their full distribution in Fig. 4 corresponds
to a fractional binomial having N = p(1 − p)=2 = 249
degrees-of-freedom, as shown by the solid curve. The ex-
tremely close ÿt of the theoretical fractional binomial to the
observed distribution is a consequence of the fact that each
comparison between two phase code bits from two dierent
irises is essentially a Bernoulli trial, albeit with correlations
between successive “coin tosses”.
In the phase code for any given iris, only small subsets
of bits are mutually independent due to the internal correla-
tions, especially radial, within an iris. (If all N =2048 phase bits were independent, then the distribution in Fig. 4 would
be very much sharper, with an expected standard deviation
of only p(1 − p)=N = 0:011 and so the HD interval be-
tween 0.49 and 0.51 would contain most of the distribution.)
Bernoulli trials that are correlated (see Ref. [12]) remain
binomially distributed but with a reduction in N , the eec-
tive number of tosses, and hence an increase in the of the
normalized HD distribution. The form and width of the HD
distribution in Fig. 4 tell us that the amount of dierence
between the phase codes for dierent irises is distributed
equivalently to runs of 249 tosses of a fair coin (Bernoulli
trials with p = 0:5; N = 249). Expressing this variation as
7/30/2019 patrec
http://slidepdf.com/reader/full/patrec 6/13
284 J. Daugman / Pattern Recognition 36 (2003) 279– 291
Binomial Cumulative
O b s e r v e d C u m u l a
t i v e
100 1,000 10,000 100,000
1 0 0
1 , 0 0 0
1 0 , 0 0 0
1 0 0 , 0 0 0
binomial:
249 degrees-of-freedom, p = 0.5
Quantile-Quantile: Observed Distances
vs Binomial Prediction
9.1 million Iris Codecomparisons
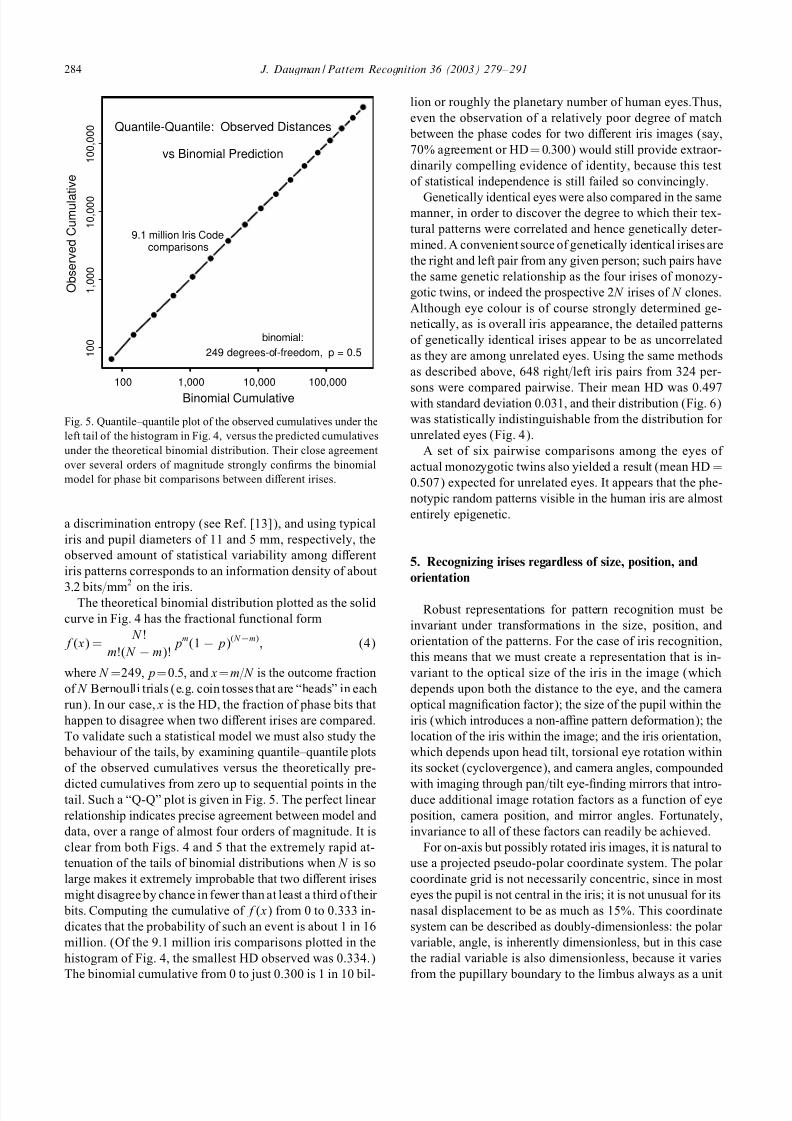
Fig. 5. Quantile–quantile plot of the observed cumulatives under the
left tail of the histogram in Fig. 4, versus the predicted cumulatives
under the theoretical binomial distribution. Their close agreement
over several orders of magnitude strongly conÿrms the binomial
model for phase bit comparisons between dierent irises.
a discrimination entropy (see Ref. [13]), and using typical
iris and pupil diameters of 11 and 5 mm, respectively, the
observed amount of statistical variability among dierent
iris patterns corresponds to an information density of about
3:2 bits= mm2
on the iris.The theoretical binomial distribution plotted as the solid
curve in Fig. 4 has the fractional functional form
f( x) =N !
m!( N − m)!pm
(1 − p)( N −m)
; (4)
where N =249; p=0:5; and x=m=N is the outcome fraction
of N Bernoulli trials (e.g. coin tosses that are “heads” in each
run). In our case, x is the HD, the fraction of phase bits that
happen to disagree when two dierent irises are compared.
To validate such a statistical model we must also study the
behaviour of the tails, by examining quantile–quantile plots
of the observed cumulatives versus the theoretically pre-
dicted cumulatives from zero up to sequential points in thetail. Such a “Q-Q” plot is given in Fig. 5. The perfect linear
relationship indicates precise agreement between model and
data, over a range of almost four orders of magnitude. It is
clear from both Figs. 4 and 5 that the extremely rapid at-
tenuation of the tails of binomial distributions when N is so
large makes it extremely improbable that two dierent irises
might disagree by chance in fewer than at least a third of their
bits. Computing the cumulative of f( x) from 0 to 0.333 in-
dicates that the probability of such an event is about 1 in 16
million. (Of the 9.1 million iris comparisons plotted in the
histogram of Fig. 4, the smallest HD observed was 0.334.)
The binomial cumulative from 0 to just 0.300 is 1 in 10 bil-
lion or roughly the planetary number of human eyes.Thus,
even the observation of a relatively poor degree of match
between the phase codes for two dierent iris images (say,
70% agreement or HD = 0:300) would still provide extraor-
dinarily compelling evidence of identity, because this test
of statistical independence is still failed so convincingly.
Genetically identical eyes were also compared in the samemanner, in order to discover the degree to which their tex-
tural patterns were correlated and hence genetically deter-
mined. A convenient source of genetically identical irises are
the right and left pair from any given person; such pairs have
the same genetic relationship as the four irises of monozy-
gotic twins, or indeed the prospective 2 N irises of N clones.
Although eye colour is of course strongly determined ge-
netically, as is overall iris appearance, the detailed patterns
of genetically identical irises appear to be as uncorrelated
as they are among unrelated eyes. Using the same methods
as described above, 648 right= left iris pairs from 324 per-
sons were compared pairwise. Their mean HD was 0.497with standard deviation 0.031, and their distribution (Fig. 6)
was statistically indistinguishable from the distribution for
unrelated eyes (Fig. 4).
A set of six pairwise comparisons among the eyes of
actual monozygotic twins also yielded a result (mean HD =
0:507) expected for unrelated eyes. It appears that the phe-
notypic random patterns visible in the human iris are almost
entirely epigenetic.
5. Recognizing irises regardless of size, position, and
orientation
Robust representations for pattern recognition must be
invariant under transformations in the size, position, and
orientation of the patterns. For the case of iris recognition,
this means that we must create a representation that is in-
variant to the optical size of the iris in the image (which
depends upon both the distance to the eye, and the camera
optical magniÿcation factor); the size of the pupil within the
iris (which introduces a non-ane pattern deformation); the
location of the iris within the image; and the iris orientation,
which depends upon head tilt, torsional eye rotation within
its socket (cyclovergence), and camera angles, compounded
with imaging through pan= tilt eye-ÿnding mirrors that intro-duce additional image rotation factors as a function of eye
position, camera position, and mirror angles. Fortunately,
invariance to all of these factors can readily be achieved.
For on-axis but possibly rotated iris images, it is natural to
use a projected pseudo-polar coordinate system. The polar
coordinate grid is not necessarily concentric, since in most
eyes the pupil is not central in the iris; it is not unusual for its
nasal displacement to be as much as 15%. This coordinate
system can be described as doubly-dimensionless: the polar
variable, angle, is inherently dimensionless, but in this case
the radial variable is also dimensionless, because it varies
from the pupillary boundary to the limbus always as a unit

7/30/2019 patrec
http://slidepdf.com/reader/full/patrec 7/13
J. Daugman / Pattern Recognition 36 (2003) 279– 291 285
0.0 0.1 0.2 0.3 0.4 0.5 0.6 0.7 0.8 0.9 1.0
0
1 0
2 0
3 0
4 0
5 0
6 0
7 0
8 0
Hamming Distance
C o u n t
Genetically Identical Eyes Have Uncorrelated IrisCodes
Right Eye / Left Eye Comparisons
for Individual Persons
mean = 0.497, stnd.dev. = 0.0311
648 eyes in 324 Right/Left pairs
Fig. 6. Distribution of Hamming distances between genetically identical irises in 648 paired eyes from 324 persons. The data are statistically
indistinguishable from that shown in Fig. 4 comparing unrelated irises. Unlike eye colour, the phase structure of iris patterns therefore
appears to be epigenetic, arising from random events and circumstances in the morphogenesis of this tissue.
interval [0; 1]. The dilation and constriction of the elastic
meshwork of the iris when the pupil changes size is intrinsi-
cally modelled by this coordinate system as the stretching of
a homogeneous rubber sheet, having the topology of an an-
nulus anchored along its outer perimeter, with tension con-trolled by an (o-centred) interior ring of variable radius.
The homogeneous rubber sheet model assigns to each
point on the iris, regardless of its size and pupillary dilation,
a pair of real coordinates (r; Â) where r lies on the unit
interval [0; 1] and  is angle [0; 2]. The remapping of the
iris image I ( x; y) from raw cartesian coordinates ( x; y) to
the dimensionless non-concentric polar coordinate system
(r; Â) can be represented as
I ( x(r; Â); y(r; Â)) → I (r; Â); (5)
where x(r; Â) and y(r; Â) are deÿned as linear combinations
of both the set of pupillary boundary points ( xp(Â); yp(Â))
and the set of limbus boundary points along the outer peri-
meter of the iris ( x s(Â); y s(Â)) bordering the sclera, both
of which were detected by ÿnding the maximum of the
operator (1).
x(r; Â) = (1 − r ) xp(Â) + rx s(Â); (6)
y(r; Â) = (1 − r )yp(Â) + ry s(Â): (7)
Since the radial coordinate ranges from the iris inner bound-
ary to its outer boundary as a unit interval, it inherently cor-
rects for the elastic pattern deformation in the iris when the
pupil changes in size.
The localization of the iris and the coordinate system de-
scribed above achieve invariance to the 2D position and
size of the iris, and to the dilation of the pupil within the
iris. However, it would not be invariant to the orientation
of the iris within the image plane. The most ecient wayto achieve iris recognition with orientation invariance is not
to rotate the image itself using the Euler matrix, but rather
to compute the iris phase code in a single canonical orien-
tation and then to compare this very compact representation
at many discrete orientations by cyclic scrolling of its angu-
lar variable. The statistical consequences of seeking the best
match after numerous relative rotations of two iris codes are
straightforward. Let f0( x) be the raw density distribution
obtained for the HDs between dierent irises after compar-
ing them only in a single relative orientation; for example,
f0( x) might be the binomial deÿned in Eq. (4). Then F 0( x),
the cumulative of f0( x) from 0 to x, becomes the probabil-
ity of getting a false match in such a test when using HDacceptance criterion x:
F 0( x) =
x0
f0( x) d x (8)
or, equivalently,
f0( x) =d
d x F 0( x): (9)
Clearly, then, the probability of not making a false match
when using criterion x is 1− F 0( x) after a single test, and it is
[1− F 0( x)]n after carrying out n such tests independently at n
dierent relative orientations. It follows that the probability
of a false match after a “best of n” test of agreement, when

7/30/2019 patrec
http://slidepdf.com/reader/full/patrec 8/13
286 J. Daugman / Pattern Recognition 36 (2003) 279– 291
0.0 0.1 0.2 0.3 0.4 0.5 0.6 0.7 0.8 0.9 1.0
1 0 0 , 0 0 0
5 0 0 , 0 0 0
9 0 0 , 0 0 0
Hamming Distance
C o u n t
Iris Code Comparisons after Rotations: Best Matches
9,060,003 different iris comparisons
Solid curve: binomial min value PDF,
249 degrees-of-freedom, 7 samples, p=0.5
mean = 0.458, stnd.dev. = 0.0196
min = 0.329, max = 0.546
Fig. 7. Distribution of Hamming distances from the same set of 9.1 million comparisons as seen in Fig. 4, but allowing for seven relative
rotations and preserving only the best match found for each pair. This “best of n” test of agreement skews the distribution to the left and
reduces its mean from about 0.5 to 0.458. The solid curve is the theoretical prediction for such “extreme-value” sampling, as described by
Eqs. (4) and (8)–(11).
using HD criterion x, regardless of the actual form of the
raw unrotated distribution f0( x), is
F n( x) = 1 − [1 − F 0( x)]n
(10)
and the expected density fn( x) associated with this cumu-
lative is
fn( x) =d
d x F n( x)
= nf0( x)[1 − F 0( x)]n−1
: (11)
Each of the 9.1 million pairings of dierent iris images
whose raw HD distribution was shown in Fig. 4, was sub-
mitted to further comparisons in each of the seven relative
orientations. This generated 63 million HD outcomes, but in
each group of seven associated with any one pair of irises,
only the best match (smallest HD) was retained. The his-togram of these new 9.1 million best HDs is shown in Fig. 7.
Since only the smallest value in each group of seven samples
was retained, the new distribution is skewed and biased to a
lower mean value (HD = 0:458) as expected from the the-
ory of extreme value sampling. The solid curve in Fig. 7 is a
plot of Eq. (11), incorporating Eqs. (4) and (8) as its terms,
and it shows an excellent ÿt between theory (binomial ex-
treme value sampling) and data. The fact that the minimum
HD observed among these millions of rotated comparisons
was about 0.33 illustrates the extreme improbability that the
phase sequences for two dierent irises might disagree in
fewer than a third of their bits. This suggests that in order to
identify people by their iris patterns with high conÿdence,
we need to demand only a very forgiving degree of match
(say, HD6 0:32).
6. Uniqueness of failing the test of statistical
independence
The statistical data and theory presented above show that
we can perform iris recognition successfully just by a test
of statistical independence. Any two dierent irises are sta-
tistically “guaranteed” to pass this test of independence, and
any two images that fail this test (i.e. produce HD6 0:32)
must be images of the same iris. Thus, it is the unique
failure of the test of independence that is the basis for iris
recognition.
It is informative to calculate the signiÿcance of any ob-served HD matching score, in terms of the likelihood that
it could have arisen by chance from two dierent irises.
These probabilities give a conÿdence level associated with
any recognition decision. Fig. 8 shows the false match prob-
abilities marked o in cumulatives along the tail of the dis-
tribution presented in Fig. 7 (same theoretical curve (11)
as plotted in Fig. 7 and with the justiÿcation presented in
Figs. 4 and 5). Table 1 enumerates the cumulatives of Eq.
(11) (false match probabilities) as a more ÿne-grained func-
tion of HD decision criterion in the range between 0.26 and
0.40. Calculation of the large factorial terms in Eq. (4) was
done with Stirling’s approximation which errs by ¡ 1%

7/30/2019 patrec
http://slidepdf.com/reader/full/patrec 9/13
J. Daugman / Pattern Recognition 36 (2003) 279– 291 287
Hamming Distance
D e n s i t y
0.0 0.1 0.2 0.3 0.4 0.5 0.6 0.7 0.8 0.9 1.0
0
2
4
6
8
1 0
1 2
1 4
1 6
1 8
2 0
10 10 10 10-5-14-30-54
||||
False Match Probabilities: Cumulatives under PDF
Solid Curve: binomial min value PDF,
249 degrees-of-freedom, 7 samples, p=0.5
Cumulatives:
Fig. 8. Calculated cumulatives under the left tail of the distribution seen in Fig. 7, up to sequential points, using the same theoretical PDF
described by Eqs. (4) and (8)–(11). The extremely rapid attenuation of these cumulatives reects the binomial combinatorics with large
N in Eq. (4). This accounts for the astronomic conÿdence levels against a false match when persons are recognized by failing this test of
statistical independence.
Table 1
Cumulatives under Eq. (11) giving false match probabilities for
various HD criteria
HD criterion Odds of false match
0.26 1 in 1013
0.27 1 in 1012
0.28 1 in 1011
0.29 1 in 13 billion
0.30 1 in 1.5 billion
0.31 1 in 185 million
0.32 1 in 26 million
0.33 1 in 4 million
0.34 1 in 690,000
0.35 1 in 133,000
0.36 1 in 28,000
0.37 1 in 6750
0.38 1 in 1780
0.39 1 in 5200.40 1 in 170
for n¿ 9:
n! ≈ exp(n ln(n) − n + 12
ln(2n)): (12)
The practical importance of the astronomic odds against
a false match when the match quality is better than about
HD6 0:32, as shown in Fig. 8 and in Table 1, is that
such high conÿdence levels allow very large databases to
be searched exhaustively without succumbing to any of the
many opportunities for suering a false match. The require-
ments of operating in one-to-many “identiÿcation” mode are
vastly more demanding than operating merely in one-to-one
“veriÿcation” mode (in which an identity must ÿrst be ex-
plicitly asserted, which is then veriÿed in a yes= no decision
by comparison against just the single nominated template).
If P 1 is the false match probability for single one-to-oneveriÿcation trials, then clearly P N , the probability of making
at least one false match when searching a database of N
unrelated patterns, is
P N = 1 − (1 − P 1) N
(13)
because (1 − P 1) is the probability of not making a false
match in single comparisons; this must happen N indepen-
dent times; and so (1 − P 1) N is the probability that such a
false match never occurs.
It is interesting to consider how a seemingly impressive
one-to-one “veriÿer” would perform in exhaustive search
mode once databases become larger than about 100, inview of Eq. (13). For example, a face recognition algorithm
that truly achieved 99.9% correct rejection when tested on
non-identical faces, hence making only 0.1% false matches,
would seem to be performing at a very impressive level
because it must confuse no more than one-tenth of all
identical twin pairs (since about 1% of all persons in the
general population have an identical twin). But even with
its P 1 = 0:001, how good would it be for searching large
databases?
Using Eq. (13) we see that when the search database
size has reached merely N = 200 unrelated faces, the prob-
ability of at least one false match among them is already

7/30/2019 patrec
http://slidepdf.com/reader/full/patrec 10/13
288 J. Daugman / Pattern Recognition 36 (2003) 279– 291
18%. When the search database is just N = 2000 unrelated
faces, the probability of at least one false match has reached
86%. Clearly identiÿcation is vastly more demanding than
one-to-one veriÿcation, and even for moderate database
sizes, merely “good” veriÿers are of no use as identiÿers.
Observing the approximation that P N ≈ NP 1 for small
P 11=N 1, when searching a database of size N , an iden-tiÿer needs to be roughly N times better than a veriÿer to
achieve comparable odds against making false matches.
The algorithms for iris recognition exploit the extremely
rapid attenuation of the HD distribution tail created by bi-
nomial combinatorics to accommodate very large database
searches without suering false matches. The decision
threshold is adaptive, to maintain P N ¡ 10−6 regardless of
how large the search database size N is. As illustrated in
Table 1, this means that if the search database contains 1
million dierent iris patterns, it is only necessary for the
HD match criterion to adjust downwards from 0.32 to 0.27
in order to maintain still a net false match probability of 10−6 for this entire large database.
At the other extreme, it is remarkable that even if matches
were accepted in which up to 40% of the bits disagreed, the
false match rate would still be only about 0.5% and better
than most biometrics (see Table 1 for HD = 0 :40). This
allows great tolerance for poor imaging conditions, such as
may be unavoidable in covert use.
7. Decision environment for iris recognition
The overall “decidability” of the task of recognizing per-
sons by their iris patterns is revealed by comparing the HDdistributions for same versus for dierent irises. The left dis-
tribution in Fig. 9 shows the HDs computed between 7070
dierent pairs of same-eye images at dierent times, un-
der dierent conditions, and usually with dierent cameras;
and the right distribution shows the results of comparisons
among dierent eyes. To the degree that one can conÿdently
decide whether an observed sample belongs to the left or the
right distribution in Fig. 9, iris recognition can be success-
fully performed. Such a dual distribution representation of
the decision problem may be called the “decision environ-
ment”, because it reveals the extent to which the two cases
(same versus dierent) are separable and thus how reliablydecisions can be made, since the overlap between the two
distributions determines the error rates.
Whereas Fig. 9 shows the decision environment under less
favourable conditions (images acquired by dierent camera
platforms), Fig. 10 shows the decision environment under
ideal (indeed, artiÿcial) conditions. Subjects’ eyes were im-
aged in a laboratory setting using always the same camera
with ÿxed zoom factor and at ÿxed distance, and with ÿxed
illumination. Not surprisingly, more than half of such image
comparisons achieved an HD of 0.00, and the average HD
was a mere 0.019. It is clear from the comparison of Figs.
9 and 10 that the “authentics” distribution for iris recog-
nition (the similarity between dierent images of the same
eye, as shown in the left-side distributions) depends very
strongly upon the image acquisition conditions. However,
the measured similarity for “imposters” (the right-side dis-
tribution) is apparently almost completely independent of
imaging factors. Instead, it mainly reects just the combi-
natorics of Bernoulli trials, as bits from independent binarysources (the phase codes for dierent irises) are compared.
For two-choice decision tasks (e.g. same versus dier-
ent), the decidability index d measures how well separated
the two distributions are, since recognition errors would be
caused by their overlap. If their two means are 1 and 2,
and their two standard deviations are 1 and 2, then d is
deÿned as
d
=|1 − 2| (2
1 + 22)= 2
: (14)
This measure of decidability is independent of how liberal
or conservative is the acceptance threshold used. Rather, bymeasuring separation, it reects the degree to which any
improvement in (say) the false match error rate must be paid
for by a worsening of the failure-to-match error rate. The
measured decidability for iris recognition is d = 7:3 for the
non-ideal (crossed platform) conditions presented in Fig. 9,
and it is d = 14:1 for the ideal imaging conditions presented
in Fig. 10.
Based on the left-side distributions in Figs. 9 and 10,
one could also calculate a table of probabilities of failure
to match [14], as a function of HD match criterion, just as
we did earlier in Table 1 for false match probabilities based
on the right-side distribution. However, such estimates may
not be stable because the same-eye distributions (left-side)depend strongly on the quality of imaging (e.g. motion blur,
focus, noise, etc.) and would be dierent for dierent opti-
cal platforms. As illustrated earlier by the badly defocused
image of Fig. 3, phase bits are still set randomly with bino-
mial statistics in poor imaging, and so the right-side distri-
bution is the stable asymptotic form both in the case of well
imaged irises (Fig. 10) and poorly imaged irises (Fig. 9).
Imaging quality determines how much the same-iris distri-
bution evolves and migrates leftward, away from the asymp-
totic dierent-iris distribution on the right. In any case, we
note that for the 7070 same-iris comparisons shown in Fig.
9, their highest HD was 0.327 which is below the smallestHD observed in even the 9.1 million comparisons between
dierent irises. Thus, a decision criterion slightly below 0.33
produces a correct match rate of 100% and no false matches
for the empirical data sets shown. At a criterion of 0.33, us-
ing the cumulatives of Eq. (11) as tabulated in Table 1, the
theoretical false match probability is 1 in 4 million.
Notwithstanding this diversity among iris patterns and
their apparent singularity because of so many dimensions
of random variation, their utility as a basis for automatic
personal identiÿcation would depend upon their relative
stability over time. There is a popular belief that the iris
changes systematically with one’s health or personality, and

7/30/2019 patrec
http://slidepdf.com/reader/full/patrec 11/13
J. Daugman / Pattern Recognition 36 (2003) 279– 291 289
0.0 0.1 0.2 0.3 0.4 0.5 0.6 0.7 0.8 0.9 1.0
Hamming Distance
D e n s i t y
Decision Environment for Iris Recognition: Non-Ideal Imaging
d’ = 7.3
2.3 million comparisons
mean = 0.110
stnd.dev. = 0.065
mean = 0.458
stnd.dev. = 0.0197
same different
Fig. 9. The decision environment for iris recognition under relatively unfavourable conditions, using images acquired at dierent distances,
and by dierent optical platforms.
0.0 0.1 0.2 0.3 0.4 0.5 0.6 0.7 0.8 0.9 1.0
Hamming Distance
D e n s i t y
Decision Environment for Iris Recognition: Ideal Imaging
d’ = 14.1
482,600 comparisons
mean = 0.019
stnd.dev. = 0.039
mean = 0.456
stnd.dev. = 0.020
same different
Fig. 10. The decision environment for iris recognition under very favourable conditions, using always the same camera, distance, and
lighting, in a laboratory setting.
even that its detailed features reveal the states of individual
organs (“iridology”); but such claims have been discredited
(see e.g. Refs. [15,16]) as medical fraud. In any case, the
recognition principle described here is intrinsically tolerant
of a large proportion of the iris information being corrupted,
say up to about a third, without signiÿcantly impairing the
inference of personal identity by the simple test of statistical
independence.

7/30/2019 patrec
http://slidepdf.com/reader/full/patrec 12/13
290 J. Daugman / Pattern Recognition 36 (2003) 279– 291
Table 2
Speeds of various stages in the iris recognition process.
Operation Execution time
Assessing image focus 15 ms
Scrubbing specular reections 56 ms
Localizing the eye and iris 90 msFitting the pupillary boundary 12 ms
Detecting and ÿtting both the eyelids 93 ms
Removing eyelashes and contact lens artifacts 78 ms
Demodulation and iriscode creation 102 ms
XOR comparison of any two iriscodes 10 s
8. Speed performance summary
On a 300 MHz Sun workstation, the execution times for
the critical steps in iris recognition are as indicated in Table
2, using optimized integer code.The search engine can perform about 100,000 full com-
parisons between dierent irises per second, because of the
ecient implementation of the matching process in terms
of elementary Boolean operators ⊗ and ∩ acting in parallel
on the computed phase bit sequences.
9. Permutation of bytes to defeat replay attacks
The test of statistical independence which is the basis of
iris recognition is of course indierent to the order in which
the bytes of two iris codes are compared, provided that any
permutation of byte order is identical for both iris codes.This is because each demodulating wavelet that sets a pair
of phase bits is a point process, and no identifying informa-
tion is embedded in the relationship between the bits com-
puted from dierent wavelets. This “non-metric” property is
not shared by other biometrics that are based on encoding
some kind of spatial map. It creates a powerful means for
preventing, or defeating, a “digital replay attack” in which
an iris code transmitted electronically in a remote transac-
tion might be captured by an eavesdropper and submitted
subsequently as an impersonation, or replay, attack.
The 256 data bytes in an iris code are capable of 256! =
10507
dierent permutations of byte order. Provided that boththe centrally enrolled iris code and the presenting one for
any given transaction, any given application or as stored
on any particular secured device, are permuted according
to the same permutation table, then recognition can still
be performed with results unaected by the permutation.
The massive number of 10507 possible cyclic permutations
means that this process could even be performed on a daily,
or hourly, basis without remotely exhausting the space of
code permutations that can be generated by a congruential
secret key. Moreover, all such concatenated permutations are
simply just another permutation, so there is no need to store
the long history of permutations; only the current resulting
one. This scenario creates new security possibilities (e.g.
an endless number of device-speciÿc or application-speciÿc
iris codes generated from any given iris) for the manner in
which iris recognition is deployed.
10. Future developments
The iris phase codes can be compressed without loss of
information to about 50 bytes, and even to as little as 36
bytes by undersampling if one can tolerate a reduction in the
number of degrees-of-freedom to about 102. However, there
is little beneÿt to be gained from these information-theoretic
manipulations to shorten the code, because of the bandwidth
and memory storage capacities today of even portable de-
vices and media.
The minimum resolution required for iris recognition re-
mains to be explored. As implied by comparing the left-side
distributions in Figs. 9 and 10, the main aspects of iris
recognition that require further improvement are related to
image acquisition. Since the iris is a small target, and a mov-
ing target, and one that ÿnds bright illumination aversive,
many compromises in imaging are required. For example,
all optical parameters ( F= number, focal depth of ÿeld, sen-
sor SNR, necessary CCD integration time) are improved
just by using more light, especially in the visible wave-
lengths. But for reasons mentioned earlier, this is not an
option.
A further negative consequence of the need to use NIR
illumination is that the sclera is often quite dark at these
wavelengths (sometimes darker even than the iris) because
the wall of the eye contains much blood, and hemoglobinhas a strong absorption band around 830 nm. The compar-
ative darkness of the sclera in such wavelengths makes it
more dicult to localize accurately the iris= sclera boundary.
The desire to acquire eye images at distances of about a me-
ter demands considerable magniÿcation, but this also works
against all of the optical parameters listed earlier. Yet despite
these challenges, the huge tolerance for error in the encoded
bit streams (up to about 33%) is a basis for optimism. The
power of the simple test of statistical independence reveals
(as Oscar Wilde [17] might have said) the importance, and
the beneÿts, of being random.
References
[1] A.N. Kolmogorov, Three approaches to the quantitative
deÿnition of information, Probl. Inform. Transm. 1 (1965)
4–7.
[2] P.N. Belhumer, J.P. Hespanha, D.J. Kriegman, Eigenfaces vs.
ÿsherfaces: recognition using class-speciÿc linear projection,
IEEE Trans. Pattern Anal. Mach. Intell. 19 (7) (1977) 711–
720.
[3] Y. Adini, Y. Moses, S. Ullman, Face recognition: the problem
of compensating for changes in illumination direction, IEEE
Trans. Pattern Anal. Mach. Intell. 19 (7) (1997) 721–732.

7/30/2019 patrec
http://slidepdf.com/reader/full/patrec 13/13
J. Daugman / Pattern Recognition 36 (2003) 279– 291 291
[4] P.J. Phillips, H. Moon, S.A. Rizvi, P.J. Rauss, The FERET
evaluation methodology for face-recognition algorithms,
IEEE Trans. Pattern Anal. Mach. Intell. 22 (10) (2000)
1090–1104.
[5] A. Pentland, T. Choudhury, Face recognition for smart
environments, Computer 33 (2) (2000) 50–55.
[6] P. Kronfeld, Gross anatomy and embryology of the eye, in:
H. Davson (Ed.), The Eye, Academic Press, London, 1962.
[7] J. Daugman, High conÿdence visual recognition of persons by
a test of statistical independence, IEEE Trans. Pattern Anal.
Mach. Intell. 15 (11) (1993) 1148–1161.
[8] J. Daugman, C. Downing, Demodulation, predictive coding,
and spatial vision, J. Opt. Soc. Amer. A 12 (4) (1995)
641–660.
[9] J. Daugman, Two-dimensional spectral analysis of cortical
receptive ÿeld proÿles, Vision Res. 20 (10) (1980) 847–856.
[10] J. Daugman, Uncertainty relation for resolution in
space, spatial frequency, and orientation optimized by
two-dimensional visual cortical ÿlters, J. Opt. Soc. Amer. A
2 (7) (1985) 1160–1169.
[11] J. Daugman, Complete discrete 2D Gabor transforms by
neural networks for image analysis and compression, IEEE
Trans. Acoustics, Speech, Signal Process. 36 (7) (1988)
1169–1179.
[12] R. Viveros, K. Balasubramanian, N. Balakrishnan, Binomial
and negative binomial analogues under correlated Bernoulli
trials, Amer. Statist. 48 (3) (1984) 243–247.
[13] T. Cover, J. Thomas, Elements of Information Theory, Wiley,
New York, 1991.
[14] J. Daugman, U.S. Patent No. 5,291,560: Biometric Personal
Identiÿcation System Based on Iris Analysis, 1 March
1994.
[15] L. Berggren, Iridology: a critical review, Acta Ophthalmol.
63 (1) (1985) 1–8.
[16] A. Simon, D.M. Worthen, J.A. Mitas, An evaluation of
iridology, J. Amer. Med. Assoc. 242 (1979) 1385–1387.
[17] O. Wilde, The Importance of Being Ernest, Leonard
Smithers, London, 1895. (Ernest): “Lady Bracknell, I hate
to seem inquisitive, but would you kindly inform me
who I am?”
About the Author —JOHN DAUGMAN is a faculty member at Cambridge University, where he teaches courses in Information Theory,
Computer Vision, Continuous Mathematics, and Neural Computing. He received his degrees at Harvard University, where he also subsequently
taught on the faculty. He has served as an editor of several journals including IEEE Trans. Pattern Analysis and Machine Intelligence;
Network Computation in Neural Systems; Cognitive Brain Research; and Journal of Computation and Mathematics. His academic
awards include the US National Science Foundation’s Presidential Young Investigator Award; the inaugural Toshiba Endowed Chair of the
Tokyo Institute of Technology; and the Order of the British Empire from Her Majesty Queen Elizabeth II. Daugman is the inventor of iris
recognition for personal identiÿcation, for which he received US Patent 5,291,560 in 1994. These algorithms won the 1997 Information
Technology Award and Medal of the British Computer Society; the 2000 Technology Innovation Award of the US Smithsonian Museum;
and the “Millenium Product” designation by the UK Design Council.


![Pattern Recognition Lettersjd92.wang/assets/files/a10_prl18.pdfJ. Wang et al. / Pattern Recognition Letters 000 (2018) 1–9 3 ARTICLE IN PRESS JID: PATREC [m5G;February 23, 2018;21:29]](https://img.pdfslide.net/doc/110x75/5f4ddcefc13b9a6fc009f029/pattern-recognition-j-wang-et-al-pattern-recognition-letters-000-2018-1a9.jpg)


![ARTICLE IN PRESS · 2020. 7. 30. · ARTICLE IN PRESS JID: PATREC [m5G;July 3, 2015;9:28] PAL FG−NET 0 10K 20K 30K 40K 50K Age database comparison - Samples Number of samples GROUPS](https://img.pdfslide.net/doc/110x75/6047edac854e984eb93afdba/article-in-press-2020-7-30-article-in-press-jid-patrec-m5gjuly-3-2015928.jpg)


![Pattern Recognition Lettersscozzafava/pubs/biopen.pdf · 2 M. De Marsico et al. / Pattern Recognition Letters 000 (2018) 1–10 ARTICLE IN PRESS JID: PATREC [m5G;April 27, 2018;16:38]](https://img.pdfslide.net/doc/110x75/5e3daf5682c98c0bdb098f0e/pattern-recognition-scozzafavapubsbiopenpdf-2-m-de-marsico-et-al-pattern.jpg)