Embed Size (px)
Citation preview

| September 26, 2017 | Nestlé Investor Seminar 20171
Capturing the opportunity from new consumer trendsPatrice Bula: EVP, Strategic Business Units, Marketing and Sales

Disclaimer
This presentation contains forward looking statements which reflect
management’s current views and estimates. The forward looking
statements involve certain risks and uncertainties that could cause
actual results to differ materially from those contained in the forward
looking statements. Potential risks and uncertainties include such
factors as general economic conditions, foreign exchange
fluctuations, competitive product and pricing pressures and regulatory
developments.
| September 26, 2017 | Nestlé Investor Seminar 20172

Being relevant to a new generation
| September 26, 2017 | Nestlé Investor Seminar 20173
Experiences
beyond product
- Convenience- Discovery- Enable self-expression- Be share-worthy
- Clean recipes- Natural ingredients- Proximity- Authenticity
The right products Be authentic and
benefit society
- Our purpose and values- Elevate social dimensions (CSV)
Earn trust
- Transparency- Empathy- Engaged

| September 26, 2017 | Nestlé Investor Seminar 20174
Changing Nutrition, Health and Wellness (NHW) expectations are leading to new growth opportunities
Source: Euromonitor data 2016, in Nestlé-relevant categories
* Market size based on retail sales price, CAGR % 2010-2015** Naturally Healthy: Food & beverage on the basis of naturally containing a substance that improves health & wellbeing beyond the product’s pure calorific value
*** High protein data not available directly, as new categories are investing in high protein variants. High protein supplements and nutrition products estimated at CHF 9 bn; meat analogues and vegetarian products estimated at CHF 1.5 bn. Rough
estimate related to Nestlé categories : CHF 4 bn.
Estimated market size in 2016* (CHF billion)
“Free-from”/ reduced
(Reduced fat, sugar,
salt, carbs, caffeine)
Plant-based Lactose-free High-protein***
Gluten-freeNatural** Organic
+10%
33 bn+4%
19 bn+7%
7 bn
+8%
4 bn
+12%
3-6 bn
+3%
195 bn
-1%
136 bn

| September 26, 2017 | Nestlé Investor Seminar 20175
Consumer expectations are holistic, multi-dimensionaland intertwined

| September 26, 2017 | Nestlé Investor Seminar 20176
Our core strategy: driving our portfolio transformation at scale
Acquiring “born pure” brands
and accelerating their growth
Integrating new NHW
dimensions into our core brands
Creating new brands

| September 26, 2017 | Nestlé Investor Seminar 20177
Example: driving “naturalization” of our petcare portfolio at scale
“Naturalizing” the core portfolio
CHF 375 million*, 51% CAGR**
Creating new brands
CHF 154 million*, 54% CAGR**
Acquiring “born pure” brands
CHF 381 million*, 26% CAGR**
Ancestral diets Regionally-sourced
Human-grade quality Protein-packed for active dogs
*Sales FY 2016, **CAGR (2014-2016)

| September 26, 2017 | Nestlé Investor Seminar 20178
Integrating organic as part of our brand offer
Infant formula & baby food
2017: China
2017: U.S., EUR, Mexico
Food
2016 - 2018: U.S.
2016 - 2017: U.S.
Dairy
Coffee Ice cream
2018: EUR
2018: U.S.2016: China, Mexico2017: ASEAN, Middle East
2016: Italy

| September 26, 2017 | Nestlé Investor Seminar 20179
Authenticity: telling genuine brand stories
Nescafé Uncle Tobys Ice creamWaters

| September 26, 2017 | Nestlé Investor Seminar 201710
Proximity: locally-sourced ingredients
Cailler Lean Cuisine Herta

| September 26, 2017 | Nestlé Investor Seminar 201711
New “free-from / high-with” diets
Lactose-free
4% avoid lactose
Reduced sugar
56% of European adult consumers reducing sugar
Gluten-free
7% avoid gluten
High-protein
75% of consumers increasingprotein intake
| September 26, 2017 | Nestlé Investor Seminar 201712
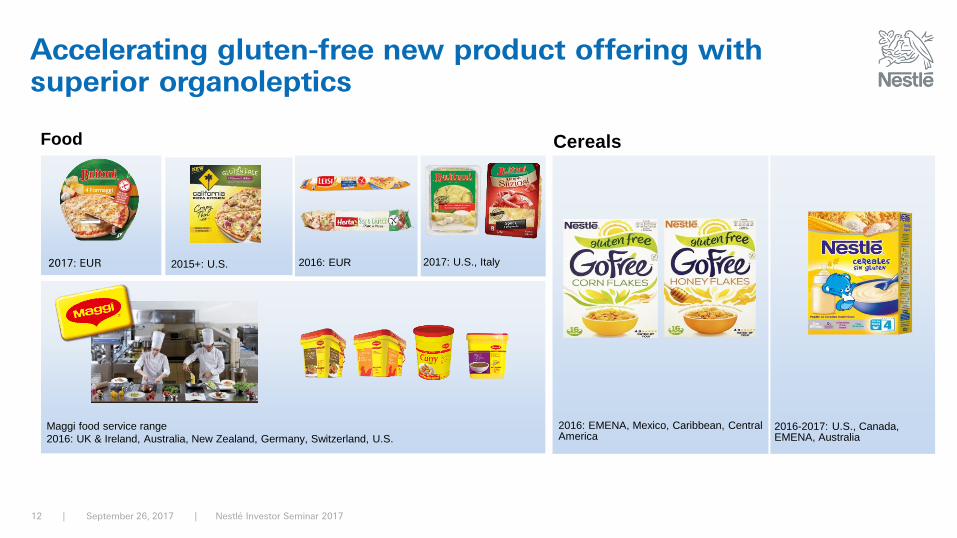
Accelerating gluten-free new product offering withsuperior organoleptics
Cereals
2016-2017: U.S., Canada, EMENA, Australia
2016: EMENA, Mexico, Caribbean, CentralAmerica
Food
2017: EUR 2017: U.S., Italy
Maggi food service range
2016: UK & Ireland, Australia, New Zealand, Germany, Switzerland, U.S.
2016: EUR2015+: U.S.
| September 26, 2017 | Nestlé Investor Seminar 201713
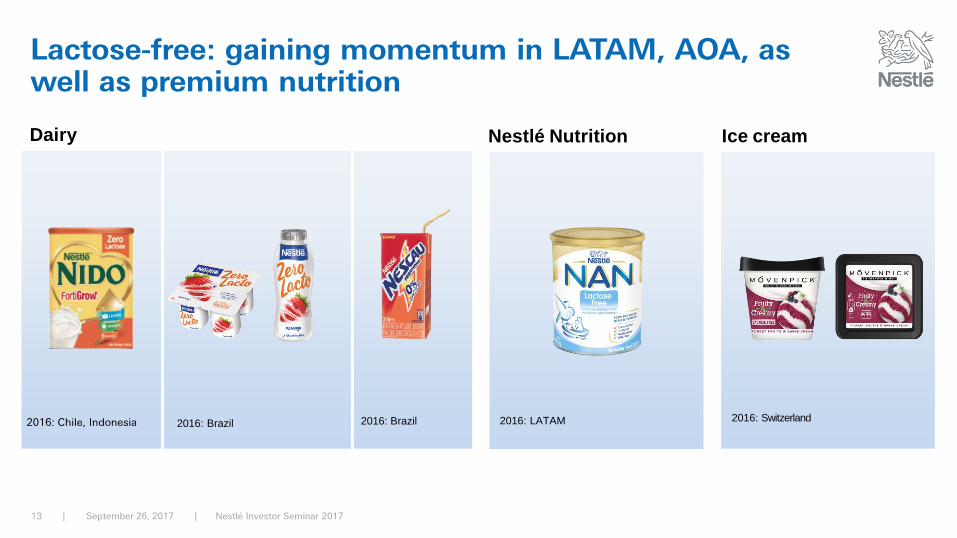
Lactose-free: gaining momentum in LATAM, AOA, as well as premium nutrition
Nestlé Nutrition
2016: LATAM
Dairy
2016: Chile, Indonesia 2016: Brazil 2016: Brazil
Ice cream
2016: Switzerland

| September 26, 2017 | Nestlé Investor Seminar 201714
Naturally reducing sugar
Dairy
Up to 30% reduced sugar No added sucrose Up to 30% reduced sugar
Confectionery

| September 26, 2017 | Nestlé Investor Seminar 201715
High-protein products
Food
2017: U.S.
Cereals
2016: EUR
Ice cream
2018: U.S.
Dairy
2017: Australia2016: U.S.

| September 26, 2017 | Nestlé Investor Seminar 201716
Plant-based diet
Flexitarians
Decide to reduce meat protein intake and actively seek plant-based alternatives
(+14% globally)
Do not consume meat, fish or poultry but may eat eggs / dairy
(+4% globally)
Vegetarians
Consume food and drink only from plant sources
(~2% globally)
Vegans

| September 26, 2017 | Nestlé Investor Seminar 201717
Offering plant-based alternatives across categories at scale
Starting from a solid base Scaling up acquired “ born pure”
brandsAccelerating with new launches
Milk-free Food
| September 26, 2017 | Nestlé Investor Seminar 201718
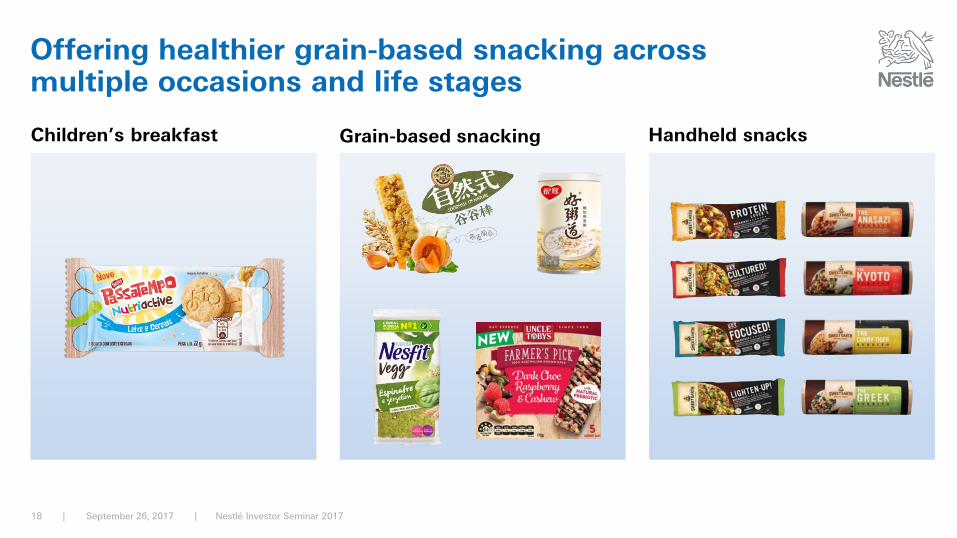
Offering healthier grain-based snacking across multiple occasions and life stages
Children’s breakfast Grain-based snacking Handheld snacks

| September 26, 2017 | Nestlé Investor Seminar 201719
Premiumization: authenticity, simplicity and noble ingredients
Ice cream
2017: U.S.
Confectionery
2017: EMENA
Culinary
2016: Mexico, ASEAN
Coffee
2018: EMENA

| September 26, 2017 | Nestlé Investor Seminar 201720
Accelerating Coffee growth through premiumizationand new experiences
Premiumization Cold coffee Blue Bottle coffee

| September 26, 2017 | Nestlé Investor Seminar 201721
Novel personalized experience and delivery models
Direct delivery of personalizedmenus
Chocolatory
2017: 15 boutiques + 66 pop-ups**pop-ups: 1 to 3 weeks during festive seasons
Nespresso

| September 26, 2017 | Nestlé Investor Seminar 201722
Nespresso “ for Chefs ”Personalized Petcare
Nutrition
Nutrition for Seniors
Novel personalized services and products
Children / Mother
Nutritional service
70’000 kits sold

2012 2013 2014 2015 2016
| September 26, 2017 | Nestlé Investor Seminar 201723
Connecting with a new generation
Source: Nestlé media agencies
Millennial-centric platform choicesDigital media spend above FMCG industry average
40%
0%
10%
20%
30% 30%
25%
Nestlé
FMCG average
Mobile first creative design
When you recycle, your
used coffee grounds can
become green energy.
| September 26, 2017 | Nestlé Investor Seminar 201724
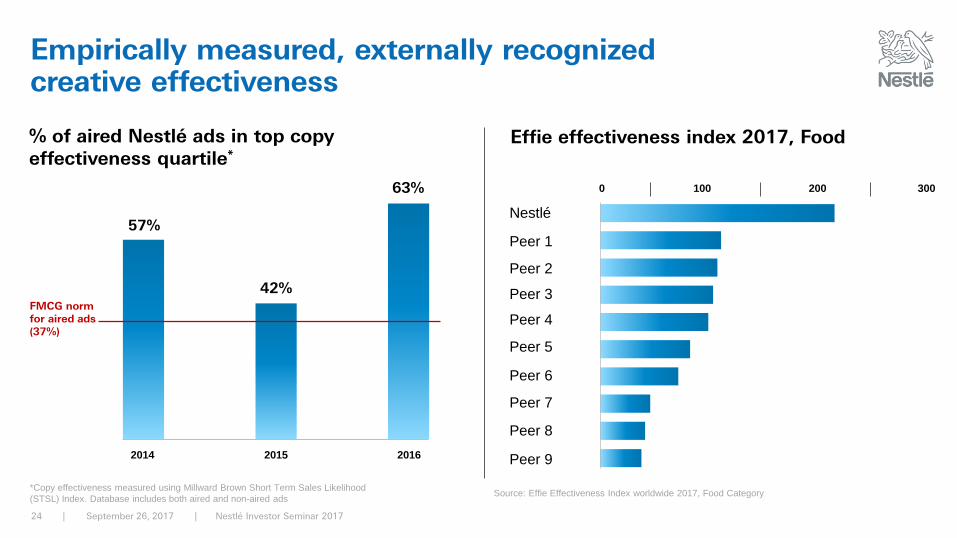
Empirically measured, externally recognized creative effectiveness
*Copy effectiveness measured using Millward Brown Short Term Sales Likelihood
(STSL) Index. Database includes both aired and non-aired ads
% of aired Nestlé ads in top copy effectiveness quartile*
2014 2015 2016
57%
42%
63%
FMCG normfor aired ads(37%)
0 100 200 300
Source: Effie Effectiveness Index worldwide 2017, Food Category
Effie effectiveness index 2017, Food
Nestlé
Peer 1
Peer 2
Peer 3
Peer 4
Peer 5
Peer 6
Peer 7
Peer 8
Peer 9

| September 26, 2017 | Nestlé Investor Seminar 201725
“Non-working” creative excellence working hard for our brands
Felix Europe
15%
16%
21%
22%
Main branded
competitor in
France
Felix France
Share ofvoice
44%
18%
36%
25%
Effective share of voice
Main branded
competitor in
UK
Felix UK
Source: Millward Brown – Share of voice vs. Effective share of voice
Nespresso U.S.
Brand awareness
59%
Purchaseconsideration
40%
4%24%
Exposed to TV ad
Not exposed to TV ad
2013 2014 2015 2016 2017
112% 109%
256%
327%
56%
Nespresso growth
Category growth
Source: UBS Global Research August 2017; Kantar TNS Brand Tracker

| September 26, 2017 | Nestlé Investor Seminar 201726
• Nescafé Gold (EMENA)• Ideal (Brazil)• ContreX (EMENA)• Coffeemate (USA)• Milo (India)• Purina Beyond (Global)• Illuma (China)• Nespresso (USA)• Nespresso «the choices we make»
(Global)

| September 26, 2017 | Nestlé Investor Seminar 201727
Media effectiveness
Source: Audit of markets representing 80% of global media spend Source: Moat, an independent vendor for measuring viewability, brand safety, fraud and attention of
online advertising. Industry average is among Moat clients for Q2 2017. All data desktop + mobile.
Enhanced transparency and data integrityNestlé online video viewability indexed to industry average
Q2’15 Q3 Q4 Q1’16 Q2 Q3 Q4 Q1’17 Q2 Q3
0.6
0.8
1.0
1.2
1.4
1.6
1.8
Industry averageviewability
Outperforming competition in media buying20% cost advantage vs. industry benchmarks
Benchmark
cost index
100%
Nestlé
cost index
80%

| September 26, 2017 | Nestlé Investor Seminar 201728
More than CHF 500 million in savings have been reinvested in productive brand building
* Marketing spend cost savings 2015, 2016 and projected 2017
Workingmedia
Productivespend
Non-workingmedia
Inefficientspend
Productivespend
Inefficientspend
• Media vendor negotiations
• Competitive agency reviews
• Research agency negotiations
• Competitive reviews
• Production decoupling
• E-auctions
• Digital agency consolidation
• Creative agency fee management

| September 26, 2017 | Nestlé Investor Seminar 201729
In summary
• We are integrating consumers’ new NHW expectations across our entire portfolio
• Acquired ‘born pure‘ businesses will bring additional sources of growth, as well as inspiration
• Our brands will continue to strive to connect and dialogue with consumers through creative excellence, new digital layers of services and personalization
• We will continue to gain efficiency in all dimensions of our brand building
• It is less about “big food” vs. small brands, than it is about great brands genuinely answering new consumer expectations

| September 26, 2017 | Nestlé Investor Seminar 201730
Thank you