Embed Size (px)
Citation preview

Patricia Sheffer, Assistant Superintendent & Director of InstructionHolly Keeney, Supervisor of Instruction

Learning targets for this session are…
Target #1• Identifying the positive role that KASC played in assisting
the Union County School District in making remarkable progress in student achievement
Target #2• Describe the various KASC products, trainings, resources,
and supports that are available to individual schools or districts
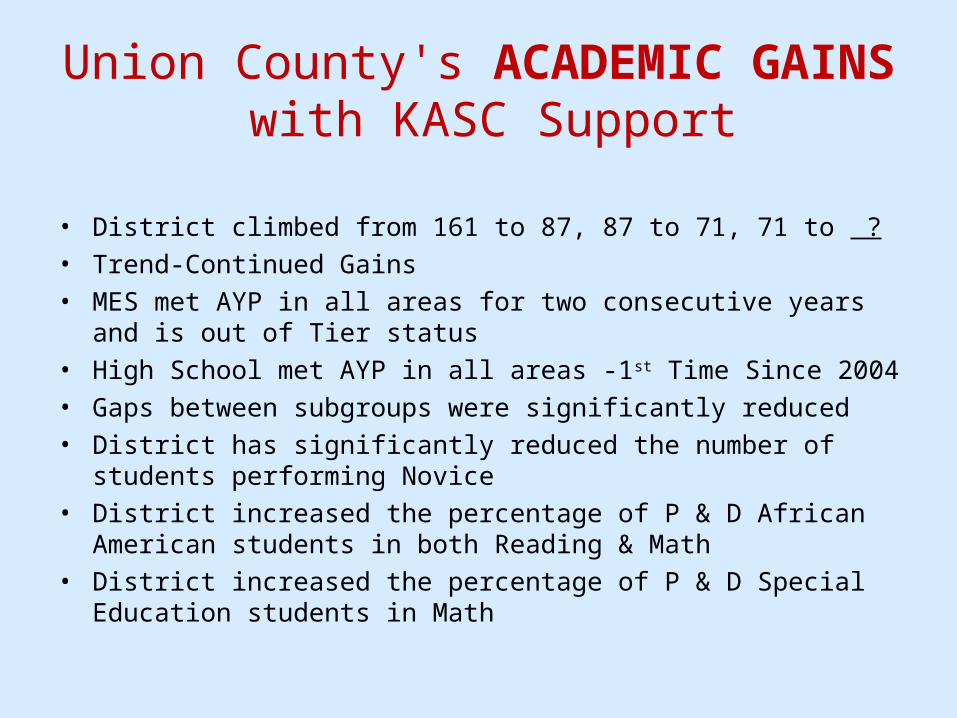
Union County's ACADEMIC GAINS with KASC Support
• District climbed from 161 to 87, 87 to 71, 71 to ? • Trend-Continued Gains• MES met AYP in all areas for two consecutive years and is out of Tier
status• High School met AYP in all areas -1st Time Since 2004• Gaps between subgroups were significantly reduced• District has significantly reduced the number of students performing
Novice• District increased the percentage of P & D African American students in
both Reading & Math• District increased the percentage of P & D Special Education students in
Math

Reasons for Success• Improved Teaching Pedagogy • Outstanding Instructional support staff• Motivated Students• Community’s understanding that Union County was in
educational peril• Belief that Union County and excellence should go hand in
hand• Continuous Formative Assessment• Kentucky Association of School Councils (KASC) Partnership• Right people in the right places• REAL Accountability

KASC Academic Data & Accountability Resources
In 2009, lawmakers passed Senate Bill 1, calling for new standards, testing, and accountability in Kentucky. While the law set aside the usual practice of calculating an academic index for each school, KASC, the Prichard Committee for Academic Excellence, and the Council for Better Education responded to requests from schools across the state to keep publishing testing results that would provide trend data for school-level performance. The Transition Index was first published in 2009 and uses a formula to compare test scores from 2007 to the present to show school progress.
KASC has complied 2010 Data available online…..• Report which compares KCCT Test results from 2007 through 2010 and tracks the status of student groups based on family
income, disability, gender, ethnic background, and other factors Disaggregated Transition Index Report.• Disaggregated Index Excel file download Disaggregated Index.• Sortable Excel version of the overall school and district Transition Index results, Transition Index Only 2010.• Overall district results Transition District Combined 2010.• Transition Index in each subject as well the Transition Index for each school and district, Excel file, Transition Index Subject 2010.
KASC TOP 20 REPORTS• KASC publishes annual reports that show how schools across Kentucky are performing. These materials have helped many
schools find new resources to boost performance in specific content areas or find schools with similar demographics to gain new insights on achievement.
• OUR REPORTS• Top 20 schools, overall and by school type and content area: 2007, 2008, 2009, 2010• Disaggregated performance: 2007, 2008,
The 2011 Data will be available soon from KASC…..

District Rankings2008 2008
% ile2009 2009
% ile2010 2010
% ile2011 2011
% ile
District 161/175 8% 87/174 55% 71/174 59% Projected top
50/174
75%
High School
165/175 6% 115/174 34% 93/169 45%
Middle School
145/175 17% 99/174 43% 59/174 66%
UES 247/713 65% 181/719 75% 397/717
45%
SES 373/713 48% 198/719 72% 241/717
66%
MES 671/713 6% 482/719 33% 397/717
45%
Elem. TOTAL
147/175 16% 65/174 63% 74/174 57%
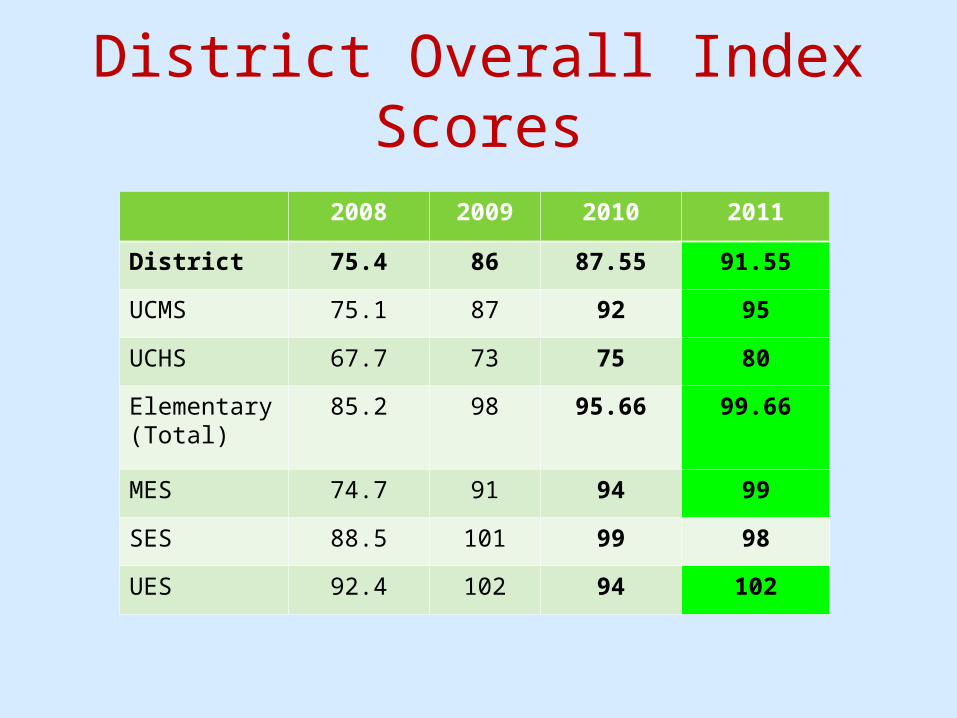
District Overall Index Scores
2008 2009 2010 2011
District 75.4 86 87.55 91.55
UCMS 75.1 87 92 95
UCHS 67.7 73 75 80
Elementary (Total)
85.2 98 95.66 99.66
MES 74.7 91 94 99
SES 88.5 101 99 98
UES 92.4 102 94 102

District Performance: 4 Year Trend % Proficient & Distinguished
2008 2009 2010 2011 % P&D Growth
Reading 59.07% 71.94% 75.37% 74.63% 15.56%
Math 45.38% 59.24% 61.81% 69.35% 23.97%
Science 46.28% 54.67% 57.54% 61.47% 15.19%
Social Studies 46.56 % 52.79% 53.93 % 59.67% 13.11 %
Writing 34.07% 40.29% 42.74% 43.06% 8.99%

District Novice Reduction 4 Year Trend
2008 % Novice
2009 % Novice
2010 % Novice
2011 % Novice
% Novice Reduction
Reading 20% 8% 12% 9.5% 10.5%
Math 82% 56% 45% 28% 54%
Science 60% 32% 30% 18.5% 41.5%
Social Studies
52% 43% 37% 26.5% 25.5%
Writing 37% 18% 18% 15.7% 21.3%
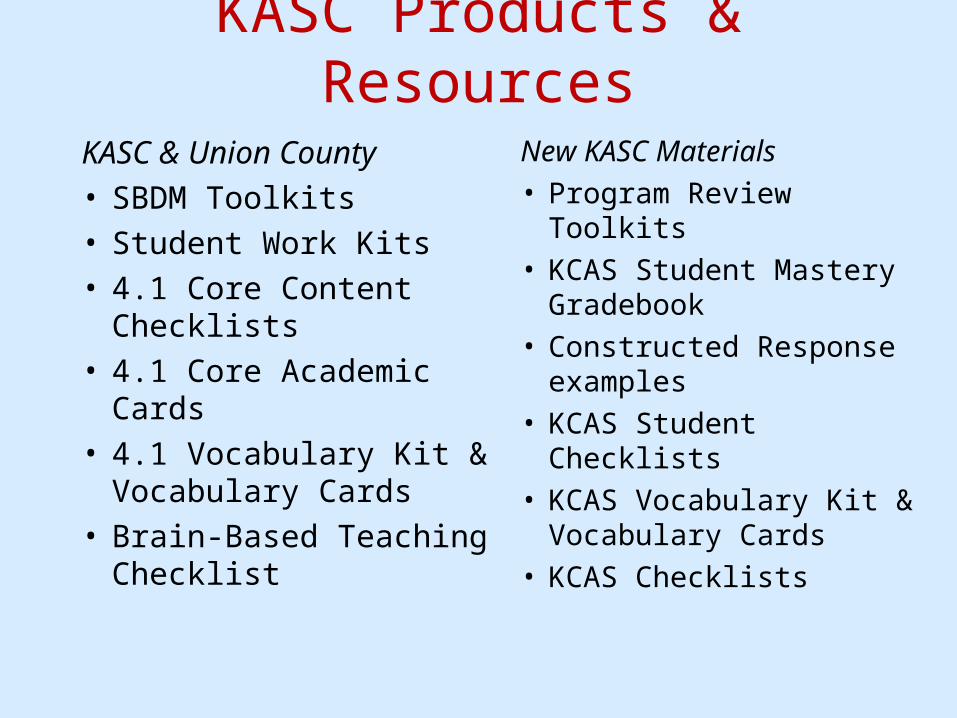
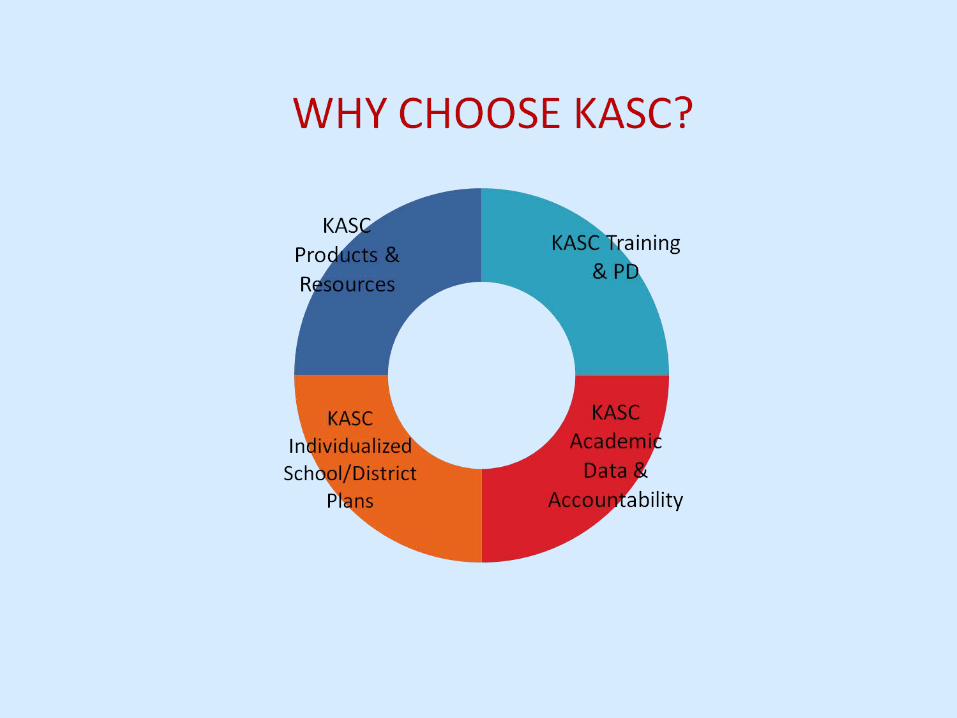
KASC Products & Resources
KASC & Union County• SBDM Toolkits• Student Work Kits• 4.1 Core Content
Checklists • 4.1 Core Academic Cards• 4.1 Vocabulary Kit &
Vocabulary Cards• Brain-Based Teaching
Checklist
New KASC Materials• Program Review Toolkits• KCAS Student Mastery
Gradebook• Constructed Response
examples• KCAS Student Checklists• KCAS Vocabulary Kit &
Vocabulary Cards• KCAS Checklists

KASC Training and PDSBDM topics• SBDM training for new and experienced council
members• KASC principal selection training• Councils and Open Meetings• Council Glossary & Basics• Council Elections• Scoring Guide for Wise and Proficient Council Work• Councils and Staffing Cuts• Planning and Legal Issues
COMPLETE INSTRUCTIONAL WORKSHOPS• RIGOR: STEP IT UP! • COLLABORATION: IT’S A PROFESSIONAL PARTNERSHIP• FORMATIVE (CONTINUOUS) ASSESSMENT • SUCCESS WITH RTI • PROFESSIONAL LEARNING COMMUNITIES• SUCCESS WITH OPEN-RESPONSE • CLOSING THE DISABILITY GAP• DIFFERENTIATED INSTRUCTION• ALL-STAR STRATEGIES
KASC PD WORKSHOPS– ANALYZING STUDENT WORK – THE CHALLENGING LEARNER: TEACHING THE
HARD-TO-REACH– ON-DEMAND WRITING – BRAIN-COMPATIBLE TEACHING AND LEARNING – REARCH AND CLASSROOM DISCIPLINE
QUICK PD: ONE-HOUR POWER SESSIONS• TEACHING VOCABULARY • MARZANO BASICS• SIMILARITIES & DIFFERENCES• NON-LINGUISTIC REPRESENTATIONS
NEW PD TITLES FOR 2011…• CONSTRUCTED RESPONSE –understand characteristics of short-
answer and open-response questions and how to choose the assessment item that best matches specific standards.
• SENATE BILL 1 IMPLEMENTATION AND LEADERSHIP -- Designed to help teachers and leaders in Senate Bill 1 Implementation. Be sure your schools are all on the same page with Kentucky’s Core Academic Standards, Formative Assessment, Program Reviews, and overall Assessment and Accountability

KASC Individualized PlansKASC will provide follow-up facilitation to help apply their resources to a district’s unique situation.
The KASC consultants will also facilitate district leadership to develop critical steps in moving each of your schools forward depending on individual levels of competency. After declining KDE’s offer of assistance in 2008, Union County Public Schools choose instead to partner with KASC and develop a more in-depth, rigorous approach to achieving rapid gains for our district.
Union County’s Plan• Commit to Excellence and define our “Top 10” vision by identifying , empowering, & equipping our
District & School Level Leadership Teams with KASC facilitating this process• Face the “Brutal Facts” with frequent walk-through data and our position in the KASC district rankings
(161/175)• Partner with KASC and utilize their resources to provide honest feedback• Utilize KASC instructional resources and professional development for improving student achievement• Visit” Top Performing” schools identified by KASC and borrow ideas that work• Implement our “Balanced Assessment System" with KASC support• Provide frequent support for building principals and SBDM councils through KASC resources• Emphasize an academic focus with “Top Ten Expectations” and improving “Student Achievement “above
all else!

Union County’s Renewed ACADEMIC FOCUS for the Classroom with KASC Support
• Implementing Engaging, Rigorous, Research-based Instructional Practices in Every Classroom
• Understanding Congruency between Learning Targets & Standards
• Utilizing Formative Assessment Effectively• Developing a Balanced Assessment System• Developing School Level Leadership Teams that focus
on “Student Achievement”• Every KID, Every Classroom, Every Day!

The Connection between Learning Targets and Formative-Assessments-(Congruency)
Bookends Sandwich
Without the congruency between the target and formative-assessment, the whole lesson
falls apart.

Underlying Principles of Continuous Formative Assessment:
(KASC)
1. Success in your classroom has to be defined by student work that demonstrates mastery and meets the minimum standard of proficiency.
– We don`t just want compliance from students. – We want demonstrations of learning.

Underlying Principles continued:
2. The focus has to be on the end result of student learning and build everything else from that foundation up.
– Goal setting-students know about their own level of mastery and how they can work to increase it.

Underlying Principles continued:
3. All students can master the content they need, and you can lead them in doing that.
– Do not limit students by the mistakes they`ve made
– All students = potential success

Underlying Principles continued:
4. Students are the most important member of the education team.
– Assessment truly becomes formative when students can use the information they receive to make adjustments to their own learning.

Underlying Principles continued:
5. Assessments are used consistently, as part of your regular instruction, to find out what can move the student to mastery.
– Teachers constantly assess student progress towards mastery
– Teachers adjust instruction based on all kinds of assessments

Underlying Principles continued
6.Knowing what students need to know and be able to do and assessing their learning can actually give you back more time in your life.
– Being able to focus specifically frees up time for you and your students, because you are working smarter.
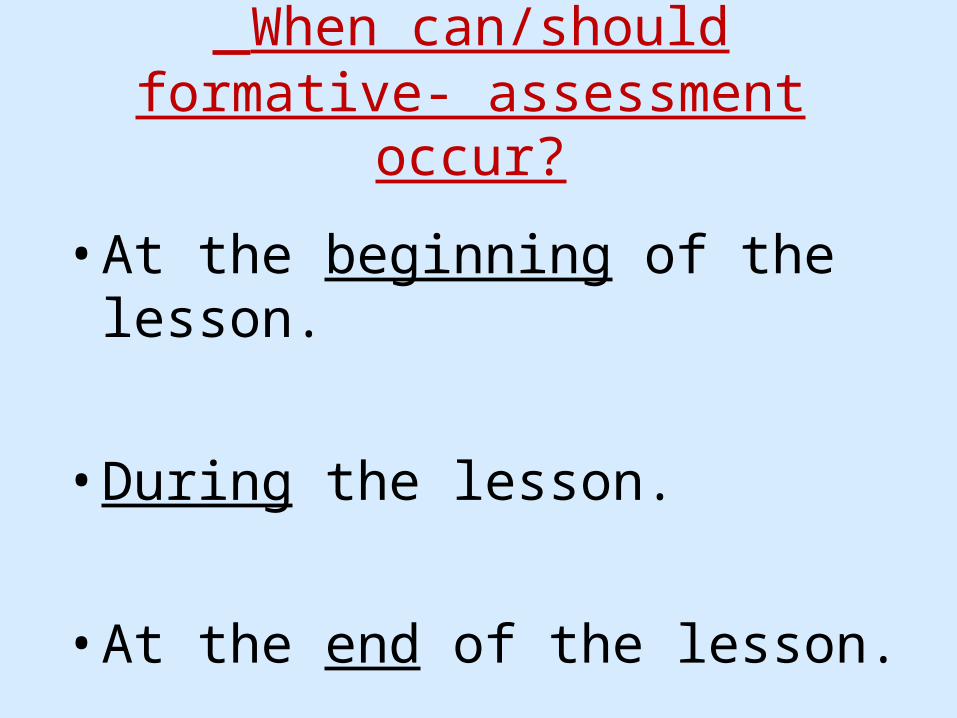
When can/should formative- assessment occur?
• At the beginning of the lesson.
• During the lesson.
• At the end of the lesson.

What does F.A. look like in the classroom?
• “Clicker” systems
• Individual dry erase boards
• Write on the desks with dry erase, water based markers, shaving cream
• Yes/No, Green/Red, or ABCD cards
• “Verbal” exit slips – student verbally responds to a teacher question before they walk out the door
• Snowballing
• Exit slips
• Should include both informal and formal types (varied)

Example of Tracking ChartName Obj 1
Add fractions like denominators
Obj 2Add fractions unlike denominators
Obj 3Subtract fractions like denominators
Obj 4Subtract fractions unlike denominators
Obj 5Add/Subtract fractions using estimation
Obj 6Set up word problems using + & - of fractions
Amy Absent -Depeka -Evan -
-Cindy Absent - April Absent
How can you use this information to impact classroom instruction and student learning?

Union County Public Schools Delivery of Instruction Checklist:
G.A.M.E. Winning Plan…• “Flashback or Review of previous content”• Ask Fundamental Question – Hook• Activate Prior Knowledge • Introduce daily Learning Target• Review Content Vocabulary• Explore Lesson Overview– explain CHAMPs behavioral expectations• Use 1st Strategy/Activity• Revisit Learning Target /informal F.A.• Use 2nd Strategy/Activity• Wrap Up Lesson Closure/Revisit F.Q. and Learning Target• Give Daily Formative Assessment
Developed with support from KASC
District Benchmark Assessments:
• Curriculum Specialist create, score, and provide report of school analysis to principal and Director of Instruction.
• Director of Instruction provides district report to Superintendent and discusses at Weekly District Leadership meetings (climate of DSA-scrolling data 24/7).
• Superintendent and DSA reports to the public through our Board of Education, local media, civic organizations and other community groups.
(Understand the district process-Thumbs up, thumbs down)

Six Steps to Implement Common Classroom F.A. by Content/School

F.A. WEEKLY ASSESSMENT PROTOCOL
Teachers will assign KCCT-like assessments weekly to be analyzed by the Curriculum Specialist and District Leadership teams. Students will be assessed as designated each Wednesday, beginning September, 2010 and for the remainder of this school year. Three scored assessments (high, medium, low) will be turned in to the curriculum specialists by 8:00 a.m. on Friday.
KCCT-like assessments will be designated by grade and content areas. The submission will include:
•one cover sheet •one dated copy of the assessment•one copy of the specific scoring rubric•three samples of student work—one low, one medium, one high(see attached packet)
District Expectations:
•All teachers are expected to utilize KCCT-like assessments as their routine assessments.•All students are expected to produce level 4 open responses.•All teachers with students not receiving a 4 will submit evidence of re-writes (independent re-write after conferencing with student, live scoring-scoring as the students complete, mini-lesson with small group or entire class, if needed).•All students are expected to score at least 80% accuracy on Practical Living multiple-choice.•All students are expected to score at least a Proficient on Senior Portfolios.

MathMarch 2011
by Index 3rd grade 4th grade 5th grade 6th grade 7th grade 8th grade 10th gradeMES 104.87 89.19 80.37 ----- ----- ----- -----SES 96.99 98.23 76.41 ----- ----- ----- -----UES 89.09 97.37 75.32 ----- ----- ----- -----UCMS ----- ----- ----- 94.57 92.2 102.03 -----UCHS ----- ----- ----- ----- ----- ----- 60.69
P & D P & D P & D P & D
2008-2009 2009-2010 Dec. March
% P & D Benchmark Benchmark
MES 69.59 67.82 44.50 58.28
SES 78.53 76.29 50.63 55.23
UES 77.00 68.93 39.83 55.58
UCMS 54.02 62.07 66.19 64.25
UCHS 32.12 34.78 42.86 35.04
IndexKCCT
2008-2009KCCT
2009-2010
2010-2011 December Benchmark
2010-2011 March
Benchmark
MES 96.38 96.90 73.20 91.48SES 103.78 100.39 79.97 90.54UES 104.10 95.00 66.20 87.26UCMS 83.59 92.46 98.29 96.27UCHS 60.64 66.99 67.59 60.69

READINGFall 2010
by Index 3rd grade 4th grade 5th grade 6th grade 7th grade 8th grade 10th gradeMES 106.87 62.44 84.73 ----- ----- ----- -----SES 114.33 77.96 84.97 ----- ----- ----- -----UES 121.28 66.30 64.87 ----- ----- ----- -----UCMS ----- ----- ----- 99.87 89.84 112.62 -----UCHS ----- ----- ----- ----- ----- ----- 92.07
P & D P & D P & D
2008-2009 2009-2010 2010-2011
% P & D Benchmark
MES 70.62 76.74 54.37
SES 85.88 85.52 62.31
UES 75.00 78.64 52.89
UCMS 68.47 75.25 69.28
UCHS 67.68 57.14 62.50
IndexKCCT 2008-
2009KCCT 2009-
2010
2010-2011 Fall
BenchmarkMES 94.73 98.73 84.68SES 103.56 101.19 92.42UES 97.52 98.04 84.15UCMS 94.13 100.01 100.78UCHS 92.86 85.51 92.07

District Formative AssessmentAnalysis of DataSeptember 2, 2009
Math Open Response Multiple-Choice
K-2 Average 100% 99.6%3rd –5th Grade Average
96.2% 99.6%
Total MathM.E.S. Average
98.1% 99.6%
Math Open Responses Multiple-Choice
K-2 Average 99% 100%3rd –5th Grade Average
99% 100%
Total Math S.E.S. Average
99% 100%
Math Open Responses Multiple-ChoiceK-2 Average: 99% 100%3rd –5th Average: 85% 91.5%Total U.E.S. Math Average
92% 95.75%
Subject ORQ Average – 4’s
Multiple Choice %
6th Grade Math 99.65 91.87th Grade Math 84.9 88.98th Grade Math 100 95.5%Total UCMS Math Average
94.85% 92%
Department /Grade Assessment/Performance
ORQ% of students
with a 4
Multiple Choice
% correctTotal MATH 12% 66% 9th grade 13% 64% 10th & 11th grade 11% 68%SCIENCE 36.7% 73.5%UCHS TOTAL 24.35% 69.75%
*District Math Average: ORQ- 79.19% M.C. –90.67%Strengths: •Good assessments this week! Keep them rigorous. We are working toward GREAT assessments.•Assessments required knowledge of specific math vocabulary this week.Areas of Improvements:•Teachers need to focus on the amount of time used in guiding Formative Assessments/much too lengthy•Teacher feedback on open responses should be specific and directed toward the actually response, not directed toward neatness or restatements. •When modeling the power verbs “explain” and “describe,” teachers should model in-depth thinking, tell how & why (leave nothing to chance)..

Union County Middle School Math Benchmark Scores
Demographics Number of Students Tested Proficient Distinguished Proficient and Distinguished
Percent Number Percent Number Percent Number
African Americans 6th - 17 6.25% 2 25.00% 5 31.25% 6
7th - 25 28.00% 7 44.00% 11 72.00% 18
8th - 26 52.00% 14 20.00% 6 72.00% 19
Total African Americans 68 28.75% 23 29.67% 22 58.42% 43
Disabilities 6th - 18 12.50% 3 12.50% 3 25.00% 5
7th - 30 23.08% 7 38.46% 12 61.54% 19
8th - 18 21.43% 4 0.00% 0 21.43% 4
Total Disabilities 66 19.00% 14 16.99% 15 35.99% 28
Free/Reduced Lunch 6th - 97 18.68% 19 25.00% 25 43.68% 43
7th - 96 31.82% 31 39.77% 39 71.59% 69
8th - 89 53.66% 48 15.80% 15 69.46% 62
Total Free/Reduced Lunch 282 34.72% 98 26.86% 79 61.58% 174
2010 KCCT Percent Proficient & Distinguished 2011 Goal Percent Proficient & Distinguished
Percent Number Percent Number
African Americans 43.21% 35 68.68% 47
Disabilities 35.71% 36 68.68% 46
Free/Reduced Lunch 52.48% 148 68.68% 194

TOPICDATE
OFASSESSMENT
TOP PERFORMERS(Highest % Reaching Proficiency)
WINNING % of Prof./Dist.
OVERALLINDEX
Geometry 12/2/09 2nd period 134.29(index) 123.45
Circles 12/15/09 6th & 10th Period 140.0(index) 137.7
Line Plots and Frequency Tables
1/6/10 1st and 5th 100% 93.65
Area of Circles and Squares
1/28/10 1st 87% 85
Measures of Central Tendency
2/12/10 3rd and 5th 100% 93.75
DISTRICT Math Assessment
2/18/10 6th Grade 107.339
Reflections3/5/10 5th 100% 90.48
6th Math

UCMS Curriculum Specialist ReportSBDM MeetingNov. 16, 2009Formative Assessment – 11/4/09Averages of students scoring a 4 Multiple
Choice UCMS Reading 55.3% 89.3%UCMS PLVS n/a
93.32% ORQ Average
MC Average
6th grade 87%
91.5%
7th grade 29%
87.8%
8th grade 50%
88.5%
PL/VS ---- 93.32%
6th grade ---- 99.7% 7th Grade ---- 86.93%
Formative Assessment – 11/11/09
Math MC Avg. OR 4 OR 3 OR 2 OR 1 OR 0UCMS 85.5% 34.2% 22.4% 19.1% 17.7% 5.7%
6th grade 86.4% 28.2% 38.5% 23.1% 10.3% --
7th grade 83.65% 54.3% 8.6% 11.4% 20% 5.7%
8th grade 86.5% 20% 20% 22.9% 22.9% 11.4%

HALLWAY DISPLAYS
•Student work should be displayed in the hallway in your assigned area.•The level of performance of this work should be distinguished.•Other sections in the building may be utilized if requested.•Displays should be creatively done.•Displays of distinguished work other than KCCT-like activities such as projects can be displayed as long as they are rigorous and include the information listed below.•Displays should include core content, learning target, rubric, example and description of activity.•Displays should be changed monthly. Interactive displays may be left up longer.

Review Learning targets for this session……Target #1• Identifying the positive role
that KASC played in assisting the Union County School District in making remarkable progress in student achievement
Target #2• Describe the various KASC
products, trainings, resources, and supports that are available to individual schools or districts

Questions?Contact Information:
• Patricia Sheffer, Assistant Superintendent & Director of Instruction
• Holly Keeney, Supervisor of Instruction
[email protected]@union.kyschools.us