Embed Size (px)
Citation preview
Open Journal of Geology, 2016, 6, 583-597 Published Online July 2016 in SciRes. http://www.scirp.org/journal/ojg http://dx.doi.org/10.4236/ojg.2016.67046
How to cite this paper: Brancato, A., Buscema, P.M., Massini, G. and Gresta, S. (2016) Pattern Recognition for Flank Erup-tion Forecasting: An Application at Mount Etna Volcano (Sicily, Italy). Open Journal of Geology, 6, 583-597. http://dx.doi.org/10.4236/ojg.2016.67046
Pattern Recognition for Flank Eruption Forecasting: An Application at Mount Etna Volcano (Sicily, Italy) A. Brancato1*, P. M. Buscema2,3, G. Massini2, S. Gresta4 1Istituto Nazionale di Geofisica e Vulcanologia-Osservatorio Etneo, Piazza Roma, Catania, Italy 2Semeion Research Center of Sciences of Communication, Via Sersale, Roma, Italy 3Department of Mathematical and Statistical Sciences, University of Colorado, Denver, CO, USA 4Dipartimento di Scienze Biologiche, Geologiche e Ambientali, Sezione di Scienze della Terra, Università di Catania, Catania, Italy
Received 24 November 2015; accepted 23 July 2016; published 26 July 2016
Copyright © 2016 by authors and Scientific Research Publishing Inc. This work is licensed under the Creative Commons Attribution International License (CC BY). http://creativecommons.org/licenses/by/4.0/
Abstract A volcano can be defined as a complex system, not least for the hidden clues related to its internal nature. Innovative models grounded in the Artificial Sciences, have been proposed for a novel pattern recognition analysis at Mt. Etna volcano. The reference monitoring dataset dealt with real data of 28 parameters collected between January 2001 and April 2005, during which the volcano underwent the July-August 2001, October 2002-January 2003 and September 2004-April 2005 flank eruptions. There were 301 eruptive days out of an overall number of 1581 investigated days. The analysis involved successive steps. First, the TWIST algorithm was used to select the most predictive attributes associated with the flank eruption target. During his work, the algorithm TWIST selected 11 characteristics of the input vector: among them SO2 and CO2 emissions, and also many other attributes whose linear correlation with the target was very low. A 5 × 2 Cross Valida-tion protocol estimated the sensitivity and specificity of pattern recognition algorithms. Finally, different classification algorithms have been compared to understand if this pattern recognition task may have suitable results and which algorithm performs best. Best results (higher than 97% accuracy) have been obtained after performing advanced Artificial Neural Networks, with a sensi-tivity and specificity estimates over 97% and 98%, respectively. The present analysis highlights that a suitable monitoring dataset inferred hidden information about volcanic phenomena, whose highly non-linear processes are enhanced.
*Corresponding author.
A. Brancato et al.
584
Keywords Mt. Etna Volcano, Flank Eruption Forecasting, Neural Networks, Pattern Recognition, Monitoring Data
1. Introduction Mt. Etna, located on the east coast of Sicily (Figure 1), is Europe’s largest and most active volcano as well as one of the best-monitored volcanoes worldwide. Every few years, eruptions occur from flank fissures concen-trated mainly along the NE and S rift zones on the slopes of the volcano (Figure 1). These events have critical socioeconomic consequences, especially due to lava flows that threaten the densely urbanized area surrounding the city of Catania (almost one million people) and major infrastructures (e.g. international airport, railway and skiing stations). The knowledge and subsequent awareness of the volcanic risk are therefore fundamental for de-cision-makers who are called on to manage appropriate emergency procedures.
The wide spectrum of styles and intensities of volcanic phenomena observed at Mt. Etna (degassing, Strom-bolian activity, lava fountains with ash fallout, phreatic and flank eruptions), coupled with the multidisciplinary data collected at Istituto Nazionale di Geofisica e Vulcanologia-Osservatorio Etneo (hereafter, INGV-OE), give an unique opportunity to better understand and/or distinguish between pre-eruptive phases. Accordingly, im-plementing a great variety of innovative models based on the Artificial Sciences is proposed. Artificial Sciences (hereafter, AS) enable comprehending natural processes by reproducing those same processes by automatic models.
A volcano is identifiable as a complex system, a spatio-temporal region, in which the structure and the state of its components change due to the dynamics linked to local and/or regional interactions (e.g. tectonic stresses), while maintaining its space-time cohesion. Being a dynamic system, a volcano generates new information over time, both in long, medium and short term (for Mt. Etna, years, months/weeks and weeks/days, respectively). Consequently, a volcano is inferred as a natural Adaptive System.
In a complex system, the global behavior does not equal the sum of the state of its components. This means that a complex system presents a highly nonlinear behavior, with a multiphase energy landscape; its dynamics is therefore not graspable by equations in a closed form [1]. To understand the actual dynamics of a natural Adap-tive System, we need a specific mathematics working directly on data in a way that the global behavior of the system occurs spontaneously by the local interactions of its components, i.e. data and equations. This is the ba-sis of the Bottom-Up method (Natural Computation), representing the best way for the study of natural Adaptive System [2].
The mathematical expression of the Natural Computation method is represented by the so-called Artificial Adaptive Systems. In natural systems there is hidden information that makes the data noticeable and easily mea-sureable. The hidden information reveals the underlying model that the natural Adaptive System is going to pursue. Artificial Adaptive Systems work by seeking for traces of this hidden information [1].
The main goal of this article is a Pattern Recognition; in other words, we have tried to understand if an erup-tion can be recognized, using only the distributed geo-information detected every day by local sensors.
We have worked applying the following steps: 1) A data preparation task in order to make the numerical information embedded in the original data explicit;
we then created a data matrix (i.e. a data set), where each row (record) represents what the sensors detect every day and each column represents a different attribute (sensor measure) of each day;
2) We assigned a target to each record (i.e. day monitored): if, according to our previous knowledge, an erup-tion would occur or not on each day;
3) We used the special adaptive Training With Input Selection and Testing algorithm (hereafter, TWIST) to select the minimum attributes able to maximize the pattern recognition task;
4) We applied a 5 × 2 Cross Validation (hereafter, CV) protocol to split the restricted data set (with a selected number of attributes) to establish the sensitivity and specificity of our pattern recognition algorithms;
5) Finally, we compared different classification algorithms (Artificial Neural Networks (hereafter, ANNs) and Machines Learning (hereafter, MLs)), to understand if this pattern recognition task may have suitable results and
A. Brancato et al.
585
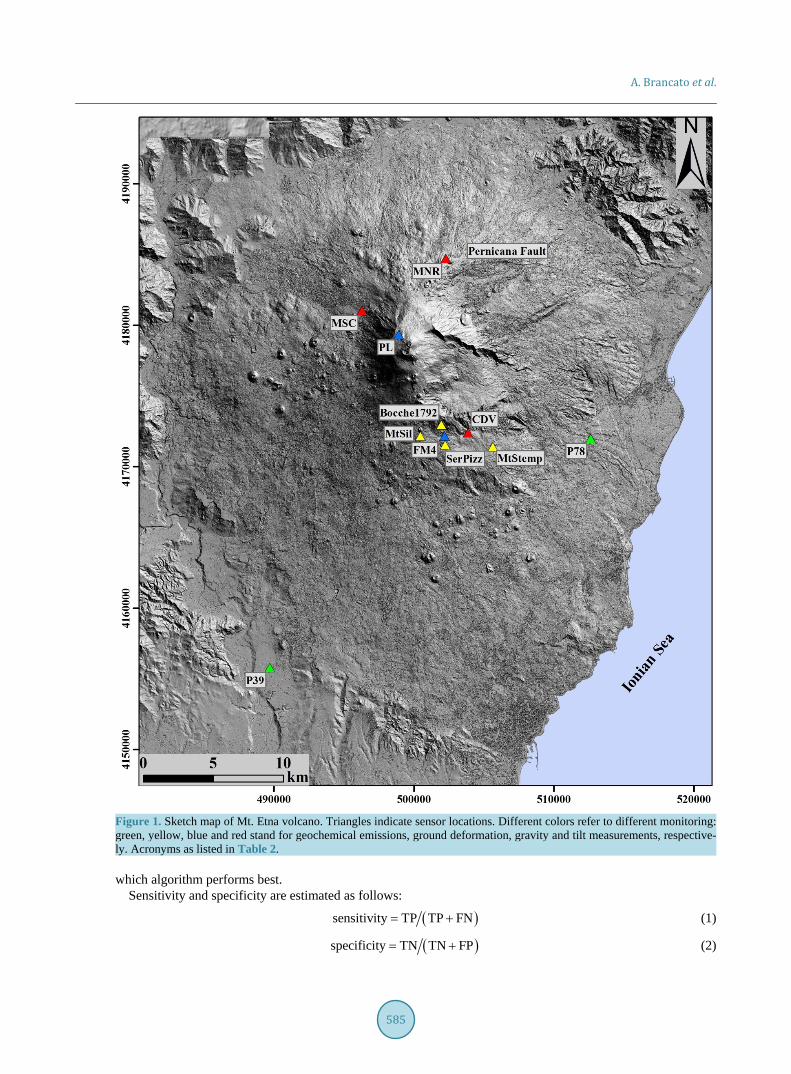
Figure 1. Sketch map of Mt. Etna volcano. Triangles indicate sensor locations. Different colors refer to different monitoring: green, yellow, blue and red stand for geochemical emissions, ground deformation, gravity and tilt measurements, respective-ly. Acronyms as listed in Table 2. which algorithm performs best.
Sensitivity and specificity are estimated as follows:
( )sensitivity TP TP FN= + (1)
( )specificity TN TN FP= + (2)
A. Brancato et al.
586
where TP, TN, FP and FN stand for True Positive, True Negative, False Positive and False Negative, respec-tively.
Furthermore, this paper presents a pattern recognition task, which is not necessarily a predictive task. Given a specific distribution of signals, the ML is able to estimate if this distribution is a typical distribution of an in-coming eruption process.
2. Data A source dataset represents most of the knowledge we have of the assigned target. Thus, we need to generate two equivalent subsets of data from a statistical point of view. Therefore, if this is true, the training session will represent a suitable learning set for the ML and the outputs of testing session will be representative of the ML capability to generalize for the whole dataset.
The dataset analyzed here deals with monitoring parameters recorded and collected at Mt. Etna in the interval January 2001-April 2005 (a total of 1581 days). This choice was motivated by the fact that the selected interval comprised various activity stages of Mt. Etna, ranging from quiescence to Strombolian activity, lava fountains and lava flank emissions. In particular, due to the target (i.e. the prediction of flank activity), we focus our atten-tion on the flank eruptions occurring in 2001 (July 17-August 9, for a total of 24 days), 2002-2003 (October 27- January 28, for a total of 94 days) and 2004-2005 (September 7-March 8, for a total of 183 days), for an overall of 301 eruptive days [3].
The dataset contains hidden information of the physical processes occurring inside the conduit of a volcano during or immediately preceding an eruption. These subsurface processes are related to data collected during volcano monitoring [4]. At Mt. Etna, seismicity(both high frequency and long period events), ground deforma-tions (tilt, EDM distances, areal dilatation, slip-rate), volatile degassing (SO2 and CO2 flux emissions, molar SO2/HCl, SO2/HCF and HCl/HF ratios, and isotopic 3He/4He ratio), potential fields (both gravimetric and mag-netic), volcanic and geological data (ash emission and dry fractures) are monitored and collected daily. Other data are retrieved by laboratory observations, such as petrologic analysis of the volcanic rocks produced by vol-canism (e.g. the presence of sideromelane in volcanic ash is indicative of a fresh magma injection).
The present dataset is a revision of a collection used to estimate the probabilities of eruptions, and relative pre-eruptive phases (unrest and nature of the unrest), by applying a Bayesian Event Tree procedure [3].
The revision works on those parameters whose time series are replicated indifferent nodes only because of different thresholds of anomaly [3]. A further revision is needed for parameters whose time series is shorter than 1581 days (i.e. tremor data). Therefore, from the initial dataset of 39 monitoring parameters [3], we elaborate only 28 parameters (Table 1), to which are associated two classes (Eruption and NonEruption) and 1581 records. In the present analysis, a monitoring parameter is assumed as a variable and no distinction among nodes is made.
A brief description of the parameters follows. The entire dataset is listed in Table 1, and a relative shortening for software applications is given in Table 2. Clearly, the whole network deployed on the Mt. Etna edifice is suitable to monitor internal volcanic processes. Indeed, parameters collected in specific zones (Table 1) are bet-ter related to the different regimes of volcanic activity, starting from an unrest state, even though on different timescales (it is worth recalling that our aim is predicting flank activity).
The deep (>200 km) and energetic (M > 5.0) earthquakes occurring on the Tyrrhenian slab as well as seismic-ity located in specific sectors (W and NW) are associated to the innermost magma movements [3]. Conversely, intense shallow VT seismicity (<5 km) is in line with shallower intrusions, most often being a precursor of flank eruptions at Mt. Etna, at least on a timescale of a few days ([3] and reference therein).
Ground deformation data are commonly linked to inflations of the volcanic edifice, on a timescale of months; relative uplifts increase until the magma is erupted ([3] and reference therein). Conversely, tilt data show signif-icant variations on a shorter timescale of a few hours to days [Gambino, personal communication]. Furthermore, GPS data, mostly collected on SE flank (Figure 1), are significant to detect anomalies for deep intrusions, while tilt data are better associated to shallow intrusions (Figure 1; [3] and reference therein).
Gravity data are related to magma intrusive processes, on a timescale of weeks to months ([3] and reference therein). Data convey a local effect, that is higher anomalies are detected at stations located closer to magmatic mass movements. Locations of the benchmarks used in this study are shown in Figure 1.
The geochemical fluids considered here are the emissions of SO2 and CO2 from the summit crater and the soil,
A. Brancato et al.
587
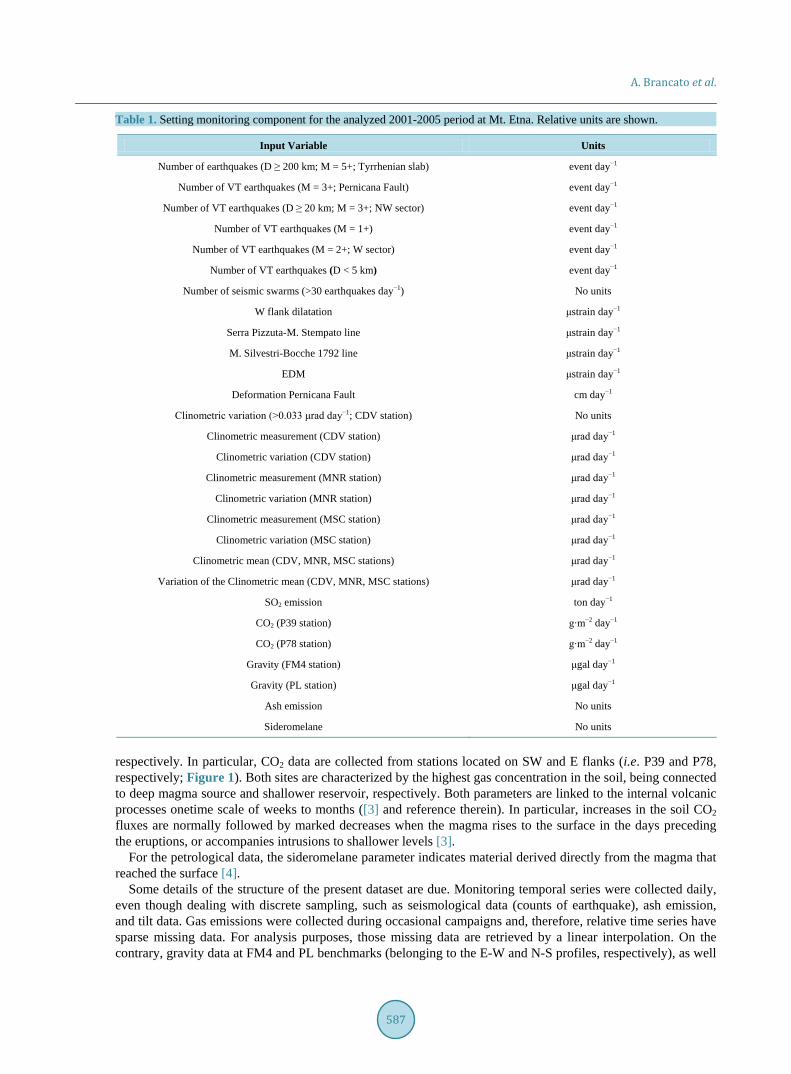
Table 1. Setting monitoring component for the analyzed 2001-2005 period at Mt. Etna. Relative units are shown.
Input Variable Units
Number of earthquakes (D ≥ 200 km; M = 5+; Tyrrhenian slab) event day−1
Number of VT earthquakes (M = 3+; Pernicana Fault) event day−1
Number of VT earthquakes (D ≥ 20 km; M = 3+; NW sector) event day−1
Number of VT earthquakes (M = 1+) event day−1
Number of VT earthquakes (M = 2+; W sector) event day−1
Number of VT earthquakes (D < 5 km) event day−1
Number of seismic swarms (>30 earthquakes day−1) No units
W flank dilatation μstrain day−1
Serra Pizzuta-M. Stempato line μstrain day−1
M. Silvestri-Bocche 1792 line μstrain day−1
EDM μstrain day−1
Deformation Pernicana Fault cm day−1
Clinometric variation (>0.033 μrad day−1; CDV station) No units
Clinometric measurement (CDV station) μrad day−1
Clinometric variation (CDV station) μrad day−1
Clinometric measurement (MNR station) μrad day−1
Clinometric variation (MNR station) μrad day−1
Clinometric measurement (MSC station) μrad day−1
Clinometric variation (MSC station) μrad day−1
Clinometric mean (CDV, MNR, MSC stations) μrad day−1
Variation of the Clinometric mean (CDV, MNR, MSC stations) μrad day−1
SO2 emission ton day−1
CO2 (P39 station) g∙m−2 day−1
CO2 (P78 station) g∙m−2 day−1
Gravity (FM4 station) μgal day−1
Gravity (PL station) μgal day−1
Ash emission No units
Sideromelane No units
respectively. In particular, CO2 data are collected from stations located on SW and E flanks (i.e. P39 and P78, respectively; Figure 1). Both sites are characterized by the highest gas concentration in the soil, being connected to deep magma source and shallower reservoir, respectively. Both parameters are linked to the internal volcanic processes onetime scale of weeks to months ([3] and reference therein). In particular, increases in the soil CO2 fluxes are normally followed by marked decreases when the magma rises to the surface in the days preceding the eruptions, or accompanies intrusions to shallower levels [3].
For the petrological data, the sideromelane parameter indicates material derived directly from the magma that reached the surface [4].
Some details of the structure of the present dataset are due. Monitoring temporal series were collected daily, even though dealing with discrete sampling, such as seismological data (counts of earthquake), ash emission, and tilt data. Gas emissions were collected during occasional campaigns and, therefore, relative time series have sparse missing data. For analysis purposes, those missing data are retrieved by a linear interpolation. On the contrary, gravity data at FM4 and PL benchmarks (belonging to the E-W and N-S profiles, respectively), as well

A. Brancato et al.
588
Table 2. Original variables (28) of the analyzed dataset vs the Input Selection (11) executed by TWIST algorithm (in italics and bold). Linear correlation of each attribute with the desired target (i.e. Eruption) is also reported.
Dataset
Variable namea Eruption LCb
eqs_slab_Tyrr −0.0173
eqs_Pern −0.0483
eqs_NW_Sect −0.0244
eqs_volc −0.0478
eqs_W_Sect −0.0707
eqs_D < 5 km −0.0476
eqs_swarm −0.0556
dil_W 0.3479
SerPizz_MtStemp −0.0563
MtSil_Bocche 1792 0.1207
EDM −0.2617
vel_def_Pern −0.1178
tilt_var_0.033_CDV 0.0887
CDV −0.1917
var_CDV 0.0209
MNR 0.2318
var_MNR −0.0490
MSC −0.0593
var_MSC −0.0350
tilt_mean_3 stat 0.1009
tilt_var_mean 0.0193
SO2 0.4498
CO2_P39 −0.3367
CO2_P78 0.0256
grav_FM4 0.1017
grav_PL −0.0966
ash −0.0798
sideromelane −0.0876 aShortening for software purposes; b(Pearson) linear coefficient. other geodetic data than tilt, report daily rates for missing data. It has to be stressed that input data are norma-lized as required to avoid overweighting certain components just for their physical dimensions.
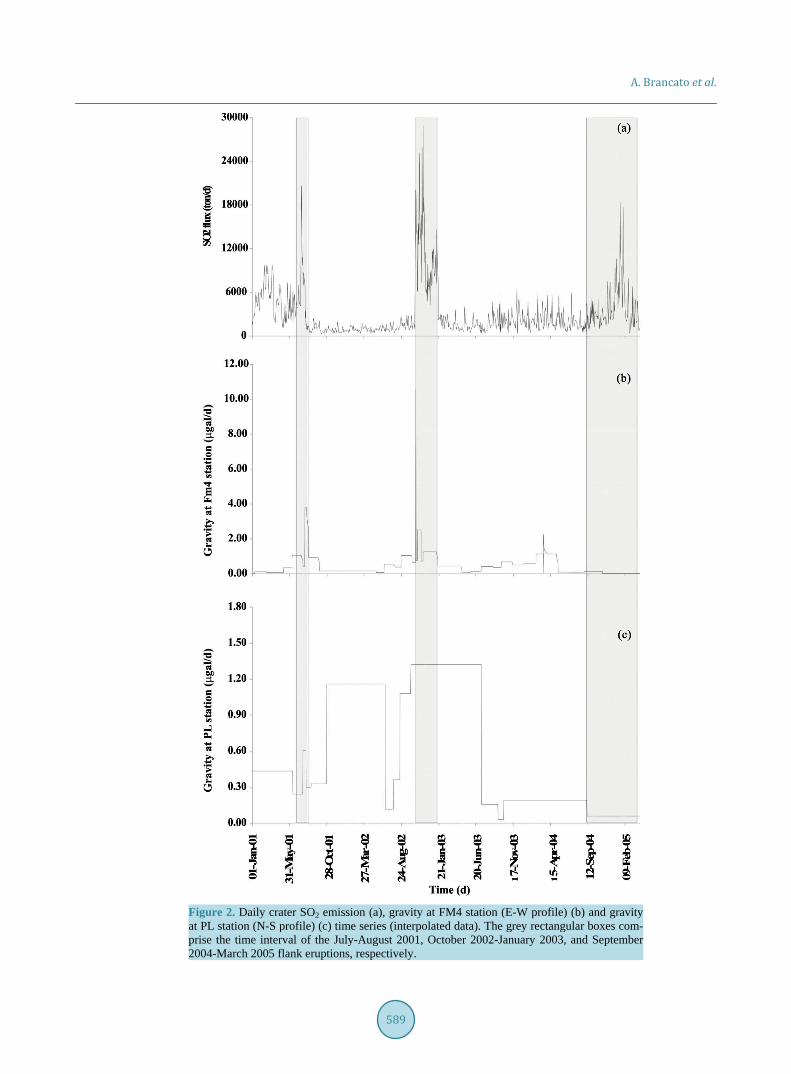
Figure 2 shows an inventory (crater SO2 emissions and gravity measurements) of the monitoring dataset here analyzed. It is evident how the data show changing with time and how they are related to different volcanic sce-narios, switching from quiescence to flank eruptive phases.
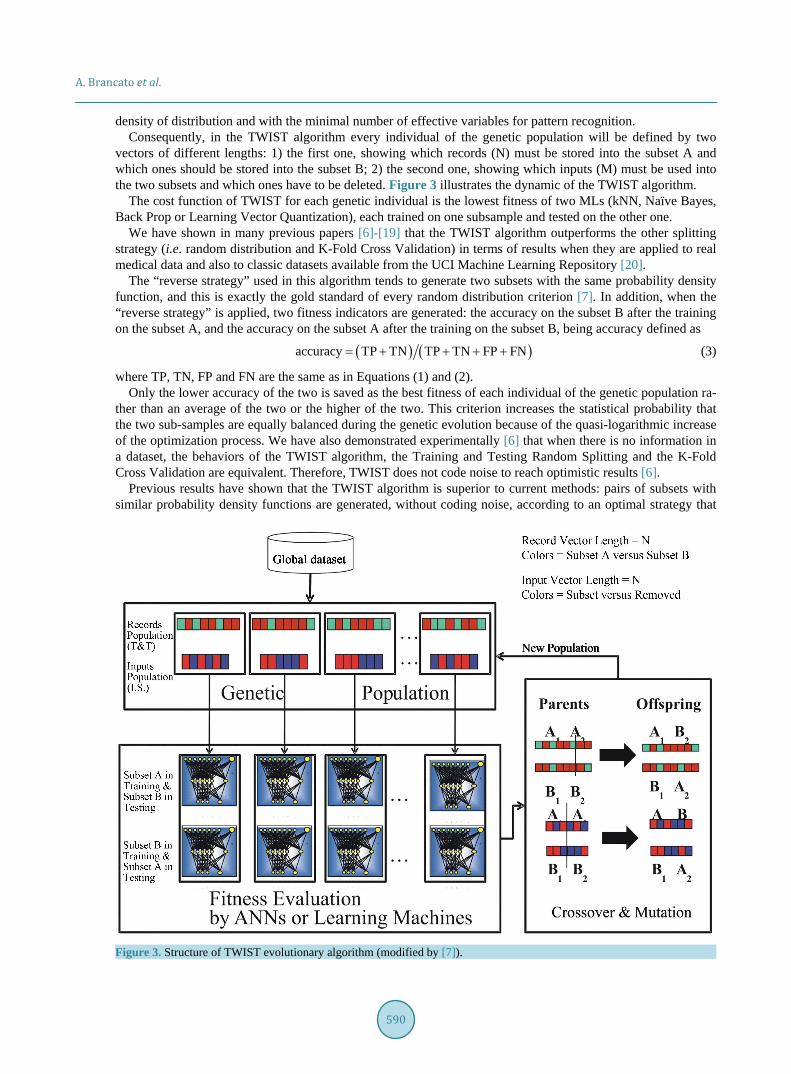
3. Methods 3.1. TWIST Algorithm TWIST is a new evolutionary algorithm [5] able to generate two subsets of data with a very similar probability
A. Brancato et al.
589
Figure 2. Daily crater SO2 emission (a), gravity at FM4 station (E-W profile) (b) and gravity at PL station (N-S profile) (c) time series (interpolated data). The grey rectangular boxes com-prise the time interval of the July-August 2001, October 2002-January 2003, and September 2004-March 2005 flank eruptions, respectively.
A. Brancato et al.
590
density of distribution and with the minimal number of effective variables for pattern recognition. Consequently, in the TWIST algorithm every individual of the genetic population will be defined by two
vectors of different lengths: 1) the first one, showing which records (N) must be stored into the subset A and which ones should be stored into the subset B; 2) the second one, showing which inputs (M) must be used into the two subsets and which ones have to be deleted. Figure 3 illustrates the dynamic of the TWIST algorithm.
The cost function of TWIST for each genetic individual is the lowest fitness of two MLs (kNN, Naïve Bayes, Back Prop or Learning Vector Quantization), each trained on one subsample and tested on the other one.
We have shown in many previous papers [6]-[19] that the TWIST algorithm outperforms the other splitting strategy (i.e. random distribution and K-Fold Cross Validation) in terms of results when they are applied to real medical data and also to classic datasets available from the UCI Machine Learning Repository [20].
The “reverse strategy” used in this algorithm tends to generate two subsets with the same probability density function, and this is exactly the gold standard of every random distribution criterion [7]. In addition, when the “reverse strategy” is applied, two fitness indicators are generated: the accuracy on the subset B after the training on the subset A, and the accuracy on the subset A after the training on the subset B, being accuracy defined as
( ) ( )accuracy TP TN TP TN FP FN= + + + + (3)
where TP, TN, FP and FN are the same as in Equations (1) and (2). Only the lower accuracy of the two is saved as the best fitness of each individual of the genetic population ra-
ther than an average of the two or the higher of the two. This criterion increases the statistical probability that the two sub-samples are equally balanced during the genetic evolution because of the quasi-logarithmic increase of the optimization process. We have also demonstrated experimentally [6] that when there is no information in a dataset, the behaviors of the TWIST algorithm, the Training and Testing Random Splitting and the K-Fold Cross Validation are equivalent. Therefore, TWIST does not code noise to reach optimistic results [6].
Previous results have shown that the TWIST algorithm is superior to current methods: pairs of subsets with similar probability density functions are generated, without coding noise, according to an optimal strategy that
Figure 3. Structure of TWIST evolutionary algorithm (modified by [7]).

A. Brancato et al.
591
extracts the minimal number of features and the most useful information for pattern classification. After 295 generation TWIST algorithm has selected 11 attributes among the original 28. Table 2 shows the
input selection executed by TWIST with the calculation of the linear correlation (hereafter, LC) between each attribute and the target. A possible geostatistical explanation for non-included attributes could be because the sensor produces weak signals, with anomaly variation that may last longer than the typical timescale of a flank eruption at Mt. Etna. Indeed, when an unrest is detected at Mt. Etna (6 - 8 months before the onset of the flank event), if the volcanic system evolves into more anomalous states, mid-term phases occur more frequently and for longer time intervals (few weeks), with a drastic increases very few days or hours before fracturing the vol-cano slopes [3]. It should also be noted that volcanic signals might be scarcely detected because of the non-op- timal location of the relative sensors.
It is interesting to observe that the TWIST algorithm does not select the attribute with the highest LC with the target. Many variables with a very low LC with the dependent variables are in fact chosen. This is because TWIST operates a many to many non-linear associative work among all the variables, in order to detect also which weak non-linear signals make the other signals become good predictors.
3.2. The 5 × 2 CV Protocol The validation protocol is a fundamental procedure to verify the ability of models to generalize the results reached in the Testing phase of each model. The application of a fixed protocol measures the level of perfor-mance that a model can produce on data that are not present in the Testing and/or Training sample. There are different types of protocol in the literature, each with advantages and disadvantages. The protocol, from the point of view of a general procedure, consists of the following steps:
1) subdividing the database in a random way into two subsamples: Subsets A and B; 2) training an ANN (or a generic algorithm) on Subset A; in this phase the ANN learns to associate the input
variables with those that are indicated as targets; 3) at the end of the training phase, the weight matrix produced by the ANN is saved and frozen together with
all the other parameters used for the training; 4) with the weight matrix saved, Subset B, which it has not seen before, is shown to the ANN, so that in each
case the ANN can express an evaluation based on the previous training; this operation takes place for each input vector and every result (output vector) and is not communicated to the ANN; in this way the ANN is evaluated only in reference to the generalization ability that it has acquired during the Training phase;
5) a new ANN is constructed with identical architecture to the previous one and the procedure is repeated from point 1, but this time the ANN will be trained on Subset B and blindly tested on the Subset A.
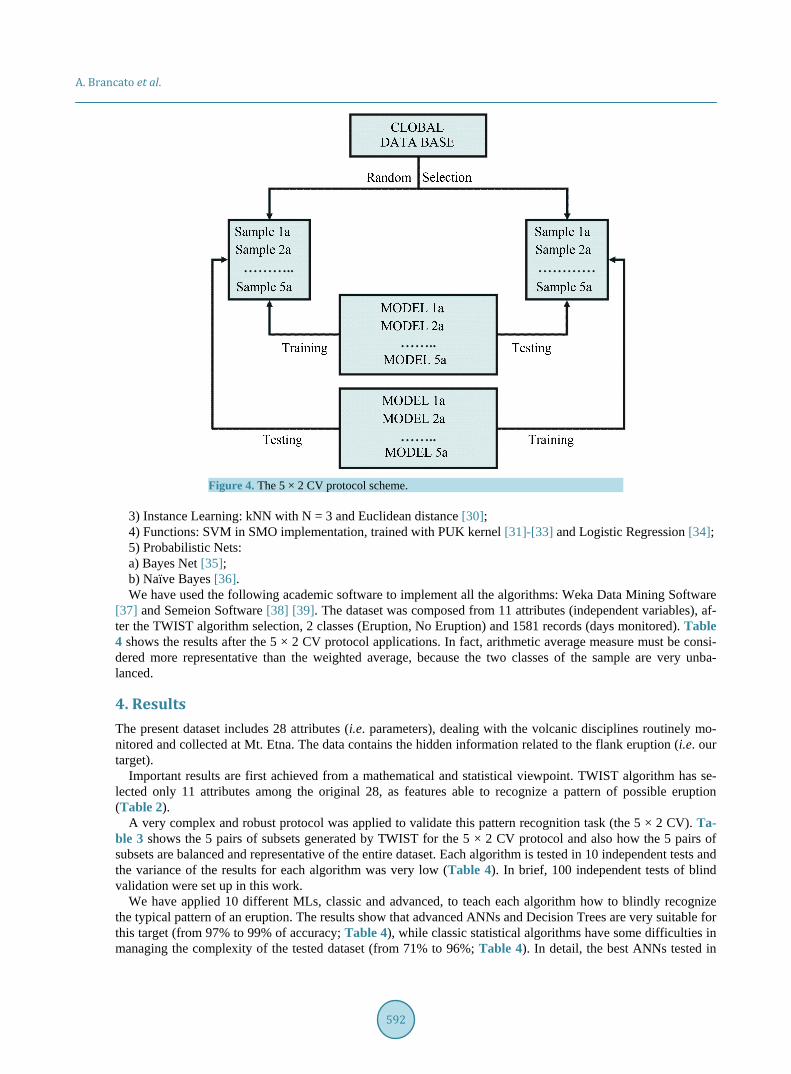
This general training plan has been further articulated with the aim of increasing the level of reliability in terms of generalization of the processing models. More specifically, we employed the so-called 5 × 2 Cross Va-lidation protocol [21]. In this procedure the study sample is randomly divided five times into two sub samples, always different but containing a similar distribution of cases and controls: the training one (containing the de-pendent variable) and the testing one. During the training phase the ANN learns a model of data distribution and then, on the basis of such a model, classifies subjects in the testing set in a blind way. The training and testing sets are then reversed and consequently 10 analyses for every model employed are conducted. The results of this protocol represent a robust statistic for pattern recognition work. Figure 4 shows the 5 × 2 CV protocol and Ta-ble 3 shows a five splitting of the dataset in two subsamples.
3.3. ANNs and MLs We have tested 10 different and known algorithms, coming from five families of MLs [22]:
1) ANNs, advanced and classic: a) Supervised Contractive Map (SV-Cm) [23] [24]; b) Sine Net, trained with 1 hidden layer of 12 units and a Learning Coefficient = 0.1 [25]; c) The classic Multi-Layer Perceptron with the Back propagation learning law (MLP-Bp), trained as Sine Net
[26]; d) K-Contractive Map (K-CM), trained with 3 hidden layers of 12 units each one and a Learning Coefficient =
0.01 [27]; 2) Decision Trees [28]: Random Forest, initialized with 100 trees [29];
A. Brancato et al.
592
Figure 4. The 5 × 2 CV protocol scheme.
3) Instance Learning: kNN with N = 3 and Euclidean distance [30]; 4) Functions: SVM in SMO implementation, trained with PUK kernel [31]-[33] and Logistic Regression [34]; 5) Probabilistic Nets: a) Bayes Net [35]; b) Naïve Bayes [36]. We have used the following academic software to implement all the algorithms: Weka Data Mining Software
[37] and Semeion Software [38] [39]. The dataset was composed from 11 attributes (independent variables), af-ter the TWIST algorithm selection, 2 classes (Eruption, No Eruption) and 1581 records (days monitored). Table 4 shows the results after the 5 × 2 CV protocol applications. In fact, arithmetic average measure must be consi-dered more representative than the weighted average, because the two classes of the sample are very unba-lanced.
4. Results The present dataset includes 28 attributes (i.e. parameters), dealing with the volcanic disciplines routinely mo-nitored and collected at Mt. Etna. The data contains the hidden information related to the flank eruption (i.e. our target).
Important results are first achieved from a mathematical and statistical viewpoint. TWIST algorithm has se-lected only 11 attributes among the original 28, as features able to recognize a pattern of possible eruption (Table 2).
A very complex and robust protocol was applied to validate this pattern recognition task (the 5 × 2 CV). Ta-ble 3 shows the 5 pairs of subsets generated by TWIST for the 5 × 2 CV protocol and also how the 5 pairs of subsets are balanced and representative of the entire dataset. Each algorithm is tested in 10 independent tests and the variance of the results for each algorithm was very low (Table 4). In brief, 100 independent tests of blind validation were set up in this work.
We have applied 10 different MLs, classic and advanced, to teach each algorithm how to blindly recognize the typical pattern of an eruption. The results show that advanced ANNs and Decision Trees are very suitable for this target (from 97% to 99% of accuracy; Table 4), while classic statistical algorithms have some difficulties in managing the complexity of the tested dataset (from 71% to 96%; Table 4). In detail, the best ANNs tested in
A. Brancato et al.
593
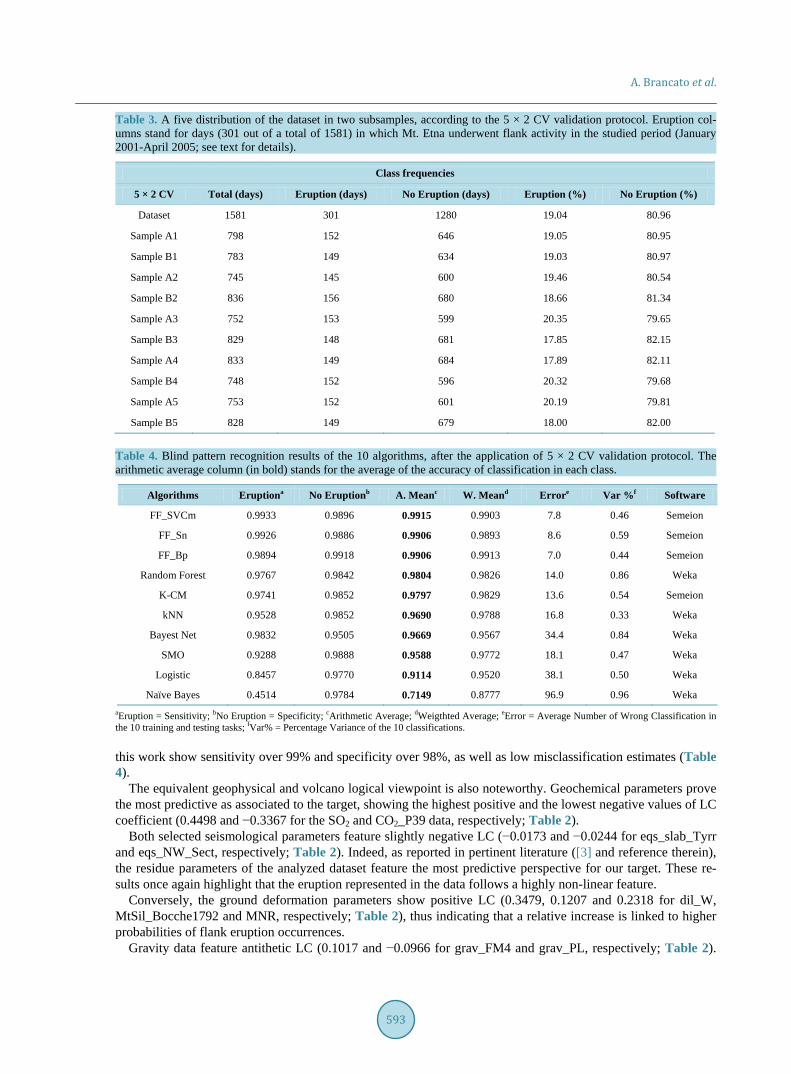
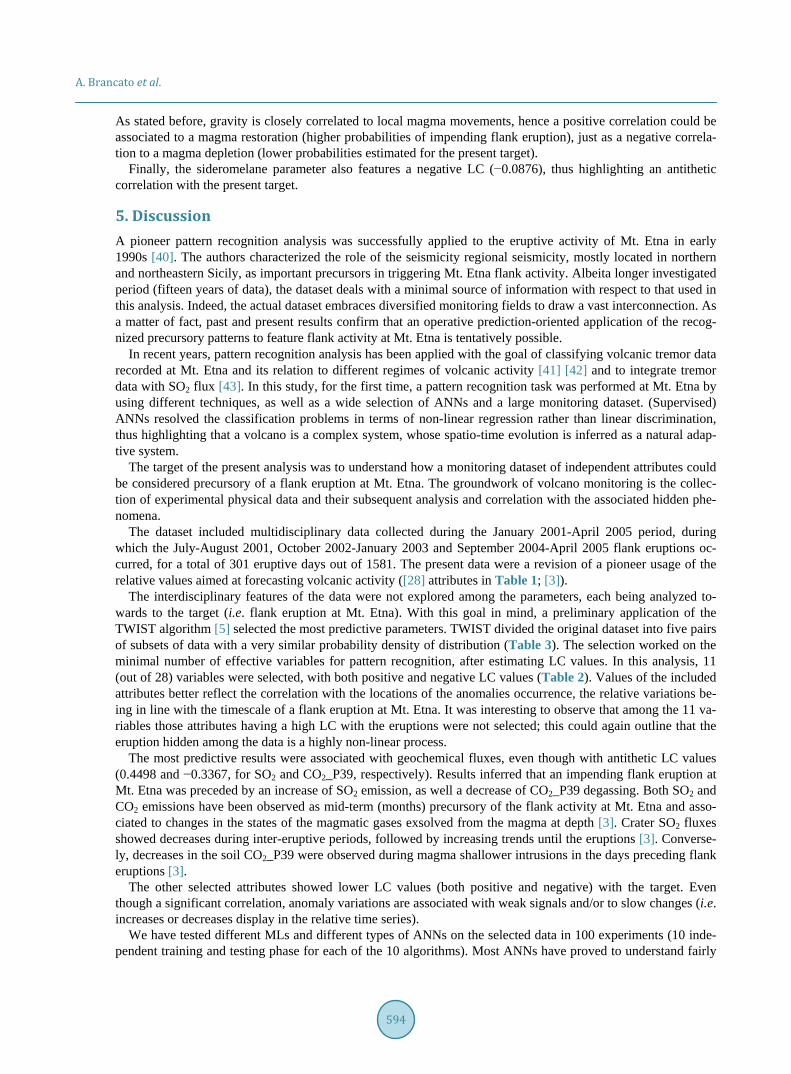
Table 3. A five distribution of the dataset in two subsamples, according to the 5 × 2 CV validation protocol. Eruption col-umns stand for days (301 out of a total of 1581) in which Mt. Etna underwent flank activity in the studied period (January 2001-April 2005; see text for details).
Class frequencies
5 × 2 CV Total (days) Eruption (days) No Eruption (days) Eruption (%) No Eruption (%)
Dataset 1581 301 1280 19.04 80.96
Sample A1 798 152 646 19.05 80.95
Sample B1 783 149 634 19.03 80.97
Sample A2 745 145 600 19.46 80.54
Sample B2 836 156 680 18.66 81.34
Sample A3 752 153 599 20.35 79.65
Sample B3 829 148 681 17.85 82.15
Sample A4 833 149 684 17.89 82.11
Sample B4 748 152 596 20.32 79.68
Sample A5 753 152 601 20.19 79.81
Sample B5 828 149 679 18.00 82.00
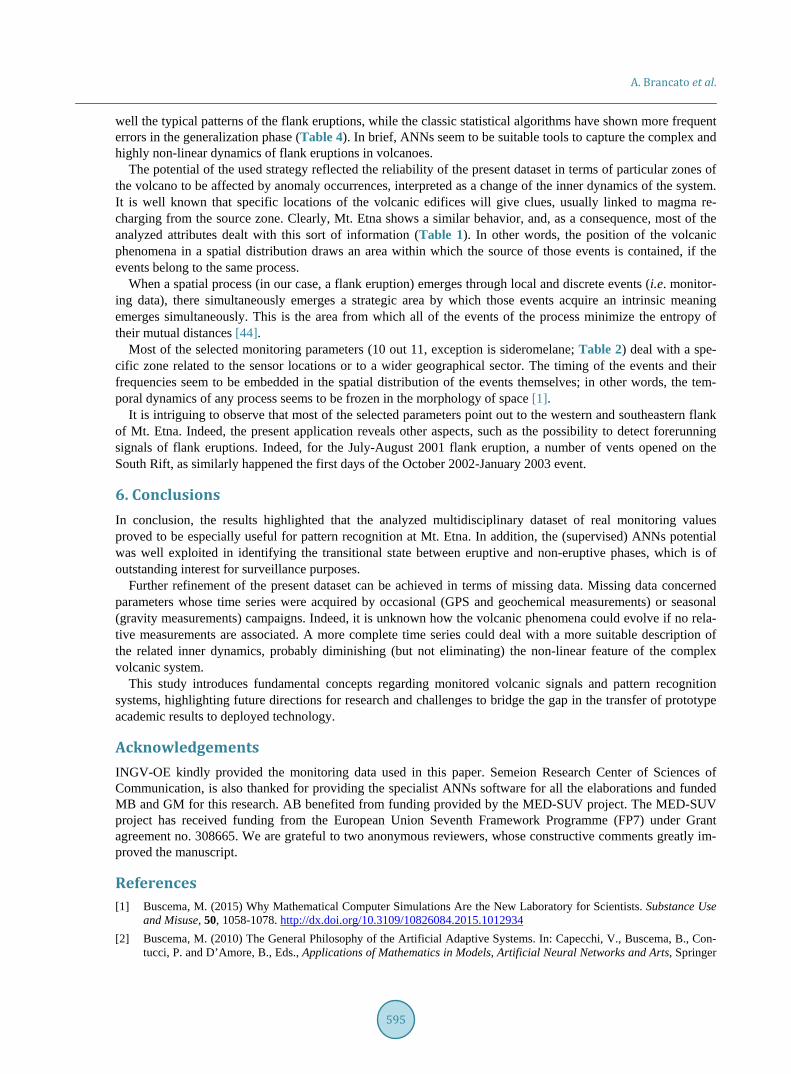
Table 4. Blind pattern recognition results of the 10 algorithms, after the application of 5 × 2 CV validation protocol. The arithmetic average column (in bold) stands for the average of the accuracy of classification in each class.
Algorithms Eruptiona No Eruptionb A. Meanc W. Meand Errore Var %f Software
FF_SVCm 0.9933 0.9896 0.9915 0.9903 7.8 0.46 Semeion
FF_Sn 0.9926 0.9886 0.9906 0.9893 8.6 0.59 Semeion
FF_Bp 0.9894 0.9918 0.9906 0.9913 7.0 0.44 Semeion
Random Forest 0.9767 0.9842 0.9804 0.9826 14.0 0.86 Weka
K-CM 0.9741 0.9852 0.9797 0.9829 13.6 0.54 Semeion
kNN 0.9528 0.9852 0.9690 0.9788 16.8 0.33 Weka
Bayest Net 0.9832 0.9505 0.9669 0.9567 34.4 0.84 Weka
SMO 0.9288 0.9888 0.9588 0.9772 18.1 0.47 Weka
Logistic 0.8457 0.9770 0.9114 0.9520 38.1 0.50 Weka
Naïve Bayes 0.4514 0.9784 0.7149 0.8777 96.9 0.96 Weka aEruption = Sensitivity; bNo Eruption = Specificity; cArithmetic Average; dWeigthted Average; eError = Average Number of Wrong Classification in the 10 training and testing tasks; fVar% = Percentage Variance of the 10 classifications. this work show sensitivity over 99% and specificity over 98%, as well as low misclassification estimates (Table 4).
The equivalent geophysical and volcano logical viewpoint is also noteworthy. Geochemical parameters prove the most predictive as associated to the target, showing the highest positive and the lowest negative values of LC coefficient (0.4498 and −0.3367 for the SO2 and CO2_P39 data, respectively; Table 2).
Both selected seismological parameters feature slightly negative LC (−0.0173 and −0.0244 for eqs_slab_Tyrr and eqs_NW_Sect, respectively; Table 2). Indeed, as reported in pertinent literature ([3] and reference therein), the residue parameters of the analyzed dataset feature the most predictive perspective for our target. These re-sults once again highlight that the eruption represented in the data follows a highly non-linear feature.
Conversely, the ground deformation parameters show positive LC (0.3479, 0.1207 and 0.2318 for dil_W, MtSil_Bocche1792 and MNR, respectively; Table 2), thus indicating that a relative increase is linked to higher probabilities of flank eruption occurrences.
Gravity data feature antithetic LC (0.1017 and −0.0966 for grav_FM4 and grav_PL, respectively; Table 2).
A. Brancato et al.
594
As stated before, gravity is closely correlated to local magma movements, hence a positive correlation could be associated to a magma restoration (higher probabilities of impending flank eruption), just as a negative correla-tion to a magma depletion (lower probabilities estimated for the present target).
Finally, the sideromelane parameter also features a negative LC (−0.0876), thus highlighting an antithetic correlation with the present target.
5. Discussion A pioneer pattern recognition analysis was successfully applied to the eruptive activity of Mt. Etna in early 1990s [40]. The authors characterized the role of the seismicity regional seismicity, mostly located in northern and northeastern Sicily, as important precursors in triggering Mt. Etna flank activity. Albeita longer investigated period (fifteen years of data), the dataset deals with a minimal source of information with respect to that used in this analysis. Indeed, the actual dataset embraces diversified monitoring fields to draw a vast interconnection. As a matter of fact, past and present results confirm that an operative prediction-oriented application of the recog-nized precursory patterns to feature flank activity at Mt. Etna is tentatively possible.
In recent years, pattern recognition analysis has been applied with the goal of classifying volcanic tremor data recorded at Mt. Etna and its relation to different regimes of volcanic activity [41] [42] and to integrate tremor data with SO2 flux [43]. In this study, for the first time, a pattern recognition task was performed at Mt. Etna by using different techniques, as well as a wide selection of ANNs and a large monitoring dataset. (Supervised) ANNs resolved the classification problems in terms of non-linear regression rather than linear discrimination, thus highlighting that a volcano is a complex system, whose spatio-time evolution is inferred as a natural adap-tive system.
The target of the present analysis was to understand how a monitoring dataset of independent attributes could be considered precursory of a flank eruption at Mt. Etna. The groundwork of volcano monitoring is the collec-tion of experimental physical data and their subsequent analysis and correlation with the associated hidden phe-nomena.
The dataset included multidisciplinary data collected during the January 2001-April 2005 period, during which the July-August 2001, October 2002-January 2003 and September 2004-April 2005 flank eruptions oc-curred, for a total of 301 eruptive days out of 1581. The present data were a revision of a pioneer usage of the relative values aimed at forecasting volcanic activity ([28] attributes in Table 1; [3]).
The interdisciplinary features of the data were not explored among the parameters, each being analyzed to-wards to the target (i.e. flank eruption at Mt. Etna). With this goal in mind, a preliminary application of the TWIST algorithm [5] selected the most predictive parameters. TWIST divided the original dataset into five pairs of subsets of data with a very similar probability density of distribution (Table 3). The selection worked on the minimal number of effective variables for pattern recognition, after estimating LC values. In this analysis, 11 (out of 28) variables were selected, with both positive and negative LC values (Table 2). Values of the included attributes better reflect the correlation with the locations of the anomalies occurrence, the relative variations be-ing in line with the timescale of a flank eruption at Mt. Etna. It was interesting to observe that among the 11 va-riables those attributes having a high LC with the eruptions were not selected; this could again outline that the eruption hidden among the data is a highly non-linear process.
The most predictive results were associated with geochemical fluxes, even though with antithetic LC values (0.4498 and −0.3367, for SO2 and CO2_P39, respectively). Results inferred that an impending flank eruption at Mt. Etna was preceded by an increase of SO2 emission, as well a decrease of CO2_P39 degassing. Both SO2 and CO2 emissions have been observed as mid-term (months) precursory of the flank activity at Mt. Etna and asso-ciated to changes in the states of the magmatic gases exsolved from the magma at depth [3]. Crater SO2 fluxes showed decreases during inter-eruptive periods, followed by increasing trends until the eruptions [3]. Converse-ly, decreases in the soil CO2_P39 were observed during magma shallower intrusions in the days preceding flank eruptions [3].
The other selected attributes showed lower LC values (both positive and negative) with the target. Even though a significant correlation, anomaly variations are associated with weak signals and/or to slow changes (i.e. increases or decreases display in the relative time series).
We have tested different MLs and different types of ANNs on the selected data in 100 experiments (10 inde-pendent training and testing phase for each of the 10 algorithms). Most ANNs have proved to understand fairly
A. Brancato et al.
595
well the typical patterns of the flank eruptions, while the classic statistical algorithms have shown more frequent errors in the generalization phase (Table 4). In brief, ANNs seem to be suitable tools to capture the complex and highly non-linear dynamics of flank eruptions in volcanoes.
The potential of the used strategy reflected the reliability of the present dataset in terms of particular zones of the volcano to be affected by anomaly occurrences, interpreted as a change of the inner dynamics of the system. It is well known that specific locations of the volcanic edifices will give clues, usually linked to magma re-charging from the source zone. Clearly, Mt. Etna shows a similar behavior, and, as a consequence, most of the analyzed attributes dealt with this sort of information (Table 1). In other words, the position of the volcanic phenomena in a spatial distribution draws an area within which the source of those events is contained, if the events belong to the same process.
When a spatial process (in our case, a flank eruption) emerges through local and discrete events (i.e. monitor-ing data), there simultaneously emerges a strategic area by which those events acquire an intrinsic meaning emerges simultaneously. This is the area from which all of the events of the process minimize the entropy of their mutual distances [44].
Most of the selected monitoring parameters (10 out 11, exception is sideromelane; Table 2) deal with a spe-cific zone related to the sensor locations or to a wider geographical sector. The timing of the events and their frequencies seem to be embedded in the spatial distribution of the events themselves; in other words, the tem-poral dynamics of any process seems to be frozen in the morphology of space [1].
It is intriguing to observe that most of the selected parameters point out to the western and southeastern flank of Mt. Etna. Indeed, the present application reveals other aspects, such as the possibility to detect forerunning signals of flank eruptions. Indeed, for the July-August 2001 flank eruption, a number of vents opened on the South Rift, as similarly happened the first days of the October 2002-January 2003 event.
6. Conclusions In conclusion, the results highlighted that the analyzed multidisciplinary dataset of real monitoring values proved to be especially useful for pattern recognition at Mt. Etna. In addition, the (supervised) ANNs potential was well exploited in identifying the transitional state between eruptive and non-eruptive phases, which is of outstanding interest for surveillance purposes.
Further refinement of the present dataset can be achieved in terms of missing data. Missing data concerned parameters whose time series were acquired by occasional (GPS and geochemical measurements) or seasonal (gravity measurements) campaigns. Indeed, it is unknown how the volcanic phenomena could evolve if no rela-tive measurements are associated. A more complete time series could deal with a more suitable description of the related inner dynamics, probably diminishing (but not eliminating) the non-linear feature of the complex volcanic system.
This study introduces fundamental concepts regarding monitored volcanic signals and pattern recognition systems, highlighting future directions for research and challenges to bridge the gap in the transfer of prototype academic results to deployed technology.
Acknowledgements INGV-OE kindly provided the monitoring data used in this paper. Semeion Research Center of Sciences of Communication, is also thanked for providing the specialist ANNs software for all the elaborations and funded MB and GM for this research. AB benefited from funding provided by the MED-SUV project. The MED-SUV project has received funding from the European Union Seventh Framework Programme (FP7) under Grant agreement no. 308665. We are grateful to two anonymous reviewers, whose constructive comments greatly im-proved the manuscript.
References [1] Buscema, M. (2015) Why Mathematical Computer Simulations Are the New Laboratory for Scientists. Substance Use
and Misuse, 50, 1058-1078. http://dx.doi.org/10.3109/10826084.2015.1012934 [2] Buscema, M. (2010) The General Philosophy of the Artificial Adaptive Systems. In: Capecchi, V., Buscema, B., Con-
tucci, P. and D’Amore, B., Eds., Applications of Mathematics in Models, Artificial Neural Networks and Arts, Springer

A. Brancato et al.
596
Science+Business Media, 197-226. http://dx.doi.org/10.1007/978-90-481-8581-8_10 [3] Brancato, A., Gresta, S., Alparone, S., Andronico, D., Bonforte, A., Caltabiano, T., Cocina, O., Corsaro, R.A., Cristo-
folini, R., Di Grazia, G., Distefano, G., Ferlito, C., Gambino, S., Giammanco, S., Greco, F., Marzocchi, W., Napoli, R., Sandri, L., Selva, J., Tusa, G. and Viccaro, M. (2011) BET_EF Application at Mount Etna: A Retrospective Analysis (Years 2001-2005). Annals of Geophysics, 54, 642-661.
[4] Mader, H.M. (2006) Volcanic Processes as a Source of Statistical Data. In: Mader, H.M., Coles, S.G., Connor, C.B. and Connor, L.J., Eds., Statistics in Volcanology, Special Publications of IAVCEI, Geological Society, London, 1-14.
[5] Buscema, M. (2004) Genetic Doping Algorithm (GenD): Theory and Application. Expert Systems, 21, 63-79. http://dx.doi.org/10.1111/j.1468-0394.2004.00264.x
[6] Buscema, M., Breda, M. and Lodwick, W. (2013) Training with Input Selection and Testing (TWIST) Algorithm: A Significant Advance in Pattern Recognition Performance of Machine Learning. Journal of Intelligent Learning Systems and Applications, 5, 29-38. http://dx.doi.org/10.4236/jilsa.2013.51004
[7] Buscema, M., Grossi, E., Intraligi, M., Garbagna, N., Andriulli, A. and Breda, M. (2005) An Optimized Experimental Protocol Based on Neuro-Evolutionary Algorithms. Application to the Classification of Dyspeptic Patients and to the Prediction of the Effectiveness of Their Treatment. Artificial Intelligence in Medicine, 34, 279-305. http://dx.doi.org/10.1016/j.artmed.2004.12.001
[8] Penco, S., Grossi, E., Cheng, S., Intraligi, M., Maurelli, G., Patrosso, M.C., Marocchi, A. and Buscema, M. (2005) As-sessment of the Role of Genetic Polymorphism in Venous Thrombosis through Artificial Neural Networks. Annals of Human Genetics, 69, 693-706. http://dx.doi.org/10.1111/j.1529-8817.2005.00206.x
[9] Grossi, E., Mancini, A. and Buscema, M. (2007) International Experience on the Use of Artificial Neural Networks in Gastroenterology. Digestive and Liver Disease, 39, 278-285. http://dx.doi.org/10.1016/j.dld.2006.10.003
[10] Grossi, E. and Buscema, M. (2007) Introduction to Artificial Neural Networks. European Journal of Gastroenterology & Hepatology, 19, 1046-1054. http://dx.doi.org/10.1097/MEG.0b013e3282f198a0
[11] Grossi, E., Marmo, R., Intraligi, M. and Buscema, M. (2008) Artificial Neural Networks for Early Prediction of Mor-tality in Patients with Non-Variceal Upper GI Bleeding. Medical Informatics Insights, 1, 7-19.
[12] Lahner, E., Intraligi, M., Buscema, M., Centanni, M., Vannella, L., Grossi, E. and Annibale, B. (2008) Artificial Neural Networks in the Recognition of the Presence of Thyroid Disease in Patients with Atrophic Body Gastritis. World Journal of Gastroenterology, 14, 563-568. http://dx.doi.org/10.3748/wjg.14.563
[13] Penco, S., Buscema, M., Patrosso, M.C., Marocchi, A. and Grossi, E. (2008) New Application of Intelligent Agents in Sporadic Amyotrophic Lateral Sclerosis Identifies Unexpected Specific Genetic Background. BMC Bioinformatics, 9, 254. http://dx.doi.org/10.1186/1471-2105-9-254
[14] Street, M.E., Grossi, E., Volta, C., Faleschini, E. and Bernasconi, S. (2008) Placental Determinants of Fetal Growth: Identification of Key Factors in the Insulin-Like Growth Factor and Cytokine Systems Using Artificial Neural Net-works. BMC Pediatrics, 8, 24. http://dx.doi.org/10.1186/1471-2431-8-24
[15] Buri, L., Hassan, C., Bersani, G., Anti, M., Bianco, M.A., Cipolletta, L., Di Giulio, E., Di Matteo, G., Familiari, L., Ficano, L., Loriga, P., Morini, S., Pietropaolo, V., Zambelli, A., Grossi, E., Intraligi, M., Buscema, M. and SIED Ap-propriateness Working Group (2010) Appropriateness Guidelines and Predictive Rules to Select Patients for Upper Endoscopy: A Nationwide Multicenter Study. American Journal of Gastroenterology, 105, 1327-1337. http://dx.doi.org/10.1038/ajg.2009.675
[16] Buscema, M., Grossi, E., Capriotti, M., Babiloni, C. and Rossini, P.M. (2010) The I.F.A.S.T. Model Allows the Pre-diction of Conversion to Alzheimer Disease in Patients with Mild Cognitive Impairment with High Degree of Accura-cy, Current Alzheimer Research. Current Alzheimer Research, 7, 173-187. http://dx.doi.org/10.2174/156720510790691137
[17] Pace, F., Riegler, G., de Leone, A., Pace, M., Cestari, R., Dominici, P., Grossi, E. and EMERGE Study Group (2010) Is It Possible to Clinically Differentiate Erosive from Nonerosive Reflux Disease Patients? A Study Using an Artificial Neural Networks-Assisted Algorithm. European Journal of Gastroenterology & Hepatology, 22, 1163-1168. http://dx.doi.org/10.1097/MEG.0b013e32833a88b8
[18] Coppedè, F., Grossi, E., Migheli, F. and Migliore, L. (2010) Polymorphisms in Folate-Metabolizing Genes, Chromo-some Damage, and Risk of Down Syndrome in Italian Women: Identification of Key Factors Using Artificial Neural Networks. BMC Medical Genomics, 3, 42. http://dx.doi.org/10.1186/1755-8794-3-42
[19] Rotondano, G., Cipolletta, L. and Grossi, E. (2011) Artificial Neural Networks Accurately Predict Mortality in Patients with Nonvariceal Upper GI Bleeding. Gastrointestinal Endoscopy, 73, 218-226. http://dx.doi.org/10.1016/j.gie.2010.10.006
[20] Frank, A. and Asuncion, A. (2010) UCI Machine Learning Repository. http://archive.ics.uci.edu/ml [21] Dietterich, T.G. (1998) Approximate Statistical Test for Comparing Supervised Classification Learning Algorithm.

A. Brancato et al.
597
Neural Computation, 10, 1895-1924. http://dx.doi.org/10.1162/089976698300017197 [22] Hastie, T., Tibshirani, R. and Friedman, J.H. (2009) The Elements of Statistical Learning: Data Mining, Inference, and
Prediction. Springer-Verlag, New York. http://dx.doi.org/10.1007/978-0-387-84858-7 [23] Buscema, P.M. and Benzi, R. (2011) Quakes Prediction Using Highly Non-Linear Systems and a Minimal Dataset. In:
Buscema, P.M. and Ruggieri, M., Eds., Advanced Networks, Algorithms and Modeling for Earthquake Prediction, River Publishers, Aalborg, 41-66.
[24] Buscema, P.M., Massini, G. and Maurelli, G. (2015) Artificial Adaptive Systems to Predict the Magnitude of Earth-quakes. Bollettino di Geofisica Teorica ed Applicata, 56, 227-256.
[25] Buscema, M., Terzi, S. and Breda, M. (2006) Using Sinusoidal Modulated Weights Improve Feed-Forward Neural Network Performances in Classification and Functional Approximation Problems. WSEAS Transactions on Informa-tion Science & Applications, 3, 885-893.
[26] Le Cun, Y., Bottou, L., Orr, G.B. and Muller, K.R. (1998) Efficient BackProp. In: Orr, G. and Muller, K.R., Eds., Neural Networks: Tricks of the Trade, Springer, New York, 9-50. http://dx.doi.org/10.1007/3-540-49430-8_2
[27] Buscema, M., Consonni, V., Ballabio, D., Mauri, A., Massini, G., Breda, M. and Todeschini, R. (2014) K-CM: A New Artificial Neural Network. Application to Supervised Pattern Recognition. Chemometrics and Intelligent Laboratory Systems, 138, 110-119. http://dx.doi.org/10.1016/j.chemolab.2014.06.013
[28] Breiman, L., Friedman, J.H., Olshen, R.A. and Stone, C.J. (1984) Classification and Regression Trees. Wadsworth In-ternational Group, Belmont.
[29] Breiman, L. (2001) Random Forest. Machine Learning, 45, 5-32. http://dx.doi.org/10.1023/A:1010933404324 [30] Aha, D.W., Kibler, D. and Albert, M.K. (1991) Instance-Based Learning Algorithms. Machine Learning, 6, 37-66.
http://dx.doi.org/10.1007/BF00153759 [31] Platt, J. (1998) Fast Training of Support Vector Machines Using Sequential Minimal Optimization. In: Schoelkopf, B.,
Burges, C.J.C. and Smola, A.J., Eds., Advances in Kernel Methods—Support Vector Learning, MIT Press, Cambridge, 41-65.
[32] Keerthi, S.S., Shevade, S.K., Bhattacharyya, C. and Murthy, K.R.-K. (2001) Improvements to Platt’s SMO Algorithm for SVM Classifier Design. Neural Computation, 13, 637-649. http://dx.doi.org/10.1162/089976601300014493
[33] Keerthi, S.S. and Gilbert, E.G. (2002) Convergence of a Generalized SMO Algorithm for SVM Classifier Design. Machine Learning, 46, 351-360. http://dx.doi.org/10.1023/A:1012431217818
[34] Cessie, S. and Van Houwelingen, J.C. (1992) Ridge Estimators in Logistic Regression. Applied Statistics, 41, 191-201. http://dx.doi.org/10.2307/2347628
[35] Friedman, N., Geiger, D. and Goldszmidt, M. (1997) Bayesian Networks Classifiers. Machine Learning, 29, 131-163. http://dx.doi.org/10.1023/A:1007465528199
[36] Zhang, H. (2004) The Optimality of Naive Bayes. Proceedings of 17th International Florida Artificial Intelligence Research Society Conference, Menlo Park, 12-14 May 2004, 562-567.
[37] Hall, M., Frank, E., Holmes, G., Pfahringer, B., Reutemann, P. and Witten, I.H. (2009) The WEKA Data Mining Soft-ware: An Update. ACM SIGKDD Explorations Newsletter, 11, 10-18. http://dx.doi.org/10.1145/1656274.1656278
[38] Buscema, M. (2006-2013) TWIST—Input Search and T&T Reverse. Semeion Software 39, Version 4.5. www.semeion.it
[39] Buscema, M. (1999-2015) Supervised ANNs and Organisms. Semeion Software 12, Version 25.0. www.semeion.it [40] Mulargia, F., Gasperini, P. and Marzocchi, W. (1991) Pattern Recognition Applied to Vo1canic Activity: Identification
of the Precursory Patterns to Etna Recent Flank Eruptions and Periods of Rest. Journal of Volcanology and Geother-mal Research, 45, 187-196. http://dx.doi.org/10.1016/0377-0273(91)90058-8
[41] Langer, H., Falsaperla, S., Masotti, M., Campanini, R., Spampinato, S. and Messina, A. (2009) Synopsis of Supervised and Unsupervised Pattern Classification Techniques Applied to Volcanic Tremor Data at Mt Etna, Italy. Geophysiscal Journal International, 178, 1132-114. http://dx.doi.org/10.1111/j.1365-246X.2009.04179.x
[42] Masotti, M., Falsaperla, S., Langer, H., Spampinato, S. and Campanini, R. (2006) Application of Support Vector Ma-chine to the Classification of Volcanictremor at Etna, Italy. Geophisical Research Letters, 33, Article ID: L20304.
[43] Falsaperla, S., Behncke, B., Langer, H., Neri, M., Salerno, G.G., Giammanco, S., Pecora, E. and Biale, E. (2014) “Failed” Eruptions Revealed by Pattern Classification Analysisof Gas Emission and Volcanic Tremor Data at Mt. Etna, Italy. International Journal of Earth Science, 103, 297-313. http://dx.doi.org/10.1007/s00531-013-0964-7
[44] Buscema, M., Grossi, E., Bronstein, A., Lodwick, W., Asadi-Zeydabadi, M., Benzi, R. and Newman, F. (2013) A New Algorithm for Identifying Possible Epidemic Sources with Application to the German Escherichia Coli Outbreak. In-ternational Journal of Geo-Information, 2, 155-200. http://dx.doi.org/10.3390/ijgi2010155

Submit or recommend next manuscript to SCIRP and we will provide best service for you: Accepting pre-submission inquiries through Email, Facebook, LinkedIn, Twitter, etc. A wide selection of journals (inclusive of 9 subjects, more than 200 journals) Providing 24-hour high-quality service User-friendly online submission system Fair and swift peer-review system Efficient typesetting and proofreading procedure Display of the result of downloads and visits, as well as the number of cited articles Maximum dissemination of your research work
Submit your manuscript at: http://papersubmission.scirp.org/