Embed Size (px)
Citation preview
Patterns of Agricultural Adaptation at the Rural-Urban
Interface (RUI)Doug Jackson-Smith, Utah State University
Jill Clark, Jeff S. Sharp, Shoshanah Inwood, Ohio State University
This project was supported by the National Research Initiative of the Cooperative State Research, Education and Extension Service, USDA, Grant # 2005-35401-15272
Challenges Faced by U.S. Farmers
COST-PRICE SQUEEZE Declining commodity prices Rising input costs Technological treadmill
DEMOGRAPHICS Aging population; declining rates of farm entry
POLICY SHIFTS Food safety & environmental regulations
CLIMATE CHANGE, WATER SHORTAGES
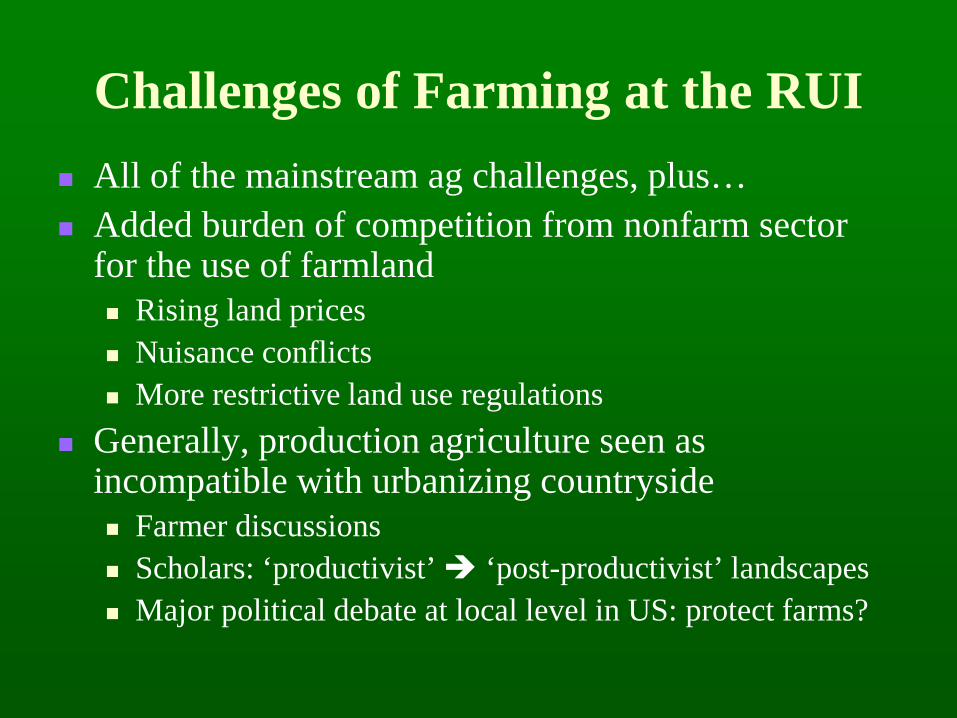
Challenges of Farming at the RUI All of the mainstream ag challenges, plus… Added burden of competition from nonfarm sector
for the use of farmland Rising land prices Nuisance conflicts More restrictive land use regulations
Generally, production agriculture seen as incompatible with urbanizing countryside Farmer discussions Scholars: ‘productivist’ ‘post-productivist’ landscapes Major political debate at local level in US: protect farms?
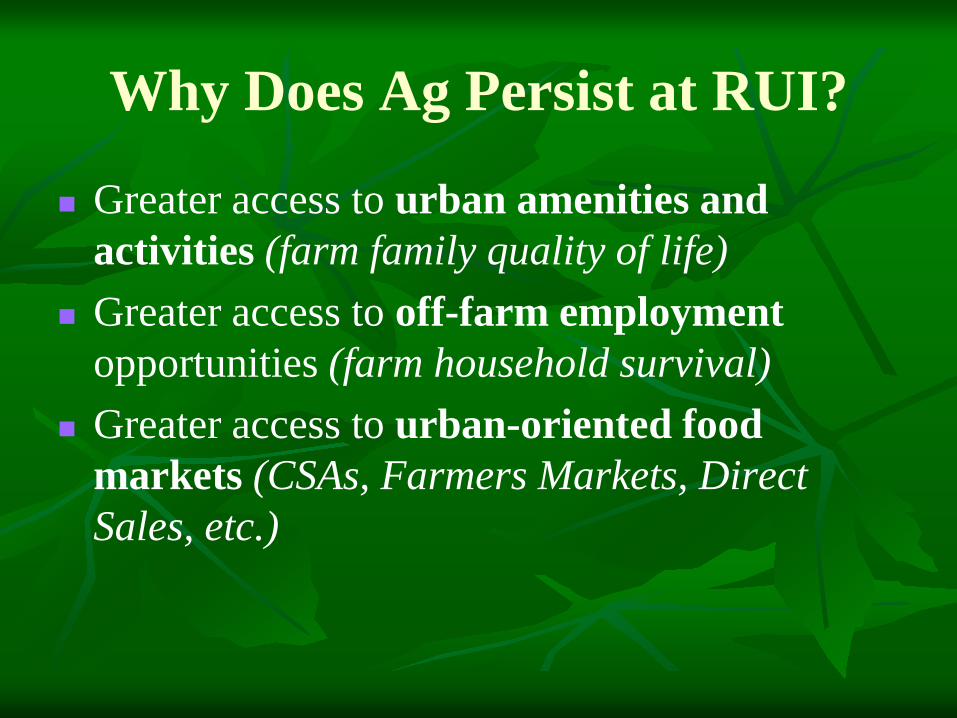
Why Does Ag Persist at RUI?
Greater access to urban amenities and activities (farm family quality of life)
Greater access to off-farm employmentopportunities (farm household survival)
Greater access to urban-oriented food markets (CSAs, Farmers Markets, Direct Sales, etc.)
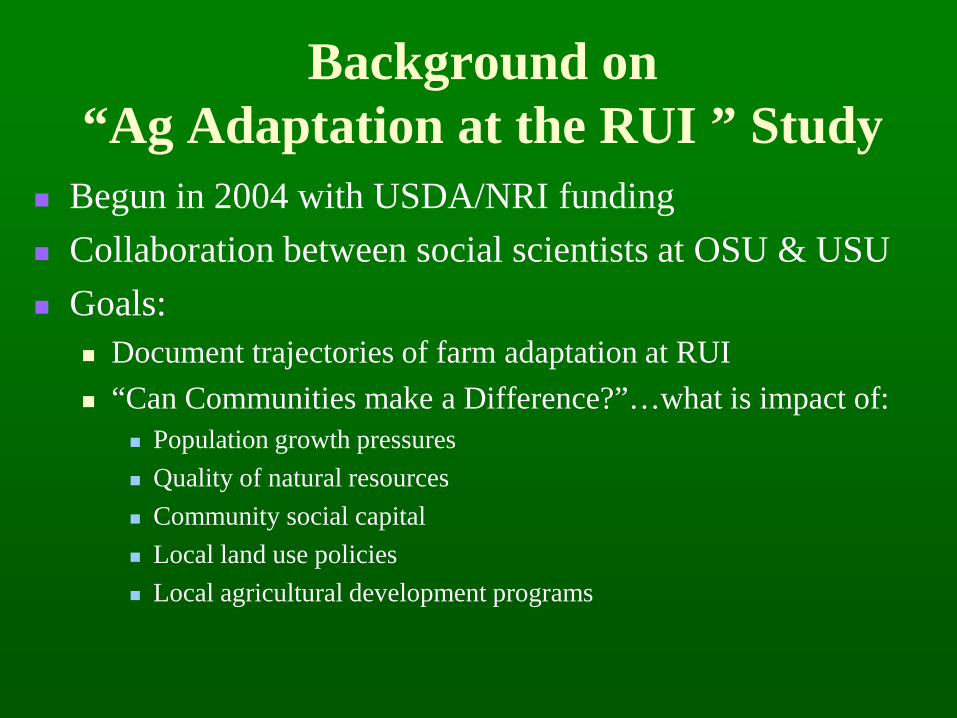
Background on “Ag Adaptation at the RUI ” Study
Begun in 2004 with USDA/NRI funding Collaboration between social scientists at OSU & USU Goals:
Document trajectories of farm adaptation at RUI “Can Communities make a Difference?”…what is impact of:
Population growth pressures Quality of natural resources Community social capital Local land use policies Local agricultural development programs
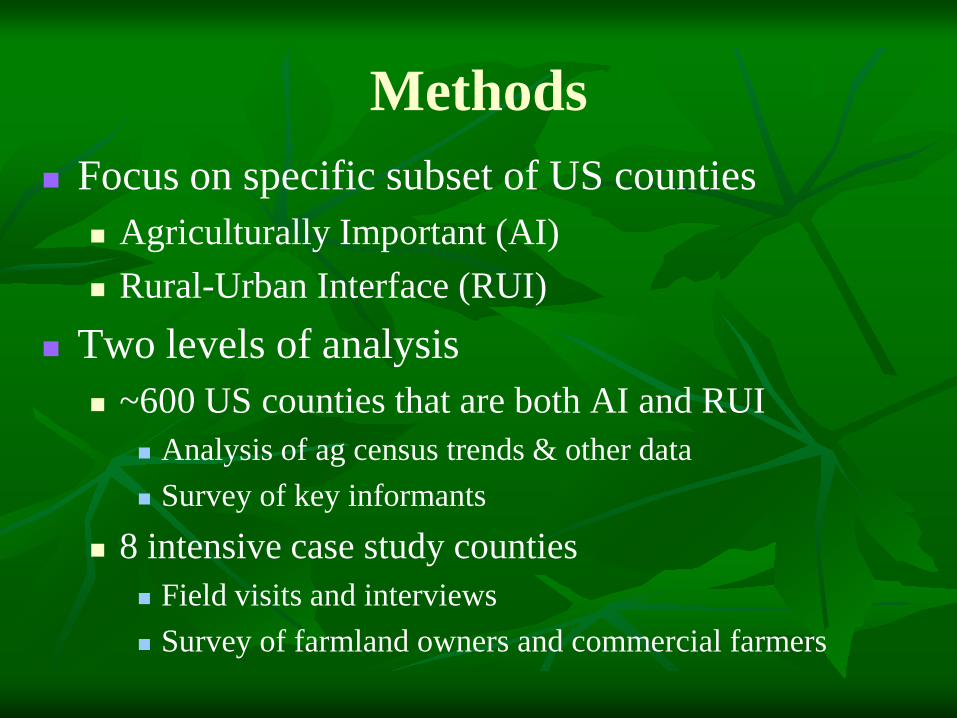
Methods Focus on specific subset of US counties
Agriculturally Important (AI) Rural-Urban Interface (RUI)
Two levels of analysis ~600 US counties that are both AI and RUI
Analysis of ag census trends & other data Survey of key informants
8 intensive case study counties Field visits and interviews Survey of farmland owners and commercial farmers
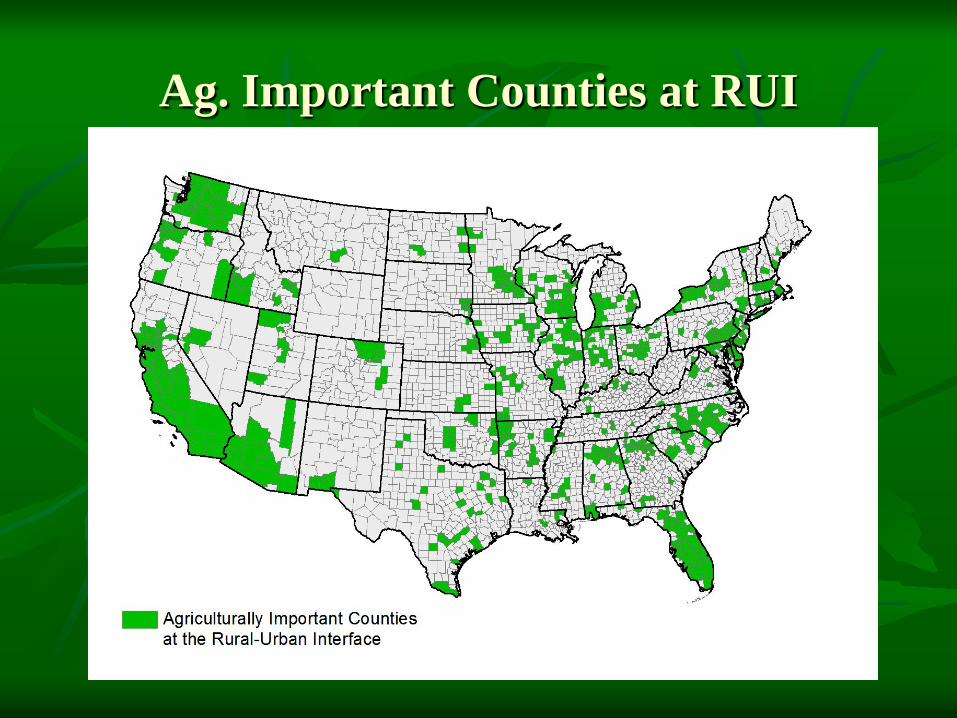
Ag. Important Counties at RUI
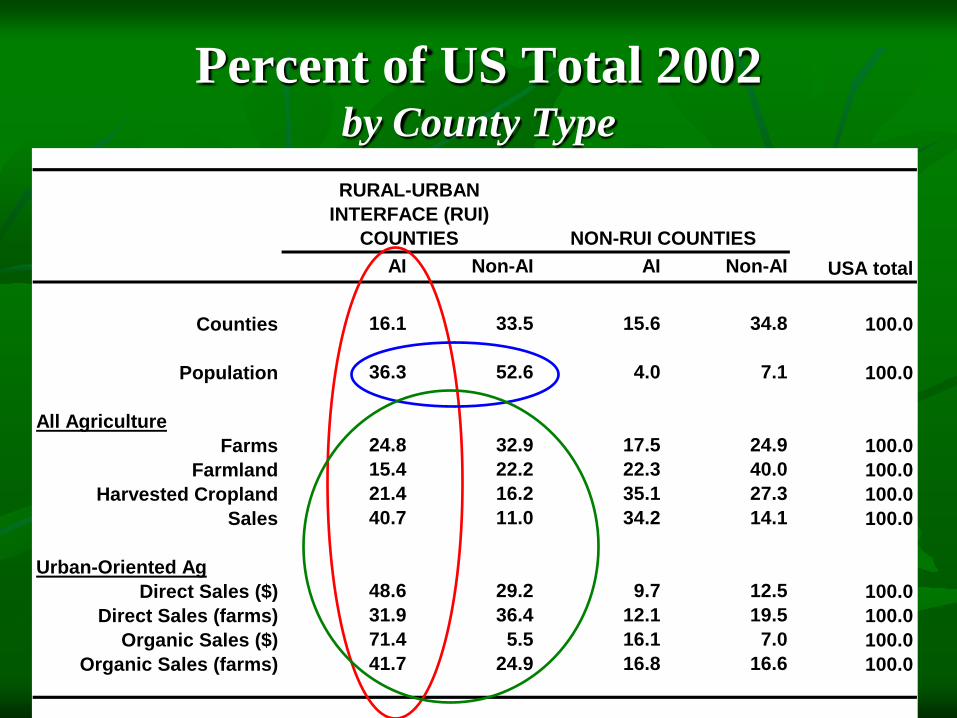
AI Non-AI AI Non-AI USA total
Counties 16.1 33.5 15.6 34.8 100.0
Population 36.3 52.6 4.0 7.1 100.0
All AgricultureFarms 24.8 32.9 17.5 24.9 100.0
Farmland 15.4 22.2 22.3 40.0 100.0Harvested Cropland 21.4 16.2 35.1 27.3 100.0
Sales 40.7 11.0 34.2 14.1 100.0
Urban-Oriented AgDirect Sales ($) 48.6 29.2 9.7 12.5 100.0
Direct Sales (farms) 31.9 36.4 12.1 19.5 100.0Organic Sales ($) 71.4 5.5 16.1 7.0 100.0
Organic Sales (farms) 41.7 24.9 16.8 16.6 100.0
RURAL-URBAN INTERFACE (RUI)
COUNTIES NON-RUI COUNTIES
Percent of US Total 2002by County Type
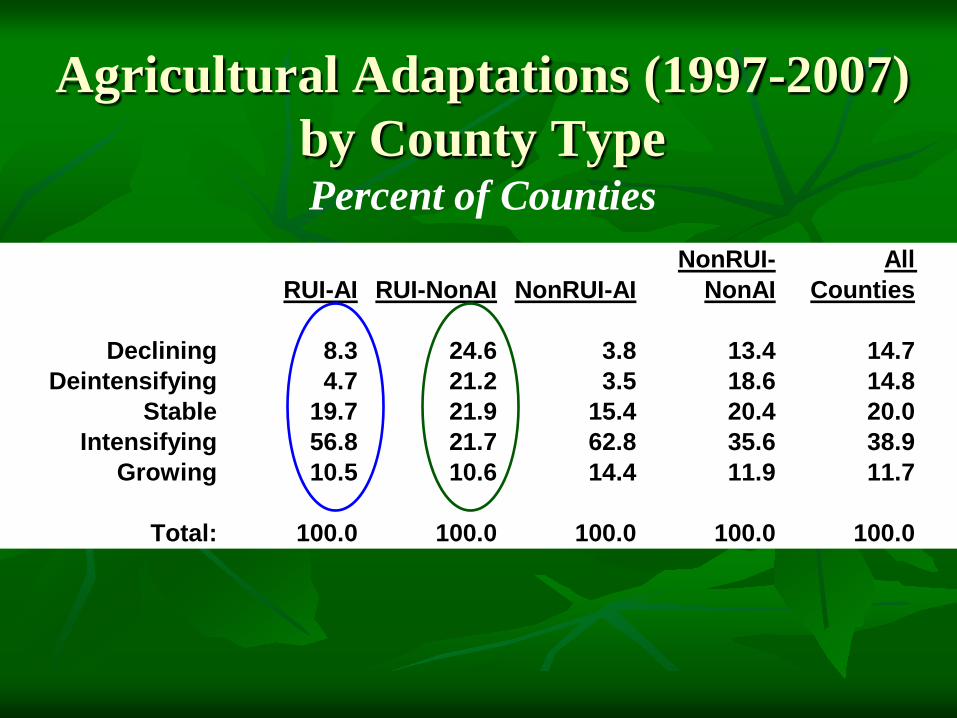
Agricultural Adaptations (1997-2007)by County TypePercent of Counties
RUI-AI RUI-NonAI NonRUI-AINonRUI-
NonAIAll
Counties
Declining 8.3 24.6 3.8 13.4 14.7Deintensifying 4.7 21.2 3.5 18.6 14.8
Stable 19.7 21.9 15.4 20.4 20.0Intensifying 56.8 21.7 62.8 35.6 38.9
Growing 10.5 10.6 14.4 11.9 11.7
Total: 100.0 100.0 100.0 100.0 100.0
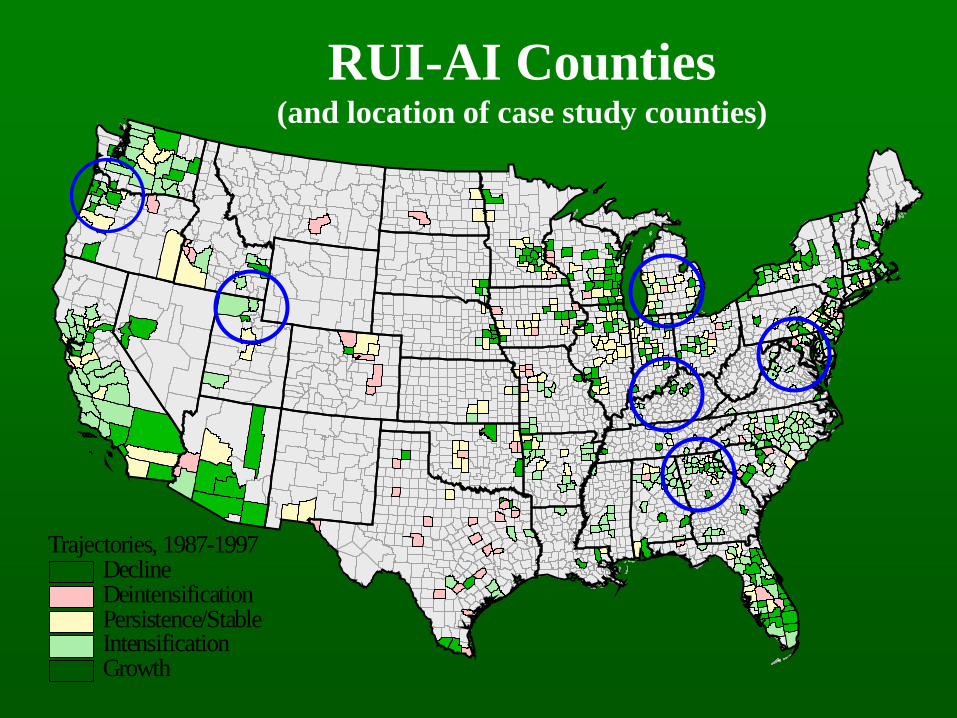
Trajectories, 1987-1997DeclineDeintensificationPersistence/StableIntensificationGrowth
RUI-AI Counties(and location of case study counties)

Agricultural Trajectories in Case Study Sites, 1987-2002
CountyFARM SALES
TRENDS FARMLAND TRENDSFARM NUMBER
TRENDS
Yamhill, OR GROWTH GROWTH GROWTH
Kent, MI GROWTH DECLINE DECLINE
Shelby, KY DECLINE STABLE STABLE
Hall, GA STABLE STABLE STABLE
Spencer, KY DECLINE STABLE DECLINE
Cache, UT STABLE DECLINE DECLINE
Frederick, MD DECLINE DECLINE STABLE
Forsyth, GA DECLINE DECLINE DECLINE
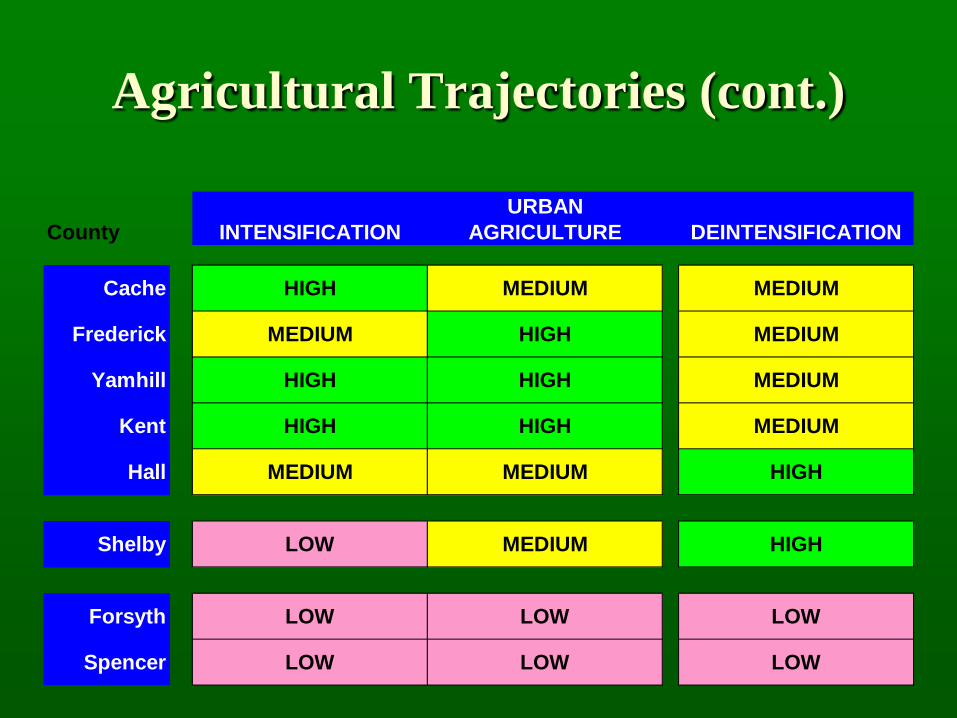
Agricultural Trajectories (cont.)
County INTENSIFICATIONURBAN
AGRICULTURE DEINTENSIFICATION
Cache HIGH MEDIUM MEDIUM
Frederick MEDIUM HIGH MEDIUM
Yamhill HIGH HIGH MEDIUM
Kent HIGH HIGH MEDIUM
Hall MEDIUM MEDIUM HIGH
Shelby LOW MEDIUM HIGH
Forsyth LOW LOW LOW
Spencer LOW LOW LOW
Results of Farmer & Landowner Surveys(random sample of 372 farms
across the 8 sites)
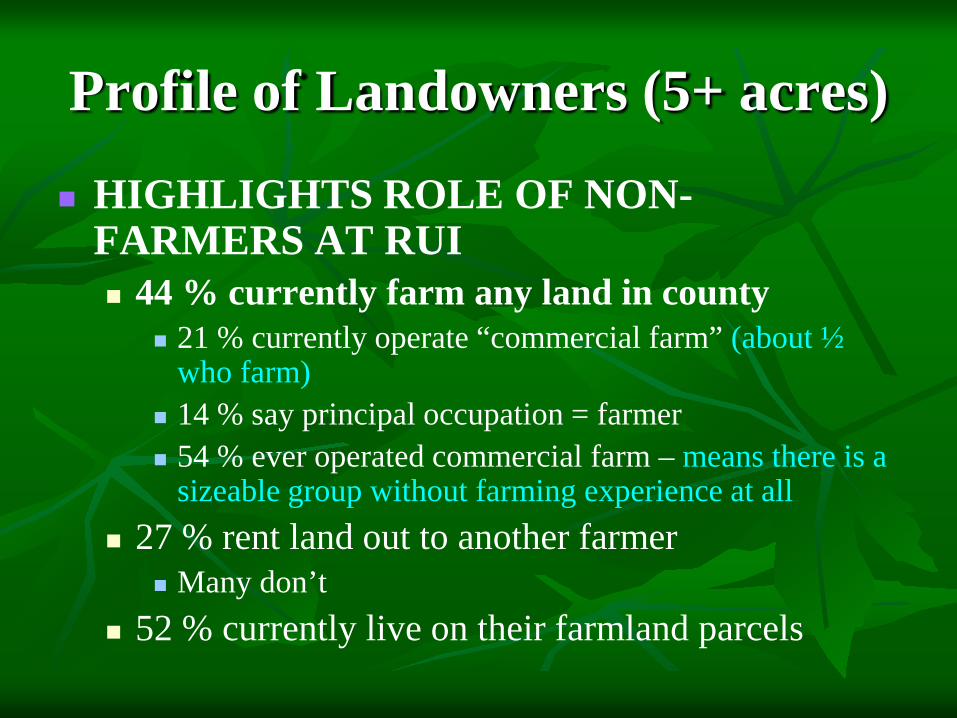
Profile of Landowners (5+ acres)
HIGHLIGHTS ROLE OF NON-FARMERS AT RUI 44 % currently farm any land in county
21 % currently operate “commercial farm” (about ½ who farm)
14 % say principal occupation = farmer 54 % ever operated commercial farm – means there is a
sizeable group without farming experience at all 27 % rent land out to another farmer
Many don’t 52 % currently live on their farmland parcels

Profile of Farming Landowners
FARM SIZE 28 % operate < 40 acres 44 % > 160 acres
ANNUAL FARM SALES 30 % sold < $10,000 36 % > $100,000
Reliance on farm income – wide range 42 % “very little income from farming” 34 % most household income from farming
About half had someone working off-farm About a third hired Latino workers
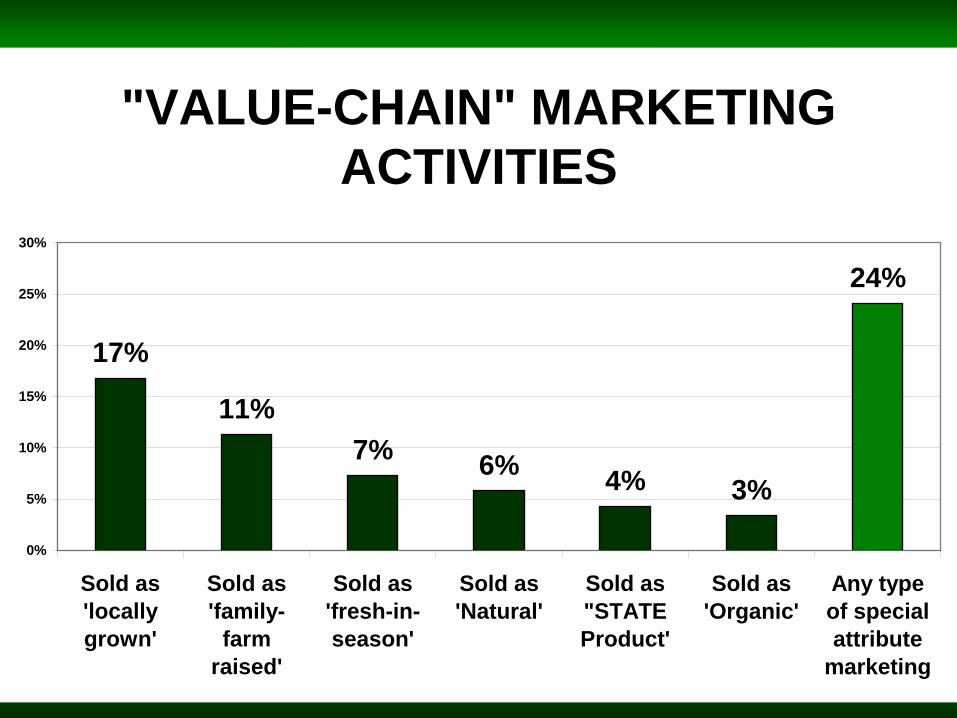
"VALUE-CHAIN" MARKETING ACTIVITIES
17%
11%7% 6% 4% 3%
24%
0%
5%
10%
15%
20%
25%
30%
Sold as'locallygrown'
Sold as'family-
farmraised'
Sold as'fresh-in-season'
Sold as'Natural'
Sold as"STATEProduct'
Sold as'Organic'
Any typeof specialattribute
marketing
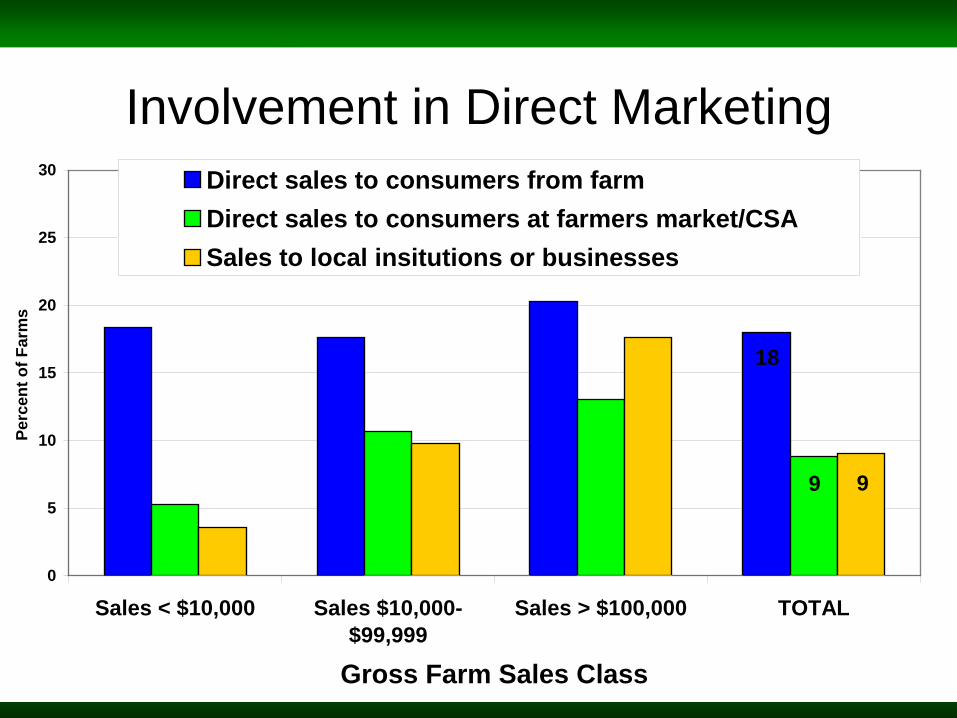
Involvement in Direct Marketing
18
9 9
0
5
10
15
20
25
30
Sales < $10,000 Sales $10,000-$99,999
Sales > $100,000 TOTAL
Gross Farm Sales Class
Perc
ent o
f Far
ms
Direct sales to consumers from farmDirect sales to consumers at farmers market/CSASales to local insitutions or businesses
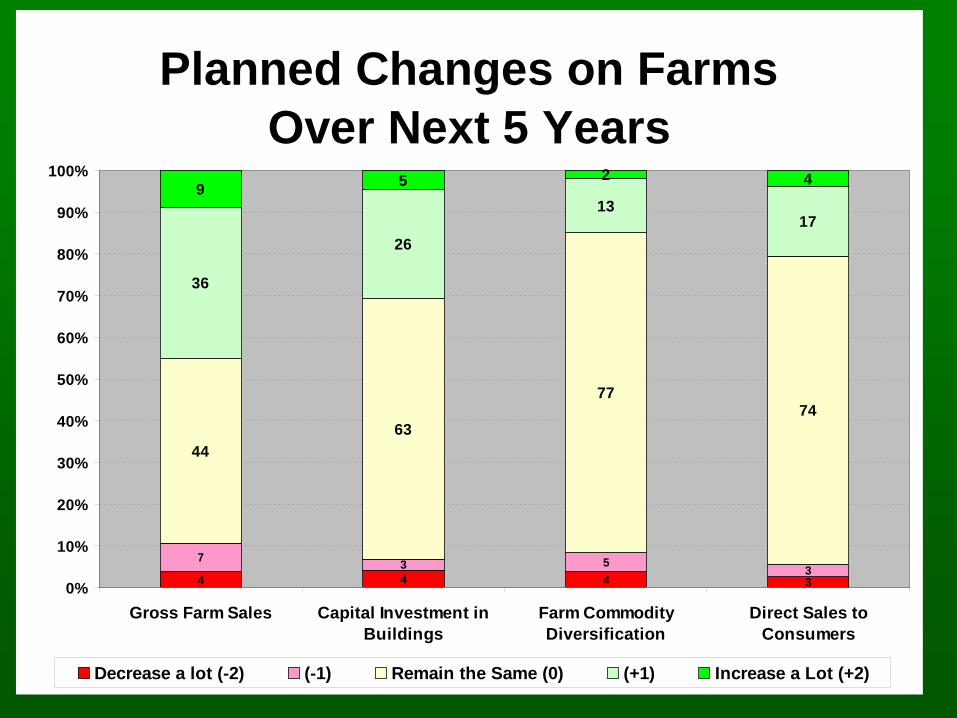
Planned Changes on Farms Over Next 5 Years
4 4 4 3
7 3 5 3
4463
7774
36
26
1317
9 5 2 4
0%
10%
20%
30%
40%
50%
60%
70%
80%
90%
100%
Gross Farm Sales Capital Investment inBuildings
Farm CommodityDiversification
Direct Sales toConsumers
Decrease a lot (-2) (-1) Remain the Same (0) (+1) Increase a Lot (+2)
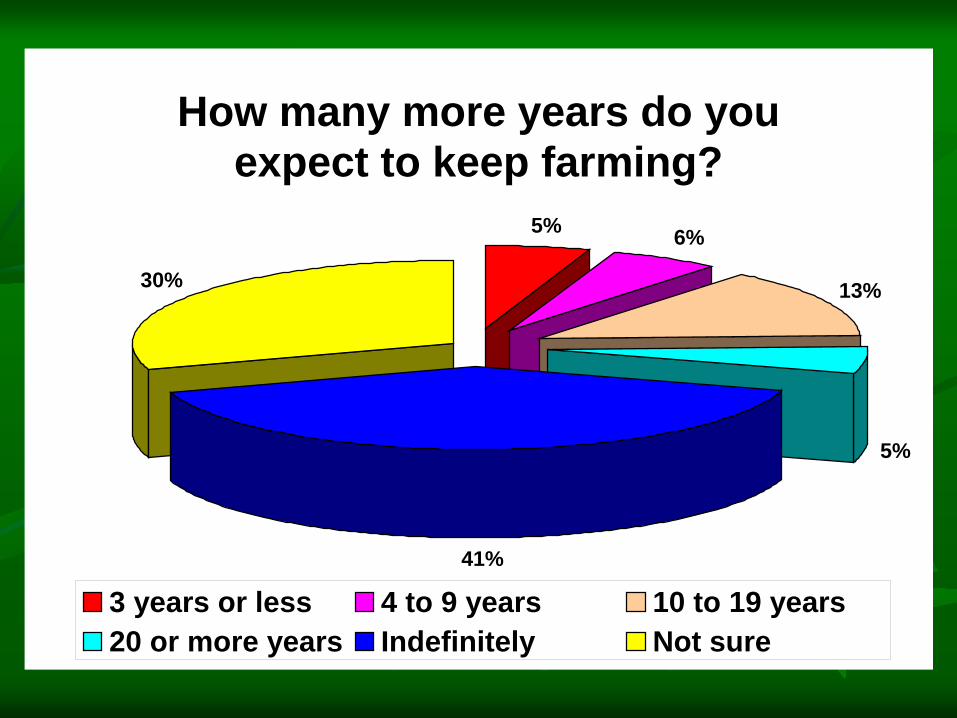
How many more years do you expect to keep farming?
5% 6%
13%
5%
41%
30%
3 years or less 4 to 9 years 10 to 19 years20 or more years Indefinitely Not sure
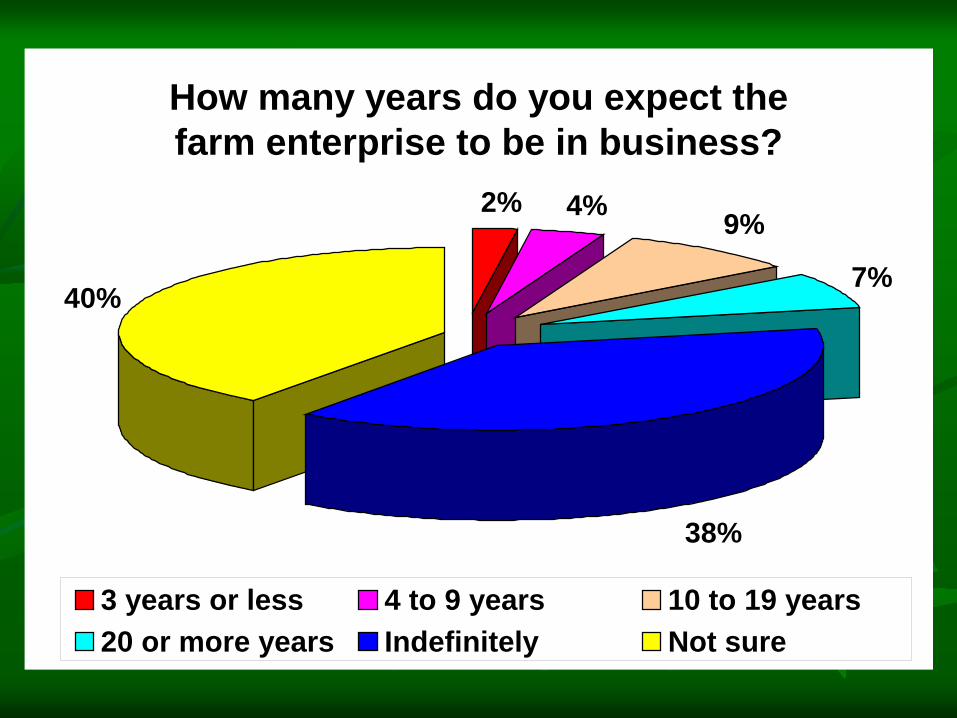
How many years do you expect the farm enterprise to be in business?
2% 4% 9%
7%
38%
40%
3 years or less 4 to 9 years 10 to 19 years20 or more years Indefinitely Not sure

What are your plans for passing on your farm?
There is a potential
successor, 33%
I have identified a successor,
36%There is no successor
available, 5%
Not applicable; too early to tell,
15%
No obvious person; plans are uncertain,
11%
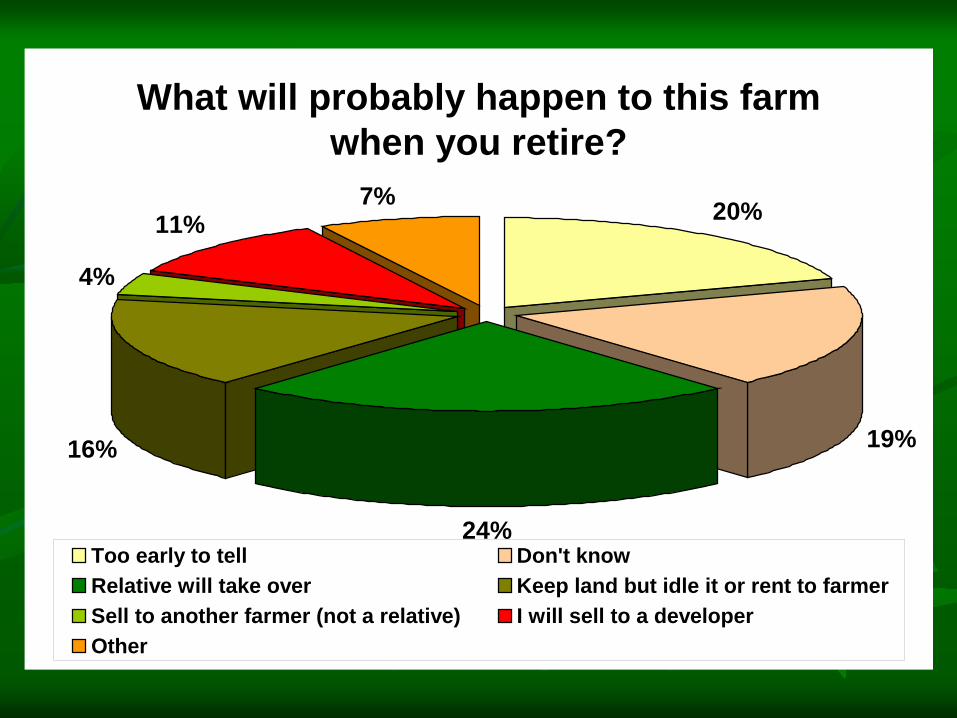
What will probably happen to this farm when you retire?
20%
19%
24%
16%
4%
11%7%
Too early to tell Don't knowRelative will take over Keep land but idle it or rent to farmerSell to another farmer (not a relative) I will sell to a developerOther
Initial Observations Farming at RUI not as bleak as one might have
thought Much growth & innovation occurring – 2 PATHS
Expanding & Intensifying CONVENTIONAL Innovative URBAN-ALTERNATIVE
Major group of “Persisters” – both hobby & commercial scale
Most farms expect to continue for long time Many have (tentative) succession plans
Considerable uncertainty about farm transitions remains

FACTORS AFFECTING FARM TRAJECTORIES AT RUI
Qualitative & Quantitative Analysis (not shown)
What predicts overall county-level farm growth, intensification, innovation?
Less important factors: Population pressure (density, growth rate) Natural resource quality (soils, climate) Local incentive policies (easements, tax credits, RTF) Local land use regulations (planning, zoning, etc.)
FACTORS (continued)
More important factors Strict state-level land use rules (Oregon) Ag Econ development staff and programs Positive farming ‘discourse’ or ‘culture of
expectations’ Existence of public debate to help farms
Qualitative Study of Farm Succession and Transition Planning
PhD Dissertation by Shoshanah Inwood (OSU) Distinguished sub-groups of farms
Rural Residential Farms Traditional Commodity Enterprises Alternative Food and Agricultural Enterprises
(AFAEs) First generation AFAEs Multi-generation AFAEs
Mixed Farms (Commodity + AFAEs)
Succession Plans & Adaptation Availability of heirs is major determinant of
enterprise adaptation & succession path No plans uncertainty If plans known, but no heir 2 paths
Decline & DisinvestmentPut land in conservation easement
Positive Succession Plans
If plans known, and heir is present 4 succession paths Expanders (increase scale and footprint) – mainly CEs Intensifiers (increase value on same land) MG-AFAEs Stackers (extend to direct marketing) – Mixed Farms Entrepreneurial Stackers (add enterprises w/
synergies) – FG-AFAEs, MG-AFAEs, Mixed Farms
Type of Farm Matters
Rural Residential Farms ride above the storm Commodity Enterprises most pessimistic about
future First generation AFAEs are innovative, but
may be at risk – few have successors in mind Multi-generation AFAEs and Mixed Farms are
most innovative & robust
Family Dynamics = Key at RUI
“Development pressure at RUI does not necessarily have the biggest impact on enterprise persistence and adaptation. Household dynamics including presence or absence of an heir, family values and motivations for land use, size and type of enterprise all affect the diversity and persistence of agriculture at the RUI.”

QUESTIONS?
Contact Information: Doug Jackson-Smith, [email protected] Sharp, [email protected]
Also visit our website:http://exurban.osu.edu/agadapt.htm